
Modeling seed-origin oak regeneration in the central Appalachians
12
Modeling seed-origin oak regeneration in the central Appalachians P.J. Gould, K.C. Steiner, M.E. McDill, and J.C. Finley Abstract: We describe the development of a model to quantify seed-origin oak regeneration potential in advance of complete overstory removal in central Appalachian oak stands. The model was developed using a “top-down” modeling approach that differs significantly from the approaches used to develop similar models for other regions. The modeling approach was designed to take advantage of the best data available for the region. A stand-level model was first fit us- ing a long-term data set from Pennsylvania that was developed, in part, from operational data collected through the course of timber sales. The stand-level model describes the relationship between oak advanced regeneration distribution (the percentage of 4 m 2 sample plots that contained at least one oak seedling before harvest) and third-decade seed- origin oak stocking (the percentage of growing space occupied by seed-origin oaks in the third decade after harvest). Inverse modeling was used to fit a plot-level model using a highly detailed short-term data set collected as part of an ongoing study of regeneration development in Pennsylvania. A negative exponential function (1 – e –αx ) was used for the plot-level model to simplify the calculation of multiple seedling success probabilities. The plot-level model predicts the probability that a 4 m 2 plot will be occupied by an oak during the third decade after harvest based on the sum of the heights of oak advanced regeneration (aggregate height). The top-down inverse modeling approach used here proved to be a feasible alternative to the more common individual seedling modeling approach, which requires more specialized data that are often difficult to obtain. Résumé : Les auteurs décrivent la mise au point d’un modèle destiné à quantifier le potentiel de régénération de chêne d’origine sexuée établie avant l’enlèvement complet du couvert dominant de chênaies du centre des Appalaches. Le modèle a été mis au point en utilisant une approche descendante de modélisation qui diffère de façon significative des approches utilisées pour mettre au point des modèles semblables dans d’autres régions. L’approche de modélisation a été conçue de façon à tirer profit des meilleures données disponibles dans la région. Dans un premier temps, un mo- dèle à l’échelle du peuplement a été ajusté à un fichier de données à long terme provenant de la Pennsylvanie et qui a été bâti en partie avec des données opérationnelles obtenues lors des ventes de bois. Le modèle à l’échelle du peuple- ment décrit la relation entre la distribution de la régénération préétablie de chêne (le pourcentage de placettes échantil- lons de 4 m 2 contenant au moins un semis de chêne avant la coupe) et le pourcentage de l’espace de croissance occupé par des chênes d’origine sexuée pendant la troisième décennie suivant la coupe. La modélisation inverse a été utilisée pour ajuster un modèle à l’échelle de la placette en utilisant un fichier de données à court terme très détaillées prove- nant d’une étude en cours sur le développement de la régénération en Pennsylvanie. Une fonction exponentielle néga- tive (1 – e –αx ) a été utilisée pour le modèle à l’échelle de la placette de façon à simplifier le calcul des probabilités de succès de semis multiples. Le modèle à l’échelle de la placette prédit la probabilité qu’une placette de 4 m 2 soit oc- cupée par un chêne pendant la troisième décennie suivant la coupe en se basant sur la somme des hauteurs de la régé- nération préétablie de chêne (hauteur collective). L’approche de modélisation inverse descendante utilisée dans cette étude peut donc servir de solution de rechange à l’approche de modélisation par semis individuel qui est plus ré- pandue, mais qui nécessite plus de données spécialisées qui sont souvent difficiles à obtenir. [Traduit par la Rédaction] Gould et al. 844 Introduction Successful natural regeneration is critical to silvicultural systems applied throughout the world. Natural regeneration is often the best method for restocking harvested forests, as it requires relatively little investment, promotes native spe- cies, and conserves locally adapted genotypes (Smith et al. 1997; Finkeldey and Ziehe 2004). However, there are some clear challenges to successful natural regeneration. Forest managers have relatively little control over species mixtures once the harvest is complete and do not always achieve ac- ceptable stocking rates. Without proper preparation, valuable species may be lost or poorly represented in naturally regen- erated stands and regeneration failures become a real possi- bility (Bertault et al. 1995; Kozlowski 2002). Stands that were harvested with little consideration for future develop- Can. J. For. Res. 36: 833–844 (2006) doi:10.1139/X05-291 © 2006 NRC Canada 833 Received 4 March 2005. Accepted 2 November 2005. Published on the NRC Research Press Web site at http://cjfr.nrc.ca on 24 March 2006. P.J. Gould, K.C. Steiner, 1 M.E. McDill, and J.C. Finley. Ferguson Building, School of Forest Resources, Pennsylvania State University, University Park, PA 16802, USA. 1 Corresponding author (e-mail: [email protected]).
Transcript of Modeling seed-origin oak regeneration in the central Appalachians

Modeling seed-origin oak regeneration in thecentral Appalachians
P.J. Gould, K.C. Steiner, M.E. McDill, and J.C. Finley
Abstract: We describe the development of a model to quantify seed-origin oak regeneration potential in advance ofcomplete overstory removal in central Appalachian oak stands. The model was developed using a “top-down” modelingapproach that differs significantly from the approaches used to develop similar models for other regions. The modelingapproach was designed to take advantage of the best data available for the region. A stand-level model was first fit us-ing a long-term data set from Pennsylvania that was developed, in part, from operational data collected through thecourse of timber sales. The stand-level model describes the relationship between oak advanced regeneration distribution(the percentage of 4 m2 sample plots that contained at least one oak seedling before harvest) and third-decade seed-origin oak stocking (the percentage of growing space occupied by seed-origin oaks in the third decade after harvest).Inverse modeling was used to fit a plot-level model using a highly detailed short-term data set collected as part of anongoing study of regeneration development in Pennsylvania. A negative exponential function (1 – e–αx) was used forthe plot-level model to simplify the calculation of multiple seedling success probabilities. The plot-level model predictsthe probability that a 4 m2 plot will be occupied by an oak during the third decade after harvest based on the sum ofthe heights of oak advanced regeneration (aggregate height). The top-down inverse modeling approach used hereproved to be a feasible alternative to the more common individual seedling modeling approach, which requires morespecialized data that are often difficult to obtain.
Résumé : Les auteurs décrivent la mise au point d’un modèle destiné à quantifier le potentiel de régénération de chêned’origine sexuée établie avant l’enlèvement complet du couvert dominant de chênaies du centre des Appalaches. Lemodèle a été mis au point en utilisant une approche descendante de modélisation qui diffère de façon significative desapproches utilisées pour mettre au point des modèles semblables dans d’autres régions. L’approche de modélisation aété conçue de façon à tirer profit des meilleures données disponibles dans la région. Dans un premier temps, un mo-dèle à l’échelle du peuplement a été ajusté à un fichier de données à long terme provenant de la Pennsylvanie et qui aété bâti en partie avec des données opérationnelles obtenues lors des ventes de bois. Le modèle à l’échelle du peuple-ment décrit la relation entre la distribution de la régénération préétablie de chêne (le pourcentage de placettes échantil-lons de 4 m2 contenant au moins un semis de chêne avant la coupe) et le pourcentage de l’espace de croissance occupépar des chênes d’origine sexuée pendant la troisième décennie suivant la coupe. La modélisation inverse a été utiliséepour ajuster un modèle à l’échelle de la placette en utilisant un fichier de données à court terme très détaillées prove-nant d’une étude en cours sur le développement de la régénération en Pennsylvanie. Une fonction exponentielle néga-tive (1 – e–αx) a été utilisée pour le modèle à l’échelle de la placette de façon à simplifier le calcul des probabilités desuccès de semis multiples. Le modèle à l’échelle de la placette prédit la probabilité qu’une placette de 4 m2 soit oc-cupée par un chêne pendant la troisième décennie suivant la coupe en se basant sur la somme des hauteurs de la régé-nération préétablie de chêne (hauteur collective). L’approche de modélisation inverse descendante utilisée dans cetteétude peut donc servir de solution de rechange à l’approche de modélisation par semis individuel qui est plus ré-pandue, mais qui nécessite plus de données spécialisées qui sont souvent difficiles à obtenir.
[Traduit par la Rédaction] Gould et al. 844
Introduction
Successful natural regeneration is critical to silviculturalsystems applied throughout the world. Natural regenerationis often the best method for restocking harvested forests, asit requires relatively little investment, promotes native spe-cies, and conserves locally adapted genotypes (Smith et al.1997; Finkeldey and Ziehe 2004). However, there are some
clear challenges to successful natural regeneration. Forestmanagers have relatively little control over species mixturesonce the harvest is complete and do not always achieve ac-ceptable stocking rates. Without proper preparation, valuablespecies may be lost or poorly represented in naturally regen-erated stands and regeneration failures become a real possi-bility (Bertault et al. 1995; Kozlowski 2002). Stands thatwere harvested with little consideration for future develop-
Can. J. For. Res. 36: 833–844 (2006) doi:10.1139/X05-291 © 2006 NRC Canada
833
Received 4 March 2005. Accepted 2 November 2005. Published on the NRC Research Press Web site at http://cjfr.nrc.ca on24 March 2006.
P.J. Gould, K.C. Steiner,1 M.E. McDill, and J.C. Finley. Ferguson Building, School of Forest Resources, Pennsylvania StateUniversity, University Park, PA 16802, USA.
1Corresponding author (e-mail: [email protected]).

ment are sometimes labeled “naturally regenerated”. Dissat-isfaction with natural regeneration in these cases can beattributed, in part, to poor forest management (Timoney andPeterson 1996). Improving outcomes requires both the willto practice good forest management and research-based toolsto make outcomes more predictable.
Predictive models can provide forest managers with usefultools for better understanding and controlling natural regen-eration. Even-aged silvicultural systems are perhaps the moststraightforward to model. Much of the regeneration potentialin even-aged stands is in place before final harvest in theform of advanced regeneration, stored seeds, and sproutingpotential. The challenge is measuring these sources of regen-eration and translating the measurements into useful infor-mation, such as future stocking by desirable species. In foresttypes where sufficient regeneration is not assured, this infor-mation can alert forest managers to the need for correctivemeasures.
Adequate natural regeneration of oaks (Quercus spp.) un-der even-aged silvicultural systems in eastern North Americais often difficult to obtain. Oaks are frequently replaced byother species after timber harvests and other disturbances(Beck and Hooper 1986; Abrams and Nowacki 1992). Theoak regeneration problem emerged in the latter half of the20th century throughout much of the eastern United Statesand has been linked to (among other causes) fire suppression,lack of overstory disturbance in maturing stands, and exces-sive browsing by white-tailed deer (Odocolieus virginianusBoddaert) (Lorimer 1993). Oaks are considered to be amongthe most desirable species in many eastern forests because oftheir high economic value and ecological importance (Johnsonet al. 2002). Given the importance of oaks and the difficultiesencountered in regenerating them, there is an immediate needfor predictive models and regional research-based guidelinesto aid forest managers in reaching regeneration goals.
Successful oak regeneration depends on establishing ad-vanced regeneration before final overstory removal. Theseseedlings, combined with oak sprouts, must then competesuccessfully to occupy growing space in the regenerated stand.Promising methods have been developed to improve oak re-generation potential using the shelterwood regeneration methodand prescribed burning (Loftis 1990a; Brose et al. 1999).Methods to evaluate the adequacy of existing sources of re-generation are needed to determine when a final overstoryremoval is warranted or whether corrective measures areneeded to enhance the regeneration potential of oaks. Re-search-based methods for evaluating seed-origin regenera-tion potential have been developed for the Missouri Ozarks(Sander et al. 1984; Dey 1991) and the southern Appala-chians (Loftis 1990b), but little work has been done in cen-tral Appalachian oak stands.
There is an immediate need for methods to evaluate oakregeneration potential in the central Appalachians, but thedevelopment of predictive models presents a considerable re-search challenge. Ideally, models would be developed usinglong-term data collected as part of a carefully designed ex-perimental or observational study that includes a large num-ber of observations which reflect the full range of growingconditions found in the region. However, such long-termdata are not currently available for the central Appalachians.Researchers in other regions have faced similar predicaments.
Sander and others (1984) and Loftis (1990b) developed oakregeneration models by monitoring the development of indi-vidual oak seedlings from before harvest to 5 and 8 years,respectively, after harvest. The early results were then ex-trapolated to the end of the regeneration period (20 years af-ter harvest) based on best guesses of the future competitivecapacity of surviving seedlings. Although these types of in-dividual-tree models appear promising, they require a greatdeal of specialized data (i.e., repeated measurements of indi-vidual seedlings over a period of several decades and a widerange of growing conditions). Thus far, individual oak seed-ling models have not been fit with empirical data that spansthe entire regeneration period and model results, in part, re-flect untested assumptions regarding the competitive capac-ity of seedlings beyond the observation period. Nevertheless,the models reflect the best information available at the timethey were created and have provided forest managers withmuch-needed guidance. The need to model complex pro-cesses with less than optimal data is not unique to oak re-generation research. Modeling methodologies that make useof the best available data are valuable for addressing a widerange of ecological problems.
The purpose of this paper is to describe the developmentof a new seed-origin oak regeneration model using two datasets from Pennsylvania and a modeling approach (inversemodeling) that has proven useful in other applications (Uriarteet al. 2005; Cropper and Anderson 2004; Asner et al. 1998).Three goals guided model development: (1) the model shouldfit the best available data, (2) the model should be easy touse (minimal computations) and readily incorporated intocomprehensive oak regeneration guidelines, and (3) the modelshould reflect current knowledge of the oak regenerationprocess and incorporate innovative elements of other models.To capitalize on the availability of a long-term, but other-wise inadequate, data set, we used different modeling meth-ods than those used to develop similar models (Sander et al.1984; Loftis 1990b; Dey 1991; Belli et al. 1999). Our ap-proach is innovative and may be useful for developing pre-dictive models to improve silvicultural systems in other foresttypes that rely on natural regeneration.
Methods
Study sitesA short-term and long-term data set were used for model-
ing. The short-term (ST) data set included measurements in46 stands, and the long-term (LT 1) data set included mea-surements in 41 stands. A second long-term data set (LT 2)was used to compare stand structure in regenerated stands tothe stand structure assumed by the model. All stands are lo-cated on Pennsylvania state forest lands that are managed bythe Pennsylvania Department of Conservation and NaturalResources, Bureau of Forestry. Although specific stand his-tories are unknown, most stands in the region are even aged,having regenerated following turn-of-the-century logging (Stout2000). Stand locations are shown in Fig. 1. In both data sets,24% of stands fall within the Appalachian Plateaus physio-graphic province and 76% fall in the Ridge and Valley phys-iographic province. The two physiographic provinces stretchparallel to one another from northern Alabama to New York(Cuff et al. 1989). The Appalachian Plateaus province is an
© 2006 NRC Canada
834 Can. J. For. Res. Vol. 36, 2006

uplifted region of rolling hills dissected by river valleys. TheRidge and Valley province is a folded and faulted regioncharacterized by steep, nearly parallel ridges oriented north-east to southwest. Ridges are covered by forest, and valleysare typically in agricultural production. The soils where thestudy stands are located in both provinces are derived fromsandstone, siltstone, and shale and are generally well drained.Stand elevations range from approximately 300 m a.s.l. inthe Ridge and Valley to 730 m in the Appalachian Plateaus.Precipitation and frost-free periods vary with elevation and to-pography. Mean annual precipitation ranges from 96 to 115 cm,and frost-free periods range from 140 to 160 days (Cuff etal. 1989). Oak forests are the dominant natural vegetation inthe Ridge and Valley. Common oaks species are northern redoak (Quercus rubra L.), chestnut oak (Quercus prinus L.),white oak (Quercus alba L.), black oak (Quercus velutinaLam.), and scarlet oak (Quercus coccinea Muenchh.). Oakstransition into Allegheny hardwoods moving from south tonorth in the Appalachian Plateaus, though oaks continue tobe locally dominant (Stout 1991; Bailey et al. 1994). Site in-dex was not consistently measured in the study stands, butproductivity is typically low to moderate with oak site indexfrom 18 to 23 m (60–75 ft) at 50 years (Bowersox and Ward1972). About 24% of LT 1 stands and 34% of ST stands oc-curred on cooler aspects (NW–E), and the other stands oc-curred on warmer aspects (SE–W).
Data collectionThe LT 1 data set was developed, in part, from operational
data collected by the Pennsylvania Department of Conserva-tion and Natural Resources personnel in advance of regener-ation harvests. All stands were oak dominated (>50% basalarea in oak) before harvest, and all were harvested by silvi-cultural clear-cutting at least 20 years prior to the initiationof this study. Advanced regeneration data were collected ap-proximately 1 year before harvest. Data were collected ineach stand on 60 milacre (4 m2) plots. Data collection work-sheets contained three cells per plot to record the presence
of up to three advanced regeneration species (stems at least2 years old and DBH <10 cm). Data describing the size anddensity of advanced regeneration were not collected. We as-sumed that plots where an oak species was recorded had atleast one oak seedling (of unknown size), and oak seedlingswere absent from plots where oak advanced regenerationwas not recorded. In virtually all cases (99.8%) where oakspecies were not recorded, fewer than three non-oak specieswere recorded, indicating that the small number of data cellsdid not result in undercounts of oak advanced regeneration.Given that these data were collected operationally without ahighly detailed data collection protocol, we did not assumethe data were as precise as research data, but we could findno evidence or rationale for bias. However, this data set isinherently weak for model development in that only a singleattribute of oak advanced regeneration (presence within plots)was measured.
Stands in the LT 1 data set were remeasured at least20 years after harvest (mean = 27.3 years; range = 21–32 years). Approximately 30 variable-radius plots were mea-sured with a 2.3 m2/ha basal area factor prism in stands of30 acres or more, and 1 plot was measured for each acre instands of less than 30 acres. The 2.3 m2/ha basal area factorhas been shown to be suitable for accurately measuringyoung hardwood stands (Brooks and McGill 2004). A mini-mum of 10 plots was measured per stand. The diameters of“in” trees were measured to the nearest 2.5 cm and crownclasses were recorded (Smith et al. 1997). Each tree was de-termined to be seed origin (a single stem arising from aseedling or seedling sprout) or stump origin (one or morestems arising from a cut parent tree). The origin of stems oc-curring singly was determined by examining root collars forevidence of a previous stump.
The LT 2 data set, consisting of measurements on 53stands located on Pennsylvania state forest land, was used toanalyze third-decade stand structure in fully stocked stands.The stands were oak-dominated before harvest and were re-generated with silvicultural clearcuts. Stands were primarily
© 2006 NRC Canada
Gould et al. 835
Fig. 1. The distribution of stands in the long-term (LT 1) and short-term (ST) data sets. Physiographic regions are labeled.

in their third decade of development (age range = 21–33 years)when they were measured. Stands were selected from a largerdata set when initial analysis showed that they were at least90% stocked (Gingrich 1967). Stands were measured usingthe same methods as for stands in the LT 1 data set (i.e., us-ing a 2.3 m2/ha basal area factor prism), except seed-originand sprout-origin regeneration were not distinguished in allstands.
ST data were collected from 1996 to 2002 as part of acontinuing study of the oak regeneration process in Pennsyl-vania. Data were collected in 46 stands on Pennsylvaniastate forest land as “pretreatment” data (i.e., before regenera-tion treatments were applied). All stands were oak domi-nated and fully stocked when they were measured. In standsof 12 ha or more, approximately thirty 202 m2 plots were es-tablished and permanently located. In stands of less than12 ha, 1 plot was established per 0.4 ha with a minimum of15 plots per stand. Within each plot, four 4 m2 subplots wereestablished 5 m from the plot center along the cardinal di-rections. Within each subplot, advanced regeneration (stemswith DBH <5 cm) was tallied by species and height class.Eight height classes were used: >5, 5–15, 16–30, 31–60, 61–90, 91–120, 121–150, and >150 cm.
Data summaryThe modeling approach used a common variable in the
LT 1 and ST data sets — the distribution of oak advanced re-generation. The LT 1 data set was used to calculate the dis-tribution of oak advanced regeneration in each stand as thepercentage of milacre plots where oak advanced regenera-tion was recorded. Chestnut oak was the most common oakregeneration recorded (30.9% of observations), followed bynorthern red oak (27.9%), black oak (21.3%), white oak(14.4%), and scarlet oak (5.4%).
The distribution of oak advanced regeneration was simi-larly calculated for stands in the ST data set as the percent-age of milacre subplots where at least one oak seedling inany size class was observed. To address the possibility thatsmaller oak seedlings presumably <2 years old were not tal-lied in the LT 1 stands, two more restrictive measures of oakadvanced regeneration distribution (R>15 cm and R>30 cm) werecalculated for the ST stands. R>15 cm is the percentage of sub-plots with at least one oak seedling >15 cm tall, and R>30 cmis the percentage with at least one oak seedling >30 cm tall.Northern red oak was the most common oak advanced re-generation recorded (42.1% of seedlings), followed by chest-nut oak (28.3%), black oak (13.9%), white oak (11.8%), andscarlet oak (4.2%). In both the LT 1 and ST data sets, we didnot distinguish between oak species when calculating oakadvanced regeneration distribution. A second variable, oakaggregate height (Fei et al. 2006), was calculated for eachsubplot in the ST data set. Oak aggregate height is the sumof preharvest oak seedling heights. The midpoints of theseedling height classes were used. The height of seedlings inthe >150 cm size class was set at 183 cm. However, oakseedlings in this size class were rare, occurring in only 0.7%of subplots.
Third-decade densities of dominant, codominant, and in-termediate seed-origin oaks were calculated by diameter classfor stands in the LT 1 data set, and for all species for standsin the LT 2 data set, using the procedures described by
Avery and Burhardt (1994, p. 221). Suppressed trees werenot included in the calculations because these trees, by defi-nition, do not occupy area in the upper canopy (Smith et al.1997). Gingrich’s (1967) stocking equation for upland oakstands was applied to the density estimates for stands in theLT 1 data set to calculate third-decade stocking values forupper-canopy seed-origin oaks. Gingrich’s stocking equation isbased on the tree-area ratio method (Chisman and Shumacher1940). The data used to develop the stocking equation werecollected in stands with similar compositions to those in thepresent study and included some stands in the third decadeof development (Gingrich 1967), indicating that the equationis applicable to the third-decade stand data. A stocking valuefor a species or species group (e.g., oaks) is equivalent to thepercentage of stand area occupied by the species whenstands are near maximum stocking (Gingrich 1967). Thedensity and average diameter of dominant, codominant, andintermediate trees were calculated for the LT 2 stands.
Model developmentA plot-level model was developed that predicts the proba-
bility that a milacre plot will be occupied by an oak at theend of the regeneration period (i.e., the third decade afterharvest). Probabilities are calculated as a function of theheights of oak seedlings present on the plot shortly beforeoverstory removal. This plot-level approach, similar to thoseproposed by Sander and others (1984) and Belli and others(1999), simplifies the regeneration process into a collectionof plot-level “events”, the occupation and eventual domina-tion of a plot by a single tree. An event is a “success” if anoak occupies the plot; otherwise it is a “failure”. The impor-tance of oak at the stand level is then expressed as the averageprobability of success across sampled plots. This quantity isequivalent to percentage of stocking when the proportion ismultiplied by 100%.
The plot-level model assumes that third-decade stands willbe occupied by an average of 2470 stems/ha (1000 stems/acre),with an average DBH of 9.4 cm (3.7 in.). At this averagedensity and diameter, each stem is expected to occupy an av-erage of 4 m2 (1 milacre) of stand area. The expected standstructure is consistent with the stocking chart (Gingrich 1967)and yield table (Gingrich 1971) for young upland mixed-oakstands on moderately productive sites (SI = 20–23 m, baseage 50 years). The average stand densities and average di-ameters of the 53 fully stocked third-decade stands wereexamined to test the validity of the model assumptions. Linearregression analyses were conducted with stand age as the in-dependent variable and stand diameter and density as de-pendent variables. Average stand diameter and density wereexpected to match the model assumptions at some point dur-ing the third decade of development.
Plot-level success is expressed as a function of the proba-bilities of failure (where failure = 1 – success) of the seed-lings within the plot using the following equation:
[1] P Pjj
n
(success) (failure)plot = −=
∏11
where Pj(failure) is the probability that stem j will fail and nis the number of stems in the plot.
© 2006 NRC Canada
836 Can. J. For. Res. Vol. 36, 2006

The plot-level success probability (eq. 1) is equal to theprobability that at least one oak seedling that falls within theplot will succeed. Each stem provides an additional “chance”for success. A negative exponential function (1 – e–αx) wasselected for the plot-level model. Like the logistic function,response values are bound between zero and one. Similar ex-ponential functions have been widely used to model seedlinggrowth and survival (Leak 1969; Belli and Ek 1988;Payandeh 1996), and the negative exponential function has adesirable mathematical property that greatly simplifies thecalculation of plot-level success probabilities. Substitutingthe negative exponential function into eq. 1 yields
[2] Px
j
nj(success) eplot = − −
=∏1
1
α
This simplifies to
[3] Pxj
j
n
(success) eplot = −− ∑
=1 1α
where xj is height (cm) of stem j, n is the number of stems inthe plot, and α is a constant.
Equation 3 calculates a plot-level success probability as afunction of the aggregate height (sum of seedling heights) ofoak advanced regeneration within the plot. Because plots areassumed to represent growing space in the third-decade stands,each successful plot contributes to third-decade seed-originoak stocking. The stand-level model is the average of theplot-level probabilities:
[4] Third-decade stocking (%)
=
−⎡
⎣
⎢⎢
⎤
⎦
⎥⎥
×
−=∑
=∑ 1
100
1
1
eα x j
j
n
i
N
N%
where N is the number of plots sampled.Equations 3 and 4 have a single coefficient, α, which
specifies the relationship between aggregate oak seedlingheight and probability of plot-level success.
A “top-down” modeling approach was used to fit α. Thisapproach contrasts with the “bottom-up” approach of model-ing individual tree success and then scaling to the stand level(e.g., Sander et al. 1984; Loftis 1993; Belli et al. 1999). Ourapproach was designed to capitalize on the LT 1 data set de-scribing the third-decade success of seed-origin oak regener-ation. These data were used to model third-decade stockingbased on oak advanced regeneration distribution. Because ofthe limitations in the data set, the initial “base model” relatesonly a single stand-level attribute, oak advanced regenera-tion distribution, to third-decade stocking.
Inverse modeling was used with the ST data set to fit theplot-level model. Inverse modeling has previously been ap-plied to ecological problems such as modeling plant popula-tion dynamics (Cropper and Anderson 2004) and modelingcanopy structure from image spectrometry (Asner et al. 1998).Under inverse modeling, prior knowledge of a system isused to formulate a model to account for an observable out-put (e.g., third-decade stocking). Model parameters are thenfit using an algorithm to identify parameter values that mini-mize the difference between observed and modeled outputs
(Asner et al. 1998). Our goal was to identify a plot-levelmodel that reproduced the base model relationship betweenoak advanced regeneration distribution and third-decade seed-origin oak stocking, while allowing for greater variability inpredicted values due to the effects of oak seedling size anddensity.
A critical assumption to the modeling approach is that thedistribution of oak advanced regeneration (plot-level frequency)functions as a proxy variable, reflecting variation in the sizeand density of oak advanced regeneration. It was not possibleto test this assumption in the LT 1 stands because of insuffi-cient data. The functionality of oak advanced regenerationdistribution as a proxy variable was tested using the ST databy examining the relationships between oak advanced regen-eration distribution and regeneration density and size. Oakadvanced regeneration densities were calculated for each STstand as the mean density of oak stems on subplots that con-tain at least one oak stem; thus subplots that lacked oakseedlings were excluded. This calculation was used in placeof a simple average to remove the explicit correlation be-tween distribution and density. Percentages of subplots con-taining stems in each of three size classes (<30, 31–90,>90 cm, simplified from the original eight classes) were cal-culated for subplots that contained at least one oak stem.Subplots that lacked oak seedlings were again excluded forthis calculation to remove the explicit correlation betweenthe distribution of stems in a given size class and the distri-bution of stems in all size classes.
A nonlinear logistic model (Sit and Poulin-Costello 1994)was fit to the LT 1 data to produce a base model describingthe relationship between oak advanced regeneration distribu-tion and third-decade seed-origin oak stocking. Model fittingwas done using the nonlinear least-squares regression proce-dure (Proc NLIN) in the SAS statistical software (SAS Insti-tute Inc. 1999). Several nonlinear models were examined,and the logistic model was selected based on its explanatorypower (r2), interpretability, and a visual judgment of good-ness of fit.
Predicted third-decade stocking values were calculated foreach ST stand using the base model. These values were thentreated as “observed” values for inverse modeling. Due tothe relative simplicity of our model, an incremental searchprocedure was used to find the optimal α value. The value ofα was initially set to zero, corresponding to a conditionwhere the probability of success for all stems is nil. Thevalue was then incrementally increased by a step size of3.3 × 10–6. After each step, eq. 4 was solved for each STstand to produce an expected third-decade stocking level.Mean squared error (MSE) was then calculated as thesquared difference between this expected stocking and ex-pected stocking under the base model. The final value of αwas selected when MSE was minimized. The same proce-dure was used to calculate alternative α values under themore restrictive measures of oak advanced regeneration dis-tribution (R>15 cm and R>30 cm) to test the sensitivity of themodel fit to possible differences between measurements inthe LT 1 and ST data sets. The incremental search procedurewas executed in the R programming environment (Ihaka andGentleman 1996).
The plot-level model was compared with a particularlycomplete long-term data set from the Missouri Ozarks (study
© 2006 NRC Canada
Gould et al. 837

OH-466; Sander 1973) to evaluate the model fit. The Ozarkdata set includes 405 oak seedlings (49% black oak, 36%white oak, 10% scarlet oak, and 5% northern red oak) thatwere measured in six stands in advance of complete removalof white oak and black oak dominated overstories. Standproductivity, as measured by site index, was low to moder-ate (SI = 15–21 m at 50 years). Seedlings were periodicallyremeasured through the onset of the third decade of standdevelopment. Crown classes were assigned to surviving trees20 or 21 years after overstory removal. The proportion ofsuccessful seedlings, by preharvest height class, were calcu-lated when (1) the stem was in a dominant or codominantcrown class in the third decade after harvest and (2) the stemwas in the dominant, codominant, or intermediate crownclass. The success proportions were then plotted and visuallycompared with results from the plot-level model. The com-parison of individual tree success proportions and proportionsfrom the plot-level model assumes the plot-level model reflectsthe success of an oak seedling in a plot. The Ozark region andcentral Appalachians are somewhat similar oak-dominatedregions, but there are important differences in climate, edaphicfactors, competing vegetation, and deer browsing between theregions. Thus, comparisons were limited to assessing the ap-plicability of the model form and to making a general com-parison of predicted and observed values.
Results
The overall structure of the LT 2 stands suggests that thethird-decade stand structure assumed by the model is a rea-sonable estimate of actual stand structure. A statistically sig-nificant relationship (P < 0.001) was found between standage and stand density (Fig. 2). Based upon this relationship,the average stand reaches a density of 2470 stems/ha at21.0 years after harvest. In addition, all stands >28 years oldhad <2470 stems/ha, suggesting that most stands transitionthrough the model stand density by the end of the third de-cade. A similar statistically significant relationship (P < 0.001)
was found between stand age and average diameter (Fig. 3).The average stand diameter reaches 9.4 cm at a stand age of23.5 years. These results indicate that, on average, actualstand structure is consistent with the model assumptions basedon Gingrich’s stocking equation (1967) and yield table (1971)during the third decade of development.
LT 1 data are plotted with the base model fit in Fig. 4.The logistic function captures a quasi-threshold effect in therelationship between third-decade seed-origin oak stockingand oak advanced regeneration distribution. In stands whereoak advanced regeneration distribution was <60%, third-decadestocking was almost uniformly poor. In stands where the dis-
© 2006 NRC Canada
838 Can. J. For. Res. Vol. 36, 2006
Fig. 2. Relationship between stand age and density in 53 fullystocked stands (LT 2 data set) in Pennsylvania.
Fig. 3. Relationship between stand age and average stand diame-ter in 53 fully stocked stands (LT 2 data set) in Pennsylvania.
Fig. 4. Base model fit using the logistic function to describe the re-lationship between the distribution of oak advanced regeneration andthird-decade oak stocking in the long-term (LT 1) stands (N = 41).
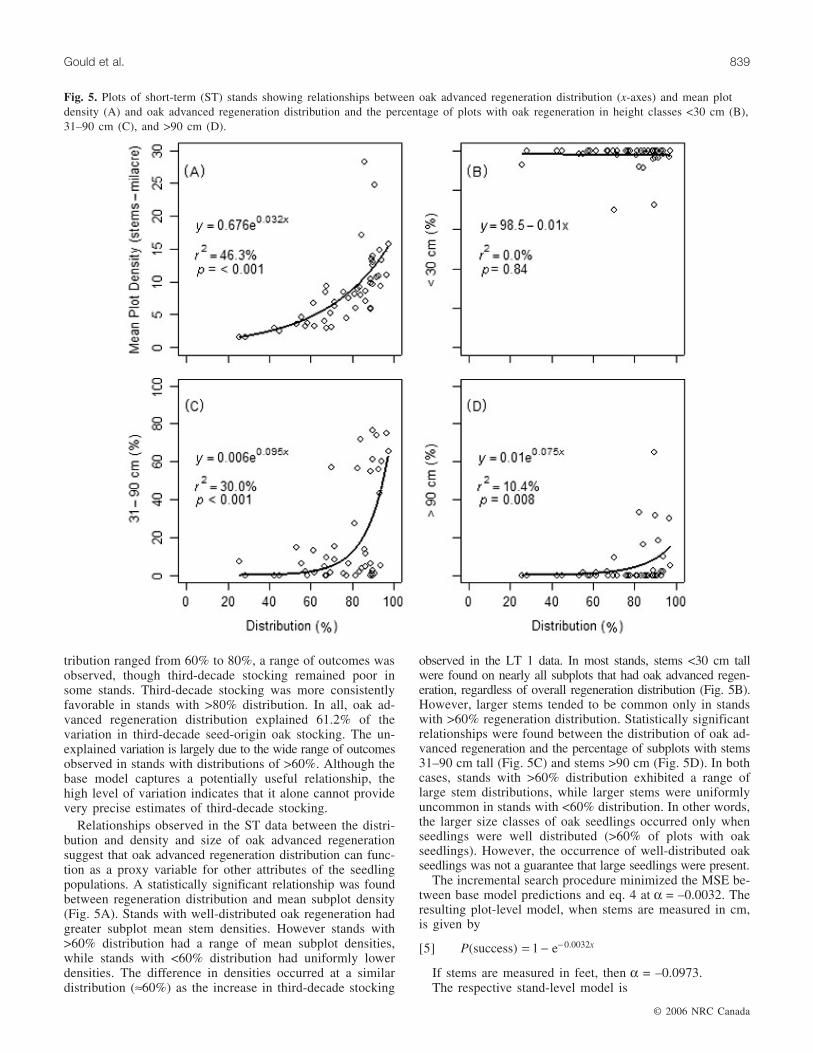
tribution ranged from 60% to 80%, a range of outcomes wasobserved, though third-decade stocking remained poor insome stands. Third-decade stocking was more consistentlyfavorable in stands with >80% distribution. In all, oak ad-vanced regeneration distribution explained 61.2% of thevariation in third-decade seed-origin oak stocking. The un-explained variation is largely due to the wide range of outcomesobserved in stands with distributions of >60%. Although thebase model captures a potentially useful relationship, thehigh level of variation indicates that it alone cannot providevery precise estimates of third-decade stocking.
Relationships observed in the ST data between the distri-bution and density and size of oak advanced regenerationsuggest that oak advanced regeneration distribution can func-tion as a proxy variable for other attributes of the seedlingpopulations. A statistically significant relationship was foundbetween regeneration distribution and mean subplot density(Fig. 5A). Stands with well-distributed oak regeneration hadgreater subplot mean stem densities. However stands with>60% distribution had a range of mean subplot densities,while stands with <60% distribution had uniformly lowerdensities. The difference in densities occurred at a similardistribution (≈60%) as the increase in third-decade stocking
observed in the LT 1 data. In most stands, stems <30 cm tallwere found on nearly all subplots that had oak advanced regen-eration, regardless of overall regeneration distribution (Fig. 5B).However, larger stems tended to be common only in standswith >60% regeneration distribution. Statistically significantrelationships were found between the distribution of oak ad-vanced regeneration and the percentage of subplots with stems31–90 cm tall (Fig. 5C) and stems >90 cm (Fig. 5D). In bothcases, stands with >60% distribution exhibited a range oflarge stem distributions, while larger stems were uniformlyuncommon in stands with <60% distribution. In other words,the larger size classes of oak seedlings occurred only whenseedlings were well distributed (>60% of plots with oakseedlings). However, the occurrence of well-distributed oakseedlings was not a guarantee that large seedlings were present.
The incremental search procedure minimized the MSE be-tween base model predictions and eq. 4 at α = –0.0032. Theresulting plot-level model, when stems are measured in cm,is given by
[5] P x(success) e 0.0032= − −1
If stems are measured in feet, then α = –0.0973.The respective stand-level model is
© 2006 NRC Canada
Gould et al. 839
Fig. 5. Plots of short-term (ST) stands showing relationships between oak advanced regeneration distribution (x-axes) and mean plotdensity (A) and oak advanced regeneration distribution and the percentage of plots with oak regeneration in height classes <30 cm (B),31–90 cm (C), and >90 cm (D).

[6] Third-decade stocking (%)
=
−⎛
⎝
⎜⎜⎜
⎞
⎠
⎟⎟⎟
×
−=∑
=∑ 1
100
1
1
e0.0032x xij
j
n
i
N
N%
Results of the incremental search procedure indicate thatMSE is moderately sensitive to variation around the optimalα value (Fig. 6). Rather than reaching a minimum MSE at asingle well-defined point, which would indicate high sensi-tivity, minimum MSE was reached within a small trough.For example, the minimum MSE was 89.5% (stocking)2, butMSE did not exceed 100.0% (stocking)2 for α values rangingfrom less than –0.0025 to greater than –0.0040. Although er-ror in our estimate of α cannot be calculated conventionally,the stand-level model appears tolerant of moderate error inthe parameter estimate.
The calculation of the α value was sensitive to alternativemeasures of oak advanced regeneration distribution in theST stands. The plot-level model fit is shown with the alter-native R>15 cm and R>30 cm model fits in Fig. 7. MSE wasminimized at α = –0.00094 and –0.00027 for the R>15 cm andR>30 cm model fits, respectively. The differences between mod-els with alternative α values are smallest for low aggregateheight values (e.g., 30 cm), but increase greatly with higheraggregate height values.
Predicted third-decade stocking levels for the ST stands(eq. 6) are compared with third-decade stocking levels ob-served in the LT 1 stands in Fig. 8. The two sets of datapoints indicate that the stand-level model reproduced thegeneral trend observed in the LT 1 stands. As expected, pre-dicted values from eq. 6 also include a great deal of varia-tion around the trend, since they are now a function of thedistribution, density, and size of oak advanced regeneration.For example, stands with approximately 80% regeneration
distribution are predicted to have between 12% and 42%third-decade stocking. The base model alone predicts 30%third-decade stocking with 80% distribution. Both predictedand observed third-decade stocking levels are generally <10%with oak advanced regeneration distributions of <60%.
Success proportions from the Missouri Ozark data set areshown with the plot-level model in Fig. 9. The points inFig. 9 represent the proportion of stems in each preharvestheight class (x-axis) that reached a dominant or codominantcrown position 20 years after harvest (open points), or a
© 2006 NRC Canada
840 Can. J. For. Res. Vol. 36, 2006
0
100
200
300
400
500
600
700
800
0.0000 -0.0033 -0.0066 -0.0098 -0.0131 -0.0164
α
MS
E
Fig. 6. Results of incremental search procedure to fit the plot-level model by minimized mean square error (MSE). The linedepicts the result of 5000 iterations. MSE was minimized whenα = –0.0032.
Fig. 7. Model comparisons to test the sensitivity of α to morerestrictive definitions of oak advanced regeneration distribution inthe short-term (ST) data set.
Fig. 8. Oak advanced regeneration distribution and actual third-decade oak stocking for the 41 long-term (LT 1) stands (openpoints) and the predicted third-decade oak stocking for the 46short-term (ST) stands (closed points).

dominant, codominant, or intermediate crown position (filledpoints). Importantly, the Ozark data follow the same trend asthe plot-level model, supporting the use of the negative expo-nential function for modeling success. Direct comparisonsbetween values must be made cautiously. Nevertheless, theplot-level model results generally agree with the long-termOzark data. The model somewhat underpredicts success rel-ative to the Ozark data when intermediate trees are includedin the success definition, but appears essentially unbiasedwhen intermediate trees are excluded.
Discussion
The present model is the first research-based model forpredicting future seed-origin oak stocking in advance of com-plete overstory removals in the central Appalachians. Themodel is based on the best available data for the region andaddresses the immediate need for a predictive tool. A lack ofsuitable long-term data is often a major barrier to the develop-ment of regeneration models. The top-down inverse modelingapproach used here allowed us to capitalize on a long-termdata set that by itself was not adequate for model develop-ment. The LT 1 data set provided important information onstand development through the third decade of postharvestdevelopment, but the ST data set was critical for modelingregeneration at the plot level and incorporating seedling sizeand density into the model. The modeling approach pre-sented here differs considerably from previous approaches(Sander et al. 1984; Loftis 1990b; Dey 1991; Belli et al.1999) and provides an additional perspective on regenerationmodeling.
Plot-level modeling is a feasible alternative to individualtree modeling using logistic regression analysis (e.g., Sanderet al. 1984; Loftis 1990b). Repeated measurements of indi-vidual seedlings, which are needed for logistic regression,
are relatively uncommon outside of specialized studies. Plotsare the standard unit of observation in forest measurementsand they often provide the most readily available data foraddressing a range of ecological questions (Chojnacky 2001).In the present study, linking the long-term data, summarizedto the stand level, and the short-term data, summarized tothe plot level, was a significant challenge. Inverse modelingproved to be a useful tool for linking the two data sets toproduce a single plot-level model. The plot-level model wasselected, in part, because it was appropriate for the availableadvanced regeneration data (measured on milacre plots), butit also provided a practical framework for simplifying thestand development process for modeling purposes. Plots rep-resent a competitive neighborhood from which only a singleseedling is expected to succeed. The plot-level model ismore sensitive to the spatial arrangement of seedlings com-pared with a stand-level model, where seedling densities areaveraged across plots before being multiplied by successprobabilities (e.g., Loftis 1993). The spatial arrangement ofseedlings is ecologically important, since seedlings that areaggregated are more likely to compete with one another(Leps and Kindlman 1987; Tome and Burkhart 1989), therebyreducing their potential contribution to the future stand.
Modeling plot-level success as a function of the successof multiple seedlings is potentially complex, but important.For example, the Ozark regeneration model (Sander et al.1984) oversimplifies the regeneration process by calculatingplot-level success as the success probability of the largeststem of oak advanced regeneration on the plot. Consequently,that model is relatively insensitive to regeneration densityand a plot that contains several stems of a given size is con-sidered to have the same probability of success as a plot thatcontains only a single stem. Belli and others (1999) im-proved on the plot-level approach by proposing a point sys-tem to weight the contributions of individual stems. Thenegative exponential function used here allowed the jointsuccess probability of multiple oak seedlings to be modeledas a function of a single value, aggregate height. The func-tion was critical for maintaining the model’s simplicity with-out making unrealistic assumptions about the developmentalprocess. The long-term Ozark data set supports the conclusionthat the function is applicable to models of oak regenerationsuccess. The negative exponential function, with aggregateheight as the independent variable, may be more broadlyuseful for regeneration modeling in other forest types wherethere are adequate data to identify an appropriate α value.
Several factors must be addressed in judging the strengthof the modeling approach. The link between the LT 1 andST stands is a potential weakness that may affect the model’saccuracy. The link requires the assumption that the measuresof oak advanced regeneration distribution are the same forthe two data sets and that the relationships between regener-ation distribution and regeneration size and density observedin the ST stands also occurred in the LT 1 stands. It is possiblethat the measures of oak advanced regeneration distributionwere not perfectly identical for the two data sets. Althoughthe criteria for recording oak advanced regeneration for theLT 1 stands (a seedling at least 2 years old) may have beensomewhat more restrictive than the criteria applied to the STstands (at least one oak seedling of any size), 2-year-oldseedlings are typically small under closed canopies, and for-
© 2006 NRC Canada
Gould et al. 841
Fig. 9. The plot-level model (line) and 20-year success propor-tions, by preharvest height class, for the Missouri Ozark data(points). Success is defined as (1) reaching a dominant orcodominant crown position (open points) and (2) reaching adominant, codominant, or intermediate crown position (filledpoints) 20–21 years after harvest.

esters who collected the original data have stated that essentiallyall oak seedlings were counted. Thus, important differencesin the way the LT 1 and ST stands were measured appearunlikely. However, if such differences did exist, they couldhave a sizable impact on the model’s accuracy. Discountingsmaller oak seedlings entirely in the calculation of oak advancedregeneration distributions in the ST data set resulted in muchless optimistic α values. While the R>15 cm and R>30 cm sce-narios are improbable, they do underscore the importance ofconsistency between data sets to our modeling approach.
The relationships between oak advanced regeneration dis-tribution and density and size exhibited similar thresholds (atabout 60% distribution) as the long-term relationship be-tween distribution and third-decade seed-origin stocking. Theseresults suggest similar mechanisms controlled distribution,density, and size in both the LT 1 and ST stands. We hypoth-esize that the relationships reflect the overall “favorability”of the growing environment, which is a function of severalfactors (e.g., light, competing vegetation, deer browsing). Un-der most conditions, periodic large seed crops can temporarilyproduce dense, well-distributed cohorts of small seedlings.This pattern was evident in ST stands with well-distributedregeneration, but few large seedlings. If stand conditions areunfavorable for growth and survival, seedlings remain smalland the distribution and density of seedlings declines rap-idly. When growth and survival are more favorable, the den-sity and distribution of oak seedlings decline less rapidly orremain fairly constant and surviving seedlings accumulateheight. A favorable growing environment maintains a highdensity of well-distributed seedlings and allows seedlings togrow larger. This pattern was evident in that larger oak seed-lings were found only in the ST stands with high distribu-tion.
Factors such as site productivity, competing non-tree veg-etation, and deer browsing intensity are known to impact theregeneration process (Jordan 1967; George and Bazzaz 1999;Liptzin and Ashton 1999; Horsley et al. 2003), but are notconsidered in the model. The development of the LT 1 standswas affected by these factors, and third-decade oak stockinglevels undoubtedly reflect a variety of influences. On aver-age, stands that are regenerated under contemporary condi-tions can be expected to develop similarly to the LT 1 stands,unless growing conditions have changed markedly. Long-term data on deer densities and understory compositions arenot available to address this question. However, estimatessuggest that deer densities have been fairly constant over thepast several decades and may have even declined in the Ap-palachian Plateau region (Redding 1995; Diefenbach et al.1997), indicating that the LT 1 stands did not experience lessintense browsing than the contemporary forest. Competitionfrom non-tree vegetation such as hayscented fern(Dennstaedtia punctilobula (Michx.) Moore) has likely in-creased and is clearly problematic in some contemporarystands. Regenerating oaks is most difficult on highly produc-tive sites (Lorimer 1993). The model was developed fromstands of low to moderate productivity and should not be ap-plied to more productive stands (SI > 23 m, base age 50)where competition from non-tree vegetation and non-oakseedlings is expected to be most intense. Even if the modelproves to be unbiased on average, adding additional factorscould improve its precision. Site productivity, deer browsing,
and competing vegetation were undoubtedly important sourcesof variation in third-decade oak stocking levels. Given suffi-cient data, a better model could be developed to account forthese sources of variation.
The importance of small oak seedlings (e.g., ≤30 cm)merits particular attention, since these seedlings have previ-ously been considered of little value to regeneration (Sanderet al. 1976). For a hypothetical plot occupied by a single30 cm seedling, the present model assigns a greater successprobability (0.09) than comparable models from the Mis-souri Ozarks (Sander et al. 1984) and southern Appalachians(Loftis 1990b) (success probability for both models = 0.01).The difference between models may be due, in part, to regionaldifferences in growing conditions. Successful oak regenera-tion is most difficult to achieve on highly productive sites(Lorimer 1993) such as those in the southern Appalachians,where intensive competition with yellow-poplar (Lirioden-dron tulipifera L.) reduces the competitive capacity of smalloak seedlings. Stand productivity in our study sites is bestcharacterized as low to moderate, and competition is typi-cally less intense (Gould et al. 2004). Site productivity in theMissouri Ozarks is also typically low to moderate, and thedifference in this case maybe attributable to different model-ing approaches. The Ozark model was developed based onpreharvest seedling measurements and measurements 5 yearsafter harvest (Sander et al. 1984). Fifth-year seedlings thatwere at least 2.7 m tall were considered successes for logis-tic regression modeling and smaller seedlings were consid-ered failures. The accuracy of the model hinges on how wellthe fifth-year success criterion served as an approximation of20-year success (reaching a dominant or codominant crownposition 20 years after harvest). The 20-year data from theMissouri Ozarks presented here strongly suggest that theOzark model is too conservative, probably because the suc-cess criterion was too restrictive. Actual 20-year successproportions for small seedlings were much closer to propor-tions from the present model than to those from the Ozarkmodel, which were based on data from the same plots mea-sured at an earlier age. Ward and Stephens (1999), in a casestudy from Connecticut, reported that oak seedlings <30 cmtall at the time of harvest reached an upper canopy position12 years later on over one-quarter of sample plots, indicatingthat small oak seedlings are important to regeneration inNew England. Preliminary results from some stands in ourST data set that have had overstory removals also demon-strate that seedlings <30 cm contribute importantly to re-generation development (K.C. Steiner, unpublished data).Unfortunately, too few case studies have been reported, andthere are no published reports that thoroughly test the accu-racy of existing oak regeneration models (Sander et al.1984; Loftis 1990b; Dey et al. 1996). Similarly, the presentmodel has not yet been tested and its accuracy has not beendemonstrated. There is a critical need for more research inthis area.
Despite its limitations, the present model can address theimmediate need for a predictive tool for the central Appala-chian region. Many of the model’s inadequacies can be over-come by using it in conjunction with an expert system toguide management decisions. For example, the model doesnot account for the effects of non-tree competing vegetation,but competition can be evaluated and addressed using a sep-
© 2006 NRC Canada
842 Can. J. For. Res. Vol. 36, 2006

arate system. A particularly important case to recognize iswhen the model predicts high third-decade oak stocking, butcompeting vegetation or intense deer browsing appears likelyto reduce actual regeneration success. The model output canbe partitioned into several categories (low, medium, or highregeneration potential) to reflect the model’s unknown preci-sion. As part of a more comprehensive set of regenerationguidelines, the model can make a critical contribution to thescience of silviculture in the region.
Acknowledgements
This research was funded, in part, by the PennsylvaniaPennsylvania Department of Conservation and Natural Re-sources, Bureau of Forestry, and the Pennsylvania HardwoodDevelopment Council. Thanks go to Daniel Dey, USDA For-est Service, North Central Research Station, for supplyingthe Missouri Ozark data set. Comments from three anony-mous reviewers improved an earlier draft of this paper.
References
Abrams, M.D., and Nowacki, G.J. 1992. Historical variation infire, oak recruitment, and post-logging accelerated succession incentral Pennsylvania. Bull. Torrey Bot. Club, 119: 19–28.
Asner, G.P., Wessman, C.A., and Schimel, D.S. 1998. Heterogene-ity of savanna canopy structure and function from imaging spec-trometry and inverse modeling. Ecol. Appl. 8: 1022–1036.
Avery, T.E., and Burkhart, H.E. 1994. Forest measurements.McGraw-Hill, New York.
Bailey, R.G., Avers, P.E., King, T., and McNab, W.H. (Editors).1994. Ecoregions and subregions of the United States (map).U.S. Geological Survey, Wahington, D.C.
Beck, D.E., and Hooper, R.M. 1986. Development of a southernAppalachian hardwood stand after clearcutting. South. J. Appl.For. 10: 168–172.
Belli, K.L., and Ek, A.R. 1988. Growth and survival modeling forplated conifers in the Great Lakes region. For. Sci. 34: 458–473.
Belli, K.L., Hart, C.P., Hodges, J.D., and Stanturf, J.A. 1999. As-sessment of the regeneration potential of red oaks and ash onminor bottoms of Mississippi. South. J. Appl. For. 23: 133–138.
Bertault, J.G., Dupuy, B., and Maitre, H.F. 1995. Silviculture forsustainable management of tropical moist forest. Unasyla, 46:3–9.
Bowersox, T.W., and Ward, W.W. 1972. Prediction of oak site in-dex in the Ridge and Valley region of Pennsylvania. For. Sci. 18:192–195.
Brooks, J.R., and McGill, D.W. 2004. Evaluation of multiple fixedarea plot sizes and BAFs in even-aged hardwood stands. In Pro-ceedings of the 14th Central Hardwood Forest Conference,Wooster, Ohio, 16–19 March 2004. Edited by D.A. Yaussy,D.M. Hix, R.P. Long, and P.C. Goebel. USDA For. Serv. Gen.Tech. Rep. NE-316. pp. 94–100.
Brose, P., Van Lear, D., and Cooper, R. 1999. Using shelterwoodharvests and prescribed fire to regenerate oak stands on produc-tive upland sites. For. Ecol. Manage. 113: 125–141.
Chisman, H.H., and Schumacher, F.X. 1940. On the tree-area ratioand certain of its applications. J. For. 38: 311–317.
Chojnacky, D.C. 2001. On FIA variables for ecological use. In Pro-ceedings of the 2nd Annual Forest Inventory and Analysis Sym-posium, Salt Lake City, Utah, 17–18 October 2000. Edited byG.A. Reams, R.E. McRoberts, and P.C. Van Deusen. USDA For.Serv. Gen. Tech. Rep. SRS-47. pp. 102–105.
Cropper, W.P., and Anderson, P.J. 2004. Population dynamics of atropical palm: use of a genetic algorithm for inverse parameterestimation. Ecol. Model. 177: 119–127.
Cuff, D.J., Young, W.J., Muller, E.K., Zelinsky, W., and Abler, R.F.1989. The Atlas of Pennsylvania. Temple University Press, Phil-adelphia, Penn.
Dey, D.C. 1991. A comprehensive Ozark regenerator. Ph.D. disser-tation, University of Missouri-Columbia, Columbia, Mo.
Dey, D.C., Johnson, P.S., and Garrett, H.E. 1996. Modeling the re-generation of oak stands in the Missouri Ozark Highlands. Can.J. For. Res. 26: 573–583.
Diefenbach, D.R., Palmer, W.L., and Shope, W.K. 1997. Attitudesof Pennsylvania sportsmen towards managing white-tailed deerto protect the ecological integrity of forests. Wildl. Soc. Bull.25: 244–251.
Fei, S., Gould, P.J., Steiner, K.C., and Finley, J.C. 2006. Aggregateheight — a composite measure of stand density for tree seedlingpopulations. For. Ecol. Manage. 223(1–3): 336–341.
Finkeldey, R., and Ziehe, M. 2004. Genetic implications of silvi-cultural regimes. For. Ecol. Manage. 197: 231–244.
Gingrich, S.F. 1967. Measuring and evaluating stocking and standdensity in upland hardwood forests in the central states. For. Sci.13: 38–53.
Gingrich, S.F. 1971. Management of young and intermediate standsof upland hardwoods. USDA For. Serv. Res. Pap. NE-195.
George, L.O., and Bazzaz, F.A. 1999. The fern understory as anecological filter: growth and survival of canopy-tree seedlings.Ecology, 80: 846–856.
Gould, P.J., Steiner, K.C., Finley, J.C., McDill, M.E., and Fei, S.2004. The post-harvest competitive environment in 13 mixed-oak stands in Pennsylvania. In Proceedings of the 14th CentralHardwood Forest Conference, Wooster, Ohio, 16–19 March2004. Edited by D.A. Yaussy, D.M. Hix, R.P. Long, and P.C.Goebel. USDA For. Serv. Gen. Tech. Rep. NE-316. pp. 427–433.
Horsley, S.B., Stout, S.L., and deCalesta, D.S. 2003. White-taileddeer impact on the vegetation dynamics of a northern hardwoodforest. Ecol. Appl. 13: 98–118.
Ihaka, R., and Gentleman, R. 1996. R: a language for data analysisand graphics. J. Comput. Graph. Stat. 5: 299–314.
Johnson, P.S., Shifley, S.R., and Rogers, R. 2002. The ecology andsilviculture of oaks. CABI Publishing, New York.
Jordan, J.S. 1967. Deer browsing in northern hardwoods after clear-cutting. USDA For. Serv. Res. Pap. NE-57.
Kozlowski, T.T. 2002. Physiological ecology of natural regenera-tion of harvested and disturbed forest stands: implications forforest management. For. Ecol. Manage. 158: 195–221.
Leak, W.B. 1969. Stocking of northern hardwood regeneration basedon the exponential dropout rate. For. Chron. 45: 344–347.
Leps, J., and Kindlmann, P. 1987. Models of the development ofspatial pattern of an even-aged plant population over time. Ecol.Model. 39: 45–57.
Liptzin, D.L., and Ashton, P.M.S. 1999. Early-succesional dynam-ics of single-aged mixed hardwood stands in a southern NewEngland forest, USA. For. Ecol. Manage. 116: 141–150.
Loftis, D.L. 1990a. A shelterwood method for regenerating red oakin the southern Appalachians. For. Sci. 36: 917–929.
Loftis, D.L. 1990b. Predicting post-harvest performance of advancedred oak reproduction in the southern Appalachians. For. Sci. 36:908–916.
Loftis, D.L. 1993. Regenerating northern red oak on high qualitysites in the southern Appalachians. In Oak regeneration: seriousproblems, practical recommendations. Edited by D. Loftis and
© 2006 NRC Canada
Gould et al. 843

C.E. McGee. USDA For. Serv. Gen. Tech. Rep. SE-84. pp. 202–210.
Lorimer, C.G. 1993. Causes of the oak regeneration problem. InOak regeneration: serious problems, practicle recommendations.Edited by D. Loftis and C.E. McGee. USDA For. Serv. Gen.Tech. Rep. GTR SE-84. pp. 14–39.
Payandeh, B. 1996. Growth and survival functions for three plantedspecies in northern Ontario. North. J. Appl. For. 13: 19–23.
Redding, J. 1995. History of deer population trends and forest cut-ting on the Allegheny National Forest. In Proceedings of the10th Central Hardwood Forest Conference, Morgantown, W.Va.,5–8 March 1995. Edited by K.W. Gottschalk and S.L.C. Fosbroke.USDA For. Serv. Gen. Tech. Rep. NE-197. pp. 214–224.
Sander, I.L. 1973. Study plan: How can reproduction developmentfollowing complete overstory removal be predicted? Unpublishedreport. FS-NC-1109, OH-466. Available from P.J. Gould.
Sander, I.L., Johnson, P.S., and Watt, R.F. 1976. A guide for evalu-ating the adequacy of oak advance reproduction. USDA For.Serv. Gen. Tech. Rep. NC-23.
Sander, I.L., Johnson, P.S., and Rogers, R. 1984. Evaluating oakadvance reproduction in the Missouri Ozarks. USDA For. Serv.Res. Pap. NC-251.
SAS Institute Inc. 1999. The SAS System for Windows, version8.02. SAS Institute Inc., Cary, N.C.
Sit, V., and Poulin-Costello, M. 1994. Catalog of curves for curvefitting. B.C. Min. For. Res. Biom. Info. Handb. 4.
Smith, D.M., Larson, B.C., Kelty, M.J., and Ashton, P.M.S. 1997.The practice of silviculture. John Wiley & Sons, New York.
Stout, S.L. 1991. Stand density, stand structure, and species com-position in transition oak stands of northwestern Pennsylvania.In Proceedings of the 8th Central Hardwood Forest Conference,University Park, Penn., 4–6 March 1991. Edited by L.H.McCormick and K.W. Gottschalk. USDA For. Serv. Gen. Tech.Rep. NE-148. pp. 194–206.
Stout, S.L. 2000. Twentieth century forestry in Pennsylvania. Pa.For. 2: 9–14.
Timoney, K.P., and Peterson, G. 1996. Failure of natural regenera-tion after clearcut logging in Wood Buffalo National Park, Can-ada. For. Ecol. Manage. 87: 89–105.
Tome, M., and Burkhart, H.E. 1989. Distance-dependent competi-tion measures for predicting growth of individual trees. For. Sci.35: 816–831.
Uriarte, M., Canham, C.D., Thompson, J., Zimmerman, J.K., andBrokaw, N. 2005. Seedling recruitment in a hurricane-driventropical forest: light limitation, density dependence and the spa-tial distribution of parent trees. J. Ecol. 93: 291–304.
Ward, J.S., and Stephens, G.R. 1999. Influence of cutting methodon 12-year-old hardwood regeneration in Connecticut. In Pro-ceedings of the 9th Central Hardwood Forest Conference, 8–10 March 1993, West Lafayette, Ind. Edited by W. Stringer andD.L. Loftis. USDA For. Serv. Gen. Tech. Rep. SRS-24. pp. 204–208.
© 2006 NRC Canada
844 Can. J. For. Res. Vol. 36, 2006