A Collaborative Approach to Study Northwest Flow Snow in The Southern Appalachians
13
A COLLABORATIVE APPROACH TO STUDY NORTHWEST FLOW SNOW IN THE SOUTHERN APPALACHIANS BY STEVE KEIGHTON, LAURENCE LEE, BLAIR HOLLOWAY, DAVID HOTZ, STEVEN ZUBRICK, JEFFREY HOVIS, GARY VOTAW, L. BAKER PERRY, GARY LACKMANN, SANDRA E. Y UTER, CHARLES KONRAD, DOUGLAS MILLER, AND BRIAN ETHERTON N orthwest flow snow (NWFS) in the southern Appalachian region occurs during periods of moist, upslope flow in association with north- west low-level wind, often resulting in significant snowfall in the absence of synoptic-scale upward vertical motion. Very sharp snow accumulation gradients are created by the superposition of the synoptic-scale flow across the long, but rather narrow, mountain range and smaller-scale upward and downward motions induced by the numerous ridges and valleys intersecting at various angles. Snowfall totals can range from a trace to over a meter from event to event or even within a single event. The highly variable nature of the snowfall in terms of duration, spatial distribution, and amount is such that observational and forecast techniques were not conducive to providing useful advance notice of these events until fairly recently. Frequently, forecasts of post–cold frontal weather mentioned only “snow flurries,” which implied no accumulation. Indeed, flurries often occurred, but many events also included Improved understanding and forecasting of northwest flow snow is the focus of a unique team of academic and operational colleagues from several universities and National Weather Service offices. Detail of an AVHRR false color satellite image. See Fig. 4 for more information.
-
Upload
independent -
Category
Documents
-
view
6 -
download
0
Transcript of A Collaborative Approach to Study Northwest Flow Snow in The Southern Appalachians
A COLLABORATIVE APPROACH TO STUDY NORTHWEST FLOW
SNOW IN THE SOUTHERN APPALACHIANS
by steve Keighton, Laurence Lee, bLair hoLLoway, david hotz, steven zubricK, JeFFrey hovis, gary votaw, L. baKer Perry, gary LacKmann, sandra e. yuter,
charLes Konrad, dougLas miLLer, and brian etherton
N orthwest flow snow (NWFS) in the southern Appalachian region occurs during periods of moist, upslope flow in association with north-
west low-level wind, often resulting in significant snowfall in the absence of synoptic-scale upward vertical motion. Very sharp snow accumulation gradients are created by the superposition of the synoptic-scale f low across the long, but rather narrow, mountain range and smaller-scale upward and downward motions induced by the numerous ridges and valleys intersecting at various angles. Snowfall totals can range from a trace to over a meter from event to event or even within a single event. The highly variable nature of the snowfall in terms of duration, spatial distribution, and amount is such that observational and forecast techniques were not conducive to providing useful advance notice of these events until fairly recently. Frequently, forecasts of post–cold frontal weather mentioned only “snow flurries,” which implied no accumulation. Indeed, flurries often occurred, butmany events also included
Improved understanding and forecasting of northwest flow snow is the focus of a unique team of academic and operational colleagues from
several universities and National Weather Service offices.
Detail of an AVHRR false color satellite image.
See Fig. 4 for more information.
980 JUly 2009|
several hours of snow, or even heavy snow showers, resulting in sufficient accumulation to cause travel problems and to close schools and businesses. Seasonal population growth from winter tourism has increased the need for accurate prediction of these snowfall events in recent years. For example, the ski industry has an economic impact of $120 million annually in North Carolina alone, and total skier visits increased from 338,000 in 1976/77 to 544,000 in 2002/03 (Millsaps and Groothuis 2003). In the past 10 years, a new interstate highway segment has been completed through western North Carolina, and another highway has been widened from two lanes to four, so an increase in commerce through the area has also demanded more accurate forecasts.
Keeter et al. (1995) provide an overview of the effects
of topography on winter storms in the southeast United States. However, NWFS in the southern Appalachians is not specifically addressed in their work. St. Jean et al. (2004) examine northwest flow regimes that produce orographically enhanced snowfall in the northeastern United States, but until recently very little attention was devoted to NWFS in the southern Appalachians. Initial climatologi-cal NWFS studies (e.g., Perry 2006; Perry et al. 2007b) noted the potential contribution of the upstream Great Lakes, consistent with the findings of Sousounis and Fritsch (1994), who first emphasized the regional character of the lake aggregate influ-ence. The previous lack of attention to NWFS in the weather analysis and forecasting literature may be due to the absence of an observational and climatological basis for identifying the events. In addition, the application of
numerical weather analysis and prediction models to study the mesoscale features and processes associated with NWFS has not occurred until recently.
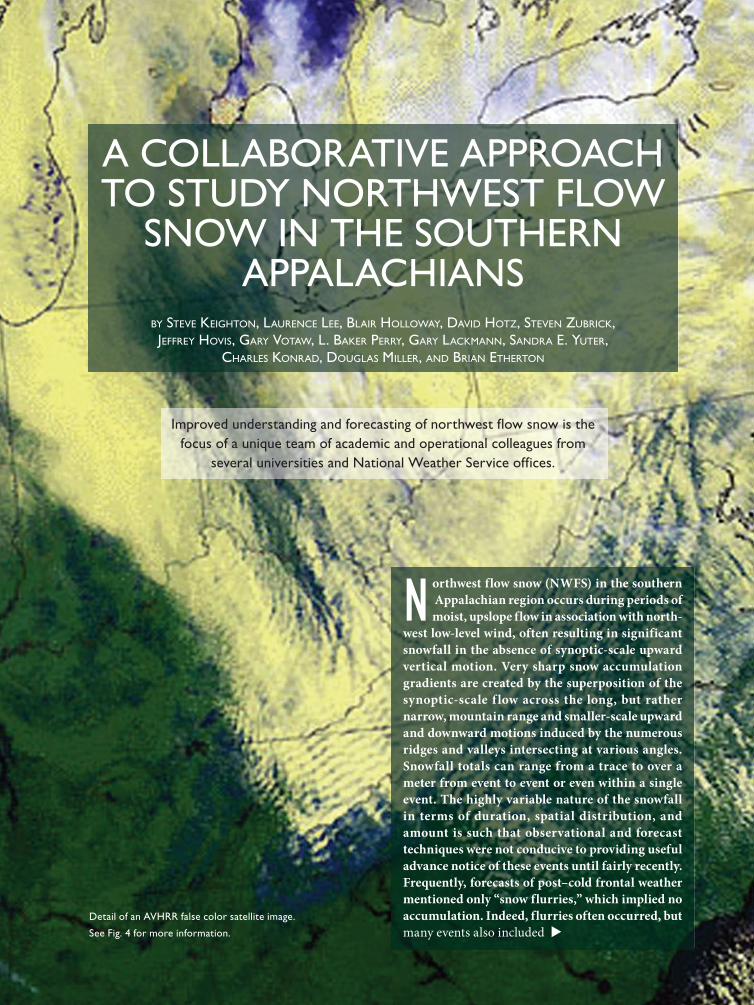
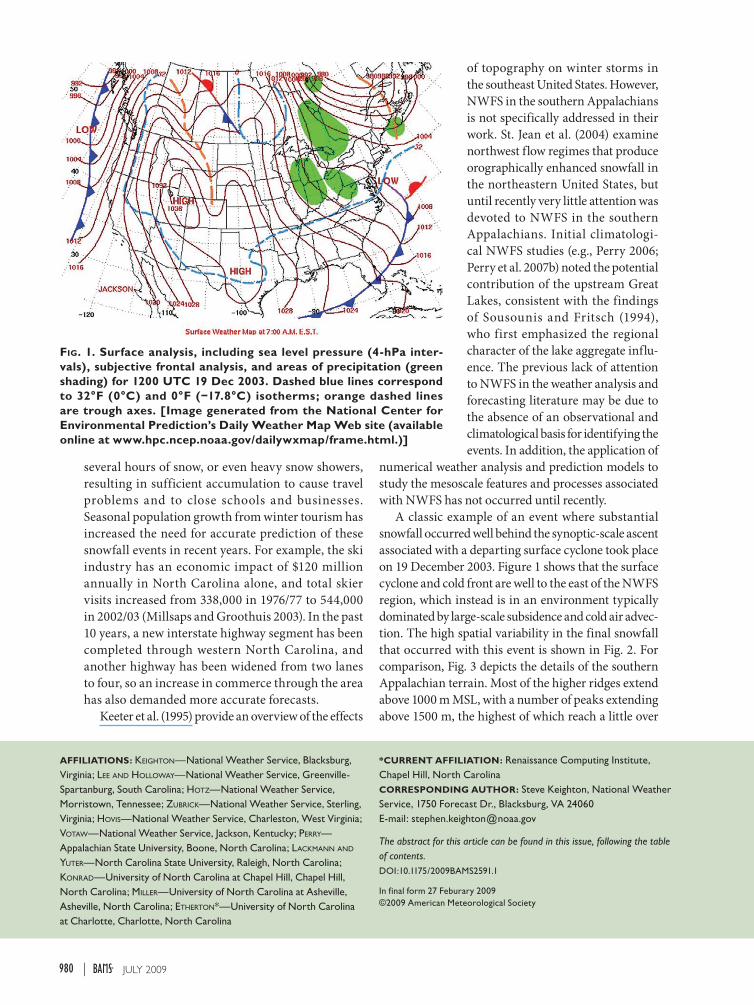
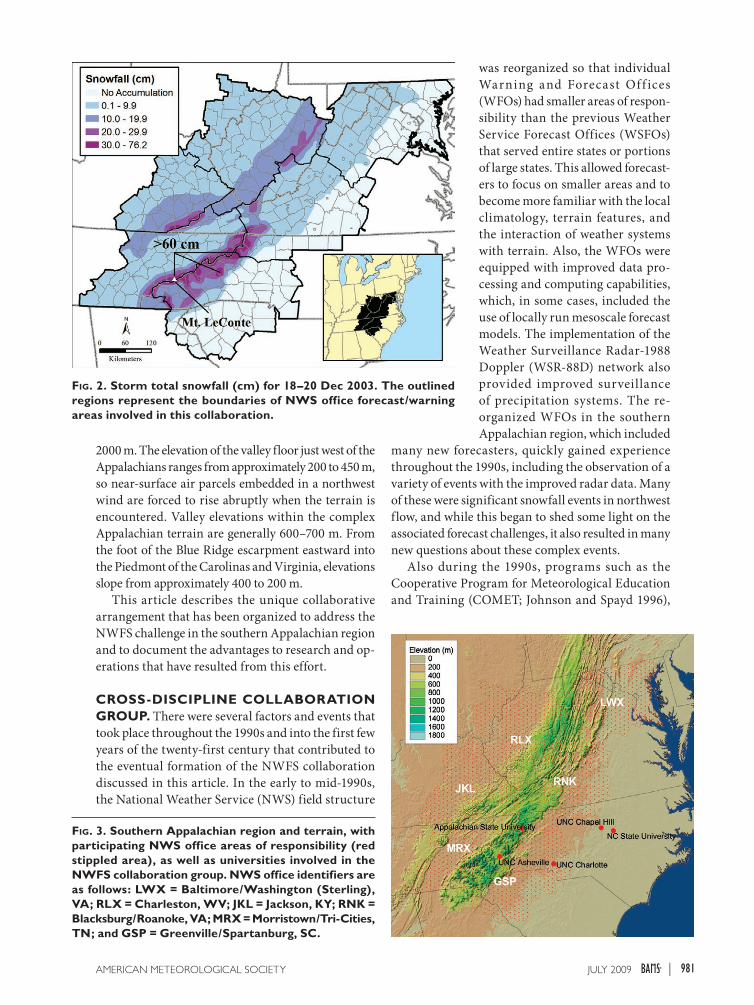
A classic example of an event where substantial snowfall occurred well behind the synoptic-scale ascent associated with a departing surface cyclone took place on 19 December 2003. Figure 1 shows that the surface cyclone and cold front are well to the east of the NWFS region, which instead is in an environment typically dominated by large-scale subsidence and cold air advec-tion. The high spatial variability in the final snowfall that occurred with this event is shown in Fig. 2. For comparison, Fig. 3 depicts the details of the southern Appalachian terrain. Most of the higher ridges extend above 1000 m MSL, with a number of peaks extending above 1500 m, the highest of which reach a little over
Fig. 1. Surface analysis, including sea level pressure (4-hPa inter-vals), subjective frontal analysis, and areas of precipitation (green shading) for 1200 UTC 19 Dec 2003. Dashed blue lines correspond to 32°F (0°C) and 0°F (−17.8°C) isotherms; orange dashed lines are trough axes. [Image generated from the National Center for Environmental Prediction’s Daily Weather Map Web site (available online at www.hpc.ncep.noaa.gov/dailywxmap/frame.html.)]
AFFILIATIONS: Keighton—National Weather Service, Blacksburg, Virginia; Lee and hoLLoway—National Weather Service, Greenville-Spartanburg, South Carolina; hotz—National Weather Service, Morristown, Tennessee; zubricK—National Weather Service, Sterling, Virginia; hovis—National Weather Service, Charleston, West Virginia; votaw—National Weather Service, Jackson, Kentucky; Perry—Appalachian State University, Boone, North Carolina; LacKmann and yuter—North Carolina State University, Raleigh, North Carolina; Konrad—University of North Carolina at Chapel Hill, Chapel Hill, North Carolina; miLLer—University of North Carolina at Asheville, Asheville, North Carolina; etherton*—University of North Carolina at Charlotte, Charlotte, North Carolina
*CUrrENT AFFILIATION: Renaissance Computing Institute, Chapel Hill, North CarolinaCOrrESPONDING AUTHOr: Steve Keighton, National Weather Service, 1750 Forecast Dr., Blacksburg, VA 24060E-mail: [email protected]
The abstract for this article can be found in this issue, following the table of contents.DOI:10.1175/2009BAMS2591.1
In final form 27 Feburary 2009©2009 American Meteorological Society
981JUly 2009AMERICAN METEOROlOGICAl SOCIETy |
2000 m. The elevation of the valley floor just west of the Appalachians ranges from approximately 200 to 450 m, so near-surface air parcels embedded in a northwest wind are forced to rise abruptly when the terrain is encountered. Valley elevations within the complex Appalachian terrain are generally 600–700 m. From the foot of the Blue Ridge escarpment eastward into the Piedmont of the Carolinas and Virginia, elevations slope from approximately 400 to 200 m.
This article describes the unique collaborative arrangement that has been organized to address the NWFS challenge in the southern Appalachian region and to document the advantages to research and op-erations that have resulted from this effort.
CrOSS-DISCIPLINE COLLABOrATION GrOUP. There were several factors and events that took place throughout the 1990s and into the first few years of the twenty-first century that contributed to the eventual formation of the NWFS collaboration discussed in this article. In the early to mid-1990s, the National Weather Service (NWS) field structure
was reorganized so that individual Warning and Forecast Off ices (WFOs) had smaller areas of respon-sibility than the previous Weather Service Forecast Offices (WSFOs) that served entire states or portions of large states. This allowed forecast-ers to focus on smaller areas and to become more familiar with the local climatology, terrain features, and the interaction of weather systems with terrain. Also, the WFOs were equipped with improved data pro-cessing and computing capabilities, which, in some cases, included the use of locally run mesoscale forecast models. The implementation of the Weather Surveillance Radar-1988 Doppler (WSR-88D) network also provided improved surveillance of precipitation systems. The re-organized WFOs in the southern Appalachian region, which included
many new forecasters, quickly gained experience throughout the 1990s, including the observation of a variety of events with the improved radar data. Many of these were significant snowfall events in northwest flow, and while this began to shed some light on the associated forecast challenges, it also resulted in many new questions about these complex events.
Also during the 1990s, programs such as the Cooperative Program for Meteorological Education and Training (COMET; Johnson and Spayd 1996),
Fig. 2. Storm total snowfall (cm) for 18–20 Dec 2003. The outlined regions represent the boundaries of NWS office forecast/warning areas involved in this collaboration.
Fig. 3. Southern Appalachian region and terrain, with participating NWS office areas of responsibility (red stippled area), as well as universities involved in the NWFS collaboration group. NWS office identifiers are as follows: LWX = Baltimore/Washington (Sterling), VA; rLX = Charleston, WV; JKL = Jackson, KY; rNK = Blacksburg/roanoke, VA; MrX = Morristown/Tri-Cities, TN; and GSP = Greenville/Spartanburg, SC.
982 JUly 2009|
as well as regional meetings (Stuart 1996), were supported to bring together forecasters in both the public and private sectors along with scientists at colleges, universities, and atmospheric science research laboratories. An important initiative was the 1994 collocation of the WFO at Raleigh, North Carolina, with the Department of Marine, Earth, and Atmospheric Sciences at North Carolina State University (NCSU). This union was the culmination of a gradual evolution of collaboration that started in the 1970s and steadily matured through the 1980s into the 1990s. By the late 1990s, the Collaborative Science, Technology, and Applied Research (CSTAR) program provided funding for researchers at NCSU to collaborate with meteorologists at nearby WFOs with the goal of studying topographically forced weather systems in the Carolinas and Virginia.
The initial CSTAR effort did not examine north-west f low snow, but operational forecasters and university researchers worked together to identify and study difficult regional forecast problems (e.g., coastal frontogenesis, cold air damming). The rela-tionships that were forged and the positive results that were obtained from these collaborative efforts led to additional CSTAR funding in 2003 that supported an effort to improve quantitative precipitation fore-casting in the southeast United States. Even though NWFS was not a primary CSTAR topic, the program provided a means for interested forecasters and researchers to discuss this challenging wintertime precipitation forecast problem. CSTAR workshops created an opportunity for the sharing of some initial NWFS studies that were being conducted at regional NWS offices, NCSU, various campuses in the University of North Carolina (UNC) system such as UNC Asheville (UNCA), UNC Charlotte (UNCC), and UNC Chapel Hill (UNC-CH), and Appalachian State University (ASU). These meetings introduced participants to the multi-perspective examination of the phenomenon (e.g., observational, climatological, pattern recognition, numerical modeling), improved communication among the parties investigating the various aspects of northwest flow snow events (e.g., Perry 2006; Perry and Konrad 2006), and served to strengthen existing university–NWS ties.
The NWFS collaboration group first formed in the fall of 2005 as an offspring of sorts from these broader formal CSTAR efforts, as several of the par-ticipants recognized the mutual interests and common ground in some of the initial research that was taking place with northwest flow snow and became better acquainted with one another. Since that time, the Northwest Flow Snow group has grown in size while
continuing to collaborate on research and operational aspects of the NWFS problem. The academic group members come from the several campuses in the University of North Carolina system previously men-tioned (NCSU, ASU, UNCA, UNCC, and UNC-CH). These include climatologists from two geography departments and meteorologists specializing in syn-optic and mesoscale meteorology, numerical model-ing, and instrumentation. National Weather Service participation in the group includes the Science and Operations Officers (SOOs; the SOO in each WFO is the chief scientist and local research leader for the office), as well as one or two forecasters from a cluster of forecast offices with responsibility for the southern Appalachian region. These offices include Baltimore/Washington (LWX), Blacksburg/Roanoke, Virginia (RNK), Greenville/Spartanburg, South Carolina (GSP), Morristown, Tennessee (MRX), Jackson, Kentucky (JKL), and Charleston, West Virginia (RLX). The areas of responsibility for each of these offices, as well as the locations of the universities involved, are overlaid with the terrain image in Fig. 3.
Recent non-CSTAR collaborations among ASU, NCSU, and UNCA have brought more advanced observational tools (such as a vertically pointing radar, a disdrometer, a weighing precipitation gauge, and mobile sounding equipment) into the southern Appalachians for the purpose of studying NWFS and other precipitation systems that cross the region. Each one of the universities has contributed to the effort by providing support in a particular area of interest and expertise (UNCA—modeling, forecasting, and observations; ASU—climatology, observations, snow water equivalence, and snow particle photomicros-copy; NCSU—remote sensing, dynamics of mesoscale precipitation systems, and observations). The data collected by the new platforms allow a more detailed examination of NWFS atmospheric f low features, storm structure, and precipitation characteristics.
The group maintains communication focused on a number of areas, including
1) learning from and improving on various mesoscale forecast model configurations and using these models to better define the relative roles of orographic forcing versus vertical motion from various scales of forcing in the free atmosphere;
2) promoting further understanding of the role of the Great Lakes, as well as other upstream conditions such as snow cover, in providing moisture, tempera-ture, and stability profiles favorable for NWFS;
3) exploring how unique local instrumentation (i.e., a vertically pointing Micro Rain Radar, discussed
983JUly 2009AMERICAN METEOROlOGICAl SOCIETy |
in a later section) can provide new insights into the NWFS forecast problem;
4) developing a more detailed climatology of NWFS events, which includes computation of observed snow-to-liquid ratios, expansion of snow spotter networks, and better utilization of high-resolution satellite imagery following events; and
5) developing improved operational forecast strate-gies and methodologies.
The diversity of expertise within the group provides the members an opportunity for learning from one an-other, helps the group identify new research topics for students and faculty, and ultimately, through training, increases the understanding and forecast skill in the NWS offices regarding these challenging events.
The collaboration among group members is more or less continuous, regardless of whether a specific formal research effort is in progress or not. The methods of communication are diverse and have effectively main-tained an enthusiastic environment for sharing and learning. These methods include the following:
1) routine (usually monthly during the winter season) conference calls with a predefined agenda, typically including discussion of recent or upcom-ing events, the status of experimental datasets or local models, any recent research insights or ideas for new research, and opportunities for publica-tions or ideas for developing forecast practices;
2) an e-mail listserv discussion forum with a broader audience than the typical conference call group, de-signed primarily for operational discussion of up-coming or recent events [The listserv includes sev-eral NWS forecasters from the participating offices, staff from the National Centers for Environmental Prediction Hydrometeorological Prediction Center, and faculty and students from the universities. These discussions have at times provided addi-tional insight into the forecast of an upcoming or recent event (e.g., snow-to-liquid ratios different from expectations due to strong winds, or the diurnal nature of horizontal snow bands leading to accumulations farther downstream).];
3) simple Web-based event reviews developed by anyone in the group as time permits to facilitate discussion and begin to develop an historical archive for reference and training purposes; and
4) a group Web page used for central storage of event reviews, conference call minutes, presentations on preliminary research results, published references, and operational links including local mesoscale model data and a variety of observations (available
online at www.erh.noaa.gov/gsp/localdat/NWFS_discussion_group/nwfs_discussion_group.html).
The accomplishments and general success of this group as described throughout this article are hard to attribute to a specific formula that was purposely followed. To a certain extent it is probably due to sev-eral intangible factors and fortunate circumstances, including member personalities and leadership styles, and the degree to which many of us have come to know one another through previous collaborations (such as the CSTAR projects from which this group evolved). Still, there are several specific factors worth briefly mentioning that have been important to our success, and may be worth consideration by other similar groups when first forming. These include the following:
1) Members have a strong common interest in this particular forecast issue but also bring a diverse range of expertise and a variety of experience to the problem.
2) The group is large enough to exploit this diverse expertise but is still of a manageable size to allow effective communication via conference calls and email. There are 13 coauthors in our case, but typically about four to seven will be able to attend any particular call.
3) The routine calls, listserv discussions, and central storage of reference material on the group Web site all contribute to frequent communication and sharing of new information, which keeps interest high.
4) NWS offices have held periodic training sessions for the forecast staff on some of the results of the research and on the use of observational and mesoscale model data, in addition to sharing ideas for specific forecast methodologies. Efforts to transfer the knowledge gained from this col-laborative process into operations, as well as to provide feedback to researchers on data and model output and identify new topics for research, act as great motivation for the entire group.
As long as both operational and academic partici-pants continue learning from each other and new research opportunities present themselves, this group is expecting to maintain frequent communication. We anticipate that over the next couple of years the group will publish articles on various aspects of the NWFS forecast problem, facilitate enhancements to local model configurations (potentially including a “collaborative ensemble” approach), lead the expan-sion of ground truth reporting networks, develop
984 JUly 2009|
new operational forecasting methods, continue data collection, and participate in field projects (as funding allows). The coordination and collaboration afforded by the group enables us to improve physical understanding of NWFS processes and effectively incorporate this into operational forecasts of these events. This arrangement provides results that could not be anticipated without the unique collaboration and relationships that have developed.
S C I E N T I F I C A N D O P E r AT I O N A L rESULTS. Climatology. Previous climatological research has demonstrated that NWFS events are common along the windward slopes and at higher elevations of the southern Appalachian Mountains, averaging nearly 15 events per season and accounting for over 50% of mean annual snowfall totals (Perry 2006; Perry et al. 2007a). At the higher elevation wind-ward slopes, such as Mt. LeConte, Tennessee (1951 m, 250-cm mean annual snowfall), NWFS contributes 57% of mean annual snowfall, totaling 143 cm (Perry et al. 2007a). Interestingly, 60% of all NWFS events analyzed during a 50-yr period were accompanied by synoptic-scale subsidence at the 700-hPa level, highlighting the importance of orographic processes during these snowfall events (Perry 2006). As a result of the pronounced topographic forcing, the spatial patterns of snowfall for a typical NWFS event dis-play complex patterns that are strongly related to the topography (refer to Figs. 2 and 3). In particular,
NWFS totals are most positively correlated with the topographic variables of elevation and exposure to the northwest (Perry and Konrad 2006).
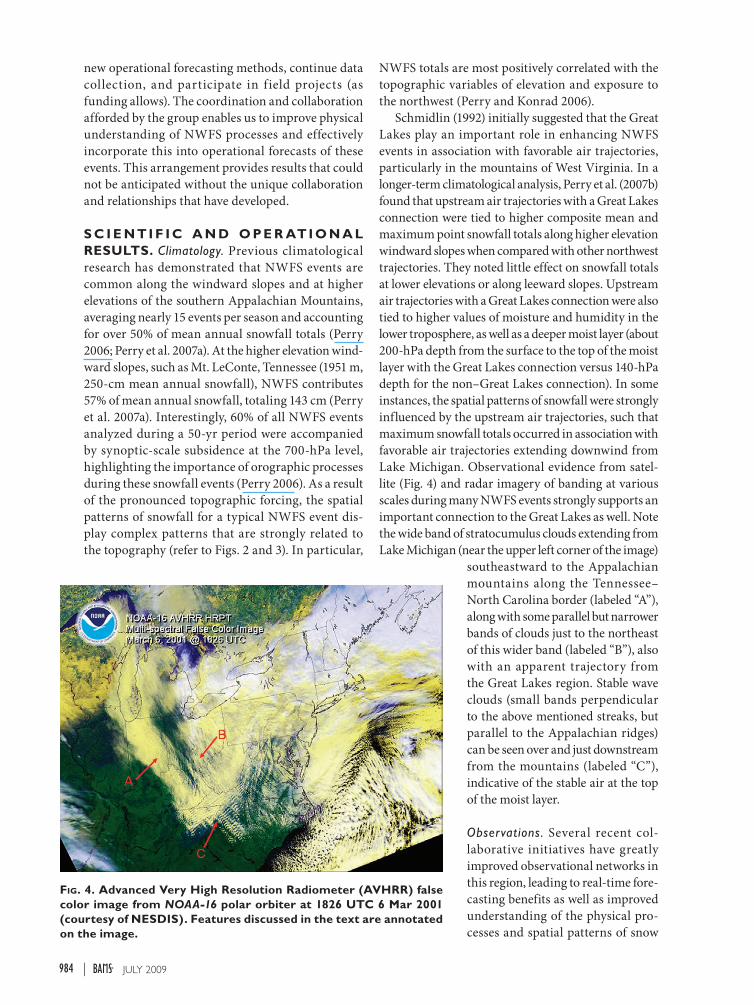
Schmidlin (1992) initially suggested that the Great Lakes play an important role in enhancing NWFS events in association with favorable air trajectories, particularly in the mountains of West Virginia. In a longer-term climatological analysis, Perry et al. (2007b) found that upstream air trajectories with a Great Lakes connection were tied to higher composite mean and maximum point snowfall totals along higher elevation windward slopes when compared with other northwest trajectories. They noted little effect on snowfall totals at lower elevations or along leeward slopes. Upstream air trajectories with a Great Lakes connection were also tied to higher values of moisture and humidity in the lower troposphere, as well as a deeper moist layer (about 200-hPa depth from the surface to the top of the moist layer with the Great Lakes connection versus 140-hPa depth for the non–Great Lakes connection). In some instances, the spatial patterns of snowfall were strongly influenced by the upstream air trajectories, such that maximum snowfall totals occurred in association with favorable air trajectories extending downwind from Lake Michigan. Observational evidence from satel-lite (Fig. 4) and radar imagery of banding at various scales during many NWFS events strongly supports an important connection to the Great Lakes as well. Note the wide band of stratocumulus clouds extending from Lake Michigan (near the upper left corner of the image)
southeastward to the Appalachian mountains along the Tennessee–North Carolina border (labeled “A”), along with some parallel but narrower bands of clouds just to the northeast of this wider band (labeled “B”), also with an apparent trajectory from the Great Lakes region. Stable wave clouds (small bands perpendicular to the above mentioned streaks, but parallel to the Appalachian ridges) can be seen over and just downstream from the mountains (labeled “C”), indicative of the stable air at the top of the moist layer.
Observations. Several recent col-laborative initiatives have greatly improved observational networks in this region, leading to real-time fore-casting benefits as well as improved understanding of the physical pro-cesses and spatial patterns of snow
Fig. 4. Advanced Very High resolution radiometer (AVHrr) false color image from NOAA-16 polar orbiter at 1826 UTC 6 Mar 2001 (courtesy of NESDIS). Features discussed in the text are annotated on the image.

985JUly 2009AMERICAN METEOROlOGICAl SOCIETy |
accumulation associated with NWFS. Expansion of the Community Collaborative Rain, Hail, and Snow (CoCoRaHS) Network (Cifelli et al. 2006) to the south-ern Appalachians has significantly improved the cov-erage and quality of snowfall, snow water equivalent (SWE), and snow density measurements across the re-gion. The 389 new CoCoRaHS observers (Fig. 5), when combined with observations from the 652 existing NWS cooperative observers and other reports from local communication centers, law enforcement, and the general public, have been very helpful in captur-
ing the mesoscale variability of NWFS as well as providing data for use in the validation of model predictions.
A vertically pointing METEK Micro Rain Radar (MRR) (Peters et al. 2002), PARSIVEL disdrometer (Löffler-Mang and Joss 2000; Löff ler-Mang and Blahak 2001; Yuter et al. 2006), Pluvio weighing precipitation gauge, and a research-quality meteorological station have been operational since October 2006 at Poga Mountain (1137 m) along the North Carolina–Tennessee border (Fig. 5). A portable sounding unit was deployed to the Poga Mountain site for the 2007/08 season to release rawinsondes during snow events. The sounding data were used to determine moist layer temperature and thickness and to document the presence and height of a capping inversion. An addi-tional PARSIVEL disdrometer, Pluvio weighing precipitation gauge, and other
meteorological sensors have also been installed on the summit of nearby Beech Mountain (1678 m) to analyze the differences in particle size and fall speed, snowfall, snow water equivalent, and new snowfall density based on elevation. In support of the 2007/08 snow season activities, the State Climate Office of North Carolina has also developed a near-real-time Web interface to bring together the aforementioned observational data-sets for the forecasting and academic communities, as well as the general public (available online at www.nc-climate.ncsu.edu/cronos/poga/map.php).
Fig. 5. regional topographic map with CoCoraHS and NWS coop-erative observer stations. The location of the Poga Mountain field site is also identified.
Fig. 6. Time–height plots of Mrr data from 20 UTC 6 Apr 2007 to 12 UTC 7 Apr 2007 from Poga Mountain: (a) reflectivity and (b) Doppler velocity. Positive velocities indicate downward motion.
986 JUly 2009|
The 2006/07 snow season was quite active at Poga Mountain, with 20 total snow events, 17 of which were identified as northwest flow snow. Most of the snow events were shallow, with 14 out of 17 northwest flow storms having 3-dBZ radar echo heights less than 2.5 km above ground level as observed in the MRR data. Ninety-one percent of the total SWE on Poga Mountain that season occurred in association with NWFS. When inversions were present, snow reflec-tivity layer depth was strongly correlated to inversion height (Perry et al. 2008). The shallow precipitation event on 7 April 2007 (Fig. 6) yielded 147 mm of snow-fall with 8.1 mm of snow water equivalent. Because fall speeds of snow are usually ~2 m s−1, Doppler velocities of less than 2 m s−1 indicate likely updrafts (Yuter and Houze 2003). Both the precipitation and
velocity fields indicate small-scale variability within the snow layer.
Mesoscale modeling. As earlier climatological studies (Perry 2006; Perry et al. 2007b) demonstrated that the Great Lakes can enhance resultant snowfall during NWFS events, some scientific questions arose that were best addressed using numerical model simula-tions of individual cases. For instance, what fraction of the NWFS precipitation is attributable to the Great Lakes? What physical processes control the varying contribution of the lakes to NWFS, and how does the synoptic-scale pattern relate to this variability? Also, how specifically do the lakes alter precipita-tion processes in the upslope flow region? To what extent does moistening versus destabilization of the upstream air mass by the lakes alter the intensity and distribution of NWFS? How is the pattern and strength of orographic lift affected by the upstream presence of the Great Lakes?
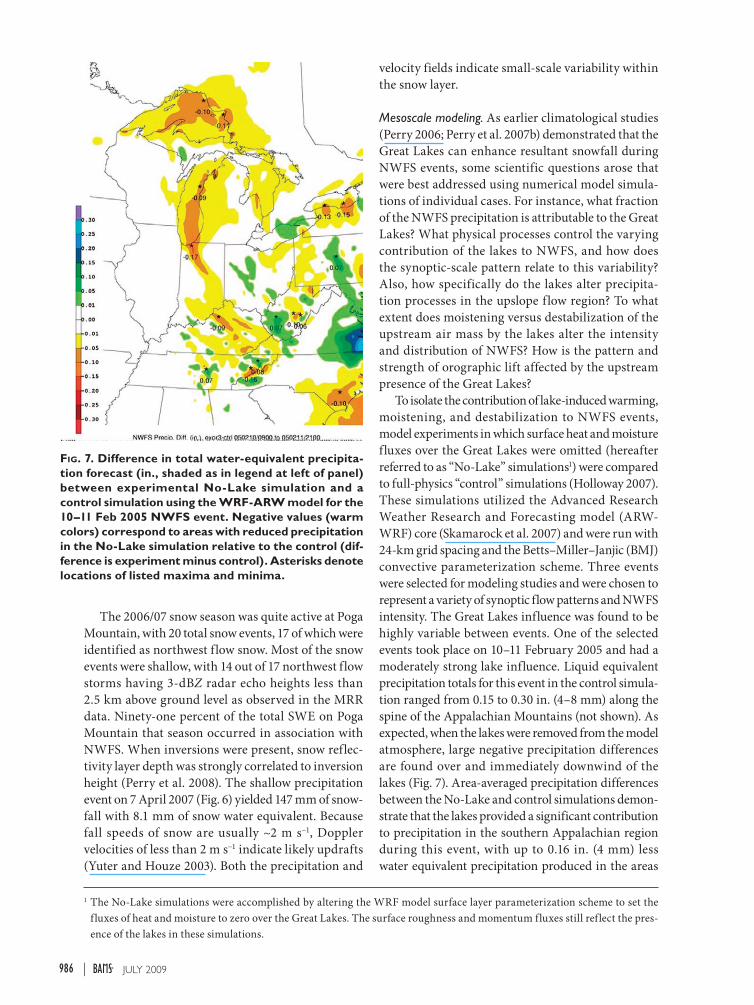
To isolate the contribution of lake-induced warming, moistening, and destabilization to NWFS events, model experiments in which surface heat and moisture fluxes over the Great Lakes were omitted (hereafter referred to as “No-Lake” simulations1) were compared to full-physics “control” simulations (Holloway 2007). These simulations utilized the Advanced Research Weather Research and Forecasting model (ARW-WRF) core (Skamarock et al. 2007) and were run with 24-km grid spacing and the Betts–Miller–Janjic (BMJ) convective parameterization scheme. Three events were selected for modeling studies and were chosen to represent a variety of synoptic flow patterns and NWFS intensity. The Great Lakes influence was found to be highly variable between events. One of the selected events took place on 10–11 February 2005 and had a moderately strong lake influence. Liquid equivalent precipitation totals for this event in the control simula-tion ranged from 0.15 to 0.30 in. (4–8 mm) along the spine of the Appalachian Mountains (not shown). As expected, when the lakes were removed from the model atmosphere, large negative precipitation differences are found over and immediately downwind of the lakes (Fig. 7). Area-averaged precipitation differences between the No-Lake and control simulations demon-strate that the lakes provided a significant contribution to precipitation in the southern Appalachian region during this event, with up to 0.16 in. (4 mm) less water equivalent precipitation produced in the areas
1 The No-Lake simulations were accomplished by altering the WRF model surface layer parameterization scheme to set the fluxes of heat and moisture to zero over the Great Lakes. The surface roughness and momentum fluxes still reflect the pres-ence of the lakes in these simulations.
Fig. 7. Difference in total water-equivalent precipita-tion forecast (in., shaded as in legend at left of panel) between experimental No-Lake simulation and a control simulation using the WrF-ArW model for the 10–11 Feb 2005 NWFS event. Negative values (warm colors) correspond to areas with reduced precipitation in the No-Lake simulation relative to the control (dif-ference is experiment minus control). Asterisks denote locations of listed maxima and minima.

987JUly 2009AMERICAN METEOROlOGICAl SOCIETy |
of heaviest NWFS in the No-Lake simulation relative to the control. The No-Lake simulation exhibited an area-averaged precipitation reduction of 40% at loca-tions in the southern Appalachians. In some locations, the No-Lake simulation actually produced more pre-cipitation than the control (Fig. 7); these localized areas were presumably due to shifts in patterns of ascent and compensating subsidence. In another event that took place on 18–20 December 2001, comparison of No-Lake and control simulations revealed little dif-ference in precipitation totals, due to more westerly upstream flow trajectories (not shown).
The model experiments reveal that the influence of the Great Lakes is not exclusively limited to its role as a moisture source. The Froude number, related to the ratio of cross-barrier inertia to the potential energy needed to surmount the barrier, is useful in diagnosis of the extent to which flow is blocked by a topographic feature. Large static stability leads to a smaller Froude number, greater blocking of the flow by the mountains, and weaker orographic ascent. In No-Lake simulations of NWFS events, the Froude number of the lower-tropospheric f low impinging on the southern Appalachians was decreased relative to that in the control simulations (not shown). This indicates that the lakes indirectly contribute to the ability of the air stream impinging on the Southern Appalachians to ascend the barrier, resulting in en-hanced orographic lift.
Higher-resolution experiments, capable of ex-plicitly resolving convective precipitation (e.g., 2-km grid spacing), are desirable to more closely examine changes to the character of the snowfall due to the upstream lake influence. Nevertheless, the coarser simulations described above provide a quantitative estimate of the enhancement that can result from a favorable Great Lakes trajectory and confirm the importance of this aspect during NWFS prediction. It should also be noted that the studies mentioned here are only a starting point to further understanding NWFS events in the southern Appalachians. It is anticipated that future modeling research will address additional questions related to the upstream lake influence on the character of the downstream response. More cases with varying backward trajecto-ries and lake influences need to be examined to better understand this regional forecasting problem.
Another avenue through which mesoscale models have been used by the group is through the dis-tribution of the workstation WRF Environmental Modeling System (WRF-EMS; Rozumalski 2006) into WFOs. Local WFOs are now using the workstation WRF-EMS to run domain-specific forecasts at finer
grid spacing than that of current operational models. The model can be tuned and configured as an office desires and the output data are often made available for public view through the internet. The purpose of these local models is to allow for better prediction of regional-scale meteorological phenomena such as NWFS events. Output from these high-resolution models over the last couple of seasons has confirmed the ability to capture the detailed influence from the terrain quite accurately but has also shown some potential skill in identifying mesoscale banded struc-tures associated with trajectories off the Great Lakes. An 18-h forecast of 1-h snowfall accumulation from a 5-km (grid spacing) WRF-EMS model running at the Charleston, West Virgina (RLX), WFO, for 27 February 2008 (Fig. 8), depicts the resulting NWFS bands along the mountains. The northeast–southwest-oriented line of higher snow accumulation, with a sharp gradient on the southeast edge, aligns precisely with the northwest upslope locations (Fig. 3), and an elongated northwest–southeast-oriented band appears to be extending from the vicinity of Lake Michigan.
The locally run mesoscale models are discussed through the group’s conference calls and listserve to coordinate changes in model configuration and to gather any feedback on the effectiveness of the output. Partially due to this coordination, a diversity of local WRF configurations exists across the participating WFOs and universities. This includes various domain sizes, horizontal grid spacing ranging from 4 to 12 km, two different dynamical core packages, explicit versus parameterized convection schemes, different precipi-
Fig. 8. One-hour snowfall accumulation forecast (scale in inches, as shaded in the legend at left of panel), valid at 1200 UTC 27 Feb 2008 from the 5-km operational WrF NMM at WFO Charleston, WV.
988 JUly 2009|
tation physics packages and boundary layer schemes, and various methods for model initialization and provision of boundary conditions. A few WFOs are running local versions of the workstation Eta Model as well. The variety of local model configurations affords the opportunity to subjectively determine (until such time as objective verification schemes may be imple-mented for these models) if any particular configura-tion may be more skilled than another at forecasting aspects of NWFS events. The configurations at each office are not necessarily chosen solely for the purpose of tackling this specific forecast challenge; however, it is hoped that with enough experience and analysis of the output, including case study reviews, we will begin to learn if particular settings or schemes are best suited for these kinds of events. Objective verification
and additional model experiments will help answer these questions as well.
There is momentum within this NWFS group, and the NWS in general, to more carefully coordinate local model configurations with the goal of creating a high-resolution pseudoensemble cluster of models within a small region sharing similar forecast challenges. The path this group has already taken toward local model coordination could be important groundwork for a more formal, organized regional ensemble across the southern Appalachians in the near future.
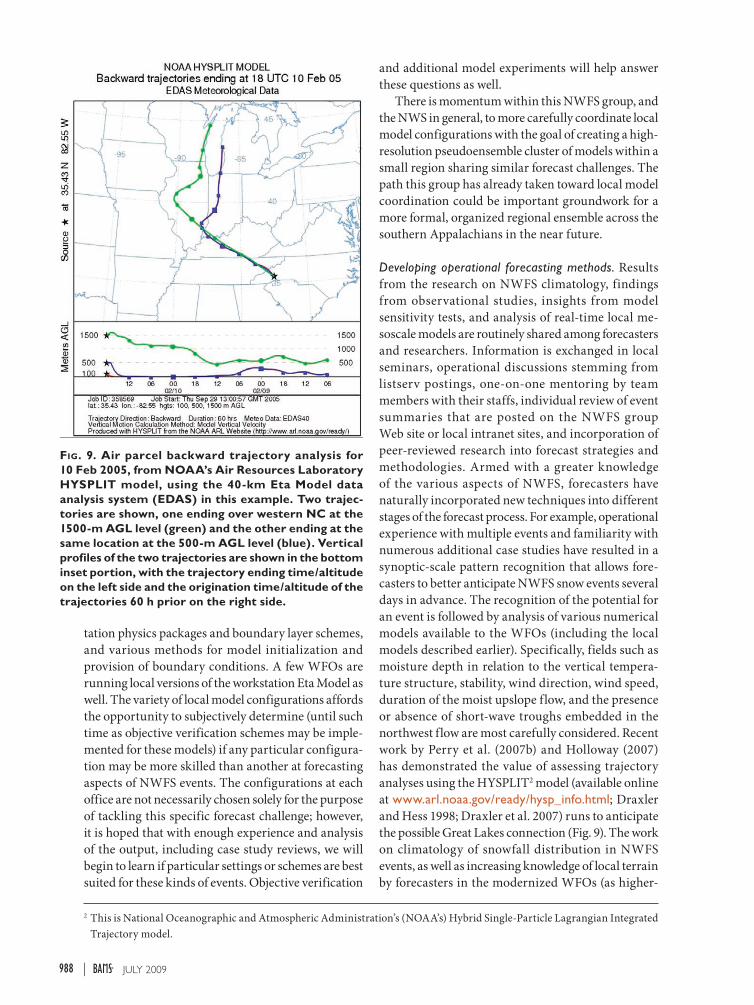
Developing operational forecasting methods. Results from the research on NWFS climatology, findings from observational studies, insights from model sensitivity tests, and analysis of real-time local me-soscale models are routinely shared among forecasters and researchers. Information is exchanged in local seminars, operational discussions stemming from listserv postings, one-on-one mentoring by team members with their staffs, individual review of event summaries that are posted on the NWFS group Web site or local intranet sites, and incorporation of peer-reviewed research into forecast strategies and methodologies. Armed with a greater knowledge of the various aspects of NWFS, forecasters have naturally incorporated new techniques into different stages of the forecast process. For example, operational experience with multiple events and familiarity with numerous additional case studies have resulted in a synoptic-scale pattern recognition that allows fore-casters to better anticipate NWFS snow events several days in advance. The recognition of the potential for an event is followed by analysis of various numerical models available to the WFOs (including the local models described earlier). Specifically, fields such as moisture depth in relation to the vertical tempera-ture structure, stability, wind direction, wind speed, duration of the moist upslope flow, and the presence or absence of short-wave troughs embedded in the northwest flow are most carefully considered. Recent work by Perry et al. (2007b) and Holloway (2007) has demonstrated the value of assessing trajectory analyses using the HYSPLIT2 model (available online at www.arl.noaa.gov/ready/hysp_info.html; Draxler and Hess 1998; Draxler et al. 2007) runs to anticipate the possible Great Lakes connection (Fig. 9). The work on climatology of snowfall distribution in NWFS events, as well as increasing knowledge of local terrain by forecasters in the modernized WFOs (as higher-
Fig. 9. Air parcel backward trajectory analysis for 10 Feb 2005, from NOAA’s Air resources Laboratory HYSPLIT model, using the 40-km Eta Model data analysis system (EDAS) in this example. Two trajec-tories are shown, one ending over western NC at the 1500-m AGL level (green) and the other ending at the same location at the 500-m AGL level (blue). Vertical profiles of the two trajectories are shown in the bottom inset portion, with the trajectory ending time/altitude on the left side and the origination time/altitude of the trajectories 60 h prior on the right side.
2 This is National Oceanographic and Atmospheric Administration’s (NOAA’s) Hybrid Single-Particle Lagrangian Integrated Trajectory model.
989JUly 2009AMERICAN METEOROlOGICAl SOCIETy |
resolution maps and map backgrounds become available in operational software), has provided fore-casters with a basis for adjusting model Quantitative Precipitation Forecast (QPF) output. As increasing knowledge about local terrain, NWFS climatol-ogy, and model performance are continually shared through this collaboration, local WFOs have felt more confident in creating predefined high-resolution geographic zones used for precise editing of gridded snowfall forecasts during these scenarios.
During the near-term or “nowcasting” phase of an event, multiple observational datasets are used to support short-term forecast updates. WSR-88D ref lectivity data provide real-time displays of the areal distribution and intensity of the snowfall across the mountains and upstream of western slopes. The patterns of radar reflectivity, in combination with an assessment of the stability characteristics, provide forecasters with a basis for anticipating convective enhancement of precipitation. Recently, forecasters have had access to the Poga Mountain vertically pointing MRR data to assist in evaluating the type and intensity of precipitation associated with pre-cipitation elements viewed on radar. In addition, a satellite enhancement curve that highlights cloud-top temperatures in the range favorable for dendritic ice crystal growth is used alongside the radar data to help ascertain where snow may be occurring.
Based on the gradual accumulation of experience and new information revealed in formal studies, forecasters in the cluster of NWS offices are begin-ning to develop specific methodologies for NWFS events to help with forecast decision strategies. These strategies are being designed to help determine which datasets to analyze at various phases of the forecast process and to identify opportunities for modifying the forecast based on the outcome of the analyses. For example, depending on the source region of low-level air from trajectory analysis, as well as the depth of the moist layer and the temperatures within it, forecasters may adjust upward the snow-to-liquid ratios used to produce final snow amounts from liquid equivalent precipitation forecasts, and they may only choose to do this in detailed predefined zones where the known climatology favors the highest amounts. As the strengths and weaknesses of mesoscale model output are better understood, strategies for using these fore-casts as a starting point and adjusting appropriately are also being developed. Then, as events begin to unfold and observational datasets add insight into the depth of moisture or the characteristics of convec-tive elements, the methodologies lead the forecasters to refine the snow-to-liquid ratios appropriately or
spread small accumulations into downslope areas if convective rolls are developing. The incorporation of this collective knowledge and available datasets are shared with all WFOs in the region, as well as with other partners in the weather enterprise through Area Forecast Discussions and local training workshops. Eventually we expect that some specific method-ologies, once further refined, will be made available through the NWFS Web site listed earlier. The pur-pose of developing such methodologies is to ensure that all forecasters within a particular office and across all impacted offices are considering the appro-priate data and reaching similar conclusions. A con-sistent analysis and decision-making strategy among members of the cluster enhances the likelihood of a collaborated forecast across County Warning and Forecast Area boundaries. Standard methodologies at neighboring offices also provide a common starting point for training new staff members not yet exposed to this forecast challenge.
The findings from the collaborated research have been incorporated into the WFO training programs through office presentations, the Weather Event Simu-lator (WES), and office weather briefings. The WES (Magsig et al. 2006) is a great training tool to pass the increased understanding of NWFS to the operational forecasters. Science and Operations Officers can have the forecasters work through a NWFS event and utilize new forecasting methodologies to determine potential snow accumulations across the forecast area.
CONCLUSIONS. While it is difficult to quantify the benefits of collaborative research to the accuracy of operational forecasts, Waldstreicher (2005) builds a compelling argument for improved warning perfor-mance in Eastern Region National Weather Service offices for several different high-impact weather phenomena. Furthermore, the advantages of such col-laborative arrangements are not limited to forecasting improvements alone. A broad spectrum of benefits to the National Weather Service forecasting community in the southern Appalachians has stemmed from this Northwest Flow Snow collaborative group. These include the following:
• directinvolvementinappliedresearchwiththeacademic community,
• theopportunityfornear-real-timefeedbackanddis-cussion of impending, ongoing, and recent events,
• accesstoexperimentaldatasetsinnear–realtime,• sharingideasforimprovedforecastmethods,• theshareduseoflocalmesoscalemodelsamong
offices, and
990 JUly 2009|
• ultimatelydevelopingimprovedcommonfore-cast methodologies that are accepted and used throughout the region.
From the university standpoint, the collaborative arrangement that has developed for the NWFS problem provides several benefits, including the following:
• operationalforecastersareabletohelpsteerre-search directions in a way that maximizes societal benefit,
• theclosescrutinyofweathereventsbyforecastersin real time provides an operational framework for theoretical aspects of the research, and
• thecollaborationprovidesgraduateandunder-graduate students with an opportunity to gain experience and make contacts in the professional forecasting ranks (which in turn makes it easier to attract top students to the participating university programs).
Furthermore, the benefits of such collabora-tion go well beyond the potential improvements to specific forecasts in northwest f low snow regimes (which have already begun to take place, as described in this paper). Relationships among operational and academic meteorologists and climatologists have been established that will likely pave the way for future collaborations. The personal connections and communication infrastructure developed here can also be applied to a variety of other potential forecast problems of mutual interest. Specifically, we hope to be able to place more focus in the fol-lowing areas in the near future: 1) the spatial and temporal nature of instability snow bands and their relation to traditional lake-effect snow, as well as specific terrain influences; 2) further understand-ing of large-scale and microscale impacts on ice crystal growth habits as well as snow-to-liquid ratios in NWFS events, and perhaps other types of snow events as well; and 3) further analysis and verifica-tion of mesoscale numerical model strengths and limitations, including an ensemble approach, in regard to the NWFS problem as well as with other mesoscale precipitation challenges in both cold and warm seasons.
The diversity of expertise among participants from several related disciplines and the specific personalities, leadership, and manageable group size, along with our frequent and varied methods of communication, have all helped to maintain interest and energy on this particular forecast problem, even
in between formal funding windows. In fact, these efforts have helped to provide opportunities for new formal research and may provide a framework for establishing new field research efforts in this region. It is hoped that sharing the successes of this particu-lar group will inspire similar collaborative groups to form and work together on unique forecast and research problems in other regions.
ACKNOWLEDGMENTS. The authors wish to thank David Radell of the National Weather Service Eastern Region Headquarters, Scientific Services Division, in Bohemia, New York, for his review and valuable sugges-tions for improvement to the original manuscript, as well as three anonymous reviewers for their very helpful sug-gestions and important corrections.
Some of the research results presented here were based on work supported by the National Science Foundation under Grants ATM-0544766 (Yuter) and ATM-0342691 (Lackmann). Any opinions, findings, conclusions, or recommendations expressed in this material are those of the author(s) and do not necessarily ref lect the views of the National Science Foundation. Additionally, aspects of this research were supported by the National Oceanic and Atmospheric Administration under CSTAR Grants NA-07WA0206, NA03NWS4680007, and NA07NWS4680002. Finally, additional material is based on work supported by a grant from the University of North Carolina General Administration Research Competitiveness Fund (Perry, Miller, and Yuter).
The authors gratefully acknowledge the NOAA Air Resources Laboratory (ARL) for the provision of the HYSPLIT transport and dispersion model and/or READY website (www.arl.noaa.gov/ready.html) used in this publication.
(Disclaimer: Mention of a commercial company or product does not constitute an endorsement by the Na-tional Weather Service. Use of information from this publication concerning proprietary products or tests of such products for publicity or advertising purposes is not authorized.)
RefeRencesCifelli, R., N. Doesken, P. Kennedy, L. D. Carey, S. A.
Rutledge, C. Gimmestad, and T. Depue, 2005: The Community Collaborative Rain, Hail, and Snow Net-work: Informal education for scientists and citizens. Bull. Amer. Meteor. Soc., 86, 1069–1077.
Draxler, R. R., and G. D. Hess, 1998: An overview of the HYSPLIT_4 modeling system for trajectories, dispersion, and deposition. Aust. Meteor. Mag., 47, 295–308.

991JUly 2009AMERICAN METEOROlOGICAl SOCIETy |
—, B. Stunder, G. D. Rolph, and A. Taylor, cited 2007: HYSPLIT4 user’s guide. [Available online at www.arl.noaa.gov/documents/reports/hysplit_user_guide.pdf.]
Holloway, B. S., 2007: The role of the Great Lakes in northwest f low snowfall events in the southern Appalachian Mountains. M.S. thesis, Dept. of Marine, Earth, and Atmospheric Sciences, North Carolina State University, 204 pp. [Available online at www.lib.ncsu.edu/theses/available/etd-110022007-181739/.]
Johnson, V. C., and L. E. Spayd, 1996: The COMET Outreach Program: Cooperative research to improve operational forecasts. Bull. Amer. Meteor. Soc., 77, 2317–2332.
Keeter, K. K., S. Businger, L . G. Lee, and J. S. Waldstreicher, 1995: Winter weather forecasting throughout the eastern United States. Part III: The effects of topography and the variability of winter weather in the Carolinas and Virginia. Wea. Fore-casting, 10, 42–60.
Löffler-Mang, M., and J. Joss, 2000: An optical disdrom-eter for measuring size and velocity of hydrometeors. J. Atmos. Oceanic Technol., 17, 130–139.
—, and U. Blahak, 2001: Estimation of the equivalent radar reflectivity factor from measured snow size spectra. J. Appl. Meteor., 40, 843–849.
Magsig, M. A., T. Decker, and N. M. Said, 2006: Builds 5 and 6 of NOAA’s NWS Weather Event Simulator. Preprints, 22nd Int. Conf. on Interactive Information Processing Systems for Meteorology, Oceanography, and Hydrology, Atlanta, GA, Amer. Meteor. Soc., P7.7. [Available online at http://ams.confex.com/ams/pdfpapers/104624.pdf.]
Millsaps, S. A., and P. A. Groothuis, 2003: The eco-nomic impact of the North Carolina ski areas on the economy of North Carolina, 2002–2003 season. Final report prepared for the North Carolina Ski Areas Association by Appalachian State University, 17 pp.
Perry, L. B., 2006: Synoptic climatology of northwest flow snowfall in the southern Appalachians. Ph.D. dissertation, University of North Carolina at Chapel Hill, 176 pp.
—, and C. E. Konrad, 2006: Relationships between NW flow snowfall and topography in the southern Appalachians, USA. Climate Res., 32, 35–47.
—, —, D. Hotz, and L. G. Lee, 2007a: Synoptic classification of snowfall events in the Great Smoky Mountains, USA. Proc. 64th Eastern Snow Conf., St. John’s, NL, Canada, Eastern Snow Conference, 207–215.
—, —, and T. W. Schmidlin, 2007b: Antecedent upstream air trajectories associated with northwest
f low snowfall in the southern Appalachians. Wea. Forecasting, 22, 334–352.
—, D. K. Miller, S. E. Yuter, L. G. Lee, and S. Keighton, 2008: Atmospheric influences on new snow density in the southern Appalachian Mountains, USA. Proc. 65th Eastern Snow Conf., Fairlee, VT, Eastern Snow Conference, in press.
Peters, G., B. Fischer, and T. Andersson, 2002: Rain observations with a vertically looking Micro Rain Radar (MRR). Boreal Environ. Res., 7, 353–362.
Rozumalski, R. A., cited 2006: National Weather Service SOO Science and Training Resource Center–WRF Environmental Modeling System user’s guide. 89 pp. [Available online at http://strc.comet.ucar.edu/wrf/wrf_userguide.htm.]
Schmidlin, T. W., 1992: Does lake-effect snow extend to the mountains of West Virginia? Proc. 49th Eastern Snow Conf., Oswego, NY, Eastern Snow Conference, 145–148.
Skamarock, W. C., J. B. Klemp, J. Dudhia, D. O. Gill, D. M. Barker, W. Wang, and J. G. Powers, 2007: A description of the advanced research WRF version 2. NCAR Tech. Note NCAR/TN-468+STR, 88 pp. [Available online at www.mmm.ucar.edu/wrf/users/docs/arw_v2.pdf.]
Sousounis, P. J., and M. J. Fritsch, 1994: Lake-aggregate mesoscale disturbances. Part II: A case study of the effects on regional and synoptic-scale weather sys-tems. Bull. Amer. Meteor. Soc., 75, 1793–1811.
St. Jean, D., P. A. Sisson, L. F. Bosart, D. Keyser, and B. Smith, 2004: Characteristics of upslope snowfall events in northern New York state and northern Vermont: Diagnostics and model simulations of several northwest-flow cases. Preprints, 20th Conf. on Weather Analysis and Forecasting. Seattle, WA, Amer. Meteor. Soc., 18.4. [Available online at http://ams.confex.com/ams/pdfpapers/71093.pdf.]
Stuart, N. A., 1996: Training symposium for operational forecasters in the Carolinas and Virginia. Bull. Amer. Meteor. Soc., 77, 2937–2945.
Waldstreicher, J. S., 2005: Assessing the impact of col-laborative research projects on NWS warning perfor-mance. Bull. Amer. Meteor. Soc., 86, 193–203.
Yuter, S. E., and R. A. Houze Jr., 2003: Microphysi-cal modes of precipitation growth determined by vertically pointing radar in orographic precipita-tion during MAP. Quart. J. Roy. Meteor. Soc., 129, 455–476.
—, D. Kingsmill, L. B. Nance, and M. Löffler-Mang, 2006: Observations of precipitation size and fall speed characteristics within coexisting rain and wet snow. J. Appl. Meteor. Climatol., 45, 1450–1464.