Prediction of tracheid length and diameter in white spruce (Picea glauca)
22
© International Association of Wood Anatomists, 2015 DOI 10.1163/22941932-00000095 Published by Koninklijke Brill NV, Leiden IAWA Journal 36 (2), 2015: 186–207 PREDICTION OF TRACHEID LENGTH AND DIAMETER IN WHITE SPRUCE (PICEA GLAUCA) Cyriac S. Mvolo 1 , Ahmed Koubaa 1,* , Maurice Defo 2 , Jean Beaulieu 3 , Martin-Claude Yemele 4 , and Alain Cloutier 2 1 Chaire de Recherche du Canada en Valorisation, Caractérisation et transformation du bois, Université du Québec en Abitibi-Témiscamingue, 445 boul. de l’Université, Rouyn-Noranda, Québec, Canada J9X 5E4 2 Département des sciences du bois et de la forêt, Faculté de foresterie, de géographie et de géomatique, Pavillon Gene-H. –Kruger, bureau 1376C, Université Laval, 2425 rue de la terrasse, Québec, Québec, Canada G1V 0A6 3 Natural Resources Canada, Canadian Forest Service, Canadian Wood Fibre Centre, 1055 du PEPS, P.O. Box 10380, Stn Sainte Foy, Québec, Canada G1V 4C7 4 Ministère des Forêts, de la Faune et des Parcs du Québec, Direction de la modernisation de l’industrie des produits forestiers, 5700, 4e Avenue Ouest, bureau A-202, Québec (Québec), G1H 6R1 * Corresponding author; e-mail: [email protected] ABSTRACT The establishment of patterns of radial and longitudinal variations and the de- velopment of models to predict the wood anatomical properties, especially from juvenile wood, are of interest for both wood industry and researchers. Linear regressions were used to predict whole-tree, breast height and mature tracheid length and diameter in white spruce (Picea glauca (Moench) Voss) and the WBE model was used to predict the variation of tracheid diameter. Tracheid length and diameter increased from pith to bark. Tracheid length decreased, while tracheid diameter increased from apex to lower heights. Cambial age was the most important predictor of tracheid length. The final tracheid length models with either a log transformation or a third-order polynomial of cambial age explained 82 % of the variation in the whole-tree tracheid length. At breast height, 83 % of the variation in the whole tracheid length was explained using the juvenile value at a cambial age of 3 years. Up to 87 % of the variation was explained by the model, including the average value of juvenile wood. However, mature wood tracheid length at breast height could not be predicted from juvenile wood. Distance from the apex predicted the tracheid widening in outer rings but failed to predict tracheid expansion of samples collected at fixed cambial ages. The WBE explained 86 % of conduit widening in the outer rings. The sampling strategy, i. e. collecting samples longitudinally at a fixed cambial age vs. at a fixed calendar year is important in predicting tracheid diameter. Keywords: Linear regression, WBE model, juvenile wood, mature wood, wood quality, cambial age, distance from apex, allometry.
Transcript of Prediction of tracheid length and diameter in white spruce (Picea glauca)
186 IAWA Journal 36 (2), 2015
© International Association of Wood Anatomists, 2015 DOI 10.1163/22941932-00000095 Published by Koninklijke Brill NV, Leiden
IAWA Journal 36 (2), 2015: 186–207
Prediction of tracheid length and diameter in white sPruce (Picea glauca)
cyriac s. mvolo1, ahmed Koubaa1,*, maurice defo2, Jean Beaulieu3, martin-claude Yemele4, and alain cloutier2
1Chaire de Recherche du Canada en Valorisation, Caractérisation et transformation du bois, Université du Québec en Abitibi-Témiscamingue, 445 boul. de l’Université, Rouyn-Noranda,
Québec, Canada J9X 5E42Département des sciences du bois et de la forêt, Faculté de foresterie, de géographie et
de géomatique, Pavillon Gene-H. –Kruger, bureau 1376C, Université Laval, 2425 rue de la terrasse, Québec, Québec, Canada G1V 0A6
3Natural Resources Canada, Canadian Forest Service, Canadian Wood Fibre Centre, 1055 du PEPS, P.O. Box 10380, Stn Sainte Foy, Québec, Canada G1V 4C7
4Ministère des Forêts, de la Faune et des Parcs du Québec, Direction de la modernisation de l’industrie des produits forestiers, 5700, 4e Avenue Ouest, bureau A-202,
Québec (Québec), G1H 6R1*Corresponding author; e-mail: [email protected]
ABSTRACT
The establishment of patterns of radial and longitudinal variations and the de-velopment of models to predict the wood anatomical properties, especially from juvenile wood, are of interest for both wood industry and researchers. Linear regressions were used to predict whole-tree, breast height and mature tracheid length and diameter in white spruce (Picea glauca (Moench) Voss) and the WBE model was used to predict the variation of tracheid diameter. Tracheid length and diameter increased from pith to bark. Tracheid length decreased, while tracheid diameter increased from apex to lower heights. Cambial age was the most important predictor of tracheid length. The final tracheid length models with either a log transformation or a third-order polynomial of cambial age explained 82% of the variation in the whole-tree tracheid length. At breast height, 83% of the variation in the whole tracheid length was explained using the juvenile value at a cambial age of 3 years. Up to 87% of the variation was explained by the model, including the average value of juvenile wood. However, mature wood tracheid length at breast height could not be predicted from juvenile wood. Distance from the apex predicted the tracheid widening in outer rings but failed to predict tracheid expansion of samples collected at fixed cambial ages. The WBE explained 86% of conduit widening in the outer rings. The sampling strategy, i.e. collecting samples longitudinally at a fixed cambial age vs. at a fixed calendar year is important in predicting tracheid diameter.
Keywords: Linear regression, WBE model, juvenile wood, mature wood, wood quality, cambial age, distance from apex, allometry.
187Mvolo et al. – Prediction of tracheid size
INTRODUCTION
Tracheid length (TL) and tracheid diameter or width (TD; all the acronyms used throughout the text are listed in Table 1) are among the most important wood quality attributes for pulp (Beaulieu 2003) and solid wood (Bendtsen & Senft 1986). Tracheid length and diameter vary with and within species (Bannan 1965). Tracheids represent 92.5% of wood volume in white spruce (Law & Lapointe 1983). Thinning (Herman et al. 1998b) and spacing (Lasserre et al. 2009) are known to favor an increase of ring width. When stands are heavily thinned, a negative influence can be registered on TL, although it is generally not meaningful in practice, and last for only a few years (Erick-son & Harrison 1974). TD was found not to vary with growth rate in juvenile radiata pine (Pinus radiata D.Don) grown in New Zealand (Lasserre et al. 2009). Lindström (1997) reported an increase in TD with ring width in mature Norway spruce (Picea abies (L.) Karst.) grown in Sweden. Three general variation patterns can be observed in wood anatomical properties: the intra-ring variation, the inter-ring radial and the inter-ring longitudinal variations. The intra-ring variation allows distinguishing between earlywood tracheid length (ETL) and latewood tracheid length (LTL). Similarly, one can segregate between earlywood tracheid diameter (ETD) and latewood tracheid diameter (LTD). Together with aver-age tracheid length (TL) and average tracheid diameter (TD), earlywood TL, latewood TL, earlywood TD, and latewood TD are considered as “tracheid components” in this study. Variation existing between earlywood and latewood wood quality attributes is sometimes so important that it led Larson et al. (2001) to recommend to consider them as making up different data populations. However, an accurate description of juvenile and mature radial and longitudinal variations of earlywood TD and latewood TD has not yet been done for white spruce. In the radial direction, TL and TD follow the first Sanio’s law of increasing from pith to bark (Sanio 1872). In the longitudinal direc-tion, the second Sanio’s law of increasing from stump to upper heights is observed for TL (Sanio 1872; Atmer & Thôrnqvist 1984). There are conflicting descriptions of TD variation in the longitudinal direction for gymnosperms. TD of both Scots pine (Pinus silvestris L.) and Norway spruce (Atmer & Thôrnqvist 1984) increase from stump to middle heights of the stem, before decreasing at upper height. However, an increasing
Table 1. Description of the acronyms used in the text.
Acronym Description Acronym Description
BA Basal area LTD Latewood tracheid diameter BH Breast height LTL Latewood tracheid length CA Cambial age RA Ring area CY Calendar year RDA Relative distance from apex DBH Diameter at breast height SH Sampling height DFA Distance from apex TD Average ring tracheid diameter ETD Earlywood tracheid diameter TL Average ring tracheid length ETL Earlywood tracheid length WBE West, Brown & Enquist (1999)
188 IAWA Journal 36 (2), 2015
pattern from apex to stump has been generalized from leaves to roots, and is believed to be an adaptive strategy, that ensures a comparable supply of sap to all leaves, regardless of their position (height) in tree (Enquist 2003), habits or habitats (Olson et al. 2014). The radial pattern of TL and TD can be fitted with polynomial (Duffield 1964) or logarithmic (Erickson & Harrison 1974; Lindström 1997; Adamopoulos et al. 2010) age transformation models. The former allow delineating a clear distinction between the juvenile wood and the mature wood through transition age determination (Koubaa et al. 2005). Juvenile wood is found near the pith and shifts to mature wood toward the bark of older trees. Transition age estimated using TL models were found to oc-cur between 12 and 19 years (Yang 1994; Fujiwara & Yang 2000) in white spruce. A minimum average TL of 2 mm is required for a good paper tear strength (Zobel & Van Buijtenen 1989). Therefore, there is a consistent need of measuring anatomical properties but the process is time-consuming and expensive (Fries et al. 2003). Thus, developing models to predict TL and TD seems to be a good cost-efficient alternative. Since growing cycles are long in boreal forest, predicting anatomical properties from those assessed at early age (cambial age (CA)) or from juvenile wood will represent a great improvement in this field. Owing to the impact of silvicultural practices on wood anatomical properties, the interaction between both must also be considered. Multiple regressions were efficiently used to estimate fiber length of black locust (Robinia pseudoacacia L.) (r2 = 0.86) and chestnut (Castania sativa Mill.) (r2 = 0.63) (Adamopoulos et al. 2010) and TL (r2 = 0.83) of Douglas-fir (Erickson & Harrison 1974), from the logarithm of CA and ring width, respectively. In two different studies on Norway spruce, TL (r2 = 0.87) was estimated in the first one (Lindström 1997), and predicted (r2 = 0.83) in the second one (Mäkinen et al. 2007) using logarithmic transformation of CA and variables accounting for growth rate and site quality. Mul-tiple regression of the second-order polynomial of CA in Douglas-fir (Duffield 1964), together with the inclusion of second-order polynomial of sampling height (SH) and their interaction in Khasi pine (Pinus kesiya Royle ex Gord.) (Burley 1969), also proved efficiency in estimating TL (r2 = 0.82). In the same way, fiber length of three poplar clones (Populus euramericana cv. I-72/58, Populus deltoides cv. I-63/51, and Populus deltoides cv. I-69/55) was estimated (r2=0.98) using a second-order polynomial of CA and variables accounting for ring width (Liu & Bao 2001). Juvenile TL was moderately (r2 = 0.58) estimable from stem slenderness and juvenile TD using multiple regressions in radiata pine (Lasserre et al. 2009). Age (or its log and polynomial transformations) is considered as a main factor when estimating TL (Duffield 1964; Liu & Bao 2001; Adamopoulos et al. 2010). Only few studies have been carried out on the estimation of white spruce TL (Taylor et al. 1982; Wang & Micko 1984; Beaulieu 2003; Duchesne & Zhang 2004). However, no study focused on the prediction of TL from juvenile values in white spruce. Multiple regressions were also used to estimate TD (r2 = 0.50–0.78) of Douglas-fir (Erickson & Harrison 1974), from the logarithm of CA and ring width, respectively. In two different studies on Norway spruce, TD (r2 = 0.19–0.76) were estimated in the first one (Lindström 1997), and predicted (r2 = 0.65) in the second one (Mäkinen et al.
189Mvolo et al. – Prediction of tracheid size
2007) using logarithmic transformation of CA and variables accounting for growth rate and site quality. However, the prediction of TD based on tree age is criticized (Anfodillo et al. 2013). Indeed, the compromise between height growth and an efficient conduit network seems to be more determining for tracheid expansion (Anfodillo et al. 2006; Anfodillo et al. 2013; Olson et al. 2014). West et al. (1999) have proposed a model that considers the diameter of any conduit (tracheid, vessel) of woody plant as an allometric function of tree height. They considered the tracheid network as a fractal-like system and demonstrated that scaling conduit diameter as a power function of tree height (from apex), with an exponent higher than 0.167 (1/6), allows overcoming hydraulic resistance (friction), that increases with conduit length. The West, Brown and Enquist 1999 (WBE) approach is often the cornerstone when scaling conduit diameter (Anfodillo et al. 2006; Anfodillo et al. 2013). However, similar approaches have been proposed (Mencuccini et al. 2007; Savage et al. 2010). The WBE is thought as a “general” solution that can be used to model conduit widening of any tree section (or height), from leaves to fine roots (West et al. 1999). It is believed to be a consequence of natural selection (Enquist 2003) and belongs to a family of functional-based models of TD, that has been called “hydraulic optimality (HO) models” (Olson et al. 2014). White spruce is widely distributed across Canada, and is very important for the Canadian pulp and solid wood industries (Isenberg et al. 1980). Predicting TL and TD of white spruce presents a practical interest. Indeed, with the need to more efficiently use of the resources (Gaudreault et al. 2009), this can be a relevant step in segregating each tree part and allocating it for the best end-uses. The objectives of this study were: 1) To establish the intra-tree patterns of radial and longitudinal variation of TL and TD of white spruce, 2) to develop prediction models for white spruce TL and TD, and 3) to test the applicability of the WBE approach for white spruce TD.
MATERIAL AND METHODS
Stand description Two sets of material were used in this study. The first material, used to develop the prediction models, came from 32 trees in a plantation established in 1936 in the Peta-wawa Research Forest, Ontario, Canada (lat. 45.59° N, long. 77.25° W, elev. 168 m). Initial stocking was 3068 trees/ha (1.8 × 1.8 m spacing). Since its inception, the planta-tion had three thinning treatments and a control plot was maintained. Heavy, medium, and light thinning intensities were applied for target basal area (BA) of 18, 25, and 32 m2/ha, respectively, and were performed in 1962, 1972, and 1982. In 1982, basal area in the control plot was 44 m2/ha. Eight apparently healthy trees (two dominants, four co-dominants, and two suppressed) were randomly selected per treatment. Material for models validation came from 12 trees in a plantation established in 1967 at the same location. The plantation had three initial spacing intensities: 1.8 × 1.8 m, 4.3 × 4.3 m, and 6.1 × 6.1 m. Basal area (and initial stocking) in the three spacings were 44.5 m2/ha (3086 trees/ha), 26.4 m2/ha (541 trees/ha), and 18.5 m2/ha (269 trees/ha), respective-ly. Four apparently healthy dominant trees were randomly sampled in each of the three
190 IAWA Journal 36 (2), 2015
spacings. All trees were felled and pruned once on the ground in July 2008.Sample collection, preparation, and wood quality attribute assessments Two 1.86 mm (tangential) adjacent strips centered on the pith were sawn from each disc. Compression wood and knots were avoided. One strip was used for the assess-ment of annual ring width, earlywood width (EW), and latewood width (LW) by X-ray densitometer (Quintek Measurements Systems QMS model QTRS-01X, Knoxville, TN, USA). We used a 25 µm linear resolution step size. The boundary between earlywood and latewood was delineated using the maximum derivative method (Koubaa et al. 2002). To study and model the radial variation of tracheid length and diameter, the second wood strips sampled from breast height (BH) were collected from all sampled trees, and wood sticks from earlywood and latewood were taken at rings 3, 6, 9, 12, 15, 20, 25, 30, 35, 40, and 45 from the pith. To study the longitudinal variation, a first sampling (fixed CA sampling) was conducted (Fig. 1). Discs were sampled in eleven trees (five from the thinning trial and six from the initial spacing trial) (Table 2), at 0.3 m, 4.3 m, 7.3 m, 10.3 m, 13.3 m, up to tree total height. Since trees of the validation set were smaller (Table 2), sticks at BH were taken until the 30th CA, and all sticks at upper heights were in the juvenile wood zone (≤15 CA) (Fig. 1). In the second longitudinal sampling (fixed calendar year (CY) sampling) (Fig. 1), earlywood and latewood sticks of the last CY of full ring (2007) were collected in four trees (Table 2), at the same tree height as the first longitudinal sampling. Two of these trees were among the biggest trees (from the thinning) and the other two were among the smallest trees (from the spacing) (Table 2). Samples were taken as near as possible to the tree apex in this fixed
Mature woodJuvenile wood
Transition wood
First longitudinal sampling
Second longitudinal sampling
Tree height (m)
Cambial age (years)70 15 9 0 3 9 15 30 70
22.3
16.3
10.3
4.3
1.30.3
3 m
3 m
1 m
22 m
Figure 1. Representations of the location of juvenile wood, transition wood, and mature wood, as well as the two longitudinal sampling strategies in a mature tree.
191Mvolo et al. – Prediction of tracheid size
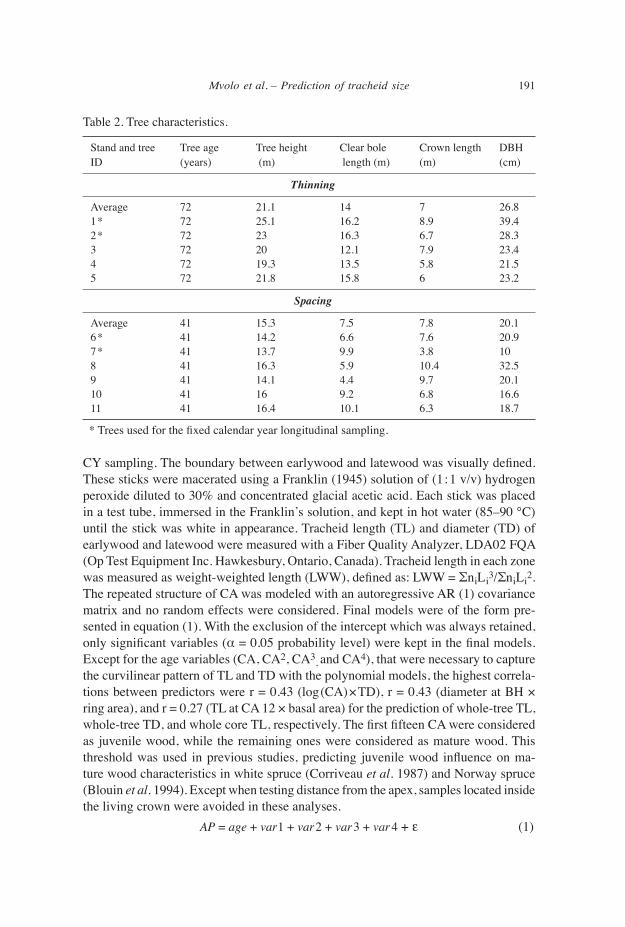
CY sampling. The boundary between earlywood and latewood was visually defined. These sticks were macerated using a Franklin (1945) solution of (1:1 v/v) hydrogen peroxide diluted to 30% and concentrated glacial acetic acid. Each stick was placed in a test tube, immersed in the Franklin’s solution, and kept in hot water (85–90 °C) until the stick was white in appearance. Tracheid length (TL) and diameter (TD) of earlywood and latewood were measured with a Fiber Quality Analyzer, LDA02 FQA (Op Test Equipment Inc. Hawkesbury, Ontario, Canada). Tracheid length in each zone was measured as weight-weighted length (LWW), defined as: LWW = ΣniLi3/ΣniLi2. The repeated structure of CA was modeled with an autoregressive AR (1) covariance matrix and no random effects were considered. Final models were of the form pre-sented in equation (1). With the exclusion of the intercept which was always retained, only significant variables (α = 0.05 probability level) were kept in the final models. Except for the age variables (CA, CA2, CA3, and CA4), that were necessary to capture the curvilinear pattern of TL and TD with the polynomial models, the highest correla- tions between predictors were r = 0.43 (log(CA)×TD), r = 0.43 (diameter at BH × ring area), and r = 0.27 (TL at CA 12 × basal area) for the prediction of whole-tree TL, whole-tree TD, and whole core TL, respectively. The first fifteen CA were considered as juvenile wood, while the remaining ones were considered as mature wood. This threshold was used in previous studies, predicting juvenile wood influence on ma-ture wood characteristics in white spruce (Corriveau et al. 1987) and Norway spruce (Blouin et al. 1994). Except when testing distance from the apex, samples located inside the living crown were avoided in these analyses. AP = age + var1 + var2 + var3 + var4 + ε (1)
Table 2. Tree characteristics.
Stand and tree Tree age Tree height Clear bole Crown length DBHID (years) (m) length (m) (m) (cm)
Thinning
Average 72 21.1 14 7 26.81* 72 25.1 16.2 8.9 39.42* 72 23 16.3 6.7 28.33 72 20 12.1 7.9 23.44 72 19.3 13.5 5.8 21.55 72 21.8 15.8 6 23.2
Spacing
Average 41 15.3 7.5 7.8 20.16* 41 14.2 6.6 7.6 20.97* 41 13.7 9.9 3.8 108 41 16.3 5.9 10.4 32.59 41 14.1 4.4 9.7 20.110 41 16 9.2 6.8 16.611 41 16.4 10.1 6.3 18.7
* Trees used for the fixed calendar year longitudinal sampling.
192 IAWA Journal 36 (2), 2015
where AP = anatomical properties (TL or TD), age = the fixed effect of the age vari- ables (logarithmic or 1st, 2nd, 3rd, and 4th polynomial transformations of CA), var1, var2, var3, and var4 are the fixed effect of the most important significant predictors of anatomical properties after the age variables, and ε is the random error term. In addition to the multiple regressions, the WBE approach (West et al. 1999; Anfo-dillo et al. 2006) given by equation (2) was tested for its applicability in predicting white spruce tracheid expansion. We fixed an allometric coefficient of 0.25, instead of the 0.167 proposed by West et al. (1999). By doing so, we hypothesized full agree-ment with WBE predictions for all trees, i.e. the conduit network were optimized in-dependently of tree height, in agreement with a previous study (Anfodillo et al. 2006). All data used for the WBE testing were first log 10-transformed. TD = DFA0.25 (2)where TD = tracheid diameter, and DFA = distance from apex.
RESULTS
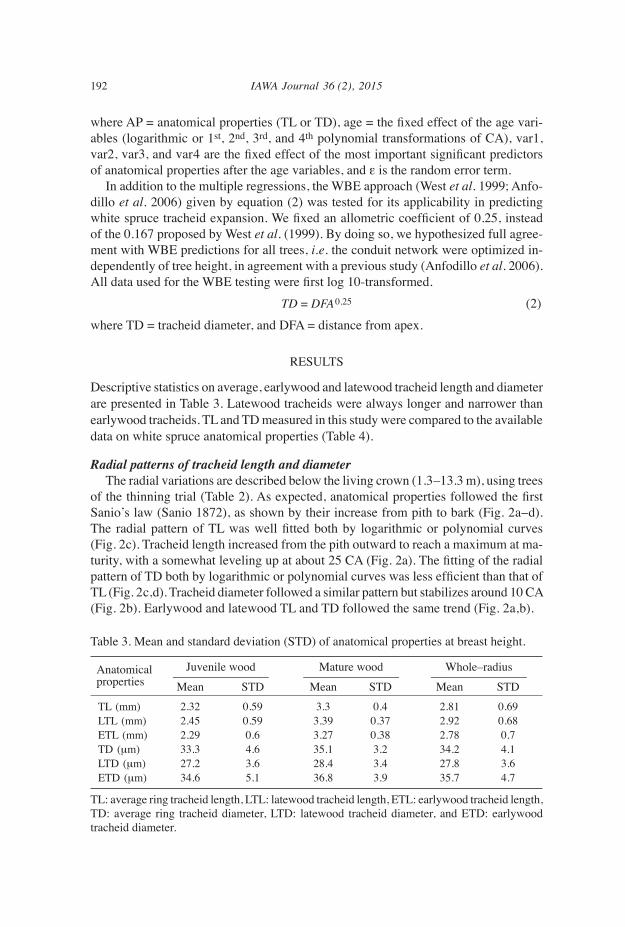
Descriptive statistics on average, earlywood and latewood tracheid length and diameter are presented in Table 3. Latewood tracheids were always longer and narrower than earlywood tracheids. TL and TD measured in this study were compared to the available data on white spruce anatomical properties (Table 4).
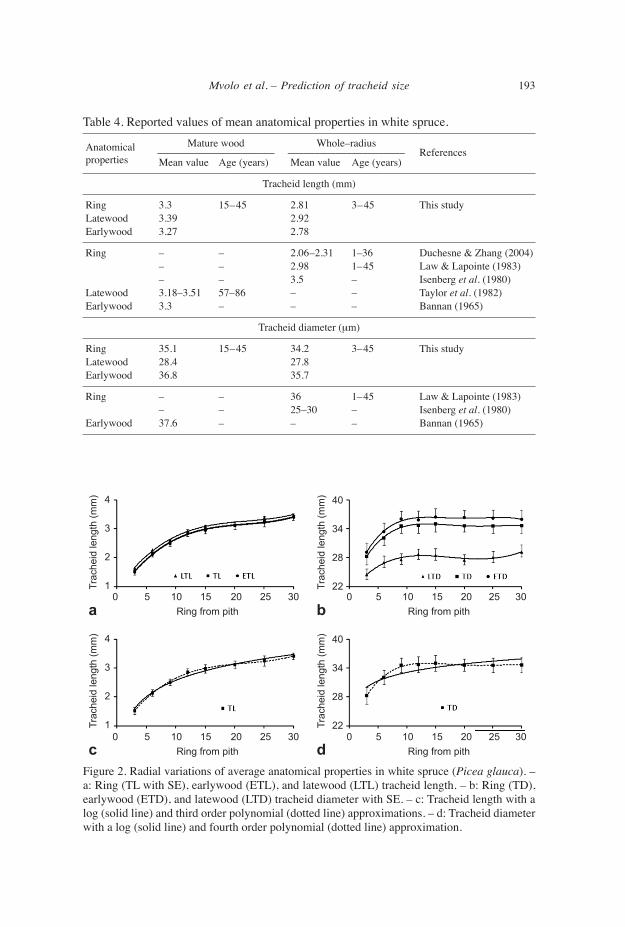
Radial patterns of tracheid length and diameter The radial variations are described below the living crown (1.3–13.3 m), using trees of the thinning trial (Table 2). As expected, anatomical properties followed the first Sanio’s law (Sanio 1872), as shown by their increase from pith to bark (Fig. 2a–d). The radial pattern of TL was well fitted both by logarithmic or polynomial curves (Fig. 2c). Tracheid length increased from the pith outward to reach a maximum at ma-turity, with a somewhat leveling up at about 25 CA (Fig. 2a). The fitting of the radial pattern of TD both by logarithmic or polynomial curves was less efficient than that of TL (Fig. 2c,d). Tracheid diameter followed a similar pattern but stabilizes around 10 CA (Fig. 2b). Earlywood and latewood TL and TD followed the same trend (Fig. 2a,b).
Table 3. Mean and standard deviation (STD) of anatomical properties at breast height.
Anatomical Juvenile wood Mature wood Whole–radius –––––––––––––––– –––––––––––––––– –––––––––––––––– properties Mean STD Mean STD Mean STD
TL (mm) 2.32 0.59 3.3 0.4 2.81 0.69LTL (mm) 2.45 0.59 3.39 0.37 2.92 0.68ETL (mm) 2.29 0.6 3.27 0.38 2.78 0.7TD (µm) 33.3 4.6 35.1 3.2 34.2 4.1LTD (µm) 27.2 3.6 28.4 3.4 27.8 3.6ETD (µm) 34.6 5.1 36.8 3.9 35.7 4.7
TL: average ring tracheid length, LTL: latewood tracheid length, ETL: earlywood tracheid length, TD: average ring tracheid diameter, LTD: latewood tracheid diameter, and ETD: earlywood tracheid diameter.
193Mvolo et al. – Prediction of tracheid size
Table 4. Reported values of mean anatomical properties in white spruce. Anatomical Mature wood Whole–radius
References –––––––––––––––––––––– –––––––––––––––––––––– properties Mean value Age (years) Mean value Age (years)
Tracheid length (mm)
Ring 3.3 15–45 2.81 3–45 This study Latewood 3.39 2.92 Earlywood 3.27 2.78
Ring – – 2.06–2.31 1–36 Duchesne & Zhang (2004) – – 2.98 1–45 Law & Lapointe (1983) – – 3.5 – Isenberg et al. (1980) Latewood 3.18–3.51 57–86 – – Taylor et al. (1982) Earlywood 3.3 – – – Bannan (1965)
Tracheid diameter (µm)
Ring 35.1 15–45 34.2 3–45 This study Latewood 28.4 27.8 Earlywood 36.8 35.7
Ring – – 36 1–45 Law & Lapointe (1983) – – 25–30 – Isenberg et al. (1980) Earlywood 37.6 – – – Bannan (1965)
4
3
2
1
4
3
2
1
40
34
28
22
40
34
28
22
0 5 10 15 20 25 30 0 5 10 15 20 25 30 Ring from pith Ring from pith
0 5 10 15 20 25 30 0 5 10 15 20 25 30 Ring from pith Ring from pith
Trac
heid
leng
th (m
m)
Tra
chei
d le
ngth
(mm
)
Trac
heid
leng
th (m
m)
Tra
chei
d le
ngth
(mm
)
a
c
b
dFigure 2. Radial variations of average anatomical properties in white spruce (Picea glauca). – a: Ring (TL with SE), earlywood (ETL), and latewood (LTL) tracheid length. – b: Ring (TD), earlywood (ETD), and latewood (LTD) tracheid diameter with SE. – c: Tracheid length with a log (solid line) and third order polynomial (dotted line) approximations. – d: Tracheid diameter with a log (solid line) and fourth order polynomial (dotted line) approximation.
194 IAWA Journal 36 (2), 2015
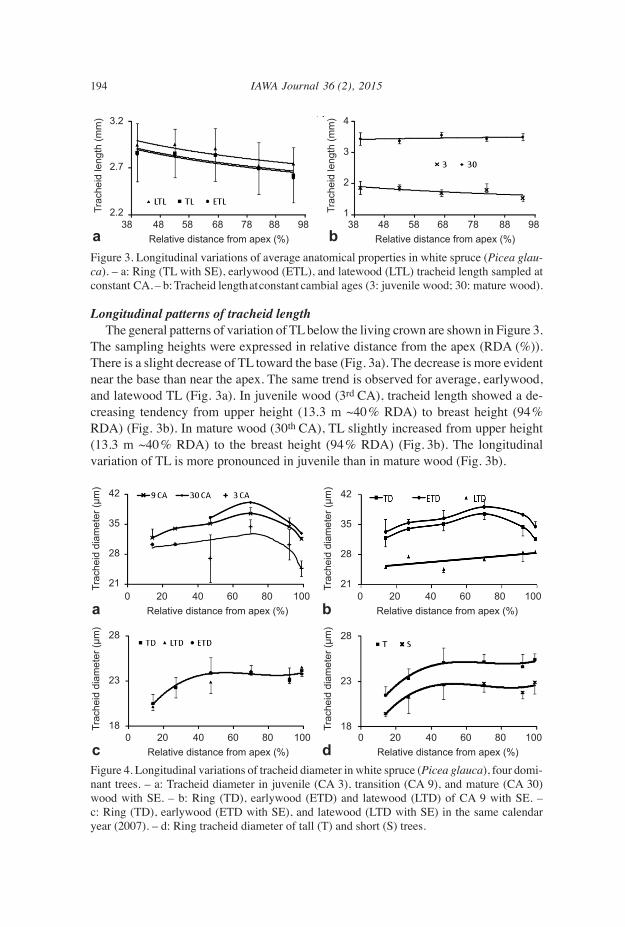
longitudinal patterns of tracheid length The general patterns of variation of TL below the living crown are shown in Figure 3. The sampling heights were expressed in relative distance from the apex (RDA (%)). There is a slight decrease of TL toward the base (Fig. 3a). The decrease is more evident near the base than near the apex. The same trend is observed for average, earlywood, and latewood TL (Fig. 3a). In juvenile wood (3rd CA), tracheid length showed a de- creasing tendency from upper height (13.3 m ~40% RDA) to breast height (94% RDA) (Fig. 3b). In mature wood (30th CA), TL slightly increased from upper height (13.3 m ~40% RDA) to the breast height (94% RDA) (Fig. 3b). The longitudinal variation of TL is more pronounced in juvenile than in mature wood (Fig. 3b).
3.2
2.7
2.2 38 48 58 68 78 88 98 38 48 58 68 78 88 98 Relative distance from apex (%) Relative distance from apex (%)
Trac
heid
leng
th (m
m) 4
3
2
1Trac
heid
leng
th (m
m)
a bFigure 3. Longitudinal variations of average anatomical properties in white spruce (Picea glau- ca). – a: Ring (TL with SE), earlywood (ETL), and latewood (LTL) tracheid length sampled at constant CA. – b: Tracheid length at constant cambial ages (3: juvenile wood; 30: mature wood).
Figure 4. Longitudinal variations of tracheid diameter in white spruce (Picea glauca), four domi- nant trees. – a: Tracheid diameter in juvenile (CA 3), transition (CA 9), and mature (CA 30) wood with SE. – b: Ring (TD), earlywood (ETD) and latewood (LTD) of CA 9 with SE. – c: Ring (TD), earlywood (ETD with SE), and latewood (LTD with SE) in the same calendar year (2007). – d: Ring tracheid diameter of tall (T) and short (S) trees.
Trac
heid
dia
met
er (µ
m)
T
rach
eid
diam
eter
(µm
) 42
35
28
21
28
23
18 0 20 40 60 80 100 0 20 40 60 80 100 Relative distance from apex (%) Relative distance from apex (%)
42
35
28
21
28
23
18
0 20 40 60 80 100 0 20 40 60 80 100 Relative distance from apex (%) Relative distance from apex (%)
Trac
heid
dia
met
er (µ
m)
T
rach
eid
diam
eter
(µm
)
a
c
b
d
195Mvolo et al. – Prediction of tracheid size
Variation of tracheid diameter from stem apex to tree base The variation of TD from stem apex to ground level was considered with both the fixed CA sampling and the fixed CY sampling. For the fixed CA sampling, TD showed some fluctuations from apex to stump, in the juvenile (3 CA), transition (9 CA), and mature (30 CA) wood zones (Fig. 4a). However, the general pattern is characterized by an increase from apex to stump (Fig. 4a,b and Table 5). This pattern is more evi- dent in earlywood than latewood tracheid diameter, and if one discards the stump level (0.3 m) which corresponds to 99% relative distance from the apex (Fig. 4b). The increasing of ring, earlywood and latewood tracheids’ diameter from apex to stump was more evident when using the fixed CY sampling (Fig. 4c and Table 5) for both tall and short trees (Fig. 4d). However, tracheids were wider in tall trees compared to short ones (Fig. 4d). These longitudinal variations, observed both with a fixed CA sampling and a fixed CY sampling clearly confirm the conduit tapering theory for white spruce. However, it is more pronounced when the combined effects of distance from apex and tree age are considered, as with the fixed CY sampling (Fig. 4 and Table 5). The tapering was sharper near the apex than at the tree base.
calibration of tracheid length modelsWhole-tree tracheid length For the multiple regression models of TL using the whole-trees (i.e. individual an-nual rings estimates of TL from pith to bark and from 1.3 m to 13.3 m height) values, inclusion of CA, as either a log transformation (Eq. 3) or a third-order polynomial (Eq. 4), accounted for 77.4% and 78.9% of the total variation, respectively. Higher-order polynomials did not improve the model. In both models, sampling height was the second most explanatory variable with a 2% and 1.5% fitting improvement for the log and polynomial models, respectively. As the third independent variable of importance, basal area explained another 1.1% and 0.78% of the variation for the log and polynomial models, respectively. Tracheid diameter was the fourth regressor retained and added 0.77% and 0.59% in the R2 for the log and polynomial models, respectively. In both models, the diameter at breast height was the last predictor and was negatively related
Table 5. Longitudinal variation of tracheid diameter (TD) with relative distance from the apex (RDA) in %, cambial age (CA) in years with minimum (min) found in shorter trees and maximum (max) found in taller trees, and sampling strategy in four dominants trees.
Fixed cambial age sampling Fixed calendar year (2007) sampling –––––––––––––––––––––––––––
RDA (%) TD (µm) –––––––––––––––––––––––––––––––––––––––––––––––––––––––––––––––– CA 3 CA 9 CA 30 TD (µm) Mean age (min - max)
14 30 32 - 20 11 (4 - 17) 27 30 34 - 22 17 (8 - 26) 47 27 35 36 24 26 (14 - 40) 70 34 37 40 24 35 (20 - 52) 92 30 34 35 23 44 (29 - 61) 99 25 32 33 24 52 (34 - 68)
196 IAWA Journal 36 (2), 2015
to TL, improving the prediction by 0.61% and 0.50% for the log and the polynomial models, respectively. This latter variable was only marginally (P ≤ 0.06) significant with the polynomial model. The final model with either a log transformation or a third-order polynomial explained 82% of the variation in TL (Fig. 5a,b). TL = 0.1557 + 0.7285Log(CA) + 0.02494SH + 0.005808BA + 0.01927TD – 0.00804DBH (3)
TL = 0.4346 + 0.1947CA – 0.00567(CA)2 + 0.000056(CA)3 + 0.02163SH + 0.004762BA + 0.01904TD – 0.00706DBH
(4)
Breast height tracheid length For the multiple regression models of TL using the whole-radius (i.e. individual an-nual rings estimates of TL from pith to bark at 1.3 m) values, the log of CA predicted 80.5% and the third-order polynomial of CA 81.3% of the total variation (final equa-tions shown in Table 6). Higher polynomial models did not improve the fitting between annual ring TL and CA. Estimate of TL of single juvenile ring was the second most important predictor and basal area the third one, though this latter added less than 1% in the variation of whole-radius TL at breast height explained. No other tested predictor enhanced the model. The best model fit was obtained at CA 12 with the log (85.4%) and the polynomial (86.4%) transformation of CA, respectively (Table 6). The coeffi-cients of determination obtained with the estimate of TL at the 12th CA were however almost similar to those obtained with the mean (rings 3–15) value of TL in the juvenile wood with the log (85.8%) and the polynomial (86.5%) models, respectively (Table 6). Cambial age 12 was the best individual age to use the estimates of TL for explaining whole-radius value. Juvenile wood TL were not found good predictors of whole-radius TL at breast height. The only exceptions occurred when using the estimate at CA 12 (60.1%) or the estimate of mean juvenile wood (65.8%). Mature wood TL could also not be calibrated from their juvenile wood with a good precision.
calibration of tracheid diameter models with multiple regressionsWhole-tree tracheid diameter Cambial age was used to calibrate the models, with material sampled at fixed CA. The log transformation (Eq. 5) and the fourth-order polynomial (Eq. 6) of CA represented 18.7% and 26.4% of the variation in TD, respectively. Higher-order polynomials failed to improve the model. In both models, ring area was the second variable explaining most variation and the R2 increased by 11.4% and 9.3% for the log and polynomial models, respectively. The third most important independent variable was diameter at BH and it brought 1.4% and 2.2% improvement in fitting for the log and polynomial models, respectively. Distance from the apex was marginal and of little importance for tracheid expansion. The final log transformation and fourth-order polynomial models explained 31.6% and 37.9% of the variation observed in TD, respectively. A better description (36.1%) was obtained by including the TL and removing the log of CA from the log model (Eq. 7).
197Mvolo et al. – Prediction of tracheid size
TD = 24.1772 + 1.9238Log(CA) + 0.001778RA + 0.1064DBH (5)
TD = 19.2193 + 2.108CA – 0.1381(CA)2 + 0.003636(CA)3 – 0.00003(CA)4
+ 0.001274RA + 0.1386DBH (6)
TD = 21.5705 + 0.001808RA + 0.1241DBH + 2.5886TL (7)
Breast height tracheid diameter Logarithmic transformation of CA made it possible to explain 21.9% and the fourth-order polynomial 35.4% of the variation of TD of whole-radius at BH (equations not shown). Higher polynomials did not add to the variation explained. In order, single juvenile ring TD, ring area, and TL were the second, third and fourth most explana- tory variable. The strongest calibration, 49% with the log and 61.6% with the polynomial full models, respectively, was obtained with the mean juvenile wood values. Though still low, ring area explained whole-radius TD more as a single predic-tor at BH than juvenile wood TD. All the tested regressors from juvenile wood failed to explain a sufficient portion of variation existing in mature TD. As found with TL, CA 12 was the best individual age to use the estimates of TD for explaining whole-radius value.
Validation of the WBe approach The applicability of the WBE approach was tested using both materials collected at fixed CA and at fixed CY. Results show that tracheid expansion can be satisfactorily predicted by the WBE approach in white spruce only if samples are taken longitudinally at the same calendar year (Table 7). Sampling the same CA longitudinally allows inves-tigating the variation of wood quality, but presents limits when functional relationships are sought.
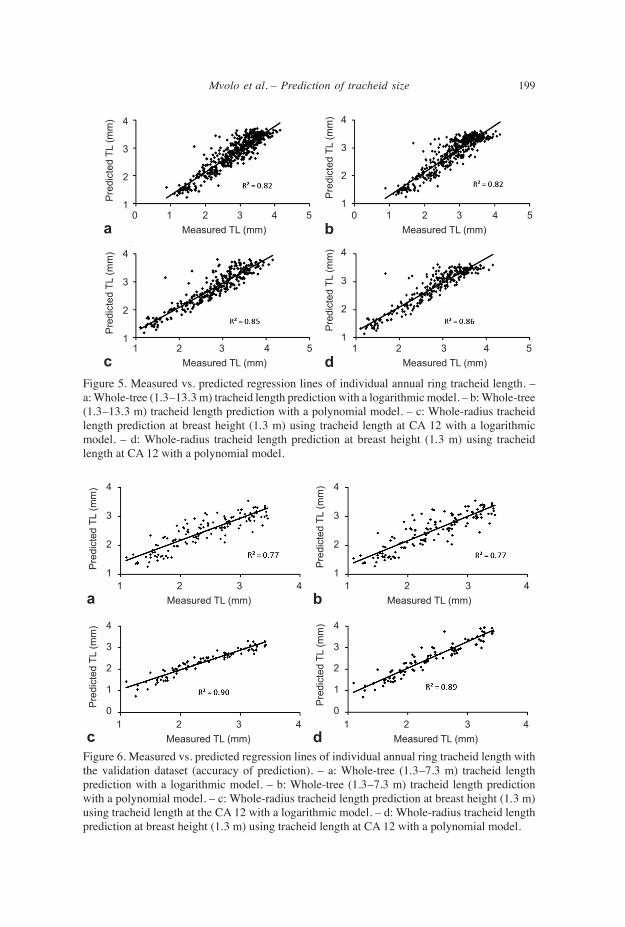
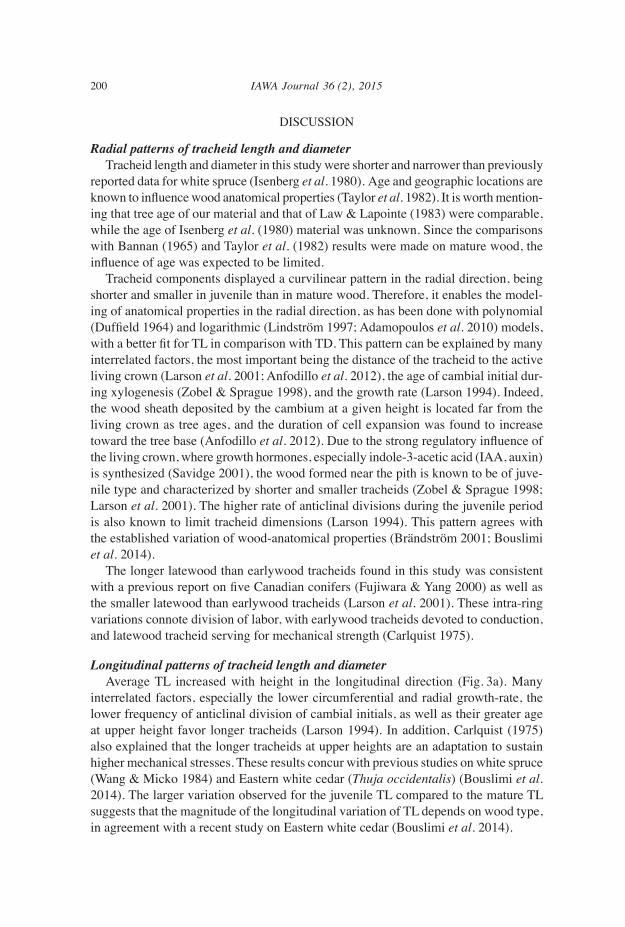
accuracy of tracheid length prediction The final multiple regressions model of entire tree bole (1.3–13.3 m height) with either a log transformation or a third-order polynomial gave a high estimation of TL (Fig. 5a, b). Similarly, at BH, models with the log and polynomial transformations gave a high estimation of TL from the value at the 12th CA (Fig. 5c, d). With all mo- dels, there was a slight tendency to overestimate shorter tracheid and underestimate longer tracheid, while the best fit was found near the average TL value found in this study (Fig. 5a–d). When applied to the validation set, the full models for entire tree bole gave highly accurate prediction of individual annual ring TL from 1.3 m to 7.3 m height, with a predictive power of 77% (RMSE = 0.3) for both the logarithmic and polynomial model (Fig. 6a,b). The multiple models of TL at breast height using juvenile tracheid value at determined CA also gave good results in validation stage (Table 6). The pre-diction at the 12th CA, 90% (RMSE = 0.2) with the log and 89% (RMSE = 0.3) with the polynomial model was still the best among single CA and similar to mean juvenile wood (Table 6). These results (12th CA) are presented as example in (Fig. 6c, d).
198 IAWA Journal 36 (2), 2015Ta
ble
6. S
umm
ary
of th
e es
timat
ion
pow
er (a
nd R
2 -R
MSE
of v
alid
atio
n) o
f who
le-c
ore
trach
eid
leng
th fr
om e
stim
ates
of T
L at
sin
gle
cam
- bi
al a
ge, m
ean
juve
nile
woo
d TL
, and
bas
al a
rea
afte
r thi
nnin
g w
ith th
e lo
garit
hmic
, and
third
-ord
er p
olyn
omia
l mod
els.
In
depe
nden
t var
iabl
es
Inde
pend
ent v
aria
bles
Cam
bial
W
hole
-cor
e (lo
g)
Who
le-c
ore
(pol
ynom
ial)
––
––––
––––
––––
––––
––––
––––
––––
––––
––––
––––
––––
––––
––
––
––––
––––
––––
––––
––––
––––
––––
––––
––––
––––
––––
––––
––––
––––
––––
––––
––––
––––
–ag
e (C
A)
Inte
rcep
t Lo
g (C
A)
TL
BA
R
2 (%
)-R
MSE
In
terc
ept
CA
C
A2
CA
3 TL
B
A
R2 (
%)-
RM
SE
3
-0.1
16
0.78
2 0.
539
– 83
(83-
0.3)
0.
045
0.22
5 -0
.007
0.
0001
0.
571
– 84
(81-
0.5)
6
-0.5
79
0.77
9 0.
498
0.00
7 83
(86-
0.2)
-0
.346
0.
219
-0.0
07
0.00
01
0.51
5 0.
006
84 (8
2-0.
5) 9
-0
.972
0.
782
0.56
9 0.
008
84 (8
8-0.
2)
-0.6
98
0.21
8 -0
.006
0.
0001
0.
570
0.00
6 85
(85-
0.4)
12
-1.0
22
0.77
7 0.
513
0.00
8 85
(90-
0.2)
-0
.841
0.
225
-0.0
07
0.00
01
0.53
4 0.
007
86 (8
9-0.
3) 1
5 -0
.631
0.
779
0.44
8 –
84 (8
9-0.
2)
-0.4
22
0.21
9 -0
.007
0.
0001
0.
452
– 85
(87-
0.4)
3–1
5 -1
.380
0.
772
0.80
1 0.
007
86 (9
0-0.
2)
-1.1
77
0.21
8 -0
.007
0.
0001
0.
823
0.00
6 87
(89-
0.4)
RM
SE: r
oot m
ean
squa
red
erro
r, TL
: ave
rage
ring
trac
heid
leng
th, C
A: c
ambi
al a
ge, C
A 3
–15:
mea
n ju
veni
le w
ood,
BA
: bas
al a
rea
afte
r thi
nnin
g, an
d lo
g: lo
garit
hmic
.
Tabl
e 7.
Reg
ress
ion
coef
ficie
nts o
f the
val
idat
ion
of th
e W
est,
Bro
wn
and
Enqu
ist 1
999
(WB
E) a
ppro
ach
in w
hite
spru
ce m
atur
e w
ood
whe
n sa
mpl
ing
at a
fixe
d ca
mbi
al a
ge (C
A),
and
at a
fixe
d ca
lend
ar y
ear (
CY
).
Sa
mpl
ing
fixed
cam
bial
age
(CA
30)
Sa
mpl
ing
fixed
cal
enda
r yea
r (C
Y 2
007)
––
––––
––––
––––
––––
––––
––––
––––
––––
––––
––––
––
––––
––––
––––
––––
––––
––––
––––
––––
––––
––––
–––
Tree
ID
Hei
ght (
m)
Age
(yr)
N
In
terc
ept
Slop
e R
2 P-
valu
e
N
Inte
rcep
t Sl
ope
R2
(%)
P-va
lue
1
25.1
72
7
4.10
8 -0
.652
0.
430
0.00
6
10
3.13
8 0.
174
86
0.00
01 2
23
72
6
3.46
1 0.
118
0.02
0 0.
804
9
2.87
7 0.
391
85
0.00
15 6
14
.2
41
– –
– –
–
6 2.
929
0.45
1 51
0.
1446
7
13.7
41
–
– –
– –
6
2.86
9 0.
292
85
0.01
19
199Mvolo et al. – Prediction of tracheid size
0 1 2 3 4 5 0 1 2 3 4 5 Measured TL (mm) Measured TL (mm)
1 2 3 4 5 1 2 3 4 5 Measured TL (mm) Measured TL (mm)
4
3
2
1
4
3
2
1
a
c
4
3
2
1
4
3
2
1Pre
dict
ed T
L (m
m)
P
redi
cted
TL
(mm
)
Pre
dict
ed T
L (m
m)
P
redi
cted
TL
(mm
)
b
d
1 2 3 4 1 2 3 4 Measured TL (mm) Measured TL (mm)
1 2 3 4 1 2 3 4 Measured TL (mm) Measured TL (mm)
Pre
dict
ed T
L (m
m)
Pre
dict
ed T
L (m
m)
b
d
4
3
2
1
4
3
2
1
0
Pre
dict
ed T
L (m
m)
Pre
dict
ed T
L (m
m) 4
3
2
1
4
3
2
1
0
a
c
Figure 5. Measured vs. predicted regression lines of individual annual ring tracheid length. – a: Whole-tree (1.3–13.3 m) tracheid length prediction with a logarithmic model. – b: Whole-tree (1.3–13.3 m) tracheid length prediction with a polynomial model. – c: Whole-radius tracheid length prediction at breast height (1.3 m) using tracheid length at CA 12 with a logarithmic model. – d: Whole-radius tracheid length prediction at breast height (1.3 m) using tracheid length at CA 12 with a polynomial model.
Figure 6. Measured vs. predicted regression lines of individual annual ring tracheid length with the validation dataset (accuracy of prediction). – a: Whole-tree (1.3–7.3 m) tracheid length prediction with a logarithmic model. – b: Whole-tree (1.3–7.3 m) tracheid length prediction with a polynomial model. – c: Whole-radius tracheid length prediction at breast height (1.3 m) using tracheid length at the CA 12 with a logarithmic model. – d: Whole-radius tracheid length prediction at breast height (1.3 m) using tracheid length at CA 12 with a polynomial model.
200 IAWA Journal 36 (2), 2015
DISCUSSION
Radial patterns of tracheid length and diameter Tracheid length and diameter in this study were shorter and narrower than previously reported data for white spruce (Isenberg et al. 1980). Age and geographic locations are known to influence wood anatomical properties (Taylor et al. 1982). It is worth mention-ing that tree age of our material and that of Law & Lapointe (1983) were comparable, while the age of Isenberg et al. (1980) material was unknown. Since the comparisons with Bannan (1965) and Taylor et al. (1982) results were made on mature wood, the influence of age was expected to be limited. Tracheid components displayed a curvilinear pattern in the radial direction, being shorter and smaller in juvenile than in mature wood. Therefore, it enables the model-ing of anatomical properties in the radial direction, as has been done with polynomial (Duffield 1964) and logarithmic (Lindström 1997; Adamopoulos et al. 2010) models, with a better fit for TL in comparison with TD. This pattern can be explained by many interrelated factors, the most important being the distance of the tracheid to the active living crown (Larson et al. 2001; Anfodillo et al. 2012), the age of cambial initial dur-ing xylogenesis (Zobel & Sprague 1998), and the growth rate (Larson 1994). Indeed, the wood sheath deposited by the cambium at a given height is located far from the living crown as tree ages, and the duration of cell expansion was found to increase toward the tree base (Anfodillo et al. 2012). Due to the strong regulatory influence of the living crown, where growth hormones, especially indole-3-acetic acid (IAA, auxin) is synthesized (Savidge 2001), the wood formed near the pith is known to be of juve-nile type and characterized by shorter and smaller tracheids (Zobel & Sprague 1998; Larson et al. 2001). The higher rate of anticlinal divisions during the juvenile period is also known to limit tracheid dimensions (Larson 1994). This pattern agrees with the established variation of wood-anatomical properties (Brändström 2001; Bouslimi et al. 2014). The longer latewood than earlywood tracheids found in this study was consistent with a previous report on five Canadian conifers (Fujiwara & Yang 2000) as well as the smaller latewood than earlywood tracheids (Larson et al. 2001). These intra-ring variations connote division of labor, with earlywood tracheids devoted to conduction, and latewood tracheid serving for mechanical strength (Carlquist 1975).
longitudinal patterns of tracheid length and diameter Average TL increased with height in the longitudinal direction (Fig. 3a). Many interrelated factors, especially the lower circumferential and radial growth-rate, the lower frequency of anticlinal division of cambial initials, as well as their greater age at upper height favor longer tracheids (Larson 1994). In addition, Carlquist (1975) also explained that the longer tracheids at upper heights are an adaptation to sustain higher mechanical stresses. These results concur with previous studies on white spruce (Wang & Micko 1984) and Eastern white cedar (Thuja occidentalis) (Bouslimi et al. 2014). The larger variation observed for the juvenile TL compared to the mature TL suggests that the magnitude of the longitudinal variation of TL depends on wood type, in agreement with a recent study on Eastern white cedar (Bouslimi et al. 2014).
201Mvolo et al. – Prediction of tracheid size
Many interrelated factors help understanding the widening of tracheid diameter from tree apex through its base. The general explanation is that it is an adaptation strategy, to overcome hydraulic resistance within the conduits with tree height (Anfodillo et al. 2006; Anfodillo et al. 2013; Olson et al. 2014). Anfodillo et al. (2012) explained the basipetal widening of TD by the fact that the duration of cell expansion increases to-ward the tree base. The cambial age at the time of xylogenesis offers a straightforward explanation of the basipetal conduit widening. Indeed, as one can see in Table 5, tree age increased from apex to stump when sampling at a fixed CY. Thus, the explanations given above for the radial widening of TD at a given height fully apply to understand the longitudinal variation at a given CY. These also explain why tall trees have wider tracheids than short trees at comparable RDA. Indeed, as one can see in Table 5, at the same RDA, vascular tissue of tall trees is older and was formed further away from the living crown than that of short trees. The fact that earlywood tracheid diameter conforms better than latewood tracheid diameter in the increase from apex to stump is understandable, since earlywood tracheids serve in conduction, while latewood tra-cheids provide mechanical strength (Carlquist 1975). The basipetal increase of ring, earlywood, and latewood TD from apex to stump observed when sampling at constant cambial ages agrees with previous description of the longitudinal variation of Norway spruce (Atmer & Thôrnqvist 1984) and Eastern white cedar (Bouslimi et al. 2014) with a similar sampling. The widening of TD from apex to stump at the same calendar year concurs with the description on many woody plants, including Norway spruce (Anfodillo et al. 2006), when trees were sampled in the same manner. Sampling wood quality attributes at fixed rings from the pith (or CA) is the current practice when assessing wood quality variation in the radial and longitudinal directions. However, with fixed CA, there is no continuity in terms of sap conduction between tracheids at different heights, while a real continuity in the conduits from stump to apex exists when sampling at fixed CY. At different heights, the same cambial age does not correspond to the same calendar year, thus the ecological conditions for the same cambial age are not the same at different heights. On the other hand, at the same calendar year, the ecological conditions are the same at any tree height (Vaganov et al. 2006). Therefore, in good agreement with Anfodillo et al. (2013), the use of “size-dependency” rather than “age-dependency” approach when examining the variation of wood quality attributes within a functional-based approach is more appropriate.
estimation of tracheid length from whole-tree values We obtained a good fit for TL using multiple regressions. Logarithmic and polynomial transformations of CA explained most of the variance of TL. Although the regression power was slightly higher with polynomials than with logarithmic transformation of CA, this latter technique presents the advantage of capturing the curvilinear pattern with a single variable. Using that single variable instead of two or more transformations of CA may prevent from overfitting and collinearity issues. Multiple regression was successfully used in earlier studies (Duffield 1964; Burley 1969; Erickson & Harrison 1974; Lindström 1997; Liu & Bao 2001; Adamopoulos et al. 2010) and variation as-
202 IAWA Journal 36 (2), 2015
sociated with logarithmic (Lindström 1997; Mäkinen et al. 2007; Adamopoulos et al. 2010) and polynomial (Liu & Bao 2001) transformations of age, were within the range of our study. The positive relationship between sampling height and TL concurs with other studies (Burley 1969; Taylor et al. 1982; Wang & Micko 1984), and suggests that longer tracheids are found at upper heights. The limited but significant negative relationship between diameter at breast height and TL found in this study was consistent with previous studies (Erickson & Harrison 1974; Beaulieu 2003; Duchesne & Zhang 2004). This was expected, since anticlinal divisions increase with the increase of tree circumference which is known to lessen TL (Larson 1994). The negative relationship existing between diameter at breast height and TL may explain the positive relationship between basal area and TL. Indeed, basal area is known to decrease while diameter at BH increases with thinning intensity when considering standing trees and ignoring previous removals through thinning, as a consequence of both selection and better growth conditions (Pelletier & Pitt 2008). One can therefore expect these variables to be inversely related to TL. The positive relationship between TL and TD confirmed their known correlation (Bannan 1965). Indeed, an increase in TL was experimental- ly shown to be positively linked with TD, though TL changes more rapidly than TD (Bannan 1965).
estimation of tracheid length from juvenile wood values at breast height There is clear evidence that at the whole-radius scale, CA is the most important parameter for TL estimation at breast height, in accordance with previous studies (Duffield 1964; Adamopoulos et al. 2010). However, the prediction power of CA drastically decreased when only the mature stage of growth was considered. This was fully expected, since TL does not vary greatly after maturity is reached. A similar result was shown by Erickson and Harrison (1974). Another study also found that a large part of the prediction power in TL is due to juvenile tracheid length (Herman et al. 1998a). The whole-radius TL of samples aged 45 CA at BH can be estimated from estimates obtained at CA 3 and confirms previous reports (Loo et al. 1984; Nyakuengama et al. 1997; Hannrup & Ekberg 1998). Loo et al. (1984) found the higher heritability for latewood TL at CA 4 in loblolly pine, Nyakuengama et al. (1997) suggested to select for pulpwood (fibre perimeter and coarseness) at CA 8–9 in radiata pine whereas Hannrup and Ekberg (1998) found CA 11 or lower to be the better age for selection of TL in Scots pine. Denne (1971) suggested an early selection on seedlings as old as one year. Heritabilities at both the family and individual levels are low in white spruce (Beaulieu 2003). Therefore, Beaulieu (2003) suggested to rely on selection and vege-tative propagation of the trees with the longest tracheids to obtain significant genetic gain. Since growing cycles are long in boreal forest, predicting TL of older white spruce trees at younger age (3–12 CA) is of great interest both practically and scientifically. The lack of prediction of mature and whole-radius TL from juvenile wood TL in simple regression concurs with Loo et al. (1984) results, but contrasts with those of Hannrup and Ekberg (1998). These results confirmed the need to include age as an explanatory variable in any prediction of TL.
203Mvolo et al. – Prediction of tracheid size
Modeling of tracheid diameter Prediction models for TD were not as strong as those for TL. There are two plausible explanations. The first explanation is that radial variation of TD is characterized by a rapid leveling observed in this study (Fig. 2b). This rapid leveling limits modeling TD as a function of CA. Similar concerns were raised concerning the relationship between TL/CA using logarithmic (Erickson & Harrison 1974) or second order polynomial (Duffield 1964) approaches. The second explanation is the sampling strategy used in this study. Sampling the same CA at different tree heights considers only the influence of tree height (Vaganov et al. 2006). Using the fixed CA sampling failed to explain TD with the WBE approach. However, when the WBE approach was used with the material sampled at a fixed CY, TD was satisfactorily predicted (r2 = 0.86). One can even expect higher prediction power with larger sampling (Anfodillo et al. 2006). Therefore, using the WBE approach with the right sampling strategy (i.e. considering the combined effect of cambium maturation and tree height) allows modeling the variation of TD in white spruce. For one of the sampled trees (Tree 6 (spacing), Table 7), the prediction of TD by the WBE approach was not as good as for the other trees. This tree was not old or tall enough (41 years, 14.2 m) to suggest the non-optimal tapering observed in very old and tall trees (Anfodillo et al. 2006). Thus, one must be aware of the fact that although the WBE is a good way to model TD, it does not work in every case (Mencuccini et al. 2007).
Quality of tracheid length models Although multiple regression models of TL for the entire stem (1.3–13.3 m) and at BH gave high estimation, there was a slight tendency to overestimate shorter tracheids and underestimate longer tracheids. This may be explained by the fact that most of the tracheids used to calibrate the model were of intermediate value. Therefore, one must expect a slight overestimation of shorter tracheids (from early juvenile wood) and a slight underestimation of longer tracheids (from late mature wood). In contrast, the strongest fit will be found near the average value of TL. Initial spacing and thinning are silvicultural practices that can affect wood properties and quality, but their effects can differ (Clark III et al. 1994). Therefore, we expected to have a bias in validation phase due to the nature of the database used. However, despite the different silvicultural practices applied to the calibration and the validation datasets, the prediction power was as high as 90% (RMSE = 0.2).
Practical implications We predicted the whole-radius TL of trees older than 50 years from seed using esti-mates obtained at the 3rd CA at breast height. Practical implication of these models is to give the possibility to select trees with superior TL at younger age and use them as parent trees in tree breeding programs (Beaulieu 2003) or anticipate the quality of mate-rial at older age. However, to be efficient as selection tools, such models must represent a trend existing at the genetic level, or be due to a strong age-age genetic correlation. This has still to be confirmed using data collected in replicated mature genetic trials.

204 IAWA Journal 36 (2), 2015
So far, only few studies have dealt with this objective (Beaulieu 2003; Duchesne & Zhang 2004). If it is successful, the plantation stock producing longer tracheids could be allocated to more valuable end-uses. The models could likely also be used as input for process-based models, as done for Norway spruce (Mäkinen et al. 2007). Sampling strategy could change to satisfy several objectives. Indeed, one can examine the effect of ageing maturation and forest management practices on anatomical properties using calendar year as variable. This sampling strategy is also more efficient than cambial age when functional relationships are sought.
CONCLUSION
The tracheid components investigated in this study followed Sanio’s law, as shown by their increase from pith to bark. Tracheid length decreased, while tracheid diameter increased from apex to lower heights. Latewood tracheids were longer and narrower than earlywood ones, no matter the wood zone or height considered. Tracheids were shorter and smaller in juvenile than in mature wood. There was a slight tendency to overestimate shorter tracheids and underestimate longer tracheids with all models. Although a slightly higher estimation can be obtained with polynomials, the use of logarithmic transformation prevents from possible overfitting or collinearity issues. Predicting tracheid length of older white spruce trees at younger age could be used to select better trees for reproduction or anticipate the quality of material at older age. For a better inference purpose, it will be worthwhile to sample older trees at different lo-cations, in order to incorporate site index, climatic variables and more sampling heights and cambial age into the models. The WBE approach allows predicting tracheid diam-eter of the outer rings, sampled in the same calendar year, but is inefficient to explain tracheid diameter when samples came from the same cambial age. Therefore, sampling material on a calendar year basis will enable using them to characterize functional and predictive relationships among wood quality attributes.
ACKNOWLEDGEMENTS
The first author is grateful to the ForValueNet NSERC Strategic Network for early financing of this project and to NSERC-FQRNT-Tembec for providing him an industrial scholarship. We are also grateful to two anonymous reviewers for their comments on an earlier draft of the manuscript. We thank Dr. Hugues Power for providing us with the raw material used in this study.
REFERENCES
Adamopoulos S, Chavenetidou M, Passialis C & Voulgaridis E. 2010. Effect of cambium age and ring width on density and fibre length of black locust and chestnut wood. Wood Research 55: 25–36.
Anfodillo T, Carraro V, Carrer M, Fior C & Rossi S. 2006. Convergent tapering of xylem con-duits in different woody species. New Phytol. 169: 279–290.
Anfodillo T, Deslauriers A, Menardi R, Tedoldi L, Petit G & Rossi S. 2012. Widening of xylem conduits in a conifer tree depends on the longer time of cell expansion downwards along the stem. J. Experim. Bot. 63: 837–845.
205Mvolo et al. – Prediction of tracheid size
Anfodillo T, Petit G & Crivellaro A. 2013. Axial conduit widening in woody species: A still neglected anatomical pattern. IAWA J. 34: 352–364.
Atmer B & Thôrnqvist T. 1984. The properties of tracheids in spruce (Picea abies Karst.) and pine (Pinus silvestris L.). The Swedish University of Agricultural Sciences: 134.
Bannan MW. 1965. The length, tangential diameter, and length /width ratio of conifer tracheids. Can. J. Bot. 43: 967–984.
Beaulieu J. 2003. Genetic variation in tracheid length and relationships with growth and wood traits in eastern white spruce (Picea glauca). Wood Fiber Sci. 35: 609–616.
Bendtsen BA & Senft J. 1986. Mechanical and anatomical properties in individual growth rings of plantation-grown eastern cottonwood and loblolly pine. Wood Fiber Sci. 18: 23–38.
Blouin D, Beaulieu J, Daoust G & Poliquin J. 1994. Wood quality of Norway spruce grown in plantations in Quebec. Wood Fiber Sci. 26: 342–353.
Bouslimi B, Koubaa A & Bergeron PY. 2014. Anatomical properties in Thuja occidentalis: Vari-ation and relationship to biological processes. IAWA J. 35: 363–384.
Brändström J. 2001. Micro- and ultrastructural aspects of Norway spruce tracheids: A review. IAWA J. 22: 333–353.
Burley J. 1969. Tracheid length variation in a single tree of Pinus kesiya Royle ex Gord. Wood Sci. Technol. 3: 109–116.
Carlquist S. 1975. Ecological strategies of xylem evolution. Univ. California Press, Berkeley.Clark III A, Saucier JR, Baldwin Jr VC & Bower DR. 1994. Effect of initial spacing and thinning
on lumber grade, yield, and strength of loblolly pine. Forest Products J. 44: 14–20.Corriveau A, Beaulieu J & Mothe F. 1987. Wood density of natural white spruce populations in
Quebec. Can. J. For. Res. 17: 675–682.Denne MP. 1971. Tracheid length in relation to seedling height in conifers. Wood Sci. Technol.
5: 135–146.Duchesne I & Zhang SY. 2004. Variation in tree growth, wood density, and pulp fiber properties
of 35 white spruce (Picea glauca (Moench) Voss) families grown in Quebec. Wood Fiber Sci. 36: 467–475.
Duffield JW. 1964. Tracheid lenght variation patterns in Douglas-fir and selection of extreme variants. Tappi 47: 122–124.
Enquist BJ. 2003. Cope’s rule and the evolution of long-distance transport in vascular plants: Allometric scaling, biomass partitioning and optimization. Plant, Cell and Environment 26: 151–161.
Erickson HD & Harrison AT. 1974. Douglas-fir wood quality studies. I. Effects of age and stimu-lated growth on wood density and anatomy. Wood Sci. Technol. 8: 207–226.
Franklin GL. 1945. Preparation of thin sections of synthetic resins and wood-resin composites, and a new macerating method for wood. Nature 155 (3924): 51.
Fries A, Ericsson T & Morling T. 2003. Measuring relative fibre length in Scots pine by non-destructive wood sampling. Holzforschung 57: 400–406.
Fujiwara S & Yang KC. 2000. The relationship between cell length and ring width and circum-ferential growth rate in five Canadian species. IAWA J. 21: 335–345.
Gaudreault C, Samson R & Stuart P. 2009. Implications of choices and interpretation in LCA for multi-criteria process design: de-inked pulp capacity and cogeneration at a paper mill case study. J. Cleaner Production 17: 1535–1546.
Hannrup B & Ekberg I. 1998. Age-age correlations for tracheid length and wood density in Pinus sylvestris. Can. J. For. Res. 28: 1373–1379.
Herman M, Dutilleul P & Avella-Shaw T. 1998a. Growth rate effects on temporal trajectories of ring width, wood density, and mean tracheid length in Norway spruce (Picea abies (L.) Karst.). Wood Fiber Sci. 30: 6–17.
206 IAWA Journal 36 (2), 2015
Herman M, Dutilleul P & Avella-Shaw T. 1998b. Intra-ring and inter-ring variations of tracheid length in fast-grown versus slow-grown Norway spruces (Picea abies). IAWA J. 19: 3–23.
Isenberg IH, Harder ML & Louden L. 1980. Pulpwoods of the United States and Canada. I. Conifers. Institute of Paper Chemistry, Appleton, Wisconsin.
Koubaa A, Isabel N, Zhang SY, Beaulieu J & Bousquet J. 2005. Transition from juvenile to ma-ture wood in black spruce (Picea mariana (Mill.) B.S.P.). Wood Fiber Sci. 37: 445–455.
Koubaa A, Zhang SY & Makni S. 2002. Defining the transition from earlywood to latewood in black spruce based on intra-ring wood density profiles from X-ray densitometry. Ann. For. Sci. 59: 511–518.
Larson PR. 1994. The vascular cambium: Development and structure. In: Timell TE (ed.), Springer Series in Wood Science, Springer-Verlag, Berlin.
Larson PR, Kretschmann DE, Clark III A & Isebrands JG. 2001. Formation and properties of juvenile wood in southern pines: A synopsis. Gen. Tech. Rept., Forest Products Laboratory. Madison WI. 42 pp.
Lasserre JP, Mason EG, Watt MS & Moore JR. 2009. Influence of initial planting spacing and genotype on microfibril angle, wood density, fibre properties and modulus of elasticity in Pinus radiata D.Don corewood. Forest Ecology and Management 258: 1924–1931.
Law KN & Lapointe M. 1983. Chemimechanical pulping of boles and branches of white spruce, white birch, and trembling aspen. Can. J. For. Res. 13: 412–418.
Lindström H. 1997. Fiber length, tracheid diameter, and latewood percentage in Norway spruce: development from pith outwards. Wood Fiber Sci. 29: 21–34.
Liu S & Bao F. 2001. Modeling wood properties in relation to cambium age and growth rate in plantation poplar in China. J. Inst. Wood Sci. 15: 247–252.
Loo JA, Tauer CG & Van Buijtenen JP. 1984. Juvenile-mature relationships and heritability estimates of several traits in loblolly pine (Pinus taeda). Can. J. For. Res. 14: 822–825.
Mäkinen H, Jaakkola T, Piispanen R & Saranpää P. 2007. Predicting wood and tracheid proper-ties of Norway spruce. Forest Ecol. Manag. 241: 175–188.
Mencuccini M, Hölttä T, Petit G & Magnani F. 2007. Sanio’s laws revisited. Size-dependent changes in the xylem architecture of trees. Ecol. Letters 10: 1084–1093.
Nyakuengama JG, Matheson C, Spencer DJ, Evans R & Vinden P. 1997. Time trends in the genetic control of wood microstructure traits in Pinus radiata. Appita J. 50: 486–494.
Olson ME, Anfodillo T, Rosell JA, Petit G, Crivellaro A, Isnard S, León-Gómez C, Alvarado-Cárdenas LO & Castorena M. 2014. Universal hydraulics of the flowering plants: Vessel diameter scales with stem length across angiosperm lineages, habits and climates. Ecol. Letters 17: 988–997.
Pelletier G & Pitt DG. 2008. Silvicultural responses of two spruce plantations to midrotation commercial thinning in New Brunswick. Can. J. For. Res. 38: 851–867.
Sanio K. 1872. Über die Grösse der Holzzellen bei der gemeinen Kiefer (Pinus sylvestris). Jahrb. Wiss. Bot. 8: 401–420.
Savage VM, Bentley LP, Enquist BJ, Sperry JS, Smith DD, Reich PB & Von Allmen EI. 2010. Hydraulic trade-offs and space filling enable better predictions of vascular structure and function in plants. Proceedings of the National Academy of Sciences of the United States of America 107 (52): 22722–22727.
Savidge R. 2001. Intrinsic regulation of cambial growth. J. Plant Growth Regulation 20: 52–77.
Taylor FW, Wang EIC, Yanchuk A & Micko MM. 1982. Specific gravity and tracheid length variation of white spruce in Alberta. Can. J. For. Res., 12: 561–566.
Vaganov EA, Hughes MK & Shashkin AV. 2006. Growth dynamics of conifer tree rings: Images of past and future environments. Springer, Germany.

207Mvolo et al. – Prediction of tracheid size
Wang EIC & Micko MM. 1984. Wood quality of white spruce from north central Alberta. Can. J. For. Res. 14: 181–185.
West GB, Brown JH & Enquist BJ. 1999. A general model for the structure and allometry of plant vascular systems. Nature 400 (6745): 664–667.
Yang KC. 1994. Impact of spacing on width and basal area of juvenile and mature wood in Picea mariana and Picea glauca. Wood Fiber Sci. 26: 479–488.
Zobel BJ & Sprague JR. 1998. Juvenile wood in forest trees. Springer Series in Wood Science, Springer Verlag, Berlin.
Zobel BJ & Van Buijtenen JP. 1989. Wood variation: its causes and control. Springer Series in Wood Science, Springer Verlag, Berlin.
Accepted: 26 November 2014


![A close-up view of wood structure and properties across a growth ring of Norway spruce ( Picea abies [L] Karst](https://static.fdokumen.com/doc/165x107/6314ef2c3ed465f0570b5bd7/a-close-up-view-of-wood-structure-and-properties-across-a-growth-ring-of-norway.jpg)


![Chloroplastic Carbon Dioxide Concentration in Norway Spruce (Picea Abies [L.] Karst.) needles relates to the position within the crown](https://static.fdokumen.com/doc/165x107/631ef1b43fc9485968098d5d/chloroplastic-carbon-dioxide-concentration-in-norway-spruce-picea-abies-l-karst.jpg)