Resistance to galling adelgids varies among families of Engelmann spruce (Picea engelmani P
10
I I e 'IbMLlN RS., BORDW J.H., 1997. Multicmponent index for evaluating mistma by Sitka spruce lo LC white pine weevil (Coleoptera: Curculionidac). J. Econ Enrod. 90.704-714. Resistance to galling adelgids varies among families of Engelmann spruce (Picea engelmani P.) WILLIAM J. MATTSON', ALVIN YANCHUK', GYULA KISS', BRUCE BIRR' , ' Forestry Sciences Laboratory, North Central Forest Research Sfatlon , 5985 Nlghway K, Rhlnelander, WI 5450 1 'Reseamh Branch, British Columbla Ministry of Forests , 1450 Government Stmet, Vlctorfa, B.C., Canada VBW 3E7 'Kalamalke Research StatEon, Brftlsh Columbia Minlstty of Fomsts 340 1 Resemlr Road, Vernon, B.C., V1B 2C7 RESUME Cootey gall adelgids, Adelges cooleyi, and round gall adelgids, Adelges abietis, differentially infested 11 0 half-sib families of Engelmann spruce, Plcea engelmannilat 9 study sites in British Columbia. There was a negative genetic correlation (-0.53) between the infestations of the two gall-fonlng specles. Cooley gall abundance exhibited a negative genetic correlation (-0.66) with tree growth, whereas round gall abundance exhibited a positive genetic correlation (0.79) with growth. Heritability (h') of resistance against the adelgids averaged about 0.60 for Cooley galls and 0.20 for round galls ACHOWLEDGEMENTS The authors thank Pamela Cheers for editing the text and Diane Paqud for her word processing work. Physiology end Genetkv ol Tme-Phptqdiage /n/ereclions Oulnn (Fr~nco), August 31 - September 6, 1997 Ed. INRA, Paris, 1999 (Lss Cdloques, n.90) NC-4501302 VMPR RBAIS: 1.713 . No Reprints Available INTRODUCTION World-wide, there are 30 species of spruce (Picea spp: Pinaceae) which sewe as the primary host for the majority of the 49 or so specles of primitive aphids in the famlly Adelgidae (Carter 1971, Ghosh 1983). Each adelgid species typically causes a uniquely shaped gall to form on the developing shoots of susceptible spruces. Such
Transcript of Resistance to galling adelgids varies among families of Engelmann spruce (Picea engelmani P

I
I
e
'IbMLlN RS., BORDW J.H., 1997. Multicmponent index for evaluating mistma by Sitka spruce lo LC white
pine weevil (Coleoptera: Curculionidac). J. Econ E n r o d . 90.704-714.
Resistance to galling adelgids varies among families of Engelmann spruce (Picea engelmani P.)
WILLIAM J. MATTSON', ALVIN YANCHUK', GYULA KISS', BRUCE BIRR' ,
' Forestry Sciences Laboratory, North Central Forest Research Sfatlon , 5985 Nlghway K, Rhlnelander, WI 5450 1 'Reseamh Branch, British Columbla Ministry of Forests , 1450 Government Stmet, Vlctorfa, B.C., Canada VBW 3E7 'Kalamalke Research StatEon, Brftlsh Columbia Minlstty of Fomsts 340 1 R esemlr Road, Vernon, B.C., V1B 2C7
RESUME
Cootey gall adelgids, Adelges cooleyi, and round gall adelgids, Adelges abietis,
differentially infested 11 0 half-sib families of Engelmann spruce, Plcea engelmannil at
9 study sites in British Columbia. There was a negative genetic correlation (-0.53)
between the infestations of the two gall-fonlng specles. Cooley gall abundance
exhibited a negative genetic correlation (-0.66) with tree growth, whereas round gall
abundance exhibited a positive genetic correlation (0.79) with growth. Heritability (h')
of resistance against the adelgids averaged about 0.60 for Cooley galls and 0.20 for
round galls
ACHOWLEDGEMENTS
The authors thank Pamela Cheers for editing the text and Diane Paqud for her word
processing work.
Physiology end Genetkv ol Tme-Phptqdiage /n/ereclions Oulnn (Fr~nco), August 31 - September 6, 1997 Ed. INRA, Paris, 1999 (Lss Cdloques, n.90)
NC-4501302 VMPR RBAIS: 1 . 7 1 3
. No R e p r i n t s A v a i l a b l e
INTRODUCTION
World-wide, there are 30 species of spruce (Picea spp: Pinaceae) which sewe
as the primary host for the majority of the 49 or so specles of primitive aphids in the
famlly Adelgidae (Carter 1971, Ghosh 1983). Each adelgid species typically causes
a uniquely shaped gall to form on the developing shoots of susceptible spruces. Such

galls can persist on the affected trees for many years depending on the species of gall-
maker and the species and environment of the host spruce, thereby leaving a useful
index to a tree's general resistance. For example, in undisturbed plantations in northern
Minnesota, we have found galls that were formed as long as 30 years earlier (Mattson
et al. 1994).
Usually, the impact of adelgids on tree growth and survival appears
inconsequential. But, to be sure, no one has ever measured their long-term impacts on
bud demography. Cooley galls, caused by Adelges cooleyl, for example, typically kill
their subjugated shoots. Round galls caused by A. abiells and A. lariciafus, on the other
hand, do not kill the shoot but allow it to grow in an apparently substandard manner.
Ragged spruce galls caused by Pineus sirnilis can cause hormonal imbalances in
young seedling stems, triggering a cork-screw growth-habit that predisposes them to
snow damage. In rare cases, some highly susceptible lndivldual trees have nearly all
of their shoots attacked by adelgids and consequently are rendered uncompetitive and
eventually die (Mattson, pers. obs). In western North America where there are 15
species of adelglds, it is not uncommon to find galls from as many as 4 species on the
same host plant, as is h e case for Engelmann spruce, P. engelmannii, Sitka spruce,
P. siichensis, while spruce, P. glauca, and the vast hybrld swarm called interior spruce
(mostly P. engelmsnnii x glauca) in interior British Columbia.
Numerous field studies in Europe and North America have reported substantive,
consistent differences among individual trees in their resistance to the galling adelgids
(e.g. see Mattson et al. 1994, Mattson et al. 1998). thereby implying that resistance has
an important genetic component to it. For example, Mattson el al. (1 998) estimated that
broad sense heritability (H') of resistance against Adelges abiefis was about 0.86 (the
theoretical maximum'being 1.0), using one clonal orchard of Picea abies in the southem
Paris basin. Of course, such limited studies (i.e. one -population. of trees, one
environment, one population of aphids) give but only a glimpse of the possible genetic
bases of spruce resislance to adelgids.
This study was undertaken to further basic understanding about the genetics of
spruce resistance to insects. Specifically, we investigated the hypothesis that there is
substantive family level variation in Engelmann spruce resistance to two common,
shoot-galling adelgids: the nalive, Cooley spruce gall aphid, A. cooleyi, and the
introduced (from Eurasia), round spruce gall aphid, A. abietis, both of which produce
very distinctive galls (Rose and Lindquist 1977). We also investigated the heritability
(h') of such resistance and tested for genetic correlations between plant resistance to
the two species of adelgids and between tree growth and resistance. We predicted that
(a) tree resistance to one adelgid species would be positively correlated with resistance
to the second adelgid owing to trees employing the same or very similar resistance
mechanisms against both species, and (b) tree resistance and growth would be
positively correlated because the most likely mechanisms of resistance would be rapid
inducible defenses, such as strong and swift hypersensitive reactions, that are
dependent on vigorous growth (Herms and Mallson 1992, 1997).
METHODS
This study was overlaid on a genetic trial utilizing 110 half-sib Engelmann spruce
families originating from the east Kootenay region in S.E. British Columbia. Families
were planted in linear, 10 tree plots, replicated in 2-3 blocks at each of 9 different, widely
separated geographic sites. Trees were about 15 years of age, and ranged in height
from 2-5 m in September 1994 when measurements were made. The first 5 living trees
of all families in each replicate were scored for numbers of Cooley and round galls by
a pair of forestry technicians. Each tree was examined (one person on each side) for
two, 30-second intervals (using a timer) during which Cooley galls were counted, and
then round galls counted. Such a brief inspection period was sufficient to provide a
reliable difference among differently infested trees. For example, there was a strong
linear regression relationship (p < 0.01, 1 = 50-75% between such 30 second counts
by forestry technicians and one minute counts (virtually 100% censuses) done on the
same trees by two highly experienced gall workers (wjm 8 bab). Usually, the 30 second
counts allowed the measurement of nearly all of the galls on lightly infested trees, and
at least one-third to one half of them on the heavily infested trees. Tree heights (cm)
and tree diameters (mm) were likewise measured at the same time. The round galls
were initiated primarily by A. abiefis, but there may also have been a small fraction of

64
*
superficially similar roung galls caused by A. ladciatus, though its distribution in S.E..
British Columbia is not well substantiated. Because over 11,000 trees were to be
examined, it was not economically feasible to attempt to definitively segregate these two
RESULTS and DISCUSSION
Variation among sites and families
species of round gall makers, if Indeed they occurred together. Therefore, h e round Cooley galls were common at all 9 sites, but as expected, the\[ abundance
gall counts may represent cumulative infestations of two species of adelgids. Due to differed substantially and significantly among siles (Tables 1.2). For example, (hey
mlsundemtandings, the whole tree gall C O U ~ ~ S Were converted to a tlumefical index, and averaged about 7 galldtree at the least infested site, and 31 gallsftree at the most
recorded as infestation classes: 0=0, 1 =I-1 0, 2=11-20, 3=21-30, 4=31-40, 5=4l -99 infested site. Analyses of variance confirmed that there were also substantive.
galls.
For statistical analyses and tests, we used the numerical indices directly, but
furthermore we converted them back into a semblance of the original data by using a
random number generator to pick a gall number within the appropriate numerical range
coveredby the index assigned to a tree. All such generated numbers (x) were then
converted to their log, (x+l) equivalent for meeting the assumptions of ANOVA. We
used two ANOVA models. One was for analyzing separately each geographic locale
or site: X,= p + F, + R, + FP, + e,, where F is family, R is replicate, and FR are family
by replicate interaction effects, e is residual error among indlvlduals. The second was
for analyzing the pooled data set across all sites: X, = p + S, + R, (S,) + F, + FISk + F,
R, (S.) + em, where S is site. Because of computatlonal overload problems with an
unbalanced design arising from missing observations, the pooled data set was
manipulated to create a perfectly balanced data set conslstlng of 82 families and three
individual trees per replicate (2) at all study sites. Hence, those statistics for the pooled
study refer to this reduced data set, and consist o l the class counts for galls. Statistics
shown for the individual sites are based on the full set of 110 families, all replicates, and
all individual trees, but using the random counts. In every ANOVA, all effects were
considered random effects. To estimate the magnludes of genetic correlations (rJ, and
narrow-sense, individual heritabilities (h'), we computed the variance components for
the main effects, and their interactions, and then followed standard estimation protocols
(Becker 1984, Falconer 1989, Kiss and Yanchuck 1991, Stonecypher 1992).
- - 1
significant (pe.001) differences among half-sib families (F) in their resistance to A.
coolevi at all 9 sites. According lo a variance components analysis on !he overall model
testing all of the sites together, lamily effecls accounted for 8.6 % of the total variation
(Table 2). At the most heavily infested sites, the majority (>75 percent) of families were
in middle to high range infestation classes, i.e. medium to light-heavy infestalion
classes. Only very few families were in the extremes, i.e. in very light and very heavy
infestation categories. This implies that nearly all families are moderately to highly
susceptible to A. cooleyj.
Round galls were much less common than Cooley galls at 6 of the 9 sltes, but
at 3 sites they were equally abundant (Tables 1.2). At the least infested location, round
galls averaged about 2/tree, whereas at the most infested location they averaged about
34ltree. Analyses of variance revealed that there were highly signilicant family effects
(p < .001) on round gall numbersltree at all 9 sites. According to a variance components
analysis on the overall model, family effects accounted for 2.4% of the total variation
(Table 2). At the most heavily infested siles, the majority of spruce half-sib families fell
into the medium and heavy infestation classes. As was the case for Cooley gall
susceplibility, only few families fell into the very light and very heavy infestation classes.
Thus, almost all families are moderately to highly susceptible to !he round gall adelgids.
Tree size effects on galling
Because larger trees have larger canopies and offer more potential growing
points for adelgid infestations, and families varled significantly in growth rates, we
plotted mean galldlreelfamily against family diameter (d.b.h.) and height to search for
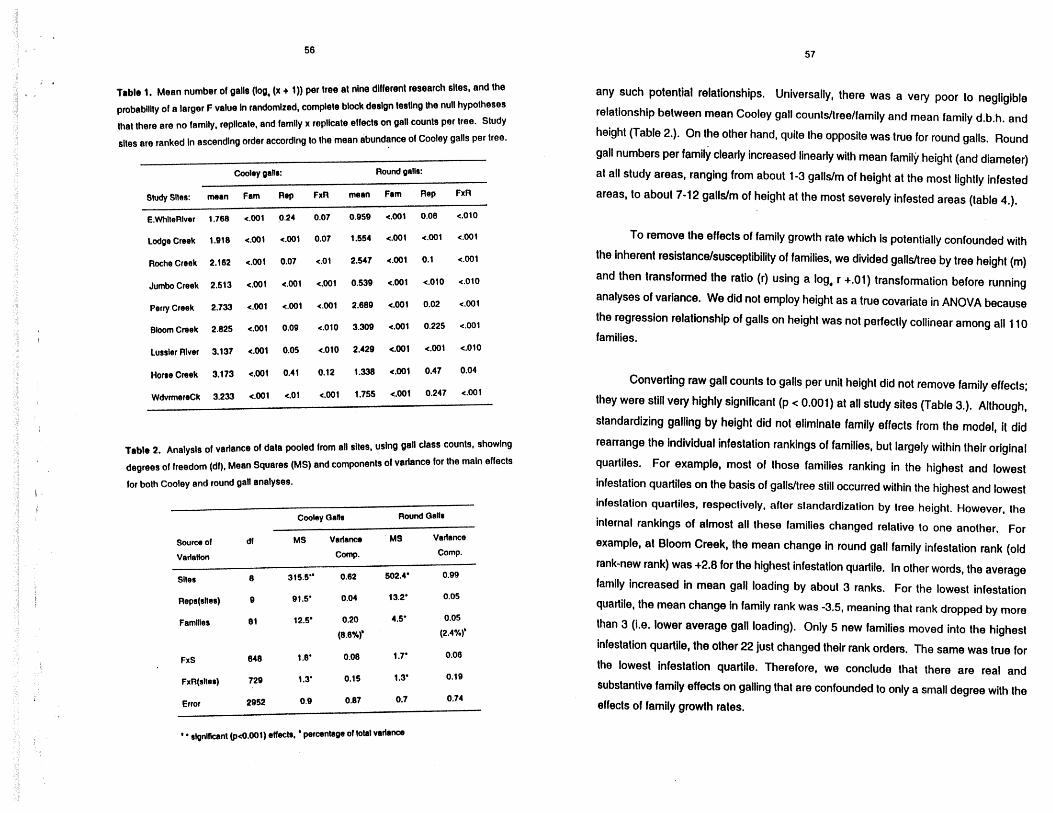
Trblr 1. Mean number of galls (log, (x + 1)) per tree at nine different research slles, and the
pmbablllty of a larger F value In randomized, complete black deslgn tesNng Me null hypolheses
that there are no family, repllcale, and family x replicate effects on gall counts per tree. Study
sltes are ranked In ascending order according to the mean abundance of Cooley galls per tree.
Cooky gallr: Round galls:
Study Sltes: mean Fam Rep FxR mean Fam Rep FxR
E.WhlteREvsr 1,768 e.001 0.24 0.07 0.959 c.001 0.06 e.010
Lodge Creek 1,818 e.001 e.001 0.07 1.554 c.001 c.001 e.001
Roche Creek 2.162 e.001 0.07 e.01 2.547 e.001 0.1 <.001
JumboCreek 2.613 e.001 r1.001 401 0.539 c.001 e.010 e.010
PerryCreek 2.733 e.001 c.001 e.001 2.689 e.001 0.02 e.001
Hone Creek 3.173 e.001 0.41 0.12 1.338 <.001 0.47 0.04
WdwmereCk 3.233 e.001 c.01 e.001 1.755 4.001 0.247 e.001
Table 2. Analysls of variance of data pooled from all sibs, uslng gal class counts, showing
degrees of freedom (dl). Mean Squares (MS) and components of variance for the main effects
lor both Cooley and round gal analyses.
Cooley OaHs Round GaIlr
Saum of dl MS Varfsn~, MS Vadance Vertetion COW. Comp.
Sltss 8 315.5'" 0.62 S02.4' 0.99
FxS
Error 2952 0.9 0.87 0.7 0.74
' ' slgnlfknnt (pc0.001) effecls, * percentage of total variance
any such potential relationships. Universally, there was a vety poor to negligible
relationship between mean Cooley gall counts/treelfamily and mean family d.b.h. and
height (Table 2.). On the other hand, quite the opposite was true for round galls. Round
gall numbers per family clearly increased linearly with mean family height (and diameter)
at all study areas, ranging from about 1-3 gallslm of height at the most lightly infested
areas, to about 7-12 galldm of height at the most severely infested areas (table 4.).
To remove the effects of family growth rate which is potentially confounded with
the inherent resistance/susceptibility of families, we divided galldtree by tree height (m)
and then transformed the ratio (r) using a log, r +.01) transformation before running
analyses of variance. We did not employ height as a true covariate in ANOVA because
the regression relationship of galls on height was not perfectly collinear among all 1 10
families.
Converting raw gall counts to galls per unit height did not remove family effects;
they were still vety highly significant (p < 0.001) at all study sites (Table 3.). Although,
standardizing galling by height did not eliminate famlly effects from the model, il did
rearrange the individual infestation rankings of families, but largely within their original
quartiles. For example, most of those families ranking in the highest and lowest
infestation quartiles on the basis of gallsllree still occurred within the highest and lowest
infestation quartiles, respectively, after slandardization by tree heighl. However, the
internal rankings of almost all these families changed relative to one another. For
example, at Bloom Creek. the mean change in round gall family infestation rank (old
rank-new rank) was +2.8 for the highest infestation quartile. In other words, the average
family increased in mean gall loading by about 3 ranks. For the lowest infestation
quartile. the mean change in family rank was -3.5, meaning lhat rank dropped by more
than 3 (i.e. lower average gall loading). Only 5 new families moved into the highest
infestation quartile, the other 22 just changed their rank orders. The same was true for
the lowest infestation quartile. Therefore, we conclude that there are real and
substantive family effects on galling that are confounded to only a small degree with the
effects of family growth rates.

Table 3. Statistics lor linear regressions of mean Cooley and round pall nrunt~ree/famlly
versus mean lamlly tree helght (cm) at each of 8 sludy areas. If zero occurs In the slope
columns, slopes are not slgnl f lmn~ fmm different from zero. Othemise, elopes are slgnlficantly
(p < .05) larger than zero. Each regression Is based on2 216 obsew%tlons.
Cooley gals: Roue gals:
Study Sltes 5- r" fitopa r'
BbomC& 4.0443 0.05 . 0,0954 0.17
Tttble 4. Mean number ot log, (galYmMer of tree helphl* 0.0 1) at dne dWennt research sltes.
and the probablllv of a larger F value In randomized, complete block deslgn testing the null
hypotheses lhal there are no lamlly, replicate, and family x repllcate effects on gall per unit of
helght per tree. Study sltes are ranked in ascending order according to the mean abundance
ol Cooley galls per tree.
Study Cooley galls: Round galls:
Sites: mean Fam Rep FxR mean Fam Rep FxR
E.WhlteRlver -0.018 e.OO1 0.09 0.03 -2.002 e.OO1 0.04 e.OO1
Lodge Creek 0.199 e.00f e.OO1 0.018 4.592 e.001 e.001 c.001
JumboCreek 1.003 e.001 c.001 c.010 -3.217 c.001 e.001 c.010
Peny Creek 1.006 e.001 e.001 c.001 0,954 4 0 1 0.03 e.001
Lussier Rivet 1.887 e.001 0.06 e.010 0.857 4 0 1 c.002 c.030
HoneCreek 1.839 e.001 0.31 0.49 -1,132 e.001 0.55 0.010
Genetlc correlations between galling and tree growth
To investigate possible genetic relationships between gall inlesletlons and tree
growth rates, we calculated the genetic correlations (r9) between Cooley and round gall
infestations and height. at each of the nine study sites, and on the entire, pooled data
set (Table 5). In the case of Cooley galls, all correlatlons were negative, ranging In value
from -0.02 to -.0.79. The pooled data set gave rv = -0.21. The consistent assoclatlon
implies that the tree's traits for fast growth and resistance lo Cooley gall aphids are
positively linked, as might be the case if resistance depended on rapid inducible
Table 5. Genetic mnslatkms (rJ between adelgld gall hfeslalbm and tree gm* (helghtJ, and
between Cwley (C) and round (R) galls levels per tree, and estimates of the heritability (h) of
resistance against adelgldr using two measures of infeslallon. gall nohree and gall no.fm at
each of 8 study altes in British Columbia. Each estimate In the table Is based upon
measurements on approximately 1000-2000 trees, except lor the pooled sites.
Gemtk correlallons: Heritablllty (h') estimates: Study Sites C,geNs R.qsls RsellaYsC.aalls C.galls R.galls C.galls R.gslls
vs vs no. Per no. per
helght blght nohree noJm lree tree noJm nolm
Bbom Creek -0.79 0.36 -0.51 -0.31 1.0+ 0.41 1.0+ 0.17
E. While River -0.49 1.0+ -0.54 -0.71 0.34 0.13 0.44 0.09
Horse Creek -0.28 1.0+ 0.03 -0.59 0.35 0.26 0.44 0.1 1
Jumbo Creek -0.42 0.84 -0.49 -0.61 0.32 0.26 0.39 0.21
Lodge Creek -1.0+ 0.62 -1.0+ -1.0+ 0.28 0.05 0.32 0.00
tussler River 5.37 0.84 -0.48 -0.69 0.95 0.51 1.0+ 0.26
Perryereek -0.61 1.0+ -0.33 -0.69 0.83 0.12 0.85 0.00
RocheCreek -0.02 0.84 0.19 0.38 0.78 0.17 0.84 0.09
Wdvmre -0.55 0.74 -0.93 -0.85 0.69 0.18 1.0+ 0.11
Creek
1 n.a. not available, because analysis was not done for the particular variable of concern.

defenses (such as hypersensitive reactions) which are swiftest and strongest in
vigorously growing tlssues. On the other hand, for round galls quite the opposite was
found. All correlations were positive, ranging from 0.36 to 0.84. The pooled r, estimate
was 0.92. E3ecause round and Cooley gall resistance have different relationships to tree
growlh, it implies that the resistance mechanisms against them are different.
Correlstlone Between Cooley and round gall adelgld8
To obtain a synoptic view of famlly resistance to both Cooley and round gall
adelgids, we ranked each spruce famlly according lo its percent departure from the
grand mean resistance level of all 110 families at each of the 9 study sites. For
example, at each locale, every family was rescaled for the two gall types using the
following formula: (,m, gall, mean-local gall grand mean)/local gall, grand mean x 100,
where means are from log, (x+l) data. These new variables, percent deviations, were
then used in a randomized block ANOVA, with study areas treated as blocks, to test
again for family differences,
As before, there were hlghly slgnlficant (p <0.001) family effects on the rescaled
measures of resistance to galling. To demonstrate the fammes' resistance relationships
to both Cooley and round gall adelgids, we plotted mean round gall rank against mean
Cooley gall rank for all 110 families (Figure 1). The result was an obvious left to right
sloping scatlergram. Such a pattern implies a negative genetk correlation between the
resistance traits for these two adelgids. Sixty-eight percent of the families fell into the
upper left (27 percent) and lower right (41 percent) quadrants of the graph. Only a
meager 11 percent of the families occurred in the lower left quadrant where
susceptibility to both species of adelgids is below the grand mean. Therefore, typically.
when one resistance trait Is high, then the olher is low, and vice versa. Contrary to this
trend, only one family, 1-126, had substantially low levels of both adelgids: its
infestations were on average 23 percent below the grand mean for Cooley galls, and 32
percent below the grand mean for round galls. At the other contrary extreme, family f-
80, had \he highest combined level of both adelgids: its infestations were on average
about 20, and 23 percent higher than the respective grand means for Cooley and round
galls.
(. Family 7 6
t high-high I
Coolsy gall--devlatlon from grand mean (%)
Flgure 1. Plot showlng the mean round and Cooley gall Infestalbn ranks of each of 1 10 spwce
lamilies. using a larnity's average percent deviation from Vle grand mean round and Cooley gal
Infestation level of all Ireos, at each of 9 study sites, In other words, each point is Ihe mean ol
9 individual devlallons measurements for a single famlly, showing its tendency lo be higher, or
lower than others with respecl to infestations by round and Cooley gall adelgids. For example.
Family 126 Is Identified In the bwer kfl (low-low) quadrant, exhibiting bebw average levels of
both gelling adelglds.
Genetlc correlations between Cooley and round gall lnfeslations
Using the log, (x+l) gall counts, we found that there were negative genetic
correlations (-0.33 to -0.93) between Cooley and round gall infestalions per tree at 7 of
9 sites (Table 5). At 2 sites {he correlalions were near zero or positive (0.03 and 0.19).
Using the entire data (all sites) set in the pooled model gave a substantial, negative
genetic correlation of -0.53.
Estimating heritabilities of reslstance to edefgfds
Heritability estimates depend on the environment in which they are measured.
Ihe particular genetic structure of the populations, and a bevy of other factors.
Therefore, we computed herilabilily eslimates for each of the 9 study locales, realizing
that insect population size and ils genetic structure may vary substanlially among them.

For Cooley adelglds, h' values ranged from 0.28-0.95 wilh one estimate exceeding 1.0,
owing to estimation errors (Yable 5). The pooled estlmate and i s standard error over all
sites was 0.61 5 0.1 1.
For round gall adelglds, he values ranged from 0.05-0.51 (Table 5). The pooled
estlmate and its standard error over all sites was 0.20 & 0.05.
Because each heritability estimate was usually based on about 1000 individual
tree measurements, derived from 110 families, the precision of the estimates are reasonably good. For example, the sampling variances of h2 estimates are
approximately 32 x ht/lOOO (Falconer 1989), and thus its standard errors are
approximately (sqrt (32 x h')) 1 1000. Although we only calculated standard errors for
the overall h' estimates (after Becker 1984), it is evident that heritabllities were
significantly larger than zero.
would make breeding for resistance against both insects more difficult as very few
genotypes would be segregating for positive attributes for all three traits (1.e.. growth and
Cooley and round gall adelgid resistance ). ,
*
Adjustments to the data lo accounl for differenlial attack among large and small
trees, suggested that tree size per se does not largely change the probability that a tree
will be attacked and that family pedigree Is more important. Ideally one should know the
impact of galling aphids on tree growth which would then permit an assessment of the
benefit of developing lines of trees resistant to gall forming adelgids. Unfortunately,
nothing is really known about the impact of such gall formers on tree survival and
growth.
Understanding of the genetics of tree resistance lo phytophagous insects is in its
infancy. More research is clearly needed in order to be able to effectively employ
natural mechanisms of plant resistance against potential tree pests.
CONCLUSIONS
REFERENCES
Heritability estimates varied widely across individual sites, but the overall
estimates confirmed that h' was substantially larger ( -0.6) for Cooley galls, than for
round galls (-0.2). This may suggest lhat there is more genetic variation present for
Cooley gall resistance, but the lower level of attack by round gall adelgids may have
caused the heritability estimates to be less than those for Cooley gall resistance. Not
surprisingly, for both gall adelglds there was a tendency for the highest heritability
estimates to be linked to the sites with highest insect densities, as has been observed
elsewhere by Strong el el. (1 993) for a cecidomyiid leaf-galling fly on willow, spp
In Sweden.
Nevedheless, these values Indicate there are good levels of genetic variation in
reslstance to both gall-forming Insects on Interior spruce, and breeding for resistance
would be possible. However, relationships between height growth and resistance to both
gall forming insects were quite different. Cooley gall abundance was negatively
correlated wilh height growth which suggests faster growing families are more resistant.
Whereas, for round gall adelgids, faster growing famllies are more susceptible. This
BECKER W.A., 1984. Manual of quanIitalive genetics, Wash, State Unlv, Press, Pullman. CARTER C.I., 1971. Conifer woolly aphids (Adelgldae) In Britaln. Foresfv Comm. BUN. 42: 1-4 1 FALCONER D.S., 1989. Infmdmfbn to quanfilative genelks. John Wiley, N.Y., 438 pp. Gtiosti A.K., 1983. A review of the family Adelgidae from the Indian subregion ( Homoplera: Aphidoidea).
Orienfal Insects 17: 2-29. HEUMS D.A. and MATTSON W.J., 1992. The dilemma of plants: to grow or defond. Quad. Rev. Biot 67:
283-335. HERMS D.A., and M A ~ W.J.. 1997. Trees, stress, end pests, pp. 13-25. In: Plan! health cam for wody
arnrrmenlals,. Unlv. Ill. Coop. Ext. Sawlce, U&ana-Champaign, 223 p. KISS Q.K. and YANCW A.D., 1991. Preliminary evaluation of genetk control of weevil resistance of Interfor
spruce in British Colombia. Can J. For. Res. 21: 230-234. MATTSON W.J., BIRR B.A.. and IAWUENCE R.K.. 1994. Variation In the susceptibility of North Amerkan white
spruce populallons to the gall-krming adelgid, Adelges abielis (Homoplera: Adelgidae) pp. 135-147, In Price, P., Mattson, W.J., and Baranchlkov, Y, (eds.) The ecology and evolution of
gall-fomlng Insects. USDA Forest Sew. GTR NC-174, St. Paul, Mn., 222 p. Mrcnsm W.J. LEVIEUX J., and PIOU D., 1998. Genetk and environmental contributions to variation In the
resistance of Pkea abhs to the gall-tormlng adelgid, Adejges abietis (Homoplera: Adelgidae). pp. 304-315, In Csoka, G.. Mattson. W.J.. Stone. G.N.. and Price. P.W. (eds.) The biology of gall- forming arfhmpods, USDA For. Sew. GTR NC-199, St. Paul, Mn 303 p.

ROSE A.H. and. CIND~VIST, O.H., 1977. Insects of eastem spruces, flr, and hemlock. For. Tech. Rept. 23, Ministry of Supply and Servkes, Ottawa, 167 pp.
S~floFIa D.R., LARSSON S. and QULL~ER~ U., 1993. Heritability of host plant resistance to herbivory changes with gallmfdge density during an outbreak on willow.. Evolution 47: 291-300.
S~mEcvrnefl R.W., 1992, Computational methods, pp, 195-228, in Fins, L., Friedman, S.T., and Brotschol, J.V..(eds.) Hendbook of quanfiteflve forest genefks. Kiuwer Academlc Publishers, London. 403 p.

Physiology and Genetics of Tree-Phytophage Interactions
International Symposium
Gujan (France) August 31 - September 5, 1997

Physiology and Genetics of Tree-Phytophage Interactions
International Symposium
Gujan (France), August 31 - September 5, 1997
organized by lnstitut National de la Recherche Agronomique (INRA)
International Union of Forestry Research Organizations (IUFRO)
INSTITUT NATIONAL DE LA RECHERCHE AGRONOMIQUE \ .
147, rue de I'Universite - 75338 Paris Cedex 07


![A close-up view of wood structure and properties across a growth ring of Norway spruce ( Picea abies [L] Karst](https://static.fdokumen.com/doc/165x107/6314ef2c3ed465f0570b5bd7/a-close-up-view-of-wood-structure-and-properties-across-a-growth-ring-of-norway.jpg)