Metabolic Influences Modulating Erythrocyte Deformability ...
Upload
kemri-wellcomeCategory
view
1download
0
Expression of Plasmodium falciparum genes involved inerythrocyte invasion varies among isolates cultured directlyfrom patients
Susana Nerya, Anne-Marie Deansb, Moses Mosoboc, Kevin Marshc, J. Alexandra Roweb,and David J. Conwaya,d,*
aDepartment of Infectious and Tropical Diseases, London School of Hygiene and TropicalMedicine, Keppel Street, London WC1E 7HT, United KingdombInstitute of Immunology and Infection Research, School of Biological Sciences, University ofEdinburgh, Kings Buildings, West Mains Road, Edinburgh EH9 3JT, United KingdomcWellcome Trust Research Laboratories, Kenya Medical Research Institute, Kilifi, KenyadMedical Research Council Laboratories, Fajara, P.O. Box 273, Banjul, Gambia
AbstractPlasmodium falciparum merozoites invade erythrocytes using a range of alternative ligands thatincludes erythrocyte binding antigenic proteins (EBAs) and reticulocyte binding proteinhomologues (Rh). Variation in the expression of some of these genes among culture-adaptedparasite lines correlates with the use of different erythrocyte receptors. Here, expression profiles offour Rh genes and eba175 are analysed in a sample of 42 isolates cultured from malaria patients inKenya. The profiles cluster into distinct groups, largely because of very strong negativecorrelations between the levels of expression of particular gene pairs (Rh1 versus Rh2b, eba175versus Rh2b, and eba175 versus Rh4), previously associated with alternative invasion pathways inculture-adapted parasite lines. High levels of eba175 are seen in isolates in expression profilegroup I, and may be associated with sialic acid-dependent invasion. Groups II and III are,respectively, characterized by high levels of Rh2b and Rh4, and are more likely to be associatedwith sialic acid-independent invasion.
KeywordsMalaria; Ligand; Gene expression; Reticulocyte binding protein homologues (Rh); Erythrocytebinding antigens (EBA); Clinical isolates
1. IntroductionAnalyses of culture-adapted lines of Plasmodium falciparum have revealed several differentreceptor–ligand interactions mediating alternative pathways of erythrocyte invasion bymerozoites [1,2]. The importance of several erythrocyte binding antigens (EBA) andreticulocyte binding protein homologues (Rh) has been demonstrated by parasite gene knockout studies and invasion assays using erythrocytes treated with enzymes that cleave differentreceptors [3-9]. In the development of blood stage parasites, gene transcript and proteinsynthesis of these molecules is highly specific to late stage schizonts [10,11]. There are
© 2006 Elsevier B.V. All rights reserved.*Corresponding author. Tel.: +220 449 5917; fax: +220 449 6513. [email protected] (D.J. Conway). .
Europe PMC Funders GroupAuthor ManuscriptMol Biochem Parasitol. Author manuscript; available in PMC 2010 May 27.
Published in final edited form as:Mol Biochem Parasitol. 2006 October ; 149(2): 208–215. doi:10.1016/j.molbiopara.2006.05.014.
Europe PM
C Funders A
uthor Manuscripts
Europe PM
C Funders A
uthor Manuscripts

differences among laboratory lines of P. falciparum in the levels of expression of Rhproteins [6,9,12], and some of these appear to be associated with use of different erythrocytereceptors in merozoite invasion. For example, parasite lines that express high levels of Rh1tend to express low or undetectable levels of Rh2a and Rh2b and have a sialic acid-dependent mechanism of invasion, whereas parasites expressing less Rh1 are more likely toexpress Rh2a and Rh2b and undergo a sialic acid-independent invasion [6,9].
Although the invasion phenotype appears to be a stable property of most parasite clonallines in culture, switching of invasion phenotype has been shown to occur in the Dd2/W2mef clone [13] and more recently in the CSL2 clone [8]. In these lines, a switch ofinvasion phenotype from sialic acid dependent to independent can be selected by culturingin neuraminidase-treated erythrocytes, and involves increased transcription of Rh4 [8,14].Disruption of the eba175 gene by transfection also causes a switch to sialic acid independentinvasion and upregulation of Rh4 transcription [8]. However, a comparison of four parasitelines that do not undergo switching indicated that variation in the level of Rh4 genetranscription was unrelated to the sialic acid dependence of the lines [14].
Field isolates of P. falciparum have a range of phenotypes similar to that of diverse culture-adapted lines [15-17], but gene expression patterns have not been investigated. As selectionamong parasites occurs during growth in laboratory culture, and some clones can switchtheir expression profile, it is important to know the nature of variation among parasites inhumans. As a survey of the variation in gene expression that occurs within a single P.falciparum endemic population, the ex vivo generation of parasites in 42 blood samplesfrom malaria patients in Kenya were grown to schizont stage in short term culture, andrelative levels of transcripts of the different protein coding Rh genes and eba175 wereassayed. The transcript profiles clustered into distinct groups, and there were strong negativecorrelations among the isolates in the expression of particular pairs of genes. There were nodetected differences in genomic copy numbers of any of the genes, indicating that theprofiles are under transcriptional control. A subsequent preliminary analysis of two otherprotein coding eba genes in a subset of the isolates indicated less variation in relativetranscript levels than for eba175.
2. Materials and methods2.1. Blood samples and parasite culture
A total of 42 blood samples from children presenting with P. falciparum infections of >1%parasitaemia at Kilifi District Hospital were cultured for between 24 and 36 h to schizontstage of development. Sixteen of these were cultured fresh upon collection, from patientsthat presented during two consecutive rainy seasons (5 during December 2003–January2004, and 11 during June–August 2004), and 26 had been cryopreserved upon collectionseveral years previously (from 1994 to 1996) and were thawed for culture (during June–August 2004). Cases of severe malaria that were admitted to the pediatric ward withunrousable coma (Blantyre score ≤2), prostration (inability to sit or to breast feed) orrespiratory distress (abnormally deep breathing) accounted for 22 of the isolates (12 in1994–1996, 10 in 2003–2004). The other 20 isolates were from patients with uncomplicatedmild clinical malaria attending the Outpatients Department (14 in 1994–1996, 6 in 2003–2004).
Erythrocytes in heparinised blood from the patients were separated from lymphocytes andbuffy coat by Lymphoprep™ density gradient centrifugation, washed and cultured at 2.5%haematocrit in RPMI complete medium until schizont stage of development in 3% CO2, 1%O2, and 96% N2 at 37 °C. Packed volume varied between 50 and 300 μl depending onavailability of volumes within samples being shared with other studies. For DNA analysis,
Nery et al. Page 2
Mol Biochem Parasitol. Author manuscript; available in PMC 2010 May 27.
Europe PM
C Funders A
uthor Manuscripts
Europe PM
C Funders A
uthor Manuscripts

approximately 200 μl of each parasite culture (equivalent to 4 μl of packed erythrocytes)was sampled before growth, and DNA extracted using the QIAamp™ DNA Blood Mini Kit(Qiagen, UK). From each of the 26 isolates that were cultured after cryopreservation, theschizont stage culture was centrifuged and cells (resuspended at 50% haematocrit inincomplete medium) harvested directly for parasite RNA. Approximately four volumes ofTRI Reagent™ (Sigma) or TRIzol Reagent™ (Invitrogen) was added to the erythrocytesprior to freezing at −80 °C. The parasites from the 16 fresh isolates were enriched atschizont stage using 55% Percoll, then diluted to 1% parasitaemia with heterologouserythrocytes for invasion assays, at which point part of the sample was frozen as above.
2.2. Erythrocyte invasion assaysErythrocytes from an uninfected Caucasian donor (blood group O+) were treated with 1 mg/ml trypsin, 1 mg/ml chymotrypsin or 50 mU neuraminidase for 1 h at 37 °C, after whichthey were washed once with 1 ml incomplete RPMI and then 0.5 mg/ml soybean trypsininhibitor was added to the trypsin and chymotrypsin samples to inhibit the enzyme(incomplete RPMI was added to the control and neuraminidase sample) while mixing on arotating wheel for 10 min at room temperature. Erythrocytes were washed three times beforeresuspending at 50% haematocrit in RPMI, and stored at 4 °C for a maximum of 1 week,prior to use in invasion assays. Cultured schizonts from the fresh isolates were enriched bycentrifugation through 55% Percoll, washed twice and adjusted to around 1% parasitaemiawith untreated or enzyme-treated donor erythrocytes. These comprised a subset of theisolates tested in a larger study of parasite growth and invasion phenotypes ([18]; Deans etal., in preparation). They were cultured for a further 24 h in duplicate wells of 96-well platesin volumes of 50 μl at 2% haematocrit, following which thin blood films of the pre-invasionsample and the ring-invaded erythrocytes were prepared and stained with Giemsa fordetermination of parasitaemia. At least 1000 erythrocytes were counted from each the wells.Parasite multiplication rate (PMR) was scored as the number of ring-infected erythrocytesafter invasion divided by the pre-invasion parasitaemia. Percentage inhibition of invasiondue to enzyme treatment of erythrocytes was measured as 100 – ((enzyme-treated PMR/control PMR) × 100).
2.3. RNA extraction and reverse transcriptionRNA was extracted from the preparation from each isolate in TRIzol™ or TRI Reagent™according to manufacturer’s instructions, in combination with the RNeasy Micro™ (Qiagen,UK) protocol for removal of DNA contamination. The extracted RNA was frozen in two 5μl aliquots and a third aliquot (2 μl) was used for estimation of the RNA concentrationusing the Agilent RNA labchip. Total RNA was reverse-transcribed with random primersusing TaqMan reverse transcription reagents (Applied Biosystems, UK) in a 50 μl reaction,for 10 min at 25 °C, followed by 1 h at 37 °C. Calculations were made so that for eachreverse transcription (RT) reaction no more than 800 ng of RNA was used, and this was splitbetween eight PCR assays so the cDNA used in each PCR reaction would not exceed 100 ng(the RNA yield varied so that this was frequently less than 50 ng and could be as low as 1 ngper PCR reaction).
2.4. Real time quantitative PCR analysis of parasite cDNAFor relative quantification of different gene transcripts the cDNA was used in a fluorogenic5′-nuclease assay using the TaqMan system on the ABI Prism 7000 Sequence Detector(Applied Biosystems). Gene-specific TaqMan primers and probe sets were obtained usingthe Assays-by-Design system (Applied Biosystems) for the Rh1, Rh2a, Rh2b, Rh4 and ama1genes (Table 1). For eba175, eba140 and eba181, primers and probes were based on thosepreviously described [11]. The chosen sequences for amplification were not designed tospan an exon–exon boundary, except in the case of Rh1. All probes were labeled with 6-
Nery et al. Page 3
Mol Biochem Parasitol. Author manuscript; available in PMC 2010 May 27.
Europe PM
C Funders A
uthor Manuscripts
Europe PM
C Funders A
uthor Manuscripts

carboxy-fluorescein (FAM) on the 5′-end and a non-fluorescent quencher (MGB-NFQ,Applied Biosystems) on the 3′-end and used in single reporter assays. The PCR reactionswere carried out in 25 μl volumes using 900 nM of each primer and 250 nM probe.
Serial dilutions of Dd2 genomic DNA (four dilutions over a 1000-fold concentration range)were used to generate standard curves for each gene individually (except for Rh1 as thisgene has multiple copies in the Dd2 genome [9] and the Rh1 oligonucleotides were designedto detect cDNA rather than genomic DNA). As the efficiency (derived from the slope of thestandard curve) for all the gene assays was comparable, the amount of Rh1 transcript wasestimated using the standard curve obtained for Rh2a within each plate reaction. Each 96-well plate run included the genomic DNA standard curves, cDNA from five field samples tobe tested for each of the genes, and control wells to check for genomic DNA contamination(samples from each isolate without RT were tested for two different genes so the platecontained negative controls for all genes). Quantitation of each gene in each sample wasperformed using the ABI Prism 7000 Sequence Detection System Software version 1.2.3.Genomic DNA standard curves were generated each time a set of samples was run, byplotting the Ct value for each standard well against the known dilutions. On all plates thethreshold fluorescence value of 0.2 was chosen for Ct determination (after ensuring that thiscorresponded to the exponential part of the PCR amplification in each plate).
2.5. Statistical and cladistic analysis of gene expression profilesFor each isolate the transcript levels of each of the Rh genes and eba175 were normalizedagainst the transcript level of ama1, which has a similar stage-specific expression and isconsidered to be expressed at similar levels among different parasite lines. Expressionprofiles were generated by plotting the relative proportions of each transcript, calculated as apercentage of the total for the five genes.
Spearman’s rank nonparametric correlation coefficient (ρ) was used to measure the pairwiserelationships between the relative proportions of expression of each of the different genesacross all isolates. Mann–Whitney U tests were used to assess whether there were significantassociations between the relative amounts of each of the transcripts and the case status of thepatients (severe or mild malaria) and whether or not the isolate was freshly cultured or hadbeen cryopreserved. Spearman’s ρ was also used to test for correlation between relativelevels of expression and parasitemia or multiplication rate. All statistical analysis wasperformed using SPSS version 11.0 software.
The expression profiles of the five candidate genes together were compared across differentisolates by computing a difference index for each pair of isolates. For each gene, thedifference in relative proportions of different transcripts between the two isolates wasdivided by the sum of the proportions in the two isolates, and this value was summed overall five genes and the total divided by five (to give a standardized difference index with apotential range from 0 to 1.0). The resulting distance matrix among all isolates was thenanalysed using neighbour-joining and UPGMA clustering analysis with the phylogeneticsoftware PHYLIP (PHYLogeny Inference Package available free at http://evolution.genetics.washington.edu/phylip.html). An additional analysis was performed usingNTSys (Numerical Taxonomical Systems, Exeter Software) on the relative expression levelsfor each of the five genes, generating an independent distance matrix and UPGMA tree tocheck the integrity of the major clusters derived by the above method.
Nery et al. Page 4
Mol Biochem Parasitol. Author manuscript; available in PMC 2010 May 27.
Europe PM
C Funders A
uthor Manuscripts
Europe PM
C Funders A
uthor Manuscripts

2.6. Testing for multiple clone infections and genomic amplification of gene copy numbersTo test for the presence of multiple clones of P. falciparum in the isolates, the highlypolymorphic repeat sequences in two loci (msp1 block 2 and msp2 block 3) were amplifiedusing a nested PCR method with allele type-specific internal primers [19].
For estimation of genomic copy numbers of each of the candidate genes, genomic DNA wasanalysed in the TaqMan system, following a method similar to that used for analysis humangene copy number variation [20]. The gene-specific primers and probe sets were the same asfor the transcript analyses, except for Rh1 for which a different set of primers and probeswas used for genomic DNA that did not span a cDNA exon–exon boundary (Table 1). Everyassay included standard curves for each gene of interest (four dilutions of 3D7 genomicDNA covering 1000-fold differences) and was replicated with two different standard singlecopy genes (ama1 on one assay and seryl tRNA synthase on another assay). Non-templatewells without DNA served as negative controls, and separate wells with 3D7 (singlegenomic copy of Rh1) and FCB1 (multiple genomic copies of Rh1) DNA as positivecontrols.
3. Results3.1. P. falciparum field isolates vary in the relative expression of Rh genes and eba175
The gene expression profile was determined for a total of 42 isolates cultured to schizontstage ex vivo (16 fresh and 26 thawed cryopreserved samples). The levels of Rh1, Rh2a,Rh2b, Rh4 and eba175 transcripts were normalized against ama1. The ama1 gene waschosen as it has similar stage specificity (being expressed in schizonts and merozoites) andis an essential gene that is not considered to vary in transcription among different parasitelines, so it should normalize for differences in the maturity of the schizonts as well asvariation in parasitaemia among different isolates. Expression profiles were generated toanalyse the relative amounts of each of the five transcripts (Rh genes and eba175)considered to potentially determine invasion phenotypes. Visual examination of the plottedexpression profiles indicates that isolates vary substantially in the relative levels oftranscripts of the different genes (Fig. 1A and Supplementary figure). For example, in manyisolates eba175 transcript was abundant, whereas in some others it was relatively low andRh2b was predominant. In almost all isolates the level of Rh4 expression was substantiallylower than the other transcripts, but in two isolates it was a predominant transcript. Thevariance/mean ratio of relative transcript abundance over all 42 isolates was highest for Rh4with a value of 8.76, reflecting the fact that it is very low in most isolates and abundant inonly a few. For the other transcripts, the variance/mean ratio was approximately half of thisor less, with values of 2.99, 3.42, and 4.77 for Rh1, Rh2a and Rh2b, respectively, and 4.58for eba175.
Categorization of expression profiles into discrete groups was supported by a cladisticanalysis. The analysis allowed the division of the 42 samples into three major groups (Fig.1B). The first group (clade I) accounts for most (81%, 34/42) of the isolates and ischaracterized by a relative abundance of eba175 transcript in most cases, with varying levelsof the other transcripts (Fig. 1A and Supplementary figure). It may putatively contain morehomogeneous subgroups, such as Ia and Ib that differ in the degree to which eba175expression is dominant and together account for 62% of all isolates (26/42, Fig. 1A and B).Members of subgroup Ia also express relatively high levels of Rh1, Rh2a or Rh2b whereassubgroup Ib is characterized by a greater predominance of eba175 relative to the secondmost abundant transcript (either Rh1 or Rh2b). The remaining eight isolates in group I didnot fall into subgroup Ia or Ib (Fig. 1B and Supplementary figure). Group II consists of sixisolates (14% of the total) expressing Rh2b as the predominant transcript, while group III
Nery et al. Page 5
Mol Biochem Parasitol. Author manuscript; available in PMC 2010 May 27.
Europe PM
C Funders A
uthor Manuscripts
Europe PM
C Funders A
uthor Manuscripts

consists of two isolates (5% of the total) that express Rh4 as the predominant transcript (Fig.1A and B). The same three major cladistic groups were obtained by neighbour-joiningclustering of the expression distance matrix, and by an UPGMA analysis of distancesindependently derived using NTSys (trees not shown).
3.2. Strong negative correlations between expression of particular transcriptsRelationships between the relative proportions of different transcripts were explored for allten pairwise correlations among the five candidate genes, from which three highlysignificant correlations emerged (Fig. 2). Two of these involved eba175, with very strongnegative correlations between levels of eba175 and Rh2b (Spearman’s ρ = −0.717, P <0.0001), and between levels of eba175 and Rh4 (ρ = −0.526, P < 0.0001). There was also astrong negative correlation between expression levels of Rh1 and Rh2b (ρ = −0.479, P <0.001). There were two weaker correlations, Rh2a and Rh4 levels being negativelycorrelated (ρ = −0.344, P < 0.025), and Rh2a and Rh2b levels being positively correlated (ρ= 0.324, P < 0.037). The remaining five pairwise correlations were not significant (ρ valuesranged from −0.275 to 0.286).
3.3. Tests for associations between gene expression levels, clinical disease status andother variables
The relative level of each transcript was compared among isolates and tested for associationwith different variables. There was no overall difference between isolates from the 22patients with severe malaria or the 20 with mild clinical malaria for any of the individualtranscripts (Mann–Whitney U tests, P > 0.05). Consistent with this, the severe and mildisolates were apparently randomly scattered among the different expression profile groups inthe cladistic analysis (Fig. 1). There was also no association between parasitaemia in thepatients and relative levels of expression of any of the genes.
Overall, parasite isolates that were cultured fresh ex vivo had slightly lower levels of Rh1than isolates that had been cryopreserved before culturing (Mann–Whitney U test, P <0.037), although there was no difference for any of the other transcripts. This difference wasalso reflected in the observation that only fresh isolates were present in expression profilegroup II that has low levels of Rh1 (Fig. 1).
Thirteen of the fresh isolates were tested for associations between relative amounts of geneexpression and parasite growth and invasion phenotypes (the remaining three fresh isolatesdid not yield adequate numbers of reinvaded cells for counting). Invasion phenotype wasdetermined by measuring the ability of merozoites to invade donor RBCs treated withneuraminidase, trypsin and chymotrypsin compared to the ability of invading untreatedRBCs. Parasite growth was estimated as the first generation multiplication rate. Of the 20correlation tests explored (four invasion or growth phenotypes against five gene transcripts),there were two significant correlations: a positive correlation between eba175 levels andsensitivity of invasion to neuraminidase treatment (Spearman’s ρ = 0.582, P = 0.037), and apositive correlation between Rh2b levels and parasite multiplication rate (ρ = 0.654, P =0.015).
The presence of multiple clones of P. falciparum in the isolates, that could potentially givemixed or ‘hybrid’ phenotypes, was assayed by amplification of the highly polymorphicrepeat sequences in msp1 and msp2 from all isolates (except fresh isolate 2 from which nomaterial remained for DNA extraction). The mean number of distinct genotypes detected perisolate ranged from one to six, with a mean of 2.2 per isolate, and 32% (13/41) wereapparently single clone infections. Although the single clone isolates were a minority of thetotal, they were represented in all the gene expression clusters (marked with asterisks in Fig.
Nery et al. Page 6
Mol Biochem Parasitol. Author manuscript; available in PMC 2010 May 27.
Europe PM
C Funders A
uthor Manuscripts
Europe PM
C Funders A
uthor Manuscripts

1 and Supplementary figure), indicating that the major clusters are not artifacts ofsuperimposed phenotypes. However, some of the expression profiles of mixed genotypeisolates are likely to reflect such superimposition. This may be the case for the eight samplesshown in Supplementary figure (belonging to group I but not segregating into subgroup Ia orIb), all except one of which are mixed genotype infections.
3.4. Testing for candidate gene copy number amplificationRh1 gene copy number (shown to vary among culture-adapted isolates [9]) was assayed in36 of the isolates for which adequate DNA remained for analysis. Copy number wascompared to the single locus genes ama1 and seryl tRNA synthase, and control genomicDNA from cultured P. falciparum isolates was also assayed (3D7 which has a single copy ofRh1, and FCB-1 which has been previously estimated to have four copies [9]). In the assayshere, 3D7 was shown consistently to have a single copy and FCB-1 to have multiple copies(approximately seven in most assays). All of the 36 field isolates tested had an estimatedRh1 copy number of 1 (none had a reproducible estimate approaching 2, or more than thatfor the 3D7 control) (data not shown). Following this, 10 isolates were randomly chosen foranalysis of gene copy number of the other Rh genes and eba175 (there is no previousevidence of genomic copy number amplification in culture-adapted isolates for these genes,although isolate D10 has a deletion of gene Rh2b [6]). None of the isolates tested here hadan estimated gene copy number different from 1.
3.5. Preliminary assay of additional candidate genesAfter the analysis showed that the abundance of particular gene transcripts varied in relationto each other and to the gene encoding the principal ligand eba175, it was considered thatthe expression of additional genes could also vary between isolates. The very limitedschizont-stage RNA material from the isolates studied here was mostly exhausted, butsufficient remained from 14 isolates to allow a preliminary assay of variation in two othereba genes (eba140 and eba181) alongside eba175 (the other paralogues ψeba165 and ebl-1are putative pseudogenes and were not tested). Among these isolates, variation in relativetranscript levels measured for eba140 and eba181 was slightly less than that for eba175(variance/mean ratios of 2.20, 1.44, and 3.74, respectively).
4. DiscussionThese results indicate that gene expression differences that have been shown to correlatewith invasion phenotypes of culture-adapted and transgenic P. falciparum lines are reflectiveof differences that occur naturally. Among the Kenyan isolates studied here, high relativelevels of eba175 expression were very strongly negatively correlated with Rh4 levels, inagreement with the upregulation of Rh4 in parasite lines that have the eba175 gene knockedout, and in lines that are selected for sialic acid-independent invasion [8]. High levels of Rh1were strongly negatively correlated with Rh2b expression, which is in agreement with thepattern of variation among different culture-adapted laboratory isolates [6]. There was also astrong negative correlation between eba175 and Rh2b gene expression, as might be expectedbecause the receptors of these respective ligands have opposite sensitivities to enzymetreatment (the EBA175 receptor Gyp A is trypsin and neuraminidase sensitive, whereas theRh2b receptor Z is trypsin and neuraminidase resistant).
The fact that there were no significant differences in the expression profiles of the fivecandidate genes between the 22 severe malaria and the 20 mild malaria isolates may havebeen expected, as these numbers give very modest statistical power. This indicates thatparasites in severe malaria infections are not a highly restricted phenotypic subset, and amuch larger case–control study will be needed to test for any disease associations. It is not
Nery et al. Page 7
Mol Biochem Parasitol. Author manuscript; available in PMC 2010 May 27.
Europe PM
C Funders A
uthor Manuscripts
Europe PM
C Funders A
uthor Manuscripts

known why Rh1 transcript levels were lower in fresh isolates than cryopreserved ones, sothat expression profile group II consisted only of fresh isolates. It is unlikely thatcryopreservation of ring stage parasites from patients would alter the relative level oftranscription of genes at the schizont stage, so it could be merely a chance association.Alternatively, it is possible that there were underlying differences in the expression profilesof P. falciparum isolates collected at the Kilifi District Hospital in 1994–1996 comparedwith 2003–2004.
For most of the isolates cultured here for gene expression analysis, there was insufficientvolume of blood available for erythrocyte invasion assays to be performed. However,thirteen of the fresh isolates were included among a panel of isolates from Kenya and Malithat were tested for parasite growth and invasion [18]. Although the number is too low toallow a highly informative analysis of gene expression in relation to phenotype, correlationcoefficients were explored for 20 preliminary tests (relative amounts of each of the fivecandidate transcripts versus four culture phenotypes). This yielded two significantcorrelations, a positive correlation between eba175 levels and sensitivity of invasion toneuraminidase treatment of target erythrocytes, and a positive correlation between Rh2blevels and parasite multiplication rate. These correlations could have occurred by chance andneed to be tested for in a larger study, but it is worth noting that the first is consistent withthe known role of EBA175 in binding to glycophorin A [21,22] which is the mainmechanism underlying the neuraminidase sensitive invasion phenotype in culture-adaptedlines [3] although there are others that are also used in some lines [4,23-25].
The three major expression profile clusters for the candidate genes studied here are quiteclearly defined, with the first and largest being associated generally with higher levels ofeba175, and the other two being associated with higher levels of Rh2b and Rh4,respectively. Although this clustering scheme helps to describe the data from these fieldisolates, further work is needed to develop the definition of expression profiles. The largestcluster here (group I) is diverse, and might be composed of different subgroups that need tobe more clearly defined (e.g. subgroups Ia and Ib which appear to differ in the relativeamount of eba175 transcript). The inclusion of additional candidate genes involved ininvasion phenotypes might qualitatively alter the profiles if expression of these variesamong isolates. A preliminary analysis of eba140 and eba181 here indicated that theirexpression varied less among different isolates than eba175, but these are still candidates forfurther study, as is the newly identified Rh5 [2]. Microarray analysis of whole transcriptprofiles of schizont stage parasites should help identify additional genes that differ in theirexpression among isolates, and some of these may also be added into the panel of invasionphenotype candidate genes.
This is the first characterization of gene expression in malaria parasite field isolates focusingon ligands involved in erythrocyte invasion, and shows the existence of distinct expressionprofiles. Whether the different profiles are associated with invasion phenotypes or severityof disease, and whether they are selected by acquired immune responses, remains to beelucidated by larger studies.
Supplementary MaterialRefer to Web version on PubMed Central for supplementary material.
AcknowledgmentsWe are grateful to Andy Whargo, Bruno Santos and Jake Baum for advice with RNA extraction and real time PCR,Brett Lowe for assistance in access to the field isolates, Gareth Weedall for discussions on Rh gene sequences, andDavis Nwakanma for advice on cladistic analysis methods. We thank all patients for their participation in this
Nery et al. Page 8
Mol Biochem Parasitol. Author manuscript; available in PMC 2010 May 27.
Europe PM
C Funders A
uthor Manuscripts
Europe PM
C Funders A
uthor Manuscripts

study. SN received fellowship support from the European Molecular Biology Organisation (EMBO) and thePortuguese Foundation for Science and Technology (FCT), and the work was supported by grants from the UKMedical Research Council (MRC) and the Wellcome Trust.
Appendix A. Supplementary dataSupplementary data associated with this article can be found, in the online version, at doi:10.1016/j.molbiopara.2006.05.014.
Abbreviations
EBA erythrocyte binding antigenic protein
Rh reticulocyte binding protein-like homologue
RT reverse transcription
References[1]. Gaur D, Mayer DCG, Miller LH. Parasite ligand–host receptor interactions during invasion of
erythrocytes by Plasmodium merozoites. Int J Parasitol. 2004; 34:1413–29. [PubMed: 15582519]
[2]. Cowman AF, Crabb BS. Invasion of red blood cells by malaria parasites. Cell. 2006; 124:755–66.[PubMed: 16497586]
[3]. Duraisingh MT, Maier AG, Triglia T, Cowman AF. Erythrocyte-binding antigen 175 mediatesinvasion in Plasmodium falciparum utilizing sialic acid-dependent and -independent pathways.Proc Natl Acad Sci USA. 2003; 100:4796–801. [PubMed: 12672957]
[4]. Maier AG, Duraisingh MT, Reeder JC, et al. Plasmodium falciparum erythrocyte invasion throughglycophorin C and selection for Gerbich negativity in human populations. Nat Med. 2003; 9:87–92. [PubMed: 12469115]
[5]. Gilberger T-M, Thompson JK, Triglia T, Good RT, Duraisingh MT, Cowman AF. A novelerythrocyte binding antigen-175 paralogue from Plasmodium falciparum defines a new trypsin-resistant receptor on human erythrocytes. J Biol Chem. 2003; 278:14480–6. [PubMed:12556470]
[6]. Duraisingh MT, Triglia T, Ralph SA, et al. Phenotypic variation of Plasmodium falciparummerozoite proteins directs receptor targeting for invasion of human erythrocytes. EMBO J. 2003;22:1047–57. [PubMed: 12606570]
[7]. Reed MB, Caruana SR, Batchelor AH, Thompson JK, Crabb BS, Cowman AF. Targeteddisruption of an erythrocyte binding antigen in Plasmodium falciparum is associated with aswitch toward a sialic acid-independent pathway of invasion. Proc Natl Acad Sci USA. 2000;97:7509–14. [PubMed: 10861015]
[8]. Stubbs J, Simpson KM, Triglia T, et al. Molecular mechanism for switching of P. falciparuminvasion pathways into human erythrocytes. Science. 2005; 309:1384–7. [PubMed: 16123303]
[9]. Triglia T, Duraisingh MT, Good RT, Cowman AF. Reticulocyte-binding protein homologue 1 isrequired for sialic acid-dependent invasion into human erythrocytes by Plasmodium falciparum.Mol Microbiol. 2005; 55:162–74. [PubMed: 15612925]
[10]. Bozdech Z, Llinas M, Pulliam BL, Wong ED, Zhu J, DeRisi JL. The transcriptome of theintraerythrocytic developmental cycle of Plasmodium falciparum. PLOS Biol. 2003; 1:85–100.
[11]. Blair PL, Witney A, Haynes JD, Moch JK, Carucci DJ, Adams JH. Transcripts ofdevelopmentally regulated Plasmodium falciparum genes quantified by real-time RT-PCR. NuclAcids Res. 2002; 30:2224–31. [PubMed: 12000842]
[12]. Taylor HM, Grainger M, Holder AA. Variation in the expression of a Plasmodium falciparumprotein family implicated in erythrocyte invasion. Infect Immun. 2002; 70:5779–89. [PubMed:12228308]
[13]. Dolan SA, Miller LH, Wellems TE. Evidence for a switching mechanism in the invasion oferythrocytes by Plasmodium falciparum. J Clin Invest. 1990; 86:618–24. [PubMed: 2200806]
Nery et al. Page 9
Mol Biochem Parasitol. Author manuscript; available in PMC 2010 May 27.
Europe PM
C Funders A
uthor Manuscripts
Europe PM
C Funders A
uthor Manuscripts

[14]. Gaur D, Furuya T, Mu J, Jiang LB, Su X-Z, Miller LH. Upregulation of expression of thereticulocyte homology gene 4 in the Plasmodium falciparum clone Dd2 is associated with aswitch in the erythrocyte invasion pathway. Mol Biochem Parasitol. 2006; 145:205–15.[PubMed: 16289357]
[15]. Lobo CA, de Frazao K, Rodriguez M, Reid M, Zalis M, Lustigman S. Invasion profiles ofBrazilian field isolates of Plasmodium falciparum: phenotypic and genotypic analyses. InfectImmun. 2004; 72:5886–91. [PubMed: 15385490]
[16]. Okoyeh JN, Pillai CR, Chitnis CE. Plasmodium falciparum field isolates commonly useerythrocyte invasion pathways that are independent of sialic acid residues of glycophorin A.Infect Immun. 1999; 67:5784–91. [PubMed: 10531229]
[17]. Baum J, Pinder M, Conway DJ. Erythrocyte invasion phenotypes of Plasmodium falciparum inGambia. Infect Immun. 2003; 71:1856–63. [PubMed: 12654801]
[18]. Deans A-M, Lyke KE, Thera MA, et al. Low multiplication rates of African Plasmodiumfalciparum isolates and lack of association of multiplication rate and red blood cell selectivitywith malaria virulence in African children. Am J Trop Med Hyg. 2006; 74:554–63. [PubMed:16606983]
[19]. Snounou G, Zhu X, Siripoon N, et al. Biased distribution of msp1 and msp2 allelic variants inPlasmodium falciparum populations in Thailand. Trans R Soc Trop Med Hyg. 1999; 93:369–74.[PubMed: 10674079]
[20]. Regis S, Grossi S, Lualdi S, Biancheri R, Filocamo M. Diagnosis of Pelizaeus–Merzbacherdisease: detection of proteolipid protein gene copy number by real-time PCR. Neurogenetics.2005; 6:73–8. [PubMed: 15827763]
[21]. Tolia NH, Enemark EJ, Sim BKL, Joshua-Tor L. Structural basis for the EBA-175 erythrocyteinvasion pathway of the malaria parasite Plasmodium falciparum. Cell. 2005; 122:183–93.[PubMed: 16051144]
[22]. Sim BKL, Chitnis CE, Wasniowska K, Hadley TJ, Miller LH. Receptor and ligand domains forinvasion of erythrocytes by Plasmodium falciparum. Science. 1994; 264:1941–4. [PubMed:8009226]
[23]. Mayer DCG, Kaneko O, Hudson-Taylor DE, Reid ME, Miller LH. Characterization of aPlasmodium falciparum erythrocyte-binding protein paralogous to EBA-175. Proc Natl Acad SciUSA. 2001; 98:5222–7. [PubMed: 11309486]
[24]. Lobo C-A, Rodriguez M, Reid M, Lustigman S. Glycophorin C is the receptor for thePlasmodium falciparum erythrocyte binding ligand PfEBP-2. Blood. 2003; 101:4628–31.[PubMed: 12576308]
[25]. Dolan SA, Proctor JL, Alling DW, Okubo Y, Wellems TE, Miller LH. Glycophorin B as anEBA-175 independent Plasmodium falciparum receptor of human erythrocytes. Mol BiochemParasitol. 1994; 64:55–63. [PubMed: 8078523]
Nery et al. Page 10
Mol Biochem Parasitol. Author manuscript; available in PMC 2010 May 27.
Europe PM
C Funders A
uthor Manuscripts
Europe PM
C Funders A
uthor Manuscripts
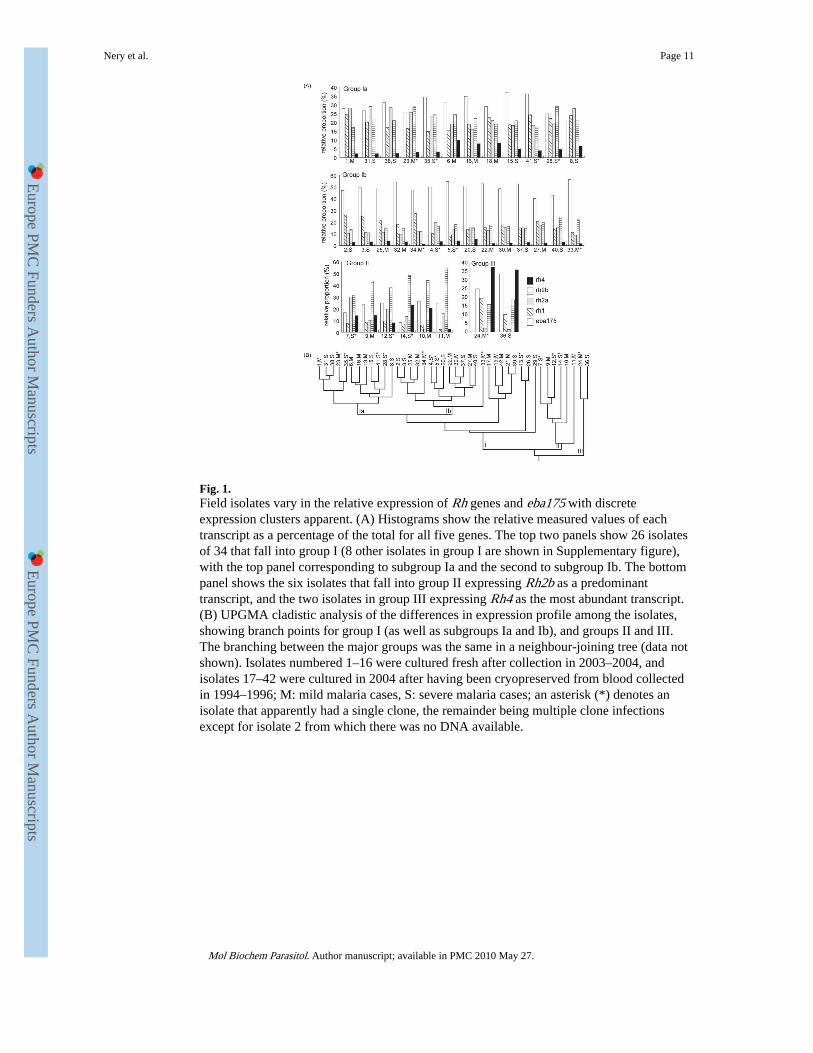
Fig. 1.Field isolates vary in the relative expression of Rh genes and eba175 with discreteexpression clusters apparent. (A) Histograms show the relative measured values of eachtranscript as a percentage of the total for all five genes. The top two panels show 26 isolatesof 34 that fall into group I (8 other isolates in group I are shown in Supplementary figure),with the top panel corresponding to subgroup Ia and the second to subgroup Ib. The bottompanel shows the six isolates that fall into group II expressing Rh2b as a predominanttranscript, and the two isolates in group III expressing Rh4 as the most abundant transcript.(B) UPGMA cladistic analysis of the differences in expression profile among the isolates,showing branch points for group I (as well as subgroups Ia and Ib), and groups II and III.The branching between the major groups was the same in a neighbour-joining tree (data notshown). Isolates numbered 1–16 were cultured fresh after collection in 2003–2004, andisolates 17–42 were cultured in 2004 after having been cryopreserved from blood collectedin 1994–1996; M: mild malaria cases, S: severe malaria cases; an asterisk (*) denotes anisolate that apparently had a single clone, the remainder being multiple clone infectionsexcept for isolate 2 from which there was no DNA available.
Nery et al. Page 11
Mol Biochem Parasitol. Author manuscript; available in PMC 2010 May 27.
Europe PM
C Funders A
uthor Manuscripts
Europe PM
C Funders A
uthor Manuscripts

Fig. 2.Scatter plots showing the three highly significant rank correlations among levels ofexpression of particular Rh genes and eba 175, among the 10 pairwise correlations for thefive genes. (A) High levels of eba175 are associated with low levels of Rh4 (ρ = −0.526, P <0.001). (B) High levels of eba175 are associated with low levels of Rh2b (ρ = −0.717, P <0.001). (C) High levels of Rh1 are associated with low levels of Rh2b (ρ = −0.479, P <0.001). Of the other seven pairwise correlations among transcript levels, one was weaklypositive and one weakly negative and five were not significantly-different from random (seetext).
Nery et al. Page 12
Mol Biochem Parasitol. Author manuscript; available in PMC 2010 May 27.
Europe PM
C Funders A
uthor Manuscripts
Europe PM
C Funders A
uthor Manuscripts

Europe PM
C Funders A
uthor Manuscripts
Europe PM
C Funders A
uthor Manuscripts
Nery et al. Page 13
Tabl
e 1
Sequ
ence
s of
pri
mer
s an
d pr
obes
for
eac
h of
the
gene
s an
alys
ed b
y re
al ti
me
PCR
*
Gen
eSe
quen
ceN
ucle
otid
e po
siti
onA
cces
sion
no.
Rh1
cD
NA
(e
xon–
exon
)
F: 5′-
GC
AA
AG
GT
GG
AT
TT
TC
TG
CA
AC
AT
-3′
3–26
R: 5′-
TC
TG
AA
TA
GT
CC
TT
TC
TT
AT
TT
TT
TC
AT
TG
GA
AG
A-3′
RC
: 82–
116
AF5
3370
0
P: 5′-
FAM
-CA
TG
GC
TA
AA
TT
CT
GC
TA
AG
TA
A-M
GB
-3′
RC
: 45–
67
Rh1
gD
NA
F: 5′-
GG
GA
AA
AT
AT
TA
AT
AA
TG
TG
GA
AA
TA
TG
GT
AT
GA
AA
AA
AA
TA
TA
AT
TG
-3′
4307
–435
4
R: 5′-
AT
GT
AT
CA
AT
GT
TT
TC
CA
TA
TA
TT
TT
GC
AG
CT
TT
-3′
RC
: 439
0–44
23A
F533
700
P: 5′-
FAM
-CA
TT
CA
TA
TG
AC
GT
AA
GA
AA
TA
T-M
GB
-3′
RC
: 435
6–43
78
Rh2
a
F: 5′-
GG
TC
AT
AA
AA
GA
TA
AT
GA
GA
CA
CA
AT
TG
AA
AA
CA
A-3′
8805
–883
9
R: 5′-
GC
AA
TA
TT
TT
TT
TC
TG
GT
TT
TC
TT
CG
TA
TT
CC
-3′
RC
: 890
7–89
38A
Y13
8496
P: 5′-
FAM
-CA
CG
TT
TC
AA
AT
TA
AG
AT
AT
AA
TT
G-M
GB
-3′
RC
: 886
3–88
87
Rh2
b
F: 5′-
AC
AG
AA
AG
CG
AT
GA
TA
TT
GA
TA
AC
AG
TG
AA
-3′
8521
–855
0A
Y13
8500
R: 5′-
CC
CA
TG
GG
TG
TT
AC
TT
CT
AT
GA
CT
-3′
RC
: 859
6–86
19
P: 5′-
FAM
-CA
TA
TG
AG
TG
AC
AT
CG
AA
AG
TA
-MG
B-3′
8566
–858
7
Rh4
F: 5′-
GA
AA
TG
AC
GC
AA
TT
CC
CT
CA
AA
AG
A-3′
68–9
2A
F432
854
R: 5′-
GG
TG
TG
TT
TT
AT
TT
AT
AT
CA
TG
TT
GA
TT
CT
GT
GA
-3′
RC
: 127
–160
P: 5′-
FAM
-CT
TC
TG
GA
TC
GT
TT
TT
TT
TT
-MG
B-3′
RC
: 93–
112
ama1
F: 5′-
GG
AT
TA
TG
GG
TC
GA
TG
GA
AA
TT
GT
G-3′
937–
961
U65
407
R: 5′-
CA
TA
AT
CT
GT
TA
AA
TG
TT
GT
TC
AT
AT
TG
TT
TA
GG
TT
GA
T-3′
1044
–108
1
P: 5′-
FAM
-CC
GA
AG
CA
CT
CA
AT
TC
A-M
GB
-3′
RC
: 102
6–10
42
Nuc
leot
ide
posi
tion
corr
espo
nds
to th
e fi
rst n
ucle
otid
e of
the
forw
ard
prim
er in
the
3D7
codi
ng s
eque
nce
of e
ach
gene
. RC
indi
cate
s th
e re
vers
e co
mpl
emen
t seq
uenc
e th
at is
alig
ned
with
the
full
leng
th c
odin
g se
quen
ce.
* eba
gene
s w
ere
anal
ysed
usi
ng p
rim
ers
and
prob
es a
s pr
evio
usly
des
crib
ed [
11].
Mol Biochem Parasitol. Author manuscript; available in PMC 2010 May 27.
Copyright © 2022 FDOKUMEN