On valuing and hedging European options when volatility is estimated directly

ARTICLE
Received 23 Jul 2014 | Accepted 8 Oct 2014 | Published 19 Nov 2014
Atomically resolved tomography to directly informsimulations for structure–property relationshipsMichael P. Moody1, Anna V. Ceguerra2, Andrew J. Breen2, Xiang Yuan Cui2, Baptiste Gault1,
Leigh T. Stephenson2, Ross K.W. Marceau3, Rebecca C. Powles2 & Simon P. Ringer2
Microscopy encompasses a wide variety of forms and scales. So too does the array of
simulation techniques developed that correlate to and build upon microstructural information.
Nevertheless, a true nexus between microscopy and atomistic simulations is lacking. Atom
probe has emerged as a potential means of achieving this goal. Atom probe generates
three-dimensional atomistic images in a format almost identical to many atomistic
simulations. However, this data is imperfect, preventing input into computational algorithms
to predict material properties. Here we describe a methodology to overcome these
limitations, based on a hybrid data format, blending atom probe and predictive Monte Carlo
simulations. We create atomically complete and lattice-bound models of material specimens.
This hybrid data can then be used as direct input into density functional theory simulations to
calculate local energetics and elastic properties. This research demonstrates the role that
atom probe combined with theoretical approaches can play in modern materials engineering.
DOI: 10.1038/ncomms6501
1Department of Materials, University of Oxford, Parks Road, Oxford OX1 3PH, UK. 2Australian Centre for Microscopy and Microanalysis, School of
Aerospace, Mechanical and Mechatronic Engineering, The University of Sydney, Sydney, New South Wales 2006, Australia. 3 Institute for Frontier
Materials, Deakin University, Geelong, Victoria 3216, Australia. Correspondence and requests for materials should be addressed to M.P.M.
(email: [email protected]).
NATURE COMMUNICATIONS | 5:5501 | DOI: 10.1038/ncomms6501 | www.nature.com/naturecommunications 1
& 2014 Macmillan Publishers Limited. All rights reserved.

Atomic-scale microscopy enables the characterization ofincredibly small and complex structures, and increasinglyis the gateway for advances in materials technology.
However, it is the complementary development of computationalmaterials science that has been key to unlocking our under-standing of the mechanisms by which atomic architecturesdirectly impact the properties and behaviour of materials.Impressive inroads have been made in materials characterizationover the last decade, particularly through continued advances inthe capabilities of electron microscopy, most notably the efforts inhigh-resolution aberration-corrected transmission electronmicroscopy (TEM)1 and scanning TEM2 and the developmentof tomographic TEM techniques3. Atom probe tomography(APT) is a very different three-dimensional (3D) microscopyconcept, but one that is rapidly rising in prominence4–6. On thebasis of sequential field evaporation of individual ions from thesurface of a sharp needle-shaped specimen, APT provides ahighly accurate elementally resolved, atom-by-atom 3D image ofa specimen encompassing hundreds of millions of atoms(Supplementary Fig. 1).
The data generated by APT is of a format almost identical tothat exploited by many types of computer simulations. Indeed,one of the necessary precursors to carrying out atomisticmodelling is to have the initial microstructure configurations asclose as possible to real structures7. In constitutive modelling ofinhomogeneous systems, grid points or supercells are oftenemployed to represent different parts of the microstructures. Afundamental problem with such an approach is that the actualmicrostructures may differ significantly from simulated onesbecause of the presence of non-uniform distributions of crystalorientation, and morphology8.
APT has previously been used to bridge this gap betweenexperimental microscopy and atomistic simulation. Many studieshave demonstrated this potential by using atom probe data toindirectly inform various flavours of computational materialsscience, including Monte Carlo (MC) simulations9–12, moleculardynamics (MD)13 and density functional theory (DFT)14–19. Ineach case, APT offers valuable information to construct relevantmodels, and the simulated results can subsequently be comparedwith experiments. However, although APT reconstructionsrepresent a highly spatially resolved atomistic representation ofa material system, this data remains both imperfect andsignificantly incomplete. This is key since it prevents APT datafrom being seeded directly into theoretical models andsimulations, and thus prevents the full potential of itsinformation from being realised.
The 3D spatial resolution of APT can be extremely high20,21,however, the location of atoms in the reconstructed image is notexact. As a result, in the analysis of crystalline materials, atomsare offset from their true positions on the lattice. Further, due tothe incorporation of multi-channel plates in the design of theposition-sensitive detectors, a significant proportion of ionsstriking the detector are simply omitted from the finalreconstructed image. This process is often considered stochasticand independent of the identity of the incident ion. The termdetection efficiency refers to the fraction of ions that aresuccessfully detected, and in most commercial instrumentshas an estimated value of eE0.37–0.57. Imperfect spatialresolution and detection efficiency are two of the most seriousissues limiting APT from offering true atomic resolution analyses.Instrumentation advances will continue to incrementally improvethe situation, but this goal will not be achieved in the near futurevia technical advances alone.
In the present study, we propose a new analytical approach thatblends experiment with simulation to create a complete andlattice-based atomistic image of the original system. Although the
information provided by APT is incomplete, in actuality, thesheer amount of data generated by this technique is itsexceptional strength. Millions of atoms are routinely chemicallyidentified and precisely located in 3D in the course of anexperiment. Hence, an almost overwhelming amount of statisticalinformation is available and this is the foundation on which wehave built our methods.
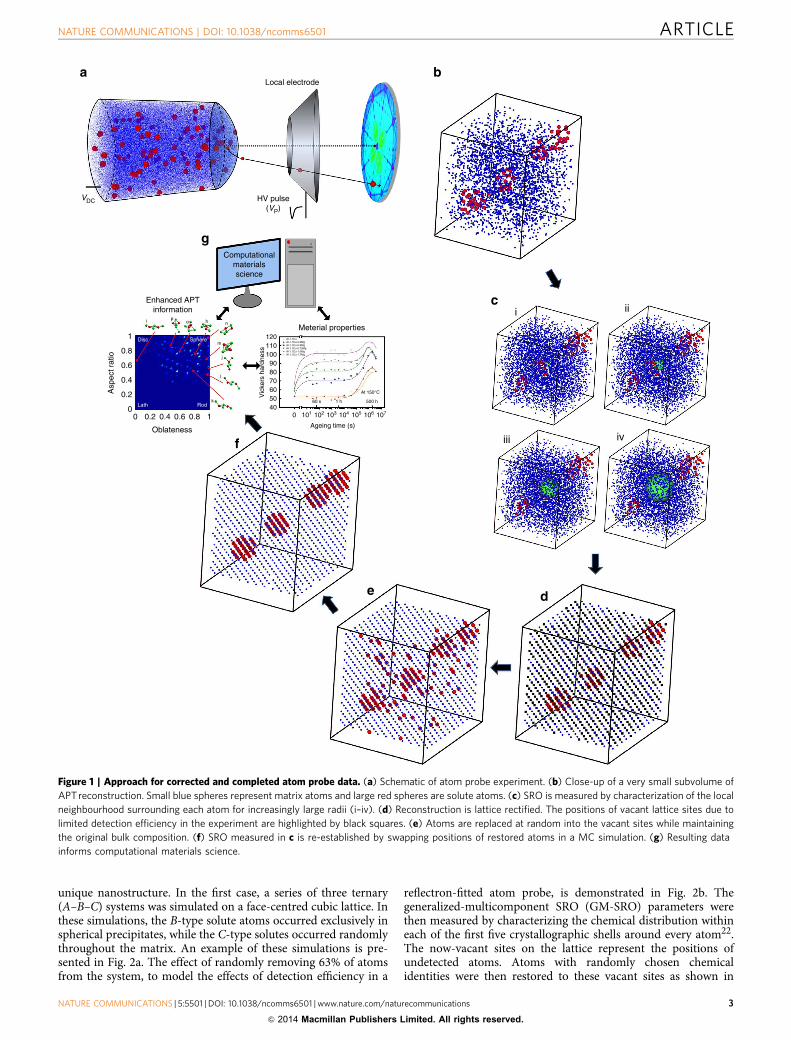
Our strategic approach is outlined step-by-step in Fig. 1.A crystalline specimen is analysed via APT (Fig. 1a), generating a3D atomic reconstruction of the original atomic configuration(Fig. 1b). In the next step, the average local chemical distributionwithin the reconstruction is characterized by measuring a set ofshort-range order (SRO) parameters at increasingly large radii(Fig. 1c i–iv). SRO parameters are well established for thecharacterization of chemical correlations in alloyed materials, andwe have recently developed an approach to derive thesemeasurements from APT data22. It was also demonstrated thatSRO measured via APT can provide a quantitative descriptionof the nanostructure present in the system despite itsaforementioned limitations.
On further statistical analyses, in many cases, it is observed thatsignificant crystallographic information has been retained in thereconstruction23–25 (Supplementary Fig. 2). This is discussed inmore detail in Supplementary Note 1. This information can beused to correct the data, atom by atom, to the perfect latticeconfiguration of the original specimen26,27 (Fig. 1d). We term thisprocess lattice rectification. In the rectified data, it will beapparent that there are a substantial number of vacant latticesites. As a first approximation, it is assumed that this is due solelyto a limited detection efficiency, which, in a stochastic manner,effectively omits a significant fraction of the ions field evaporatedfrom the specimen. Atoms can then be replaced into the APTdata by filling the vacant sites, and these will be termed restoredatoms. The chemical identity of individual restored atoms ischosen at random but with the constraint that after all vacantlattice sites have been filled, the overall composition of theoriginal reconstruction has been maintained (Fig. 1e).
It is clear from comparing the respective chemical distributionsin Fig. 1d,e that most of the restored solute atoms have beenplaced in incorrect lattice sites. This is also reflected in a drasticchange in values when the SRO parameters are re-measuredbecause we are randomly adding atoms to a reconstruction thathas significant short-range ordering. At this point, the recon-struction is seeded directly into to a MC algorithm. This MCsimulation is specifically adapted such that instead of utilizinginteraction potentials, trial moves are accepted or rejected basedon their effect on the overall SRO of the system. The SROparameters measured in the original reconstruction (Fig. 1c) areused by the simulation as target values. Atomic positionscontinue to be swapped at random until the SRO target valueshave been restored28. A critical constraint applied to thissimulation is that the positions of the original (experimentallydetected) atoms are not moved from their lattice-rectifiedpositions, only the positions of the restored atoms are swapped.The final result is a 3D lattice-based and atomically completerepresentation of the nanostructure present in the originalexperimental specimen (Fig. 1f).
ResultsReplacing atoms missing in simulated systems. There is no wayof confirming the chemical identities of the actual ions lost in theexperiment due to detection efficiency; hence, computer-gener-ated APT-like systems provide an excellent means to test theaccuracy of our approach for predicting the missing atoms.A range of systems were simulated, each incorporating its own
ARTICLE NATURE COMMUNICATIONS | DOI: 10.1038/ncomms6501
2 NATURE COMMUNICATIONS | 5:5501 | DOI: 10.1038/ncomms6501 | www.nature.com/naturecommunications
& 2014 Macmillan Publishers Limited. All rights reserved.
unique nanostructure. In the first case, a series of three ternary(A–B–C) systems was simulated on a face-centred cubic lattice. Inthese simulations, the B-type solute atoms occurred exclusively inspherical precipitates, while the C-type solutes occurred randomlythroughout the matrix. An example of these simulations is pre-sented in Fig. 2a. The effect of randomly removing 63% of atomsfrom the system, to model the effects of detection efficiency in a
reflectron-fitted atom probe, is demonstrated in Fig. 2b. Thegeneralized-multicomponent SRO (GM-SRO) parameters werethen measured by characterizing the chemical distribution withineach of the first five crystallographic shells around every atom22.The now-vacant sites on the lattice represent the positions ofundetected atoms. Atoms with randomly chosen chemicalidentities were then restored to these vacant sites as shown in
Local electrode
VDC HV pulse
(VP)
Meterial properties120 Al-1.1Cu
Al-1.1Cu-0.2MgAl-1.1Cu-0.5MgAl-1.1Cu-0.75MgAl-1.1Cu-1.0MgAl-1.1Cu-1.7Mg
110
100
90
80
70
60
50
400 101 102 103 104 105 106 107
60 s 1 h 500 h
At 150°C
Enhanced APT
information
ip
o h n
m
j
l
k
1 Disc Sphere
RodLath
0.8
0.6
0.6 0.8
OblatenessAgeing time (s)
Computational
materials
science
1
0.4
0.4
0.2
0.20
0
Aspect ra
tio
Vic
kers
hard
ne
ss
i ii
iii iv
g
Figure 1 | Approach for corrected and completed atom probe data. (a) Schematic of atom probe experiment. (b) Close-up of a very small subvolume of
APTreconstruction. Small blue spheres represent matrix atoms and large red spheres are solute atoms. (c) SRO is measured by characterization of the local
neighbourhood surrounding each atom for increasingly large radii (i–iv). (d) Reconstruction is lattice rectified. The positions of vacant lattice sites due to
limited detection efficiency in the experiment are highlighted by black squares. (e) Atoms are replaced at random into the vacant sites while maintaining
the original bulk composition. (f) SRO measured in c is re-established by swapping positions of restored atoms in a MC simulation. (g) Resulting data
informs computational materials science.
NATURE COMMUNICATIONS | DOI: 10.1038/ncomms6501 ARTICLE
NATURE COMMUNICATIONS | 5:5501 | DOI: 10.1038/ncomms6501 | www.nature.com/naturecommunications 3
& 2014 Macmillan Publishers Limited. All rights reserved.

Fig. 2c, while maintaining the overall composition of thesystem. The data were then seeded directly into the MCsimulation, and the originally measured values of the GM-SROparameters were re-established by swapping the positions of therestored atoms. The final result is presented in Fig. 2d, in whichoverwhelmingly the solute atoms have been returned correctly tothe precipitates.
Supplementary Note 2 describe how the approach wasalso successfully applied to systems containing more compli-cated nanostructures, including precipitates with an orderedstructure (for example, L12 in Supplementary Fig. 3) andfeatures with non-spherical geometries (for example, disc-shaped Guinier–Preston zones in Supplementary Fig. 4).The results demonstrate that based on the existing, butincomplete data, not only were atoms accurately replaced backinto a precipitate, but also the existing long-range orderand shape of these nanostructural features were preserved.It emphasizes the fact that the different crystallographic shellssurrounding each atom inherently contain information aboutthe site occupation of elements along different crystallographicorientations.
Application to experimental data. This approach was thenapplied to replace the missing atoms in actual experimental APTdata. A thermally treated Al-5.6Ag-0.84Cu (at. %) alloy analysiswas chosen for this investigation since it contains a significantamount of nanostructure in the form of spherical, coherent AgGuinier–Preston zones (Fig. 3a; Supplementary Fig. 1). The datawere obtained on a straight-flight path local electrode atom probe3000X Si. Multiple sets of crystallographic planes in the data wereidentified and characterized using spatial distribution maps29
(Supplementary Fig. 2). The precision of both the SROmeasurement and the lattice rectification procedure isdependent on the spatial resolution of the APT data to whichthey are applied. Hence, a 20! 20! 100 nm region of interest(ROI), containing 1.2! 106 atoms, free of significantreconstruction artefacts was then identified and isolated. Thesedata are shown in Fig. 3a where at this scale only solute atoms areshown. A close-up within this ROI is also presented in which allthe atoms (matrix and solute) are shown.
Next, the complete set of GM-SRO parameters, [aAl–Al, aAl–Ag,aAl–Cu, aAg–Al,y, aAlAgCu–AlCu, aAlAgCu–AgCu], was measured forthe first five crystallographic shells where aAB–CD represents thedistribution of C- and D-type atoms around A- and B-type atoms.A key assumption that we make is that ion detection is effectivelya stochastic process, and hence, although a significant fraction ofatoms are missing from the final reconstruction, this does notaffect the values of the measured SRO, that is, the SRO wemeasure from a data set with 57% detection efficiency is the sameas that which would be measured in a hypothetical 100%detection efficiency data set. The validity of this assumption hasbeen previously investigated28. It is also well known that incertain analyses can occur a non-stochastic loss of ions due to acombination of preferential evaporation and detector pile-upeffects30,31, however, this is not expected to be a significant issuefor the alloys chosen for this study.
Following this, the ROI was subject to lattice rectification. Ithas previously been estimated that in a reasonable-sizedsubvolume of a pure Al reconstruction upwards of 85% of therectified atoms is returned to their correct lattice sites26. Theeffect of restoring the lattice is clearly apparent when comparingthe close-ups in Fig. 3a,b. The vacant lattice sites were thenidentified and their positions are highlighted in Fig. 3b by blacksquares. As for the simulations described above, atoms wererestored to these vacant sites, their chemical identities chosen atrandom but with the constraint that the overall bulk compositionremained the same throughout this process. A close-up of therestored atoms is shown in Fig. 3c. The corresponding image ofthe entire subvolume indicates the homogeneous distribution ofthe restored solute atoms throughout the system, and is in clearcontrast to the distribution of the experimentally detected solutesin Fig. 3a.
35.5 nm
5.5 nm
5.5 nm
5.5 nm
5.5 nm
5.5
nm
5.5
nm
5.5
nm
5.5
nm
35.5 nm
35.5
nm
35.5
nm
35.5
nm
35.5
nm
a
b
c
d
Figure 2 | Restoring atoms to simulated system. (a) On left is the original
simulation (B-type atoms are blue dots, C-type atoms are green and matrix
atoms are not shown at this scale for sake of visual clarity). On right is a
close-up of a specific precipitate. Matrix atoms are now shown and are now
depicted by red dots. (b) Same simulation after 63% of atoms have been
removed at random. On right is corresponding close-up of same precipitate.
(c) Atoms are replaced at random in the vacant lattice sites. The overall
composition of the system has been maintained. (d) The final system after
distribution of the restored atoms is rearranged via MC simulation to return
the original SRO.
ARTICLE NATURE COMMUNICATIONS | DOI: 10.1038/ncomms6501
4 NATURE COMMUNICATIONS | 5:5501 | DOI: 10.1038/ncomms6501 | www.nature.com/naturecommunications
& 2014 Macmillan Publishers Limited. All rights reserved.

The entire data set (including both detected and restoredatoms) was seeded into the MC simulation with target SRO basedon the measured GM-SRO parameters that measured the originalAPT data. The final solute distribution of the restored atoms ispresented in Fig. 3d. There is a striking agreement between thedistribution of the detected and restored solute atoms. This is asexpected, since they effectively represent two halves of the samematerial system that has been randomly split through the actionof the microchannel plate detector system. Supplementary Fig. 5shows a further example where this technique has been equallyeffective in restoring APT data containing precipitates with morecomplicated shapes. The final data set is a hybrid of experimentaland simulated data, an approximation of a completed 3D imageof the original specimen in which every atom is accounted forchemically and spatially.
APT-informed DFT calculation. There are many ways that theatomically complete hybrid APT data can potentially be used toinform simulations. The simplest example is a direct comparisonbetween the nature and distribution of nanostructure character-ized in the completed experimental data and that predictedby simulation. Alternatively, the hybrid APT data set could
potentially actually be directly seeded into a kinetic MC or MDsimulation to predict how the system will evolve with time, whensubject to specific treatments or conditions. Here we implementDFT simulations to demonstrate local area energy mapping in thethermally treated Al-5.6Ag-0.84Cu (at. %) system presented inFig. 3. DFT simulation was chosen because it can in principlepredict energetic, electronic and elastic properties of a specificatomic configuration. It is easy to envisage that local composi-tional variation will impact local properties, and then the macro-properties. However, precise quantification of realistic structuresto undertake such a calculation is a grand challenge—hindering atrue material optimization at the atomic level. To demonstratethis concept, we have carried out DFT simulations to calculate‘local cohesive energy’, ‘local Fermi energy’ and ‘local elasticmoduli’ within regions of the specimen. The cohesive energy isclosely correlated with many properties, including interatomicbonding strength, molar volume and compressibility32, while theFermi energy is critically important for the electrical and thermalproperties of solids33.
To conduct the energy mapping, first, 49 groups of ‘cubic’ 32-atom (2! 2! 2 supercells) subvolumes were randomly sampledfrom the hybrid APT data, as illustrated in Fig. 4a. Then, theduplicity of these subvolumes was assessed, indicating 15 pure Al
30
0 n
m
10
0 n
m
100 n
m
100 n
m
20 n
m2
0 n
m
20
nm
a b
cd
Figure 3 | Restoring missing atoms to actual APT data. (a) Left, Al-5.6Ag-0.84Cu (at. %) APT reconstruction. ROI is highlighted, which contains
1.2! 106 atoms. Only solute atoms (Ag blue, Cu green) are shown for clarity. Close-up within ROI also indicates position of matrix ions (Al red). (b) Close-
up of ROI after lattice rectification, restoring face-centred cubic crystal. Vacant lattice sites are highlighted by black squares. (c) Close-up of positions
of atoms randomly restored atoms to vacant sites. Corresponding image of entire ROI indicates the homogenous distribution of the restored solute atoms.
(d) ROI distribution of the restored atoms after the MC simulation to restore SRO.
NATURE COMMUNICATIONS | DOI: 10.1038/ncomms6501 ARTICLE
NATURE COMMUNICATIONS | 5:5501 | DOI: 10.1038/ncomms6501 | www.nature.com/naturecommunications 5
& 2014 Macmillan Publishers Limited. All rights reserved.

subvolumes and 8 subvolumes containing only a single Ag atom.In total, 25 unique configurations were identified, and these arepresented in Fig. 4. To account for environmental effects andenable periodic boundary conditions, each unique 32-atomconfiguration was then embedded into a 108-atom 3! 3! 3supercell. DFT total energy calculations were subsequentlyperformed, allowing atomic relaxation, that is, possible structuraldistortions were taken into account.
The calculated local cohesive energy as a function of number ofAg atoms contained in each subvolume is presented in Fig. 5a.Local cohesive energy clearly decreases with a linear dependenceon increasing number of local Ag atoms (goodness of fit of linearregression r2¼ 0.98). TheB0.1 eV per atom variation of cohesiveenergy across the Ag concentration range considered here isrelatively small (that is, within the error range for standard DFTcalculation for a given system). However, our systematic studyconsistently consolidates the reliability of this trend. Indeed, byexamining two higher-concentration configurations, 32-Ag-atomand 108-Ag-atom, it has been confirmed that this linearity is stillvalid. Such behaviour is reasonable if one compares the cohesiveenergy values of bulk Al and Ag. Experimental values are 3.39 eVper atom for pure Al versus 2.95 eV per atom for pure Ag34 andthe corresponding values calculated in this study are 3.33 eV peratom and 2.56 eV per atom, respectively. In the calculationsperformed here, for a single Al and Ag atom, the spin polarisationand Hund’s effects were explicitly included. It is also notable that,for each Ag concentration, increasing the number of Cu atomstends to increase the local cohesive energy, indicating anattractive interaction between Ag–Cu atoms.
The calculated local Fermi energy as a function of number ofAg atom is presented in Fig. 5b. Again, with increasing the Agconcentration, the Fermi energy decreases. The graph demon-strates that the local addition of Cu atoms further decreases thelocal Fermi energy (goodness of fit of linear regression r2¼ 0.90).This behaviour is to be expected since the Fermi energies of Agand Cu are much smaller than that of Al. Experimental values are5.49 eV for Ag, 7.00 eV for Cu and 11.7 eV for Al (ref. 33).The results demonstrate the importance of characterizing andcontrolling the local microstructure to tailor the micro- andultimately macro-properties accordingly.
The final DFT example presented in this study uses theinformation in the unique hybrid APT data format to investigatethe local mechanical and thermodynamic properties. In this case,the central parameters, namely, the elastic constants, are derivedby applying a set of homogeneous deformations and calculatingfrom the second derivative of the total energy as a function ofvolume, tetragonal and trigonal lattice distortions around theequilibrium structures. To our knowledge, a systematic compar-ison of elastic quantities as a function of local microstructurevariation has not been previously reported. Due to the lowsymmetries involved, we have selected seven of the 32-atomconfigurations in Fig. 4, whose relaxed equilibrium cells aretetragonal (or cubic) structures. For these cases, expressions canbe derived for bulk modulus,
B ¼C33 C11 þC12ð Þ& 2C2
13
C11 þC12 þ 2C33 & 4C13; ð1Þ
shear modulus
G ¼C11 &C12
2ð2Þ
and Young’s modulus,
Y ¼9B
1þ 3B=G: ð3Þ
119 nm
Al
29 n
m
Cu Ag Cell
28 nm
0.5 nm
14
0.5
nm
0.5 nm
32-Atom local region
1
5 6
2 3 4
87
9 10 1211
13 15 1716
18 19 2120
22 23 2524
Embedded configuration:
108-atom supercell
Figure 4 | Sampling regions of the hybrid APT data for local property
mapping. (a) Slice of the hybrid APTdata, red squares indicate regions that
have been randomly sampled. (b) Close-up of one of the sampled 32-atom
subvolumes. (c) The subvolume in b embedded into a 108-atom supercell.
(d) The unique 32-atom configurations. The sequence in which these
configurations appear in this figure is based on the associated increase in
cohesive energy calculated in Fig. 5.
ARTICLE NATURE COMMUNICATIONS | DOI: 10.1038/ncomms6501
6 NATURE COMMUNICATIONS | 5:5501 | DOI: 10.1038/ncomms6501 | www.nature.com/naturecommunications
& 2014 Macmillan Publishers Limited. All rights reserved.

Values for the six independent elastic constants have beencalculated and are listed in Table 1. The resulting measurementsof local elastic quantities are presented in Fig. 6, again plotted as afunction of the number of Ag atoms.
First, from Table 1 it is apparent that all calculated elasticconstants satisfy the criteria of mechanical stability for tetragonalcrystals35: C1140, C3340, C4440, C6640, (C11&C12)40, (C11
þC33& 2C13)40 and [2(C11þC12)þC33þ 4C13]40. Hence, it
can be asserted that all the examined local configurations areintrinsically stable. Further, the general trend for each of thesethree moduli (B, G and Y) is similar, increasing with Agconcentration. Yet, for a given Ag concentration, the calculatedorder of moduli values varies. All the three moduli (B, G and Y)can be used to evaluate material hardness, however, G and Y arebetter indicators36. The calculated B, G and Y values (75.67, 20.51and 56.42GPa, respectively) for pure Al agree reasonably wellwith those derived experimentally (76, 26 and 70GPa). Thecalculations presented in Fig. 6 results consistently suggest thatadding Ag will increase the local hardness.
DiscussionMicroscopy has continued to make great strides in characterizingmaterial microstructure with ever increasing details. However,there still remains an intrinsic disconnect between the micro-structure and the bulk material properties. The way in which localmicrostructure variations influence the macro-property is poorlyunderstood, restricting the potential to use information generatedby microscopy for the purpose of materials’ design. Hence, theaim of this study is twofold: first, from a microscopy perspective,the goal has been to extend the current limits of APT bygenerating complete hybrid experimental-analytical data sets of aform that can be seeded directly into atomistic simulations.Second, from the perspective of physical material properties, byusing these hybrid data sets, we attempt to bridge the gap betweenmicrostructure and macro-properties by studying the localproperties. The significance of this is that collectively these localproperties will contribute to define to the macroscopic properties.For inhomogeneous systems, in many cases, the ability toaccurately probe the local properties is highly desirable andrepresents a crucial step to understand the normally complicatedbulk properties and to offer information for material design37,38.The results demonstrate the importance of characterizing andcontrolling the local microstructure to tailor micro- andultimately macro-properties accordingly.
It must be noted that the method that has been developed torestore the data missing from APT characterization is based on astatistical process. The exact configuration of solute atoms thatconverges to a particular set of SRO parameters is not necessarilyunique. Hence, the hybrid APT data set that is ultimately
Table 1 | Local elastic constants calculated within 32-atom
subvolume configurations.
Configuration C11
(GPa)
C12
(GPa)
C13
(GPa)
C33
(GPa)
C44
(GPa)
C66
(GPa)
1 98.2 56.4 56.4 98.2 26.7 26.7
2 103 62 62 103 27.6 27.6
3 110.7 66.2 64.4 110.2 29.7 31.9
5 102.8 58 58 102.8 28.9 28.9
7 110.7 64.4 66.2 110.7 29.8 30.2
11 114.5 65.7 65.7 114.4 33.6 31.4
19 116.1 65.1 66.2 117.1 29.5 28.6
The values are sampled from within hybrid APT data (Fig. 4).
80
21
37
11 19
19117
35
1
12
5
37
11
B
G
Y
19
2
570
24
23
22
21
200 1
Number of Ag atoms
2 3
Thre
e d
iffe
rent m
oduli
(GP
a)
60
25
Figure 6 | Local bulk modulus (B), shear modulus (G) and Young’s
modulus (Y). Moduli calculated by DFT simulations informed directly by
local regions of the hybrid APT reconstruction and plotted as a function of
Ag content.
3.33
3.32
3.31
3.30
3.29
3.28
3.27
3.26
1
2 3
4
56
7
8
9
10
1112
13
21
20
19
18
17
16
15
14
22
23
2425
1
2
3
4
5
6
7
8
9
10
11
12
1321
2019
18
17
1615
14
22
23
24
25
3.25
3.24
6.35
6.30
6.25
6.20
6.15
6.10
6.45
6.40
Number of Ag atoms
Number of Ag atoms
Co
he
siv
e e
ne
rgy (
eV
pe
r a
tom
)F
erm
i energ
y (
eV
)
0 1 2 3 4 5 6 7 8 9 1210 11
0 1 2 3 4 5 6 7 8 9 1210 11
Figure 5 | DFT calculation of local energies as a function of Ag content.
(a) Local cohesive energy and (b) local Fermi energy calculated for each
unique 32-atom configuration.
NATURE COMMUNICATIONS | DOI: 10.1038/ncomms6501 ARTICLE
NATURE COMMUNICATIONS | 5:5501 | DOI: 10.1038/ncomms6501 | www.nature.com/naturecommunications 7
& 2014 Macmillan Publishers Limited. All rights reserved.

generated is one of the number of possible atomic configurationsthat could be obtained. However, this is analogous to examiningtwo or more successive APT analyses of the same specimen (forexample, a solid solution). Although the individual distributionsof solutes will be statistically equivalent, at the atomic scale,identical configurations would never be observed. Hence, thehybrid APT data represents the most likely configuration ofatoms based on the existing experimental information, which,although not unique, is a highly accurate representation of thetrue atomic structure of the material.
The approach also makes several key assumptions andapproximations. These are acknowledged here to map out thechallenges for routine and meaningful rectification and restora-tion of APT data into the future: it is assumed that detectionefficiency is independent of ionic identity; data must be free ofaberrant regions of high and low density; and the SRO analysismust have sufficient statistics to ensure that measurements arenot unduly biased and are representative of the bulk system.Currently, all atoms are mapped back onto a perfect singlecrystal lattice by the rectification process. Hence, the alloysystems studied in this work were either solid solutions ofengineering significance or alloy systems where precipitates arecoherent with the surrounding matrix. The understandinggained from relatively simple systems is instrumental in definingthe pathways to develop the infrastructure to investigatecomplex systems containing, for instance, interstitial atoms,defects, secondary phases or even grain boundaries. We envisagethat this will be a future development of the methodology,which will require development of secondary correctionsbased on all of the available information. Most of the limitationslisted above are issues affecting all APT-based characterizations,not just those developed in this study. As such, research isalready ongoing towards limiting the influence of all of theseeffects. Indeed, instrumentation will undoubtedly continue toimprove and rather than being relegated by such advances, theanalytical approach described here will be complemented bythese developments progressively improving accuracy andapplicability.
The APT-based methods developed in this study representa bridge between microstructure and micro-property.This outlook opens the pathway for a formidable nexus betweenthe determination of the structure of a material and itsproperties by using a range of other atomistic simulations (suchas MC and MD), particularly for intrinsically highly inhomo-geneous systems. One could also conceive of large-scale orbital-free DFT39 so as to relax the hybrid atom probe data andcircumvent the limitation currently associated with the hardlattice originating from the rectification procedure, which couldbe of paramount interest for replacing interstitial atoms orobtain the appropriate local crystal structure of precipitates, forexample, allowing for comparison with other characterizationtechniques such as electron microscopy or X-ray or neutronscattering.
MethodsAtom probe experiments. Al-5.6Ag-0.84Cu (at. %) alloy samples were solutiontreated for 1 h at 525 !C in a salt bath and cold water (15–20 !C) quenched. Spe-cimens for APT were prepared first by cutting small blanks (0.3mm! 0.3mm! 15mm) from the bulk alloy material before thermal ageing. Needle-shapedspecimens for APT analysis, with radii B50 nm, were prepared using standardtwo-stage electropolishing techniques4.
APT analysis was performed using a local electrode atom probe 3000X Simanufactured by Cameca. Experiments were performed at a specimen temperatureof B20–25K under ultrahigh vacuum conditions of B1! 10& 8Pa, in voltage-pulsing mode with a pulse fraction of 20% and a pulse repetition rate of 200 kHz.Reconstruction of the APT data was performed using the IVAS software package,which is based on a reverse-projection algorithm40, and was calibrated usingtechniques developed by Gault et al.41,42
SRO-based MC simulations. The first step in our process after acquiring andreconstructing the atom probe data is to characterize the average local chemicaldistribution via the measurement of SRO parameters. The GM-SRO22 is based onthe probability of finding particular types of atoms around another atom defined as
pmfBjg
kj¼1fBlg
hl¼0
¼ pmfB1 j ::: jBkgfB1 j ::: jBhg¼
Pk
j¼1
NBj
Pu
l¼h
pmBjBl
Pk
j¼1
NBj
: ð4Þ
Taking the example of an Al–Ag–Cu alloy, pm¼1fAggfCug represents the probability
of finding a Cu atom in the first shell (m¼ 1) around an Ag atom. Likewise,pm¼3fCugfAl;Cug represents the probability of finding an Ag or Cu atom in the thirdcrystallographic shell around Cu atom. The resulting GM-SRO expression isgiven by
am
fBjgkj¼1fBlg
hl¼0
¼ ð& 1Þ1þ d
fBjgkj¼1
fBl ghl¼0
! "
pmfBjg
kj¼1fBlg
hl¼0
&XfBlghl¼0
! "
dfBjgkj¼1fBlg
hl¼0
&XfBlghl¼0
# $ ð5Þ
where dfBjgkj¼1fBlg
hl¼0
equals 1 if the two sets contain exactly the same atomic species
and 0 otherwise, and XfBjgkj¼1
¼ XB1þ :::þXBk
. Again taking the current example,
this results in a set of possible parameters
a ¼ amAlf g Agf g; a
mAlf g Cuf g; a
mAlf g Alf g; a
mAgf g Alf g; :::; a
mAlAgCuf g AgCuf g
# $m¼1;2;3;::ð6Þ
where each element of this set can be measured as a function of radius, m. Thisrepresents a comprehensive statistical description of the system. An approach formeasuring GM-SRO in APT reconstructions, taking into account its finite spatialresolution and limited detected efficiency, has previously been developed22.
It has previously been demonstrated that in many cases, the SRO containssufficient information to accurately predict the identities of the atoms missing dueto finite detection in an APT experiment28. MC approaches have previously beendeveloped to drive a simulated atomic system to a specific configuration based onusing experimentally measured SRO as target parameter28,43. Starting at someinitial configuration atoms in a lattice, in each step of an SRO-based MCsimulation, the relative positions of two atoms are swapped at random. Aftereach trial move, the set of SRO is re-evaluated and if the swap drives theseparameters towards their target values the move is accepted, otherwise it is rejectedand the atoms are replaced to their original positions. Defining whether or notthe swapping of a pair of atoms has improved the overall configuration of thesystem is not straightforward. The target SRO can potentially comprise a largeset of parameters. Taking the example above, it is possible that the action ofrandomly swapping a pair of atoms may move the system towards the a
mAgf g Cuf g
target but simultaneously also move the system away from the amCuf g Cuf g
target. Hence, an objective metric is required in the algorithm to decide on whetherthe trial move has either improved or worsened the overall atomic configuration.Here, we define residual as a measure of the difference in the instantaneous SRO inthe simulated system and the experimentally measured target SRO values (denotedby the prefix T):
DSRO ¼X
amfigfjg &
Tamfigfjg
%
%
%
%
%
% ð7Þ
A swap reducing the value of DSRO is automatically accepted. The requirednumber of trial moves is dependent on the magnitude of the difference between thetarget and the current actual SRO parameter values, the concentration of eachelement, number of crystallographic shells, size of the data set and the number ofelements that constitute the alloy.
Lattice rectification. In APT, crystallographic information is most apparent in theform of crystallographic planes. Spatial distribution maps provide an efficientapproach for the characterization of these atomic planes (Supplementary Fig. 2), interms of inter-planar spacing, orientation and resolution (that is, the accuracy towhich atoms are placed on these planes). Knowledge of this underlying latticestructure combined with the local distribution of atoms in the raw data facilitatesthe remapping of the perturbed atom positions back to their true lattice sites, aprocess that we termed lattice rectification26.
Having identified the orientation of a set of crystallographic planes {hkl}, it canbe inferred that in the specimen, any two neighbouring atoms were actuallyseparated by a distance corresponding to an exact multiple of the plane spacing inthis direction. A small correction can be applied to the reconstructed coordinates ofatoms to satisfy this condition. If three independent sets of planes are identifiedwithin the data, this correction of atoms onto the closest plane, simultaneously inthree directions, provides a unique solution, that is, a single lattice site. Thesignificance of this result is that the lattice structure of the specimen is recoveredvia a progressive atom-by-atom triangulation.
The smallest possible correction is being made to the atomic coordinates,requiring access to highly spatially resolved data. However, trajectory aberrationscan result in significant inaccuracies in the original 3D positioning of an atom.Trajectory aberrations most often originate primarily from local magnificationeffects on the specimen surface arising from either the preferential evaporation or
ARTICLE NATURE COMMUNICATIONS | DOI: 10.1038/ncomms6501
8 NATURE COMMUNICATIONS | 5:5501 | DOI: 10.1038/ncomms6501 | www.nature.com/naturecommunications
& 2014 Macmillan Publishers Limited. All rights reserved.

retention of certain atoms. Such aberrations cause two main issues: (1) thecrystalline lattice appears smeared out by small dithering of the atomic positionsand (2) the shape of larger features (that is, precipitate, layers and so on) appearsdistorted. These effects have been thoroughly described in the literature, includingin recent reviews on the topic44–46. However, as shown in this study, it is oftenpossible to identify high-quality subvolumes of the data devoid of significant localmagnification effects. This simple lattice rectification approach requires APTreconstructions within which sufficient crystallographic information can beidentified, and incorporate significant regions of interest free of aberrations. It isnoted that this is currently not the case for many complex systems now studied byAPT. Although some of these contain a significant amount of crystallographicinformation47, until the accuracy the original reconstruction can be improved,lattice rectification is not meaningful for these systems.
DFT simulations. All-electron DFT calculations were performed using thegeneralized gradient approximation48 with the DMol3 program package49.The wave functions were expanded in terms of a double-numerical quality basisset, with a set of large values of real-space cut-off (Cu: 9.45 Bohr; Ag: 9.98 Bohr;Al: 10.88 Bohr). A reciprocal space of 4! 4! 4 K-point meshes was employed inthe calculations of the 108-atom supercells.
References1. Nellist, P. D. et al. Direct sub-angstrom imaging of a crystal lattice. Science 305,
1741–1741 (2004).2. Muller, D. A. et al. Atomic-scale chemical imaging of composition and bonding
by aberration-corrected microscopy. Science 319, 1073–1076 (2008).3. Midgley, P. A. & Dunin-Borkowski, R. E. Electron tomography and holography
in materials science. Nat. Mater. 8, 271–280 (2009).4. Miller, M. K., Cerezo, A., Hetherington, M. G. & Smith, G. D. W. Atom Probe
Field Ion Microscopy (Oxford Science Publications - Clarendon Press, 1996).5. Kelly, T. F. & Miller, M. K. Invited review article: atom probe tomography. Rev.
Sci. Instrum. 78, 031101 (2007).6. Seidman, D. N. Three-dimensional atom-probe tomography: advances and
applications. Annu. Rev. Mat. Res. 37, 127–158 (2007).7. Vitek, V. & Srolovitz, D. J. Atomistic Simulation of Materials: Beyond Pair
Potentials (Plenum Press, 1989).8. Gross, D. & Li, M. Constructing microstructures of poly- and nanocrystalline
materials for numerical modeling and simulation. Appl. Phys. Lett. 80, 746–748(2002).
9. Mao, Z. G., Sudbrack, C. K., Yoon, K. E., Martin, G. & Seidman, D. N. Themechanism of morphogenesis in a phase-separating concentratedmulticomponent alloy. Nat. Mater. 6, 210–216 (2007).
10. Pareige, C., Soisson, F., Martin, G. & Blavette, D. Ordering and phaseseparation in Ni-Cr-Al: Monte Carlo simulations vs three-dimensional atomprobe. Acta Mater. 47, 1889–1899 (1999).
11. Sha, G. & Cerezo, A. Kinetic Monte Carlo simulation of clustering in anAl-Zn-Mg-Cu alloy(7050). Acta Mater. 53, 907–917 (2005).
12. Clouet, E. et al. Complex precipitation pathways in multicomponent alloys.Nat. Mater. 5, 482–488 (2006).
13. Zhou, X. W. et al. Atomic scale structure of sputtered metal multilayers. ActaMater. 49, 4005–4015 (2001).
14. Balogh, Z., Chellali, M. R., Greiwe, G. H., Schmitz, G. & Erdelyi, Z. Interfacesharpening in miscible Ni/Cu multilayers studied by atom probe tomography.Appl. Phys. Lett. 99, 181902 (2011).
15. Amouyal, Y., Mao, Z. & Seidman, D. N. Phase partitioning and site-preferenceof hafnium in the gamma ’(L1(2))/gamma(fcc) system in Ni-based superalloys:an atom-probe tomographic and first-principles study. Appl. Phys. Lett. 95,161909 (2009).
16. Gault, B. et al. Atom probe tomography investigation of Mg site occupancywithin delta0 precipitates in an Al-Mg-Li alloy. Scr. Mater. 66, 903–906 (2012).
17. Geng, W. T., Ping, D. H., Gu, Y. F., Cui, C. Y. & Harada, H. Stability ofnanoscale co-precipitates in a superalloy: a combined first-principles and atomprobe tomography study. Phys. Rev. B 76, 224102 (2007).
18. Li, L. et al. Magnetism of Co-doped ZnO epitaxially grown on a ZnO substrate.Phys. Rev. B 85, 174430 (2012).
19. Yeoh, W. K. et al. Direct observation of local potassium variation and itscorrelation to electronic inhomogeneity in (Ba1-xKx)Fe2As2 pnictide. Phys.Rev. Lett. 106, 247002 (2011).
20. Cadel, E., Vurpillot, F., Larde, R., Duguay, S. & Deconihout, B. Depth resolutionfunction of the laser assisted tomographic atom probe in the investigation ofsemiconductors. J. Appl. Phys. 106, 1–6 (2009).
21. Gault, B. et al. Origin of the spatial resolution in atom probe microscopy. Appl.Phys. Lett. 95, 034103 (2009).
22. Ceguerra, A. V., Powles, R. C., Moody, M. P. & Ringer, S. P. Quantitativedescription of atomic architecture in solid solutions: a generalized theory formulticomponent short-range order. Phys. Rev. B 82, 132201 (2010).
23. Geiser, B. P., Kelly, T. F., Larson, D. J., Schneir, J. & Roberts, J. P. Spatialdistribution maps for atom probe tomography. Microsc. Microanal. 13,437–447 (2007).
24. Vurpillot, F., De Geuser, F., Da Costa, G. & Blavette, D. Application of Fouriertransform and autocorrelation to cluster identification in the three-dimensionalatom probe. J. Microsc. 216, 234–240 (2004).
25. Yao, L. et al. Crystallographic structural analysis in atom probe microscopy via3D Hough transformation. Ultramicroscopy 111, 458–463 (2011).
26. Moody, M. P. et al. Lattice rectification in atom probe tomography: toward truethree-dimensional atomic microscopy. Microsc. Microanal. 17, 226–239 (2011).
27. Vurpillot, F., Renaud, L. & Blavette, D. A new step towards the latticereconstruction in 3DAP. Ultramicroscopy 95, 223–230 (2003).
28. Ceguerra, A. V. et al. Short-range order in multicomponent materials. ActaCrystallogr. A 68, 547–560 (2012).
29. Moody, M. P., Gault, B., Stephenson, L. T., Haley, D. & Ringer, S. P.Qualification of the tomographic reconstruction in atom probe by advancedspatial distribution map techniques. Ultramicroscopy 109, 815–824 (2009).
30. Danoix, F., Miller, M. K. & Bigot, A. Analysis conditions of an industrialAl–Mg–Si alloy by conventional and 3D atom probes. Ultramicroscopy 89,177–188 (2001).
31. Saxey, D. W. Correlated ion analysis and the interpretation of atom probe massspectra. Ultramicroscopy 111, 473–479 (2011).
32. Turchanin, M. A. & Agraval, P. G. Cohesive energy, properties, and formationenergy of transition metal alloys. Powder Metall. Met. Ceram. 47, 26–39 (2008).
33. Ashcroft, N. W. & Mermin, N. D. Solid State Physics (Saunders College, 1976).34. Kittel, C. Introduction to Solid State Physics (Wiley, 2004).35. Born, M. & Huang, K. Dynamical Theory of Crystal Lattices (Clarendon Press,
1956).36. Fulcher, B. D., Cui, X. Y., Delley, B. & Stampfl, C. Hardness analysis of cubic
metal mononitrides from first principles. Phys. Rev. B 85, 184106 (2012).37. Gavini, V., Bhattacharya, K. & Ortiz, M. Quasi-continuum orbital-free density-
functional theory: a route to multi-million atom non-periodic DFT calculation.J. Mech. Phys. Solids 55, 697–718 (2007).
38. Gustafsson, A., Pistol, M.-E., Montelius, L. & Samuelson, L. Local probetechniques for luminescence studies of low-dimensional semiconductorstructures. J. Appl. Phys. 84, 1715–1775 (1998).
39. Storm, K. et al. Spatially resolved Hall effect measurement in a singlesemiconductor nanowire. Nat. Nanotechnol. 7, 718–722 (2012).
40. Gault, B. et al. Advances in the reconstruction of atom probe tomography data.Ultramicroscopy 111, 448–457 (2011).
41. Gault, B. et al. Estimation of the reconstruction parameters for atom probetomography. Microsc. Microanal. 14, 296–305 (2008).
42. Gault, B. et al. Advances in the calibration of atom probe tomographicreconstruction. art. no. 034913. J. Appl. Phys. 105, 34913 (2009).
43. de Fontaine, D. The number of independent pair-correlation functions inmulticomponent systems. J. Appl. Crystallogr. 4, 15–19 (1971).
44. Miller, M. K. & Hetherington, M. G. Local magnification effects in the atomprobe. Surf. Sci. 246, 442–449 (1991).
45. Vurpillot, F., Cerezo, A., Blavette, D. & Larson, D. J. Modeling imagedistortions in 3DAP. Microsc. Microanal. 10, 384–390 (2004).
46. Larson, D. J., Gault, B., Geiser, B. P., De Geuser, F. & Vurpillot, F. Atom probetomography spatial reconstruction: status and directions. Curr. Opin. SolidState Mater. Sci. 17, 236–247 (2013).
47. Gault, B., Moody, M. P., Cairney, J. M. & Ringer, S. P. Atom probecrystallography. Mater. Today 15, 378–386 (2012).
48. Perdew, J. P., Burke, K. & Ernzerhof, M. Generalized gradient approximationmade simple. Phys. Rev. Lett. 77, 3865–3868 (1996).
49. Delley, B. From molecules to solids with the DMol(3) approach. J. Chem. Phys.113, 7756–7764 (2000).
AcknowledgementsWe are grateful for scientific and technical input and support from staff and students
from the Department of Materials at the University of Oxford and the Australian
Microscopy & Microanalysis Research Facility (AMMRF) at The University of Sydney.
We acknowledge the computing resources provided by the National Computational
Infrastructure (Australia) and support from the Australian Research Council.
Author contributionsM.P.M. and S.P.R. led the research. M.P.M. developed the lattice rectification algorithm
and contributed to development of the SRO measurements and the SRO-based MC
simulations. A.V.C. designed the SRO measurements and the SRO-based MC simula-
tions, and contributed to the design of the DFT simulations. A.J.B. contributed to the
development of the lattice rectification methodology and the MC simulations. X.Y.C.
designed, undertook and interpreted the DFT simulations. B.G. generated the simulated
APT-like data, contributed to the development of the analytical techniques and the
application of the data in DFT simulations. L.T.S. and R.K.W.M. undertook the APT
experiments, provided the reconstructions and contributed to development of the
analytical techniques. R.C.P. contributed to the development of the SRO measurements
and the SRO-based MC simulations. S.P.R. directed the research programme. All authors
discussed results and contributed to writing of the paper.
NATURE COMMUNICATIONS | DOI: 10.1038/ncomms6501 ARTICLE
NATURE COMMUNICATIONS | 5:5501 | DOI: 10.1038/ncomms6501 | www.nature.com/naturecommunications 9
& 2014 Macmillan Publishers Limited. All rights reserved.

Additional informationSupplementary Information accompanies this paper at http://www.nature.com/
naturecommunications
Competing financial interests: The authors declare no competing financial interests.
Reprints and permission information is available online at http://www.nature.com/
reprintsandpermissions/
How to cite this article: Moody, M. P. et al. Atomically resolved tomography to
directly inform simulations for structure-property relationships. Nat. Commun. 5:5501
doi: 10.1038/ncomms6501 (2014).
ARTICLE NATURE COMMUNICATIONS | DOI: 10.1038/ncomms6501
10 NATURE COMMUNICATIONS | 5:5501 | DOI: 10.1038/ncomms6501 | www.nature.com/naturecommunications
& 2014 Macmillan Publishers Limited. All rights reserved.
Copyright © 2022 FDOKUMEN