Nanostructuring Titania: Control over Nanocrystal Structure, Size, Shape, and Organization
This journal is c the Owner Societies 2013 Phys. Chem. Chem. Phys., 2013, 15, 3917--3929 3917
Cite this: Phys. Chem.Chem.Phys.,2013,15, 3917
Chemically-synthesised, atomically-precise goldclusters deposited and activated on titania†
David P. Anderson,a Jason F. Alvino,b Alexander Gentleman,b Hassan Al Qahtani,c
Lars Thomsen,d Matthew I. J. Polson,a Gregory F. Metha,*b Vladimir B. Golovko*a
and Gunther G. Andersson*c
Synchrotron XPS was used to investigate a series of chemically-synthesised, atomically-precise gold clusters
Aun(PPh3)y (n = 8, 9, 11 and 101, with y depending on cluster size) immobilized on titania nanoparticles.
The gold clusters were washed with toluene at 100 1C or calcined at 200 1C to remove the organic
ligand. From the position of the Au 4f7/2 peak it is concluded that cluster size is not altered through the
deposition. From the analysis of the phosphorous spectra, it can be concluded that the applied heat
treatment removes the organic ligands. Washing and calcination leads to partial oxidation and partial
agglomeration of the clusters. Oxidation of the clusters is most likely due to the interaction of the cluster
core with the oxygen of the titania surface after removal of ligands. The position of the Au 4f7/2 peak
indicates that the size of the agglomerated clusters is still smaller than that of Au101.
Introduction
Fabrication of support-immobilized nanoparticles as modelsystems1,2 in heterogeneous catalysis follows two distinctroutes. The first route relies on the classical surface scienceUHV techniques. In this case, metal nanoparticles are created onflat supports either via gas phase delivery and support-assistedself-assembly3 of metal atoms by evaporation of the metal4–6 or bythe deposition of size-selected clusters formed in the gas phaseafter the evaporation of the metal.7–9 The second route involveschemical synthesis of nanoparticles or their precursors followedby their deposition onto the support. This route offers the hugebenefit of easy scale-up and testing of the fabricated materialsunder industrially relevant conditions. Generally, there are threealternative methods for the chemical catalyst fabrication route,with varying degree of control over the precision with which thenanoparticles are created. The simple chemical methods aim to
control the growth of nanoparticles on various supports viareduction/decomposition of simple precursors, such as simplemetal salts or simple organometallic compounds.10 Improvedcontrol can be achieved via the immobilization of pre-mademetal ion containing templates, such as metal ion containingdendrimers,11 onto supports followed by careful reduction/decomposition to form well defined nanoparticles. Alternatively,the metal core (containing metal–metal bonds) of the nano-particle can be formed during the synthesis stage (i.e. in theliquid phase cf. on the support surface) with an excellent degreeof control over the size and chemical composition. Liquid phasesynthesis of gold colloids with narrow metal core size distributions,stabilized by capping groups dates back to the 19th centurystudies by Faraday.12
Immobilization of colloids and clusters onto supports is animportant step in the fabrication of heterogeneous catalysts. Thepost-fabrication activation of such catalysts by calcination13–17
or washing18 could afford nanoparticles, from which some orall ligands have been removed and where the size is defined bythe specific precursor (colloid or cluster). However, in somecases catalytic activity is attributed to intact clusters on the support,i.e. clusters from which ligands have not been removed.19
Detailed studies of the effects of the activation processeson the morphology and electronic properties of the support-immobilized nanoparticles are required to understand thenature of such catalysts. Importantly, support-immobilizationof atomically-precise chemically-synthesised clusters offers anopportunity to control the active site of the heterogeneous
a The MacDiarmid Institute for Advanced Materials and Nanotechnology,
Department of Chemistry, University of Canterbury, Christchurch 8140,
New Zealand. E-mail: [email protected] Department of Chemistry, University of Adelaide, 5005, Australia.
E-mail: [email protected] Flinders Centre for NanoScale Science and Technology, Flinders University,
Adelaide SA 5001, Australia. E-mail: [email protected] Australian Synchrotron, 800 Blackburn Road, Clayton Vic-3168, Australia
† Electronic supplementary information (ESI) available: CCDC 907703 and907704. For ESI and crystallographic data in CIF or other electronic format seeDOI: 10.1039/c3cp44005b
Received 11th November 2012,Accepted 16th January 2013
DOI: 10.1039/c3cp44005b
www.rsc.org/pccp
PCCP
PAPER
Ope
n A
cces
s A
rtic
le. P
ublis
hed
on 1
7 Ja
nuar
y 20
13. D
ownl
oade
d on
29/
11/2
014
15:3
0:19
. T
his
artic
le is
lice
nsed
und
er a
Cre
ativ
e C
omm
ons
Attr
ibut
ion
3.0
Unp
orte
d L
icen
ce.
View Article OnlineView Journal | View Issue
3918 Phys. Chem. Chem. Phys., 2013, 15, 3917--3929 This journal is c the Owner Societies 2013
catalyst with an ultimate precision allowing correlation of anyobserved catalytic reactivity with the structural and electronicproperties of the key ingredients – exactly defined metalmoieties. Thus, detailed understanding of the deposition ofatomically precise gold clusters and the effect of activationprocesses is important for the development of better strategiesfor fabrication of heterogeneous catalysts.
Titania is a particularly important support material inthe field of gold nanoparticle-based heterogeneous catalysts.3
Surprisingly, fabrication and activation of catalysts usingchemically-synthesised, atomically precise gold clusters supportedon titania is practically unexplored.20 Thus, for the purpose of thisstudy we have focused our efforts on gold clusters supported onTiO2 P-25 Aeroxide – a commercially available material which isoften used as a standard in the field of TiO2-focused research.
Gold particles with a size reduced below 5 nanometres areknown to be catalytically active.21,22 Moreover, it was demonstratedthat the onset of catalytic activity of gold coincides with the loss ofmetallic properties of Au nanoparticles at around 1.5–2 nm. Thissize-threshold is established for both naked clusters preparedunder UHV conditions23 and chemically synthesised,14 well-definedmetal nanoparticles immobilized onto inert supports.
More recently, there have been reports that the reactivityproperties can become even more dramatic when the particlesize is less than 1 nm, where each particle can be consideredas a nanocluster (or cluster). There is evidence of excellentcatalytic performance of specific, size-selected clusters producedin the gas phase. For example, the CO oxidation by Au8 clustersdeposited on MgO surfaces has been experimentally shown tooccur at 150 K,9 whereas smaller clusters are inert. Hutchingsand co-workers have demonstrated that a tiny amount of goldnanoclusters consisting of ca. 10 atoms is responsible for highCO-oxidation activity of a catalyst containing a majority of goldin the form of larger particles immobilized on iron-oxide.24
Similarly, Flytzani-Stephanopoulos and co-workers have shownthat sub-1 nm gold particles on ceria are highly active inthe methanol-steam-reforming and water-gas-shift reactions,compared to effectively inactive particles larger than 3 nmin size.25,26 Finally, chemically made, atomically-precise goldclusters stabilized by thiols (i.e. strongly bonding ligands) havevery recently been shown to be active in reactions of oxidationand hydrogenation.27–29
Whilst there is general agreement that the size and the electronicstructure of the active components of the nanoparticles plays acritical role in the catalytic process, systematic studies revealing theelectronic structure of chemically-synthesized gold clusters used incatalysis are still very rare. For this reason, electronic spectroscopy,such as XPS, is an important tool in identifying the electronic effectsat play.30 In particular, many studies have focussed on the 4f7/2
orbital of gold as it provides a convenient and sensitive measure ofthe electronic state of gold. In the following five paragraphs we willgive an overview of how the binding energy of the core electronsdetermined by XPS informs about the size and chemical state of thedeposited clusters. This overview is essential for the interpretation ofthe XPS spectra. However, the reader could also proceed to the endof this section where a summary is provided.
Firstly, the oxidation state plays a major role in the peakposition. The literal gold standard is bulk gold (i.e. Au0), inwhich the 4f7/2 peak is well known to appear at 84.0 eV with a3.67 eV separation to the 4f5/2 peak. Upon complete oxidation toAu2O3, the 4f7/2 peak shifts to 85.8–86.2 eV, depending upon thesubstrate;31,32 the thickness of gold oxide layer is estimated tobe between 0.75 nm31 and 3.3 nm,32 providing the 4f7/2 peakposition values for a macroscopic layer of gold oxide surface(cf. nanoparticles of Au2O3). Secondly, initial and final stateseffects also determine the peak position as well as the full-width-half-maximum of the peaks, both depending on theelement forming the cluster, its size and its interaction withthe substrate.33 Changes in the valence electron structureresulting from reduced size of the cluster (cf. the bulk metal)and changes due to the interaction with the substrate contri-bute to the initial state effects.33 After excitation, the metalnanocluster can stay in a charged state for a certain period oftime, which often depends on the size of the cluster and thetype of the substrate. This is often referred to as a final stateeffect.33 Therefore, the peak position and width can provideinformation that is of fundamental importance for understandingthe electronic structure of metal nano-clusters, whether they areprepared via gas phase deposition or are chemically synthesised.However, interpreting changes of peak positions as an initial orfinal state effect based on experimental data is very difficult forgold as the Auger lines are rather weak.33,34 Thus, in the presentwork only changes in peak positions will be considered and notinterpreted as initial or final state effects.
Over the last decade there have been a number of studies ofsub-monolayer gold films evaporated onto various substratesand of chemically synthesised clusters in various matrices. Alarge variety of results was reported. The difficulty with findinga unifying thread between these studies is the uncertainty inparticle size, particularly below 1 nm, where exact size deter-mination is difficult. We provide a thorough, though notexhaustive, description of previous work using XPS to deter-mine key properties of ultra-small gold particles/clusters. It isordered according to the specific way in which the materialshave been fabricated. We will start with gold nanoparticles withinthe ultra-small (sub-2 nm) particle size-regime made withoutprecise control of the particle sizes; followed by atomically precisenaked gold clusters made under UHV conditions, size-selectedand soft-landed onto specific support material; and finally discussthe atomically-precise, chemically-synthesised ligand protectedgold clusters deposited onto a specific support from solution.
Buttner et al. evaporated gold onto pristine HOPG anddefect-rich HOPG following bombardment with Ar ions. Nopeak shifts were found on the pristine surface, whereas gold onthe defect-rich HOPG shows peak shifts of up to +1.5 eV,multiple peaks and peak broadening.4 The authors attributethe peak shift and broadening to the preferential formation ofgold particles at the defect sites which are found in a muchhigher number on the HOPG exposed to Ar bombardment.Kitsudo et al. evaporated gold onto graphite and various metaloxides.5 The gold peaks did not shift on the graphite andNiO(001) substrates. However, peak shifts of up to +0.4 eV were
Paper PCCP
Ope
n A
cces
s A
rtic
le. P
ublis
hed
on 1
7 Ja
nuar
y 20
13. D
ownl
oade
d on
29/
11/2
014
15:3
0:19
. T
his
artic
le is
lice
nsed
und
er a
Cre
ativ
e C
omm
ons
Attr
ibut
ion
3.0
Unp
orte
d L
icen
ce.
View Article Online
This journal is c the Owner Societies 2013 Phys. Chem. Chem. Phys., 2013, 15, 3917--3929 3919
observed on SrTiO3, Al2Ox/NiAl(110), TiO2 and NiO(111) at sub-monolayer gold coverage. Importantly, on both SrTiO3 andgraphite the full-width-half-maximum (FWHM) of the goldpeak decreased slightly with increasing particle size. Lykhachet al. evaporated gold on Nb2O5/Nb, Nb2O5/W and NbO/Nbsurfaces.35 They find shifts in the gold peak position of up to+0.7 eV, with the largest shifts observed for the smallest Aucoverage. Lim et al. evaporated gold on SiO2/Si and observedshifts of the gold peak of up to +1 eV. Again, the largest shiftcorresponded to the smallest amount of gold evaporated.Exposure to atomic oxygen leads to the appearance of a secondpeak at about 86 eV, attributed to the formation of Au2O3.6
Deposition of size-selected clusters produced under gas-phase conditions have been known for over a decade. DiCenzoet al. measured Au 4f XPS data for gas phase, size-selected Aun
clusters deposited on amorphous carbon. For cluster sizes ofn = 5, 7, 27 and 33 they observed shifts of +0.7, +0.6, +0.5 and+0.5 eV, respectively, with peak FWHM being slightly broaderfor the smaller clusters.36 Cox et al. reported Au 4f7/2 XPSdata for gas phase, size-selected positively charged clustersdeposited on silica (natural oxide layer on Si(100)-wafers). Theyobserved a shift of +0.8–1.0 eV for Aun (n = 1–7).37 More recently,Lim et al. have published a series of papers where mass-selected Au cluster anions up to 20 atoms were soft-landedonto SiO2/Si surfaces and the samples subsequently exposed toatomic oxygen.6,38–40 Although peak widths of 1.5 eV wereobserved, in addition to Au0 peaks, the clusters also exhibitedfeatures attributed to AuIII, which were shifted by +1.5 eV.Interestingly, an even–odd effect was observed, wherebythe odd-numbered clusters were inert towards oxidation andexhibited very small AuIII peaks, particularly so for Au5, Au7 andAu13. These workers also deposited the same clusters on sputter-damaged HOPG. In this case, only Au8 showed any ability tooxidise after oxygen treatment. Small gold peak shifts of +0.1 eVto +0.2 eV were observed relative to bulk gold.
XPS studies have also been performed on chemically-synthesised,ligand protected gold species; from monoatomic Au com-pounds (e.g. Au(PPh3)(NO3)), to atomically precise Au clusters(e.g. Au8(PPh3)8(NO3)3), to even larger, less precise, nanoparticlesspanning the size range from ca. 1.5 nm (‘‘Au101’’41) and above.Yuan et al. have deposited Au(PPh3)(NO3) on Ti(OH)4 and TiO2
showing a Au 4f7/2 of 85.5 eV in the first case and 84.8 eV in thelatter case and attributed the difference in binding energy todifferent interactions of the cluster with the substrate.42 Chusueiet al. deposited [Au6(PPh3)6][BF4]2 clusters on TiO2 and observedAu 4f7/2 peaks with binding energy of 83.9 eV.43 Removal of thetriphenylphosphine ligand groups via electron-stimulateddesorption resulted in a shift of +0.4 eV. This was attributed tothe removal of the ligands, which was corroborated by a reductionin size as observed by STM. Very early XPS studies by Battistoniet al. investigated Au1 Au4, Au8, Au9 and Au11 clusters stabilised bytriphenylphosphine ligands.44,45 Samples deposited from alcoholsolutions onto steel sample plates showed Au binding energiesthat were 0.7 to 1.7 eV higher than bulk gold, and which dependedupon the number of ligands and the counter ions. By analysis ofthe different peak shapes they concluded that Au9 and Au11
clusters possess centred polyhedral geometries with a centralmetal atom involved only in metal–metal bonds. Van Attekumand co-workers similarly published an XPS analyses of chemicallysynthesised Au8, Au9 and Au11 stabilised by tri-arylphosphineligands.46 Clusters were evaporated onto graphite substrates fromsolutions in dichloromethane. All clusters exhibited individual Au4f7/2 peaks with widths of 1.5 eV. Only kinetic energy values havebeen tabulated and calibrated relative to the P peak, however,these could be subject to a chemical shift so the peak positionsmay not be reliable. Boyen et al. used XPS to investigate a series ofgold nanoparticles made using polymers as stabilizing agentswith metal core sizes ranging from 2.9 down to 0.8 nm depositedon silicon. Following removal of stabilizers by treatment first withoxygen and subsequently with hydrogen plasma, the authorsfound peak shifts of up to +0.5 eV at their smallest cluster sizeof 0.8 nm.47 The same authors found that phosphine stabilized1.4 nm (similar size as Au101 (ref. 41)) nanoparticles after oxygen/hydrogen plasma treatment show an Au 4f7/2 peak at about84.2 eV. Ono et al. reported for polymer-stabilised gold particlespeak positions of about 85 eV for 1.5 nm gold and about 87 eVfor oxidised 1.5 nm gold clusters on both TiO2 and SiO2 substratesfollowing treatment at 150 K with oxygen plasma only.48
Upon heating, they observed very fast decomposition of goldoxide species (within 6 min at 350 K) for the nanoparticlessupported on TiO2 which was in stark contrast to the case ofSiO2-supported gold oxide species. More recently, Turner et al.found the Au 4f7/2 peak of 1.5 nm gold clusters deposited on BN ata binding energy of 85.1 eV.14
In summary, the smaller clusters tend to exhibit the highestbinding energy shifts, with the binding energy decreasing ascluster size increases before finally converging to the bulk valueat large cluster sizes.5,36,47,49,50 The FWHM also shows in manycases an increase with decreasing cluster size.5,35 The shift,however, also strongly depends on the substrate. For ‘‘inert’’substrates such as HOPG and pure Si, only small shifts, o0.1 eV,are observed. SiO2 surfaces tend to shift the peaks by B0.2 eV tohigher energy. Highly interacting surfaces such as TiO2, SrTiO3,Al2O3 and NiO(111) induce shifts up to 1.5 eV.
The goal of this paper is to identify changes in electronicstructure for a series of chemically-synthesised, atomically-precise gold clusters that occur upon their deposition ontotitania followed by selected treatments – washing and calcina-tion under mild conditions. Using Synchrotron XPS we havemonitored removal of ligands, changes attributed to partialagglomeration and interaction of the cluster core with thesubstrate.
Experimental
The clusters were synthesized according to well-established,previously reported methods. Each cluster has been recrystallisedat least twice to achieve high purity. Furthermore, their identitieshave been confirmed by NMR, MS and X-ray crystallography(CCDC 907704 for Au11 and 907703 for Au8, Fig. 1 and ESI†).Specific details of the synthesis and purification via recrystallisa-tion of the Aun clusters (n = 8, 9, 11, 101) is described in the ESI.†
PCCP Paper
Ope
n A
cces
s A
rtic
le. P
ublis
hed
on 1
7 Ja
nuar
y 20
13. D
ownl
oade
d on
29/
11/2
014
15:3
0:19
. T
his
artic
le is
lice
nsed
und
er a
Cre
ativ
e C
omm
ons
Attr
ibut
ion
3.0
Unp
orte
d L
icen
ce.
View Article Online
3920 Phys. Chem. Chem. Phys., 2013, 15, 3917--3929 This journal is c the Owner Societies 2013
The following information regarding preparation of the support-immobilised clusters and treatments is presented below becauseit is essential to the discussion.
Deposition of clusters onto support
A solution of the cluster (20 mg) in methanol (30 mL) wasadded to the magnetically stirred suspension of acid washedEvonik P-25 (2 g) in methanol (50 mL) in a Schlenk tube. Thesuspension was left overnight and the solvent removed undervacuum taking care to avoid contamination of the Schlenk linewith the resulting dry powder. The material obtained in thisway was stored in a refrigerated Schlenk tube under N2 and inthe absence of light.
Evonik P-25 particles were chosen as substrates as thismaterial is a very popular TiO2 support used by numerousresearchers worldwide, which very recently was U.S. NationalInstitute of Standards and Technology as a nanoscale referencematerial. Further, particles have a large number of surfacedefects which is assumed to support the adsorption on thesurface.51 It has to be noted that Evonik P-25 is a mixture of70% anatase and 30% rutile particles. The interaction betweenthe gold clusters and anatase and rutile could differ52 resultingin two different types of surfaces after deposition of the goldclusters. Prior to deposition of the gold clusters, the titaniaparticles were treated with sulphuric acid.18
Supported cluster treatment conditions
Solvent treatment (washing) was undertaken following asimilar protocol described by Lopez-Sanchez et al.18 Typically,the magnetically stirred (1000 rpm) suspension of the supportedcluster on TiO2 (ca. 500 mg) in toluene (50 mL) was heated
to 100 1C for 2 hours. The solid was then recovered usingcentrifugation (10 min, 5000 rpm). The solid was then washedthree times with toluene (50 mL) by forming a suspension usinga Vortex agitator followed by centrifugation (10 min, 5000 rpm)to recover the solid, which was then dried under reducedpressure at about 10�2 mbar. The material obtained in thisway was stored in a refrigerated Schlenk tube under N2 and inthe absence of light.
Toluene was chosen as a solvent in the washing procedure asit is frequently used in catalytic processes. Thus, washingtreatment with toluene at elevated temperatures also mimicsthe effect of the induction period during the first two hours ifuntreated catalyst is used.
Heat treatment or calcination
We follow the protocol described by M. Turner et al.14 Thesupported cluster on TiO2 (ca. 500 mg) in a Schlenk tube wasstirred (1000 rpm) and heated at 200 1C (oil bath) under vacuumfor 2 hours. The sample was then removed from the oil bath andallowed to cool to room temperature under reduced pressure.The material obtained in this way was stored in a refrigeratedSchlenk tube under N2 and in the absence of light.
Sample preparation for XPS analysis
A suspension of the support-immobilised cluster was made upin dichloromethane at a concentration of ca. 1 mg mL�1. A10 mL drop of each sample was deposited onto a clean 6� 6 mmsilicon (Si) wafer and dried in air. Each sample was then fixedby double-sided copper tape onto a gold-plate; up to 6 sampleswere affixed onto each plate for XPS analysis. On a representa-tive number of samples, various spots were investigated.Between the investigated spots, no significant variation of theXPS signals was found. To confirm reproducibility of ourresults a completely new batch of the Au9 cluster was depositedon a new batch of acid washed TiO2 and the resulting materialwas heat treated as before. The XPS spectra for new ‘‘untreated’’and ‘‘calcined’’ samples were in excellent agreement withearlier obtained data.
Synchrotron beam line
Photoelectron spectra were recorded at the Soft X-ray Beamlineat the Australian Synchrotron (AS) using a SPECS Phoibos150 hemispherical electron analyser with the photon energyset to 650 eV. The beam was adjusted to yield an irradiationspot size of B600 � 600 mm, yielding an X-ray photon flux ofapproximately 1012 photons mm�2 s�1, conditions that havebeen shown not to induce thermal damage to samples ofNaAuCl4.53 High resolution XPS spectra of C, O, Si, P, Ti andAu were recorded at a pass energy of 10 eV, yielding aninstrumental resolution of 295 meV.54 Scans were repeatedseveral times to ensure that no photon-induced changesoccurred in the samples. The stability of the energy of theX-ray was monitored using a bulk gold reference.
All XPS spectra were fitted in the following manner. A Shirleybackground was applied to remove the electron-scattering back-ground and maintain the intrinsic line shape from the raw data.55,56
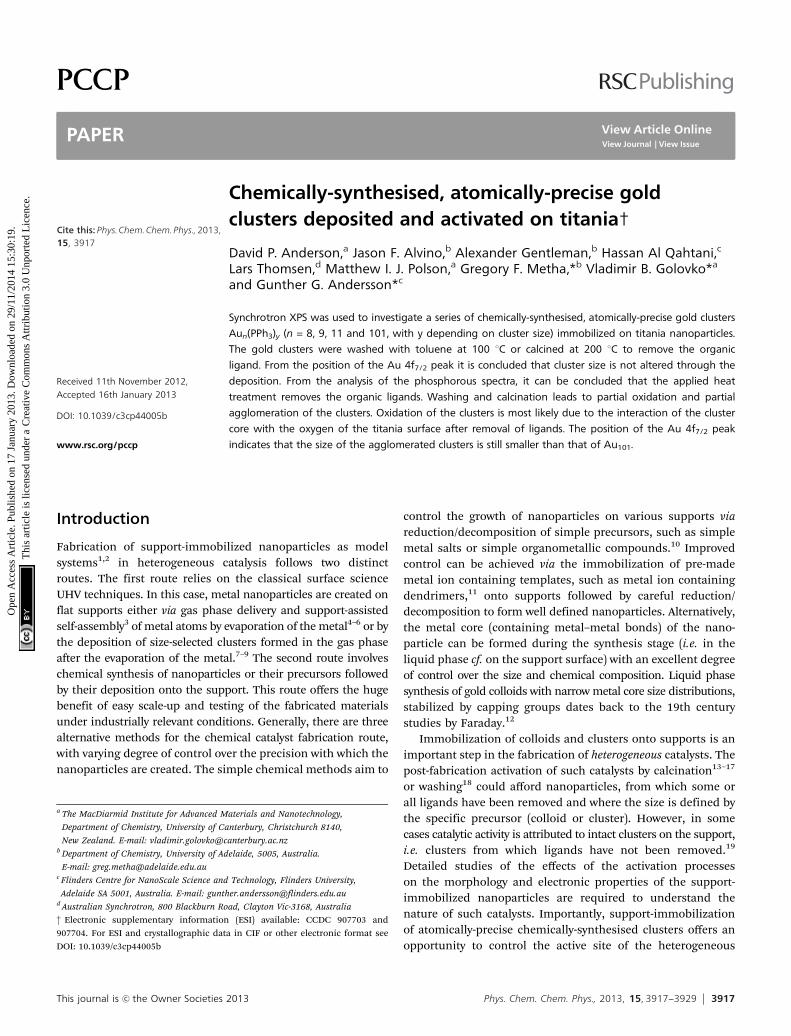
Fig. 1 Crystal structures of Au8 (left column), Au9 (centre column) and Au11
(right column) clusters showing the exact number of Au atoms per cluster core.Top row: space-filled models showing triphenylphospine ligands effectivelyprotecting the metal cores buried underneath. Centre row: ball and stickmodel showing positions of all atoms except hydrogen, co-crystallisation solventmolecules and non-coordinated counter anions. Bottom row: geometries of themetal cores only. The atomic colour scheme is gold (Au), orange (P), green (Cl),and black (C).
Paper PCCP
Ope
n A
cces
s A
rtic
le. P
ublis
hed
on 1
7 Ja
nuar
y 20
13. D
ownl
oade
d on
29/
11/2
014
15:3
0:19
. T
his
artic
le is
lice
nsed
und
er a
Cre
ativ
e C
omm
ons
Attr
ibut
ion
3.0
Unp
orte
d L
icen
ce.
View Article Online
This journal is c the Owner Societies 2013 Phys. Chem. Chem. Phys., 2013, 15, 3917--3929 3921
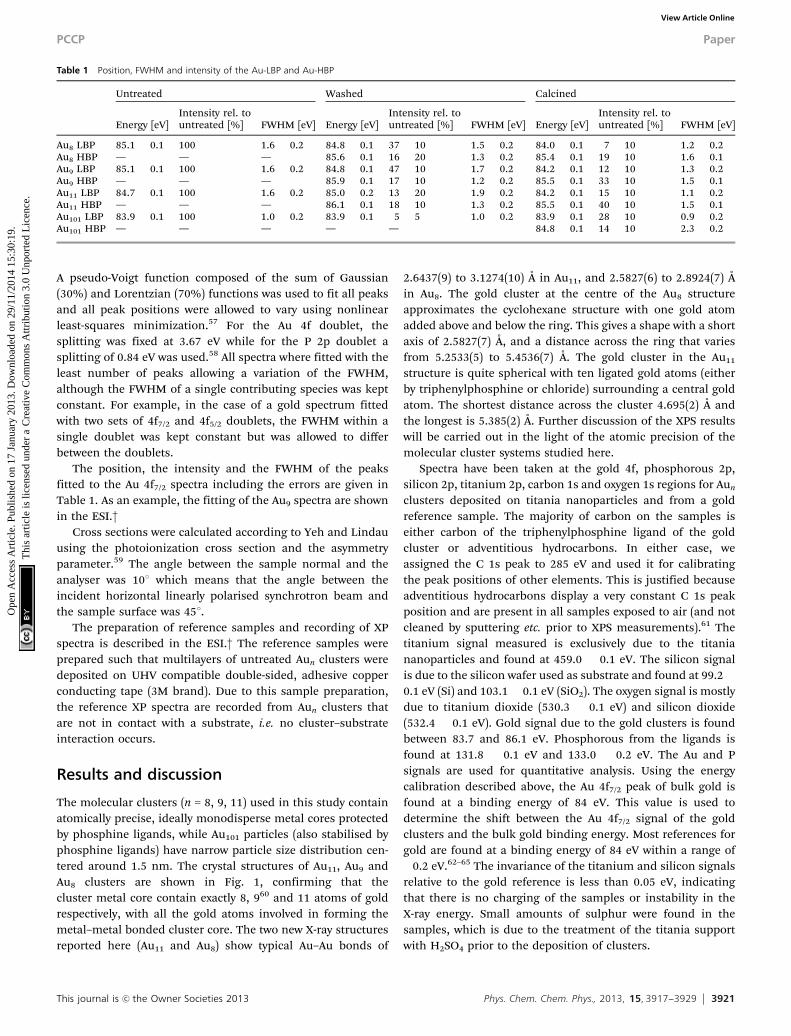
A pseudo-Voigt function composed of the sum of Gaussian(30%) and Lorentzian (70%) functions was used to fit all peaksand all peak positions were allowed to vary using nonlinearleast-squares minimization.57 For the Au 4f doublet, thesplitting was fixed at 3.67 eV while for the P 2p doublet asplitting of 0.84 eV was used.58 All spectra where fitted with theleast number of peaks allowing a variation of the FWHM,although the FWHM of a single contributing species was keptconstant. For example, in the case of a gold spectrum fittedwith two sets of 4f7/2 and 4f5/2 doublets, the FWHM within asingle doublet was kept constant but was allowed to differbetween the doublets.
The position, the intensity and the FWHM of the peaksfitted to the Au 4f7/2 spectra including the errors are given inTable 1. As an example, the fitting of the Au9 spectra are shownin the ESI.†
Cross sections were calculated according to Yeh and Lindauusing the photoionization cross section and the asymmetryparameter.59 The angle between the sample normal and theanalyser was 101 which means that the angle between theincident horizontal linearly polarised synchrotron beam andthe sample surface was 451.
The preparation of reference samples and recording of XPspectra is described in the ESI.† The reference samples wereprepared such that multilayers of untreated Aun clusters weredeposited on UHV compatible double-sided, adhesive copperconducting tape (3M brand). Due to this sample preparation,the reference XP spectra are recorded from Aun clusters thatare not in contact with a substrate, i.e. no cluster–substrateinteraction occurs.
Results and discussion
The molecular clusters (n = 8, 9, 11) used in this study containatomically precise, ideally monodisperse metal cores protectedby phosphine ligands, while Au101 particles (also stabilised byphosphine ligands) have narrow particle size distribution cen-tered around 1.5 nm. The crystal structures of Au11, Au9 andAu8 clusters are shown in Fig. 1, confirming that thecluster metal core contain exactly 8, 960 and 11 atoms of goldrespectively, with all the gold atoms involved in forming themetal–metal bonded cluster core. The two new X-ray structuresreported here (Au11 and Au8) show typical Au–Au bonds of
2.6437(9) to 3.1274(10) Å in Au11, and 2.5827(6) to 2.8924(7) Åin Au8. The gold cluster at the centre of the Au8 structureapproximates the cyclohexane structure with one gold atomadded above and below the ring. This gives a shape with a shortaxis of 2.5827(7) Å, and a distance across the ring that variesfrom 5.2533(5) to 5.4536(7) Å. The gold cluster in the Au11
structure is quite spherical with ten ligated gold atoms (eitherby triphenylphosphine or chloride) surrounding a central goldatom. The shortest distance across the cluster 4.695(2) Å andthe longest is 5.385(2) Å. Further discussion of the XPS resultswill be carried out in the light of the atomic precision of themolecular cluster systems studied here.
Spectra have been taken at the gold 4f, phosphorous 2p,silicon 2p, titanium 2p, carbon 1s and oxygen 1s regions for Aun
clusters deposited on titania nanoparticles and from a goldreference sample. The majority of carbon on the samples iseither carbon of the triphenylphosphine ligand of the goldcluster or adventitious hydrocarbons. In either case, weassigned the C 1s peak to 285 eV and used it for calibratingthe peak positions of other elements. This is justified becauseadventitious hydrocarbons display a very constant C 1s peakposition and are present in all samples exposed to air (and notcleaned by sputtering etc. prior to XPS measurements).61 Thetitanium signal measured is exclusively due to the titaniananoparticles and found at 459.0 � 0.1 eV. The silicon signalis due to the silicon wafer used as substrate and found at 99.2 �0.1 eV (Si) and 103.1� 0.1 eV (SiO2). The oxygen signal is mostlydue to titanium dioxide (530.3 � 0.1 eV) and silicon dioxide(532.4 � 0.1 eV). Gold signal due to the gold clusters is foundbetween 83.7 and 86.1 eV. Phosphorous from the ligands isfound at 131.8 � 0.1 eV and 133.0 � 0.2 eV. The Au and Psignals are used for quantitative analysis. Using the energycalibration described above, the Au 4f7/2 peak of bulk gold isfound at a binding energy of 84 eV. This value is used todetermine the shift between the Au 4f7/2 signal of the goldclusters and the bulk gold binding energy. Most references forgold are found at a binding energy of 84 eV within a range of�0.2 eV.62–65 The invariance of the titanium and silicon signalsrelative to the gold reference is less than 0.05 eV, indicatingthat there is no charging of the samples or instability in theX-ray energy. Small amounts of sulphur were found in thesamples, which is due to the treatment of the titania supportwith H2SO4 prior to the deposition of clusters.
Table 1 Position, FWHM and intensity of the Au-LBP and Au-HBP
Untreated Washed Calcined
Energy [eV]Intensity rel. tountreated [%] FWHM [eV] Energy [eV]
Intensity rel. tountreated [%] FWHM [eV] Energy [eV]
Intensity rel. tountreated [%] FWHM [eV]
Au8 LBP 85.1 � 0.1 100 1.6 � 0.2 84.8 � 0.1 37 � 10 1.5 � 0.2 84.0 � 0.1 7 � 10 1.2 � 0.2Au8 HBP — — — 85.6 � 0.1 16 � 20 1.3 � 0.2 85.4 � 0.1 19 � 10 1.6 � 0.1Au9 LBP 85.1 � 0.1 100 1.6 � 0.2 84.8 � 0.1 47 � 10 1.7 � 0.2 84.2 � 0.1 12 � 10 1.3 � 0.2Au9 HBP — — — 85.9 � 0.1 17 � 10 1.2 � 0.2 85.5 � 0.1 33 � 10 1.5 � 0.1Au11 LBP 84.7 � 0.1 100 1.6 � 0.2 85.0 � 0.2 13 � 20 1.9 � 0.2 84.2 � 0.1 15 � 10 1.1 � 0.2Au11 HBP — — — 86.1 � 0.1 18 � 10 1.3 � 0.2 85.5 � 0.1 40 � 10 1.5 � 0.1Au101 LBP 83.9 � 0.1 100 1.0 � 0.2 83.9 � 0.1 5 � 5 1.0 � 0.2 83.9 � 0.1 28 � 10 0.9 � 0.2Au101 HBP — — — — — 84.8 � 0.1 14 � 10 2.3 � 0.2
PCCP Paper
Ope
n A
cces
s A
rtic
le. P
ublis
hed
on 1
7 Ja
nuar
y 20
13. D
ownl
oade
d on
29/
11/2
014
15:3
0:19
. T
his
artic
le is
lice
nsed
und
er a
Cre
ativ
e C
omm
ons
Attr
ibut
ion
3.0
Unp
orte
d L
icen
ce.
View Article Online

3922 Phys. Chem. Chem. Phys., 2013, 15, 3917--3929 This journal is c the Owner Societies 2013
Our XPS analysis of the gold and phosphorous peaksrequires these signals to be normalised. The intensity of thegold spectra, i.e. the integral over the peaks fitted to the spectra,has to be normalised as the silicon substrate was, in all cases,not fully covered with the titania particles, i.e. there is a variableloading with titania particles. Normalisation of the phosphoroussignal is not required since only the ratio of the phosphorous togold intensity is of interest. The normalisation of the goldintensity and the calculation of the phosphorous to gold ratioare described in detail in the ESI.†
Untreated samples
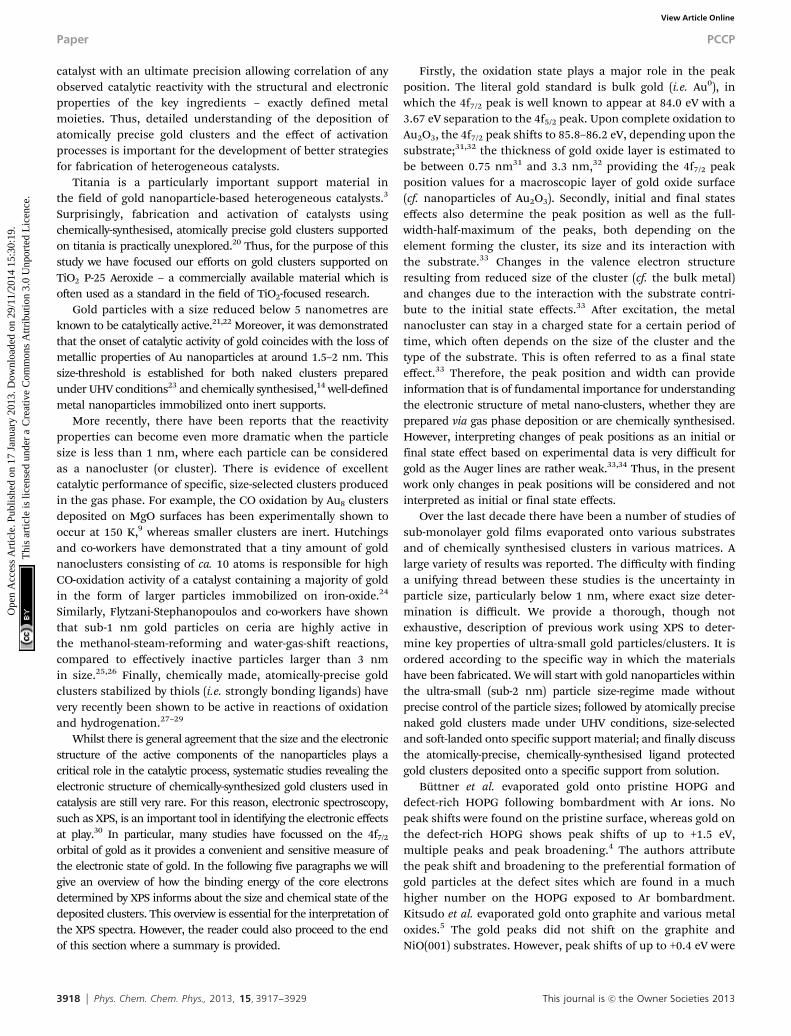
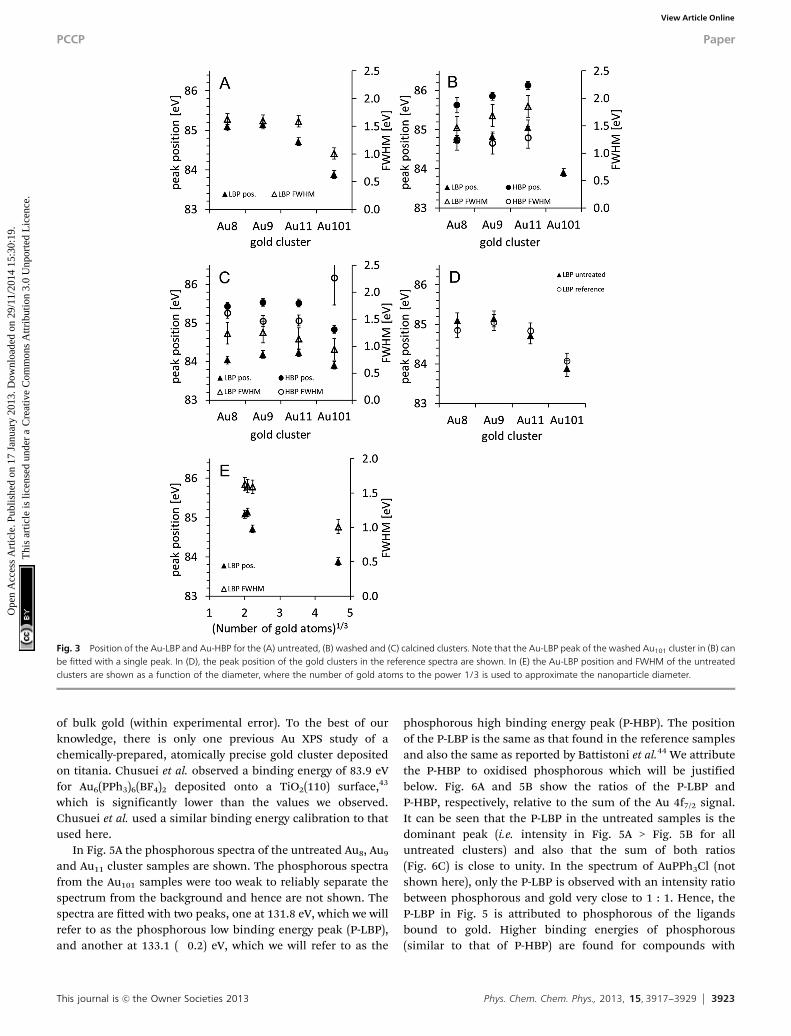
The Au 4f spectra for the Au8, Au9, Au11 and Au101 clusters areshown in Fig. 2 for the untreated (i.e. as deposited) clusters (A),the samples washed after deposition (B), and the calcinedsamples (C). In these spectra, it can be seen that the gold peaksshift towards higher binding energies with decreasing numberof atoms in the metal cluster. All four spectra can be fitted witha single peak for each of the Au 4f7/2 and Au 4f5/2 components.The peak position and the FWHM are shown in Fig. 3A (as willbe discussed below, these peaks are referred to as the gold lowbinding peak, Au-LBP). The positions of all peaks are at ahigher binding energy than that of metallic gold except forAu101. The FWHM of Au8, Au9 and Au11 is the same withinexperimental error but are larger than that of Au101. Shifts inthe peak position and an increase in the FWHM of the XPSsignal of particles consisting of a small number of metal atoms
has been attributed in a number of cases to finite size effectsand depends on the element constituting the nano-sized objectas well as the substrate on which they are deposited.5,46 In thecase of gold, peak shifts up to +1 to +1.5 eV,4 +0.7 eV,35,36 +1 eV3
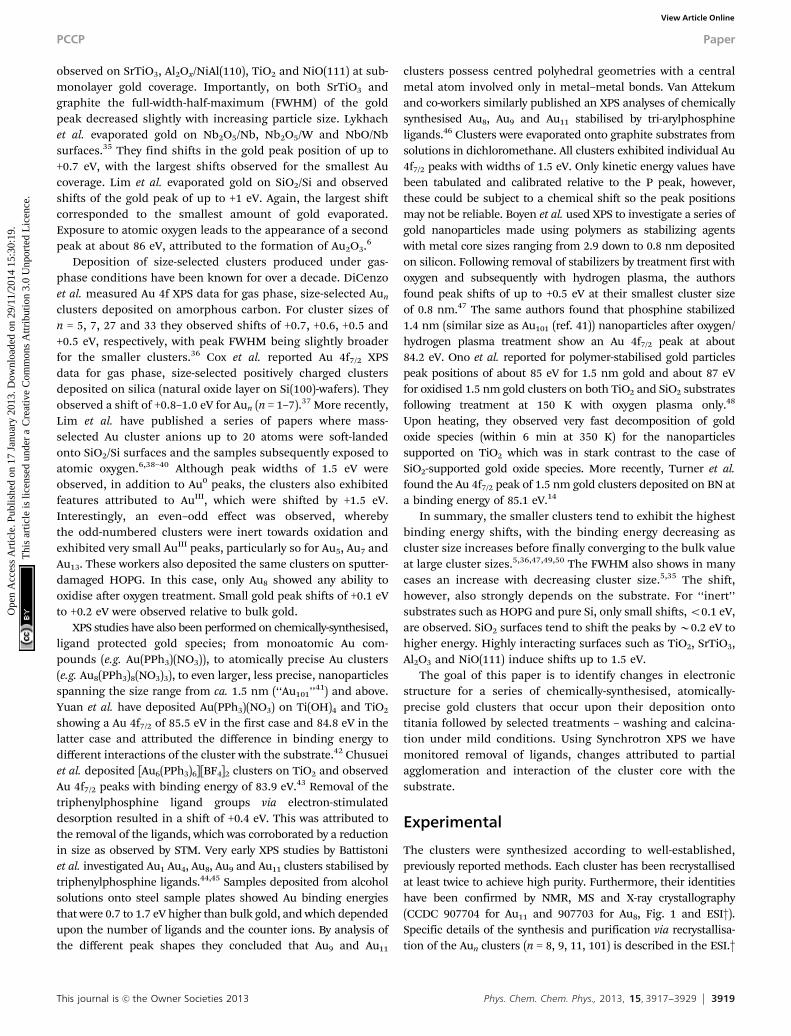
and +1.1 eV14,47 have been previously reported. In all cases, anincrease of the FWHM relative to that of bulk gold signal hasalso been reported. Thus, we attribute the shift of the peakposition to the decrease in size of the gold cluster. Thepeak positions relative to the bulk gold Au 4f7/2 found hereare +1.1 eV for Au8 and Au9, +0.7 eV for Au11 and �0.1 eV forAu101. The position of Au 4f7/2 of the untreated samples is veryclose to the peak position of the reference spectra as shown inFig. 3D. Thus, it can be concluded that the clusters as depositedare not affected by the titania substrate. The position of theAu 4f7/2 peaks for both the untreated gold clusters and thereference samples are in the range of the Au 4f7/2 positionreported for nanosized gold. As an example, Battistoni et al.44
reported that for Au9(PPh3)8(NO3)3 deposited on steel plates,the Au 4f7/2 peak lies at 85.2 eV (using the same energycalibration as here). The position of the gold peak as a functionof the diameter of the gold cluster is shown in Fig. 3E. Thediameter d of the gold cluster is approximated with d B N1/3
where N is the number of gold atoms in the cluster. For suchsmall values of N, this approximation is only a rough estima-tion to the cluster size but even so, Fig. 3E has similarities tothe 1/d relation found for gold nanoparticles by Boyen et al.47
Due to its large size Au101 has a binding energy the same as that
Fig. 2 Au XPS spectra of Aun samples: (A) untreated, (B) washed and (C) calcined clusters.
Paper PCCP
Ope
n A
cces
s A
rtic
le. P
ublis
hed
on 1
7 Ja
nuar
y 20
13. D
ownl
oade
d on
29/
11/2
014
15:3
0:19
. T
his
artic
le is
lice
nsed
und
er a
Cre
ativ
e C
omm
ons
Attr
ibut
ion
3.0
Unp
orte
d L
icen
ce.
View Article Online
This journal is c the Owner Societies 2013 Phys. Chem. Chem. Phys., 2013, 15, 3917--3929 3923
of bulk gold (within experimental error). To the best of ourknowledge, there is only one previous Au XPS study of achemically-prepared, atomically precise gold cluster depositedon titania. Chusuei et al. observed a binding energy of 83.9 eVfor Au6(PPh3)6(BF4)2 deposited onto a TiO2(110) surface,43
which is significantly lower than the values we observed.Chusuei et al. used a similar binding energy calibration to thatused here.
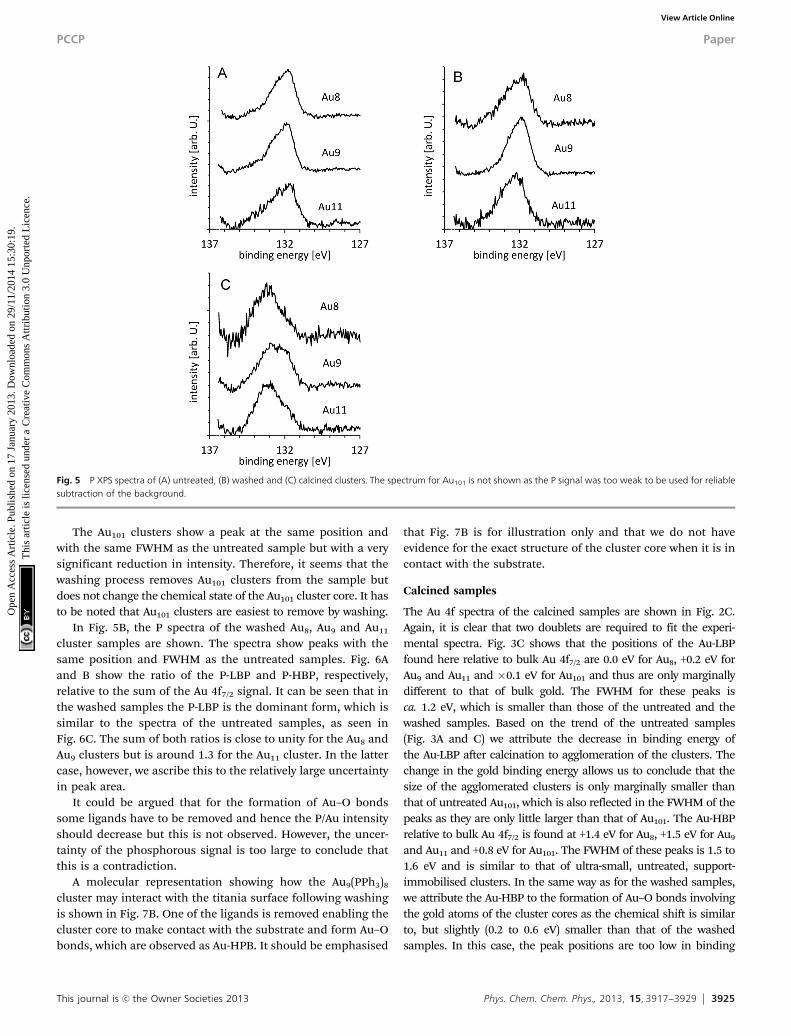
In Fig. 5A the phosphorous spectra of the untreated Au8, Au9
and Au11 cluster samples are shown. The phosphorous spectrafrom the Au101 samples were too weak to reliably separate thespectrum from the background and hence are not shown. Thespectra are fitted with two peaks, one at 131.8 eV, which we willrefer to as the phosphorous low binding energy peak (P-LBP),and another at 133.1 (�0.2) eV, which we will refer to as the
phosphorous high binding energy peak (P-HBP). The positionof the P-LBP is the same as that found in the reference samplesand also the same as reported by Battistoni et al.44 We attributethe P-HBP to oxidised phosphorous which will be justifiedbelow. Fig. 6A and 5B show the ratios of the P-LBP andP-HBP, respectively, relative to the sum of the Au 4f7/2 signal.It can be seen that the P-LBP in the untreated samples is thedominant peak (i.e. intensity in Fig. 5A > Fig. 5B for alluntreated clusters) and also that the sum of both ratios(Fig. 6C) is close to unity. In the spectrum of AuPPh3Cl (notshown here), only the P-LBP is observed with an intensity ratiobetween phosphorous and gold very close to 1 : 1. Hence, theP-LBP in Fig. 5 is attributed to phosphorous of the ligandsbound to gold. Higher binding energies of phosphorous(similar to that of P-HBP) are found for compounds with
Fig. 3 Position of the Au-LBP and Au-HBP for the (A) untreated, (B) washed and (C) calcined clusters. Note that the Au-LBP peak of the washed Au101 cluster in (B) canbe fitted with a single peak. In (D), the peak position of the gold clusters in the reference spectra are shown. In (E) the Au-LBP position and FWHM of the untreatedclusters are shown as a function of the diameter, where the number of gold atoms to the power 1/3 is used to approximate the nanoparticle diameter.
PCCP Paper
Ope
n A
cces
s A
rtic
le. P
ublis
hed
on 1
7 Ja
nuar
y 20
13. D
ownl
oade
d on
29/
11/2
014
15:3
0:19
. T
his
artic
le is
lice
nsed
und
er a
Cre
ativ
e C
omm
ons
Attr
ibut
ion
3.0
Unp
orte
d L
icen
ce.
View Article Online
3924 Phys. Chem. Chem. Phys., 2013, 15, 3917--3929 This journal is c the Owner Societies 2013
phosphorous bound to oxygen.66 Hence, it is concluded that inthe untreated support-immobilised clusters there is about oneligand per gold atom and that the nature of the bond betweenthe phosphorous of the ligand and the gold is very similar tothat in AuPPh3Cl.
A molecular representation showing how the Au9(PPh3)8
cluster may be deposited onto the titania surface is shown inFig. 7A, where all ligands remain attached to the cluster coreand prevent its contact with the substrate.
Washed samples
In the Au 4f spectra of the washed samples (Fig. 2B) it isnecessary to fit a second, higher energy, gold doublet for Au8,Au9 and Au11 (hereafter referred to as Au-HBP). Fig. 3B showsthat the Au-LBP peak positions relative to bulk Au 4f7/2 are+0.8 eV for Au8 and Au9, +1.0 eV for Au11 and �0.1 eV for Au101
and only marginally different to those of the untreated samples.The FWHMs are the same within the experimental error asthose for the Au-LBP in the untreated samples. The Au-HBP isfound at +1.6 eV for Au8, at +1.9 eV for Au9, +2.1 eV for Au11. NoAu-HBP peak is found for Au101. This binding energy is verysimilar to that of Au2O3 thin films which shows a shift inbinding energy of 1.8 to 2.1 eV.6,31,32 Ono et al. have reportedshifts in binding energies from about 85 eV to about 87 eVwhen exposing 1.5 nm sized gold clusters supported on TiO2
and on SiO2 to oxygen plasma (i.e. about 3 eV higher bindingenergy than bulk gold).48 It is worth noting that Au101 also has asize of about 1.5 nm. Lim et al. reported that gold peaks fromgas-phase deposited Aun (n = 3–20) clusters deposited on SiO2
after exposure to atomic oxygen are found at about 86 eV with ashift of about 2 eV relative to the unexposed sample, which theyattributed to the formation of gold oxide.6
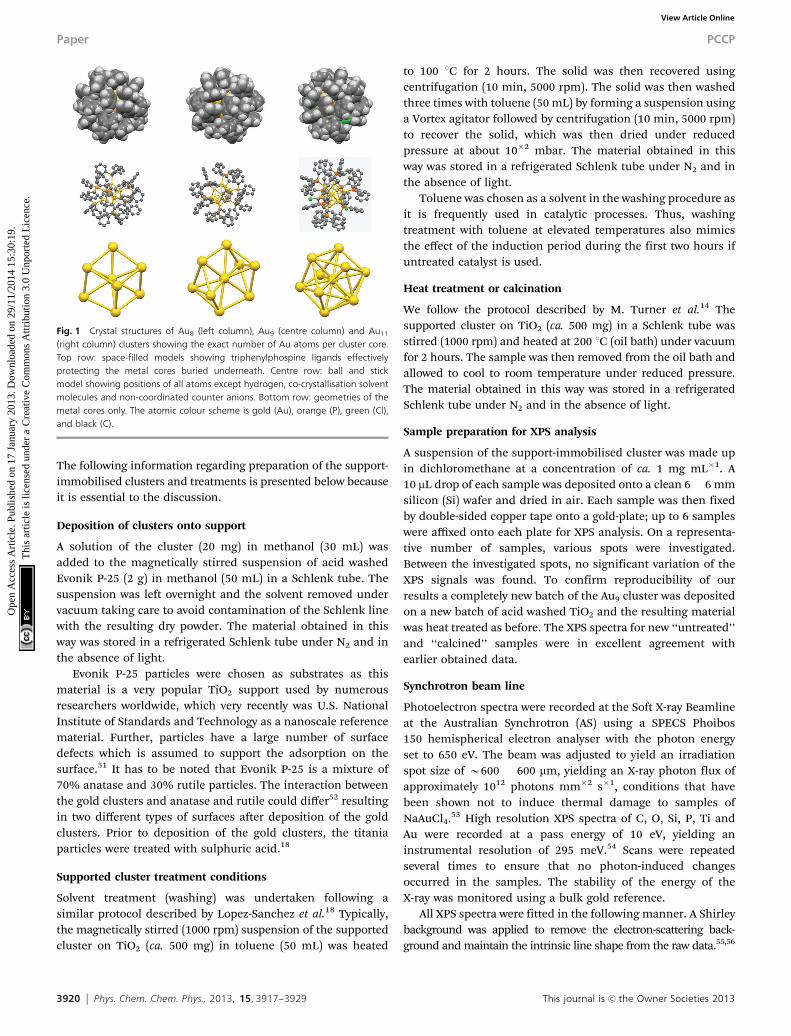
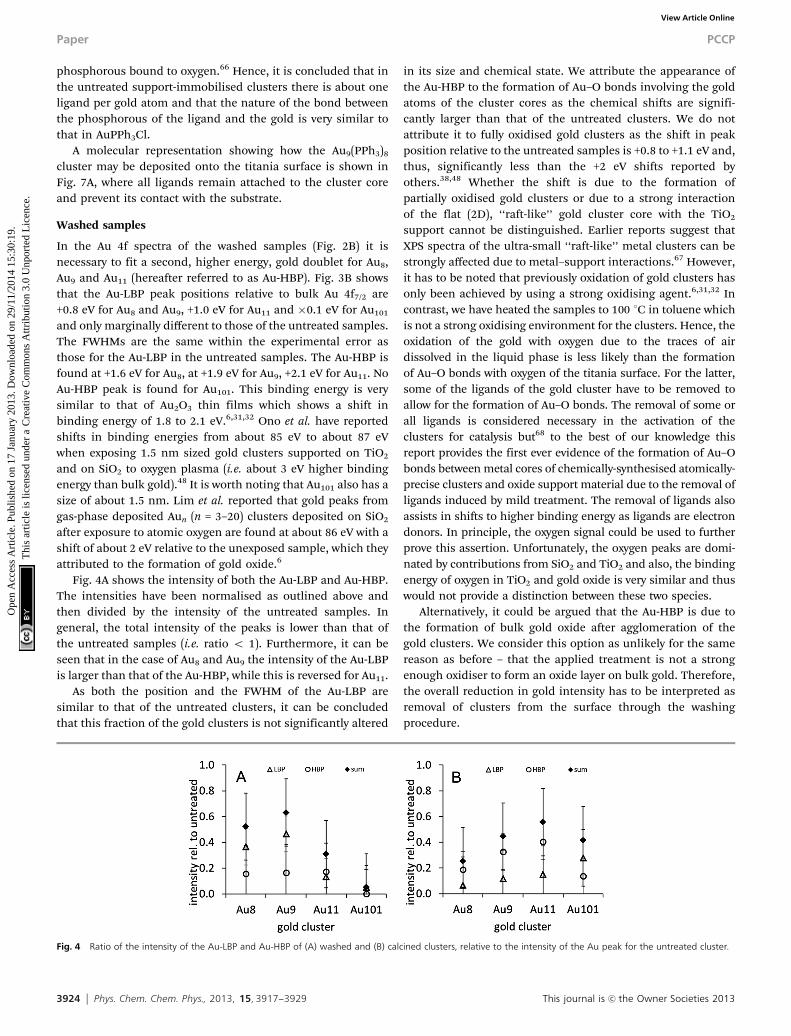
Fig. 4A shows the intensity of both the Au-LBP and Au-HBP.The intensities have been normalised as outlined above andthen divided by the intensity of the untreated samples. Ingeneral, the total intensity of the peaks is lower than that ofthe untreated samples (i.e. ratio o 1). Furthermore, it can beseen that in the case of Au8 and Au9 the intensity of the Au-LBPis larger than that of the Au-HBP, while this is reversed for Au11.
As both the position and the FWHM of the Au-LBP aresimilar to that of the untreated clusters, it can be concludedthat this fraction of the gold clusters is not significantly altered
in its size and chemical state. We attribute the appearance ofthe Au-HBP to the formation of Au–O bonds involving the goldatoms of the cluster cores as the chemical shifts are signifi-cantly larger than that of the untreated clusters. We do notattribute it to fully oxidised gold clusters as the shift in peakposition relative to the untreated samples is +0.8 to +1.1 eV and,thus, significantly less than the +2 eV shifts reported byothers.38,48 Whether the shift is due to the formation ofpartially oxidised gold clusters or due to a strong interactionof the flat (2D), ‘‘raft-like’’ gold cluster core with the TiO2
support cannot be distinguished. Earlier reports suggest thatXPS spectra of the ultra-small ‘‘raft-like’’ metal clusters can bestrongly affected due to metal–support interactions.67 However,it has to be noted that previously oxidation of gold clusters hasonly been achieved by using a strong oxidising agent.6,31,32 Incontrast, we have heated the samples to 100 1C in toluene whichis not a strong oxidising environment for the clusters. Hence, theoxidation of the gold with oxygen due to the traces of airdissolved in the liquid phase is less likely than the formationof Au–O bonds with oxygen of the titania surface. For the latter,some of the ligands of the gold cluster have to be removed toallow for the formation of Au–O bonds. The removal of some orall ligands is considered necessary in the activation of theclusters for catalysis but68 to the best of our knowledge thisreport provides the first ever evidence of the formation of Au–Obonds between metal cores of chemically-synthesised atomically-precise clusters and oxide support material due to the removal ofligands induced by mild treatment. The removal of ligands alsoassists in shifts to higher binding energy as ligands are electrondonors. In principle, the oxygen signal could be used to furtherprove this assertion. Unfortunately, the oxygen peaks are domi-nated by contributions from SiO2 and TiO2 and also, the bindingenergy of oxygen in TiO2 and gold oxide is very similar and thuswould not provide a distinction between these two species.
Alternatively, it could be argued that the Au-HBP is due tothe formation of bulk gold oxide after agglomeration of thegold clusters. We consider this option as unlikely for the samereason as before – that the applied treatment is not a strongenough oxidiser to form an oxide layer on bulk gold. Therefore,the overall reduction in gold intensity has to be interpreted asremoval of clusters from the surface through the washingprocedure.
Fig. 4 Ratio of the intensity of the Au-LBP and Au-HBP of (A) washed and (B) calcined clusters, relative to the intensity of the Au peak for the untreated cluster.
Paper PCCP
Ope
n A
cces
s A
rtic
le. P
ublis
hed
on 1
7 Ja
nuar
y 20
13. D
ownl
oade
d on
29/
11/2
014
15:3
0:19
. T
his
artic
le is
lice
nsed
und
er a
Cre
ativ
e C
omm
ons
Attr
ibut
ion
3.0
Unp
orte
d L
icen
ce.
View Article Online
This journal is c the Owner Societies 2013 Phys. Chem. Chem. Phys., 2013, 15, 3917--3929 3925
The Au101 clusters show a peak at the same position andwith the same FWHM as the untreated sample but with a verysignificant reduction in intensity. Therefore, it seems that thewashing process removes Au101 clusters from the sample butdoes not change the chemical state of the Au101 cluster core. It hasto be noted that Au101 clusters are easiest to remove by washing.
In Fig. 5B, the P spectra of the washed Au8, Au9 and Au11
cluster samples are shown. The spectra show peaks with thesame position and FWHM as the untreated samples. Fig. 6Aand B show the ratio of the P-LBP and P-HBP, respectively,relative to the sum of the Au 4f7/2 signal. It can be seen that inthe washed samples the P-LBP is the dominant form, which issimilar to the spectra of the untreated samples, as seen inFig. 6C. The sum of both ratios is close to unity for the Au8 andAu9 clusters but is around 1.3 for the Au11 cluster. In the lattercase, however, we ascribe this to the relatively large uncertaintyin peak area.
It could be argued that for the formation of Au–O bondssome ligands have to be removed and hence the P/Au intensityshould decrease but this is not observed. However, the uncer-tainty of the phosphorous signal is too large to conclude thatthis is a contradiction.
A molecular representation showing how the Au9(PPh3)8
cluster may interact with the titania surface following washingis shown in Fig. 7B. One of the ligands is removed enabling thecluster core to make contact with the substrate and form Au–Obonds, which are observed as Au-HPB. It should be emphasised
that Fig. 7B is for illustration only and that we do not haveevidence for the exact structure of the cluster core when it is incontact with the substrate.
Calcined samples
The Au 4f spectra of the calcined samples are shown in Fig. 2C.Again, it is clear that two doublets are required to fit the experi-mental spectra. Fig. 3C shows that the positions of the Au-LBPfound here relative to bulk Au 4f7/2 are 0.0 eV for Au8, +0.2 eV forAu9 and Au11 and �0.1 eV for Au101 and thus are only marginallydifferent to that of bulk gold. The FWHM for these peaks isca. 1.2 eV, which is smaller than those of the untreated and thewashed samples. Based on the trend of the untreated samples(Fig. 3A and C) we attribute the decrease in binding energy ofthe Au-LBP after calcination to agglomeration of the clusters. Thechange in the gold binding energy allows us to conclude that thesize of the agglomerated clusters is only marginally smaller thanthat of untreated Au101, which is also reflected in the FWHM of thepeaks as they are only little larger than that of Au101. The Au-HBPrelative to bulk Au 4f7/2 is found at +1.4 eV for Au8, +1.5 eV for Au9
and Au11 and +0.8 eV for Au101. The FWHM of these peaks is 1.5 to1.6 eV and is similar to that of ultra-small, untreated, support-immobilised clusters. In the same way as for the washed samples,we attribute the Au-HBP to the formation of Au–O bonds involvingthe gold atoms of the cluster cores as the chemical shift is similarto, but slightly (0.2 to 0.6 eV) smaller than that of the washedsamples. In this case, the peak positions are too low in binding
Fig. 5 P XPS spectra of (A) untreated, (B) washed and (C) calcined clusters. The spectrum for Au101 is not shown as the P signal was too weak to be used for reliablesubtraction of the background.
PCCP Paper
Ope
n A
cces
s A
rtic
le. P
ublis
hed
on 1
7 Ja
nuar
y 20
13. D
ownl
oade
d on
29/
11/2
014
15:3
0:19
. T
his
artic
le is
lice
nsed
und
er a
Cre
ativ
e C
omm
ons
Attr
ibut
ion
3.0
Unp
orte
d L
icen
ce.
View Article Online
3926 Phys. Chem. Chem. Phys., 2013, 15, 3917--3929 This journal is c the Owner Societies 2013
energy for assigning these peaks to either fully oxidised goldclusters or oxidised bulk gold. Here again, we cannot pinpointwhether the shift is due to the formation of partially oxidised goldclusters or due to a strong interaction of the flat (2D), ‘‘raft-like’’gold cluster cores with the TiO2 support. Heating at 200 1C in lowvacuum is a somewhat harsher environment than the washingprocedure but still cannot be considered as a strong oxidisingtreatment comparable to oxygen plasma. Also, gold oxide has beenfound to be unstable at the temperatures applied here. Hence, alsoin this case the oxidation of the gold with gas phase oxygen isunlikely and the formation of Au–O bonds with oxygen ofthe titania surface has to be considered as being much more likely.The shifts are slightly reduced relative to the washed samples. Thereason could be some degree of agglomeration of the clusters thathave formed Au–O bonds under higher temperature conditions.
The total intensity of gold is significantly reduced compared tothe untreated sample as can be seen in Fig. 4B, with the Au-HBPbeing more intense than the Au-LBP. Different to washing, calcina-tion does not remove clusters from the support and hence theamount of gold in the sample must be the same as for the untreatedsamples. Thus, the decrease in gold intensity can only be attributedto agglomeration of the gold cores of the clusters. An increase ingold particle size means that the signal of the gold from the side ofthe cluster closer to the substrate is attenuated due to the limitedmean free path of the photoelectrons. As the amount of gold on thesample is constant, the total gold intensity decreases. This inter-pretation is supported by the fact that the position of the Au-LBP isclose to 84 eV.
Fig. 5 shows the phosphorous spectra of the calcined Au8,Au9 and Au11 cluster samples. The spectra clearly illustrate a
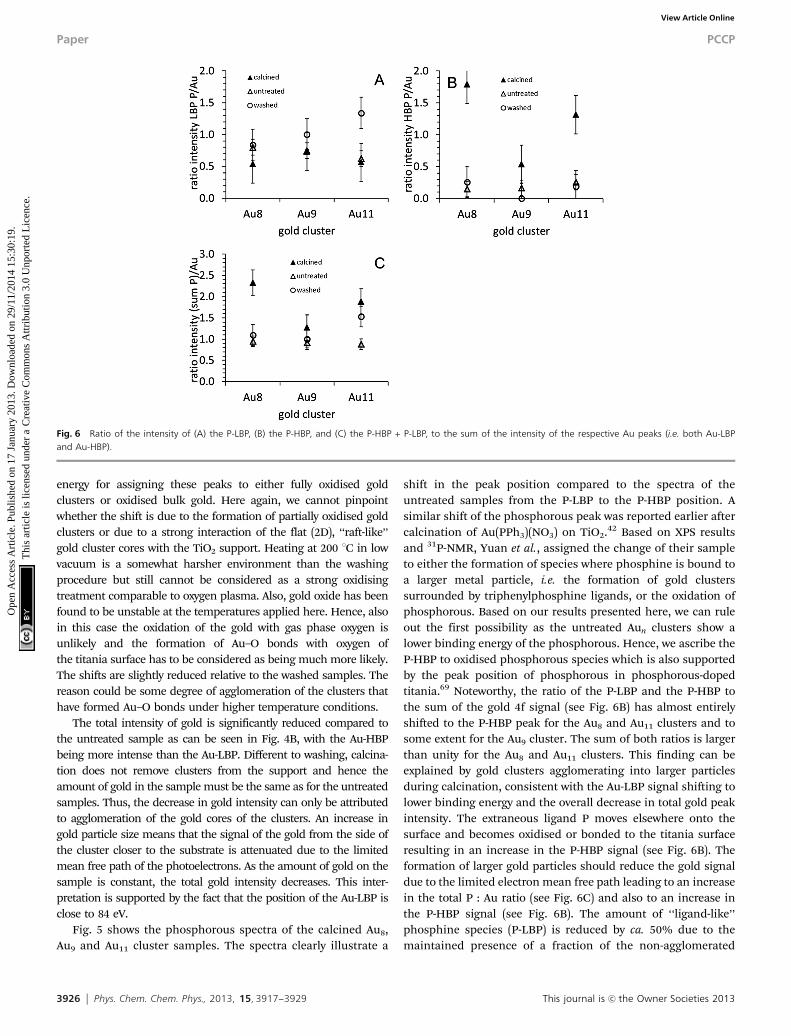
shift in the peak position compared to the spectra of theuntreated samples from the P-LBP to the P-HBP position. Asimilar shift of the phosphorous peak was reported earlier aftercalcination of Au(PPh3)(NO3) on TiO2.42 Based on XPS resultsand 31P-NMR, Yuan et al., assigned the change of their sampleto either the formation of species where phosphine is bound toa larger metal particle, i.e. the formation of gold clusterssurrounded by triphenylphosphine ligands, or the oxidation ofphosphorous. Based on our results presented here, we can ruleout the first possibility as the untreated Aun clusters show alower binding energy of the phosphorous. Hence, we ascribe theP-HBP to oxidised phosphorous species which is also supportedby the peak position of phosphorous in phosphorous-dopedtitania.69 Noteworthy, the ratio of the P-LBP and the P-HBP tothe sum of the gold 4f signal (see Fig. 6B) has almost entirelyshifted to the P-HBP peak for the Au8 and Au11 clusters and tosome extent for the Au9 cluster. The sum of both ratios is largerthan unity for the Au8 and Au11 clusters. This finding can beexplained by gold clusters agglomerating into larger particlesduring calcination, consistent with the Au-LBP signal shifting tolower binding energy and the overall decrease in total gold peakintensity. The extraneous ligand P moves elsewhere onto thesurface and becomes oxidised or bonded to the titania surfaceresulting in an increase in the P-HBP signal (see Fig. 6B). Theformation of larger gold particles should reduce the gold signaldue to the limited electron mean free path leading to an increasein the total P : Au ratio (see Fig. 6C) and also to an increase inthe P-HBP signal (see Fig. 6B). The amount of ‘‘ligand-like’’phosphine species (P-LBP) is reduced by ca. 50% due to themaintained presence of a fraction of the non-agglomerated
Fig. 6 Ratio of the intensity of (A) the P-LBP, (B) the P-HBP, and (C) the P-HBP + P-LBP, to the sum of the intensity of the respective Au peaks (i.e. both Au-LBPand Au-HBP).
Paper PCCP
Ope
n A
cces
s A
rtic
le. P
ublis
hed
on 1
7 Ja
nuar
y 20
13. D
ownl
oade
d on
29/
11/2
014
15:3
0:19
. T
his
artic
le is
lice
nsed
und
er a
Cre
ativ
e C
omm
ons
Attr
ibut
ion
3.0
Unp
orte
d L
icen
ce.
View Article Online

This journal is c the Owner Societies 2013 Phys. Chem. Chem. Phys., 2013, 15, 3917--3929 3927
clusters even in calcined samples (see Fig. 6A). This interpretationis supported for Au8 and Au11 by the changes in the phosphoroussignal shown in Fig. 6. To a lesser degree the interpretation is alsosupported for Au9. However, the removal of the ligands from thecluster and their oxidation seems to be less efficient for Au9
compared to Au8 and Au11, as the P-LBP is stronger in the case ofAu9 compared to Au8 and Au11. In summary, it can be concludedthat the phosphorous of the ligands oxidises during calcinationand is most likely removed from the clusters but remains in anoxidised form on the surface. The changes of the clusters depos-ited on the titania particles due to the calcination procedureapplied are illustrated in Fig. 7. In terms of the molecularrepresentation in Fig. 7B, although calcining of the sample doeslead to removal of ligands, it is also observed that agglomerationof the gold core occurs.
Conclusions
We have investigated chemically synthesised, atomically precise goldclusters deposited on titania nanoparticles using XPS. Subsequent totheir immobilisation on the titania support, the gold clusters have
been treated with washing and calcination to remove the phosphineligands from the gold cluster core. XPS has been used as a tool todetermine changes in the chemical nature, composition, and toestimate changes in the size of the gold clusters. Upon treatmentthree changes of the clusters have been found: firstly, removal of thephosphine ligands from the Au clusters and interaction of thecluster core with the substrate, secondly, partial agglomeration ofthe Au clusters and thirdly, oxidation of the phosphine ligands. Theremoval of the ligands is most likely an essential step to make theclusters catalytically active and their interaction with the substratewill affect their catalytic activity since it influences their charge state.Agglomeration of the clusters will also impact the catalytic propertiesof the deposited clusters. It is known that small clusters show sizespecific catalytic activity8,9 which is lost when they agglomerate.However, only partial agglomeration is found here and a portion ofthe clusters are not affected. As the ligands are at least partiallyremoved, the non-agglomerated clusters could be involved in cata-lytic reactions. The interaction with the substrate could also affectthe catalytic activity.
We find that upon depositions, untreated clusters remainvirtually unchanged and can be described as ultra-small clusters
Fig. 7 Schematic illustration of the changes of the clusters due to washing and calcination. In (A) the cluster is shown after deposition (Au9(PPh3)8). The ligands areattached to the cluster core and the core is not in contact with the substrate. In (B), one of the ligands is removed (i.e. Au9(PPh3)7) and the core is in contact with thesubstrate. (Note: whilst these figures are based upon the crystal structures of the Au9 cluster and anatase (101) surface separately, the relative position and orientationof the cluster–surface interaction does not involve any geometric or energy minimisation process. They should therefore be regarded as crude representations of apossible interaction that is consistent with the XPS data. It should also be noted that the counter ion is not shown. Furthermore, it must be emphasised that the exactnumber of ligands removed is unknown and may be more than shown here.)
PCCP Paper
Ope
n A
cces
s A
rtic
le. P
ublis
hed
on 1
7 Ja
nuar
y 20
13. D
ownl
oade
d on
29/
11/2
014
15:3
0:19
. T
his
artic
le is
lice
nsed
und
er a
Cre
ativ
e C
omm
ons
Attr
ibut
ion
3.0
Unp
orte
d L
icen
ce.
View Article Online
3928 Phys. Chem. Chem. Phys., 2013, 15, 3917--3929 This journal is c the Owner Societies 2013
with decreasing size from Au101 to Au8, as indicated by positionsand widths of the gold and phosphorus peaks in the XPS spectra.The peak positions in the gold XPS spectra shift systematically inagreement with the size of the clusters determined by X-raydiffraction immediately after their synthesis.
Washing of the support-immobilised cluster with toluene at100 1C leads to the removal of a fraction of the clusters from thetitania surface. Of those clusters left on the titania surface someremain virtually unchanged. The other fraction shows formationof Au–O bonds, most likely to the oxygen of the titania surface,correlating with at least partial removal of ligands. No significantagglomeration of the cluster cores is evident from the observedXPS spectra for this fraction.
Calcination of the support-immobilised clusters has twoeffects. First, the ultra-small clusters aggregate to form slightlylarger gold particles that are still protected by phosphineligands. The average size of the aggregated clusters can beestimated to be marginally smaller than that of untreated Au101.Second, a fraction of gold clusters forms Au–O bonds, againmost likely to the oxygen of the titania surface, which coincideswith the loss of phosphine ligands and formation of oxidisedphosphorous species. Of this fraction of clusters, at least aportion does not show agglomeration.
Acknowledgements
This work was supported by a grant of the Australian Synchrotron(AS112/SXR/3576), the MacDiarmid Institute and the College ofScience at the Canterbury University. The XPS measurementswere undertaken on the soft X-ray beamline at the AustralianSynchrotron, Victoria, Australia.
References
1 P. L. J. Gunter, J. W. Niemantsverdriet, F. H. Ribeiro andG. A. Somorjai, Catal. Rev.: Sci. Eng., 1997, 39, 77–168.
2 F. H. Ribeiro, G. A. Somorjai, G. Wedler, B. C. Gates,C. T. Campbell, C. Xu, D. W. Goodman, A. Zecchina,D. Scarano, S. Bordiga, A. Cimino, F. S. Stone, Y. Iwasawa,M. A. Barteau, J. M. Vohs and J. P. Vigneron, in Handbook ofHeterogeneous Catalysis, Wiley-VCH Verlag GmbH, 2008,pp. 771–908.
3 M. S. Chen and D. W. Goodman, Chem. Soc. Rev., 2008, 37,1860–1870.
4 M. Buttner and P. Oelhafen, Surf. Sci., 2006, 600, 1170–1177.5 Y. Kitsudo, A. Iwamoto, H. Matsumoto, K. Mitsuhara,
T. Nishimura, M. Takizawa, T. Akita, Y. Maeda andY. Kido, Surf. Sci., 2009, 603, 2108–2114.
6 D.-C. Lim, C.-C. Hwang, G. Gantefor and Y. D. Kim, Phys.Chem. Chem. Phys., 2010, 12, 15172–15180.
7 U. Heiz and W.-D. Schneider, Crit. Rev. Solid State Mater.Sci., 2001, 26, 251–290.
8 S. Kunz, K. Hartl, M. Nesselberger, F. F. Schweinberger,G. Kwon, M. Hanzlik, K. J. J. Mayrhofer, U. Heiz andM. Arenz, Phys. Chem. Chem. Phys., 2010, 12, 10288–10291.
9 B. Yoon, H. Hakkinen, U. Landman, A. S. Worz,J.-M. Antonietti, S. Abbet, K. Judai and U. Heiz, Science,2005, 307, 403–407.
10 R. Schlogl, M. Che, O. Clause, C. Marcilly, C. Louis,H. Knoinger, E. Teglauer, W. Keim, B. Drieben-Holscher,J. W. Geus, A. J. van Dillen and J. Barbier, in Handbook ofHeterogeneous Catalysis, Wiley-VCH Verlag GmbH, 2008,pp. 138–264.
11 R. M. Crooks, M. Q. Zhao, L. Sun, V. Chechik andL. K. Yeung, Acc. Chem. Res., 2001, 34, 181–190.
12 M. Faraday, Philos. Trans. R. Soc. London, 1857, 147, 145–181.13 A. B. Hungria, R. Raja, R. D. Adams, B. Captain, J. M. Thomas,
P. A. Midgley, V. Golovko and B. F. G. Johnson, Angew. Chem.,Int. Ed., 2006, 45, 4782–4785.
14 M. Turner, V. B. Golovko, O. P. H. Vaughan, P. Abdulkin,A. Berenguer-Murcia, M. S. Tikhov, B. F. G. Johnson andR. M. Lambert, Nature, 2008, 454, 981–983.
15 R. Raja, V. B. Golovko, J. M. Thomas, A. Berenguer-Murcia,W. Z. Zhou, S. H. Xie and B. F. G. Johnson, Chem. Commun.,2005, 2026–2028.
16 Y. M. Liu, H. Tsunoyama, T. Akita and T. Tsukuda, Chem.Commun., 2010, 46, 550–552.
17 Y. M. Liu, H. Tsunoyama, T. Akita, S. H. Xie and T. Tsukuda,ACS Catal., 2011, 1, 2–6.
18 J. A. Lopez-Sanchez, N. Dimitratos, C. Hammond,G. L. Brett, L. Kesavan, S. White, P. Miedziak,R. Tiruvalam, R. L. Jenkins, A. F. Carley, D. Knight,C. J. Kiely and G. J. Hutchings, Nat. Chem., 2011, 3, 551–556.
19 Y. Zhu, H. Qian and R. Jin, J. Mater. Chem., 2011, 21, 6793–6799.
20 C. C. Chusuei, X. Lai, K. A. Davis, E. K. Bowers, J. P. Facklerand D. W. Goodman, Langmuir, 2001, 17, 4113–4117.
21 M. Haruta, S. Tsubota, T. Kobayashi, H. Kageyama,M. J. Genet and B. Delmon, J. Catal., 1993, 144, 175–192.
22 R. Meyer, C. Lemire, S. Shaikhutdinov and H. Freund, GoldBull., 2004, 37, 72–124.
23 M. Valden, X. Lai and D. W. Goodman, Science, 1998, 281,1647–1650.
24 A. A. Herzing, C. J. Kiely, A. F. Carley, P. Landon andG. J. Hutchings, Science, 2008, 321, 1331–1335.
25 N. Yi, R. Si, H. Saltsburg and M. Flytzani-Stephanopoulos,Appl. Catal., B, 2010, 95, 87–92.
26 N. Yi, R. Si, H. Saltsburg and M. Flytzani-Stephanopoulos,Energy Environ. Sci., 2010, 3, 831–837.
27 W. Huang, H.-J. Zhai and L.-S. Wang, J. Am. Chem.Soc., 2010,132, 4344–4351.
28 Z. Jiang, W. Zhang, L. Jin, X. Yang, F. Xu, J. Zhu andW. Huang, J. Phys. Chem. C, 2007, 111, 12434–12439.
29 M. Walter, J. Akola, O. Lopez-Acevedo, P. D. Jadzinsky, G. Calero,C. J. Ackerson, R. L. Whetten, H. Gronbeck and H. Hakkinen,Proc. Natl. Acad. Sci. U. S. A., 2008, 105, 9157–9162.
30 S. Porsgaard, P. Jiang, F. Borondics, S. Wendt, Z. Liu,H. Bluhm, F. Besenbacher and M. Salmeron, Angew. Chem.,Int. Ed., 2011, 50, 2266–2269.
31 K. Juodkazis, J. Juodkazyte, V. Jasulaitiene, A. Lukinskas andB. Sebeka, Electrochem. Commun., 2000, 2, 503–507.
Paper PCCP
Ope
n A
cces
s A
rtic
le. P
ublis
hed
on 1
7 Ja
nuar
y 20
13. D
ownl
oade
d on
29/
11/2
014
15:3
0:19
. T
his
artic
le is
lice
nsed
und
er a
Cre
ativ
e C
omm
ons
Attr
ibut
ion
3.0
Unp
orte
d L
icen
ce.
View Article Online
This journal is c the Owner Societies 2013 Phys. Chem. Chem. Phys., 2013, 15, 3917--3929 3929
32 B. Koslowski, H. G. Boyen, C. Wilderotter, G. Kastle,P. Ziemann, R. Wahrenberg and P. Oelhafen, Surf. Sci.,2001, 475, 1–10.
33 V. Borman, M. Pushkin, V. Tronin and V. Troyan, J. Exp.Theor. Phys., 2010, 110, 1005–1025.
34 S. Zafeiratos and S. Kennou, Surf. Sci., 1999, 443, 238–244.35 Y. Lykhach, J. Plsek, I. Spirovova and Z. Bastl, Collect. Czech.
Chem. Commun., 2003, 68, 1791–1804.36 S. B. DiCenzo, S. D. Berry and E. H. Hartford, Jr., Phys. Rev.
B: Condens. Matter Mater. Phys., 1988, 38, 8465–8468.37 D. M. Cox, W. Eberhardt, P. Fayet, Z. Fu, B. Kessler,
R. D. Sherwood, D. Sondericker and A. Kaldor, Z. Phys. D:At., Mol. Clusters, 1991, 20, 385–386.
38 D. C. Lim, R. Dietsche, G. Gantefor and Y. D. Kim, Chem.Phys. Lett., 2008, 457, 391–395.
39 D. C. Lim, R. Dietsche, G. Gantefor and Y. D. Kim, Chem.Phys., 2009, 359, 161–165.
40 D. C. Lim, R. Dietsche, G. Gantefor and Y. D. Kim, Appl. Surf.Sci., 2009, 256, 1148–1151.
41 W. W. Weare, S. M. Reed, M. G. Warner and J. E. Hutchison,J. Am. Chem. Soc., 2000, 122, 12890–12891.
42 Y. Yuan, K. Asakura, A. P. Kozlova, H. Wan, K. Tsai andY. Iwasawa, Catal. Today, 1998, 44, 333–342.
43 C. C. Chusuei, X. Lai, K. A. Davis, E. K. Bowers, J. P. Facklerand D. W. Goodman, Langmuir, 2001, 17, 4113–4117.
44 C. Battistoni, G. Mattogno, R. Zanoni and L. Naldini,J. Electron Spectrosc. Relat. Phenom., 1982, 28, 23–31.
45 C. Battistoni, G. Mattogno, F. Cariati, L. Naldini andA. Sgamellotti, Inorg. Chim. Acta, 1977, 24, 207–210.
46 P. M. T. M. Van Attekum, J. W. A. Van der Velden andJ. M. Trooster, Inorg. Chem., 1980, 19, 701–704.
47 H. G. Boyen, A. Ethirajan, G. Kastle, F. Weigl, P. Ziemann,G. Schmid, M. G. Garnier, M. Buttner and P. Oelhafen, Phys.Rev. Lett., 2005, 94, 016804.
48 L. K. Ono and B. Roldan Cuenya, J. Phys. Chem. C, 2008, 112,4676–4686.
49 C. N. R. Rao, V. Vijayakrishnan, H. N. Aiyer, G. U. Kulkarniand G. N. Subbanna, J. Phys. Chem., 1993, 97, 11157–11160.
50 A. K. Santra and D. W. Goodman, J. Phys.: Condens. Matter,2003, 15, R31.
51 L. Ellis-Gibbings, V. Johansson, R. B. Walsh, L. Kloo,J. S. Quinton and G. G. Andersson, Langmuir, 2012, 28,9431–9439.
52 M. Murdoch, G. I. N. Waterhouse, M. A. Nadeem,J. B. Metson, M. A. Keane, R. F. Howe, J. Llorca andH. Idriss, Nat. Chem., 2011, 3, 489–492.
53 Y.-Y. Fong, B. R. Visser, J. R. Gascooke, B. C. C. Cowie,L. Thomsen, G. F. Metha, M. A. Buntine and H. H. Harris,Langmuir, 2011, 27, 8099–8104.
54 B. C. C. Cowie, A. Tadich and L. Thomsen, AIP Conf. Proc.,2010, 1234, 307–310.
55 D. A. Shirley, Phys. Rev. B: Solid State, 1972, 5, 4709–4714.56 J. Vegh, J. Electron Spectrosc. Relat. Phenom., 2006, 151,
159–164.57 H. P. Hughes and J. A. Scarfe, J. Phys.: Condens. Matter, 1996,
8, 1421.58 J. F. Moulder, W. F. Stickle, P. E. Sobol and K. D. Bomben,
Handbook of X-ray Photoelectron Spectroscopy, Physical Elec-tronics, Inc., Eden Prairie, 1995.
59 J. J. Yeh and I. Lindau, At. Data Nucl. Data Tables, 1985, 32,1–155.
60 F. Wen, U. Englert, B. Gutrath and U. Simon, Eur. J. Inorg.Chem., 2008, 106–111.
61 D. Briggs and M. P. Seah, Practical surface analysis, Wiley,Chichester, New York, Aarau, 1990.
62 K. Asami, J. Electron Spectrosc. Relat. Phenom., 1976, 9,469–478.
63 K. Duckers and H. P. Bonzel, Surf. Sci., 1989, 213, 25–48.64 T. Darrah Thomas and P. Weightman, Phys. Rev. B: Condens.
Matter Mater. Phys., 1986, 33, 5406–5413.65 M. P. Seah, G. C. Smith and M. T. Anthony, Surf. Interface
Anal., 1990, 15, 293–308.66 C. A. Strydom and H. J. Strydom, Inorg. Chim. Acta, 1989,
159, 191–195.67 A. Y. Stakheev and L. M. Kustov, Appl. Catal., A, 1999, 188,
3–35.68 A. Kulkarni, R. J. Lobo-Lapidus and B. C. Gates, Chem.
Commun., 2010, 46, 5997–6015.69 L. Lin, R. Y. Zheng, J. L. Xie, Y. X. Zhu and Y. C. Xie,
Appl. Catal., B, 2007, 76, 196–202.
PCCP Paper
Ope
n A
cces
s A
rtic
le. P
ublis
hed
on 1
7 Ja
nuar
y 20
13. D
ownl
oade
d on
29/
11/2
014
15:3
0:19
. T
his
artic
le is
lice
nsed
und
er a
Cre
ativ
e C
omm
ons
Attr
ibut
ion
3.0
Unp
orte
d L
icen
ce.
View Article Online
Copyright © 2022 FDOKUMEN