Development of polyurethane–titania nanocomposites as dielectric and piezoelectric material
12
Cite this: DOI: 10.1039/c2ra22929c Development of polyurethane–titania nanocomposites as dielectric and piezoelectric material Received 24th August 2012, Accepted 13th December 2012 DOI: 10.1039/c2ra22929c www.rsc.org/advances Suryakanta Nayak, a Banalata Sahoo, b Tapan Kumar Chaki ac and Dipak Khastgir* a Flexible polyurethane (PU)–titania nanocomposites of different compositions are prepared by a melt- mixing technique. Two different sequences of mixing method are adapted to prepare two different sets of composites. All these composites show composition-dependent dielectric properties, and composites with tunable dielectric properties can be obtained through judicial adjustment of composition. The morphology of these composites has been investigated by field emission scanning electron microscopy (FESEM), high resolution transmission electron microscopy (HRTEM), and scanning probe microscopy (SPM). Dielectric properties at low frequency regions are found to depend on morphology. These composites show excellent piezoelectric behaviour, where the dielectric constant and conductivity of these flexible composites change appreciably with changes in applied stress. The dielectric breakdown strength of these composite is also measured. To understand the thermal stability of these composites, thermogravimetric analysis has been applied and it was found that a composite containing 12.49 vol% titania shows higher thermal stability, beyond which, stability decreases due to the photocatalytic effect of titania. 1 Introduction Polymer nanocomposites have attracted great attention due to their unique set of properties. 1,2 These composites have either nano-clay, 2–6 carbon fillers, 7–10 carbon nanotubes, 1,11–13 or different types of inorganic fillers 14,15 dispersed in an appropriate polymer matrix. Polymer composites filled with ceramic particles have received considerable attention in the past decade. Favourable features include a high dielectric constant, low dielectric loss, and good compatibility with printed-circuit-boards (PCB), making them promising candi- dates for embedded capacitors used in passive technology. 16 In the present investigation, we have utilized titania nano- particles in order to study their effect on the thermal, electrical, and piezoelectric properties of PU–titania compo- sites. Composites derived from inorganic fillers dispersed in a polymer matrix have received significant attention because of their improved mechanical properties coupled with their tailor-made dielectric properties, and in order to prepare suitable dielectric materials. 17 Dielectric materials are capable of storing large amounts of electrical energy which are desirable for many electronic and power devices. Polyurethane elastomer is a unique material that offers the elasticity of rubber combined with good mechanical proper- ties, toughness and durability, and has become an important material for many applications. 17,18 However, these materials are seldom used as pure polymers and are usually combined with mineral fillers. 17 These fillers are used with a polymer in order to improve the mechanical, thermal, and electrical properties, and the dimensional stability of the final compo- sites. Filled polyurethanes (PUs) are used for moderate strain applications whereas unfilled PUs are used where strain rates are low. 19 PU composites are used in various applications such as artificial muscles, sensors, adhesives, electrostatic imaging, cables, and EMI shielding gasket materials. 18,20,21 Titanium dioxide is an inorganic filler having large permittivity and is thus used for insulating material in electronics and as a dielectric for capacitors. 22 Other applications of titania include use as a de-pollutant, self-cleaning agent, photocatalyst, photovoltaic cell, semi conductor, etc. 23 Composites prepared from titania show increased tensile modulus, 24 tensile strength, tear strength, hardness, 25 and in some cases, mechanical properties such as the mechanical modulus value are found to decrease with an increase of filler concentration in the polymer matrix. 26 Polyurethane is a polar polymer having relatively high permittivity compared to a non-polar polymer like polyethylene. Such a polymer can be used as a capacitor for electronic applications. A tailor-made capacitor with controlled dielectric properties can also be obtained using PU as a matrix filled with electro-ceramics, such as titania (TiO 2 ), BaTiO 3 , PZT etc., having a high dielectric constant. 27–29 In fact, the dielectric constant of such compo- sites depends on the composition. Upon selection of an a Rubber Technology Centre, Indian Institute of Technology, Kharagpur, W.B. 721302, India. E-mail: [email protected]; Fax: +91-3222282292; Tel: +91-3222283192 b Department of Chemistry, Indian Institute of Technology, Kharagpur, W.B. 721302, India c Polymer-Nano Science and Technology, Chonbuk National University, Jeonju 561 756, Republic of Korea RSC Advances PAPER This journal is ß The Royal Society of Chemistry 2013 RSC Adv. Downloaded by National University of Singapore on 10 January 2013 Published on 10 January 2013 on http://pubs.rsc.org | doi:10.1039/C2RA22929C View Article Online View Journal
Transcript of Development of polyurethane–titania nanocomposites as dielectric and piezoelectric material
Cite this: DOI: 10.1039/c2ra22929c
Development of polyurethane–titania nanocompositesas dielectric and piezoelectric material
Received 24th August 2012,Accepted 13th December 2012
DOI: 10.1039/c2ra22929c
www.rsc.org/advances
Suryakanta Nayak,a Banalata Sahoo,b Tapan Kumar Chakiac and Dipak Khastgir*a
Flexible polyurethane (PU)–titania nanocomposites of different compositions are prepared by a melt-
mixing technique. Two different sequences of mixing method are adapted to prepare two different sets of
composites. All these composites show composition-dependent dielectric properties, and composites with
tunable dielectric properties can be obtained through judicial adjustment of composition. The morphology
of these composites has been investigated by field emission scanning electron microscopy (FESEM), high
resolution transmission electron microscopy (HRTEM), and scanning probe microscopy (SPM). Dielectric
properties at low frequency regions are found to depend on morphology. These composites show
excellent piezoelectric behaviour, where the dielectric constant and conductivity of these flexible
composites change appreciably with changes in applied stress. The dielectric breakdown strength of these
composite is also measured. To understand the thermal stability of these composites, thermogravimetric
analysis has been applied and it was found that a composite containing 12.49 vol% titania shows higher
thermal stability, beyond which, stability decreases due to the photocatalytic effect of titania.
1 Introduction
Polymer nanocomposites have attracted great attention due totheir unique set of properties.1,2 These composites have eithernano-clay,2–6 carbon fillers,7–10 carbon nanotubes,1,11–13 ordifferent types of inorganic fillers14,15 dispersed in anappropriate polymer matrix. Polymer composites filled withceramic particles have received considerable attention in thepast decade. Favourable features include a high dielectricconstant, low dielectric loss, and good compatibility withprinted-circuit-boards (PCB), making them promising candi-dates for embedded capacitors used in passive technology.16
In the present investigation, we have utilized titania nano-particles in order to study their effect on the thermal,electrical, and piezoelectric properties of PU–titania compo-sites. Composites derived from inorganic fillers dispersed in apolymer matrix have received significant attention because oftheir improved mechanical properties coupled with theirtailor-made dielectric properties, and in order to preparesuitable dielectric materials.17 Dielectric materials are capableof storing large amounts of electrical energy which aredesirable for many electronic and power devices.Polyurethane elastomer is a unique material that offers the
elasticity of rubber combined with good mechanical proper-ties, toughness and durability, and has become an importantmaterial for many applications.17,18 However, these materialsare seldom used as pure polymers and are usually combinedwith mineral fillers.17 These fillers are used with a polymer inorder to improve the mechanical, thermal, and electricalproperties, and the dimensional stability of the final compo-sites. Filled polyurethanes (PUs) are used for moderate strainapplications whereas unfilled PUs are used where strain ratesare low.19 PU composites are used in various applications suchas artificial muscles, sensors, adhesives, electrostatic imaging,cables, and EMI shielding gasket materials.18,20,21 Titaniumdioxide is an inorganic filler having large permittivity and isthus used for insulating material in electronics and as adielectric for capacitors.22 Other applications of titania includeuse as a de-pollutant, self-cleaning agent, photocatalyst,photovoltaic cell, semi conductor, etc.23 Composites preparedfrom titania show increased tensile modulus,24 tensilestrength, tear strength, hardness,25 and in some cases,mechanical properties such as the mechanical modulus valueare found to decrease with an increase of filler concentrationin the polymer matrix.26 Polyurethane is a polar polymerhaving relatively high permittivity compared to a non-polarpolymer like polyethylene. Such a polymer can be used as acapacitor for electronic applications. A tailor-made capacitorwith controlled dielectric properties can also be obtainedusing PU as a matrix filled with electro-ceramics, such astitania (TiO2), BaTiO3, PZT etc., having a high dielectricconstant.27–29 In fact, the dielectric constant of such compo-sites depends on the composition. Upon selection of an
aRubber Technology Centre, Indian Institute of Technology, Kharagpur, W.B. 721302,
India. E-mail: [email protected]; Fax: +91-3222282292;
Tel: +91-3222283192bDepartment of Chemistry, Indian Institute of Technology, Kharagpur, W.B. 721302,
IndiacPolymer-Nano Science and Technology, Chonbuk National University, Jeonju 561
756, Republic of Korea
RSC Advances
PAPER
This journal is � The Royal Society of Chemistry 2013 RSC Adv.
Dow
nloa
ded
by N
atio
nal U
nive
rsity
of
Sing
apor
e on
10
Janu
ary
2013
Publ
ishe
d on
10
Janu
ary
2013
on
http
://pu
bs.r
sc.o
rg |
doi:1
0.10
39/C
2RA
2292
9C
View Article OnlineView Journal

appropriate type of polyurethane, one can obtain suitablepiezoelectric composites. To have piezoelectric characteristics,a flexible PU matrix is preferred.
The present investigation deals with the development of adielectric material using PU as the base matrix with varyingconcentrations of titania as a filler. The polyurethane chainhere is elastomeric in nature so that some piezoelectriccharacteristics can also be brought into the system. Detailedelectrical and dielectric properties of these composites over awide range of frequency and applied pressure have beeninvestigated. To understand the thermal stability of thesecomposites, thermogravimetric analysis has been studied. Theeffect of processing conditions on the electrical properties ofthese composites has also been investigated.
2 Experimental
2.1 Raw materials
Polyester-based commercial grade polyurethane elastomer wasused as the base matrix for this work, which was supplied byRheinchemie, Germany, having density = 1.2 g cm21 andML5+4@100 uC = 30–50. Dicumyl peroxide (DCP, m.p. = 80 uC,purity = 98%, Sigma Aldrich, USA) was used as the curingagent. Co-curing agent triallyl cyanurate (TAC, M.P. = 26 uC)was procured from Rheinchemie, Germany. Anatase gradetitanium dioxide was procured from Merck chemical Ltd.,India.
2.2 Preparation of PU–titania nanocomposites
PU–titania nanocomposites of various formulations wereprepared via a melt-mixing technique, where titania and othercompounds were mixed with the PU matrix in an internalmixer (Brabender plasticorder, model PLE 330) operating at 80uC with a shear rate of 45 rpm for a mixing time of 10 min.Different compositions by parts of filler per hundred parts ofpolymer by weight (php) were prepared and the concentrationof filler in the composites varied from 30 to 90 php. However,for ease of understanding, php concentration of filler has beenconverted to volume percentage of filler and can accordinglybe written as 30 php = 7.98 vol%, 50 php = 12.49 vol%, 70 php= 16.67 vol%, and 90 php = 20.45 vol%. Anatase grade titaniaobtained as such was subjected to ball milling in ethanolmedium for 15 min to get nanosized particles. The mixing oftitania and other compounds into the pristine PU matrix wasdone as per formulations given in Table 1 and two methods ofpreparation have been used to prepare these composites.
These two methods differ in the sequence of addition of filler.Incorporation of all compounds was done according to twodifferent sequences, for example: Method-1: PU was added inan internal mixer at a specified condition and softened for 2min. Then, titania was added and mixed for 6 min followed bythe addition of curative systems (DCP + TAC) and mixing wasfurther continued for 2 min, thus, the whole process took 10min. The mixed mass was then released from the internalmixer and sheeted out in a two role mill while it was hot. Thus,the sequence of mixing was as follows: [PU A TiO2 A curatives(DCP + TAC)]. Method-2: PU was added in an internal mixer atthe specified condition and softened for 2 min followed by theaddition of curatives for 2 min. After that the whole mass wasreleased from the internal mixer to cool down to roomtemperature (y35 uC). Again the cold mass at 35 uC wasreheated to 80 uC and titania was added and mixed for 6 min.After the completion of mixing, the hot mass was taken outfrom the internal mixer and sheeted out in a two roll mill.Thus, the sequence of mixing was as follows: [PU A curatives(DCP + TAC) A TiO2]. The optimum cure times of differentcompounds were evaluated by a rubber process analyzer (RPA)operating at 150 uC. Different test specimens from all thecomposites were prepared using a compression mouldingpress at 150 uC and cured upto the optimum curing time.
Different composites were designated using alpha numer-ical number; for example, P100Tx, which means the composi-tion of PU elastomer and TiO2 containing x parts of TiO2 byweight per hundred parts of polymer (php), where P representsPU and T represents titanium dioxide. Note: The concentrationof curatives (dicumyl peroxide ‘‘DCP’’ and triallyl cyanurate‘‘TAC’’) remains constant in all the composites, so these termsare not included in the alpha numerical designation.
2.3 Measurements and characterization
The DC resistivity of pristine PU and PU–titania compositeswere measured using a high resistivity meter (Agilent 4339B)attached with a resistivity cell (Agilent 16008B). Dielectricproperties of these composites were measured using aprecision LCR meter (Model. Quad Tech 7600) attached witha homemade sample holder having parallel plate circularelectrodes. All measurements were carried out over thefrequency range 10–106 Hz. The effect of pressure on thedielectric properties and conductivity of all the composites wasanalyzed using a LCR meter (GW-Instek LCR-819). Thedielectric breakdown strength (break down voltage) of thecomposites was measured using a Multiplex 11kV BDV tester(M/s Agro Scientific Industries, Pune, India).Thermogravimetric analysis (TGA) was carried out using TA
Table 1 Formulations of PU–TiO2 nanocomposites
Compound
Composition by weight per hundred parts of polymer (titania amount in vol%)
P100T0 P100T30 P100T50 P100T70 P100T90
PU 100 100 100 100 100TiO2 0 30 (7.89 vol%) 50 (12.49 vol%) 70 (16.67 vol%) 90 (20.45 vol%)DCP 2 2 2 2 2TAC 0.5 0.5 0.5 0.5 0.5
RSC Adv. This journal is � The Royal Society of Chemistry 2013
Paper RSC Advances
Dow
nloa
ded
by N
atio
nal U
nive
rsity
of
Sing
apor
e on
10
Janu
ary
2013
Publ
ishe
d on
10
Janu
ary
2013
on
http
://pu
bs.r
sc.o
rg |
doi:1
0.10
39/C
2RA
2292
9CView Article Online
instruments (Q 50), at a heating rate of 10 uC min21 undernitrogen atmosphere from 30 to 650 uC. The wide angle X-raydiffraction (WAXD) analysis was carried out using a highresolution X-ray diffractometer (X’Pert PRO, Philips PANanalytical B.V., Almelo, Netherlands) with a Cu-Ka (l = 0.154nm) radiation source. The phase and crystallographic state ofthe samples were scanned in the 2h range from 10 to 90u at ascan rate of 0.13u s21 using an X’celerator mode. Themorphology and distribution of titania filler in the compositeswere characterized by field emission scanning electronmicroscopy (FESEM, Supra 40, Carl Zeiss SMT AG, Germany),high resolution transmission electron microscopy (HRTEM,JEM-2100), and scanning probe microscopy (SPM, Multiview-1000TM).
3 Results and discussion
3.1 Effect of composition on electrical properties
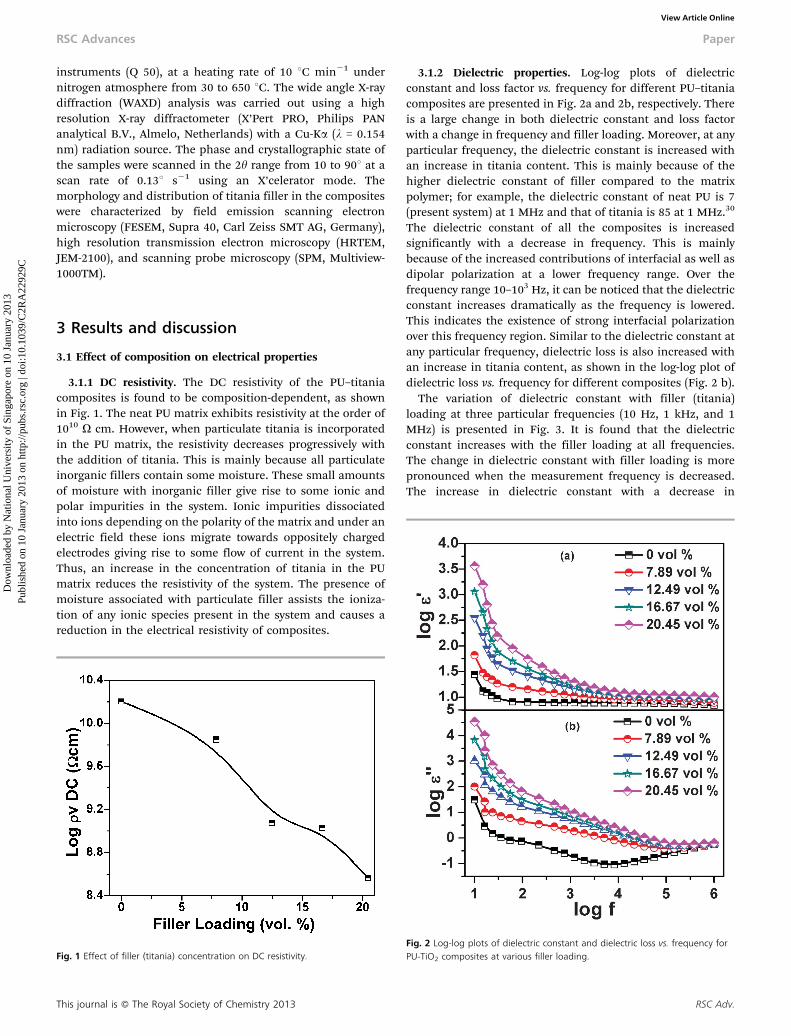
3.1.1 DC resistivity. The DC resistivity of the PU–titaniacomposites is found to be composition-dependent, as shownin Fig. 1. The neat PU matrix exhibits resistivity at the order of1010 V cm. However, when particulate titania is incorporatedin the PU matrix, the resistivity decreases progressively withthe addition of titania. This is mainly because all particulateinorganic fillers contain some moisture. These small amountsof moisture with inorganic filler give rise to some ionic andpolar impurities in the system. Ionic impurities dissociatedinto ions depending on the polarity of the matrix and under anelectric field these ions migrate towards oppositely chargedelectrodes giving rise to some flow of current in the system.Thus, an increase in the concentration of titania in the PUmatrix reduces the resistivity of the system. The presence ofmoisture associated with particulate filler assists the ioniza-tion of any ionic species present in the system and causes areduction in the electrical resistivity of composites.
3.1.2 Dielectric properties. Log-log plots of dielectricconstant and loss factor vs. frequency for different PU–titaniacomposites are presented in Fig. 2a and 2b, respectively. Thereis a large change in both dielectric constant and loss factorwith a change in frequency and filler loading. Moreover, at anyparticular frequency, the dielectric constant is increased withan increase in titania content. This is mainly because of thehigher dielectric constant of filler compared to the matrixpolymer; for example, the dielectric constant of neat PU is 7(present system) at 1 MHz and that of titania is 85 at 1 MHz.30
The dielectric constant of all the composites is increasedsignificantly with a decrease in frequency. This is mainlybecause of the increased contributions of interfacial as well asdipolar polarization at a lower frequency range. Over thefrequency range 10–103 Hz, it can be noticed that the dielectricconstant increases dramatically as the frequency is lowered.This indicates the existence of strong interfacial polarizationover this frequency region. Similar to the dielectric constant atany particular frequency, dielectric loss is also increased withan increase in titania content, as shown in the log-log plot ofdielectric loss vs. frequency for different composites (Fig. 2 b).
The variation of dielectric constant with filler (titania)loading at three particular frequencies (10 Hz, 1 kHz, and 1MHz) is presented in Fig. 3. It is found that the dielectricconstant increases with the filler loading at all frequencies.The change in dielectric constant with filler loading is morepronounced when the measurement frequency is decreased.The increase in dielectric constant with a decrease in
Fig. 1 Effect of filler (titania) concentration on DC resistivity.Fig. 2 Log-log plots of dielectric constant and dielectric loss vs. frequency forPU-TiO2 composites at various filler loading.
This journal is � The Royal Society of Chemistry 2013 RSC Adv.
RSC Advances Paper
Dow
nloa
ded
by N
atio
nal U
nive
rsity
of
Sing
apor
e on
10
Janu
ary
2013
Publ
ishe
d on
10
Janu
ary
2013
on
http
://pu
bs.r
sc.o
rg |
doi:1
0.10
39/C
2RA
2292
9CView Article Online
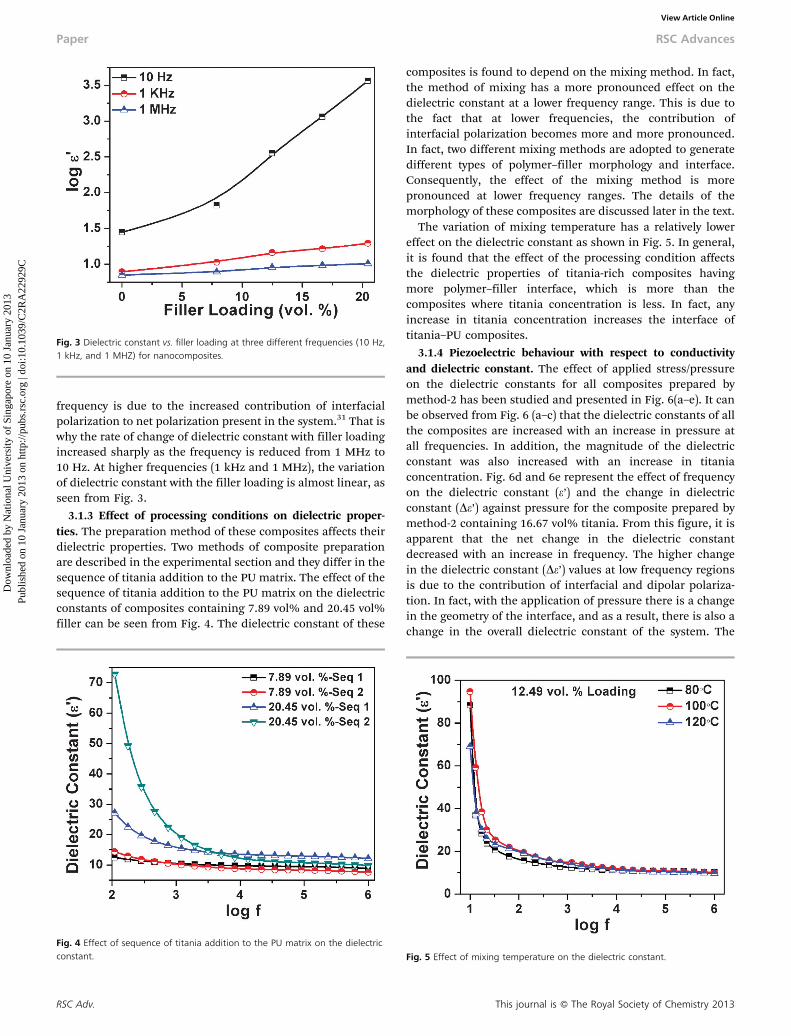
frequency is due to the increased contribution of interfacialpolarization to net polarization present in the system.31 That iswhy the rate of change of dielectric constant with filler loadingincreased sharply as the frequency is reduced from 1 MHz to10 Hz. At higher frequencies (1 kHz and 1 MHz), the variationof dielectric constant with the filler loading is almost linear, asseen from Fig. 3.
3.1.3 Effect of processing conditions on dielectric proper-ties. The preparation method of these composites affects theirdielectric properties. Two methods of composite preparationare described in the experimental section and they differ in thesequence of titania addition to the PU matrix. The effect of thesequence of titania addition to the PU matrix on the dielectricconstants of composites containing 7.89 vol% and 20.45 vol%filler can be seen from Fig. 4. The dielectric constant of these
composites is found to depend on the mixing method. In fact,the method of mixing has a more pronounced effect on thedielectric constant at a lower frequency range. This is due tothe fact that at lower frequencies, the contribution ofinterfacial polarization becomes more and more pronounced.In fact, two different mixing methods are adopted to generatedifferent types of polymer–filler morphology and interface.Consequently, the effect of the mixing method is morepronounced at lower frequency ranges. The details of themorphology of these composites are discussed later in the text.
The variation of mixing temperature has a relatively lowereffect on the dielectric constant as shown in Fig. 5. In general,it is found that the effect of the processing condition affectsthe dielectric properties of titania-rich composites havingmore polymer–filler interface, which is more than thecomposites where titania concentration is less. In fact, anyincrease in titania concentration increases the interface oftitania–PU composites.
3.1.4 Piezoelectric behaviour with respect to conductivityand dielectric constant. The effect of applied stress/pressureon the dielectric constants for all composites prepared bymethod-2 has been studied and presented in Fig. 6(a–e). It canbe observed from Fig. 6 (a–c) that the dielectric constants of allthe composites are increased with an increase in pressure atall frequencies. In addition, the magnitude of the dielectricconstant was also increased with an increase in titaniaconcentration. Fig. 6d and 6e represent the effect of frequencyon the dielectric constant (e’) and the change in dielectricconstant (De’) against pressure for the composite prepared bymethod-2 containing 16.67 vol% titania. From this figure, it isapparent that the net change in the dielectric constantdecreased with an increase in frequency. The higher changein the dielectric constant (De’) values at low frequency regionsis due to the contribution of interfacial and dipolar polariza-tion. In fact, with the application of pressure there is a changein the geometry of the interface, and as a result, there is also achange in the overall dielectric constant of the system. The
Fig. 3 Dielectric constant vs. filler loading at three different frequencies (10 Hz,1 kHz, and 1 MHZ) for nanocomposites.
Fig. 4 Effect of sequence of titania addition to the PU matrix on the dielectricconstant. Fig. 5 Effect of mixing temperature on the dielectric constant.
RSC Adv. This journal is � The Royal Society of Chemistry 2013
Paper RSC Advances
Dow
nloa
ded
by N
atio
nal U
nive
rsity
of
Sing
apor
e on
10
Janu
ary
2013
Publ
ishe
d on
10
Janu
ary
2013
on
http
://pu
bs.r
sc.o
rg |
doi:1
0.10
39/C
2RA
2292
9CView Article Online

Fig. 6 (a–c) The effect of pressure on the dielectric constant at different frequencies (10, 102, and 103 Hz); (d and e) the effect of pressure on the dielectric constant (e’)and change in the dielectric constant (De’) of the composite filled with 16.67 vol% of TiO2 at different frequencies; and (f) effect of pressure on DC conductivity ofcomposites prepared by method-2.
This journal is � The Royal Society of Chemistry 2013 RSC Adv.
RSC Advances Paper
Dow
nloa
ded
by N
atio
nal U
nive
rsity
of
Sing
apor
e on
10
Janu
ary
2013
Publ
ishe
d on
10
Janu
ary
2013
on
http
://pu
bs.r
sc.o
rg |
doi:1
0.10
39/C
2RA
2292
9CView Article Online
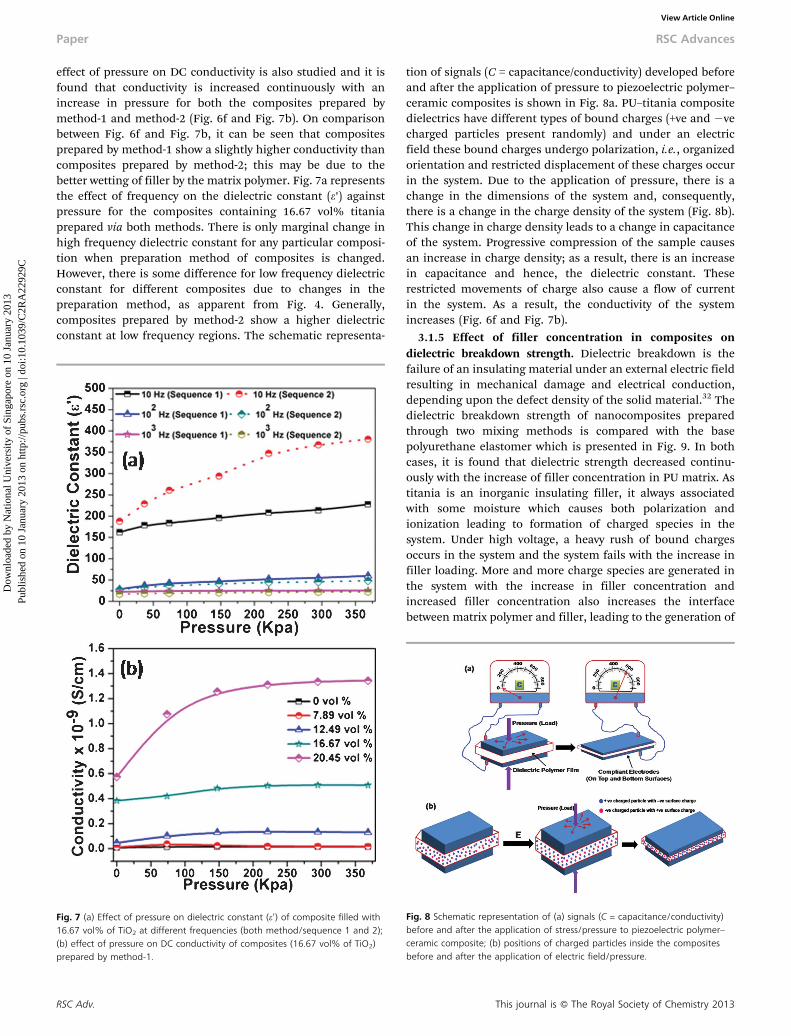
effect of pressure on DC conductivity is also studied and it isfound that conductivity is increased continuously with anincrease in pressure for both the composites prepared bymethod-1 and method-2 (Fig. 6f and Fig. 7b). On comparisonbetween Fig. 6f and Fig. 7b, it can be seen that compositesprepared by method-1 show a slightly higher conductivity thancomposites prepared by method-2; this may be due to thebetter wetting of filler by the matrix polymer. Fig. 7a representsthe effect of frequency on the dielectric constant (e’) againstpressure for the composites containing 16.67 vol% titaniaprepared via both methods. There is only marginal change inhigh frequency dielectric constant for any particular composi-tion when preparation method of composites is changed.However, there is some difference for low frequency dielectricconstant for different composites due to changes in thepreparation method, as apparent from Fig. 4. Generally,composites prepared by method-2 show a higher dielectricconstant at low frequency regions. The schematic representa-
tion of signals (C = capacitance/conductivity) developed beforeand after the application of pressure to piezoelectric polymer–ceramic composites is shown in Fig. 8a. PU–titania compositedielectrics have different types of bound charges (+ve and 2vecharged particles present randomly) and under an electricfield these bound charges undergo polarization, i.e., organizedorientation and restricted displacement of these charges occurin the system. Due to the application of pressure, there is achange in the dimensions of the system and, consequently,there is a change in the charge density of the system (Fig. 8b).This change in charge density leads to a change in capacitanceof the system. Progressive compression of the sample causesan increase in charge density; as a result, there is an increasein capacitance and hence, the dielectric constant. Theserestricted movements of charge also cause a flow of currentin the system. As a result, the conductivity of the systemincreases (Fig. 6f and Fig. 7b).
3.1.5 Effect of filler concentration in composites ondielectric breakdown strength. Dielectric breakdown is thefailure of an insulating material under an external electric fieldresulting in mechanical damage and electrical conduction,depending upon the defect density of the solid material.32 Thedielectric breakdown strength of nanocomposites preparedthrough two mixing methods is compared with the basepolyurethane elastomer which is presented in Fig. 9. In bothcases, it is found that dielectric strength decreased continu-ously with the increase of filler concentration in PU matrix. Astitania is an inorganic insulating filler, it always associatedwith some moisture which causes both polarization andionization leading to formation of charged species in thesystem. Under high voltage, a heavy rush of bound chargesoccurs in the system and the system fails with the increase infiller loading. More and more charge species are generated inthe system with the increase in filler concentration andincreased filler concentration also increases the interfacebetween matrix polymer and filler, leading to the generation of
Fig. 7 (a) Effect of pressure on dielectric constant (e’) of composite filled with16.67 vol% of TiO2 at different frequencies (both method/sequence 1 and 2);(b) effect of pressure on DC conductivity of composites (16.67 vol% of TiO2)prepared by method-1.
Fig. 8 Schematic representation of (a) signals (C = capacitance/conductivity)before and after the application of stress/pressure to piezoelectric polymer–ceramic composite; (b) positions of charged particles inside the compositesbefore and after the application of electric field/pressure.
RSC Adv. This journal is � The Royal Society of Chemistry 2013
Paper RSC Advances
Dow
nloa
ded
by N
atio
nal U
nive
rsity
of
Sing
apor
e on
10
Janu
ary
2013
Publ
ishe
d on
10
Janu
ary
2013
on
http
://pu
bs.r
sc.o
rg |
doi:1
0.10
39/C
2RA
2292
9CView Article Online
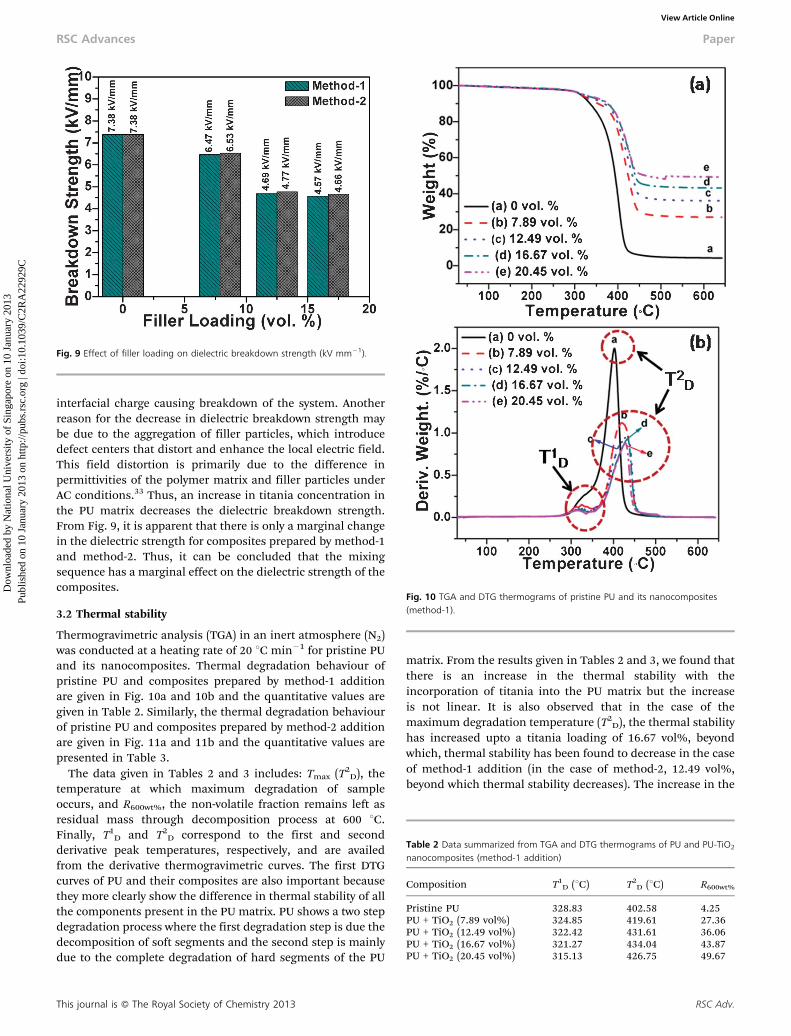
interfacial charge causing breakdown of the system. Anotherreason for the decrease in dielectric breakdown strength maybe due to the aggregation of filler particles, which introducedefect centers that distort and enhance the local electric field.This field distortion is primarily due to the difference inpermittivities of the polymer matrix and filler particles underAC conditions.33 Thus, an increase in titania concentration inthe PU matrix decreases the dielectric breakdown strength.From Fig. 9, it is apparent that there is only a marginal changein the dielectric strength for composites prepared by method-1and method-2. Thus, it can be concluded that the mixingsequence has a marginal effect on the dielectric strength of thecomposites.
3.2 Thermal stability
Thermogravimetric analysis (TGA) in an inert atmosphere (N2)was conducted at a heating rate of 20 uC min21 for pristine PUand its nanocomposites. Thermal degradation behaviour ofpristine PU and composites prepared by method-1 additionare given in Fig. 10a and 10b and the quantitative values aregiven in Table 2. Similarly, the thermal degradation behaviourof pristine PU and composites prepared by method-2 additionare given in Fig. 11a and 11b and the quantitative values arepresented in Table 3.
The data given in Tables 2 and 3 includes: Tmax (T2D), the
temperature at which maximum degradation of sampleoccurs, and R600wt%, the non-volatile fraction remains left asresidual mass through decomposition process at 600 uC.Finally, T1
D and T2D correspond to the first and second
derivative peak temperatures, respectively, and are availedfrom the derivative thermogravimetric curves. The first DTGcurves of PU and their composites are also important becausethey more clearly show the difference in thermal stability of allthe components present in the PU matrix. PU shows a two stepdegradation process where the first degradation step is due thedecomposition of soft segments and the second step is mainlydue to the complete degradation of hard segments of the PU
matrix. From the results given in Tables 2 and 3, we found thatthere is an increase in the thermal stability with theincorporation of titania into the PU matrix but the increaseis not linear. It is also observed that in the case of themaximum degradation temperature (T2
D), the thermal stabilityhas increased upto a titania loading of 16.67 vol%, beyondwhich, thermal stability has been found to decrease in the caseof method-1 addition (in the case of method-2, 12.49 vol%,beyond which thermal stability decreases). The increase in the
Fig. 10 TGA and DTG thermograms of pristine PU and its nanocomposites(method-1).
Table 2 Data summarized from TGA and DTG thermograms of PU and PU-TiO2
nanocomposites (method-1 addition)
Composition T1D (uC) T2
D (uC) R600wt%
Pristine PU 328.83 402.58 4.25PU + TiO2 (7.89 vol%) 324.85 419.61 27.36PU + TiO2 (12.49 vol%) 322.42 431.61 36.06PU + TiO2 (16.67 vol%) 321.27 434.04 43.87PU + TiO2 (20.45 vol%) 315.13 426.75 49.67
Fig. 9 Effect of filler loading on dielectric breakdown strength (kV mm21).
This journal is � The Royal Society of Chemistry 2013 RSC Adv.
RSC Advances Paper
Dow
nloa
ded
by N
atio
nal U
nive
rsity
of
Sing
apor
e on
10
Janu
ary
2013
Publ
ishe
d on
10
Janu
ary
2013
on
http
://pu
bs.r
sc.o
rg |
doi:1
0.10
39/C
2RA
2292
9CView Article Online
thermal stability of composites up to 16.67/12.49 vol% titanialoading is due to the homogenous distribution of titania fillerin the PU matrix and the higher thermal stability of TiO2
powder.34 However, the decreased thermal stability of compo-sites containing filler beyond 16.67/12.49 vol% may be due tothe photoactivity of TiO2 which surpasses the thermal stabilityof TiO2 powder.35 Upon comparison, it has been found thatcompounds prepared via method-2 show better thermalstability than compounds prepared by method-1.
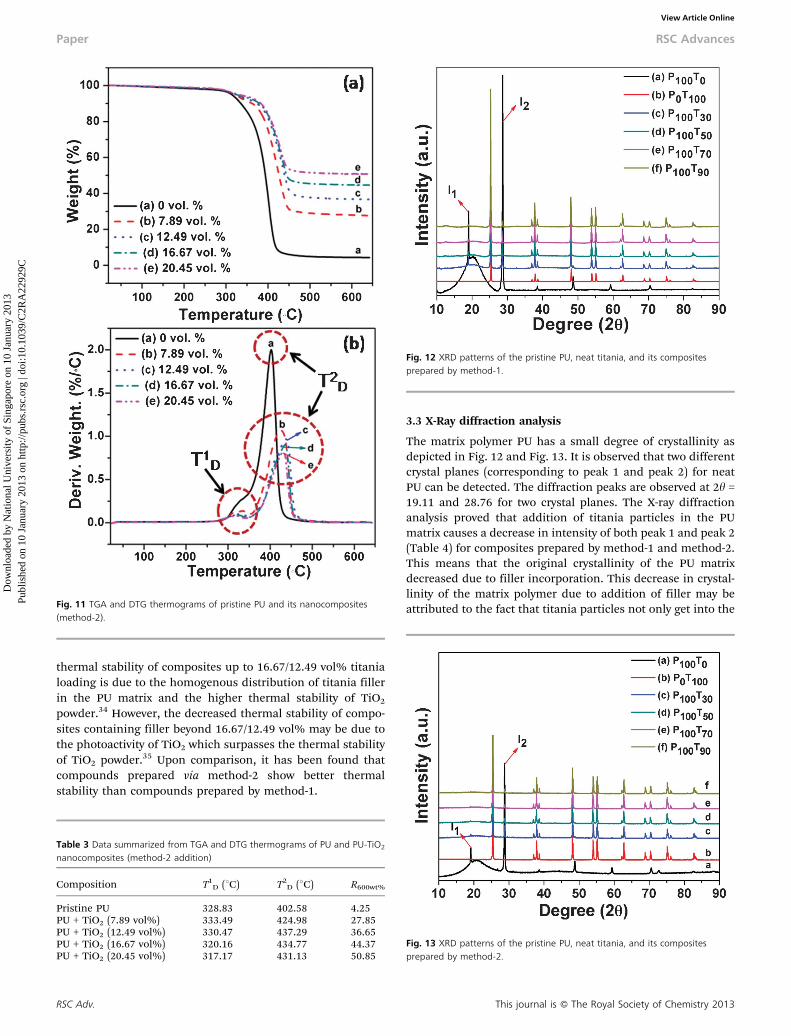
3.3 X-Ray diffraction analysis
The matrix polymer PU has a small degree of crystallinity asdepicted in Fig. 12 and Fig. 13. It is observed that two differentcrystal planes (corresponding to peak 1 and peak 2) for neatPU can be detected. The diffraction peaks are observed at 2h =19.11 and 28.76 for two crystal planes. The X-ray diffractionanalysis proved that addition of titania particles in the PUmatrix causes a decrease in intensity of both peak 1 and peak 2(Table 4) for composites prepared by method-1 and method-2.This means that the original crystallinity of the PU matrixdecreased due to filler incorporation. This decrease in crystal-linity of the matrix polymer due to addition of filler may beattributed to the fact that titania particles not only get into theFig. 11 TGA and DTG thermograms of pristine PU and its nanocomposites
(method-2).
Table 3 Data summarized from TGA and DTG thermograms of PU and PU-TiO2
nanocomposites (method-2 addition)
Composition T1D (uC) T2
D (uC) R600wt%
Pristine PU 328.83 402.58 4.25PU + TiO2 (7.89 vol%) 333.49 424.98 27.85PU + TiO2 (12.49 vol%) 330.47 437.29 36.65PU + TiO2 (16.67 vol%) 320.16 434.77 44.37PU + TiO2 (20.45 vol%) 317.17 431.13 50.85
Fig. 12 XRD patterns of the pristine PU, neat titania, and its compositesprepared by method-1.
Fig. 13 XRD patterns of the pristine PU, neat titania, and its compositesprepared by method-2.
RSC Adv. This journal is � The Royal Society of Chemistry 2013
Paper RSC Advances
Dow
nloa
ded
by N
atio
nal U
nive
rsity
of
Sing
apor
e on
10
Janu
ary
2013
Publ
ishe
d on
10
Janu
ary
2013
on
http
://pu
bs.r
sc.o
rg |
doi:1
0.10
39/C
2RA
2292
9CView Article Online

amorphous region of the polymer but are also present in theinterphase between the crystalline and amorphous regions. Infact, the presence of such particles in this region hampers therecrystallization of the PU matrix after melt-mixing (Fig. 14).
3.4 Field emission scanning electron microscopy (FESEM)study
Cryo-fractured surfaces of different PU–TiO2 nanocompositeswith various filler loadings (e.g. 7.89 vol% (30 php), 12.49 vol%(50 php), 16.67 vol% (70 php), and 20.45 vol% (90 php) oftitania) are analyzed by FESEM (Fig. 15 and Fig. 16). The whitedots in these pictures indicate the presence of filler (titania)particles and the gray areas show the matrix polymer. Fig. 15represents the FESEM images of composites prepared viamethod-1 addition whereas Fig. 16 represents the FESEM
images of composites prepared via method-2 addition. It canbe observed from both of these figures that the numbers oftitania particles are increased for composites containing 16.67vol% and 20.45 vol% of titania and the particles are firmlybound to the PU matrix. This can be attributed to the existenceof interactions between titania particles and the PU matrix.From Fig. 16, a unique morphology (pitcher shape) is observedfor all the composites. For all pitcher-like shapes, the internalpart is the PU matrix and the outer white dots are for titaniaparticles which are apparent from EDX analysis (Fig. 16f and
Fig. 14 Schematic representation of polymer chains before and after theaddition of titania particles.
Fig. 15 The microstructure of the cryo-fractured surfaces of the compositesprepared via method-1 (a) 7.89 vol% titania, (b) 12.49 vol% titania, (c) 16.67vol% titania, and (d) 20.45 vol% titania.
Fig. 16 The microstructure of the cryo-fractured surfaces of the compositesprepared via method-2 (a) pristine PU, (b) 7.89 vol% titania, (c) 12.49 vol%titania, (d) 16.67 vol% titania, (e) 20.45 vol% titania, and (f) SEM-EDX image ofcomposite containing 20.45 vol% titania.
Table 4 The peak intensities of peak 1 and peak 2 for neat PU and itscomposites
Titania Content (vol%)
Intensity (%)
I1 I2
Method-1 0 28.16 1007.89 4.74 17.4312.49 1.85 6.8516.67 1.2 3.4220.45 0.8 2.41
Method-2 0 28.16 1007.89 5.14 12.4812.49 3.52 5.4716.67 0 4.13
This journal is � The Royal Society of Chemistry 2013 RSC Adv.
RSC Advances Paper
Dow
nloa
ded
by N
atio
nal U
nive
rsity
of
Sing
apor
e on
10
Janu
ary
2013
Publ
ishe
d on
10
Janu
ary
2013
on
http
://pu
bs.r
sc.o
rg |
doi:1
0.10
39/C
2RA
2292
9CView Article Online
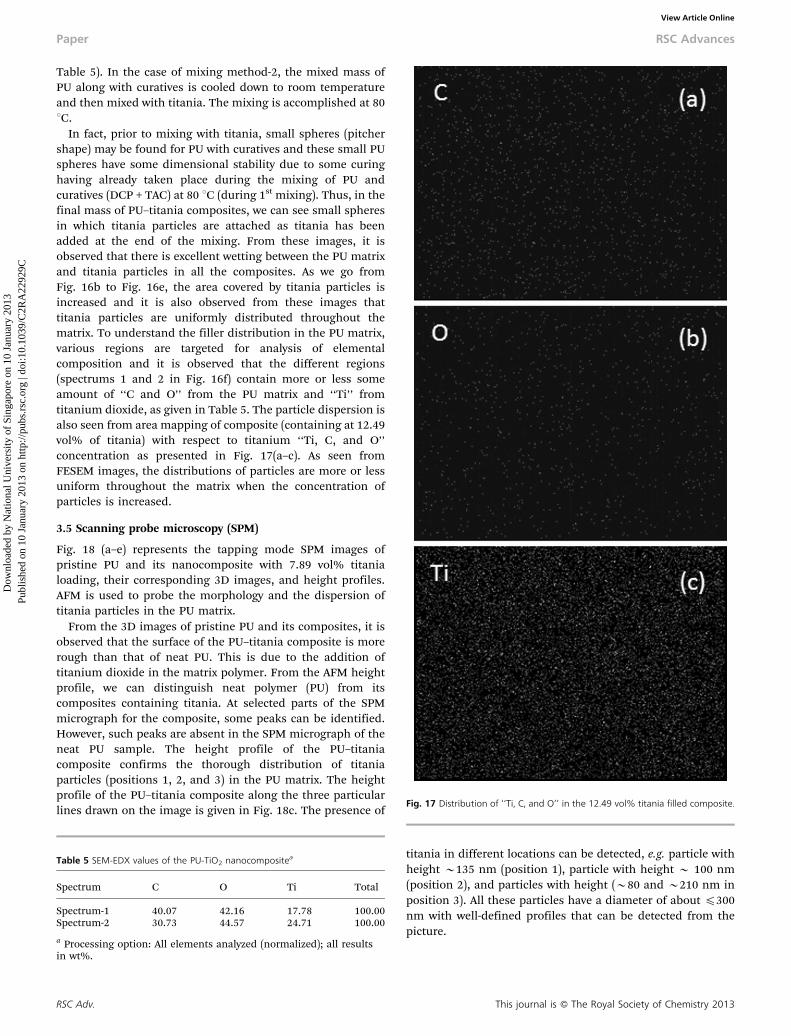
Table 5). In the case of mixing method-2, the mixed mass ofPU along with curatives is cooled down to room temperatureand then mixed with titania. The mixing is accomplished at 80uC.
In fact, prior to mixing with titania, small spheres (pitchershape) may be found for PU with curatives and these small PUspheres have some dimensional stability due to some curinghaving already taken place during the mixing of PU andcuratives (DCP + TAC) at 80 uC (during 1st mixing). Thus, in thefinal mass of PU–titania composites, we can see small spheresin which titania particles are attached as titania has beenadded at the end of the mixing. From these images, it isobserved that there is excellent wetting between the PU matrixand titania particles in all the composites. As we go fromFig. 16b to Fig. 16e, the area covered by titania particles isincreased and it is also observed from these images thattitania particles are uniformly distributed throughout thematrix. To understand the filler distribution in the PU matrix,various regions are targeted for analysis of elementalcomposition and it is observed that the different regions(spectrums 1 and 2 in Fig. 16f) contain more or less someamount of ‘‘C and O’’ from the PU matrix and ‘‘Ti’’ fromtitanium dioxide, as given in Table 5. The particle dispersion isalso seen from area mapping of composite (containing at 12.49vol% of titania) with respect to titanium ‘‘Ti, C, and O’’concentration as presented in Fig. 17(a–c). As seen fromFESEM images, the distributions of particles are more or lessuniform throughout the matrix when the concentration ofparticles is increased.
3.5 Scanning probe microscopy (SPM)
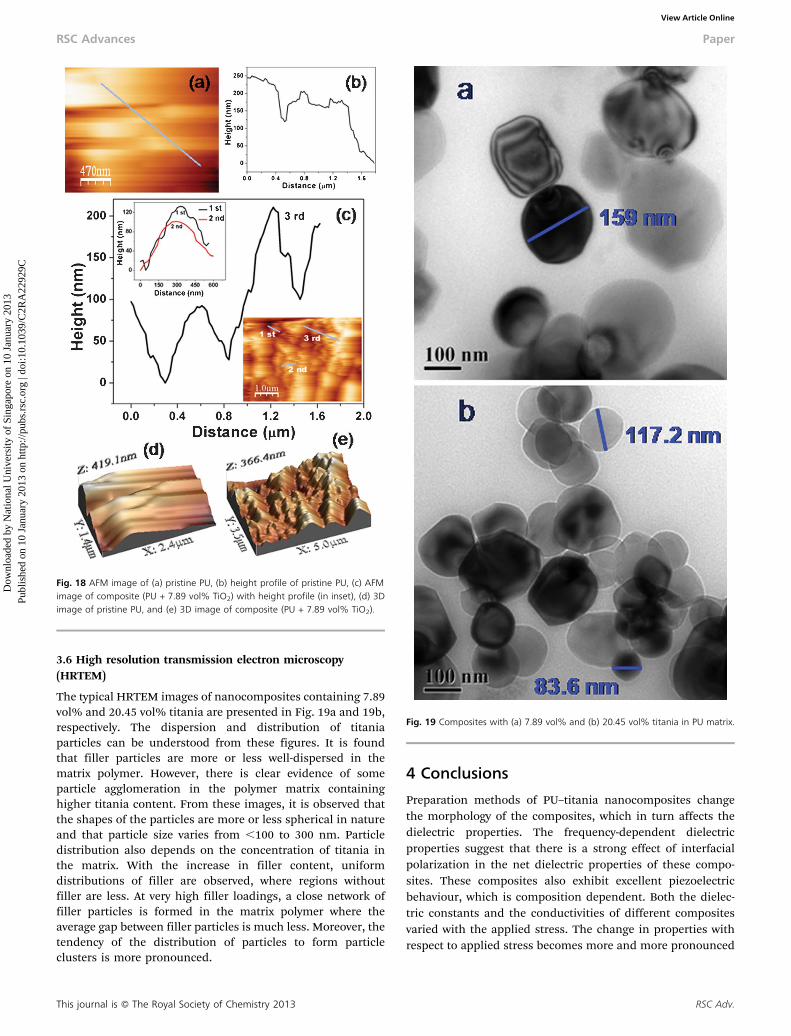
Fig. 18 (a–e) represents the tapping mode SPM images ofpristine PU and its nanocomposite with 7.89 vol% titanialoading, their corresponding 3D images, and height profiles.AFM is used to probe the morphology and the dispersion oftitania particles in the PU matrix.
From the 3D images of pristine PU and its composites, it isobserved that the surface of the PU–titania composite is morerough than that of neat PU. This is due to the addition oftitanium dioxide in the matrix polymer. From the AFM heightprofile, we can distinguish neat polymer (PU) from itscomposites containing titania. At selected parts of the SPMmicrograph for the composite, some peaks can be identified.However, such peaks are absent in the SPM micrograph of theneat PU sample. The height profile of the PU–titaniacomposite confirms the thorough distribution of titaniaparticles (positions 1, 2, and 3) in the PU matrix. The heightprofile of the PU–titania composite along the three particularlines drawn on the image is given in Fig. 18c. The presence of
titania in different locations can be detected, e.g. particle withheight y135 nm (position 1), particle with height y 100 nm(position 2), and particles with height (y80 and y210 nm inposition 3). All these particles have a diameter of about ¡300nm with well-defined profiles that can be detected from thepicture.
Fig. 17 Distribution of ‘‘Ti, C, and O’’ in the 12.49 vol% titania filled composite.
Table 5 SEM-EDX values of the PU-TiO2 nanocompositea
Spectrum C O Ti Total
Spectrum-1 40.07 42.16 17.78 100.00Spectrum-2 30.73 44.57 24.71 100.00
a Processing option: All elements analyzed (normalized); all resultsin wt%.
RSC Adv. This journal is � The Royal Society of Chemistry 2013
Paper RSC Advances
Dow
nloa
ded
by N
atio
nal U
nive
rsity
of
Sing
apor
e on
10
Janu
ary
2013
Publ
ishe
d on
10
Janu
ary
2013
on
http
://pu
bs.r
sc.o
rg |
doi:1
0.10
39/C
2RA
2292
9CView Article Online
3.6 High resolution transmission electron microscopy(HRTEM)
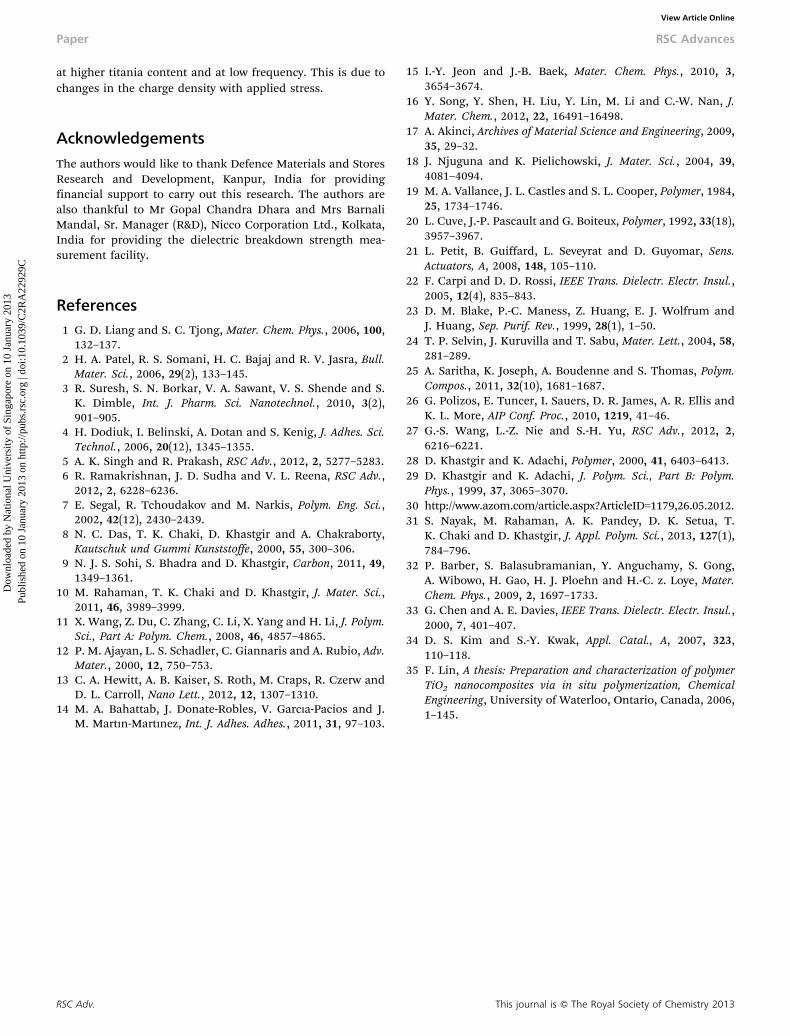
The typical HRTEM images of nanocomposites containing 7.89vol% and 20.45 vol% titania are presented in Fig. 19a and 19b,respectively. The dispersion and distribution of titaniaparticles can be understood from these figures. It is foundthat filler particles are more or less well-dispersed in thematrix polymer. However, there is clear evidence of someparticle agglomeration in the polymer matrix containinghigher titania content. From these images, it is observed thatthe shapes of the particles are more or less spherical in natureand that particle size varies from ,100 to 300 nm. Particledistribution also depends on the concentration of titania inthe matrix. With the increase in filler content, uniformdistributions of filler are observed, where regions withoutfiller are less. At very high filler loadings, a close network offiller particles is formed in the matrix polymer where theaverage gap between filler particles is much less. Moreover, thetendency of the distribution of particles to form particleclusters is more pronounced.
4 Conclusions
Preparation methods of PU–titania nanocomposites changethe morphology of the composites, which in turn affects thedielectric properties. The frequency-dependent dielectricproperties suggest that there is a strong effect of interfacialpolarization in the net dielectric properties of these compo-sites. These composites also exhibit excellent piezoelectricbehaviour, which is composition dependent. Both the dielec-tric constants and the conductivities of different compositesvaried with the applied stress. The change in properties withrespect to applied stress becomes more and more pronounced
Fig. 18 AFM image of (a) pristine PU, (b) height profile of pristine PU, (c) AFMimage of composite (PU + 7.89 vol% TiO2) with height profile (in inset), (d) 3Dimage of pristine PU, and (e) 3D image of composite (PU + 7.89 vol% TiO2).
Fig. 19 Composites with (a) 7.89 vol% and (b) 20.45 vol% titania in PU matrix.
This journal is � The Royal Society of Chemistry 2013 RSC Adv.
RSC Advances Paper
Dow
nloa
ded
by N
atio
nal U
nive
rsity
of
Sing
apor
e on
10
Janu
ary
2013
Publ
ishe
d on
10
Janu
ary
2013
on
http
://pu
bs.r
sc.o
rg |
doi:1
0.10
39/C
2RA
2292
9CView Article Online
at higher titania content and at low frequency. This is due tochanges in the charge density with applied stress.
Acknowledgements
The authors would like to thank Defence Materials and StoresResearch and Development, Kanpur, India for providingfinancial support to carry out this research. The authors arealso thankful to Mr Gopal Chandra Dhara and Mrs BarnaliMandal, Sr. Manager (R&D), Nicco Corporation Ltd., Kolkata,India for providing the dielectric breakdown strength mea-surement facility.
References1 G. D. Liang and S. C. Tjong, Mater. Chem. Phys., 2006, 100,
132–137.2 H. A. Patel, R. S. Somani, H. C. Bajaj and R. V. Jasra, Bull.
Mater. Sci., 2006, 29(2), 133–145.3 R. Suresh, S. N. Borkar, V. A. Sawant, V. S. Shende and S.
K. Dimble, Int. J. Pharm. Sci. Nanotechnol., 2010, 3(2),901–905.
4 H. Dodiuk, I. Belinski, A. Dotan and S. Kenig, J. Adhes. Sci.Technol., 2006, 20(12), 1345–1355.
5 A. K. Singh and R. Prakash, RSC Adv., 2012, 2, 5277–5283.6 R. Ramakrishnan, J. D. Sudha and V. L. Reena, RSC Adv.,
2012, 2, 6228–6236.7 E. Segal, R. Tchoudakov and M. Narkis, Polym. Eng. Sci.,
2002, 42(12), 2430–2439.8 N. C. Das, T. K. Chaki, D. Khastgir and A. Chakraborty,
Kautschuk und Gummi Kunststoffe, 2000, 55, 300–306.9 N. J. S. Sohi, S. Bhadra and D. Khastgir, Carbon, 2011, 49,
1349–1361.10 M. Rahaman, T. K. Chaki and D. Khastgir, J. Mater. Sci.,
2011, 46, 3989–3999.11 X. Wang, Z. Du, C. Zhang, C. Li, X. Yang and H. Li, J. Polym.
Sci., Part A: Polym. Chem., 2008, 46, 4857–4865.12 P. M. Ajayan, L. S. Schadler, C. Giannaris and A. Rubio, Adv.
Mater., 2000, 12, 750–753.13 C. A. Hewitt, A. B. Kaiser, S. Roth, M. Craps, R. Czerw and
D. L. Carroll, Nano Lett., 2012, 12, 1307–1310.14 M. A. Bahattab, J. Donate-Robles, V. Garc|a-Pacios and J.
M. Mart|n-Mart|nez, Int. J. Adhes. Adhes., 2011, 31, 97–103.
15 I.-Y. Jeon and J.-B. Baek, Mater. Chem. Phys., 2010, 3,3654–3674.
16 Y. Song, Y. Shen, H. Liu, Y. Lin, M. Li and C.-W. Nan, J.Mater. Chem., 2012, 22, 16491–16498.
17 A. Akinci, Archives of Material Science and Engineering, 2009,35, 29–32.
18 J. Njuguna and K. Pielichowski, J. Mater. Sci., 2004, 39,4081–4094.
19 M. A. Vallance, J. L. Castles and S. L. Cooper, Polymer, 1984,25, 1734–1746.
20 L. Cuve, J.-P. Pascault and G. Boiteux, Polymer, 1992, 33(18),3957–3967.
21 L. Petit, B. Guiffard, L. Seveyrat and D. Guyomar, Sens.Actuators, A, 2008, 148, 105–110.
22 F. Carpi and D. D. Rossi, IEEE Trans. Dielectr. Electr. Insul.,2005, 12(4), 835–843.
23 D. M. Blake, P.-C. Maness, Z. Huang, E. J. Wolfrum andJ. Huang, Sep. Purif. Rev., 1999, 28(1), 1–50.
24 T. P. Selvin, J. Kuruvilla and T. Sabu, Mater. Lett., 2004, 58,281–289.
25 A. Saritha, K. Joseph, A. Boudenne and S. Thomas, Polym.Compos., 2011, 32(10), 1681–1687.
26 G. Polizos, E. Tuncer, I. Sauers, D. R. James, A. R. Ellis andK. L. More, AIP Conf. Proc., 2010, 1219, 41–46.
27 G.-S. Wang, L.-Z. Nie and S.-H. Yu, RSC Adv., 2012, 2,6216–6221.
28 D. Khastgir and K. Adachi, Polymer, 2000, 41, 6403–6413.29 D. Khastgir and K. Adachi, J. Polym. Sci., Part B: Polym.
Phys., 1999, 37, 3065–3070.30 http://www.azom.com/article.aspx?ArticleID=1179,26.05.2012.31 S. Nayak, M. Rahaman, A. K. Pandey, D. K. Setua, T.
K. Chaki and D. Khastgir, J. Appl. Polym. Sci., 2013, 127(1),784–796.
32 P. Barber, S. Balasubramanian, Y. Anguchamy, S. Gong,A. Wibowo, H. Gao, H. J. Ploehn and H.-C. z. Loye, Mater.Chem. Phys., 2009, 2, 1697–1733.
33 G. Chen and A. E. Davies, IEEE Trans. Dielectr. Electr. Insul.,2000, 7, 401–407.
34 D. S. Kim and S.-Y. Kwak, Appl. Catal., A, 2007, 323,110–118.
35 F. Lin, A thesis: Preparation and characterization of polymerTiO2 nanocomposites via in situ polymerization, ChemicalEngineering, University of Waterloo, Ontario, Canada, 2006,1–145.
RSC Adv. This journal is � The Royal Society of Chemistry 2013
Paper RSC Advances
Dow
nloa
ded
by N
atio
nal U
nive
rsity
of
Sing
apor
e on
10
Janu
ary
2013
Publ
ishe
d on
10
Janu
ary
2013
on
http
://pu
bs.r
sc.o
rg |
doi:1
0.10
39/C
2RA
2292
9CView Article Online