Atomically Detailed Models of the Effect of Thermal Roughening on the Enantiospecificity of...
12
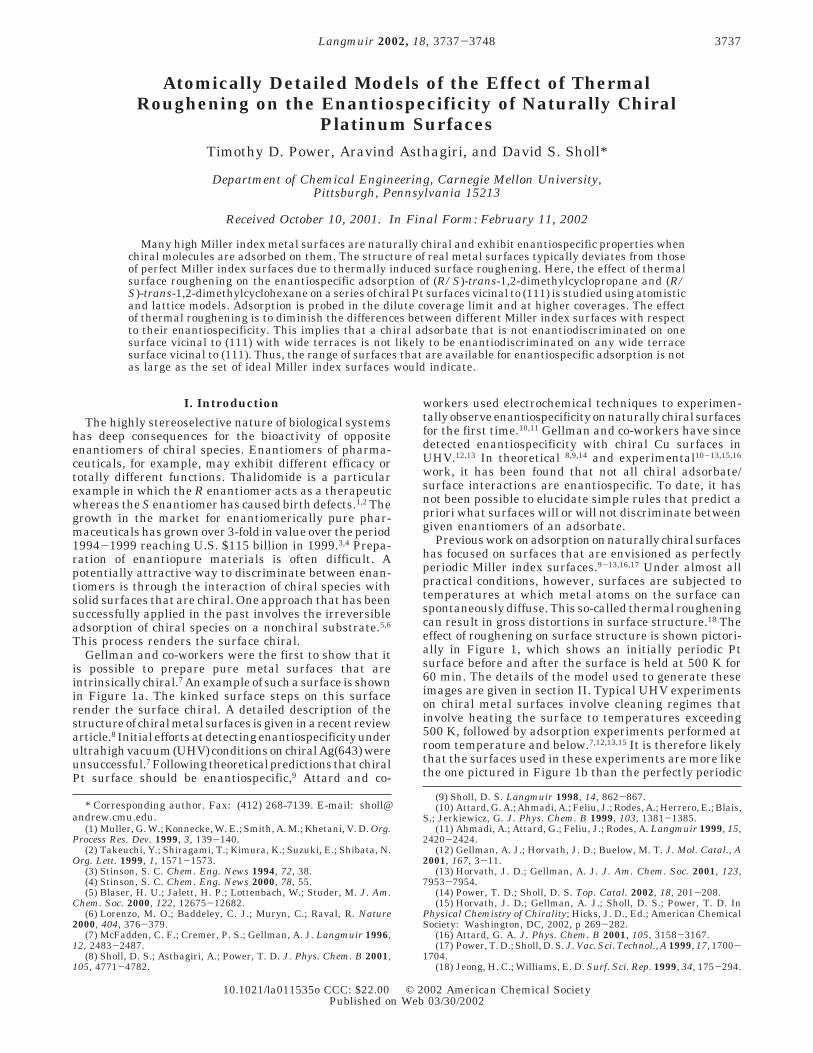
Atomically Detailed Models of the Effect of Thermal Roughening on the Enantiospecificity of Naturally Chiral Platinum Surfaces Timothy D. Power, Aravind Asthagiri, and David S. Sholl* Department of Chemical Engineering, Carnegie Mellon University, Pittsburgh, Pennsylvania 15213 Received October 10, 2001. In Final Form: February 11, 2002 Many high Miller index metal surfaces are naturally chiral and exhibit enantiospecific properties when chiral molecules are adsorbed on them. The structure of real metal surfaces typically deviates from those of perfect Miller index surfaces due to thermally induced surface roughening. Here, the effect of thermal surface roughening on the enantiospecific adsorption of (R/S)-trans-1,2-dimethylcyclopropane and (R/ S)-trans-1,2-dimethylcyclohexane on a series of chiral Pt surfaces vicinal to (111) is studied using atomistic and lattice models. Adsorption is probed in the dilute coverage limit and at higher coverages. The effect of thermal roughening is to diminish the differences between different Miller index surfaces with respect to their enantiospecificity. This implies that a chiral adsorbate that is not enantiodiscriminated on one surface vicinal to (111) with wide terraces is not likely to be enantiodiscriminated on any wide terrace surface vicinal to (111). Thus, the range of surfaces that are available for enantiospecific adsorption is not as large as the set of ideal Miller index surfaces would indicate. I. Introduction The highly stereoselective nature of biological systems has deep consequences for the bioactivity of opposite enantiomers of chiral species. Enantiomers of pharma- ceuticals, for example, may exhibit different efficacy or totally different functions. Thalidomide is a particular example in which the R enantiomer acts as a therapeutic whereas the S enantiomer has caused birth defects. 1,2 The growth in the market for enantiomerically pure phar- maceuticals has grown over 3-fold in value over the period 1994-1999 reaching U.S. $115 billion in 1999. 3,4 Prepa- ration of enantiopure materials is often difficult. A potentially attractive way to discriminate between enan- tiomers is through the interaction of chiral species with solid surfaces that are chiral. One approach that has been successfully applied in the past involves the irreversible adsorption of chiral species on a nonchiral substrate. 5,6 This process renders the surface chiral. Gellman and co-workers were the first to show that it is possible to prepare pure metal surfaces that are intrinsically chiral. 7 An example of such a surface is shown in Figure 1a. The kinked surface steps on this surface render the surface chiral. A detailed description of the structure of chiral metal surfaces is given in a recent review article. 8 Initial efforts at detecting enantiospecificity under ultrahigh vacuum (UHV) conditions on chiral Ag(643) were unsuccessful. 7 Following theoretical predictions that chiral Pt surface should be enantiospecific, 9 Attard and co- workers used electrochemical techniques to experimen- tally observe enantiospecificity on naturally chiral surfaces for the first time. 10,11 Gellman and co-workers have since detected enantiospecificity with chiral Cu surfaces in UHV. 12,13 In theoretical 8,9,14 and experimental 10-13,15,16 work, it has been found that not all chiral adsorbate/ surface interactions are enantiospecific. To date, it has not been possible to elucidate simple rules that predict a priori what surfaces will or will not discriminate between given enantiomers of an adsorbate. Previous work on adsorption on naturally chiral surfaces has focused on surfaces that are envisioned as perfectly periodic Miller index surfaces. 9-13,16,17 Under almost all practical conditions, however, surfaces are subjected to temperatures at which metal atoms on the surface can spontaneously diffuse. This so-called thermal roughening can result in gross distortions in surface structure. 18 The effect of roughening on surface structure is shown pictori- ally in Figure 1, which shows an initially periodic Pt surface before and after the surface is held at 500 K for 60 min. The details of the model used to generate these images are given in section II. Typical UHV experiments on chiral metal surfaces involve cleaning regimes that involve heating the surface to temperatures exceeding 500 K, followed by adsorption experiments performed at room temperature and below. 7,12,13,15 It is therefore likely that the surfaces used in these experiments are more like the one pictured in Figure 1b than the perfectly periodic * Corresponding author. Fax: (412) 268-7139. E-mail: sholl@ andrew.cmu.edu. (1) Muller, G. W.; Konnecke, W. E.; Smith, A. M.; Khetani, V. D. Org. Process Res. Dev. 1999, 3, 139-140. (2) Takeuchi, Y.; Shiragami, T.; Kimura, K.; Suzuki, E.; Shibata, N. Org. Lett. 1999, 1, 1571-1573. (3) Stinson, S. C. Chem. Eng. News 1994, 72, 38. (4) Stinson, S. C. Chem. Eng. News 2000, 78, 55. (5) Blaser, H. U.; Jalett, H. P.; Lottenbach, W.; Studer, M. J. Am. Chem. Soc. 2000, 122, 12675-12682. (6) Lorenzo, M. O.; Baddeley, C. J.; Muryn, C.; Raval, R. Nature 2000, 404, 376-379. (7) McFadden, C. F.; Cremer, P. S.; Gellman, A. J. Langmuir 1996, 12, 2483-2487. (8) Sholl, D. S.; Asthagiri, A.; Power, T. D. J. Phys. Chem. B 2001, 105, 4771-4782. (9) Sholl, D. S. Langmuir 1998, 14, 862-867. (10) Attard, G. A.; Ahmadi, A.; Feliu, J.; Rodes, A.; Herrero, E.; Blais, S.; Jerkiewicz, G. J. Phys. Chem. B 1999, 103, 1381-1385. (11) Ahmadi, A.; Attard, G.; Feliu, J.; Rodes, A. Langmuir 1999, 15, 2420-2424. (12) Gellman, A. J.; Horvath, J. D.; Buelow, M. T. J. Mol. Catal., A 2001, 167,3-11. (13) Horvath, J. D.; Gellman, A. J. J. Am. Chem. Soc. 2001, 123, 7953-7954. (14) Power, T. D.; Sholl, D. S. Top. Catal. 2002, 18, 201-208. (15) Horvath, J. D.; Gellman, A. J.; Sholl, D. S.; Power, T. D. In Physical Chemistry of Chirality; Hicks, J. D., Ed.; American Chemical Society: Washington, DC, 2002, p 269-282. (16) Attard, G. A. J. Phys. Chem. B 2001, 105, 3158-3167. (17) Power, T. D.; Sholl, D. S. J. Vac. Sci. Technol., A 1999, 17, 1700- 1704. (18) Jeong, H. C.; Williams, E. D. Surf. Sci. Rep. 1999, 34, 175-294. 3737 Langmuir 2002, 18, 3737-3748 10.1021/la011535o CCC: $22.00 © 2002 American Chemical Society Published on Web 03/30/2002
Transcript of Atomically Detailed Models of the Effect of Thermal Roughening on the Enantiospecificity of...
Atomically Detailed Models of the Effect of ThermalRoughening on the Enantiospecificity of Naturally Chiral
Platinum SurfacesTimothy D. Power, Aravind Asthagiri, and David S. Sholl*
Department of Chemical Engineering, Carnegie Mellon University,Pittsburgh, Pennsylvania 15213
Received October 10, 2001. In Final Form: February 11, 2002
Many high Miller index metal surfaces are naturally chiral and exhibit enantiospecific properties whenchiral molecules are adsorbed on them. The structure of real metal surfaces typically deviates from thoseof perfect Miller index surfaces due to thermally induced surface roughening. Here, the effect of thermalsurface roughening on the enantiospecific adsorption of (R/S)-trans-1,2-dimethylcyclopropane and (R/S)-trans-1,2-dimethylcyclohexane on a series of chiral Pt surfaces vicinal to (111) is studied using atomisticand lattice models. Adsorption is probed in the dilute coverage limit and at higher coverages. The effectof thermal roughening is to diminish the differences between different Miller index surfaces with respectto their enantiospecificity. This implies that a chiral adsorbate that is not enantiodiscriminated on onesurface vicinal to (111) with wide terraces is not likely to be enantiodiscriminated on any wide terracesurface vicinal to (111). Thus, the range of surfaces that are available for enantiospecific adsorption is notas large as the set of ideal Miller index surfaces would indicate.
I. Introduction
The highly stereoselective nature of biological systemshas deep consequences for the bioactivity of oppositeenantiomers of chiral species. Enantiomers of pharma-ceuticals, for example, may exhibit different efficacy ortotally different functions. Thalidomide is a particularexample in which the R enantiomer acts as a therapeuticwhereas the S enantiomer has caused birth defects.1,2 Thegrowth in the market for enantiomerically pure phar-maceuticals has grown over 3-fold in value over the period1994-1999 reaching U.S. $115 billion in 1999.3,4 Prepa-ration of enantiopure materials is often difficult. Apotentially attractive way to discriminate between enan-tiomers is through the interaction of chiral species withsolid surfaces that are chiral. One approach that has beensuccessfully applied in the past involves the irreversibleadsorption of chiral species on a nonchiral substrate.5,6
This process renders the surface chiral.Gellman and co-workers were the first to show that it
is possible to prepare pure metal surfaces that areintrinsically chiral.7 An example of such a surface is shownin Figure 1a. The kinked surface steps on this surfacerender the surface chiral. A detailed description of thestructureof chiralmetal surfaces is given in a recent reviewarticle.8 Initial efforts at detecting enantiospecificity underultrahighvacuum(UHV)conditions on chiral Ag(643)wereunsuccessful.7 Following theoretical predictions that chiralPt surface should be enantiospecific,9 Attard and co-
workers used electrochemical techniques to experimen-tallyobserveenantiospecificityonnaturally chiral surfacesfor the first time.10,11 Gellman and co-workers have sincedetected enantiospecificity with chiral Cu surfaces inUHV.12,13 In theoretical 8,9,14 and experimental10-13,15,16
work, it has been found that not all chiral adsorbate/surface interactions are enantiospecific. To date, it hasnot been possible to elucidate simple rules that predict apriori what surfaces will or will not discriminate betweengiven enantiomers of an adsorbate.
Previous work on adsorption on naturally chiral surfaceshas focused on surfaces that are envisioned as perfectlyperiodic Miller index surfaces.9-13,16,17 Under almost allpractical conditions, however, surfaces are subjected totemperatures at which metal atoms on the surface canspontaneously diffuse. This so-called thermal rougheningcan result in gross distortions in surface structure.18 Theeffect of roughening on surface structure is shown pictori-ally in Figure 1, which shows an initially periodic Ptsurface before and after the surface is held at 500 K for60 min. The details of the model used to generate theseimages are given in section II. Typical UHV experimentson chiral metal surfaces involve cleaning regimes thatinvolve heating the surface to temperatures exceeding500 K, followed by adsorption experiments performed atroom temperature and below.7,12,13,15 It is therefore likelythat the surfaces used in these experiments are more likethe one pictured in Figure 1b than the perfectly periodic
* Corresponding author. Fax: (412) 268-7139. E-mail: [email protected].
(1) Muller, G. W.; Konnecke, W. E.; Smith, A. M.; Khetani, V. D. Org.Process Res. Dev. 1999, 3, 139-140.
(2) Takeuchi, Y.; Shiragami, T.; Kimura, K.; Suzuki, E.; Shibata, N.Org. Lett. 1999, 1, 1571-1573.
(3) Stinson, S. C. Chem. Eng. News 1994, 72, 38.(4) Stinson, S. C. Chem. Eng. News 2000, 78, 55.(5) Blaser, H. U.; Jalett, H. P.; Lottenbach, W.; Studer, M. J. Am.
Chem. Soc. 2000, 122, 12675-12682.(6) Lorenzo, M. O.; Baddeley, C. J.; Muryn, C.; Raval, R. Nature
2000, 404, 376-379.(7) McFadden, C. F.; Cremer, P. S.; Gellman, A. J. Langmuir 1996,
12, 2483-2487.(8) Sholl, D. S.; Asthagiri, A.; Power, T. D. J. Phys. Chem. B 2001,
105, 4771-4782.
(9) Sholl, D. S. Langmuir 1998, 14, 862-867.(10) Attard, G. A.; Ahmadi, A.; Feliu, J.; Rodes, A.; Herrero, E.; Blais,
S.; Jerkiewicz, G. J. Phys. Chem. B 1999, 103, 1381-1385.(11) Ahmadi, A.; Attard, G.; Feliu, J.; Rodes, A. Langmuir 1999, 15,
2420-2424.(12) Gellman, A. J.; Horvath, J. D.; Buelow, M. T. J. Mol. Catal., A
2001, 167, 3-11.(13) Horvath, J. D.; Gellman, A. J. J. Am. Chem. Soc. 2001, 123,
7953-7954.(14) Power, T. D.; Sholl, D. S. Top. Catal. 2002, 18, 201-208.(15) Horvath, J. D.; Gellman, A. J.; Sholl, D. S.; Power, T. D. In
Physical Chemistry of Chirality; Hicks, J. D., Ed.; American ChemicalSociety: Washington, DC, 2002, p 269-282.
(16) Attard, G. A. J. Phys. Chem. B 2001, 105, 3158-3167.(17) Power, T. D.; Sholl, D. S. J. Vac. Sci. Technol., A 1999, 17, 1700-
1704.(18) Jeong, H. C.; Williams, E. D. Surf. Sci. Rep. 1999, 34, 175-294.
3737Langmuir 2002, 18, 3737-3748
10.1021/la011535o CCC: $22.00 © 2002 American Chemical SocietyPublished on Web 03/30/2002

structure shown in Figure 1a. The aim of this paper is touse atomically detailed models of molecular adsorption toassess how the thermal roughening typified by Figure 1changes the enantiospecific adsorption properties of chiralmetal surfaces relative to their idealized Miller indexstates. To do this, we apply a lattice model we developedrecently19 to predict the structure of a series of thermallyroughened Pt surfaces vicinal to Pt(111) with atomic-scaledetail. We then examine the adsorption of two chiralhydrocarbons, (R/S)-trans-1,2-dimethylcyclopropane (R/S-DMCPr) and (R/S)-trans-1,2-dimethylcyclohexane (R/S-DMCH), on these surfaces using atomistic methods wehave previously developed for studying ideal high Millerindex surfaces.8 The former molecule is a small moleculewith little flexibility; the latter has a larger ring and canadopt several stable conformations.8,14 We show that, forboth species, thermal roughening diminishes the differ-ences between chiral surfaces vicinal to the same low-index plane, effectively reducing the choice of substratesavailable for enantiospecific adsorption.
The rest of this paper is organized as follows. In sectionII, we describe the lattice gas calculations used to predictroughened surface structures. In section III, we study theadsorption of the chiral hydrocarbons on roughenedsurfaces in the dilute coverage limit, i.e., when only onemolecule is adsorbed on the surface. Our results arediscussed in terms of both the adsorption states observedat lowtemperaturesandthedesorptionbehavioraccessiblefrom temperature-programmed desorption (TPD) experi-ments. The extension of our model to the coveragedependence of TPD spectra is described in section IV. Weconclude in section V with a summary of our results anda discussion of strategies relevant to the problem ofcreating surfaces that are highly enantiospecific withrespect to chiral adsorbates.
II. Thermal Roughening of Chiral Pt SurfacesThe starting point for a modeling study of thermally
roughened surfaces is a description of the roughenedsurfaces’ structure. Because thermal roughening is drivenby the surface diffusion of metal atoms, it is necessary touse a model that incorporates an accurate description ofthese processes. We have recently developed a lattice gas(LG) model using adatom diffusion barriers calculated bydensity functional theory (DFT) to quantitatively predictthe effect of thermal roughening on the step structure ofchiral Pt surfaces vicinal to Pt(111). A detailed descriptionof the model can be found in ref 19, but we will outline itsimportant assumptions and features below.
Our goal is to be able to make quantitative predictionson an atomic level of the roughened step structure of chiralPt surfaces. This is possible if one knows the mechanismand rate of all the relevant surface diffusion processes. Tolimit the number of processes that must be considered,we restrict our attention to single surface steps boundedon both sides by (111) planes. That is, we consider onlyPt surfaces vicinal to (111) with large step-step spacings.We discuss the effect of step spacing on enantiospecificadsorption in section III.
On fcc surfaces vicinal to (111), kinks occur when a stepedge with local (100) orientation intersects a step withlocal (110) orientation.8 Such steps are often referred toas A and B steps, respectively.8 We refer to kinks wherethe A step (B step) is the longer of the two step edges asbeing A-type (B-type) kinks. Kinks with equal A and Bstep lengths such as fcc(531) also exist and are chiral. Adetailed description of these issues is provided in ref 8.The energy barriers to many of the relevant diffusionprocesses for these surfaces have been calculated usingDFT by Feibelman.20 Energy barriers calculated via DFTfor Pt(111) and Pt(331) are in good agreement withexperimental results, which serves as an example of theaccuracy of this technique.20 For this work we use theDFT results computed using the local density approxima-tion (LDA). Results from the generalized gradient ap-proximation (GGA) are qualitatively similar but not asquantitatively accurate.20
Although many energy barriers for Pt adatom diffusionhave been calculated using DFT,20 it is not feasible toexamine every process available to atoms on a surface. Toovercome this difficulty we have derived a LG model forPt diffusion along step edges on the basis of the barriersknown from DFT. There are four assumptions in thismodel. First, we consider only diffusion of single Pt atomsvia direct hopping mechanisms. DFT calculations indicatethat these are preferred over concerted substitutionmechanisms.20 Second, we do not allow step edge atomsto detach from the step, restricting our model to so-calledperiphery diffusion.18 DFT calculations indicate that theenergy barrier for a step edge atom to move from a stepto a terrace on these surfaces is much larger than diffusionalong the step.19 STM experiments also indicate thatperipherydiffusion is thedominantmechanism forPtstepson a range of relevant time scales with temperatures ashigh as 800 K.21 Third, we do not allow atoms to diffusefrom 7- or 8-fold-coordinated sites in the step. Finally, therate of each diffusion process is given by k ) ν exp(-Eb/
(19) Asthagiri, A.; Feibelman, P. J.; Sholl, D. S. Top. Catal. 2002, 18,193-200.
(20) Feibelman, P. J. Phys. Rev. B 1999, 60, 4972-4981.(21) Giesen, M.; IckingKonert, G. S.; Stapel, D.; Ibach, H. Surf. Sci.
1996, 366, 229-238.
Figure 1. Ball model of (a) nonroughened and (b) roughened chiral fcc(643) surface. The surface shown in (b) is produced fromthat in (a) by thermal roughening for 60 min at 500 K. The step-edges are highlighted.
3738 Langmuir, Vol. 18, No. 9, 2002 Power et al.
kBT), where the preexponential factor is fixed to be ν )1013 s-1 for all processes and Eb is the process-dependentenergy barrier.
We used an extended bond counting scheme fitted tothe known barriers to predict the barrier to any diffusionmove along the step.19 The scheme includes 13 parametersthat are determined using a least-squares fit to the 18independent barriers known from DFT. One usefulparameter for assessing the accuracy of our LG model isthe effective energy barrier associated with step roughen-ing, Eeff.19,21,22 This barrier is a function of several singleatom diffusion barriers. For our purposes, we note thatEeff can be determined directly from the subset of diffusionbarriers known from LDA-DFT: Eeff
DFT ) 0.61 (0.52) eVfor B (A) steps.19 In our earlier work we equally weightedall the known DFT barriers when fitting the parametersof our LG model.19 This nonweighted approach yields Eeff
LG
) 0.56 (0.57) eV for B (A) steps. Although qualitativelycorrect, these results fail to capture the energetic differ-ences between roughening of A and B steps. To addressthis issue, we have reparametrized our LG model byweighting the known diffusion barrier from a 6-fold-coordinated kink site to a 5-fold-coordinated straight stepsite as five times more important than the other knownbarriers. This revised LG model gives Eeff
LG ) 0.61 (0.53)eV, in excellent agreement with the DFT results. The rmsdeviation between the barriers predicted by this LG modeland the 18 known DFT barriers is 0.047 eV. For com-pleteness, the parameters and definition of our LG modelare given in Appendix A.
Our LG model gives a self-contained description of Ptstep roughening. The dynamics of this model can besimulated using kinetic Monte Carlo (KMC). We use theN-fold way algorithm19,23 to select events and incrementtime. This algorithm is ideal for systems with a wide rangeof time scales and allows us to follow roughening onexperimentally relevant time scales of minutes to hours.We show a typical result from our simulations in Figure1, which shows the initial and final step structure of astep that was allowed to roughen for 60 min at T ) 500K. The initial step was chosen to have the same structureas the steps on a chiral Pt(643) surface.7,8 The isolatedstep in our simulation has been mapped into Figure 1using periodic boundary conditions for illustrative pur-poses. The step shows considerable rearrangement afterroughening. While there was only one type of kink in thenonroughened surface, after roughening there are adistribution of kinks of various structures. We haveemphasized in our earlier work that despite the disruptionof the step structure that occurs due to thermal roughen-ing, roughened steps that began as chiral surfaces arestill chiral.8,19 One way to see this important fact is thatin Figure 1b the kinks always move “up” the page andnever “down” the page. The appearance of just one“direction” of step kinks is a natural feature of ideal chiralmetal surfaces, and this property is retained on roughenedsurfaces because these surfaces retain the same averagestep direction as the original ideal surface from whichthey evolve. The net chirality of roughened surfaces suchas the one in Figure 1b will also become apparent whenwe discuss adsorption of chiral molecules on these stepsin the next section.
The distribution of step lengths can be examined bydefining PA(L) [PB(L)] to be the probability that a randomlychosen A [B] step has a length L (in lattice units). This
is a measure of the local step structure. We find that thesedistributions equilibrate in experimentally relevant timescales of less than 5 min at temperatures of 500 K orabove for all the Pt surfaces we discuss in this paper8,19
and are only very weakly dependent on the rougheningtemperature. We have also determined that the distribu-tion of step lengths that appear on roughened surfacesare uncorrelated. That is, the appearance of one type ofstep length does not influence the identity of the adjacentstep lengths.8 We also observe that the time scale forsignificant rearrangement of the surface becomes ex-tremely long (.1 day) at room temperature and below.Thus, to model real surfaces that are used in experimentsat room temperature and below, we can generate aroughened structure using a simulation at 500 K or aboveto generate a structure that would arise during thermalannealing and then hold the surface structure fixed whenwe consider the surface’s low-temperature properties. Thestep length distribution, PA(L) and PB(L), for each stepstructure discussed in this paper are averaged over 20simulations, each containing step lengths of 2000 atomsand roughened at T ) 500 K for t ) 1 h. Once we havemeasured PA(L) and PB(L) for a particular step structure,we can generate roughened steps of arbitrary length byalternately choosing step lengths at random from PA(L)and PB(L). This procedure is valid because, as noted above,our detailed simulations show that the identity of adjacentstep lengths on roughened steps is uncorrelated. All ofthe roughened structures used in the remainder of thispaper were generated using this method.
It is interesting to note that experimental studies ofnaturally chiral surfaces using LEED have typically shownsharp diffraction patterns.7,10,15,16 Although it is temptingto conclude from these sharp patterns that real chiralsurfaces exhibit very little disorder, there is considerableevidence from theoretical studies of LEED that veryirregular arrays of steps can result in nearly ideal LEEDpatterns.24,25 Thus, the experimental data currently avail-able on the structure of chiral metal surfaces are consistentwith the surfaces having disordered structures such asthe one shown in Figure 1b.
III. Enantiospecific Adsorption in the DiluteCoverage Limit
Having described our model for thermally roughenedchiral Pt surfaces, we now move to describing molecularadsorption on these surfaces. We have modeled adsorptionof two chiral hydrocarbons, (R/S)-trans-1,2-dimethylcy-clopropane (DMCPr) and (R/S)-trans-1,2-dimethylcyclo-hexane (DMCH), on roughened surfaces generated fromfive chiral Miller index surfaces: Pt(531)S; Pt(643)S; Pt-(653)S; Pt(854)S; Pt(874)S. These surfaces have been chosensince they contain members of the three fundamental kinkstructures present on surfaces vicinal to (111).8 For adetailed description of chiral surface structure and theR/S notation used to distinguish between enantiomorphicsurface pairs, the reader is referred to our recent reviewarticle.8 In this paper we approximate the periodic terracestructure of these Miller index surfaces by surfaces withinfinite terrace width, i.e., surfaces containing a singlestep-edge. The nonroughened surfaces have periodic kinksof fixed structure along the step-edge, whereas theroughened surfaces contain a distribution of kinks gener-ated as described in section II.
In this section we study adsorption in the dilute limit,i.e., where a single adsorbate molecule is adsorbed on the
(22) Natori, A.; Godby, R. W. Phys. Rev. B 1993, 47, 15816-15822.(23) Bortz, A. B.; Kalos, M. H.; Lebowitz, J. L. J. Comput. Phys.
1975, 17, 10-18.
(24) Rhead, G. E. Surf. Sci. 1977, 68, 20.(25) Ertl, G.; Kuppers, J. Low Energy Electrons and Surface
Chemistry, 2nd ed.; VCH Publishers: Deerfield Beach, FL, 1985.
Atomically Detailed Models of Thermal Roughening Langmuir, Vol. 18, No. 9, 2002 3739
surface. Following our previous work, we have modeledthe interaction of the adsorbate atoms with the surfacePt atoms using a potential devised by Weaver andMadix.8,26 Briefly, the adsorbate hydrocarbon is modeledas a set of united atoms that interact with each Pt atomvia a Morse potential. The potential was parametrized tofit scattering data for neopentane on Pt(111).26 Thispotentialaccuratelypredicts theobservedbindingenergiesfor isobutane, n-butane, and neopentane on Pt(111).Within each molecule, bond bending, bond stretching,torsion, and antiinversion potentials are used as describedin our earlier work.8,14
In addition to thermal roughening, metal surfacestructures deviate from ideality by virtue of the localrelaxation of surface atoms required to balance surfaceforces. The impact of this phenomenon on enantiospecificadsorption has been studied by us previously.14 In thatwork the structure of relaxed surfaces had been deter-mined using DFT. It was found that chiral Pt surfacesexhibited greater relaxation than atomically flat surfacessuch as Pt(111). The amount of relaxation varied alongthe kinked step edge with the greatest degree of relaxationbeing exhibited by the least coordinated atoms. Althoughrelaxation does not result in a gross distortion of surfacestructure, adsorption enantiospecificity is altered whenit is taken into account. In the majority of cases we studied,using a relaxed surface structure slightly reduced themagnitude of enantiospecificity but did not change themain qualitative features of these systems.14 It is im-practical to apply DFT to nonperiodic systems such asthose necessary to describe roughened surfaces. Thismeans that quantitatively determining the fully relaxedgeometry of surfaces such as those in Figure 1b is notcurrently possible. As such, all of the results in this paper,both for roughened and nonroughened surfaces, cor-respond to surfaces where all atoms are in the positionsobtained from their geometry in the bulk solid. Neverthe-less, the known changes in enantiospecificity due torelaxation on periodic surfaces14 strongly suggest that theconclusions we draw in this paper are also applicable tofully relaxed roughened surfaces.
A useful measure of the enantiospecificity of adsorptionis the difference in binding energies between enantiomerson a chiral surface. To this end, we define ∆U ) ⟨UR⟩ -⟨US⟩, where ⟨‚‚‚⟩ indicates a canonical average at tem-perature T and UR and US are the potential energy of theR and S enantiomers, respectively, on the surface.8,9,14,17
Initially, we examine the enantiomeric energy differenceat 0 K, denoted ∆U0. Since physisorbed species are weaklybound to the surface, they can adopt many adsorptiongeometries. Each local minimum of the potential energysurface can therefore be regarded as a distinct adsorptionstate. Our method for identifying adsorption states isdescribed elsewhere.8,14 Briefly, we sample the full po-tential energy surface of the adsorbed molecule usingMonte Carlo sampling and then minimize the energy ofmany configurations to locate local energy minima. On achiral surface, the kink provides greatest coordination toan adsorbate. Therefore, the global minimum energy stateof physisorbed species is typically located at a kink site.The global minimum energy state for an adsorbed speciesin the dilute limit will be the state that it occupies at T) 0 K. Therefore, ∆U0 ) Umin
R - UminS , where Umin is the
energy of the global minimum energy state for theadsorbate being considered.
In Table 1 we present ∆U0 for DMCPr and DMCH onall five (single-step) roughened and nonroughened sur-faces. We note that energy differences of a fraction of akcal/mol are known to be sufficient to allow effective
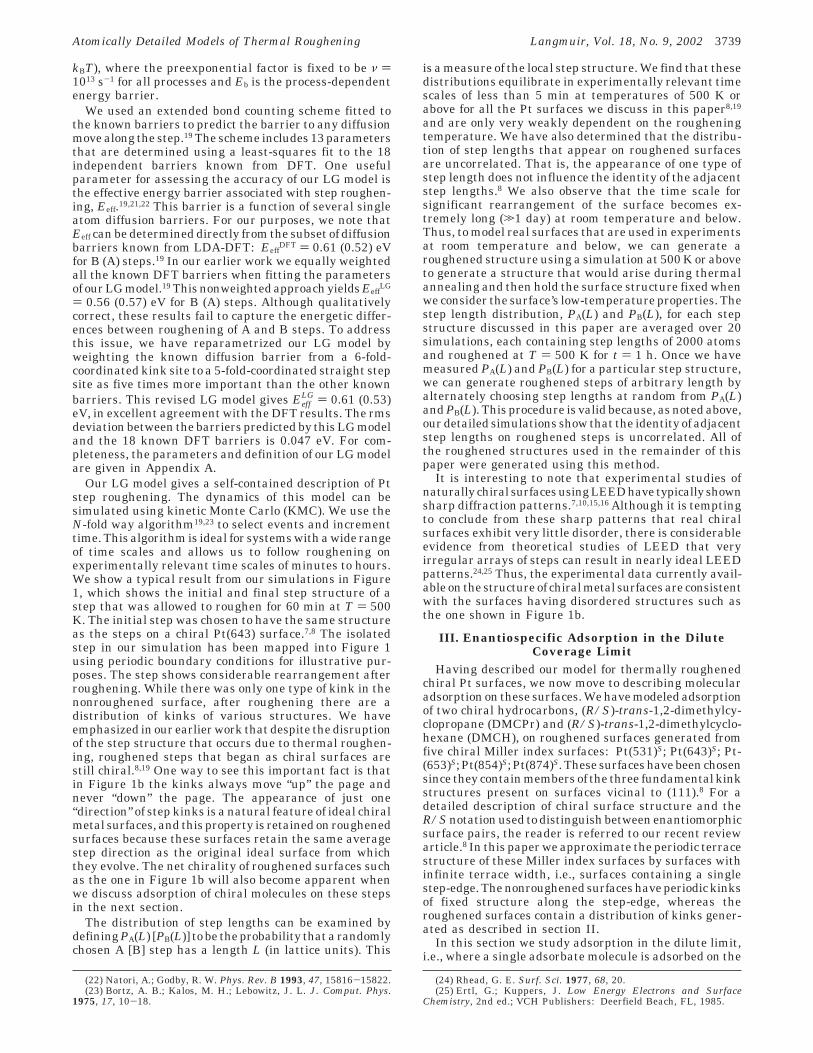
separation of enantiomers in chromatographic applica-tions.8,27 For each adsorbate, ∆U0 varies between thedifferent nonroughened surfaces, but ∆U0 is identical onevery roughened surface. That is, with respect to ∆U0,roughening renders the surfaces indistinguishable. Thisobservation can be understood as follows. Kinks arestructures that are present where two step edges meet.On all nonroughened Miller index surfaces of fcc metals,at least one step-edge forming a kink is one atom inlength.8,19 Thermal roughening allows rearrangement ofatoms on a surface, leading to structures that are notfound on nonroughened surfaces. Specifically, roughenedsurfaces contain kinks where both step edges can be morethan one atom in length. We call these structures non-Miller index kinks (NM kinks).8,19 An example of a NMkink is shown in Figure 2. NM kinks offer physisorbedmolecules a means to increase their coordination to surfaceatoms relative to standard Miller index kinks. As anexample, the global minimum energy state for R-DMCPris shown on an NM kink and on the nonroughened infiniteterrace analogue of Pt(643)S in Figure 2. In this example,the adsorbate is more firmly bound to the NM structureby 0.91 kcal/mol. Examples of NM kinks can also be seenin Figure 1b.
The lowest energy state of an adsorbate within an NMkink is typically positioned close to where the step edgesmeet. Thus, once the steps defining a NM kink are longerthan a critical size, they make no further contribution toan adsorbate’s binding energy. All NM kinks that aregreater in size than the critical size will therefore yieldthe same minimum energy state at the kink center.Furthermore, these NM kinks provide the greatest pos-sible coordination and therefore the tightest possiblebinding for phyisorbed species. Consequently, the globalminimum energy state for a physisorbed molecule on aroughened surface is typically located at a NM kink thatis larger than the critical size.
The fact that ∆U0rough is independent of the initial
surface structure can now be rationalized by noting thatNM kinks are structurally independent of the roughenedsurface’s initial structure. For example, the NM kinkshown in Figure 2 is an S-NM kink and was found on aroughened Pt(643)S surface. However it can also be foundon roughened Pt(854)S or any S-oriented roughenedsurface vicinal to (111). A complete description of whichMiller index surfaces fall into this category can be foundin ref 8. Within this class of surfaces, the ideal (i.e.nonroughened) surface structure merely dictates therelative abundance of different kink structures on theroughened surface. Thus, the global minimum energy statefor a physisorbed molecule will be identical on anyS-oriented roughened surface vicinal to (111). Since thesame set of kink structures (with opposite handedness)
(26) Weaver, J. F.; Madix, R. J. J. Chem. Phys. 1999, 110, 10585-10598.
(27) Lipkowitz, K. B.; Coner, R.; Peterson, M. A.; Morreale, A.;Shackelford, J. J. Org. Chem. 1998, 63, 732-745.
Table 1. ∆U0 for DMCH and DMCPr on Five Roughenedand Nonroughened Surfacesa
surf type Pt(531)S Pt(643)S Pt(653)S Pt(854)S Pt(874)S
DMCPrnonroughened -0.66 -0.45 -0.85 -0.23 -0.72roughened -0.76 -0.76 -0.76 -0.76 -0.76
DMCHnonroughened 0.02 0.03 0.38 0.02 0.36roughened 0.03 0.03 0.03 0.03 0.03
a Energy is shown in kcal/mol.
3740 Langmuir, Vol. 18, No. 9, 2002 Power et al.

will appear on R-oriented roughened surfaces, ∆U0rough
will be the same for all surfaces in this class and oppositein sign to the S-oriented roughened surfaces.
Our discussion to this point has focused on enantiospe-cific adsorption in the dilute limit at T ) 0 K. We nowconsider higher temperatures, where the global minimumenergy state is no longer the only relevant adsorption state.To do so, we apply a harmonic approximation to thepotential energy surface.28 This approximation expressesthe potential energy surface as a set of harmonic oscillatorscentered at each local minimum of the full potential energysurface. The harmonic approximation is most accurate atlow T. With this approximation,
where Ei (ni) is the binding energy (relative degeneracy)of state i and there are Nstates distinct adsorption states.This expression assumes that the product of normal-modefrequencies for each state is equal. We have performedcalculations in which actual normal-mode frequencies areincluded and repeated them when their product is equal;the value of ⟨U⟩ calculated for each case is indistinguish-able. Once the adsorption energies and their relativedegeneracies {Ei,ni} are identified, eq 1 gives ⟨U⟩ as afunction of T. Our goal, therefore, for modeling phys-isorption on roughened surfaces is to find {Ei,ni} for eachsystem of interest. In previous work,8,14 we have performedextensive Monte Carlo (MC) simulations of the adsorptionof DMCH and DMCPr on a series of Miller index surfaces,specifically, Pt(531)S, Pt(643)S, Pt(854)S, and Pt(874)S. Inaddition, we have performed analogous simulations of Pt-(653)S and achiral Pt(322) and Pt(332). The latter twosurfaces are vicinal to Pt(111) with straight A-type andB-type step edges, respectively. This set of seven surfacesspans all fundamental structures present on ideal surfacesvicinal to (111).8 From these MC studies, we have isolatedthe individual adsorption states on each surface for each
adsorbate we have simulated.8 The adsorption stateslocated on this set of (ideal) Miller index surfaces formsthe basis of our calculations to determine {Ei,ni} onroughened surfaces. For each adsorbate on each roughenedsurface we considered we used the following scheme:
(1) We construct a roughened surface step of fixed lengthas described in section II. Every atom along the resultingstep edge is considered to be an independent site.
(2) The three lowest energy states from each nonrough-ened Miller index surface listed above (a total of 21 states)are mapped into the coordinate system of the roughenedsurface.
(3) The first of the 21 mapped states is placed at a siteat one end of the roughened step edge, and its energy isminimized. If the minimized structure is not located toofar away (0.75 of a lattice unit or more) from the startingposition, the energy of the minimized structure is recordedand associated with that site; otherwise the minimum isrejected and no record is made.
(4) The unminimized mapped state is moved to the nextsite along the roughened step edge, and the sameminimization procedure is carried out.
(5) Step 4 is repeated along the step-edge to the end.Steps 3-5 are repeated with the rest of the 21 mapped
states. For every state at each site, provided that itsminimum state is acceptable, the minimum energy iscompared with the existing states associated with thatsite. If the energy is new, it is recorded as a new stateassociated with that site.
For all the results below, we performed simulations onfive realizations of each roughened surface with 2000atoms along the step edge. Each adsorption site j alongthe (total) roughened step-edge is associated with anumber of accessible energy states, qj
tot, with correspond-ing energies {Ej
q} (q ) 1, 2, ..., qjtot). This information
proves useful for studying high-coverage effects. Bycompiling these data, we identify all distinct adsorptionenergies and their relative degeneracies, {Ei,ni}, alongeach step-edge. This procedure does not include anyadsorption on the terrace. Adsorption on the terrace isconsiderably less energetically favorable than adsorptionagainst the step-edge on account of the terrace’s lowercoordination.
Before returning to the effects of surface roughening,we can use the technique described above to examine thedifferences between ideal Miller index chiral surfaces and
(28) Fowles, G. R. Analytical mechanics, 4th ed.; Saunders CollegePub.: Philadelphia, PA, 1986.
Figure 2. R-DMCPr adsorbed in (a) a Miller index (ideal) kink and in (b) a non-Miller index kink. The molecule is more firmlybound to the kink in (b) than in (a) by 0.91 kcal/mol. The step-edges are highlighted with the A step (B step) shown as a dashed(solid) line.
⟨U⟩ )
∑i
Nstates
niEi exp(-Ei/kT)
∑i
Nstates
ni exp(-Ei/kT)
(1)
Atomically Detailed Models of Thermal Roughening Langmuir, Vol. 18, No. 9, 2002 3741
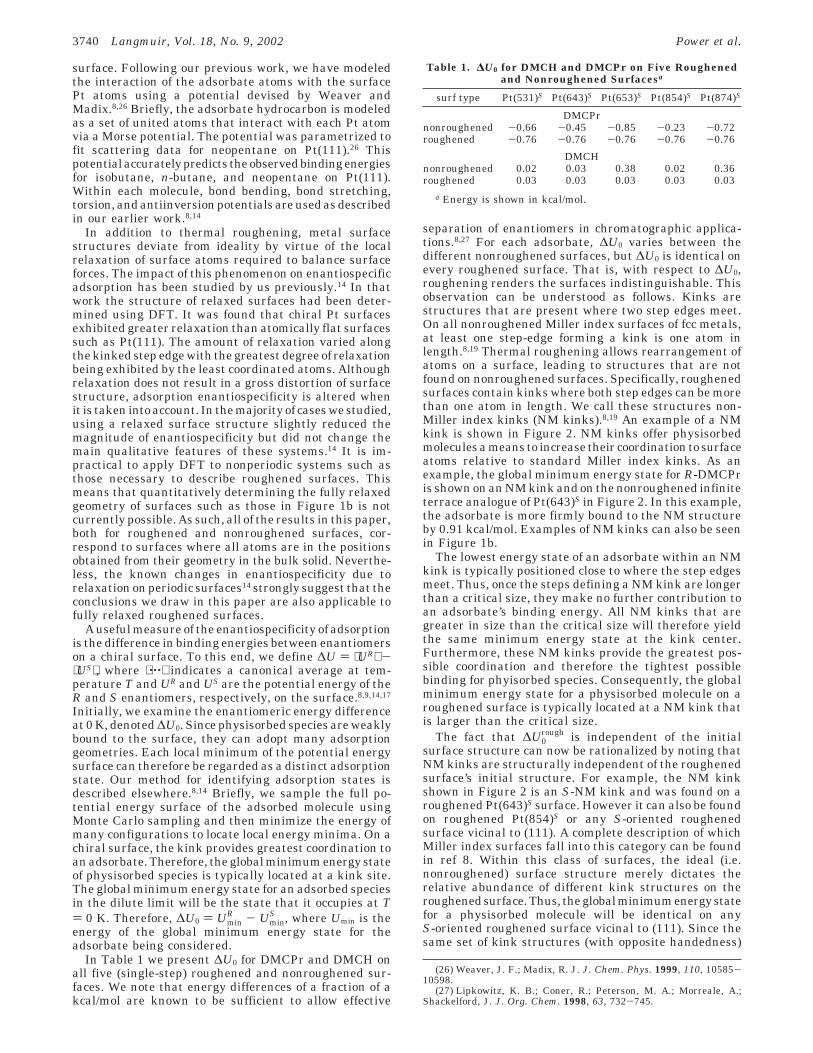
surfaces with just one step surrounded by extremely wideterraces. In Figure 3, ∆U is shown for DMCH and DMCPradsorbed on Miller index surfaces and on surfaces withthe same step structure but infinitely wide terraces. Ineach case, ∆U was calculated using eq 1 after finding{Ei,ni}. When the adsorption energy on Miller indexsurfaces is dominated by interactions that do not spanmore than one terrace, it is reasonable to expect that thefinite and infinite terrace structures yield similar results.From this figure, it is clear that, for Pt(531)S, the infiniteterrace approximation to the true finite terrace structureis poor (see Figure 3a). This is not surprising since thefcc(531) surface has practically no terrace.8,16 However,the comparison between the finite and infinite terracedata for the Pt(874)S structures is good (see Figure 3b).The terraces in the Miller index Pt(874)S surface aresufficiently wide for interterrace adsorption interactionsto be mild. We have observed similar results with theother chiral surfaces for the adsorbates we have examined;with the exception of Pt(531)S, the representation ofsurface structures as single steps surrounded by extremelylarge (111) terraces captures the adsorption properties ofthe Miller index surfaces well. For this reason, we onlypresent results from steps with infinitely wide terracesbelow. For convenience we will refer to these steps usingtheir Miller index analogue in the remainder of this paper.Although this notation is convenient, it is more accurateto consider each surface used below as representing afamily of stepped surfaces with identical step structuresand variable terrace widths with the caveat that theterrace widths are larger than the adsorbates we consider.
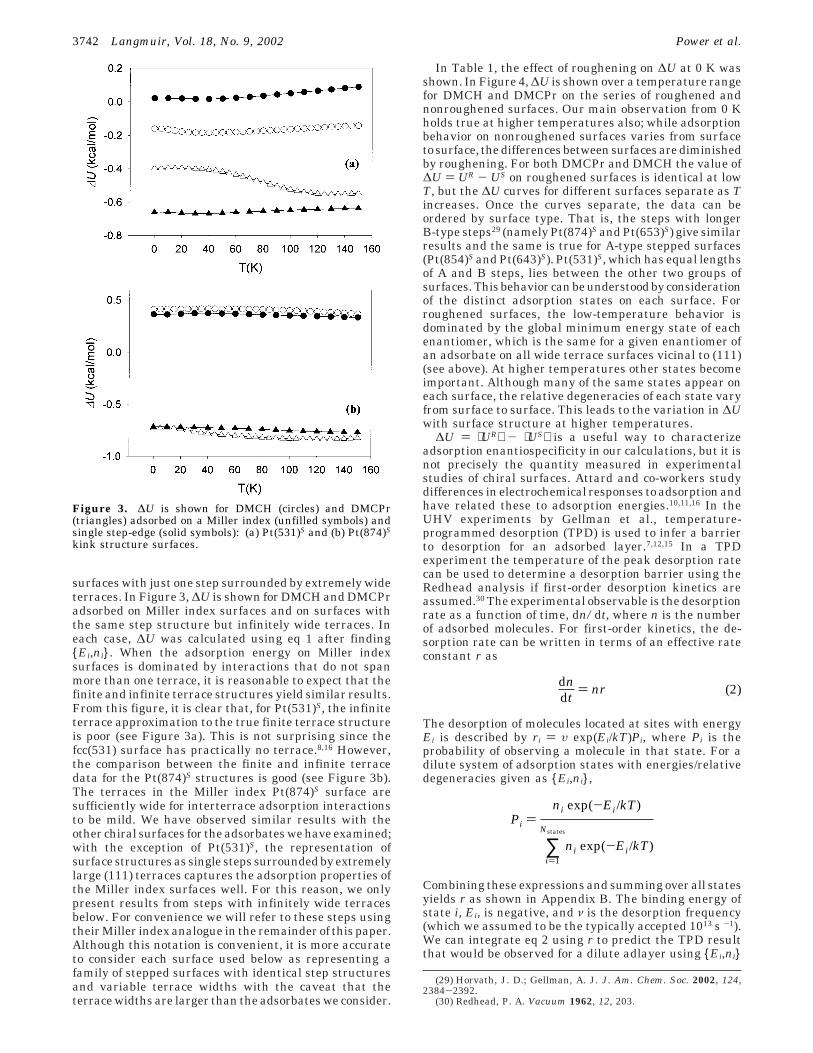
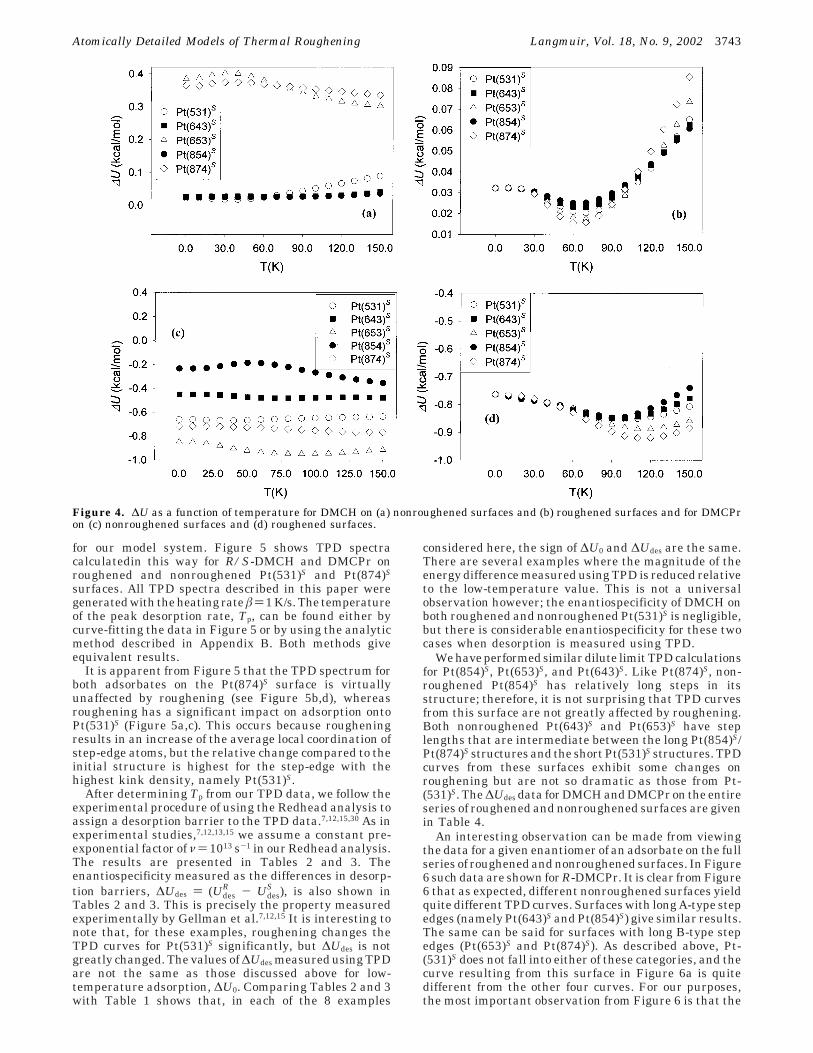
In Table 1, the effect of roughening on ∆U at 0 K wasshown. In Figure 4, ∆U is shown over a temperature rangefor DMCH and DMCPr on the series of roughened andnonroughened surfaces. Our main observation from 0 Kholds true at higher temperatures also; while adsorptionbehavior on nonroughened surfaces varies from surfaceto surface, the differences between surfaces are diminishedby roughening. For both DMCPr and DMCH the value of∆U ) UR - US on roughened surfaces is identical at lowT, but the ∆U curves for different surfaces separate as Tincreases. Once the curves separate, the data can beordered by surface type. That is, the steps with longerB-type steps29 (namely Pt(874)S and Pt(653)S) give similarresults and the same is true for A-type stepped surfaces(Pt(854)S and Pt(643)S). Pt(531)S, which has equal lengthsof A and B steps, lies between the other two groups ofsurfaces. This behavior can be understood by considerationof the distinct adsorption states on each surface. Forroughened surfaces, the low-temperature behavior isdominated by the global minimum energy state of eachenantiomer, which is the same for a given enantiomer ofan adsorbate on all wide terrace surfaces vicinal to (111)(see above). At higher temperatures other states becomeimportant. Although many of the same states appear oneach surface, the relative degeneracies of each state varyfrom surface to surface. This leads to the variation in ∆Uwith surface structure at higher temperatures.
∆U ) ⟨UR⟩ - ⟨US⟩ is a useful way to characterizeadsorption enantiospecificity in our calculations, but it isnot precisely the quantity measured in experimentalstudies of chiral surfaces. Attard and co-workers studydifferences in electrochemical responses to adsorption andhave related these to adsorption energies.10,11,16 In theUHV experiments by Gellman et al., temperature-programmed desorption (TPD) is used to infer a barrierto desorption for an adsorbed layer.7,12,15 In a TPDexperiment the temperature of the peak desorption ratecan be used to determine a desorption barrier using theRedhead analysis if first-order desorption kinetics areassumed.30 The experimental observable is the desorptionrate as a function of time, dn/dt, where n is the numberof adsorbed molecules. For first-order kinetics, the de-sorption rate can be written in terms of an effective rateconstant r as
The desorption of molecules located at sites with energyEi is described by ri ) υ exp(Ei/kT)Pi, where Pi is theprobability of observing a molecule in that state. For adilute system of adsorption states with energies/relativedegeneracies given as {Ei,ni},
Combining these expressions and summing over all statesyields r as shown in Appendix B. The binding energy ofstate i, Ei, is negative, and ν is the desorption frequency(which we assumed to be the typically accepted 1013 s -1).We can integrate eq 2 using r to predict the TPD resultthat would be observed for a dilute adlayer using {Ei,ni}
(29) Horvath, J. D.; Gellman, A. J. J. Am. Chem. Soc. 2002, 124,2384-2392.
(30) Redhead, P. A. Vacuum 1962, 12, 203.
Figure 3. ∆U is shown for DMCH (circles) and DMCPr(triangles) adsorbed on a Miller index (unfilled symbols) andsingle step-edge (solid symbols): (a) Pt(531)S and (b) Pt(874)S
kink structure surfaces.
dndt
) nr (2)
Pi )ni exp(-Ei/kT)
∑i)1
Nstates
ni exp(-Ei/kT)
3742 Langmuir, Vol. 18, No. 9, 2002 Power et al.
for our model system. Figure 5 shows TPD spectracalculatedin this way for R/S-DMCH and DMCPr onroughened and nonroughened Pt(531)S and Pt(874)S
surfaces. All TPD spectra described in this paper weregenerated with the heating rate â ) 1 K/s. The temperatureof the peak desorption rate, Tp, can be found either bycurve-fitting the data in Figure 5 or by using the analyticmethod described in Appendix B. Both methods giveequivalent results.
It is apparent from Figure 5 that the TPD spectrum forboth adsorbates on the Pt(874)S surface is virtuallyunaffected by roughening (see Figure 5b,d), whereasroughening has a significant impact on adsorption ontoPt(531)S (Figure 5a,c). This occurs because rougheningresults in an increase of the average local coordination ofstep-edge atoms, but the relative change compared to theinitial structure is highest for the step-edge with thehighest kink density, namely Pt(531)S.
After determining Tp from our TPD data, we follow theexperimental procedure of using the Redhead analysis toassign a desorption barrier to the TPD data.7,12,15,30 As inexperimental studies,7,12,13,15 we assume a constant pre-exponential factor of ν ) 1013 s-1 in our Redhead analysis.The results are presented in Tables 2 and 3. Theenantiospecificity measured as the differences in desorp-tion barriers, ∆Udes ) (Udes
R - UdesS ), is also shown in
Tables 2 and 3. This is precisely the property measuredexperimentally by Gellman et al.7,12,15 It is interesting tonote that, for these examples, roughening changes theTPD curves for Pt(531)S significantly, but ∆Udes is notgreatly changed. The values of ∆Udes measured using TPDare not the same as those discussed above for low-temperature adsorption, ∆U0. Comparing Tables 2 and 3with Table 1 shows that, in each of the 8 examples
considered here, the sign of ∆U0 and ∆Udes are the same.There are several examples where the magnitude of theenergy difference measured using TPD is reduced relativeto the low-temperature value. This is not a universalobservation however; the enantiospecificity of DMCH onboth roughened and nonroughened Pt(531)S is negligible,but there is considerable enantiospecificity for these twocases when desorption is measured using TPD.
We have performed similar dilute limit TPD calculationsfor Pt(854)S, Pt(653)S, and Pt(643)S. Like Pt(874)S, non-roughened Pt(854)S has relatively long steps in itsstructure; therefore, it is not surprising that TPD curvesfrom this surface are not greatly affected by roughening.Both nonroughened Pt(643)S and Pt(653)S have steplengths that are intermediate between the long Pt(854)S/Pt(874)S structures and the short Pt(531)S structures. TPDcurves from these surfaces exhibit some changes onroughening but are not so dramatic as those from Pt-(531)S. The ∆Udes data for DMCH and DMCPr on the entireseries of roughened and nonroughened surfaces are givenin Table 4.
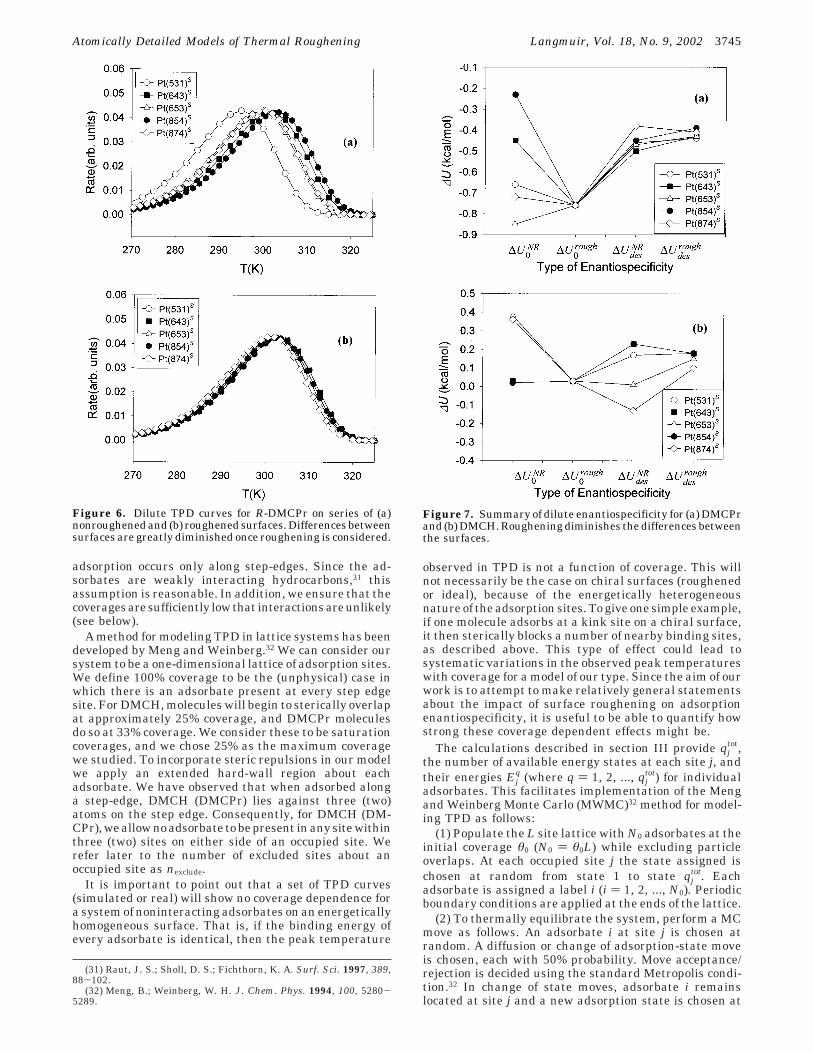
An interesting observation can be made from viewingthe data for a given enantiomer of an adsorbate on the fullseries of roughened and nonroughened surfaces. In Figure6 such data are shown for R-DMCPr. It is clear from Figure6 that as expected, different nonroughened surfaces yieldquite different TPD curves. Surfaces with long A-type stepedges (namely Pt(643)S and Pt(854)S) give similar results.The same can be said for surfaces with long B-type stepedges (Pt(653)S and Pt(874)S). As described above, Pt-(531)S does not fall into either of these categories, and thecurve resulting from this surface in Figure 6a is quitedifferent from the other four curves. For our purposes,the most important observation from Figure 6 is that the
Figure 4. ∆U as a function of temperature for DMCH on (a) nonroughened surfaces and (b) roughened surfaces and for DMCPron (c) nonroughened surfaces and (d) roughened surfaces.
Atomically Detailed Models of Thermal Roughening Langmuir, Vol. 18, No. 9, 2002 3743

differences between the curves are greatly diminished forroughened surfaces. This observation is true for bothenantiomers of each adsorbate that we have examined.
Tables 1 and 4 summarize our dilute limit data. Theyshow the dilute coverage limit enantiospecificity as both
the 0 K difference in binding energy, ∆U0, and thedifference indesorptionbarriersassigned fromTPD, ∆Udes,for DMCH and DMCPr on the series of roughened andnonroughened surfaces. The same data are shown pic-torially in Figure 7. In the dilute limit, whether enan-tiospecificity is measured as a difference in bindingenergies or as a difference in TPD desorption barriers,roughening effectively diminishes the differences betweenthe surfaces vicinal to (111). This implies that the rangeof surfaces that appear to be available for enantiodis-crimination isgreatly reduced.Thus, if agivenwide terracesurface vicinal to (111) is not found to discriminate betweenenantiomers of a particular adsorbate, then it is not likelythat any wide terrace surface vicinal to (111) will do soeither.
IV. Enantiospecific Adsorption at High CoverageThe discussion above has addressed adsorption in the
limit of dilute coverage only. In this section we examineenantiospecific TPD at higher coverages with the as-sumption that the adsorbates are noninteracting and
Figure 5. Dilute limit TPD spectra for (a) DMCH on Pt(531)S, (b) DMCH on Pt(874)S, (c) DMCPr on Pt(531)S, and (d) DMCPron Pt(874)S. Curves for nonroughened (roughened) surfaces are shown with filled (unfilled) symbols, and circles (triangles) representthe R (S) enantiomer.
Table 2. Peak Temperatures and Desorption Barriers forR/S-DMCH and R/S-DMCPr on Roughened and
Nonroughened Pt(874)S in the Dilute Limita
DMCPr DMCH
Tp (K) Udes (kcal/mol) Tp (K) Udes (kcal/mol)
R nonroughened 299.93 -19.16 446.36 -28.86R roughened 301.18 -19.24 444.66 -28.74S nonroughened 294.09 -18.78 444.39 -28.73S roughened 294.92 -18.83 446.22 -28.85∆Udes
nonroughened -0.38 -0.13∆Udes
roughened -0.41 0.11a Energies are negative for consistency with energy datum as
gas-phase minimum energy. Enantiospecificity is shown also.
Table 3. Peak Temperatures and Desorption Barriers forR/S-DMCH and R/S-DMCPr on Roughened and
Nonroughened Pt(531)S in the Dilute Limita
DMCPr DMCH
Tp (K) Udes (kcal/mol) Tp (K) Udes (kcal/mol)
R nonroughened 294.94 -18.83 437.52 -28.27R roughened 303.12 -19.37 448.45 -29.00S nonroughened 287.97 -18.37 440.14 -28.44S roughened 296.44 -18.93 451.11 -29.17∆Udes
nonroughened -0.46 -0.17∆Udes
roughened -0.44 0.18a Energies are negative for consistency with energy datum as
gas-phase minimum energy. Enantiospecificity is shown also.
Table 4. Dilute Limit Enantiospecificity, ∆U, for DMCPrand DMCH on the Series of Roughened and
Nonroughened Surfaces As Determined from theSimulated TPD Spectrum
∆U Pt(531)S Pt(643)S Pt(653)S Pt(854)S Pt(874)S
DMCPrroughened -0.44 -0.43 -0.43 -0.39 -0.41nonroughened -0.46 -0.50 -0.47 -0.45 -0.38
DMCHroughened 0.18 0.18 0.15 0.18 0.11nonroughened 0.17 0.23 0.01 0.23 -0.13
3744 Langmuir, Vol. 18, No. 9, 2002 Power et al.
adsorption occurs only along step-edges. Since the ad-sorbates are weakly interacting hydrocarbons,31 thisassumption is reasonable. In addition, we ensure that thecoveragesaresufficiently lowthat interactionsareunlikely(see below).
A method for modeling TPD in lattice systems has beendeveloped by Meng and Weinberg.32 We can consider oursystem to be a one-dimensional lattice of adsorption sites.We define 100% coverage to be the (unphysical) case inwhich there is an adsorbate present at every step edgesite. For DMCH, molecules will begin to sterically overlapat approximately 25% coverage, and DMCPr moleculesdo so at 33% coverage. We consider these to be saturationcoverages, and we chose 25% as the maximum coveragewe studied. To incorporate steric repulsions in our modelwe apply an extended hard-wall region about eachadsorbate. We have observed that when adsorbed alonga step-edge, DMCH (DMCPr) lies against three (two)atoms on the step edge. Consequently, for DMCH (DM-CPr), we allow no adsorbate to be present in any site withinthree (two) sites on either side of an occupied site. Werefer later to the number of excluded sites about anoccupied site as nexclude.
It is important to point out that a set of TPD curves(simulated or real) will show no coverage dependence fora system of noninteracting adsorbates on an energeticallyhomogeneous surface. That is, if the binding energy ofevery adsorbate is identical, then the peak temperature
observed in TPD is not a function of coverage. This willnot necessarily be the case on chiral surfaces (roughenedor ideal), because of the energetically heterogeneousnature of the adsorption sites. To give one simple example,if one molecule adsorbs at a kink site on a chiral surface,it then sterically blocks a number of nearby binding sites,as described above. This type of effect could lead tosystematic variations in the observed peak temperatureswith coverage for a model of our type. Since the aim of ourwork is to attempt to make relatively general statementsabout the impact of surface roughening on adsorptionenantiospecificity, it is useful to be able to quantify howstrong these coverage dependent effects might be.
The calculations described in section III provide qjtot,
the number of available energy states at each site j, andtheir energies Ej
q (where q ) 1, 2, ..., qjtot) for individual
adsorbates. This facilitates implementation of the Mengand Weinberg Monte Carlo (MWMC)32 method for model-ing TPD as follows:
(1) Populate the L site lattice with N0 adsorbates at theinitial coverage θ0 (N0 ) θ0L) while excluding particleoverlaps. At each occupied site j the state assigned ischosen at random from state 1 to state qj
tot. Eachadsorbate is assigned a label i (i ) 1, 2, ..., N0). Periodicboundary conditions are applied at the ends of the lattice.
(2) To thermally equilibrate the system, perform a MCmove as follows. An adsorbate i at site j is chosen atrandom. A diffusion or change of adsorption-state moveis chosen, each with 50% probability. Move acceptance/rejection is decided using the standard Metropolis condi-tion.32 In change of state moves, adsorbate i remainslocated at site j and a new adsorption state is chosen at
(31) Raut, J. S.; Sholl, D. S.; Fichthorn, K. A. Surf. Sci. 1997, 389,88-102.
(32) Meng, B.; Weinberg, W. H. J. Chem. Phys. 1994, 100, 5280-5289.
Figure 6. Dilute TPD curves for R-DMCPr on series of (a)nonroughened and (b) roughened surfaces. Differences betweensurfaces are greatly diminished once roughening is considered.
Figure 7. Summary of dilute enantiospecificity for (a) DMCPrand (b) DMCH. Roughening diminishes the differences betweenthe surfaces.
Atomically Detailed Models of Thermal Roughening Langmuir, Vol. 18, No. 9, 2002 3745
random from 1 to qjtot. In diffusion moves, one of the sites
on either side of the adsorption site j is chosen with 50%probability as a target site for diffusion. If it is possibleto place an adsorbate in the target state without overlap-ping an existing adsorbate or the sites blocked by stericrepulsions, and then the MC trial state becomes adsorbatei located at the target site with the adsorption stateassigned at random from 1 to qk
tot. If the diffusion attemptis infeasible due to steric overlaps, the move is abandonedand the move is restarted with another randomly chosenadsorbate.
(3) Repeat step 2 until thermodynamic equilibrium isachieved. We have found that 100 000 single moleculeMC moves are sufficient for this task.
(4) The desorption rate for each adsorbate is calculatedusing a desorption frequency of 1013 Hz, and the moleculewith the highest desorption rate, rmax, is identified. Anadsorbate i is identified at random and allowed to desorbwith probability Pi ) ri/rmax. If no desorption occurs, thisprocedure is repeated until desorption is successful. Aftereach desorption, time is updated by δt ) (Σi)1
N ri)-1, whereN is the number of adsorbate molecules, and temperatureis increased by δT ) âTHδt. The observed desorption rateis recorded as ∆N/∆t, where ∆N is the number of moleculesdesorbed during the time interval ∆t.
We have performed simulations on five realizations ofevery roughened surface, each containing 2000 sites.Therefore, L in our lattice is 10 000. To achieve betterstatistical accuracy, we perform multiple MWMC simula-tions for every adsorbate/surface pair and average theresulting TPD spectra. Lower coverages require moresimulations to achieve good statistical coverage. Thenumber of independent simulations was varied from 100at 5% coverage to 20 at 25% coverage.
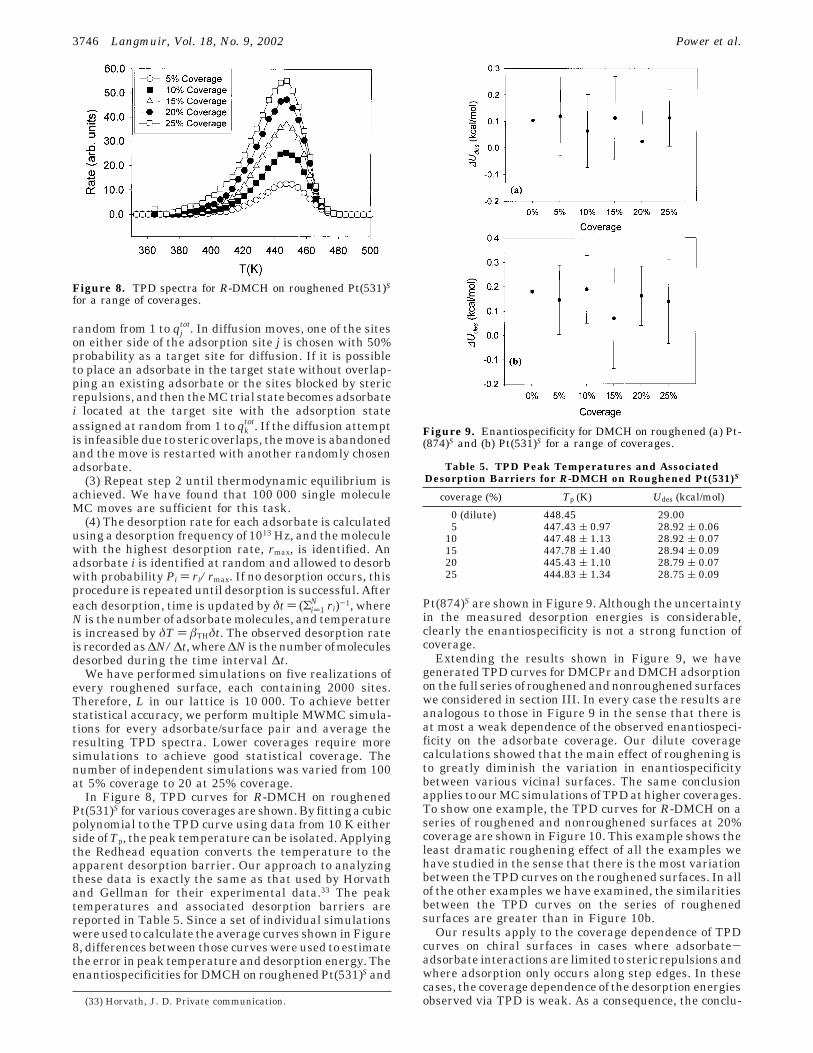
In Figure 8, TPD curves for R-DMCH on roughenedPt(531)S for various coverages are shown. By fitting a cubicpolynomial to the TPD curve using data from 10 K eitherside of Tp, the peak temperature can be isolated. Applyingthe Redhead equation converts the temperature to theapparent desorption barrier. Our approach to analyzingthese data is exactly the same as that used by Horvathand Gellman for their experimental data.33 The peaktemperatures and associated desorption barriers arereported in Table 5. Since a set of individual simulationswere used to calculate the average curves shown in Figure8, differences between those curves were used to estimatethe error in peak temperature and desorption energy. Theenantiospecificities for DMCH on roughened Pt(531)S and
Pt(874)S are shown in Figure 9. Although the uncertaintyin the measured desorption energies is considerable,clearly the enantiospecificity is not a strong function ofcoverage.
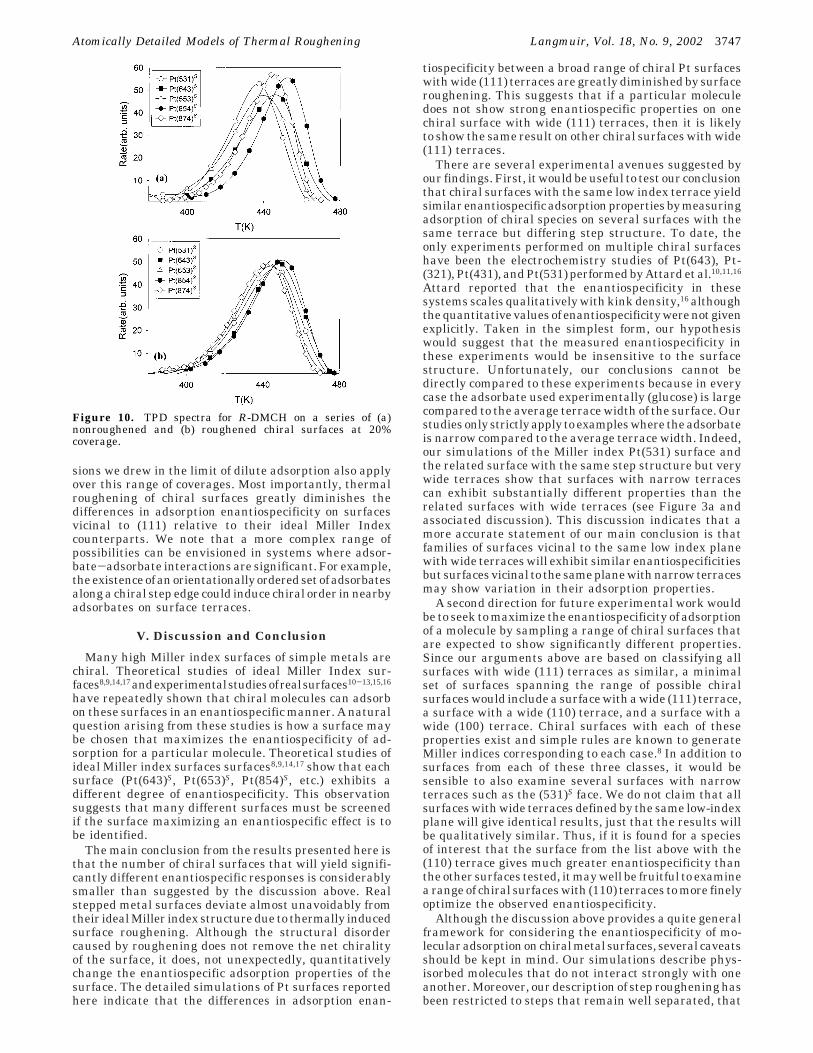
Extending the results shown in Figure 9, we havegenerated TPD curves for DMCPr and DMCH adsorptionon the full series of roughened and nonroughened surfaceswe considered in section III. In every case the results areanalogous to those in Figure 9 in the sense that there isat most a weak dependence of the observed enantiospeci-ficity on the adsorbate coverage. Our dilute coveragecalculations showed that the main effect of roughening isto greatly diminish the variation in enantiospecificitybetween various vicinal surfaces. The same conclusionapplies to our MC simulations of TPD at higher coverages.To show one example, the TPD curves for R-DMCH on aseries of roughened and nonroughened surfaces at 20%coverage are shown in Figure 10. This example shows theleast dramatic roughening effect of all the examples wehave studied in the sense that there is the most variationbetween the TPD curves on the roughened surfaces. In allof the other examples we have examined, the similaritiesbetween the TPD curves on the series of roughenedsurfaces are greater than in Figure 10b.
Our results apply to the coverage dependence of TPDcurves on chiral surfaces in cases where adsorbate-adsorbate interactions are limited to steric repulsions andwhere adsorption only occurs along step edges. In thesecases, the coverage dependence of the desorption energiesobserved via TPD is weak. As a consequence, the conclu-(33) Horvath, J. D. Private communication.
Figure 8. TPD spectra for R-DMCH on roughened Pt(531)S
for a range of coverages.
Figure 9. Enantiospecificity for DMCH on roughened (a) Pt-(874)S and (b) Pt(531)S for a range of coverages.
Table 5. TPD Peak Temperatures and AssociatedDesorption Barriers for R-DMCH on Roughened Pt(531)S
coverage (%) Tp (K) Udes (kcal/mol)
0 (dilute) 448.45 29.005 447.43 ( 0.97 28.92 ( 0.06
10 447.48 ( 1.13 28.92 ( 0.0715 447.78 ( 1.40 28.94 ( 0.0920 445.43 ( 1.10 28.79 ( 0.0725 444.83 ( 1.34 28.75 ( 0.09
3746 Langmuir, Vol. 18, No. 9, 2002 Power et al.
sions we drew in the limit of dilute adsorption also applyover this range of coverages. Most importantly, thermalroughening of chiral surfaces greatly diminishes thedifferences in adsorption enantiospecificity on surfacesvicinal to (111) relative to their ideal Miller Indexcounterparts. We note that a more complex range ofpossibilities can be envisioned in systems where adsor-bate-adsorbate interactions are significant. For example,theexistenceofanorientationallyorderedsetofadsorbatesalong a chiral step edge could induce chiral order in nearbyadsorbates on surface terraces.
V. Discussion and Conclusion
Many high Miller index surfaces of simple metals arechiral. Theoretical studies of ideal Miller Index sur-faces8,9,14,17andexperimentalstudiesofrealsurfaces10-13,15,16
have repeatedly shown that chiral molecules can adsorbon these surfaces in an enantiospecific manner. A naturalquestion arising from these studies is how a surface maybe chosen that maximizes the enantiospecificity of ad-sorption for a particular molecule. Theoretical studies ofideal Miller index surfaces surfaces8,9,14,17 show that eachsurface (Pt(643)S, Pt(653)S, Pt(854)S, etc.) exhibits adifferent degree of enantiospecificity. This observationsuggests that many different surfaces must be screenedif the surface maximizing an enantiospecific effect is tobe identified.
The main conclusion from the results presented here isthat the number of chiral surfaces that will yield signifi-cantly different enantiospecific responses is considerablysmaller than suggested by the discussion above. Realstepped metal surfaces deviate almost unavoidably fromtheir ideal Miller index structure due to thermally inducedsurface roughening. Although the structural disordercaused by roughening does not remove the net chiralityof the surface, it does, not unexpectedly, quantitativelychange the enantiospecific adsorption properties of thesurface. The detailed simulations of Pt surfaces reportedhere indicate that the differences in adsorption enan-
tiospecificity between a broad range of chiral Pt surfaceswith wide (111) terraces are greatly diminished by surfaceroughening. This suggests that if a particular moleculedoes not show strong enantiospecific properties on onechiral surface with wide (111) terraces, then it is likelyto show the same result on other chiral surfaces with wide(111) terraces.
There are several experimental avenues suggested byour findings. First, it would be useful to test our conclusionthat chiral surfaces with the same low index terrace yieldsimilarenantiospecificadsorptionpropertiesbymeasuringadsorption of chiral species on several surfaces with thesame terrace but differing step structure. To date, theonly experiments performed on multiple chiral surfaceshave been the electrochemistry studies of Pt(643), Pt-(321), Pt(431), and Pt(531) performed by Attard et al.10,11,16
Attard reported that the enantiospecificity in thesesystems scales qualitatively with kink density,16 althoughthe quantitative values of enantiospecificity were not givenexplicitly. Taken in the simplest form, our hypothesiswould suggest that the measured enantiospecificity inthese experiments would be insensitive to the surfacestructure. Unfortunately, our conclusions cannot bedirectly compared to these experiments because in everycase the adsorbate used experimentally (glucose) is largecompared to the average terrace width of the surface. Ourstudies only strictly apply to examples where the adsorbateis narrow compared to the average terrace width. Indeed,our simulations of the Miller index Pt(531) surface andthe related surface with the same step structure but verywide terraces show that surfaces with narrow terracescan exhibit substantially different properties than therelated surfaces with wide terraces (see Figure 3a andassociated discussion). This discussion indicates that amore accurate statement of our main conclusion is thatfamilies of surfaces vicinal to the same low index planewith wide terraces will exhibit similar enantiospecificitiesbut surfaces vicinal to the same plane with narrow terracesmay show variation in their adsorption properties.
A second direction for future experimental work wouldbe to seek to maximize the enantiospecificity of adsorptionof a molecule by sampling a range of chiral surfaces thatare expected to show significantly different properties.Since our arguments above are based on classifying allsurfaces with wide (111) terraces as similar, a minimalset of surfaces spanning the range of possible chiralsurfaces would include a surface with a wide (111) terrace,a surface with a wide (110) terrace, and a surface with awide (100) terrace. Chiral surfaces with each of theseproperties exist and simple rules are known to generateMiller indices corresponding to each case.8 In addition tosurfaces from each of these three classes, it would besensible to also examine several surfaces with narrowterraces such as the (531)S face. We do not claim that allsurfaces with wide terraces defined by the same low-indexplane will give identical results, just that the results willbe qualitatively similar. Thus, if it is found for a speciesof interest that the surface from the list above with the(110) terrace gives much greater enantiospecificity thanthe other surfaces tested, it may well be fruitful to examinea range of chiral surfaces with (110) terraces to more finelyoptimize the observed enantiospecificity.
Although the discussion above provides a quite generalframework for considering the enantiospecificity of mo-lecular adsorption on chiral metal surfaces, several caveatsshould be kept in mind. Our simulations describe phys-isorbed molecules that do not interact strongly with oneanother. Moreover, our description of step roughening hasbeen restricted to steps that remain well separated, that
Figure 10. TPD spectra for R-DMCH on a series of (a)nonroughened and (b) roughened chiral surfaces at 20%coverage.
Atomically Detailed Models of Thermal Roughening Langmuir, Vol. 18, No. 9, 2002 3747
is, surfaces with relatively wide terraces. Scenarios canbe envisioned in which the specific structure of a chiralsurface may be especially important. For example, ifenantiospecific effects occur because chiral order inmolecules adsorbed on terraces is induced by moleculesadsorbed at step edges, this behavior will only occur onsurfaces with terraces wide enough to allow adsorption ofmultiple molecules and these effects will vary as a functionof the terrace width. Nevertheless, the observation thatthermal roughening tends to diminish the differencesbetween chiral metal surfaces with the same low indexterrace appears to be quite general. It is hoped that thisidea and the detailed results reported here will spurcontinued experimental study of chiral metal surfaces andprovide a useful means for classifying experimental datafrom the wide range of possible surfaces.
Appendix AOur LG model for periphery diffusion of Pt atoms along
Pt surface steps has been described in detail elsewhere.19
Briefly, the activation energy to move between two sitesis given by Eb ) ETS - ES, where ETS and ES are the movingatom’s energy at the transition state (TS) and the initialstate (S). These energies are defined in terms of 6 typesof nearest neighbor atoms: A-step atom, B-step atom,120° corner atom, 240° corner atom, 300° A corner atom,and 300° B corner atom.19 We define
and
where i ) 1, .., 6 labels the atom types, EiS and Ei
TS areenergies of interactions, and Ni (Mi) are the number of“fully” (“partially”) bonded nearest neighbors.19 Theparameters of the LG model used throughout this paperare summarized in Table 6.
Appendix BThe desorption rate of n molecules from the surface is
given as
where r is the aggregate desorption rate constant from all
possible states. This is calculated by
For each state i,
where υ is the desorption frequency, Ei is the bindingenergy, which is negative, and Pi is the probability ofobserving a molecule in that state. Pi is given in the dilutelimit by
Combining (B.4) and (B.3) gives
Substitution of (B.5) into (B.2) yields r as
The temperature corresponding to the peak desorptionrate, Tp, can be determined by solving an implicit equationthat arises from generalizing the usual Redhead analysis30
to a system with multiple adsorption sates. By determi-nation of the conditions where d2n/dt2 ) 0, the peaktemperature is found to satisfy
Acknowledgment. This work was supported by theNSF under Grant No. CTS-9813937. Computations wereperformed at the Pittsburgh Supercomputer Center andon a computer cluster supported by the NSF (Grant No.CTS-0094407) and Intel. T.D.P. received a graduatefellowship from Air Products and Chemicals Inc., andD.S.S. is an Alfred P. Sloan research fellow.
LA011535O
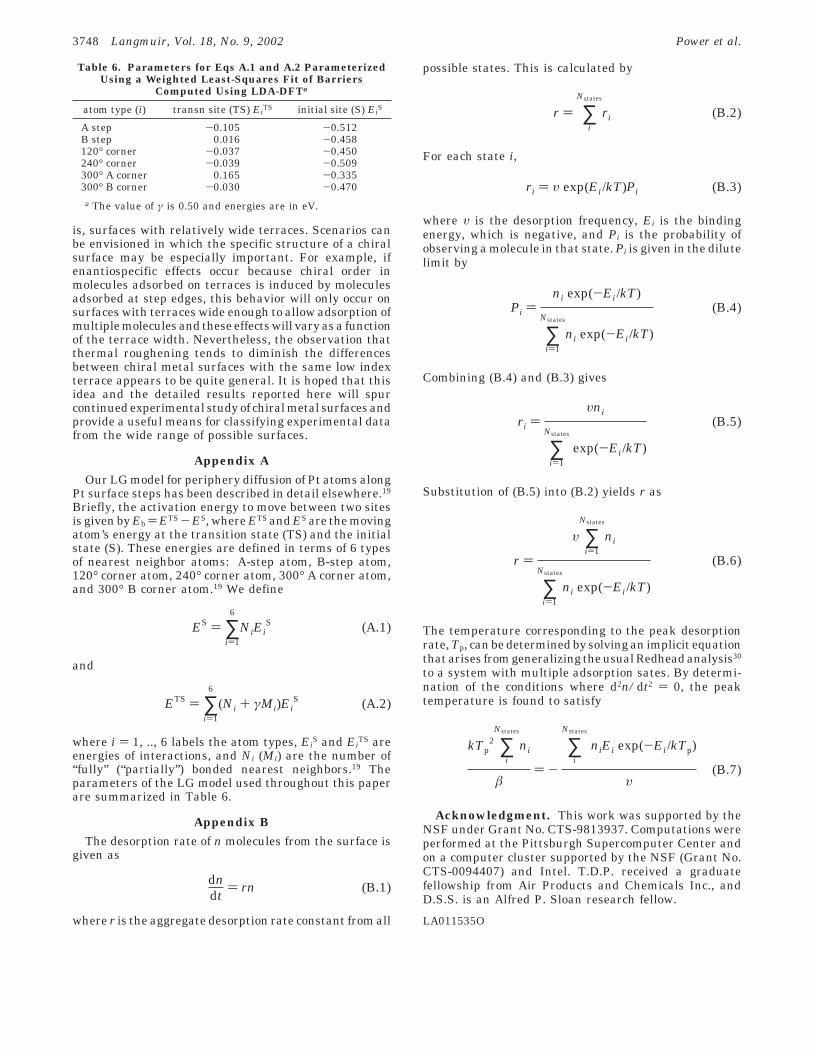
Table 6. Parameters for Eqs A.1 and A.2 ParameterizedUsing a Weighted Least-Squares Fit of Barriers
Computed Using LDA-DFTa
atom type (i) transn site (TS) EiTS initial site (S) Ei
S
A step -0.105 -0.512B step 0.016 -0.458120° corner -0.037 -0.450240° corner -0.039 -0.509300° A corner 0.165 -0.335300° B corner -0.030 -0.470a The value of γ is 0.50 and energies are in eV.
ES ) ∑i)1
6
NiEiS (A.1)
ETS ) ∑i)1
6
(Ni + γMi)EiS (A.2)
dndt
) rn (B.1)
r ) ∑i
Nstates
ri (B.2)
ri ) υ exp(Ei/kT)Pi (B.3)
Pi )ni exp(-Ei/kT)
∑i)1
Nstates
ni exp(-Ei/kT)
(B.4)
ri )υni
∑i)1
Nstates
exp(-Ei/kT)
(B.5)
r )
υ ∑i)1
Nstates
ni
∑i)1
Nstates
ni exp(-Ei/kT)
(B.6)
kTp2 ∑
i
Nstates
ni
â) -
∑i
Nstates
niEi exp(-Ei/kTp)
υ(B.7)
3748 Langmuir, Vol. 18, No. 9, 2002 Power et al.