Chemoreception for fat: Do rats sense triglycerides directly?
Upload
khangminh22Category
view
2download
0
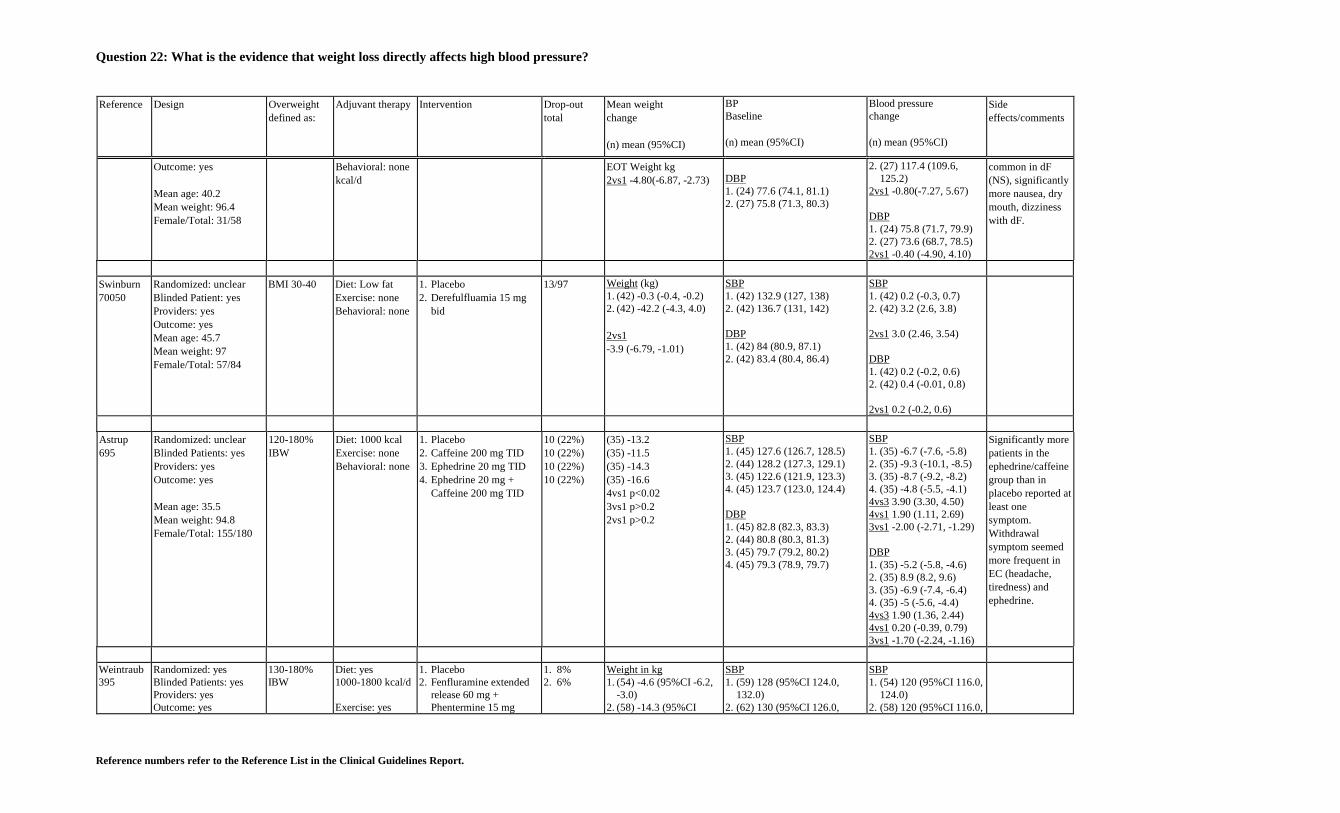
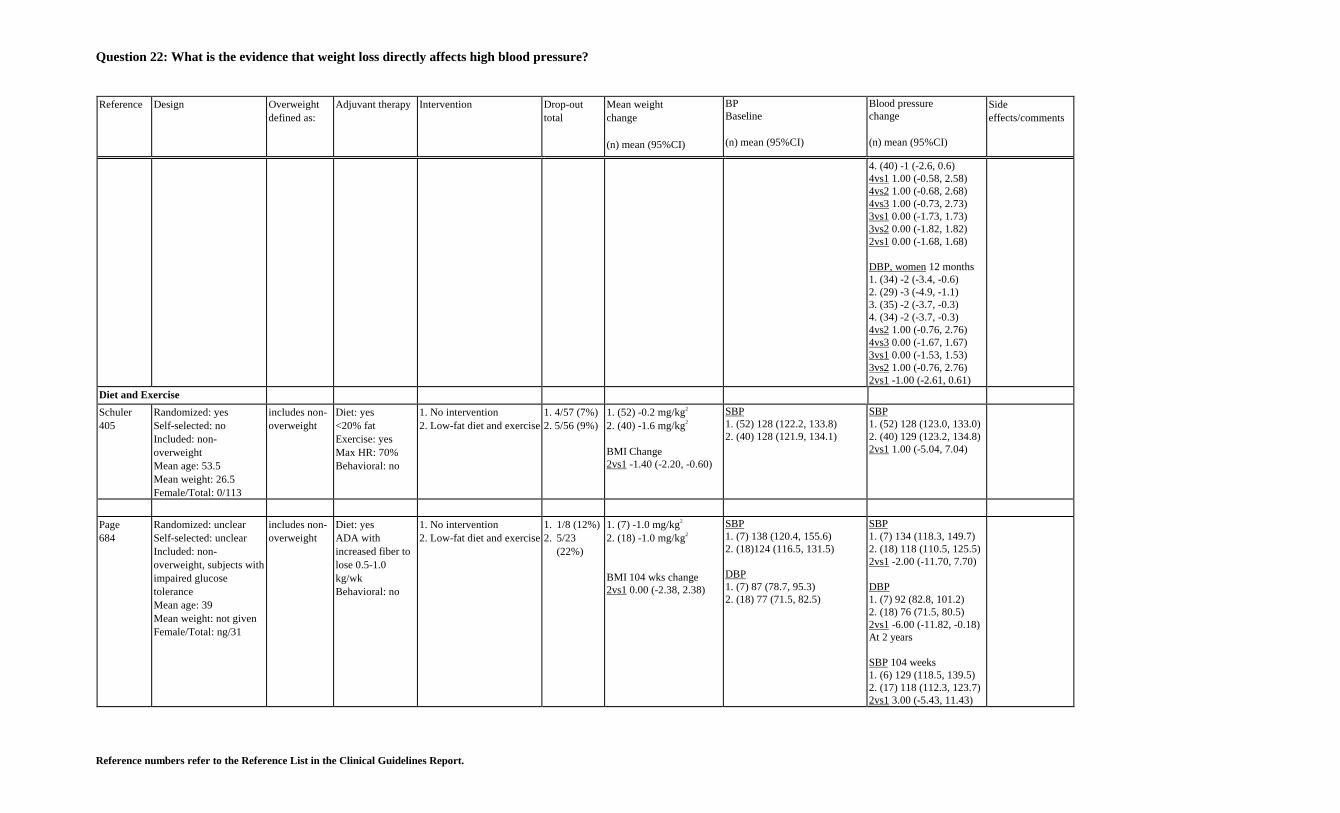
Question 22: What is the evidence that weight loss directly affects high blood pressure?
Reference numbers refer to the Reference List in the Clinical Guidelines Report.
Reference Design Overweightdefined as:
Adjuvant therapy Intervention Drop-outtotal
Mean weightchange
(n) mean (95%CI)
BPBaseline
(n) mean (95%CI)
Blood pressurechange
(n) mean (95%CI)
Sideeffects/comments
Pharmacotherapy
Rasmussen699
Randomized: unclearBlinded Patients: yesProviders: yesOutcome: yes
Mean age: 37Mean weight: 95.7Female/Total: 51/60
BMI: 27-39 Diet: low-calorie,high-fiberExercise: noneBehavioral: none
1. Placebo2. Cimetidine 200 mg TID
Duration: 8 weeks
55
(29) -5.9(26) -5.7
2vs10.20 (-1.09, 1.48)
SBP1. (30) 123 (117, 129)2. (30) 127 (118, 135)
DBP1. (30) 79 (74.9, 83.1)2. (30) 81 (76.5, 85.5)
SBP1. (29) 120 (114, 125)2. (26) 120 (112, 127)2vs1 -4 (-41, 32)DBP1. (29) 73 (69.2, 76.8)2. (26) 74 (69.2, 78.8)2vs1 -1 (-5.5, 3.5)
Nausea/abdominalpain more frequentwith cimetidine(no statistic done).
Mathus-Vliegen390
Randomized: unclearBlinded Patients: yesProviders: yesOutcome: yesSubgroup of INDEX trial
Mean age: 35.9Mean weight: 110.7Female/Total: 64/75
>135% IBW Diet: low-calorie(1000 kcal less)Exercise: noneBehavioral: none
1. Placebo2. Dexfenfluramine 15 mg
BID
3 (8%)7 (19%)
(36) -8.0(36) -10.7
2vs1 p=ns
SBP1. 1.(39) 154.2 (148.2, 160.2)2. 2.(36) 151.9 (143.9, 159.9)
DBP1. (39) 103.1 (98.9, 107.3)2. (36) 103.8 (98.2, 109.4)
SBP 6 mos2vs1 -3.70 (-11.19, 3.79)
SBP1. (36) 126.9 (119.9,
133.9)2. (29) 124.1 (116.9,
131.3)2vs1 -0.50 (-8.02, 7.02)
DBP1. (36) 88.3 (83.8, 92.8)2. (29) 86.4 (81.5, 91.3)2vs1 -2.60 (-7.64, 2.44)DBP 6 mos change2vs1 -1.00 (-6.14, 4.14)
Dutch eatingbehavior increasedin placebo (need torestrain theireating more inorder to achievesame weight loss).
Herwig70037
Randomized: YesBlinded Patients: YesProviders: YesOutcome: YesMean age: 42Mean weight:Female/Total: 52/60
>120% IBW Diet: LCD 1500Exercise: NoBehavioral: No
1. Placebo2. Dexfenfluramine 15 mg
BID
18/60 Weight loss (upper bodyobesity)1. (8) –4.7 (-7.1, -2.3)2. (12) –14.2 (-15.6, 12.8)
2vs1–9.5 (-11.19, -7.81)
Weight loss (lower bodyobesity)
1. (6) –2.6 (-5, -0.16)2. (16) –11.1 (-12.7, -9.6)
2vs1-8.5 (-10.14, -6.86)
SBP (upper body obesity)1. (8) 153.8 (146, 161)2. (12) 157.5 (151, 164)
SBP (lower body obesity)1. (6) 138 (128, 138)2. (16) 136 (128, 144)
SBP (upper body obesity)1. (8) 140 (133, 147)2. (12) 133 (128, 138)

Question 22: What is the evidence that weight loss directly affects high blood pressure?
Reference numbers refer to the Reference List in the Clinical Guidelines Report.
Reference Design Overweightdefined as:
Adjuvant therapy Intervention Drop-outtotal
Mean weightchange
(n) mean (95%CI)
BPBaseline
(n) mean (95%CI)
Blood pressurechange
(n) mean (95%CI)
Sideeffects/comments
Connacher696
Randomized: unclearBlinded Patients: yesProviders: yesOutcome: yes
Mean age: 42.8Mean weight: 100.5Female/Total: 32/40
>120% IBW Diet: 3.35 MJ/dExercise: noBehavioral: no
1. Placebo2. BRL 26830A (beta
adrenoreceptor agonist)start at 200, then 400 mg
none Weight in kg1. (16) -10 (95%CI -13.1,
–6.9)2. (16) -15.4 (95%CI -18.9,
-11.9)
SBP1. (20) 127 (95%CI 118.6, 135.4)2. (20) 129 (95%CI 123.4, 134.6)
DBP1. (20) 83 (95%CI 79.7, 86.3)2. (20) 84 (95%CI 80.3, 87.7)
SBP1. (16) 119 (95%CI 112.6,
125.4)2. (16) 116 (95%CI 107.5,
124.5)
DBP1. (16) 79 (95%CI 74.7,
83.3)2. (16) 78 (95%CI 73.7,
82.3)
Bremer386
Randomized: unclearBlinded Patients: yesProviders: yesOutcome: yes
Mean age: 49.4Mean weight: 83.3Female/Total: 15/26*dyslipidemic patients
poor outcometo weight lossprograms
Diet: low-fat dietExercise: noneBehavioral: none
1. Placebo2. Dexfenfluramine 15 mg
BID
03 (20%)
(14) -2.5(12) -4.2
2vs1-1.7 (-8.65, 5.25)
SBP1. (14) 137.5 (130.6, 144.4)2. (12) 146.7 (136.6, 156.8)
DBP1. (14) 87.5 (80.6, 94.4)2. (12) 82.3 (77.0, 87.6)
SBP1. (14) 132.4 (125.9,
138.9)2. (12) 128.6 (120.2,
137.0)2vs1 -13.00 (-20.85,-5.15)
DBP1. (14) 86.9 (81.3, 92.5)2. (12) 78.2 (72.7, 83.7)2vs1 -3.50(-9.39, 2.39)
40% in dFcompared to 0% inplacebo.Drowsiness,fatigue, sleepiness,memory loss,faintness, loss ofsensation in armsand legs werereasons forwithdrawal.
Mathus-Vliegen391
Randomized: unclearBlinded Patients: yesProviders: yesOutcome: yes
Mean age: 36.5Mean weight: 109Female/Total: 35/42
>120% IBW Diet: 1000 kcallessExercise: noneBehavioral: none
1. Placebo2. Dexfenfluramine 15 mg
BID
1. (17%)2. (24%)
(18) -8.63(17) -12.84
2vs1 -4.21 (-13.2, 4.79)
SBP1. (18) 150.3 (144.1, 156.5)2. (17) 152.1 (139.5, 164.7)
DBP1. (18) 103.3 (97.5, 109.1)2. (17) 102.6 (93.8, 111.4)
SBP1. (18) 137.2 (126.7,
147.7)2. (17) 129.4 (119.4,
139.4)2vs1 -9.6 (-20, 0.8)
DBP1. (18) 94.4 (87.3, 101.5)2. (17) 91.5 (84.7, 98.3)2vs1 -2.2 (-9.5, 5.2)
O'Connor392
Randomized: unclearBlinded Patients: yesProviders: yes
BMI: 30-40(kg/m2)
Diet: 1200 to1500Exercise: none
1. Placebo2. Dexfenfluramine 15 mg
BID
1. (14%)2. (10%)
(24) -4.9(27) - 9.7
SBP1. (24) 118.9 (113.9, 123.9)2. (27) 117.2 (111.2, 123.2)
SBP1. (24) 119.9 (114.7,
125.1)
Diarrhea,↓appetite, fatigue,headache more
Question 22: What is the evidence that weight loss directly affects high blood pressure?
Reference numbers refer to the Reference List in the Clinical Guidelines Report.
Reference Design Overweightdefined as:
Adjuvant therapy Intervention Drop-outtotal
Mean weightchange
(n) mean (95%CI)
BPBaseline
(n) mean (95%CI)
Blood pressurechange
(n) mean (95%CI)
Sideeffects/comments
Outcome: yes
Mean age: 40.2Mean weight: 96.4Female/Total: 31/58
Behavioral: nonekcal/d
EOT Weight kg2vs1 -4.80(-6.87, -2.73) DBP
1. (24) 77.6 (74.1, 81.1)2. (27) 75.8 (71.3, 80.3)
2. (27) 117.4 (109.6,125.2)
2vs1 -0.80(-7.27, 5.67)
DBP1. (24) 75.8 (71.7, 79.9)2. (27) 73.6 (68.7, 78.5)2vs1 -0.40 (-4.90, 4.10)
common in dF(NS), significantlymore nausea, drymouth, dizzinesswith dF.
Swinburn70050
Randomized: unclearBlinded Patient: yesProviders: yesOutcome: yesMean age: 45.7Mean weight: 97Female/Total: 57/84
BMI 30-40 Diet: Low fatExercise: noneBehavioral: none
1. Placebo2. Derefulfluamia 15 mg
bid
13/97 Weight (kg)1. (42) -0.3 (-0.4, -0.2)2. (42) -42.2 (-4.3, 4.0)
2vs1-3.9 (-6.79, -1.01)
SBP1. (42) 132.9 (127, 138)2. (42) 136.7 (131, 142)
DBP1. (42) 84 (80.9, 87.1)2. (42) 83.4 (80.4, 86.4)
SBP1. (42) 0.2 (-0.3, 0.7)2. (42) 3.2 (2.6, 3.8)
2vs1 3.0 (2.46, 3.54)
DBP1. (42) 0.2 (-0.2, 0.6)2. (42) 0.4 (-0.01, 0.8)
2vs1 0.2 (-0.2, 0.6)
Astrup695
Randomized: unclearBlinded Patients: yesProviders: yesOutcome: yes
Mean age: 35.5Mean weight: 94.8Female/Total: 155/180
120-180%IBW
Diet: 1000 kcalExercise: noneBehavioral: none
1. Placebo2. Caffeine 200 mg TID3. Ephedrine 20 mg TID4. Ephedrine 20 mg +
Caffeine 200 mg TID
10 (22%)10 (22%)10 (22%)10 (22%)
(35) -13.2(35) -11.5(35) -14.3(35) -16.64vs1 p<0.023vs1 p>0.22vs1 p>0.2
SBP1. (45) 127.6 (126.7, 128.5)2. (44) 128.2 (127.3, 129.1)3. (45) 122.6 (121.9, 123.3)4. (45) 123.7 (123.0, 124.4)
DBP1. (45) 82.8 (82.3, 83.3)2. (44) 80.8 (80.3, 81.3)3. (45) 79.7 (79.2, 80.2)4. (45) 79.3 (78.9, 79.7)
SBP1. (35) -6.7 (-7.6, -5.8)2. (35) -9.3 (-10.1, -8.5)3. (35) -8.7 (-9.2, -8.2)4. (35) -4.8 (-5.5, -4.1)4vs3 3.90 (3.30, 4.50)4vs1 1.90 (1.11, 2.69)3vs1 -2.00 (-2.71, -1.29)
DBP1. (35) -5.2 (-5.8, -4.6)2. (35) 8.9 (8.2, 9.6)3. (35) -6.9 (-7.4, -6.4)4. (35) -5 (-5.6, -4.4)4vs3 1.90 (1.36, 2.44)4vs1 0.20 (-0.39, 0.79)3vs1 -1.70 (-2.24, -1.16)
Significantly morepatients in theephedrine/caffeinegroup than inplacebo reported atleast onesymptom.Withdrawalsymptom seemedmore frequent inEC (headache,tiredness) andephedrine.
Weintraub395
Randomized: yesBlinded Patients: yesProviders: yesOutcome: yes
130-180%IBW
Diet: yes1000-1800 kcal/d
Exercise: yes
1. Placebo2. Fenfluramine extended
release 60 mg +Phentermine 15 mg
1. 8%2. 6%
Weight in kg1. (54) -4.6 (95%CI -6.2,
-3.0)2. (58) -14.3 (95%CI
SBP1. (59) 128 (95%CI 124.0,
132.0)2. (62) 130 (95%CI 126.0,
SBP1. (54) 120 (95%CI 116.0,
124.0)2. (58) 120 (95%CI 116.0,

Question 22: What is the evidence that weight loss directly affects high blood pressure?
Reference numbers refer to the Reference List in the Clinical Guidelines Report.
Reference Design Overweightdefined as:
Adjuvant therapy Intervention Drop-outtotal
Mean weightchange
(n) mean (95%CI)
BPBaseline
(n) mean (95%CI)
Blood pressurechange
(n) mean (95%CI)
Sideeffects/comments
Mean age: 40Mean weight: 33.4mg/kg2
Female/Total: 90/121
>900 Cal/week
Behavioral: yesgroup, 8 sessions
-16.1, -12.5)
2vs1 -9.70 (-11.39, -8.01)
134.0)
DBP1. (59) 80 (95%CI 78.0, 82.0)2. (62) 83 (95%CI 81.0, 85.0)
124.0)2vs1 -2.00 (-6.29, 2.29)
DBP1. (54) 77 (95%CI 75.0,
79.0)2. (58) 76 (95%CI 74.0,
78.0)2vs1 –4.00 (-6.14, -1.86)
Schteingart512
Randomized: unclearBlinded Patients: yesProviders: yesOutcome: yes
Mean age: 37.8Mean weight: 79.9Female/Total: 85/101
115-145%overweight
Diet: 1200 kcalExercise: noneBehavioral: none
1. Placebo2. Phenylpropanolamine
75 mg qd
23 (46%)15 (29%)
(28) -1.07(36) -2.592vs1-1.52 (-3.52,0.48)
SBP (Change frombaseline)1. (28) -5.7 (n/a, n/a)2. (36) 0.4 (n/a, n/a)
DBP (Change frombaseline)1. (28) 0.3 (n/a, n/a)2. (36) 0.9 (n/a, n/a)at end of treatmentdifferences betweengroups for SBP and DBPwere not significant
no details otherthan 2 drop-outssecondary tonausea.
Marin698
Randomized: unclearBlinded Patients: noProviders: noOutcome: no
Mean age: 50.8Mean weight: 95.6Female/Total: 0/23
BMI>25 Diet: nsExercise: noneBehavioral: none
1. Placebo2. Testosterone decanoate
80 mg BID
1 (8%)1 (9%)
(12) -0.2(11) -1.4
2vs1-1.2 (-8.03, 5.63)
SBP1. (12) 144.2 (134.1, 154.3)2. (11) 140.0 (133.8, 146.2)
DBP1. (12) 85.0 (79.5, 90.5)2. (11) 88.2 (83.5, 92.9)
SBP1. (12) 135.9 (126.0,
145.8)2. (11) 130.9 (122.2,
139.6)2vs1 -0.80 (-9.5, 7.9)
DBP1. (12) 83.6 (77.4, 89.8)2. (11) 82.1 (79.6, 84.6)2vs1 -4.70 (-9.61, 0.21)
Side effects: astatisticallysignificantenlargement of theprostate was foundin the testosteronegroup.PSA unchanged.
Pfohl393
Randomized: unclearBlinded Patients: yesProviders: yesOutcome: yesMean age: 38.5Mean weight: 96.5
>120% IBW Diet: yes1200-1500 kcal
Exercise: no
Behavioral: no
1. Placebo2. Dexfenfluramine 15 mg
BID
not given Weight in kg1. (15) -9.6 (95%CI -13.2,
-6.0)2. (19) -10.9 (95%CI
-14.7, -7.1)2vs1 -1.3 (-5.2, 2.6)Weight in kg 48 months
DBP change 6 months2vs1 1.20(-18.97, 21.37)
SBP change 6 months2vs1 1.30(-36.83, 39.43)
SBP 11 months

Question 22: What is the evidence that weight loss directly affects high blood pressure?
Reference numbers refer to the Reference List in the Clinical Guidelines Report.
Reference Design Overweightdefined as:
Adjuvant therapy Intervention Drop-outtotal
Mean weightchange
(n) mean (95%CI)
BPBaseline
(n) mean (95%CI)
Blood pressurechange
(n) mean (95%CI)
Sideeffects/comments
Female/Total: 38/48 1. (11) -2.1 (95%CI -4.8,0.6)
2. (11) 1.5 (95%CI -1.4,4.4)
2vs1 3.6 (0.72, 6.48)
1. (11) 130.5 (95%CI97.3, 163.7)
2. (11) 126.8 (95%CI97.4, 156.2)
2vs1 2.60 (-31.01, 36.21)
DBP 11 months1. (11) 85.9 (95%CI 61.2,
110.6)2. (11) 80.9 (95%CI 63.1,
98.7)2vs1 -0.60 (-20.38, 19.18)
SBP 48 months1. (11) 144.6 (95%CI
96.7, 192.5)2. (11) 139.1 (95%CI
109.7, 168.5)2vs1 0.70 (-36.63, 38.03)
DBP 48 months1. (11) 89.1 (95%CI 64.4,
113.8)2. (11) 87.3 (95%CI 67.7,
106.9)2vs1 2.60 (-17.58, 22.78)
Exercise
Ready685
Randomized: unclearSelf-selected: yesIncluded:postmenopausal women,included non-overweightMean age: not givenMean weight: 79.7Female/Total 40/40
postmenopaus-al women
Diet: noExercise: yes60 min 5x/wkMax HR: 60%Behavioral: no
1. Contro1 (no exercise)2. Exercise
1. 6/16(37%)
2. 9/24(37%)
Weight in kg1. 0.6 (-7.9, 9.1)2. -1.9 (-11.22, 7.42)
2vs1 -2.5 (-11.0, 6.0)
SBP1. (10) 6.74 (6.3, 7.2)2. (15) 6.64 (6.4, 6.9)
SBP1. (10) 6.75 (6.4, 7.1)2. (15) 6.34 (6.0, 6.7)
Hellenius365
Randomized: unclearSelf-selected: noIncluded: non-overweightMean age: 46.2Mean weight: 25 kg/m2
Female/Total: none/158
not given Diet: none forgroup 3Exercise: yes30-45 min 3x/wkMax HR: 60-80%Behavioral: no
1. No intervention2. Low-fat diet3. Exercise alone4. Low-fat diet + exercise
1. 1/40(2.5%)
2. 0/393. 0/394. 0/39
Change in BMI1. 0.32. -0.33. -0.34. -0.6
4vs3 -0.30 (-0.57, -0.03)
SBP1. (39) 130 (126.0, 134.0)2. (40) 130 (124.8, 135.2)3. (39) 133 (127.2, 138.8)4. (39) 129 (124.9,133.1)1
DBP1. (39) 82 (79.3, 84.7)
SBP1. (39) -0.13 (-0.33, 0.07)2. (40) -0.19 (-0.49, 0.11)3. (39) -0.12 (-0.35, 0.11)4. (39) -0.45 (-0.77, -0.13)3vs1 0.01 (-0.20, 0.22)3vs2 0.07 (-0.19, 0.33)2vs1 -0.06 (-0.31, 0.19)

Question 22: What is the evidence that weight loss directly affects high blood pressure?
Reference numbers refer to the Reference List in the Clinical Guidelines Report.
Reference Design Overweightdefined as:
Adjuvant therapy Intervention Drop-outtotal
Mean weightchange
(n) mean (95%CI)
BPBaseline
(n) mean (95%CI)
Blood pressurechange
(n) mean (95%CI)
Sideeffects/comments
4vs2 -0.30 (-0.60, 0.00)4vs1 -0.90 (-1.15, -0.65)3vs1 -0.60 (-0.82, -0.38)3vs2 0.00 (-0.28, -0.28)2vs1 -0.60 (-0.86, -0.34)
2. (40) 82 (79.5, 84.5)3. (39) 82 (78.9, 85.1)4. (39) 81 (78.5, 83.5)
4vs3 -0.33 (-0.60, -0.064vs2 -0.26 (-0.57, 0.05)4vs1 -0.32 (-0.58, -0.06)
DBP1. (39) -1 (-3, 1)2. (40) -6 (-8, -4)3. (39) -4 (-7, -2)4. (39) -2 (-4, 1)
Gordon70030
Randomized: unclearSelf-selected: yesIncluded: hypertensiveand moderately obeseMean age: 48Mean weight: 98Female/Total 38/55
Moderatelyobese
Diet: none forgroup 2Exercise: yes30-45 min, 3-5x/wkMax HR: 60-85%Behavioral: no
1. Exercise training2. Diet3. Exercise and diet
1. 0/142. 2/173. 5/24
Weight (kg)1. (14) –1 (2.0.04)2. (15) –5.8 (-7.9, -3.6)3. (19) –7.1 (-8.5, -5.7)
SBP1. (14) 145 (138, 152)2. (15) 141 (133, 149)3. (19) 145 (139, 151)
DBP1. (14) 96 (91.3, 100.6)2. (15) 93 (89.1, 96.9)3. (19) 95 (91.6, 98.4)
SBP1. (14) –9.9 (-13.6, -6.2)2. (15) –11.3 (-18, -4.6)3. (19) –12.5 (-15.5, -9.5)
DBP1. (14) –5.9 (-8.6, -3.2)2. (15) –7.5 (-9.8, -5.1)3. (19) –7.9 (-9.9, -5.8)
Gillett678
Randomized: yesSelf-selected: unclearIncluded: not specifiedMean age: 41.9Mean weight: 165.8Female/Total: 38/38
not given Diet: noBehavioral: no
1. Aerobic dance notindividualized
2. Intensity controlledindividualized aerobic
3. 3/20(15%)
4. 1/18 (6%)
1. -5.92. -5.5
2vs1 0.4 (-8.5, 9.3)
SBP1. (17) 109.8 (105.6, 114.0)2. (17) 115 (108.2, 121.8)
DBP1. (17) 70.6 (66.3, 74.9)2. (17) 79.2 (72.9, 85.5)
SBP1. (17) 103.5 (95%CI
100.5, 106.5)2. (17) 110.8 (95%CI
105.0, 116.6)
DBP1. (17) 66.5 (95%CI 63.3,
69.7)2. (17) 72.1 (95%CI 67.6,
76.6)Fortmann363
Randomized: unclearSelf-selected: yesIncluded: >120-150%IBWMean age: 44.3Mean weight: 93.6Female/Total: 0/115
>120-150% ofIBW
Diet: only forgroup 2Exercise: yes3x/wkMax HR: 70-85%Behavioral: no
1. Control (no intervention)2. Low-calorie diet3. Exercise only
not given 1. 0.52. -6.93. -4.6
EOT Weight change2vs1 -7.40 (-8.73, -6.07)3vs2 2.30 (1.07, 3.53)3vs1 -5.10 (-6.27, -3.93)
SBP1. (35) 120 (116.9, 123.1)2. (38) 118 (115.0, 121.0)3. (42) 122 (117.9, 126.1)
DBP1. (35) 79 (76.3, 81.7)2. (38) 80 (77.4, 82.6)3. (42) 78 (75.5, 80.5)
SBP1. (35) -4.1 (-6.8, -1.4)2. (38) -5.7 (-8.3, -3.1)3. (42) -6.6 (-9.2, -4.0)3vs2 -0.90 (-3.46, 1.66)3vs1 -2.50 (-5.10, 0.10)2vs1 -1.60 (-4.20, 1.00)DBP1. (35) -2.6 (-5.4, 0.2)2. (38) -5.6 (-8.0, -3.2)3. (42) -4.1 (-6.6, -1.6)3vs2 1.50 (-0.91, 3.91)3vs1 -1.50 (-4.10, 1.10)
There were noconvincingrelations betweenchanges in nutrientintake and changesin BP in any of the3 groups

Question 22: What is the evidence that weight loss directly affects high blood pressure?
Reference numbers refer to the Reference List in the Clinical Guidelines Report.
Reference Design Overweightdefined as:
Adjuvant therapy Intervention Drop-outtotal
Mean weightchange
(n) mean (95%CI)
BPBaseline
(n) mean (95%CI)
Blood pressurechange
(n) mean (95%CI)
Sideeffects/comments
2vs1 -3.00 (-5.55, -0.45)SBP,a1. (35) 0.2 (-2.2, 2.6)2. (38) -2.7 (-6.2, 0.8)3. (42) -2.3 (-4.5, -0.1)3vs2 0.40 (-2.44, 3.24)3vs1 -2.50 (-4.75, -0.25)2vs1 -2.90 (-5.87, 0.07)DBP,a1. (35) 1.5 (-0.4, 3.4)2. (38) -1.4 (-4.0, 1.2)3. (42) -2 (-3.8, -0.2)3vs2 -0.60 (-2.78, 1.58)3vs1 -3.50 (-5.32, -1.68)2vs1 -2.90 (-5.15, -0.65)
King401
Randomized: yesSelf-selected: noIncluded: non-overweightMean age: not givenMean weight: 26.9 kg/m2
Female/Total: 160/357
not given Diet: noExercise: 30-50min 3-5x/wkMax HR: 70-80%Behavioral: no
1. No intervention2. Lower-intensity home-
based exercise3. Higher-intensity home-
based exercise4. Higher-intensity group-
based exercise
not given Men Women1. 0.1 02. -0.9 -0.63. -0.2 0.14. 0.4 0.4
men:2vs1 -1.0 (-1.9, -0.01)3vs2 0.7 (-0.3, 1.7)4vs3 0.6 (-0.81, 2.01)
women:2vs1 -0.6 (-2.3, 1.2)3vs2 0.7 (-1.2, 2.6)4vs3 0.3 (-1.5, 2.1)
SBP, men1. (41) 119 (114.9, 123.1)2. (45) 115 (111.7, 118.3)3. (42) 117 (113.3, 120.7)4. (40) 118 (113.8, 122.2)
SBP, women1. (34) 117 (112.1, 121.9)2. (29) 117 (112.1, 121.9)3. (35) 116 (111.2, 120.8)4. (34) 119 (114.1, 123.9)
DBP, men1. (41) 76 (73.8, 78.2)2. (45) 74 (71.6, 76.4)3. (42) 75 (72.5, 77.5)4. (40) 75 (72.4, 77.6)
DBP, women1. (34) 72 (69.2, 74.8)2. (29) 73 (70.3, 75.7)3. (35) 73 (70.3, 75.7)4. (34) 75 (72.2, 77.8)
SBP, men 12 months1. (41) -1 (-3.8, 1.8)2. (45) -1 (-3.4, 1.4)3. (42) -3 (-5.8, -0.2)4. (40) -3 (-5.6, -0.4)4vs1 -2.00 (-4.66, 0.66)4vs2 -2.00 (-4.46, 0.46)4vs3 0.00 (-2.66, 2.66)3vs1 -2.00 (-4.76, 0.76)3vs2 -2.00 (-4.58, 0.56)2vs1 0.00 (-2.56, 2.56)
SBP, women 12 months1. (34) -3 (-6.1, 0.1)2. (29) -6 (-9.4, -2.6)3. (35) -3 (-5.4, -0.6)4. (34) -5 (-7.8, -2.2)4vs1 -2.00 (-4.90, 0.90)4vs2 1.00 (-2.03, 4.03)4vs3 -2.00 (-4.56, 0.56)3vs1 0.00 (-2.72, 2.72)3vs2 3.00 (0.17, 5.83)2vs1 -3.00 (-6.17, 0.17)
DBP, men 12 months1. (41) -2 (-3.6, -0.4)2. (45) -2 (-3.8, -0.2)3. (42) -2 (-3.9, -0.1)
Question 22: What is the evidence that weight loss directly affects high blood pressure?
Reference numbers refer to the Reference List in the Clinical Guidelines Report.
Reference Design Overweightdefined as:
Adjuvant therapy Intervention Drop-outtotal
Mean weightchange
(n) mean (95%CI)
BPBaseline
(n) mean (95%CI)
Blood pressurechange
(n) mean (95%CI)
Sideeffects/comments
4. (40) -1 (-2.6, 0.6)4vs1 1.00 (-0.58, 2.58)4vs2 1.00 (-0.68, 2.68)4vs3 1.00 (-0.73, 2.73)3vs1 0.00 (-1.73, 1.73)3vs2 0.00 (-1.82, 1.82)2vs1 0.00 (-1.68, 1.68)
DBP, women 12 months1. (34) -2 (-3.4, -0.6)2. (29) -3 (-4.9, -1.1)3. (35) -2 (-3.7, -0.3)4. (34) -2 (-3.7, -0.3)4vs2 1.00 (-0.76, 2.76)4vs3 0.00 (-1.67, 1.67)3vs1 0.00 (-1.53, 1.53)3vs2 1.00 (-0.76, 2.76)2vs1 -1.00 (-2.61, 0.61)
Diet and Exercise
Schuler405
Randomized: yesSelf-selected: noIncluded: non-overweightMean age: 53.5Mean weight: 26.5Female/Total: 0/113
includes non-overweight
Diet: yes<20% fatExercise: yesMax HR: 70%Behavioral: no
1. No intervention2. Low-fat diet and exercise
1. 4/57 (7%)2. 5/56 (9%)
1. (52) -0.2 mg/kg2
2. (40) -1.6 mg/kg2
BMI Change2vs1 -1.40 (-2.20, -0.60)
SBP1. (52) 128 (122.2, 133.8)2. (40) 128 (121.9, 134.1)
SBP1. (52) 128 (123.0, 133.0)2. (40) 129 (123.2, 134.8)2vs1 1.00 (-5.04, 7.04)
Page684
Randomized: unclearSelf-selected: unclearIncluded: non-overweight, subjects withimpaired glucosetoleranceMean age: 39Mean weight: not givenFemale/Total: ng/31
includes non-overweight
Diet: yesADA withincreased fiber tolose 0.5-1.0kg/wkBehavioral: no
1. No intervention2. Low-fat diet and exercise
1. 1/8 (12%)2. 5/23
(22%)
1. (7) -1.0 mg/kg2
2. (18) -1.0 mg/kg2
BMI 104 wks change2vs1 0.00 (-2.38, 2.38)
SBP1. (7) 138 (120.4, 155.6)2. (18)124 (116.5, 131.5)
DBP1. (7) 87 (78.7, 95.3)2. (18) 77 (71.5, 82.5)
SBP1. (7) 134 (118.3, 149.7)2. (18) 118 (110.5, 125.5)2vs1 -2.00 (-11.70, 7.70)
DBP1. (7) 92 (82.8, 101.2)2. (18) 76 (71.5, 80.5)2vs1 -6.00 (-11.82, -0.18)At 2 years
SBP 104 weeks1. (6) 129 (118.5, 139.5)2. (17) 118 (112.3, 123.7)2vs1 3.00 (-5.43, 11.43)

Question 22: What is the evidence that weight loss directly affects high blood pressure?
Reference numbers refer to the Reference List in the Clinical Guidelines Report.
Reference Design Overweightdefined as:
Adjuvant therapy Intervention Drop-outtotal
Mean weightchange
(n) mean (95%CI)
BPBaseline
(n) mean (95%CI)
Blood pressurechange
(n) mean (95%CI)
Sideeffects/comments
DBP 104 weeks1. (6) 87 (76.5, 97.5)2. (17) 74 (68.3, 79.7)2vs1 -3.00 (-9.20, 3.20)
Kanaley681
Randomized: unclearSelf-selected: unclearIncluded: BMI>29Mean age: 36Mean weight: 88.3Female/Total: 24/24
BMI >29 Diet: 2.1 MJ lessthan BMR
Exercise:1. encouraged2. 30 min x3/wkat Max HR 60-80%
Behavioral: no
1. Diet with informalexercise
2. Diet with formalexercise
overall5/24 (21%)
Weight in kg, lowerobesity1,2. (9) -7.7 (-13.4, -2.01)
Weight in kg, upperobesity1,2. (10) -9.2 (-15.3, -3.1)
SBP, lower body obesity1,2. (9) 111 (104.1, 117.9)
DBP, lower body obesity1,2. (9) 74 (69.4, 78.6)
SBP, upper body obesity1,2. (10) 118 (109.0, 127.0)
DBP, upper body obesity1,2. (10) 80 (73.2, 86.8)
SBP, lower body obesity1,2. (9) 105 (95.8, 114.2)
DBP, lower body obesity1,2. (9) 68 (63.4, 72.6)
SBP, upper body obesity1,2. (10) 115 (106.0,124.0)
DBP, upper body obesity1,2. (10) 74 (67.2, 80.8)
Formal vs informalexercise did notinfluence thechanges in BP ineither group.
Hellenius365
Randomized: unclearSelf-selected: noIncluded: includes non-overweightMean age: 46.2Mean weight: 25.3mg/kg2
Female/Total: 0/158
includes non-overweight
Diet: NCEP I
Exercise: yesgroups 3 and 430-45 min x3/wkMax HR: 60-80%
Behavioral: no
1. Control(no intervention)2. Diet alone3. Exercise alone4. Diet and exercise
1. 1/40 (2%)2. 0/403. 0/394. 0/39
BMI1. (39) 0.3 (0.1, 0.5)2. (40) -0.3 (-0.6, 0.03)3. (39) -0.3 (-0.5, -0.01)4. (39) -0.6 (-0.9, -0.3)
EOT BMI change4vs3 -0.30 (-0.57, -0.03)4vs2 -0.30 (-0.60, 0.00)4vs1 -0.90 (-1.15, -0.65)
SBP1. (39) 130 (126.0, 134.0)2. (40) 130 (124.8, 135.2)3. (39) 133 (127.2, 138.8)4. (39) 129 (124.9, 133.1)
DBP1. (39) 82 (79.3, 84.7)2. (40) 82 (79.5, 84.5)3. (39) 82 (78.9, 85.1)4. (39) 81 (78.5, 83.5)
SBP1. (39) -0.13 (-0.33, 0.07)2. (40) -0.19 (-0.49, 0.11)3. (39) -0.12 (-0.35, 0.11)4. (39) -0.45 (-0.77, -0.13)3vs1 0.01 (-0.20, 0.22)3vs2 0.07 (-0.19, 0.33)2vs1 -0.06 (-0.31, 0.19)4vs3 -0.33 (-0.60, -0.06)4vs2 -0.26 (-0.57, 0.05)4vs1 -0.32 (-0.58, -0.06)
Gordon70030
Randomized: unclearSelf-selected: yesIncluded: hypertensiveand moderately obeseMean age: 48Mean weight: 98Female/Total 38/55
Moderatelyobese
Diet: to lose 10%of baseline weightExercise: yesGroups 1 and 330-45 min,3-5x/wkMax HR: 60-85%Behavioral: no
4. Exercise training5. Diet6. Exercise and diet
4. 0/145. 2/176. 5/24
Weight (kg)4. (14) –1 (2.0.04)5. (15) –5.8 (-7.9, -3.6)6. (19) –7.1 (-8.5, -5.7)
SBP4. (14) 145 (138, 152)5. (15) 141 (133, 149)6. (19) 145 (139, 151)
DBP4. (14) 96 (91.3, 100.6)5. (15) 93 (89.1, 96.9)
SBP4. (14) –9.9 (-13.6, -6.2)5. (15) –11.3 (-18, -4.6)6. (19) –12.5 (-15.5, -9.5)
DBP4. (14) –5.9 (-8.6, -3.2)5. (15) –7.5 (-9.8, -5.1)

Question 22: What is the evidence that weight loss directly affects high blood pressure?
Reference numbers refer to the Reference List in the Clinical Guidelines Report.
Reference Design Overweightdefined as:
Adjuvant therapy Intervention Drop-outtotal
Mean weightchange
(n) mean (95%CI)
BPBaseline
(n) mean (95%CI)
Blood pressurechange
(n) mean (95%CI)
Sideeffects/comments
6. (19) 95 (91.6, 98.4) 6. (19) –7.9 (-9.9, -5.8)
1.
Stevens376
Randomized: unclearSelf-selected: unclearIncluded: 115-165%IBWhypertensionMean age: 42.5Mean weight: 89.7Female/Total: 179/564
115-165% Diet: yesgoal to lose max0.9 kg/2w
Exercise: yes30-45 min/4-5x/wmostly notsupervised
Behavioral: yesweekly x 14, thenqmo
2. Control (no intervention)3. Diet, behavioral and
exercise
not given Weight in kg, women2. (ns) -1.6 (n/a, n/a)
Weight in kg, men2. (ns) -4.7 (n/a, n/a)
DBP1. (256) 84 (83.6, 84.4)2. (308) 83.7 (83.4, 84.0)
SBP1. (256) 124.6 (123.6, 125.6)2.(308)124.3 (123.4, 125.2)
DBP1. (236) -3.8 (-4.6, -3.0)2. (295) -6.2 (-7.0, -5.4)2vs1 -2.40 (-3.20, -1.60)
DBP, men1. (151) -3.4 (-4.4, -2.4)2. (212) -6.4 (-7.2, -5.6)2vs1 -3.00 (-3.89, -2.11)
DBP, women1. (85) -4.5 (-5.9, -3.1)2. (83) -5.6 (-7.0, -4.2)2vs1 -1.10 (-2.49, 0.29)
SBP1. (236) -2.3 (-3.3, -1.3)2. (295) -5.3 (-6.1, -4.5)2vs1 -3.00 (-3.82, -2.18)
SBP, men1. (151) -2.7 (-3.9, -1.5)2. (212) -5.8 (-6.6, -5.0)2vs1 -3.10 (-4.08, -2.12)
SBP, women1. (85) -1.7 (-3.7, 0.3)2. (83) -4 (-6.0, -2.0)2vs1 -2.30 (-4.29, -0.31)
DBP, >9.5 kg loss0. (ns) -9.4 (n/a, n/a)
DBP, 4.5-9.5 kg loss0. (ns) -6.9 (n/a, n/a)
DBP, 2.0-4.5 kg loss0. (ns) -5.2 (n/a, n/a)
DBP, 1.0-2.0 kg loss
The results showedthat for every kg ofweight loss DBPdecreased by 0.33mm Hg (p<0.001)and SBP decreasedby 0.43 mm Hg(p<0.001).
Linear regressionmodels identified asignificant trend(p<0.05) in therelationship ofchange in DBP andSBP with quintileof weight loss forboth men andwomen, althoughthe effect wassomewhatdiminished inwomen.

Question 22: What is the evidence that weight loss directly affects high blood pressure?
Reference numbers refer to the Reference List in the Clinical Guidelines Report.
Reference Design Overweightdefined as:
Adjuvant therapy Intervention Drop-outtotal
Mean weightchange
(n) mean (95%CI)
BPBaseline
(n) mean (95%CI)
Blood pressurechange
(n) mean (95%CI)
Sideeffects/comments
0. (ns) -4.4 (n/a, n/a)
DBP, <1.0 kg loss0. (ns) -3.3 (n/a, n/a)
SBP, <1.0 kg loss0. (ns) -1.4 (n/a, n/a)
SBP, 1.0-2.0 kg loss0. (ns) -2.5 (n/a, n/a)
SBP, 2.0-4.5 kg loss0. (ns) -4.8 (n/a, n/a)
SBP, >9.5 kg loss0. (ns) -8.4 (n/a, n/a)
Blonk470
Randomized: unclearSelf-selected: noIncluded: BMI>27diabetesMean age: ngMean weight: ngFemale/Total: ng/153
BMI>27 Diet: yes500 kcal less thanusual intake
Exercise: yes60 min dailyMax HR 60-80%
Behavioral: yesq4mo
1. Conventional dietprogram (diet counselingalone)
2. Comprehensive diet,behavioral and exerciseprogram
1. 4/26(15%)
2. 3/27(11%)
Weight in kg2vs1 -1.3 (-3.3, 0.7)
Not given SBP2vs1 -5.0 (-4.0, 13.0)
DBP2vs1 -0.1 (-5.0, 5.0)
Wood380
Randomized: unclearSelf-selected: yesIncluded: BMI 28-34 forpremenopausal womenand 24-30 for menMean age: 39.7Mean weight: 86.7Female/Total: 132/264
BMI >24 Diet: NCEP I
Exercise: yes 45 min x3Max HR: 60-80%
Behavioral: no
1. No intervention2. Diet alone3. Diet and exercise
overall27/264(10%)
Weight in kg, men1. (40) 1.7) (0.2, 3.2)2. (40) -5.1) (-7.0, -3.2)3. (39) -8.7) (-10.5, -6.9)
EOT Weight, men2vs1 -6.80(-8.48, -5.12)3vs1 -10.40(-12.03, -8.77)3vs2 -3.6 (-5.4, -1.8)
Weight in kg, women1. (39) 1.3 (-0.4, 3.0)
SBP, men1. (40) 0.1 (-2.4, 2.6)2. (40) -4.1 (-6.7, -1.5)3. (39) -5.4 (-8.1, -2.7)2vs1 -4.20 (-6.71, -1.69)3vs1 -5.50 (-8.06, -2.94)3vs2 -1.30 (-3.91, 1.31)
DBP, men1. (40) 2.1 (0.5, 3.7)2. (40) -2.4 (-4.5, -0.3)3. (39) -4.9 (-6.7, -3.1)

Question 22: What is the evidence that weight loss directly affects high blood pressure?
Reference numbers refer to the Reference List in the Clinical Guidelines Report.
Reference Design Overweightdefined as:
Adjuvant therapy Intervention Drop-outtotal
Mean weightchange
(n) mean (95%CI)
BPBaseline
(n) mean (95%CI)
Blood pressurechange
(n) mean (95%CI)
Sideeffects/comments
2. (31) -4.1 (-6.1, -2.1)3. (42) -5.1 (-6.8, -3.4)
EOT Weight, women2vs1 -5.40 (-7.20, -3.60)3vs1 -6.80 (-29.61, 16.01)3vs2 -1.00 (-25.27, 23.27)
2vs1 -4.50 (-6.34, -2.66)3vs1 -7.00 (-8.67, -5.33)3vs2 -2.50 (-4.43, -0.57)
SBP, women1. (39) -0.2 (-2.3, 1.9)2. (31) -4.1 (-6.3, -1.9)3. (42) -3.6 (-6.0, -1.2)2vs1 -3.90 (-6.01, -1.79)3vs1 -3.40 (-5.63, -1.17)3vs2 0.50 (-1.78, 2.78)
DBP, women1. (39) 0.9 (-0.8, 2.6)2. (31) -2.2 (-4.1, -0.3)3. (42) -2 (-3.3, -0.7)2vs1 -3.10 (-4.86, -1.34)3vs1 -2.90 (-4.38, -1.42)3vs2 0.20 (-1.35, 1.75)
Svendsen384
Randomized: unclearSelf-selected: unclearIncluded: BMI >25Mean age: ngMean weight: 77.8Female/Total: 121/121
BMI>25 Diet: 4.2 MJ/d
Exercise: yes90 min x3Max HR: ng
Behavioral: no
1. Control (no diet, exercise)2. Diet alone3. Diet + exercise
none Weight in kg1. (20) 0.5 (95%CI -0.3,
1.3)2. (50) -9.5 (95%CI -10.3, -
8.7)3. (48) -10.3 (95%CI -11.2,
9.4)
EOT change scores3vs2 -0.80 (-1.64, 0.04)2vs1 -10.00 (-10.79, -9.21)3vs1 -10.80 (-11.68, -9.94)
SBP1. (21) 129 (125.4, 132.6)2. (51) 129 (124.8, 133.2)3. (49) 128 (122.8, 133.2)
DBP1. (21) 80 (76.4, 83.6)2. (51) 79 (76.5, 81.5)3. (49) 79 (76.1, 81.9)
SBP1. (20) -2 (-7.1, 3.1)2. (50) -13 (-16.0, -9.6)3. (48) -11 (-14.2, -7.8)
DBP1. (20) -4 (-7.3, -0.7)2. (50) -7 (-9.3, -4.7)3. (48) -9 (-11.3, -6.7)
Wing473
Randomized: unclearSelf-selected: unclearIncluded: >120% IBWdiabetesMean age: 55Mean weight: 103Female/Total: 42/55
>120% IBW Diet: ADA to lose1 kg/wk
Exercise: yesgroups 2: 2x/wkgroup 4: 3-5x/wk60 min/3 x10wthen monthlyMax HR: ngBehavioral: yes
1. Diet plus placeboexercise
2. Diet plus moderateexercise
Duration: 10 weekintensive then up to 24weeks of maintenance
Study 23. Diet alone (study 2)
1. 1/13 (7%)2. 2/12
(17%)3. 0/15 (0%)4. 2/15
(13%)
Weight in kg (week 10)1. (12) -7.32. (10) -8.53. (15) -5.64. (13) -9.3
Weight in kg 12 months1. (11) -4 (-8.2, 0.2)2. (8) -7.8 (-16.5, 0.9)3. (15) -3.8 (-14.9, 7.3)
SBP1. (12) 140 (133.4, 146.6)2. (10) 137 (130.2, 143.8)
DBP1. (12) 87 (82.6, 91.4)2. (10) 86 (81.5, 90.5)
SBP3. (15) 141 (128.1, 153.9)4. (13) 132 (121.1, 142.9)
SBP at 10 weeks1. (12) 127 (118.2, 135.8)2. (10) 126 (121.5, 130.5)
DBP at 10 weeks1. (12) 79 (76.8, 81.2)2. (10) 80 (75.5, 84.5)
SBP at 10 weeks3. (15) 135 (122.1, 147.9)4. (13) 130 (119.1, 140.9)
Question 22: What is the evidence that weight loss directly affects high blood pressure?
Reference numbers refer to the Reference List in the Clinical Guidelines Report.
Reference Design Overweightdefined as:
Adjuvant therapy Intervention Drop-outtotal
Mean weightchange
(n) mean (95%CI)
BPBaseline
(n) mean (95%CI)
Blood pressurechange
(n) mean (95%CI)
Sideeffects/comments
q2wx10,qmo 4. Diet and more intensiveexercise (study 2)
4. (13) -7.9 (-22, 6.3)DBP3. (15) 84 (77.6, 90.4)4. (13) 80 (73.5, 86.5)
DBP at 10 weeks3. (15) 85 (76.4, 93.6)4. (13) 83 (78.6, 87.4)
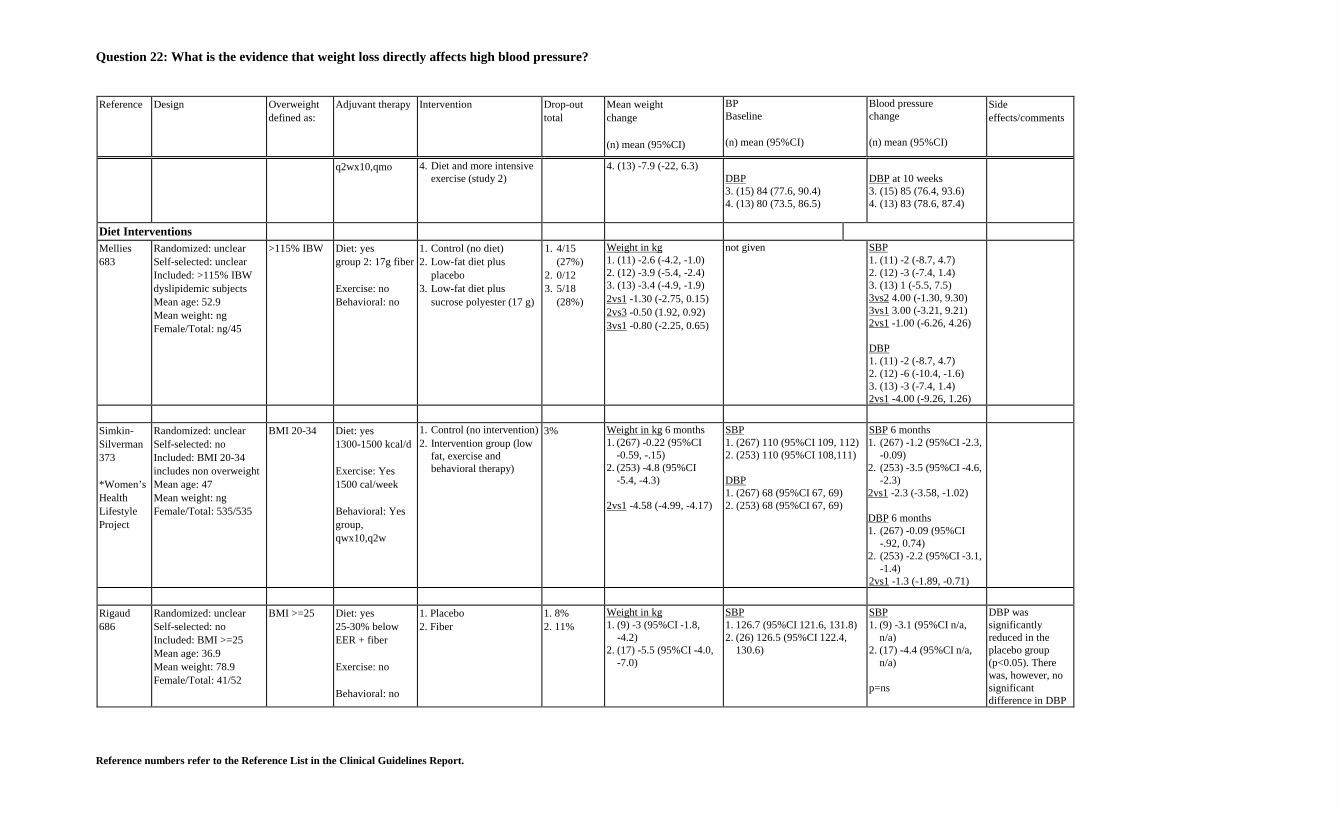
Diet InterventionsMellies683
Randomized: unclearSelf-selected: unclearIncluded: >115% IBWdyslipidemic subjectsMean age: 52.9Mean weight: ngFemale/Total: ng/45
>115% IBW Diet: yesgroup 2: 17g fiber
Exercise: noBehavioral: no
1. Control (no diet)2. Low-fat diet plus
placebo3. Low-fat diet plus
sucrose polyester (17 g)
1. 4/15(27%)
2. 0/123. 5/18
(28%)
Weight in kg1. (11) -2.6 (-4.2, -1.0)2. (12) -3.9 (-5.4, -2.4)3. (13) -3.4 (-4.9, -1.9)2vs1 -1.30 (-2.75, 0.15)2vs3 -0.50 (1.92, 0.92)3vs1 -0.80 (-2.25, 0.65)
not given SBP1. (11) -2 (-8.7, 4.7)2. (12) -3 (-7.4, 1.4)3. (13) 1 (-5.5, 7.5)3vs2 4.00 (-1.30, 9.30)3vs1 3.00 (-3.21, 9.21)2vs1 -1.00 (-6.26, 4.26)
DBP1. (11) -2 (-8.7, 4.7)2. (12) -6 (-10.4, -1.6)3. (13) -3 (-7.4, 1.4)2vs1 -4.00 (-9.26, 1.26)
Simkin-Silverman373
*Women’sHealthLifestyleProject
Randomized: unclearSelf-selected: noIncluded: BMI 20-34includes non overweightMean age: 47Mean weight: ngFemale/Total: 535/535
BMI 20-34 Diet: yes1300-1500 kcal/d
Exercise: Yes1500 cal/week
Behavioral: Yesgroup,qwx10,q2w
1. Control (no intervention)2. Intervention group (low
fat, exercise andbehavioral therapy)
3% Weight in kg 6 months1. (267) -0.22 (95%CI
-0.59, -.15)2. (253) -4.8 (95%CI
-5.4, -4.3)
2vs1 -4.58 (-4.99, -4.17)
SBP1. (267) 110 (95%CI 109, 112)2. (253) 110 (95%CI 108,111)
DBP1. (267) 68 (95%CI 67, 69)2. (253) 68 (95%CI 67, 69)
SBP 6 months1. (267) -1.2 (95%CI -2.3,
-0.09)2. (253) -3.5 (95%CI -4.6,
-2.3)2vs1 -2.3 (-3.58, -1.02)
DBP 6 months1. (267) -0.09 (95%CI
-.92, 0.74)2. (253) -2.2 (95%CI -3.1,
-1.4)2vs1 -1.3 (-1.89, -0.71)
Rigaud686
Randomized: unclearSelf-selected: noIncluded: BMI >=25Mean age: 36.9Mean weight: 78.9Female/Total: 41/52
BMI >=25 Diet: yes25-30% belowEER + fiber
Exercise: no
Behavioral: no
1. Placebo2. Fiber
1. 8%2. 11%
Weight in kg1. (9) -3 (95%CI -1.8,
-4.2)2. (17) -5.5 (95%CI -4.0,
-7.0)
SBP1. 126.7 (95%CI 121.6, 131.8)2. (26) 126.5 (95%CI 122.4,
130.6)
SBP1. (9) -3.1 (95%CI n/a,
n/a)2. (17) -4.4 (95%CI n/a,
n/a)
p=ns
DBP wassignificantlyreduced in theplacebo group(p<0.05). Therewas, however, nosignificantdifference in DBP
Question 22: What is the evidence that weight loss directly affects high blood pressure?
Reference numbers refer to the Reference List in the Clinical Guidelines Report.
Reference Design Overweightdefined as:
Adjuvant therapy Intervention Drop-outtotal
Mean weightchange
(n) mean (95%CI)
BPBaseline
(n) mean (95%CI)
Blood pressurechange
(n) mean (95%CI)
Sideeffects/comments
between the fiber-treated group 74.4,SEM ,1.4 and theplacebo 75.0,SEM,1.8.
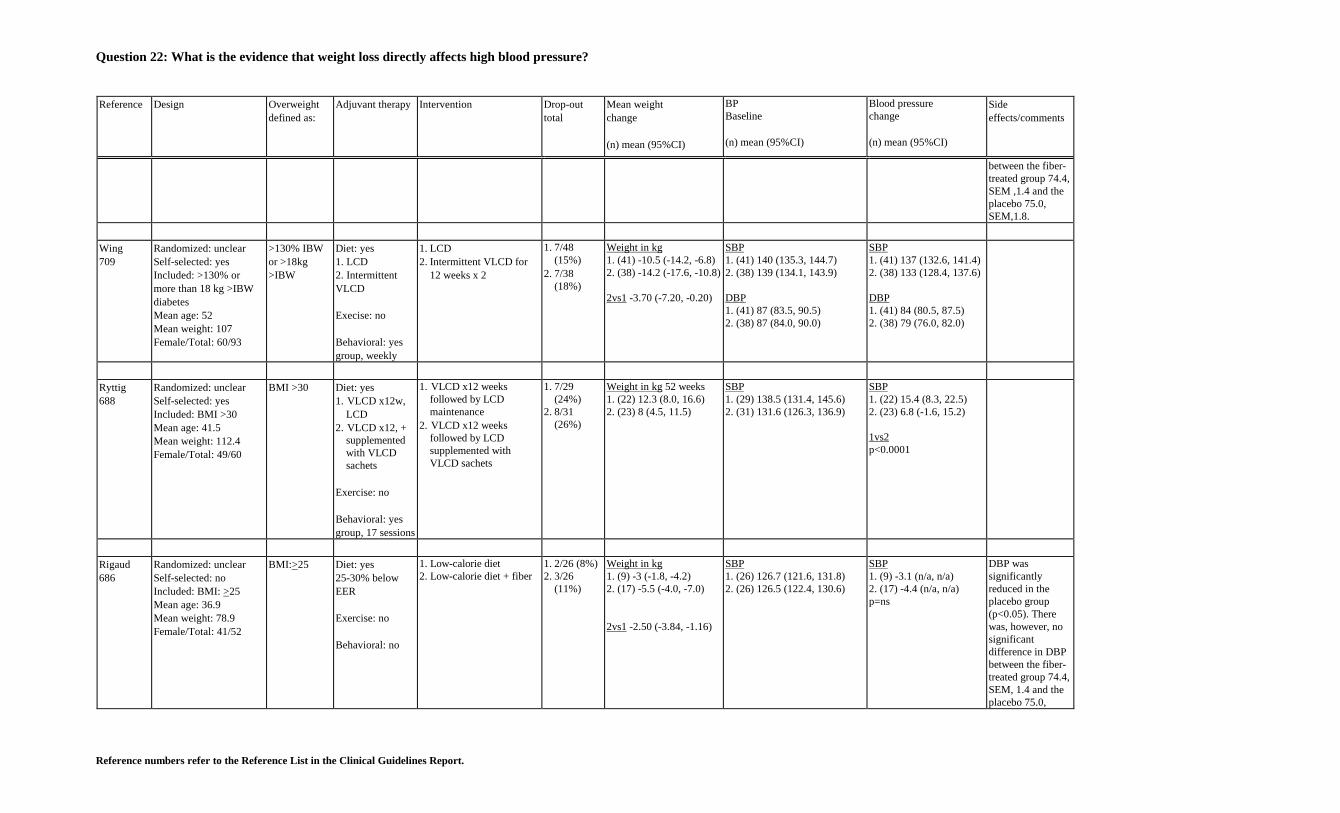
Wing709
Randomized: unclearSelf-selected: yesIncluded: >130% ormore than 18 kg >IBWdiabetesMean age: 52Mean weight: 107Female/Total: 60/93
>130% IBWor >18kg>IBW
Diet: yes1. LCD2. IntermittentVLCD
Execise: no
Behavioral: yesgroup, weekly
1. LCD2. Intermittent VLCD for
12 weeks x 2
1. 7/48(15%)
2. 7/38(18%)
Weight in kg1. (41) -10.5 (-14.2, -6.8)2. (38) -14.2 (-17.6, -10.8)
2vs1 -3.70 (-7.20, -0.20)
SBP1. (41) 140 (135.3, 144.7)2. (38) 139 (134.1, 143.9)
DBP1. (41) 87 (83.5, 90.5)2. (38) 87 (84.0, 90.0)
SBP1. (41) 137 (132.6, 141.4)2. (38) 133 (128.4, 137.6)
DBP1. (41) 84 (80.5, 87.5)2. (38) 79 (76.0, 82.0)
Ryttig688
Randomized: unclearSelf-selected: yesIncluded: BMI >30Mean age: 41.5Mean weight: 112.4Female/Total: 49/60
BMI >30 Diet: yes1. VLCD x12w,
LCD2. VLCD x12, +
supplementedwith VLCDsachets
Exercise: no
Behavioral: yesgroup, 17 sessions
1. VLCD x12 weeksfollowed by LCDmaintenance
2. VLCD x12 weeksfollowed by LCDsupplemented withVLCD sachets
1. 7/29(24%)
2. 8/31(26%)
Weight in kg 52 weeks1. (22) 12.3 (8.0, 16.6)2. (23) 8 (4.5, 11.5)
SBP1. (29) 138.5 (131.4, 145.6)2. (31) 131.6 (126.3, 136.9)
SBP1. (22) 15.4 (8.3, 22.5)2. (23) 6.8 (-1.6, 15.2)
1vs2p<0.0001
Rigaud686
Randomized: unclearSelf-selected: noIncluded: BMI: >25Mean age: 36.9Mean weight: 78.9Female/Total: 41/52
BMI:>25 Diet: yes25-30% belowEER
Exercise: no
Behavioral: no
1. Low-calorie diet2. Low-calorie diet + fiber
1. 2/26 (8%)2. 3/26
(11%)
Weight in kg1. (9) -3 (-1.8, -4.2)2. (17) -5.5 (-4.0, -7.0)
2vs1 -2.50 (-3.84, -1.16)
SBP1. (26) 126.7 (121.6, 131.8)2. (26) 126.5 (122.4, 130.6)
SBP1. (9) -3.1 (n/a, n/a)2. (17) -4.4 (n/a, n/a)p=ns
DBP wassignificantlyreduced in theplacebo group(p<0.05). Therewas, however, nosignificantdifference in DBPbetween the fiber-treated group 74.4,SEM, 1.4 and theplacebo 75.0,

Question 22: What is the evidence that weight loss directly affects high blood pressure?
Reference numbers refer to the Reference List in the Clinical Guidelines Report.
Reference Design Overweightdefined as:
Adjuvant therapy Intervention Drop-outtotal
Mean weightchange
(n) mean (95%CI)
BPBaseline
(n) mean (95%CI)
Blood pressurechange
(n) mean (95%CI)
Sideeffects/comments
SEM, 1.8.
Jalkanen400
Randomized: unclearSelf-selected: noIncluded: BMI 27-34hypertensionMean age: 49Mean weight: 83Female/Total: ng/50
BMI 27-34 Diet: yes1. n/a2. 1000-1500 kcal
Exercise: yeslectures
Behavioral: yesgroup, qwx24,q3w
1. Control (no diet oradvice)
2. Intervention program
Duration: 52 weeks
overall1/50 (2%)
Weight in kg1. (25) 02. (24) -4
2vs1 -4 (-9.32, 1.32)
SBP1. (25) 155 (149.2, 160.8)2. (24) 152 (144.8, 159.2)
DBP1. (25) 102 (99.1, 104.9)2. (24) 101 (97.6, 104.4)
SBP1. (25) 140 (133.4, 146.6)2. (24) 144 (135.6, 152.4)
DBP1. (25) 91 (88.1, 93.9)2. (24) 90 (85.8, 94.2)
Puddey370
Randomized: unclearSelf-selected: yesIncluded: BMI >120%IBWMean age: 44.3Mean weight: 92.5Female/Total: 0/86
>120% IBW Diet: yes1000-1500±ETOH
Exercise: no
Behavioral: no
1. Normal diet and normalalcohol intake
2. Hypocaloric diet andnormal alcohol intake
3. Normal diet and reducedalcohol intake
4. Hypocaloric diet andreduced alcohol intake
20% Weight in kg2. (ns) -7 (95%CI-5.4,
-8.5)3. (ns) -1.7 (95%CI -0.4,
-3.0)4. (ns) -9.6 (95%CI -7.9,
-11.3)
SBP, supine2. (20) 136.0 (95%CI 130.2,
141.8)3. (22) 136.8 (95%CI 133.1,
140.5)4. (21) 137.6 (95%CI 134.2,
141.1)5. (23) 139.1 (95%CI 135.3,
142.8)
DBP, supine1. (20) 85.5 (95%CI 80.7,88.2)2. (22) 85 (95%CI 81.9, 88.1)3. (21) 83.8 (95%CI 80.6, 87.1)4. (23) 85.6 (95%CI 83.0, 88.3)
DBP, supine2. (22) -4.2 (95%CI -6.2,
-2.2)3. (21) -3.3 (95%CI -5.2,
-1.3)4. (23) -7.5 (95%CI n/a,
n/a)
SBP, standing2. (22) -9.2 (95%CI -12.2,
-6.2)3. (21) -5.1 (95%CI -8.1,
-2.1)4. (23) -14.3 (95%CI n/a,
n/a)
SBP, standing2. (22) -9.2 (-12.2, -6.2)3. (21) -5.1 (-8.1, -2.1)4. (23) -14.3 (n/a, n/a)
DBP, standing2. (22) -4.8 (-7.0, -2.6)3. (21) -4.2 (-5.0, -0.6))4. (23) -7.5 (n/a, n/a)
Both caloricreduction andalcohol restrictionresulted indecreases in bothsystolic anddiastolic BP.Of the subjectswith elevated DBPidentified atbaseline 100% ofthose whodecreased bothcaloric and alcoholintake developednormal DBPcompared to 80%for group 2 and75% for group 3and 57% for group1. Similarly forSBP, 80%, 40%,63% and 43%,respectively.Baseline weightcorrelated withchange in neither

Question 22: What is the evidence that weight loss directly affects high blood pressure?
Reference numbers refer to the Reference List in the Clinical Guidelines Report.
Reference Design Overweightdefined as:
Adjuvant therapy Intervention Drop-outtotal
Mean weightchange
(n) mean (95%CI)
BPBaseline
(n) mean (95%CI)
Blood pressurechange
(n) mean (95%CI)
Sideeffects/comments
SBP nor DBP butchange in weightwas stronglycorrelated withchange in bothSBP and DBP (r-0.49, p<0.001 andr=0.49, p<0.001)
Walker693
Randomized: unclearSelf-selected: unclearIncluded: diabetes,includes non-overweightMean age: 58.3Mean weight: 79.8Female/Total: 15/48
not given Diet: yes1. HCLF2. Modified fat
Exercise: no
Behavioral: no
1. High-CHO/low-fat diet2. Modified fat diet
*Cross-over1 month wash-out period
Duration: 12 weeks
none Weight in kg1. (24) -0.72. (24) -1.3
2vs1 -0.6 (-0.77, -1.43)
SBP1. (24) 132 (125.8, 138.2)2. (24) 133 (126.8, 139.2)
DBP1. (24) 75 (68.8, 81.2)2. (24) 77 (72.9, 81.1)
SBP1. (24) 130 (121.7, 138.3)2. (24) 134 (125.7, 142.3)
DBP1. (24) 74 (69.9, 78.1)2. (24) 76 (71.9, 80.1)
Lean70219
Randomized: unclearSelf-selected: unclearIncluded: BMI >25 kg/m2
Mean age: 50.6Mean weight: 84.4Female/Total: 110/110
Not given Exercise: noBehavioral: no
Group description1. Low carbohydrate diet2. High carbohydrate diet
Not given Weight (kg)1. (40) –6.8 (-8.4, -5.2)2. (42) –5.6 (-7.1, -4.1)
2vs1 1.2 (-0.33, 2.73)
SBP1. (48) 135.7 (129, 143)2. (51) 136.7 (131, 143)
DBP1. (48) 86 (82.6, 89.4)2. (51) 84.2 (81, 88)
SBP1. (36) –0.3 (-6.1, 5.6)2. (38) –1.1 (-6.6, 4.4)
DBP1. (36) –2.3 (-6.1, 1.5)2. (38) –2.7 (-6.4, 1.1)
Katzel369
Randomized: yesSelf-selected: yesIncluded: 120-160%IBW, non-smokersMean age: 61Mean weight: 91.07Female/Total: 0/170
120-160%IBW
Diet: yes1260-2100 kcal
Exercise: yes45 minx3
Behavioral: no
Group description1. Control2. Weight loss3. Aerobic exercise
Duration: 9 months
2. 8/26(31%)
3. 25/73(34%)
4. 19/71(27%)
Weight in kg2. (44)- 9.5 (-8.1, -10.9)
SBP2. (73) 132 (128.0, 136.0)3. (71) 128 (124.0, 132.0)
DBP2. (73) 83 (81.0, 85.0)3. (71) 86 (82.0, 90.0)
SBP2. (44) -8%, p<0.013. (49) -3%, p,0.023vs1 p=ns
DBP2. (44) -8%, p<0.013. (49) -2%, p<0.023vs1 p=ns
Jeffery680
Randomized: unclearSelf-selected: noIncluded: 10-50%
10-50%desirableweight
Diet: yesReduce intake,low salt diet.
1. Group treatment2. Individual counselling
1. 5/47(10.6%)
2. 7/47
Weight in kg1. (42) -6 (-7.0, -5.0)2. (40) -5.7 (-6.6, -4.8)
SBP1. (42) 134.5 (131.0, 138.0)2. (40) 135.8 (133.5, 138.1)
SBP1. (42) -9.1 (-13.1, -5.1)2. (40) -7 (-10.2, -3.8)

Question 22: What is the evidence that weight loss directly affects high blood pressure?
Reference numbers refer to the Reference List in the Clinical Guidelines Report.
Reference Design Overweightdefined as:
Adjuvant therapy Intervention Drop-outtotal
Mean weightchange
(n) mean (95%CI)
BPBaseline
(n) mean (95%CI)
Blood pressurechange
(n) mean (95%CI)
Sideeffects/comments
desirable weight, highnormal blood pressureMean age: ngMean weight: ngFemale/Total: ng/94
Exercise: noBehavioral: no
(14.9%)2vs1 -0.30 (-1.24, -0.64) DBP
1. (42) 85 (82.9, 87.1)2. (40) 83.8 (81.9, 85.7)
2vs1 2.10 (-1.48, 5.68)
DBP1. (42) -4.8 (-7.7, -1.9)2. (40) -5.4 (-7.5, -3.3)2vs1 -0.6 (-3.10, 1.90)
Singh689
Randomized: yesSelf-selected: yesIncluded: hypertensionMean age: 47.0Mean weight: 66.7Female/Total: ng/217
BMI:>25 Diet: yes1. 2100 kcal2.1600 kcalExercise: noBehavioral: no
1. Usual diet2. Low-calorie, low-
cholesterol, low-salt diet
none Weight in kg1. (109) -0.8 (95%CI n/a,
n/a)2. (108) -3.6 (95%CI n/a,
n/a)net change: 2.8 (95%CI1.5, 4.1)
Weight in kg, inoverweight patients1. (83) -1.82. (82) -4.2net change: 2.4 (95%CI0.44, 4.36)
SBP1. (108) 154.8 (152.5, 157.1)2. (108) 152.5 (150.6, 154.4)
DBP1. (108) 100.5 (99.6, 101.4)2. (108) 99.6 (98.2, 101.0)
SBP, in overweight patients1. (83) 161.8 (95%CI 159.7,
163.9)2. (82) 160.8 (95%CI 159.2,
162.4)
DBP, in overweight patients1. (83) 97.5 (95%CI 95.4, 99.6)2. (82) 106.8 (95%CI 105.2,108.4)
SBP1. (109) -3 (n/a, n/a)2. (108) -10.5 (n/a, n/a)p<.01net change: 7.5 (3.47,11.52)
DBP1. (109) -1.5 (n/a, n/a)2. (108) -8 (n/a, n/a)p<.01net change: 6.5 (3.33,9.67)
SBP, in overweightpatients1. (83) -6.7 (95%CI n/a,
n/a)2. (82) -18.1 (95%CI n/a,
n/a)net change: 12.1 (4.57,27.15)DBP, in overweightpatients1. (83) -3.6 (95%CI n/a,
n/a)2. (82) -13.6 (95%CI n/a,
n/a)net change: 10.0(95%CI3.86, 16.14)
Results:2.8 kg netreduction in meanbody weight and 1kg/m2 decrease inmean BMI at 16weeks produced asignificantlygreater reduction(7.6/6.5 mm Hg) inSBP and DBP thandid drug therapyand placebo in thecontrol group.
Gordon70030
Randomized: unclearSelf-selected: yesIncluded:postmenopausal women,
not given Diet: none forgroup 2Exercise: yes30-45 min, 3-
7. Exercise training8. Diet9. Exercise and diet
7. 0/148. 2/179. 5/24
Weight (kg)7. (14) –1 (2.0.04)8. (15) –5.8 (-7.9, -3.6)9. (19) –7.1 (-8.5, -5.7)
SBP7. (14) 145 (138, 152)8. (15) 141 (133, 149)9. (19) 145 (139, 151)
SBP7. (14) –9.9 (-13.6, -6.2)8. (15) –11.3 (-18, -4.6)9. (19) –12.5 (-15.5, -9.5)

Question 22: What is the evidence that weight loss directly affects high blood pressure?
Reference numbers refer to the Reference List in the Clinical Guidelines Report.
Reference Design Overweightdefined as:
Adjuvant therapy Intervention Drop-outtotal
Mean weightchange
(n) mean (95%CI)
BPBaseline
(n) mean (95%CI)
Blood pressurechange
(n) mean (95%CI)
Sideeffects/comments
included non-overweightMean age: not givenMean weight: 79.7Female/Total 40/40
5x/wkMax HR: 60-85%Behavioral: no
DBP7. (14) 96 (91.3, 100.6)8. (15) 93 (89.1, 96.9)9. (19) 95 (91.6, 98.4)
DBP7. (14) –5.9 (-8.6, -3.2)8. (15) –7.5 (-9.8, -5.1)9. (19) –7.9 (-9.9, -5.8)
Croft347
Randomized: unclearSelf-selected: noIncluded BMI: >25hypertensionMean age: ngMean weight: 85.7Female/Total: 103/210
BMI >25 Diet: yesnot described
Exercise: noBehavioral: no
1. Hypertensive with nodietary intervention
2. Hypertensive with weightreduction diet
3. Normotensive withweight reductionintervention (notrandomized)
1. 3/64 (5%)2. 17/66
(26%)3. 47/80
(59%)
Weight in kg1. (64) -0.22. (66) -6.53. (80) -3.22vs1 p<0.001Weight in kg1. (compl, 50) +0.52. (compl, 47) -8.02vs1 p<0.001
SBP1. (64) 161 (95%CI n/a, n/a)2. (66) 161 (95%CI n/a, n/a)
DBP1. (64) 96 (95%CI n/a, n/a)2. (66) 98 (95%CI n/a, n/a)
SBP1. (compl, 50) 158 (95%CI n/a,
n/a)2. (compl, 47) 160 (95%CI n/a,
n/a)
DBP1. (compl, 50) 94 (95%CI n/a,
n/a)2. (compl, 47) 97 (95%CI n/a,
n/a)
SBP1. (64) -42. (66) -112vs1 p<0.01
DBP1. (64) -52. (66) -72vs1 p<0.001
SBP1. (compl, 50) -32. (compl, 47) -132vs1 p<0.01
DBP1. (compl, 50) 02. (compl, 47) -92vs1 p<0.001
Commencedantihypertensivetherapy before 6months:group 1: 5/64group 2: 2/66group 3: 0/80
* 6 patients of thenon-dieting group(1) expressed aspontaneous wishto lose weight(data not givenseparately for theseindividuals)
MacMahon356
Randomized: unclearSelf-selected: noIncluded BMI: >26hypertensionMean age: 42Mean weight: 97.1Female/Total: 14/56
BMI: >26 Diet: yesGr 2 low-calorieExercise: noBehavioral: no
1. Placebo (no diet)2. Low-calorie diet3. Metoprolol 100 mg bid.
(no diet)
1. 2/18(11%)2. 1/20 (5%)3. 1/18 (5%)
Weight in kg1. (18) +.5 (n/a, n/a)2. (20) -7.1 (n/a, n/a)3. (18) -2.0 (n/a, n/a)2vs1 p<0.053vs1 p=ns
SBP1. (18) 150.3 (144.7, 155.9)2. (20) 149.8 (145.2, 154.4)3. (18) 151.2 (146.2, 156.2)
DBP1. (18) 98.9 (94.2, 103.6)2. (20) 101.2 (98.7, 103.7)3. (18) 100.9 (98.5, 103.3)
SBP1. (18) 142.9 (n/a, n/a)2. (20) 136.5 (n/a, n/a)3. (18) 141.3 (n/a, n/a)2vs1 p<.053vs1 not sig
DBP1. (18) 95.8 (n/a, n/a)2. (20) 91.2 (n/a, n/a)3. (18) 94.7 (n/a, n/a)2vs1 p<.053vs1 p not sig
ResultsIn the weightreduction group,the changes in SBPand DBP wereclosely correlatedwith the change inweight (SBPr=0.73, DBPr=0.68)At the end offollow-up, 50% ofsubjects in theweight reductiongroup, 39% in

Question 22: What is the evidence that weight loss directly affects high blood pressure?
Reference numbers refer to the Reference List in the Clinical Guidelines Report.
Reference Design Overweightdefined as:
Adjuvant therapy Intervention Drop-outtotal
Mean weightchange
(n) mean (95%CI)
BPBaseline
(n) mean (95%CI)
Blood pressurechange
(n) mean (95%CI)
Sideeffects/comments
metoprolol and17% in placebohad DBP <90.
The reductions inblood pressure bymetoprolol did notdiffer significantlyfrom placebo (notbecause of non-compliance)
Andersson675
Randomized: unclearSelf-selected: unclearIncluded: hypertensionMean age: 51Mean weight: 97.1Female/Total: 0/30
not stated Diet: yes1. no saltrestriction2. salt restrictionExercise: noBehavioral: no
1. Energy restricted only2. Energy restricted and salt
restricted
not given Weight in kg1. (13) -9.2 (n/a, n/a)2. (10) -8.8 (n//a, n/a)
2vs1 0.4 (-5.39, 6.19)
SBP1. (13) 151.1 (142.5, 159.7)2. (10) 151.1 (139.4, 162.8)
DBP1. (13) 89.5 (84.8, 94.2)2. (10) 88.6 (81.6, 95.6)
SBP1. (13) 146.4 (137.5,
155.3)2. (10) 138 (126.9, 149.1)
DBP1. (13) 84.5 (81.1, 87.9)2. (10) 79 (73.4, 84.6)
Haynes351
Randomized: yesSelf-selected: noIncluded: >110% IBW,hypertensionMean age: ngMean weight: 91.8Female/Total: ng/60
>110% IBW Diet: yesCaloric restrictionto lose 1lb/w x8w,then1/2 lb/wExercise: noBehavioral: yesgroup weekly
1. Control (no diet)2. Low-calorie diet
1. 4/30(13%)
2. 2/30 (6%)
Weight in kg @ 6 months1. (24) -0.82. (27) -4.1p=0.018
SBP1. (30) 134.02. (30) 135.0
DBP1. (30) 88.92. (30) 91.3
SBP1. -0.2 mm Hz p=.2032. +4.8
DBP1. -0.12. +1.4 p=0.177measurements done athome by surprise
Fagerberg349
Randomized: unclearSelf-selected: unclearIncluded: >20-40%desirable weight,hypertensionMean age: 51Mean weight: 97.4Female/Total: 0/30
>20-40%desirableweight
Diet: yesLow-calorie1230 kcalExercise: noBehavioral: no
1. Normal energy andsodium intake for 4weeks then crossed overto a restricted diet andrestricted sodium intakefor 9 months
2. Energy restricted dietwith unchanged sodiumintake for 12 weeks
none Weight in kg1. (15) -8.3 (n/a, n/a)2. (15) -8.7 (n/a, n/a)
2vs1 -0.4 (-5.53, 4.73)
SBP1. (15) 155.5 (146.5, 164.5)2. (15) 151.7 (142.7, 160.7)
DBP1. (15) 101.3 (96.8, 105.8)2. (15) 98.7 (94.0, 103.4)
SBP1. (15) 138.8 (131.5,
146.1)2. (15) 148.3 (141.0,
155.6)
DBP1. (15) 90.5 (85.4, 95.6)2. (15) 94.6 (90.5, 98.7)

Question 22: What is the evidence that weight loss directly affects high blood pressure?
Reference numbers refer to the Reference List in the Clinical Guidelines Report.
Reference Design Overweightdefined as:
Adjuvant therapy Intervention Drop-outtotal
Mean weightchange
(n) mean (95%CI)
BPBaseline
(n) mean (95%CI)
Blood pressurechange
(n) mean (95%CI)
Sideeffects/comments
Langford355
Randomized: yesSelf-selected: unclearIncluded: 110-160%IBW, hypertensionMean age: 48Mean weight: 136Female/Total: 398/878
110-160%IBW
Diet: yeslow-calorie1-6, no Na/Krestriction7-9 Na 52-100 K 62-115
Exercise: noBehavioral: no
1. Usual diet plus placebo2. Usual diet plus
chlorthalidone 25 mg3. Usual diet plus atenolol
50 mg4. Weight loss diet plus
placebo5. Weight loss diet plus
chlorthalidone 25 mg6. Weight loss diet plus
atenolol 50 mg7. Low Na/High K diet plus
placebo8. Low Na/High K diet plus
chlorthalidone 25 mg9. Low Na/High K diet plus
atenolol 50 mg
not given Weight in kg1. (89) -0.6 (-1.3, 0.1)2. (87) -1.5 (-2.3, -0.7)3. (86) 0.5 (-0.1, 1.1)4. (88) -4.4 (-5.7, -3.1)5. (85) -6.8 (-7.8, -5.8)6. (88) -3 (-3.8, -2.2)7. (79) -0.4 (-1.5, 0.7)8. (88) -1 (-1.9, -0.1)9. (90) 0.5 (-0.1, 1.1)
4vs1 -3.80 (-4.84, -2.76)4vs2 -2.90 (-3.97, -1.83)4vs3 -4.9 (-5.91, -3.89)4vs7 -4 (-5.32, -2.68)
DBP1. (90) 93.7 (n/a, n/a)2. (87) 93.4 (n/a, n/a)3. (87) 93.7 (n/a, n/a)4. (90) 94 (n/a, n/a)5. (87) 93.7 (n/a, n/a)6. (88) 93.7 (n/a, n/a)7. (79) 94.4 (n/a, n/a)8. (89) 93.7 (n/a, n/a)9. (90) 94 (n/a, n/a)
4vs1 -0.82 (-33.09, 31.45)4vs2 2.00 (0.07, 3.93)4vs3 3.65 (1.72, 5.58)4vs7 -0.87 (-3.15, 1.41)
SBP1. (90) 144.5 (n/a, n/a)2. (87) 141.9 (n/a, n/a)3. (87) 142.8 (n/a, n/a)4. (90) 143.2 (n/a, n/a)5. (87) 141.0 (n/a, n/a)6. (88) 142.8 (n/a, n/a)7. (79) 144.9 (n/a, n/a)8. (89) 143.1 (n/a, n/a)9. (90) 146.3 (n/a, n/a)
DBP1. (90) -7.96 (-9.8, -6.2)2. (87) -10.78 (-12.3, -9.3)3. (87) -12.43 (-13.9,
-10.9)4. (90) -8.78 (-11.1, -6.5)5. (87) -15.06 (-16.9,
-13.2)6. (88) -14.81 (-16.7,
-12.9)7. (79) -7.91 (-10.2, -5.6)8. (89) -12.18 (-13.9,
-10.5)9. (90) -12.76 (-14.4,
-11.1)
SBP1. (90) -10.34 (n/a, n/a)2. (87) -17.41 (n/a, n/a)3. (87) -15.06 (n/a, n/a)4. (89) -11.49 (n/a, n/a)5. (86) -21.72 (n/a, n/a)6. (88) -18.11 (n/a, n/a)7. (79) -8.66 (n/a, n/a)8. (88) -19.51 (n/a, n/a)9. (90) -18.29 (n/a, n/a)
Berglund431
Randomized: noSelf-selected: unclearIncluded BMI: >26hypertensionMean age: 54Mean weight: 99Female/Total: 0/64
BMI>26 Diet: yesLow fat
Exercise: noBehavioral: no
1. Low salt, weight loss diet2. Atenolol
Overall3/64 (5%)
Weight in kg 12 months1. (31)-7.8 (n/a, n/a)2. (30) 1.0 n/a, n/a)
EOT Weight change2vs1 8.80(-4.36, 13.24)
SBP1. (31) 152 (95% CI 146.5,
157.5)2. (30) 155 (95% CI 150.1,
159.9)
DBP1. (31) 96 (95% CI 94.5, 97.5)2. (30) 97 (95% CI 95.1, 98.9)
SBP 12 months1. (31) 147 (95% CI 142
2, 151.8)2. (30) 140 (95% CI
134.0, 146.0)2vs1 10.00 (4.15, 15.85)
DBP 12 months1. (31) 92 (95%CI 89.3,
94.2. (30) 86 (95%CI 83.0,
89.0)2vs1 -7.00(-4.43, -9.57)
Question 22: What is the evidence that weight loss directly affects high blood pressure?
Reference numbers refer to the Reference List in the Clinical Guidelines Report.
Reference Design Overweightdefined as:
Adjuvant therapy Intervention Drop-outtotal
Mean weightchange
(n) mean (95%CI)
BPBaseline
(n) mean (95%CI)
Blood pressurechange
(n) mean (95%CI)
Sideeffects/comments
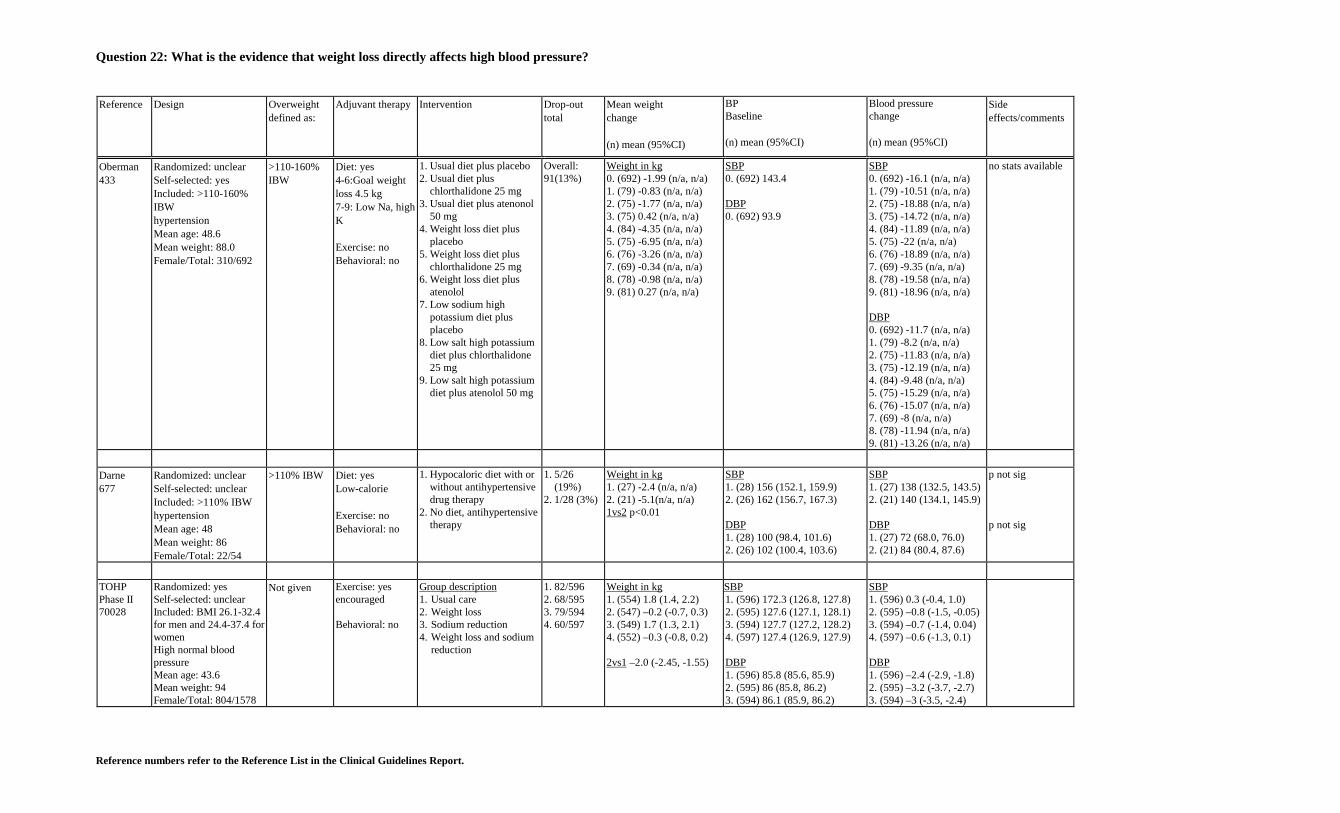
Oberman433
Randomized: unclearSelf-selected: yesIncluded: >110-160%IBWhypertensionMean age: 48.6Mean weight: 88.0Female/Total: 310/692
>110-160%IBW
Diet: yes4-6:Goal weightloss 4.5 kg7-9: Low Na, highK
Exercise: noBehavioral: no
1. Usual diet plus placebo2. Usual diet plus
chlorthalidone 25 mg3. Usual diet plus atenonol
50 mg4. Weight loss diet plus
placebo5. Weight loss diet plus
chlorthalidone 25 mg6. Weight loss diet plus
atenolol7. Low sodium high
potassium diet plusplacebo
8. Low salt high potassiumdiet plus chlorthalidone25 mg
9. Low salt high potassiumdiet plus atenolol 50 mg
Overall:91(13%)
Weight in kg0. (692) -1.99 (n/a, n/a)1. (79) -0.83 (n/a, n/a)2. (75) -1.77 (n/a, n/a)3. (75) 0.42 (n/a, n/a)4. (84) -4.35 (n/a, n/a)5. (75) -6.95 (n/a, n/a)6. (76) -3.26 (n/a, n/a)7. (69) -0.34 (n/a, n/a)8. (78) -0.98 (n/a, n/a)9. (81) 0.27 (n/a, n/a)
SBP0. (692) 143.4
DBP0. (692) 93.9
SBP0. (692) -16.1 (n/a, n/a)1. (79) -10.51 (n/a, n/a)2. (75) -18.88 (n/a, n/a)3. (75) -14.72 (n/a, n/a)4. (84) -11.89 (n/a, n/a)5. (75) -22 (n/a, n/a)6. (76) -18.89 (n/a, n/a)7. (69) -9.35 (n/a, n/a)8. (78) -19.58 (n/a, n/a)9. (81) -18.96 (n/a, n/a)
DBP0. (692) -11.7 (n/a, n/a)1. (79) -8.2 (n/a, n/a)2. (75) -11.83 (n/a, n/a)3. (75) -12.19 (n/a, n/a)4. (84) -9.48 (n/a, n/a)5. (75) -15.29 (n/a, n/a)6. (76) -15.07 (n/a, n/a)7. (69) -8 (n/a, n/a)8. (78) -11.94 (n/a, n/a)9. (81) -13.26 (n/a, n/a)
no stats available
Darne677
Randomized: unclearSelf-selected: unclearIncluded: >110% IBWhypertensionMean age: 48Mean weight: 86Female/Total: 22/54
>110% IBW Diet: yesLow-calorie
Exercise: noBehavioral: no
1. Hypocaloric diet with orwithout antihypertensivedrug therapy
2. No diet, antihypertensivetherapy
1. 5/26(19%)
2. 1/28 (3%)
Weight in kg1. (27) -2.4 (n/a, n/a)2. (21) -5.1(n/a, n/a)1vs2 p<0.01
SBP1. (28) 156 (152.1, 159.9)2. (26) 162 (156.7, 167.3)
DBP1. (28) 100 (98.4, 101.6)2. (26) 102 (100.4, 103.6)
SBP1. (27) 138 (132.5, 143.5)2. (21) 140 (134.1, 145.9)
DBP1. (27) 72 (68.0, 76.0)2. (21) 84 (80.4, 87.6)
p not sig
p not sig
TOHPPhase II70028
Randomized: yesSelf-selected: unclearIncluded: BMI 26.1-32.4for men and 24.4-37.4 forwomenHigh normal bloodpressureMean age: 43.6Mean weight: 94Female/Total: 804/1578
Not given Exercise: yesencouraged
Behavioral: no
Group description1. Usual care2. Weight loss3. Sodium reduction4. Weight loss and sodium
reduction
1. 82/5962. 68/5953. 79/5944. 60/597
Weight in kg1. (554) 1.8 (1.4, 2.2)2. (547) –0.2 (-0.7, 0.3)3. (549) 1.7 (1.3, 2.1)4. (552) –0.3 (-0.8, 0.2)
2vs1 –2.0 (-2.45, -1.55)
SBP1. (596) 172.3 (126.8, 127.8)2. (595) 127.6 (127.1, 128.1)3. (594) 127.7 (127.2, 128.2)4. (597) 127.4 (126.9, 127.9)
DBP1. (596) 85.8 (85.6, 85.9)2. (595) 86 (85.8, 86.2)3. (594) 86.1 (85.9, 86.2)
SBP1. (596) 0.3 (-0.4, 1.0)2. (595) –0.8 (-1.5, -0.05)3. (594) –0.7 (-1.4, 0.04)4. (597) –0.6 (-1.3, 0.1)
DBP1. (596) –2.4 (-2.9, -1.8)2. (595) –3.2 (-3.7, -2.7)3. (594) –3 (-3.5, -2.4)

Question 22: What is the evidence that weight loss directly affects high blood pressure?
Reference numbers refer to the Reference List in the Clinical Guidelines Report.
Reference Design Overweightdefined as:
Adjuvant therapy Intervention Drop-outtotal
Mean weightchange
(n) mean (95%CI)
BPBaseline
(n) mean (95%CI)
Blood pressurechange
(n) mean (95%CI)
Sideeffects/comments
4. (597) 86 (85.8, 86.1) 4. (597) –3 (-3.5, -2.4)
1.
Langford354
Randomized: unclearSelf-selected: noIncluded: includes nonoverweighthypertensionMean age: 56.9Mean weight: 80.0Female/Total: ng/496
includes non-overweight
Diet: yeslow sodium orlow calorie
Exercise: no
Behavioral: no
2. Control (continuemedication)
3. No medication, no diet4. No medication, sodium
restriction5. No medication, weight
reduction diet6. Not overweight, continue
medication7. Not overweight, no
medication, no diet8. Not overweight, no
medication/sodiumrestriction diet
not reported Weight in kg1. (43) -0.46 (95%CI -1.2,
0.2)2. (77) -0.46 (95%CI -1.3,
0.4)3. (79) 0 (95%CI -0.8,
0.8)4. (67) -4 (95%CI -5.2,
-2.8)5. (63) 0.46 (95%CI -0.3,
1.3)6. (63) 0 (95%CI -0.8,
0.8)7. (46) 0.46 (95%CI -0.3,
1.3)4vs1 -3.54 (-4.57, -2.51)4vs2 -3.54 (-5.63, -1.45)
not given not given Overall 96.6% ofall participitantswere withdrawnsuccessfully frommedication.Relative odds ofsuccess forsodium group was2.17 (p<0.05)compared to thediscontinuemedication, nointervention group.Weight reductiongroup 3.43(p<0.05) comparedto the obesediscontinuemedication, nointervention.
Overweightgroups:The successesreduced theirweight by 5,a,6,while those whowere returned tomedications lost anaverage of 3.5,a,4which was not astatisticallysignificantdifference.
The highestsuccess rates werefound in theoverweight weightreduction group
Question 22: What is the evidence that weight loss directly affects high blood pressure?
Reference numbers refer to the Reference List in the Clinical Guidelines Report.
Reference Design Overweightdefined as:
Adjuvant therapy Intervention Drop-outtotal
Mean weightchange
(n) mean (95%CI)
BPBaseline
(n) mean (95%CI)
Blood pressurechange
(n) mean (95%CI)
Sideeffects/comments
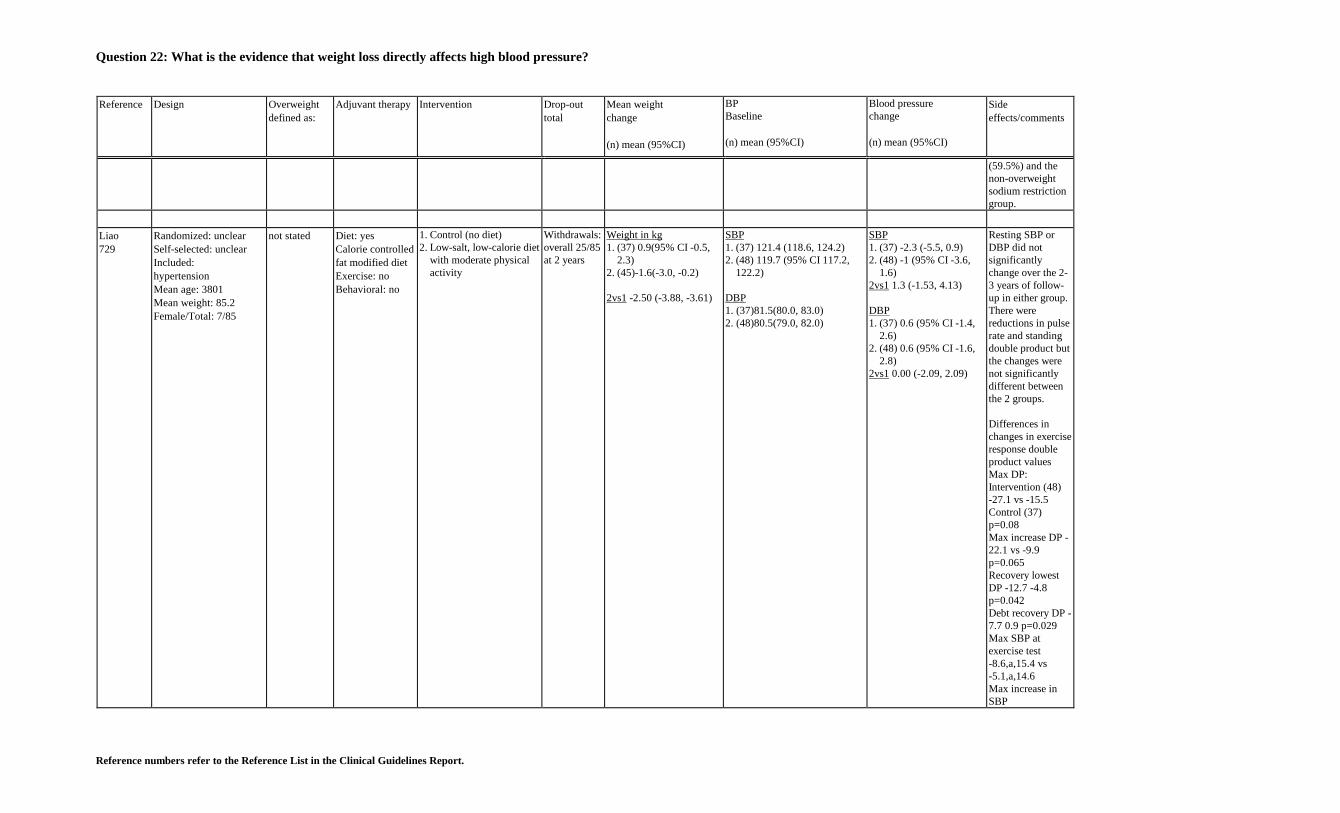
(59.5%) and thenon-overweightsodium restrictiongroup.
Liao729
Randomized: unclearSelf-selected: unclearIncluded:hypertensionMean age: 3801Mean weight: 85.2Female/Total: 7/85
not stated Diet: yesCalorie controlledfat modified dietExercise: noBehavioral: no
1. Control (no diet)2. Low-salt, low-calorie diet
with moderate physicalactivity
Withdrawals:overall 25/85at 2 years
Weight in kg1. (37) 0.9(95% CI -0.5,
2.3)2. (45)-1.6(-3.0, -0.2)
2vs1 -2.50 (-3.88, -3.61)
SBP1. (37) 121.4 (118.6, 124.2)2. (48) 119.7 (95% CI 117.2,
122.2)
DBP1. (37)81.5(80.0, 83.0)2. (48)80.5(79.0, 82.0)
SBP1. (37) -2.3 (-5.5, 0.9)2. (48) -1 (95% CI -3.6,
1.6)2vs1 1.3 (-1.53, 4.13)
DBP1. (37) 0.6 (95% CI -1.4,
2.6)2. (48) 0.6 (95% CI -1.6,
2.8)2vs1 0.00 (-2.09, 2.09)
Resting SBP orDBP did notsignificantlychange over the 2-3 years of follow-up in either group.There werereductions in pulserate and standingdouble product butthe changes werenot significantlydifferent betweenthe 2 groups.
Differences inchanges in exerciseresponse doubleproduct valuesMax DP:Intervention (48)-27.1 vs -15.5Control (37)p=0.08Max increase DP -22.1 vs -9.9p=0.065Recovery lowestDP -12.7 -4.8p=0.042Debt recovery DP -7.7 0.9 p=0.029Max SBP atexercise test-8.6,a,15.4 vs-5.1,a,14.6Max increase inSBP

Question 22: What is the evidence that weight loss directly affects high blood pressure?
Reference numbers refer to the Reference List in the Clinical Guidelines Report.
Reference Design Overweightdefined as:
Adjuvant therapy Intervention Drop-outtotal
Mean weightchange
(n) mean (95%CI)
BPBaseline
(n) mean (95%CI)
Blood pressurechange
(n) mean (95%CI)
Sideeffects/comments
-1.4,a,16.4 vs0.5,a,15.0
Grimm679
Randomized: unclearSelf-selected: unclearIncluded: non-overweighthypertensionMean age: 54.8Mean weight: 85Female/Total: 342/902
includes non-overweight
Diet: Yes1000-1600 kcal/d
Exercise: yes600 cal/w
Behavioral: yesgroup, qwx8, qmo
1. Placebo (salt restriction)2. Acebutolol 400 mg/d3. Amlodipine 5 mg/d4. Chlorthalidone 15 mg/d5. Doxazosin 2 mg/d6. Enalapril 5 mg/d
2 deathsotherwise notgiven
Weight in kg 12 months1. (212) -4.5 (95%CI -4.5,
-4.5)2. (119) -4.3 (95%CI -4.4,
-4.2)3. (118) -5 (95%CI -5.1, -
4.9)4. (117) -5.6 (95%CI -5.7,
-5.5)5. (123) -3.9 (95%CI -4.0,
-3.8)6. (113) -5.3 (95%CI -5.4,
-5.2)
SBP1. (221) 141.2 (95%CI 139.6,
142.8)2. (126) 140.5 (95%CI 138.2,
142.8)3. (120) 138.4 (95%CI 136.1,
140.7)4. (124) 141.1 (95%CI 138.8,
143.4)5. (129) 141.1 (95%CI 139.0,
143.2)6. (127) 141 (95%CI 138.7,
143.3)
DBP1. (221) 90.6 (95%CI 90.1,
91.1)2. (126) 90.8 (95%CI 90.2,
91.4)3. (120) 90.9 (95%CI 90.3,
91.5)4. (124) 90.5 (95%CI 89.9,
91.1)5. (129) 90.6 (95%CI 90.0,
91.2)6. (127) 90.1 (95%CI 89.5,
90.7)
SBP 12 months1. (221) -10.6 (95%CI
-10.7, -10.5)2. (126) -20.1 (95%CI
-20.3, -19.9)3. (120) -17.5 (95%CI4. -17.7, -17.3)5. (124) -21.8 (95%CI
-22.0, -21.6)6. (129) -16.1 (95%CI
-16.3, -15.9)7. (127) -17.6 (95%CI
-17.8, -17.4)
DBP 12 months1. (221) -8.1 (95%CI -8.2,
-8.0)2. (126) -13.7 (95%CI
-13.8, -13.6)3. (120) -12.9 (95%CI
-13.0, -12.8)4. (124) -13.1 (95%CI
-13.2, -13.0)5. (129) -12 (95%CI -12.1,
-11.9)6. (127) -12.2 (95%CI
-12.3, -12.1)
At the end of 4years follow-upperiod, 70% ofparticipantsremained belowtheir baselineweight and 34%had maintained atleast 10 lb weightloss.Men maintained agreater proportionof their initial lossat 4 years (55 vs44%)Men achieved theirmaximum weightloss of 13 lb at 6months whilewomen reachedtheir maximumloss of 8.2 at 1year.The trend in BPchange by weightchange was highlysignificant(p<0.001) for bothDBP and SBP
Stamler374
Randomized: yesSelf-selected: yesincluded:% desirable weight: >110to 149% IBW but <150%IBW if DBP 80-84Female/Total:27/201
% desirableweight: >110to 149% IBWbut <150%IBW if DBP80-84
Diet: yesprovided <1800mg Na,<26gETOHlose 4.5 kg or 5%of weightExercise: yesisotonic
1. Control (no intervention)2. Low-salt, low-fat diet
with moderate exercise
small forboth groupswith 87%participatingfor 4 years ormore
Weight in kg 5 years1. (98) 0.82. (95) -2.0
*Weight:weight data are reportedfor patients with relativeweight greater than 1.0
DBP1. (99) 82.6 (82.0, 83.2)2. (102) 82.5 (81.9, 83.1)
SBP1. (99) 122.7 (121.3, 124.1)2. (102) 122.5 (121.2, 123.8)
DBP 2 years1. (74) -1.92. (82) -2.7
DBP 5 years1. (99) 82.5 (81.4, 83.6)2. (102) 81.2 (80.2, 82.2)
The proportionmoving fromhypertension-proneto definitehypertension was19.2% of controlgroup compared to8.8% in group 2

Question 22: What is the evidence that weight loss directly affects high blood pressure?
Reference numbers refer to the Reference List in the Clinical Guidelines Report.
Reference Design Overweightdefined as:
Adjuvant therapy Intervention Drop-outtotal
Mean weightchange
(n) mean (95%CI)
BPBaseline
(n) mean (95%CI)
Blood pressurechange
(n) mean (95%CI)
Sideeffects/comments
Mean age: 37.5Mean weight: 84.2
Minutes/Time perwk30 min x3Behavioral: no
The largest group weightchange was in the firstyears, -4.1 kg.
SBP 5 years1. (99) 121.5 (119.7,
123.3)2. (102) 119.8 (118.3,
121.3)
(p=0.027). Theodds ratio for theincidence ofhypertension in thecontrol group was2.4 (90% CI 1.2 to4.8).
BPThose who lostweight had areduction of 4.4mm Hg in SBP vs1.1 mm Hg inthose with little orno weight loss orwith weight gain(p=0.007)Weight reductionin the interventiongroup was relatedsignificantly toaverage changeduring the trial inboth SBP and DBP(r=0.31, p<0.001).Sodium restrictionwas related to SBP(r-0.14, p<0.089)and with DBP(r=0.03).In multipleregression analysisthere was asignificantrelationshipbetwen weightchange and changein BP while forsodium andalcohol change therelationship wasnot independent.The regression for

Question 22: What is the evidence that weight loss directly affects high blood pressure?
Reference numbers refer to the Reference List in the Clinical Guidelines Report.
Reference Design Overweightdefined as:
Adjuvant therapy Intervention Drop-outtotal
Mean weightchange
(n) mean (95%CI)
BPBaseline
(n) mean (95%CI)
Blood pressurechange
(n) mean (95%CI)
Sideeffects/comments
weight changeindicated that adifference of 4.5kg was associatedwith a differenceof 2.1 mm Hg inSBP and 1.5 mmHg in DBP.
Andersson674
Randomized: unclearSelf-selected: unclearIncluded BMI: 26-36Mean age: ngMean weight: 82.7Female/Total: 20/20
BMI: 26-36 Diet: yesSemistarvationExercise: NoBehavioral: No
1. Control (no intervention)2. Semistarvation for 3 days
1. 0/92. 1/11(9%)
Weight in kg1. (9) -0.2 (n/a, n/a)2. (10) -2.5 (n/a, n/a)2vs1 -2.3 (-9.49, 4.89)
SBP1. (9) 148 (138.8, 157.2)2. (10) 148 (139.0, 157.0)
DBP1. (9) 96 (91.4, 100.6)2. (10) 93 (88.5, 97.5)
SBP 4 months1. (9) 146 (136.8, 155.2)2. (9) 142 (130.5, 153.5)2vs1 -4.00 (-13.11, 5.11)DBP 4 months1. (9) 94 (87.1, 100.9)2. (9) 86 (76.8, 95.2)2vs1 -5.00 (-11.40, 1.40)
Singh690
Randomized: yesSelf-selected: noIncluded: AMI within 24hoursMean age: 50.5Mean weight: 66Female/Total: ng/406
not stated Diet: yesLow fat, lowenergy, high fruitand vegetable
Exercise: noBehavioral: no
1. Usual diet2. Low energy, high fruit
and vegetable diet
1. 5/202(2%)
2. 6/204(2%)
Weight in kg1. (179) -2.2 (n/a, n/a)2. (182) -5.3 (n/a, n/a)net change: 3.1(1.28,4.92)
SBP1. (202) 134.2 (133.2, 135.2)2. (204) 132.5 (131.8, 133.2)
DBP1. (202) 88.4 (87.8, 89.0)2. (204) 85.3 (84.9, 85.7)
SBP1. (179) -4.4 (n/a, n/a)2. (182) 12.3 (n/a, n/a)net change: 7.9 (4.58,11.2)
DBP1. (179) -3.4 (n/a, n/a)2. (182) -8.1 (n/a, n/a)net change: 4.7 (2.1, 7.3)
Hakala364
Randomized: unclearSelf-selected: yesIncluded: 30-50% IBWMean age: 38Mean weight: 96.3Female/Total: 82/110
30-50%overweight
Diet: yes2. moderate meat,
fish and egg3. no meat, fish or
eggs
Exercise: no
Behavioral: no
1. Control (no intervention)2. Lactovegetarian weight
reduction group3. Mixed diet weight
reduction program
1. 2/46 (4%)2. 15/46
33%)3. 9/46
(20%)
Weight in kg1. (ng) 1.62. (ng) -9.23. (ng) -10.4
2vs1 p<0.0013vs1 p<0.001
Systolic BP1. (42) 133 (95%CI n/a, n/a)2. (31) 127 (95%CI n/a, n/a)3. (37) 130 (95%CI n/a, n/a)
Diastolic BP1. (42) 87 (95%CI n/a, n/a)2. (31) 83 (95%CI n/a, n/a)3. (37) 86 (95%CI n/a, n/a)
Systolic BP1. (ng) 0 (95%CI n/a, n/a)2. (ng) -2.5 (95%CI n/a,
n/a)3. (ng) -6.3 (95%CI n/a,
n/a)
2vs1 p=ns3vs1 p<0.05
Diastolic BP

Question 22: What is the evidence that weight loss directly affects high blood pressure?
Reference numbers refer to the Reference List in the Clinical Guidelines Report.
Reference Design Overweightdefined as:
Adjuvant therapy Intervention Drop-outtotal
Mean weightchange
(n) mean (95%CI)
BPBaseline
(n) mean (95%CI)
Blood pressurechange
(n) mean (95%CI)
Sideeffects/comments
1. (ng) 0 (95%CI n/a, n/a)2. (ng) -1.5 (95%CI n/a,
n/a)3. (ng) -4.7 (95%CI n/a,
n/a)
2vs1 p<0.013vs1 p<0.01
Anderssen346
Randomized: unclearSelf-selected: noIncluded: BMI >24 kg/m2
Mean age: 44.9Mean weight: 28.8 kg/m2
Female/Total: 21/212
BMI >24 Diet: yeslow calorie to lose0.5-1.0 kg/monthExercise: yes
aerobic60-80% max HR60 min 3x/week
Behavioral: no
1. Control (no diet orexercise)
2. Diet alone3. Exercise alone4. Diet and exercise
1. 0/432. 3/553. 5/544. 2/67
BMI1a. (12) 0.2 (-0.46, 0.86)2a. (16) -1.7 (-2.55, -0.85)3a. (20) -0.4 (-1.03, 0.23)4a. (24) -2.2 (-2.61, -1.79)
BMI1b. (16) 0.4 (-0.03, 0.83)2b. (17) -1.4 (-2.46, -0.34)3b. (16) 0 (-0.64, 0.64)4b. (20) -2 (-2.84, -1.16)
BMI1c. (15) 0.4 (0.19, 0.61)2c. (19) -0.7 (-1.12, -0.28)3c. (13) -0.5 (-1.37, 0.37)4c. (21) -1.2 (-2.03, -0.37)
SBP1a. (12) 137.5 (132.00, 143.00)2a. (16) 144.5 (134.91, 154.09)3a. (20) 139.5 (135.31, 143.69)4a. (24) 142.8 (137.84, 147.76)
DBP1a. (12) 95.6 (93.18, 98.02)2a. (16) 97.3 (94.53, 100.07)3a. (20) 96.4 (94.10, 98.70)4a. (24) 97 (95.14, 98.86)
SBP2b. (17) 133.6 (128.94, 138.26)1b. (16) 129.6 (125.55, 133.65)3b. (16) 130.6 (125.91, 135.29)4b. (20) 129.2 (n/a, n/a)
DBP1b. (16) 88 (86.93, 89.07)2b. (17) 88.1 (87.04, 89.16)3b. (16) 88.2 (86.92, 89.48)4b. (20) 86.6 (85.55, 87.65)
SBP1c. (15) 120.8 (118.01, 123.59)2c. (19) 122.2 (118.00, 126.40)3c. (13) 122.7 (116.82, 128.58)4c. (21) 121.9 (118.77, 125.03)
DBP1c. (15) 79.1 (76.31, 81.89)2c. (19) 78.6 (76.08, 81.12)3c. (13) 79.4 (77.44, 81.36)
SBP1a. (12) 2.9 (-6.78, 12.58)2a. (16) -8.4 (-15.43,
-1.37)3a. (20) -4.1 (-7.87, -0.33)4a. (24) -8.3 (-12.64,
-3.96)
DBP1a. (12) -0.4 (-8.32, 7.52)2a. (16) -7.1 (-10.94,
-3.26)3a. (20) -5.5 (-9.06, -1.94)4a. (24) -7.1 (-9.79, -4.41)
SBP2b. (17) -8.2 (-12.23,
-4.17)1b. (16) -1.7 (-7.88, 4.48)3b. (16) -1.6 (-4.58, 1.38)4b. (20) -6.1 (-8.82, -3.38)
DBP1b. (16) -2.2 (-6.25, 1.85)2b. (17) -4.5 (-7.26, -1.74)3b. (16) -2.4 (-5.38, 0.58)4b. (20) -6.4 (-8.91, -3.89)
SBP1c. (15) -1.9 (-5.76, 1.96)2c. (19) -3.2 (-7.19, 0.79)3c. (13) 0.2 (-4.81, 5.21)4c. (21) -3 (-6.55, 0.55)

Question 22: What is the evidence that weight loss directly affects high blood pressure?
Reference numbers refer to the Reference List in the Clinical Guidelines Report.
Reference Design Overweightdefined as:
Adjuvant therapy Intervention Drop-outtotal
Mean weightchange
(n) mean (95%CI)
BPBaseline
(n) mean (95%CI)
Blood pressurechange
(n) mean (95%CI)
Sideeffects/comments
4c. (21) 79 (77.54, 80.46) DBP1c. (15) 0.8 (-2.42, 4.02)2c. (19) 0.8 (-2.35, 3.95)3c. (13) 1.2 (-3.16, 5.56)4c. (21) -1.8 (-5.35, 1.75)
Karvetti368
Randomized: unclearSelf-selected: unclearIncluded: BMI >27 kg/m2
Mean age: 48.1Mean weight: 33.9 kg/m2
Female/Total: 147/189
BMI >27kg/m2
Diet: 1200 kcal/dExercise: noBehavioral: no
1. Control (no diet)2. Weight reduction
program
Duration: 52 weeks
1. 21/117(18%)
2. 33/126(26%)
Weight in kg, men2. (17) -10.9
Weight in kg, women2. (62) -5.42vs1 p<0.05 per author
Systolic BP, men1. (20) 148 (138.17, 157.83)2. (22) 145 (134.36, 155.64)
Systolic BP, women1. (76) 142 (137.20, 146.80)2. (69) 146 (141.20, 150.80)
Diastolic BP, women2. (69) 92 (89.60, 94.40)1. (76) 91 (88.49, 93.51)
Diastolic BP, men1. (20) 92 (86.38, 97.62)2. (22) 95 (86.13, 103.87)
Systolic BP, men1. (ns) 147 (n/a, n/a)2. (17) 145 (133.17,
156.83)
Systolic BP, women1. (ns) 142 (n/a, n/a)2. (62) 140 (135.17,
144.83)2vs1 p<0.05
Diastolic BP, women2. (62) 86 (83.46, 88.54)1. (ns) 88 (n/a, n/a)
Diastolic BP, men1. (ns) 87 (n/a, n/a)2. (17) 88 (80.29, 95.71)
Collins676
Randomized: unclearSelf-selected: yesIncluded: BMI 30-40diabetesMean age: ngMean weight: ngFemale/Total: ng/40
BMI 30 -40 Diet: yesVLCD,HMR 800800 Kcal
Exercise: noBehavioral: yesgroup weekly
1. HMR 800 (2supplements per day)
2. HMR 800 (5supplements per day)
1/32(3%)* 7 notincluded ($medication)
Weight in kg0. (32) -15.3 (n/a, n/a)
SBP1. (32) 140.6 (135.9, 145.3)
DBP1. (32) 88.2 (85.5, 90.9)
SBP0. (32) 124.9 (118.4,
130.4)
DBP0. (32) 76.8 (73.7, 79.9)
SBP 64 weeks0. (30) 135.4 (127.2,
143.6)DBP 64 weeks0. (30) 82.4 (79.3, 85.5)
Stokholm692
Randomized: unclearSelf-selected: not
>180% IBW Diet: yesConventional: no
1. Conventional diet2. Jejunoileal bypass (end
none 1. -10 kg2. -42.8
SBP, median1. (33) 140 (95%CI, 18, 197)
max change SBP, median1. (33) 140 (95%CI 110,
Positive correlationbetween the

Question 22: What is the evidence that weight loss directly affects high blood pressure?
Reference numbers refer to the Reference List in the Clinical Guidelines Report.
Reference Design Overweightdefined as:
Adjuvant therapy Intervention Drop-outtotal
Mean weightchange
(n) mean (95%CI)
BPBaseline
(n) mean (95%CI)
Blood pressurechange
(n) mean (95%CI)
Sideeffects/comments
Included: >180% IBWMean age: 31.7Mean weight: 125.2 kgFemale/Total: 113/134
description
Exercise: noBehavioral: no
to side)2vs1 -32.8 (-64.2, -1.39)
2. (101) 140 (95%CI 116, 180)
DBP, median1. (33) 90 (95%CI 67, 112)2. (101) 85.0 (95%CI 70, 109)
187)2. (101) 120 (95%CI 105,
150)2vs1 -20 (-53, 13)
max change DBP, median1. (33) 90 (95%CI 70,
100)2. (101) 80 (95%CI 60,
99)2vs1 -5 (-26, 16)
maximum changein body weight andcorrespondingchange in BP (rsquare=0.43) SBP(r square =0.46)DBP (r square=0.36).No correlationbetween weightchanges and meanBP at allocation (rsquare =0.12,p>0.10).
Behavioral
Jeffery367
Randomized: unclearSelf-selected: yesIncluded: 14 to 32 kgoverweight, multiplefailed attemptsMean age: 37.5Mean weight: 98.7Female/Total: 22/54
14 to 32 kgoverweight
Diet: yes1000-1500 kcal/d
Exercise: yes2 and 51000 kcal/w
Behavioral: yesgroup, qwx20,qmo
1. Control2. Standard behavioral
treatment3. Standard behavioral
treatment plus foodprovision
4. Standard behavioraltreatment plus monetaryincentive
5. Standard behavioraltreatment plus foodprovision plus monetaryincentive
not given Weight in kg1. (ns) 0.5 (95%CI n/a,
n/a)2. (ns) -3.5 (95%CI n/a,
n/a)3. (ns) -6 (95%CI n/a, n/a)4. (ns) -3 (95%CI n/a, n/a)5. (ns) -6 (95%CI n/a, n/a)
Weight in kg 12 months1. (ns) 0 (95%CI n/a, n/a)2. (ns) -4 (95%CI n/a, n/a)3. (ns) -8 (95%CI n/a, n/a)4. (ns) -5 (95%CI n/a, n/a)5. (ns) -8 (95%CI n/a, n/a)
Weight in kg 12 months1. (28) -1.5 (95%CI)2,3,4,5. (131) -7.5 (95%CI)
Weight in kg 120 weeks1. (27) 0.6 (95%CI
-1.5, 2.7)2. (24) -1.4 (95%CI
-4.4, 1.6)3. (34) -2.2 (95%CI
SBP1. (28) 110.6 (95%CI 107.1,
114.1)2,3,4,5. (131) 111.9 (95%CI110.0, 113.8)
DBP1. (28) 71.1 (95%CI 68.1, 74.1)2,3,4,5. (131) 71.9 (95%CI70.5, 73.3)
SBP 6 months1. (28) -3.2 (95%CI)2,3,4,5. (131) -6.9(95%CI)
SBP, men 6 months2,3,4,5. (ns) -8.9 (95%CI)
SBP, women 6 months2,3,4,5. (ns) -4.7 (95%CI)
DBP 6 months1. (28) 0.5 (95%CI)2,3,4,5. (131) 3.5 (95%CI)
DBP, men 6 months2,3,4,5. (ns) -4.7 (95%CI)
DBP, women 6 months2,3,4,5. (ns) -2.2 (95%CI)
SBP 12 months1. (ns) -0.2 (95%CI)2,3,4,5. (ns) -5.4 (95%CI)
DBP 12 months1. (ns) 1.6 (95%CI)
An average weightloss of 11.8 kg or13% of initial bodyweight producedsignificant andpersistentimprovements inTG, HDL, SBP,DBP, WHR,fasting insulin. Theonly exception isFBS, whichreturned tobaseline.

Question 22: What is the evidence that weight loss directly affects high blood pressure?
Reference numbers refer to the Reference List in the Clinical Guidelines Report.
Reference Design Overweightdefined as:
Adjuvant therapy Intervention Drop-outtotal
Mean weightchange
(n) mean (95%CI)
BPBaseline
(n) mean (95%CI)
Blood pressurechange
(n) mean (95%CI)
Sideeffects/comments
-4.5, 0.1)4. (34) -1.6 (95%CI
-3.5, 0.3)5. (34) -1.6 (95%CI
-3.8, 0.6)
Weight in kg 120 weeks1. (28) -1.2 (95%CI , )2,3,4,5. (131) -6.0 (95%CI)
2,3,4,5. (ns) -2.4 (95%CI)
SBP, men 12 months2,3,4,5. (ns) -7.1 (95%CI)
SBP, women 12 months2,3,4,5. (ns) -3.7 (95%CI)
DBP, men 12 months2,3,4,5. (ns) -3.7 (95%CI)
DBP, women 12 months2,3,4,5. (ns) -1.0 (95%CI)
SBP 120 weeks1. (ns) -3.8 (95%CI , )2,3,4,5. (ns) -6.3 (95%CI)
DBP 120 weeks1. (ns) 0.5 (95%CI)2,3,4,5. (ns) -2.2 (95%CI)
SBP, men 120 weeks2,3,4,5. (ns) -8.1 (95%CI)
SBP, women 120 weeks2,3,4,5. (ns) -4.3 (95%CI)15, men 120 weeks2,3,4,5. (ns) -3.3 (95%CI)
DBP, women 120 weeks2,3,4,5. (ns) -1.1 (95%CI)
Lovibond484
Randomized: unclearSelf-selected: yesIncluded: non-overweight, subjects athigh risk of CADMean age: ngMean weight: ngFemale/Total: 18/75
includes non-overweight
Diet: yesto reach ormaintain weight
Exercise: yesaerobic
Behavioral: yesgroup andindividual
1. Basic behavioral therapy2. Extended behavioral
therapy3. Maximal behavioral
therapy
1. (20%)2. (8%)3. (8%)
Weight in kg1. (ns, overwgt) -5.15
(95%CI n/a, n/a)2. (ns, overwgt) -8
(95%CI n/a, n/a)3. (ns, overwgt) -10.35
(95%CI n/a, n/a)Weight in kg 12 months1. (ns, overwgt) -5.5
(95%CI n/a, n/a)
*SBP1. (20) 153.2 (95%CI n/a, n/a)2. (18) 155.1 (95%CI n/a, n/a)3. (21) 152.8 (95%CI n/a, n/a)
*DBP1. (20) 93.3 (95%CI n/a, n/a)2. (18) 91.8 (95%CI n/a, n/a)3. (21) 94.8 (95%CI n/a, n/a)*data given for 59 hypertensive
SBP1. (20) -8.4 (95%CI n/a,
n/a)2. (18) -13.6 (95%CI n/a,
n/a)3. (21) -13.6 (95%CI n/a,
n/a)
SBP 12 months1. (ns) -7.1 (95%CI n/a,
Blood pressure:Of the 59/75patients who wereintiallyhypertensive, 39%(n=23) hadreduced their SBPto below the cutoffpoint forhypertension

Question 22: What is the evidence that weight loss directly affects high blood pressure?
Reference numbers refer to the Reference List in the Clinical Guidelines Report.
Reference Design Overweightdefined as:
Adjuvant therapy Intervention Drop-outtotal
Mean weightchange
(n) mean (95%CI)
BPBaseline
(n) mean (95%CI)
Blood pressurechange
(n) mean (95%CI)
Sideeffects/comments
2. (ns, overwgt) -8.3(95%CI n/a, n/a)
3. (ns, overwgt) -9.6(95%CI n/a, n/a)
subjects n/a)2. (ns) -12.4 (95%CI n/a,
n/a)3. (ns) -12.1 (95%CI n/a,
n/a)
DBP 12 months1. (ns) 88.3 (95%CI n/a,
n/a)2. (ns) 85 (95%CI n/a, n/a)3. (ns) 87 (95%CI n/a, n/a)
(SBP=140) by the6-monthassessment
Jeffery680
Randomized: unclearSelf-selected: noIncluded: 10-50%overweight, subjects withhigh normal BPMean age: 45.7Mean weight: 90Female/Total: none/94
10-50%overweight
Diet: yeslow calorie, lowsalt
Exercise: no
Behavioral: yesgroup vsindividual
1. Group treatment2. Individual counseling
1. 11%2. 15%
Weight in kg1. (42) -6 (95%CI -7.0,
-5.0)2. (40) -5.7 (95%CI -6.6,
-4.8)
2vs1 -0.30 (-2.15, 1.55)
SBP1. (42) 134.5 (95%CI 131.0,
138.0)2. (40) 135.8 (95%CI 133.5,
138.1)
DBP1. (42) 85 (95%CI 82.9, 87.1)2. (40) 83.8 (95%CI 81.9, 85.7)
SBP1. (42) -9.1 (95%CI -13.1,
-5.1)2. (40) -7 (95%CI -10.2,
-3.8)2vs1 2.10 (-1.48, 5.68)
DBP1. (42) -4.8 (95%CI -7.7,
-1.9)2. (40) -5.4 (95%CI -7.5,
-3.3)2vs1 -0.6 (-3.10, 1.90)
Uusitupa490
Randomized: unclearSelf-selected: notIncluded: Diabetes>120% IBWMean age: 53Mean weight: 93kgFemale/Total: ng
>120% IBW Diet: yesKcal ng, low fat
Exercise: no
Behavioral: yesFormat: unclearq2w
1. Conventional dieteducation
2. Intensified diet education
overall1. (4%)
BMI1. (46) -0.82. (40) -1.82vs1 -1 (-2.65, 0.65)
SBP1. (48) 149 (95% CI 142.3,
155.7)2. (40) 148 (95% CI 142.2,
153.8)
DBP1. (48) 88 (95% CI 84.5, 91.5)2. (40) 91 (95% CI 86.8, 95.2)
SBP1. (46) 144 (95% CI
138.7, 149.3)2. (40) 137 (95% CI
131.9, 142.1)2vs1 -6.00 (-12.19, 0.19)
DBP1. (46) 85 (95% CI 82.3,
87.7)2. (40) 83 (95% CI 80.1,
85.9)
SBP 108 weeks1. (44)150 (95% CI143.3,
156.7)
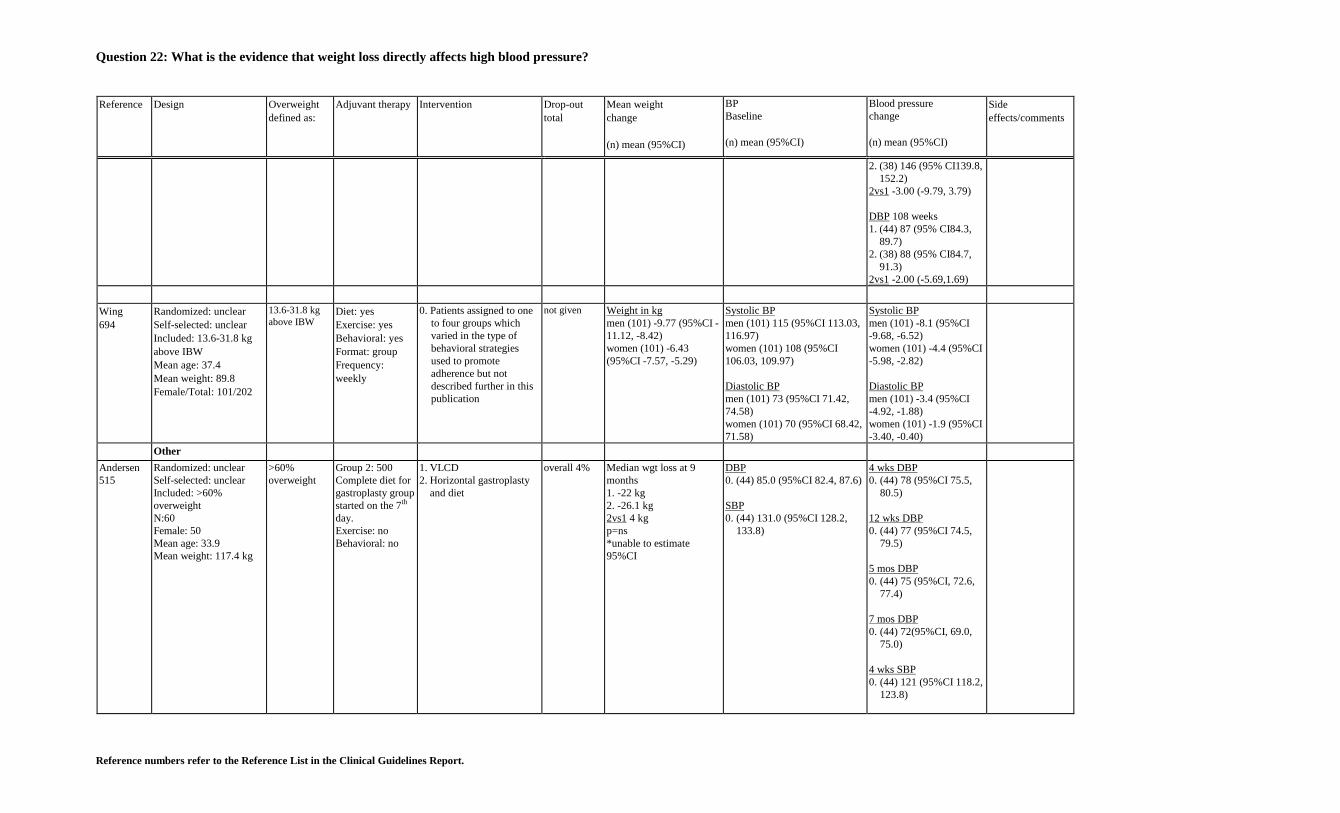
Question 22: What is the evidence that weight loss directly affects high blood pressure?
Reference numbers refer to the Reference List in the Clinical Guidelines Report.
Reference Design Overweightdefined as:
Adjuvant therapy Intervention Drop-outtotal
Mean weightchange
(n) mean (95%CI)
BPBaseline
(n) mean (95%CI)
Blood pressurechange
(n) mean (95%CI)
Sideeffects/comments
2. (38) 146 (95% CI139.8,152.2)
2vs1 -3.00 (-9.79, 3.79)
DBP 108 weeks1. (44) 87 (95% CI84.3,
89.7)2. (38) 88 (95% CI84.7,
91.3)2vs1 -2.00 (-5.69,1.69)
Wing694
Randomized: unclearSelf-selected: unclearIncluded: 13.6-31.8 kgabove IBWMean age: 37.4Mean weight: 89.8Female/Total: 101/202
13.6-31.8 kgabove IBW
Diet: yesExercise: yesBehavioral: yesFormat: groupFrequency:weekly
0. Patients assigned to oneto four groups whichvaried in the type ofbehavioral strategiesused to promoteadherence but notdescribed further in thispublication
not given Weight in kgmen (101) -9.77 (95%CI -11.12, -8.42)women (101) -6.43(95%CI -7.57, -5.29)
Systolic BPmen (101) 115 (95%CI 113.03,116.97)women (101) 108 (95%CI106.03, 109.97)
Diastolic BPmen (101) 73 (95%CI 71.42,74.58)women (101) 70 (95%CI 68.42,71.58)
Systolic BPmen (101) -8.1 (95%CI-9.68, -6.52)women (101) -4.4 (95%CI-5.98, -2.82)
Diastolic BPmen (101) -3.4 (95%CI-4.92, -1.88)women (101) -1.9 (95%CI-3.40, -0.40)
Other
Andersen515
Randomized: unclearSelf-selected: unclearIncluded: >60%overweightN:60Female: 50Mean age: 33.9Mean weight: 117.4 kg
>60%overweight
Group 2: 500Complete diet forgastroplasty groupstarted on the 7th
day.Exercise: noBehavioral: no
1. VLCD2. Horizontal gastroplasty
and diet
overall 4% Median wgt loss at 9months1. -22 kg2. -26.1 kg2vs1 4 kgp=ns*unable to estimate95%CI
DBP0. (44) 85.0 (95%CI 82.4, 87.6)
SBP0. (44) 131.0 (95%CI 128.2,
133.8)
4 wks DBP0. (44) 78 (95%CI 75.5,
80.5)
12 wks DBP0. (44) 77 (95%CI 74.5,
79.5)
5 mos DBP0. (44) 75 (95%CI, 72.6,
77.4)
7 mos DBP0. (44) 72(95%CI, 69.0,
75.0)
4 wks SBP0. (44) 121 (95%CI 118.2,
123.8)
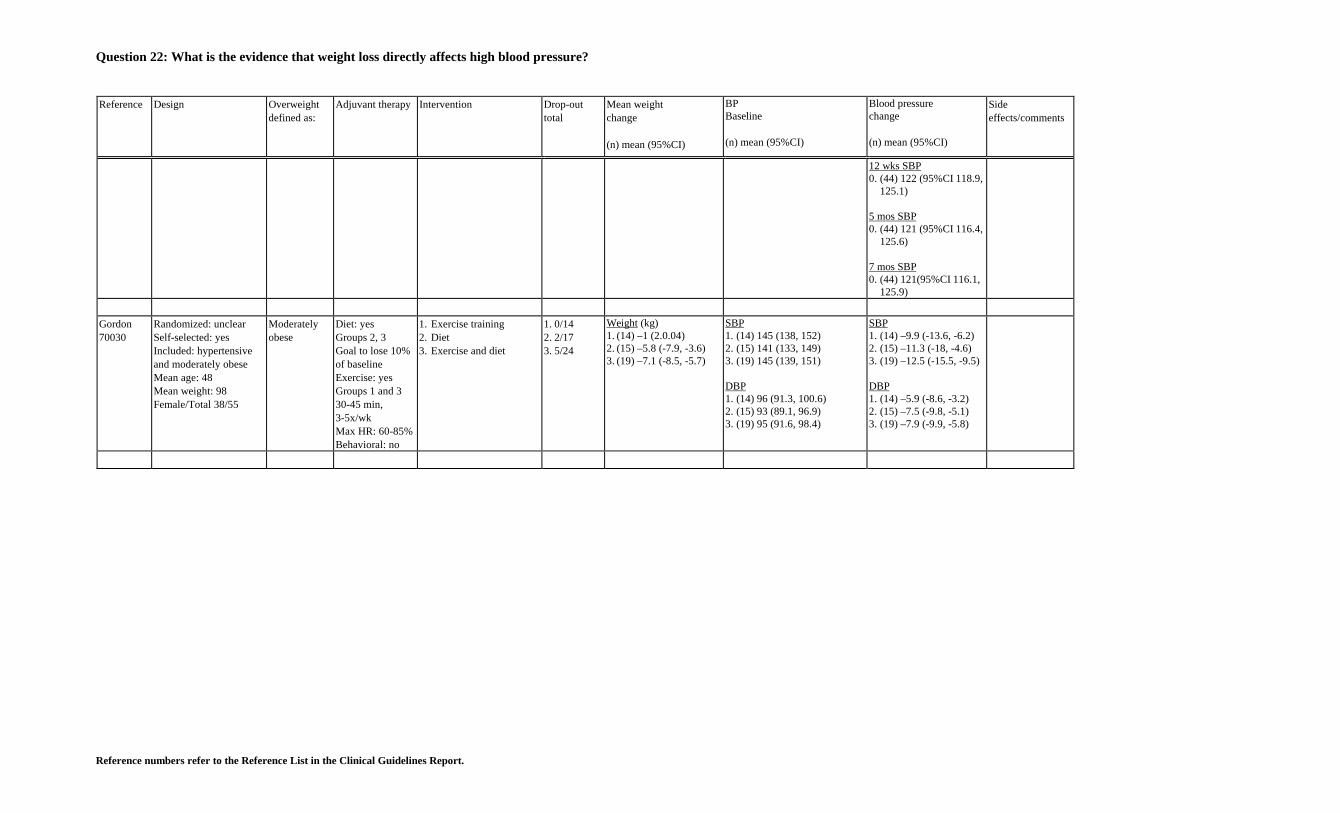
Question 22: What is the evidence that weight loss directly affects high blood pressure?
Reference numbers refer to the Reference List in the Clinical Guidelines Report.
Reference Design Overweightdefined as:
Adjuvant therapy Intervention Drop-outtotal
Mean weightchange
(n) mean (95%CI)
BPBaseline
(n) mean (95%CI)
Blood pressurechange
(n) mean (95%CI)
Sideeffects/comments
12 wks SBP0. (44) 122 (95%CI 118.9,
125.1)
5 mos SBP0. (44) 121 (95%CI 116.4,
125.6)
7 mos SBP0. (44) 121(95%CI 116.1,
125.9)
Gordon70030
Randomized: unclearSelf-selected: yesIncluded: hypertensiveand moderately obeseMean age: 48Mean weight: 98Female/Total 38/55
Moderatelyobese
Diet: yesGroups 2, 3Goal to lose 10%of baselineExercise: yesGroups 1 and 330-45 min,3-5x/wkMax HR: 60-85%Behavioral: no
1. Exercise training2. Diet3. Exercise and diet
1. 0/142. 2/173. 5/24
Weight (kg)1. (14) –1 (2.0.04)2. (15) –5.8 (-7.9, -3.6)3. (19) –7.1 (-8.5, -5.7)
SBP1. (14) 145 (138, 152)2. (15) 141 (133, 149)3. (19) 145 (139, 151)
DBP1. (14) 96 (91.3, 100.6)2. (15) 93 (89.1, 96.9)3. (19) 95 (91.6, 98.4)
SBP1. (14) –9.9 (-13.6, -6.2)2. (15) –11.3 (-18, -4.6)3. (19) –12.5 (-15.5, -9.5)
DBP1. (14) –5.9 (-8.6, -3.2)2. (15) –7.5 (-9.8, -5.1)3. (19) –7.9 (-9.9, -5.8)
Copyright © 2022 FDOKUMEN