upcoming | read the corrected letters below! - 1 File Download
Upload
khangminh22Category
view
1download
0
i
Lehrstuhl für Ökophysiologie der Pflanzen
Below-ground competitiveness of adult beech and spruce
trees: resource investments versus returns
Petia Simeonova Nikolova
Vollständiger Abdruck der von der Fakultät Wissenschaftszentrum Weihenstephan für
Ernährung, Landnutzung und Umwelt der Technischen Universität München zur Erlangung
des akademischen Grades eines
Doktors der Naturwissenschaften (Dr. rer. nat.)
genehmigten Dissertation.
Vorsitzender: Univ.-Prof. Dr. Wolfgang Oßwald
Prüfer der Dissertation:
1. Univ.-Prof. Dr. Rainer Matyssek
2. Univ.-Prof. Dr. Johannes Schnyder
Die Dissertation wurde am 14.11.2006 bei der Technischen Universität München eingereicht
und durch die Fakultät Wissenschaftszentrum Weihenstephan für Ernährung, Landnutzung
und Umwelt am 08.02.2007 angenommen.

ii
iii
TABLE OF CONTENTS
• SUMMARY
• ABBREVIATIONS
1 INTRODUCTION
1.1 Theories of plant competition
1.1.1 Mechanisms of competition
1.1.2 Determining the competitive success in plants
1.1.3 Quantifying the competitive success in plants: investments vs. returns
1.2 Below-ground competition
1.2.1 Mechanism of below-ground competition
1.2.2 Quantifying the competitive ability in plants below-ground
1.3 Competitiveness under the influence of ozone
1.3.1 Ozone impact on forest trees
1.3.2 Ozone fumigation experiment at “Kranzberger Forst”
1.4 Competitiveness under the influence of drought
1.5 Aim of the study
2 MATERIAL AND METHODS
2.1 Site description
2.2 Species description
2.2.1 European Beech (Fagus sylvatica L.)
2.2.1.1 Area of distribution
2.2.1.2 Species characteristics
2.2.2 Norway Spruce (Picea abies (L.) Karsten)
2.2.2.1 Area of distribution
2.2.2.2 Species characteristics
2.2.3 Central European mixed forests with Fagus sylvatica and
Picea abies
2.3 The Kranzberg Ozone Fumigation Experiment
2.4 Experimental design
2.5 Diagnostics of the ozone impact below-ground
2.6 Diagnostics of the drought impact below-ground
2.7 Space definition below-ground
2.8 Assessment of climate conditions
2.9 Assessment of standing fine root biomass
1
5
8
8
8
10
11
12
13
14
16
16
18
19
21
22
22
23
23
23
23
24
24
25
26
28
30
32
32
33
34
35
iv
2.10 Annual fine-root production
2.10.1 “Minimum-maximum” method
2.10.2 In-growth coring method
2.11 Fine root dynamics
2.11.1 Fine-root turnover
2.11.2 Root longevity
2.11.3 Root mortality rate
2.12 Functional categories of fine roots
2.13 Morphological parameters of fine roots
2.14 Assessment of ectomycorrhizal colonisation rate
2.15 Nutrient analysis in the fine roots
2.16 Non-structural carbohydrate analysis
2.17 Analysis of δ13C of newly produced fine-roots
2.18 Assessment of fine root respiration rate
2.18.1 Assessment of the ozone impact on root respiration rate
2.18.2 Seasonal dynamics in fine-root respiration rate
2.19 Measurement of water uptake by fine roots
2.20 Assessment of total soil respiration
2.21 Assessment of “autotrophic” and “heterotrophic” soil respiration
2.21.1 Root exclusion technique
2.21.2 Modelling of “autotrophic” and “heterotrophic” soil respiration
2.22 Efficiency ratios of competitiveness
2.22.1 Belowground space occupation
2.22.2 Belowground space exploitation
2.22.3 Belowground “running costs”
2.23 Statistical analyses
3 RESULTS
3.1 Climatic variation at “Kranzberger Forst” during 2002-2004
3.2 Dynamics of the fine-root biomass
3.2.1 Seasonal dynamics of the standing fine root biomass
3.2.2 Annual fine root production
3.2.3 Stand heterogeneity
3.2.4 Fine-root turnover
3.2.5 Life span of fine roots
3.3 δ13C signature of newly formed fine roots
3.4 Total soil respiration
35
35
36
36
36
37
37
37
40
40
41
41
42
43
44
44
45
50
51
51
52
54
54
56
57
57
59
59
61
61
62
64
66
66
67
69
v
3.4.1 Seasonal dynamics in total soil respiration
3.4.2 Ozone impact on total soil respiration
3.4.3 Components of total soil respiration under drought
3.4.3.1 Seasonal dynamics in “autotrophic” and “heterotrophic” soil
respiration
3.4.3.2 Modelling plant-available sol water
3.4.3.3 Responses of “autotrophic” and “heterotrophic” soil respiration
to soil temperature and plant-available sol water
3.4.3.4 Modelling of “autotrophic” and “heterotrophic” soil respiration
3.5 Respiration of fine roots
3.5.1 Ozone impact on root respiration rate
3.5.2 Seasonal dynamics in temperature sensitivity of root respiration rate
3.5.3 Respiration rate of individual fine rootlets in beech and spruce
3.6 Morphological parameters of fine roots
3.6.1 Seasonal dynamics of the specific fine-root area
3.6.2 Ozone impact on fine-root morphology
3.7 Ectomycorrhizal colonisation rate
3.8 Non-structural carbohydrates of fine roots
3.8.1 Ozone impact on sugar and starch concentration
3.8.2 Seasonal course of non-structural carbohydrates
3.8.2.1 Starch
3.8.2.2 Sugars
3.9 Nutritional analyses
3.9.1 Nutritional status of the fine-root categories
3.9.2 Drought impact on C and N concentration
3.9.3 Seasonal dynamics of C and N concentration in rootlets
3.9.4 Relationship between root respiration rate and N content of the rootlets
3.10 Water uptake by fine roots
3.10.1 Morphological and growth parameters of the rootlets
3.10.2 Seasonality of the water uptake by rootlets
3.11 Efficiency ratios of competitiveness
3.11.1 Specific fine-root length
3.11.2 Efficiency ratio of below-ground space occupation
3.11.3 Efficiency ratio of below-ground space exploitation
3.11.4 Efficiency ratio of “running costs”
69
70
71
71
73
74
77
79
79
80
83
84
84
85
87
88
88
89
89
90
94
94
98
98
100
102
102
103
106
106
107
109
109
vi
4 DISCUSSION
4.1 Climatic variation during the study period 2002-2004
4.2 Comparison of beech and spruce responses to drought
4.2.1 Beech
4.2.2 Spruce
4.2.3 Responses of beech and spruce to drought at the stand level
4.2.4 Drought effects on soil respiration components
4.2.4.1 Partitioning of total soil respiration under spruce and beech as
affected by drought
4.2.4.2 Parameterisation for “autotrophic” and “heterotrophic” soil
respiration modelling
4.2.4.3 Intra-annual variation in “autotrophic” and “heterotrophic” soil
respiration
4.3 Comparison of beech and spruce responses to enhanced ozone
concentration
4.3.1 Beech trees under intraspecific competition
4.3.2 Spruce trees under intraspecific competition
4.3.3 Beech and spruce trees under interspecific competition
4.3.4 Total soil respiration
4.4 Belowground efficiency ratios of tree competitiveness
4.4.1 Beech vs. spruce
4.4.2 Ozone impact
4.4.3 Mechanisms of below-ground competition between beech and spruce
5 CONCLUSIONS
6 APPENDIX
7 REFERENCES
8 ACKNOWLEDGMENTS
• CURRICULUM VITAE
113
114
116
116
119
122
123
123
125
126
127
128
130
132
133
134
135
136
137
140
143
145
159
161
vii
SUMMARY
The aim of the field study was to quantify the below-ground competitiveness of 50 to 60-year-
old beech (Fagus sylvatica) and spruce (Picea abies) trees by means of space-related
cost/benefit relationships. The study was conducted at the experimental site “Kranzberger
Forst” within the framework of the interdisciplinary research program
Sonderforschungsbereich 607 (SFB 607; Project B4) “Growth and Parasite Defence –
Competition for Resources in Economical Plants from Agronomy and Forestry”. It was
postulated that costs (resource investments) and returns (resource gains) as based on soil
volume have the potential to quantify the plant competitive ability below-ground. This idea
relates to the definition of Begon et al. (1996) that the competitive success of plants depends
on their ability to acquire efficiently resources shared with neighbours from external pools
located in a given space. The below-ground competitive ability (i.e. competitiveness) of
beech and spruce was quantified by using three types of space-related cost/benefit
relationships (i.e. “efficiencies”, cf. Grams et al., 2002): (1) Efficiency of below-ground space
occupation (occupied soil volume per unit C investment into standing fine-root biomass), (2)
Efficiency of below-ground space exploitation (resource uptake as related to the occupied
soil volume), and (3) Efficiency of below-ground “running costs” (occupied soil volume per
unit of C costs of root respiration to sustain occupation and exploitation of the occupied soil
volume). Here, tree response to free-air ozone fumigation at the crown level (the O3 regime
was experimentally raised by a factor of 2 relative to the ambient O3 regime; i.e. 1xO3 and
2xO3, respectively) was related to different water availability across the three experimental
years (including the extraordinary summer drought of 2003) to analyse the belowground
responsiveness of both competitors to disturbance under forest stand conditions.
1 The following hypotheses were to be evaluated: (i) Limited carbon gain by the foliage, as
caused by O3 stress or water limitation, results in stimulation of compensatory fine-root
production; (ii) Spruce being more conservative in resource turnover is less affected below-
ground by O3 stress than beech; conversely, relative to beech, the root system of spruce is
more affected by drought; (iii) O3 exposure enhances the CO2 efflux from the soil, whereas
drought reduces CO2 efflux; (iv) “Autotrophic” soil respiration (i.e. CO2 release from roots +
mycorrhizosphere) and “heterotrophic” soil respiration (i.e. respiration of free-living soil micro-
organisms) differ in their response to changing soil temperature and soil water content, with
higher sensitivity reflected in “autotrophic” soil respiration ; (v) The responses of beech and
spruce plants to O3 stress and water limitation depend on the type of competition (i.e. intra or
interspecific); (vi) Below-ground competitiveness of adult beech and spruce trees is
determined by similar efficiency ratios as above-ground competitiveness.
Summary
1
viii
Sampling and analysis were conducted within the uppermost 20 cm of the soil where most
intense below-ground competition between the neighbouring trees was expected. In addition,
within this soil depth two soil sub-samples were distinguished according to the existing
gradient in nutrient and water supply: organic sub-sample (consisting of the humus layer, and
the humic topsoil (A-horizon)); and mineral sub-sample (consisting of the loamy B-horizon).
At mono-specific subplots, the space occupied by roots was derived from the volume of the
organic or mineral soil sub-sample which was extracted with a soil coring cylinder. At mixed
subplots, a factor kc (i.e. defined at the monospecific sub-plots under control conditions as
the ratio between the soil volume and the volume of contained root biomass) was used to
split the soil volume into parts occupied by beech or spruce roots, respectively. Bio- and
necromass of the fine roots was monitored using soil coring and in-growth coring methods. In
addition, the natural variations of δ13C signature were assessed in newly formed fine-roots as
obtained by in-growth technique. For assessment of the physiological, biochemical and
morphological parameters, the fine-root fraction was differentiated into three functional
categories according to root position and anatomy. Water uptake was studied in situ on intact
fine rootlets by using the non-destructive approach of Göttlein et al. (2001) adapted to field
conditions. Root respiration was measured with a portable, integrated infrared gas analyzer
(IRGA) and gas exchange assessment system throughout the annual course and in
response to temperature. Total soil respiration was assessed accordingly throughout the
annual courses of 2002 and 2003. In addition, the root exclusion method was employed to
differentiate between the components in total soil respiration, i.e. “autotrophic” and
“heterotrophic” respiration. Available soil water content (calculated by S. Raspe, LWF,
through LWF-BROOK90; Hammel & Kennel, 2001) and soil temperature data were used to
parameterize a modelling approach for estimation of the annual “autotrophic” and
“heterotrophic” soil respiration.
At monospecific sub-plots, beech responded to both disturbing factors (drought or ozone)
with enhanced fine-root production and turnover. Spruce, in contrast, showed inhibited root
growth under dry conditions, and had no response to enhanced O3. Hence, hypothesis (i)
was corroborated for beech and rejected for spruce in that resource limitation stimulated fine-
root growth. The reduced fine-root production in spruce shows that this species is more
affected below-ground by drought than beech, thus confirming hypothesis (ii). The
contrasting physiological root responses in these tree species to drought may relate with the
different extent of water limitation underneath mono-specific spruce and beech groups during
2003. In contrast to beech, spruce which has not responded below-ground to O3 showed
aboveground decrease in stem diameter increment of fumigated trees (Wipfler et al., 2005).
Possibly, the capacity for ensuring sufficient nutrient supply for growth and/or repair
processes via enhanced fine-root turnover is the “strategy of success” in beech to cope with
Summary
2
ix
O3 stress. In beech, the combination of factors “O3+drought” influenced fine-root dynamics in
a way similar to that by drought or O3 impact alone, whereas in spruce such scenario
induced responses similar as that caused by drought. At mixed sub-plots, only spruce
showed different response to the studied scenarios remaining non-affected by drought in any
of the studied root parameters (i.e. hypothesis (v) was confirmed only for spruce). Apparently
the shallow fine-root system of spruce has profited from a more effective re-charge and use
of soil water in beech/spruce mixed sub-plots relative to monospecific sub-plots.
In both species, beech and spruce, and independent of the type of competition, drought of
2003 reduced and O3 exposure increased the total CO2 efflux from the soil thus corroborating
hypothesis (iii) and rejecting hypothesis (v). In the context of “global change” scenarios with
increase of O3 levels, the risk of chronic O3 stress to promote CO2 efflux from forests with
sufficient water supply cannot be ruled out. In both species, beech and spruce, “autotrophic”
rather than “heterotrophic” soil respiration was sensitive to changing soil temperature and soil
moisture (i.e. hypothesis (iv) was corroborated in both tree species). Drought limitation of
“autotrophic” soil respiration was accompanied, on an annual basis, in both tree species by
decrease in radial stem growth (according to P. Wipfler, pers. comm.), with spruce being
more sensitive than beech.
Under control conditions, the below-ground competitive advantage of beech within the
uppermost 20 cm of the soil was indicated by higher efficiency of space occupation and
space exploitation, whereas the efficiency of “running costs” remained similar in both tree
species. The competitive success of beech was associated with the capacity to exploit
available resources rapidly from soil (i.e. via constructing fine-roots with high specific fine-
root length). This finding supports the theory of Grime (1977), that the competitive success is
a reflection of the individual capacity to exploit resources rapidly. Additionally, the present
study shows that beech which was the superior competitor for light (Reiter et al., 2005) was
the superior competitor also for soil resources (i.e. soil water). These results are in
agreement with the other hypothesis of Grime (1977), that superior competitors for light
would be equally successful in competing for soil resources (cf. section 1.1.2).
When focusing on space occupation within both soil sub-samples, beech was more efficient
than spruce within the organic soil sub-sample, whereas spruce was more efficient within the
lower mineral soil. Such “habitat partitioning” between both competitors resulted in
decreased competition for water: Beech was more efficient in space exploitation within the
mineral, whereas spruce was more efficient in space exploitation within the organic soil sub-
sample. Such “habitat partitioning” may represent the mechanism allowing beech and spruce
to coexist in a short-term scale. On the other hand, such kind of partitioning may result in a
shift towards a more superficially distributed fine-root system of spruce in mixture with beech,
Summary
3
x
which suppose spruce to be at higher risk than beech at prolonged drought or regarding
hazards like wind-throw.
The competitive below-ground advantage of beech over spruce vanished under chronically
enhanced O3 exposure independent of the type of competition: The disturbance through
elevated O3 lowered the efficiency of beech in below-ground space occupation and the
efficiency of “running costs” relative to the corresponding efficiencies in control sub-plots.
Spruce, in contrast, showed similar below-ground space occupation under both O3 regimes
and types of competition.
The novel approach of a quantitative, space-related assessment of cost/benefit relationships
proved suitable to analyse the below-ground competitive ability of forest trees. Within the
studied soil depth of 20 cm and under control conditions, the higher below-ground
competitive ability of beech over spruce was reflected by higher efficiency in space
occupation and space exploitation. Both “efficiencies” can be explained with higher
morphological plasticity (i.e. specific fine-root length, turnover) of the beech fine-root system
relative to spruce. In contrast, spruce fine-roots, which appear to be more expensive than
beech fine-roots in terms of their structural costs per root length, were less efficient in space
occupation and exploitation within the studied soil depth. Independent of the type of
disturbance (i.e. drought or O3-fumigation) beech maintained an enhanced fine-root
production. Although the enhanced fine-root production is related with additional structural
costs (i.e. lower efficiency in space occupation), on a whole-tree level beech was less
imperilled to such disturbances than spruce.
Summary
4
xi
ABBREVIATIONS
Abbreviation
Unit
Parameter
A
AN
AOT40
ASW
BRC
BSE
BSO
D
DW
FRBmin
FRP
FRR
k
kc
l
L
L0
Li
Lmean
LN
LRprim
LRsec
Mmean
MN
MycTD
NRT
NWRT
cm2
cm2
nl l-1
mm m-2
m3 g-1C
ml l-1 day-1
m3 g-1C
mm
g
mg l-1
mg l-1
%
gCO2 m-2 h-1 per
1°C
cm
cm
cm
cm
cm
g
g
N cm-1
Surface root area;
Rootlet surface area at the time of harvest;
Accumulated exposure to ozone per year above a
threshold of 40 nl l-1 O3 and 50 W m-2 of total global
radiation;
Available soil water;
Belowground “running” costs
Belowground space exploitation
Belowground space occupation
Root diameter;
Dry weight;
Minimum standing fine-root biomass;
Fine-root production;
Fine-root recovery rate;
The ratio between a given soil volume and the contained
volume of the root biomass;
k assessed under control conditions (monoculture under
ambient ozone levels);
Correction factor accounting for stimulation effect of shed
foliage on soil respiration rate;
Total root length;
Initial rootlet length;
Rootlet length at a recording date i;
Mean standing rootlet length;
Rootlet length at the time of harvest;
Long lateral roots with primary xylem;
Long lateral roots with secondary xylem;
Mean standing rootlet biomass;
Dry biomass of the rootlet at the time of harvest;
Number of mycorrhized root tips per unit root length;
Number of root tips;
Number of the non-pigmented white root tips;
Abbreviations
5
xii
NSC
P
Pan
PTR
PSV
Q10
RB
RD
RL
RM
RN
RP
RR
RT
RR10
RRT
RRT(0)
RRbeech
RRspruce
RV
SDI
ShR
SRt
SRa
SRh
SR10
SRA
SRL
STD
SV
mg g-1
mm
mm yr-1
%
%
g
mg l-1
yr
%
g
g
nmol CO2 g-1 s-1
%
nmol CO2 g-1 s-1
nmol CO2 g-1 s-1
nmol CO2 g-1 s-1
nmol CO2 g-1 s-1
nmol CO2 g-1 s-1
cm3
cm
gCO2 m-2 h-1
gCO2 m-2 h-1
gCO2 m-2 h-1
gCO2 m-2 h-1
cm2 g-1
cm g-1
N cm-1
cm3
Non-structural carbohydrate concentration (integrates
sucrose, glucose, fructose, pinitol (in case of spruce) and
starch concentrations);
Precipitation;
Annual precipitation;
Proportion of each of a given fine-root category in the
total rootlet biomass;
Proportion of soil volume occupied by roots of a given
tree species within a given soil sub-sample;
Change in root respiration rate in response to a 10°C
change in temperature;
Root biomass;
Fine-root density;
Fine-root longevity;
Fine-root mortality rate;
Root necromass;
Fine-root production;
Root respiration rate;
Root turnover;
Root respiration rate at a standard temperature of 10°C;
Root respiration rate at a sample temperature T;
Root respiration rate at a temperature Ts(0);
Species-specific root respiration rate in beech;
Species-specific root respiration rate in spruce;
Root volume;
Stem diameter increment measured at 1.30 m
Short mycorrhizal roots
Total soil respiration;
“Autotrophic” soil respiration rate;
“Heterotrophic” soil respiration rate;
Soil respiration rate standardized to a temperature of
10°C;
Specific root area;
Specific root length;
Specific root tip density
Soil volume;
Abbreviations
6

xiii
SVpr
SWC
SWUM
SWURP
SUM0
Tair
Ts
Ts(0)
TGR
TSC
TSVpr
V
W
Wi
WU
WUE
δ13C
cm3
%
ml g-1 day-1
ml g-1 day-1
nl l-1
°C
°C
°C
kWh m-2
mg g-1
cm3
cm3
ml
ml
ml day-1
mmol mol-1
‰
Predicted soil volume which should to be occupied by
roots of a given tree species in mixed cultures;
Volumetric soil water content;
Daily water uptake rate of the rootlets per mean standing
root biomass;
Daily water uptake per unit of newly produced fine roots;
Accumulated exposure to ozone per year;
Air temperature;
Soil temperature;
Mean daily soil temperature as monitored at 0 cm soil
depth;
Total global radiation
Total sugar concentration (integrates sucrose, glucose,
fructose, and, in case of spruce, pinitol concentrations);
Predicted total soil volume;
Root volume;
Cumulative water uptake of the rootlets per rhizotrone;
Water consumption by rootlets at a recording date i;
Daily water uptake rate of the rootlets;
Water-use efficiency 13C/12C ratio;
Abbreviations
7

xiv
1 INTRODUCTION
1.1 Theories of plant competition
A series of influential works, ever since Darwin, suggest that species interactions such as
competition are the major impediment to species coexistence and community diversity, and
that competition plays a major role in shaping the structure of communities (Grace & Tilman,
1990). Competition is an interaction between individuals, brought about by shared
requirement for a resource in limited supply, and leading to a reduction in the survivorship,
growth and/or reproduction of at least some of the competing individuals concerned (Begon
et al., 1996). According to this definition, the competitive success of the individual plant
depends on the ability to efficiently acquire resources shared with neighbours. The
competitive interactions between neighbours can be intraspecific (between individuals of the
same species) or interspecific (between individuals of different species).
Burkholder (1952; after Grace & Tilman, 1990), in classifying the possible ways by which two
species may interact, used the term competition for a reciprocal negative interaction (- , -)
and the term amensialism for one-way negative interaction (0, -). The term amensialism was
replaced later, according to Connell (1983), by the term “asymmetrical” competition.
“Asymmetrical” competitive plant interactions were found by Connell (1983) in about 65% of
the studied cases. Further, Keddy & Shipley (1989) distinctly defined plant-plant interactions
as asymmetric and symmetric competition. Asymmetric competition takes place when the
intraspecific competition is stronger for one species (the dominant one) than the interspecific
competition, while for the other species (the subordinate one) the interspecific competition is
stronger than the intraspecific competition. Consistently, symmetric competition in a two-
species system occurs when the interspecific competition is stronger for both species than
the intraspecific competition.
1.1.1 Mechanisms of competition
Goldberg (1990) developed a mechanistic framework for studying interactions between
plants. The framework is based on the observation that most interactions between individual
plants actually occur indirectly through some intermediary (e.g. resources) and consist of two
distinct processes: one or both plants have an effect on the abundance of the intermediary
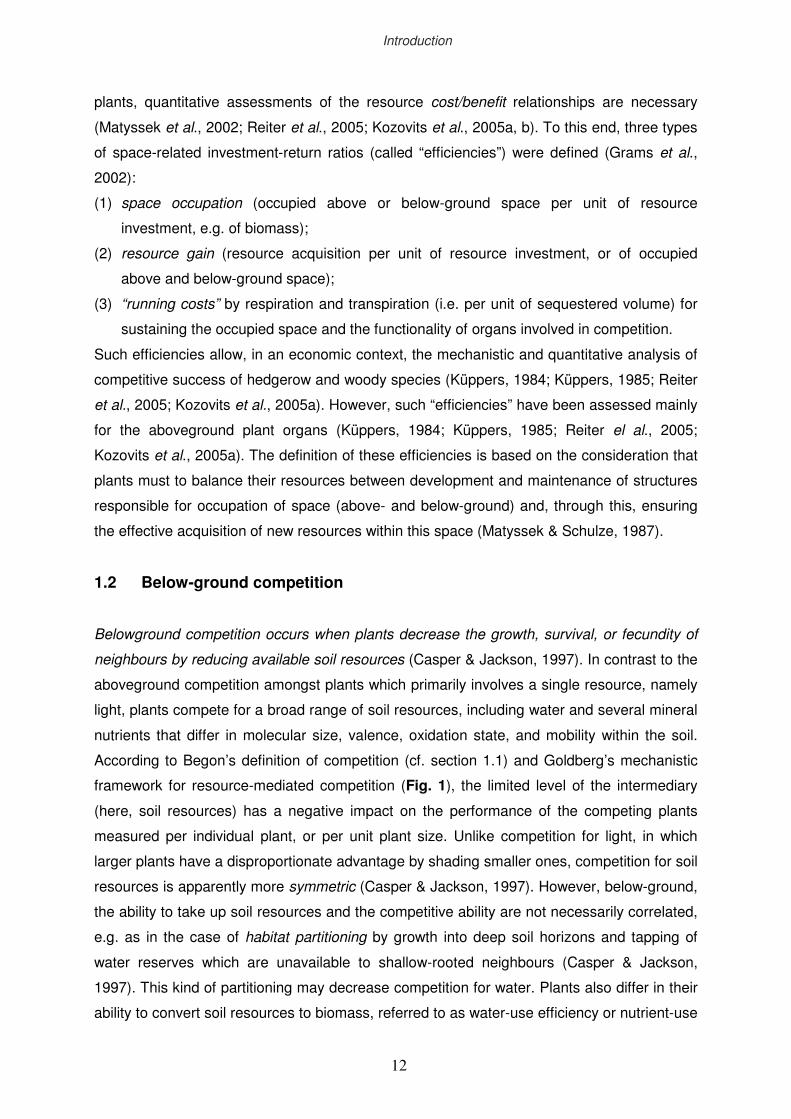
and a response to changes in abundance of the intermediary (Fig. 1).
Introduction
8
xv
Effect on a particular resource is defined as the per-individual or per-unit size rate of change
in the resource availability at a given abiotic supply rate. The most obvious mechanism
through which the plant can affect resource availability is depletion due to uptake. Although
depletion of light by plants has often been measured, less is reported about the magnitude of
effects on nutrients or water in the field. The magnitude of uptake effects is determined by
physiological activity rates and allocation to and spatial arrangement (architecture) of
resource-acquiring organs. Caldwell & Richards (1986) have argued that allocation and
architecture are of greater importance than physiological activity rates in determining relative
effects on resources among similar-sized plants.
Response to resources is defined as the relationship of some components of fitness (growth,
reserve storage, fructification and defence; Bazzaz & Grace, 1997) to resource availability,
where availability is determined by one or both of the neighbouring plants along with the
abiotic environment. When the resource is limiting, response will be determined by the
excess of uptake over loss of the resource and the new biomass (or seeds) that can be
produced per unit of internal stores. Assuming that growth is positively correlated with
fitness, there are three possible ways in which a plant may increase its fitness at low
resource levels: (1) increased resource uptake, (2) decreased resource loss, and/or (3)
increased efficiency of conversion of internal stores into new growth (Chapin et al., 1987).
Mechanisms such as directly harming a neighbouring plant, e.g. release of toxic substances,
mechanical abrasion or direct overgrowth are involved in the direct interactions between
competing plants. The result of such interactions can also affect the abundance of the
intermediary resource (Goldberg, 1990; Gersani et al., 2001; Reiter, 2004).
Plant Plant
Response Response
Effect Effect
Intermediary
Environment
Figure 1: The effect and response components of indirect interactions between plants. The intermediary could be resources, mutualists, natural enemies or even toxins, (from Goldberg, 1990).
Introduction
9
xvi
1.1.2 Determining the competitive success in plants
When competition is between individuals of similar size, effect on resources and response to
resources of both species must be taken into account to determine their net interaction. The
competitive success of each individual can be ranked in view of such effects and responses,
depending on the extent of suppressing or tolerating the neighbour. Two classical theories
exist on the determinants of competitive ability: The one was posed by Grime and the other
by Tilman (both reviewed by Grace, 1990). Grime (1977) associates competitive ability with
traits that maximize resource capture by individuals, i.e. the competitive success is a
reflection of the individual capacity to exploit resources rapidly. In his scheme, those plants
that during their live history are adapted to low levels of stress (defined as “the external
constraints which limit the rate of dry-matter production of all or part of the vegetation”) and
disturbance (defined as “mechanisms which limit the plant biomass by causing its
destruction”) are referred to as “competitive”. Additionally, Grime supports the idea that
superior competitors for light would be equally successful in competing for soil resources. In
contrast, Tilman (1982) defines a superior competitor for a resource as one whose
population can deplete the resource to a lower level at equilibrium. The species with the
lowest resource requirement will then competitively displace all other species at equilibrium.
However, when the community is not at equilibrium, traits other than the ability of individuals
to tolerate low resource levels become important. Moreover, Tilman supposed that plants
face a trade-off between their efficiency to compete for above- and below-ground resources,
and hence good competitors for light would have a low ability to exploit soil nutrients.
As shown above, the differences in concepts of expressing competitive ability between
Grime and Tilman are consistent also with their different assumptions about trade-offs for
different resources. These discussions so far have assumed that resource supplies are
constant. However, in nature, soil resources are often supplied by pulses due to sporadic
rainfall and the effects of temperature, moisture or organic deposition on microbial activity.
When resources occur by pulses, species with rapid uptake are more likely to be able to take
advantage of the pulse than are slower-growing species with low uptake rates but tolerance
of low resource levels (Grace, 1990).
In addition to the allocation in primary metabolism (growth), plants have other resource
demands related to the defence (secondary) metabolism (Herms & Mattson, 1992; Matyssek
et al., 2002). Hence, the competitive success depends on the efficiency of plant “allocation
strategies”, i.e., the internal conflict (or trade-off) in the allocation of the internal resources
(carbon, water, nutrients) to the different sinks (growth and/or defence; Fig. 2).
Introduction
10
xvii
The conceptual model proposed by Herms & Mattson (1992) claims that increasing (external)
resource availability from the level of limitation towards saturation does reduce the proportion
of secondary metabolites along with an increase in primary production. This reduction is
believed to occur at the expense of defence but in favour of a stimulated primary metabolism
and, as a consequence, fostered plant competitiveness (www.sfb607.de). This view supports
Grime’s theory according to which the abiotic stress (defined as disturbance reflected, e.g. by
increased allocation to secondary metabolism) is related to competition, whereas the
importance of competition (concerning growth as an outcome of competition and indicator of
individual fitness) decreases with increasing stress (Donovan & Richards, 2000). However,
the long-lived woody plants may reflect a “defence strategy” that differs along gradients of
natural productivity in quantitative and qualitative ways in relation to the primary and
secondary metabolism (Ladd & Facelli, 2005).
1.1.3 Quantifying the competitive success in plants: investments vs. returns
The competitive success in plants depends on the efficient allocation of nutrients and
assimilates to the different resource sinks (Bazzaz & Grace, 1997). Plants must balance their
functionality between (1) resource costs (investments), i.e., investment of internal resources
in structures for space sequestration (i.e. of the above- or belowground space that harbours
the external resources) and maintenance of such structures (resource-capturing organs)
within the occupied space, and (2) resource benefits (returns), i.e., acquisition of resources
from external pools which are shared with the neighbours. To understand competitiveness of
Figure 2: The conceptual model of resource allocation (adapted from Herms & Mattson, 1992; from Matyssek et al., 2002) along increasing resource availability, and the trade off between primary and secondary metabolism.
Introduction
11
xviii
plants, quantitative assessments of the resource cost/benefit relationships are necessary
(Matyssek et al., 2002; Reiter et al., 2005; Kozovits et al., 2005a, b). To this end, three types
of space-related investment-return ratios (called “efficiencies”) were defined (Grams et al.,
2002):
(1) space occupation (occupied above or below-ground space per unit of resource
investment, e.g. of biomass);
(2) resource gain (resource acquisition per unit of resource investment, or of occupied
above and below-ground space);
(3) “running costs” by respiration and transpiration (i.e. per unit of sequestered volume) for
sustaining the occupied space and the functionality of organs involved in competition.
Such efficiencies allow, in an economic context, the mechanistic and quantitative analysis of
competitive success of hedgerow and woody species (Küppers, 1984; Küppers, 1985; Reiter
et al., 2005; Kozovits et al., 2005a). However, such “efficiencies” have been assessed mainly
for the aboveground plant organs (Küppers, 1984; Küppers, 1985; Reiter el al., 2005;
Kozovits et al., 2005a). The definition of these efficiencies is based on the consideration that
plants must to balance their resources between development and maintenance of structures
responsible for occupation of space (above- and below-ground) and, through this, ensuring
the effective acquisition of new resources within this space (Matyssek & Schulze, 1987).
1.2 Below-ground competition
Belowground competition occurs when plants decrease the growth, survival, or fecundity of
neighbours by reducing available soil resources (Casper & Jackson, 1997). In contrast to the
aboveground competition amongst plants which primarily involves a single resource, namely
light, plants compete for a broad range of soil resources, including water and several mineral
nutrients that differ in molecular size, valence, oxidation state, and mobility within the soil.
According to Begon’s definition of competition (cf. section 1.1) and Goldberg’s mechanistic
framework for resource-mediated competition (Fig. 1), the limited level of the intermediary
(here, soil resources) has a negative impact on the performance of the competing plants
measured per individual plant, or per unit plant size. Unlike competition for light, in which
larger plants have a disproportionate advantage by shading smaller ones, competition for soil
resources is apparently more symmetric (Casper & Jackson, 1997). However, below-ground,
the ability to take up soil resources and the competitive ability are not necessarily correlated,
e.g. as in the case of habitat partitioning by growth into deep soil horizons and tapping of
water reserves which are unavailable to shallow-rooted neighbours (Casper & Jackson,
1997). This kind of partitioning may decrease competition for water. Plants also differ in their
ability to convert soil resources to biomass, referred to as water-use efficiency or nutrient-use
Introduction
12
xix
efficiency (Nobel, 1991; after Casper & Jackson, 1997), which can affect relative plant growth
rates across a soil resource gradient even in the absence of below-ground interactions. In
addition, direct interference in plant competition through allelopathy (Olofsdotter et al., 2002),
competition between plants and soil micro-organisms (Kaye & Hart, 1997), or mycorrhizae do
alter interactions between root systems in complex ways (Bauhus & Messier, 1999).
1.2.1 Mechanism of below-ground competition
Since the mechanism through which plants can affect soil resource availability is depletion
due to resource uptake (e.g. indirect root interactions, see Fig. 1), three general processes
by which soil resources can pass the root surface are involved in below-ground competition
(Casper & Jackson, 1997):
1. root interception: the capturing of water and nutrients as the root grows through the soil,
physically displacing soil particles and clay surfaces;
2. mass flow of water and dissolved mineral nutrients: is driven by plant transpiration, and is
a function of the rate of water movement to the root and the concentration of dissolved
nutrients in the soil solution; is more important for uptake of nitrogen, especially nitrate;
3. diffusion: occurs when nutrient uptake exceeds the supply by mass flow, creating a local
concentration gradient; is especially important for nutrients with large fractions bound to the
solid matrix, such as potassium and phosphate.
Besides root interception (accounts for less than 10% of the resource uptake by roots and is
the least important of the three processes), resource uptake (e.g. competition) via diffusion
has received the most attention, since the neighbouring roots reduce nutrient uptake when
nutrient depletion zones (i.e. the radius of the concentration gradient around roots; Walker et
al., 2003) overlap. Soil moisture and soil type were predicted to be the major determinants of
diffusive nutrients supply in the soil, and therefore the primary factors determining the
mechanisms of below-ground competition (Volder et al., 2005; Raynaud & Leadley, 2004).
This concept is less applicable to water and dissolved nutrients that are primary supplied by
mass flow. Regarding such nutrients, aboveground characteristics, such as maximum
transpiration rate or stomatal conductance, will both affect water uptake and will be affected
by the rate of water uptake (Schulze et al., 1994). Therewith, the most efficient way for a
plant to compete whit its neighbour is to take the resource before its neighbour does and
such indirect root interactions may favour speed over efficiency of nutrient uptake (Nobel
1991).
Introduction
13
xx
In addition to competition through resource depletion, contest competition may occur where
the roots of different individuals may interact directly by releasing organic compounds, such
as: toxic exudates that inhibit the growth of the neighbouring plants (Bais et al., 2003) as well
as releasing of non-toxic signals that indicate an individual’s presence (Bruin et al., 1995).
Such direct interactions may allow assessment of the origin of neighbouring roots (as self or
non-self, Gersani et al., 2001). Schenk et al. (1999) expect such responses to ensure that
root systems of different plants achieve a high degree of segregation (as shown for beech
and spruce roots in Schmid & Kazda, 2005). Such “ownership” of space allows a plant to
favour efficiency rather than speed of uptake when developing its root mass, architecture,
and uptake kinetics (Gersani et al., 2001). Understanding the mechanisms that control plant
competition for soil nutrients is an essential step in predicting the outcome of interspecific
competition, the role of niche differentiation in plant competition, and the interactions
between plant diversity and ecosystem functioning (Tilman, 1988).
1.2.2 Quantifying the competitive ability in plants below-ground
To understand the complex mechanisms of competition for soil resources, Casper & Jackson
(1997) consider morphological and physiological root attributes which correlate with the
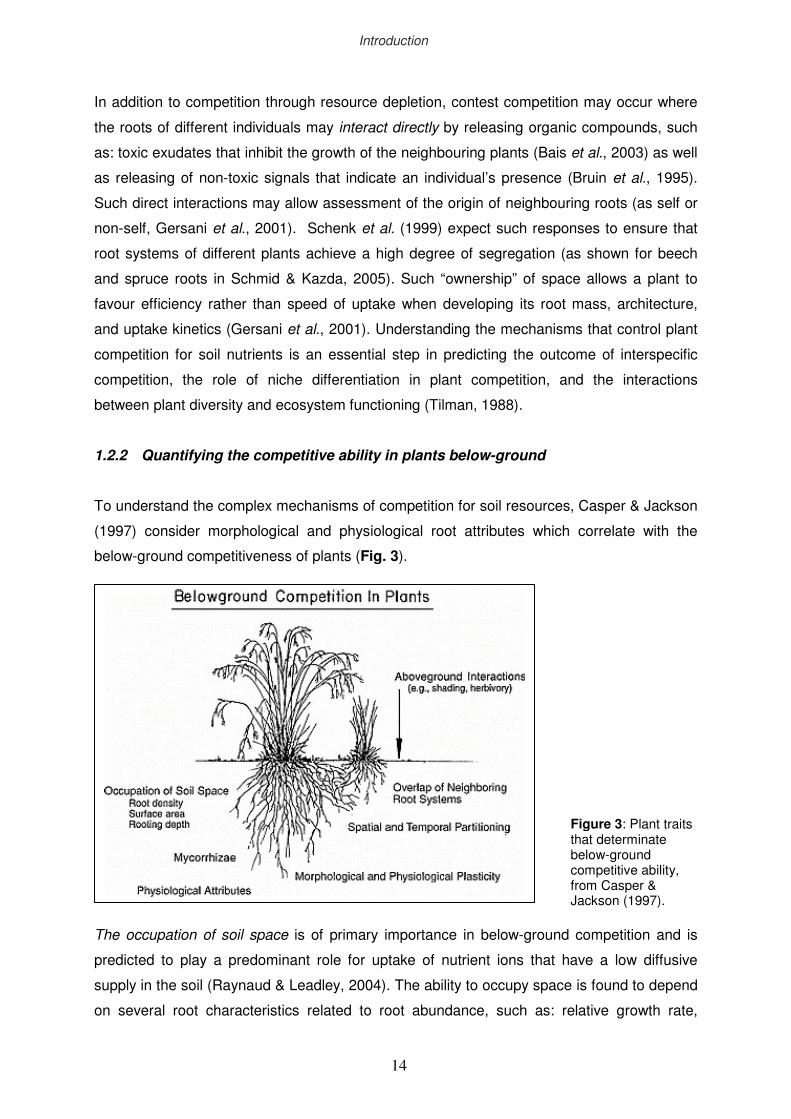
below-ground competitiveness of plants (Fig. 3).
The occupation of soil space is of primary importance in below-ground competition and is
predicted to play a predominant role for uptake of nutrient ions that have a low diffusive
supply in the soil (Raynaud & Leadley, 2004). The ability to occupy space is found to depend
on several root characteristics related to root abundance, such as: relative growth rate,
Figure 3: Plant traits that determinate below-ground competitive ability, from Casper & Jackson (1997).
Introduction
14
xxi
standing biomass and fine root longevity (Leuschner et al., 2001); or to morphological root
characteristics such as specific fine-root length (Grams et al., 2002; Kozovits et al., 2005a)
and root surface area (Raghothama & Karthikeyan, 2005). However, root abundance alone is
insufficient to explain the relative uptake rates among different tree species. In two grasses,
Caldwell et al. (1991) found the same acquisition of phosphate from nutrient patches despite
the difference in the root biomass. Other factors, such as mycorrhizae and their spatial and
temporal partitioning may explain the lack of close relationships between root density and the
outcome of competition. The ability to quickly adjust in morphological (demographic and
architectural) or physiological terms (enzymatic alterations, osmoregulation) to changes in
the local environment is defined as plasticity and is crucial for the competitive ability of plants
(Bliss et al., 2002; Hodge, 2004). This feature allows plant roots to proliferate into nutrient-
rich patches (Huang & Eissenstat, 2000); however, the costs of morphological plasticity,
uptake kinetics and mycorrhizal activity should by taken into account (Gersani et al., 2001).
For instance, Huang & Eissenstat (2000) report numerous evidences about considerable
energy investments related to patch space exploitation below-ground.
Traditionally, below-ground competition is quantified by the extent of reduced resource
uptake, vegetative growth or proliferation due to root interactions (Gersani et al., 1998;
O’Brien et al., 2005). The methods which are used for estimating below-ground competition
often affect soil environment, and hence, constrain sharing of resources. Another approach
which involves less manipulation is based on the estimation of changes in shared resources,
but problems of scaling may result. Casper & Jackson (1997) recommend combined
approaches to document both the resource intermediary and the significance of root
interactions on below-ground competition.
There is ongoing debate on the determinants by which species may be successful in
competition under changing environmental conditions, and on the relative importance of
competition per se in determining species composition of plant communities (Chesson,
2000). This question can be elucidated through productivity gradients as resulting from such
in resource availability. Such a gradient was experimentally employed within the framework
of the interdisciplinary research program Sonderforschungsbereich 607 (SFB 607) “Growth
and Parasite Defence – Competition for Resources in Economics of Plants from Agronomy
and Forestry”. A twice-ambient O3 regime (maximum level restricted to 150 nl l-1) was
employed to curtail carbon availability in plants upon O3-induced reduction of photosynthesis.
In this context, ozone was not regarded as an air pollutant, but as an analytical tool to
experimentally invoke disturbance in the carbon allocation of trees – i.e., to derive regulatory
mechanisms in allocation from the response to this kind of disturbance (Matyssek et al.,
2002).
Introduction
15
xxii
1.3 Competitiveness under the influence of ozone
The tropospheric O3 concentration has been increasing for several decades (Fabian, 2002),
and may nowadays reach peak concentrations of 100-200 nl l-1 in urban areas (Musselman
et al., 1994). It is widely recognised that this increase in ozone results from anthropogenic
pollution (e.g., car traffic, industry) at the local or trans-regional scale, and that ozone can
affect vegetation when exceeding natural, pre-industrial levels (Matyssek et al., 1995). One
important sink is the degradation and uptake of tropospheric ozone by plants.
1.3.1 Ozone impact on forest trees
Ozone enters plants by diffusion through stomata into the mesophyll. Injury to plant leaf
tissue results from oxidation of biological compounds by O3 and derivates like free radicals
(Mittler, 2002; Edreva, 2004), adversely affecting biochemical and physiological processes
(Polle, 1998). Ozone-induced alterations in plant growth and biomass allocation are
documented in crops (McCrady & Andersen, 2000), seedlings (Andersen & Rygiewicz,
1995), and juvenile trees (Utriainen & Holopainen, 2001; Uddling et al., 2004). The O3 effects
on above-ground plant parts may incite growth and crop reduction (Matyssek & Innes, 1999;
Giles, 2005), stimulation of carbonyl emissions from leaves (Cojocariu et al., 2005),
enhanced low-molecular antioxidant concentrations in leaves (Grulke et al., 2003), increased
phenolics in leaves (Saleem et al., 2001), enhanced 1-aminocyclopropane-1-carboxylate
(ACC) level, reduction of gas exchange and accelerated foliar senescence in fall (Matyssek
et al., 1992; Grulke et al., 2002; Nunn et al., 2005a). O3 injury is a consequence of the O3
uptake exceeding the detoxification capacity of the leaf mesophyll (Matyssek et al., 2004).
However, ozone impact on mature forest trees has rarely been examined experimentally; in
particular, (indirect) O3 effects on below-ground processes are hardly understood.
Several studies in juvenile and adult forest trees suggest a reduction in C allocation to roots
under both short-term and long-term ozone exposures (Scagel & Andersen 1997; Grulke et
al., 1998; Matyssek & Sandermann, 2003). The higher C demand in leaves under O3 stress
is reflected by C limitations within the root system which can disrupt their prominent function
to store the carbohydrate reserves (Andersen, 2003). In controlled experiments, ozone
fumigation of Ponderosa pine seedlings reduced the available starch reserves within fine and
coarse roots during the following spring (Andersen et al., 1991). Additionally, changes in the
translocation of photosynthate to sinks in roots lead to altered interactions with rhizospheric
micro-organisms (Andersen & Rygiewicz, 1995; Scagel & Andersen, 1997; McCrady &
Andersen, 2000; Andersen, 2003). Often the observed stimulation in bacterial and fungal
Introduction
16
xxiii
biomass disappeared after two years of O3 fumigation (Kasurinen et al., 1999), or decreased
at higher O3 levels compared to the control (Scagel & Andersen, 1997).
Although below-ground O3 effects have been frequently observed in controlled conditions,
ozone effects on roots of mature forest trees have rarely been documented. Most of the
reports are from forest sites in the San Bernardino Mountains, California, where the specific
climatic conditions combine with the air pollutants from Los Angeles, resulting in elevated
chronic O3 exposure at the local forest sites (Grulke et al., 1998). Ponderosa pine and Jeffery
pine being most sensitive to O3 showed depressed monosaccharide concentrations in fine
and coarse roots (Grulke et al., 2001) and a strong reduction in root biomass at the most
polluted relative to the least polluted site (Grulke et al., 1998). Simulated root dynamics of
individual adult sugar maple trees using the TREEGRO model (Retzlaff et al., 1996) confirm
the decline of fine and coarse root production as a response to ozone exposure. The
reductions in above- and below-ground biomass, and decreases in root exudation, root and
hyphal turnover due to elevated ozone levels can also significantly lower the C sink strength
and C input into the soil (Loya et al., 2003). O3 can alter C flux to soils also by changing leaf
litter quality (Saleem et al., 2001). Since belowground C allocation drives soil respiration
(Högberg et al., 2001), O3 may induce changes in soil CO2 efflux. Experimental studies on
Ponderosa pine seedlings (Scagel & Andersen, 1997) show increasing soil CO2 efflux in
response to O3. In forests, the response of soil respiration to ozone fumigation has not been
documented so far. A detailed review that emphasises O3 impact on physiological processes
within the complex plant-soil continuum is presented by Andersen (2003). The conceptual
diagram of this review (Fig. 4) shows the positions at which O3 disrupts the carbon flow in a
tree-soil system. Included is the transfer between below-ground biotic and abiotic
components that influence soil physical and chemical properties. Andersen (2003) points out
that future effort should be directed to quantifying changes that occur below-ground in
response to O3, and to their potential impact on the long-term stability of ecosystems.
However, the simultaneous influence of a multitude of interacting factors (e.g., N deposition,
drought events) makes it difficult to ascertain ozone specific reactions of forests (Grulke et
al., 2002; Grulke et al., 2003).
Introduction
17
xxiv
1.3.2 Ozone fumigation experiment at “Kranzberger Forst”
Investigations of the impact of ozone on young woody plants have typically been carried out
in fumigation chambers (Saurer et al., 1995; Kozovits et al., 2005; Nunn et al., 2005b), where
even minor ozone effects could be identified as a result of the well defined, controlled
conditions. Even open-top chamber experiments (Blaschke, 1990; Isebrands et al., 2001;
King et al., 2001) were limited to young trees. A novel free-air system for the O3 fumigation of
entire canopies was developed recently by Werner & Fabian (2002). This system is installed
in a mixed stand “Kranzberger Forst” near Freising (Germany) consisting of about 25-30 m
high spruce and beech trees which are 50 to 60 years old (Pretzsch et al., 1998). The system
has been operated since May 2000 in the framework of the interdisciplinary research
program Sonderforschungsbereich 607 (SFB 607) “Growth and Parasite Defence –
Competition for Resources in Economics of Plants from Agronomy and Forestry”. During the
first phase of this program, the main aim of the research was to clarify the efficiencies by
which space is being sequestered, exploited and sustained under contrasting environmental
conditions (Reiter, 2004, Reiter et al., 2005). Nunn et al. (2005a) summarize responses of
structural, phenological, physiological and biochemical parameters to high O3 doses in beech
and spruce at that site across three growing seasons (from 2000 to 2002). Responses of
Figure 4: Ozone effects on the C flow in a tree-soil system: arrows denote carbon flux pathways that are affected by O3. Dashed lines indicate where impact of O3 is expected but unknown (from Andersen, 2003).
Introduction
18
xxv
some parameters (e.g. length of growing season, leaf injury) tended to decrease from 2000
to 2002 and showed large variations at the different scaling levels and between foliage types
and growing seasons.
1.4 Competitiveness under the influence of drought
Drought represents the major constraint on plant growth and productivity in most terrestrial
plant communities (Chaves et al., 2002). Periods of soil and/or atmospheric water deficit
often occur during a plant’s life cycle even outside the arid/semi-arid regions, as reported for
temperate forests (Law et al., 2000). Water limitation can prove to be a critical constraint to
primary production under future climate scenarios of global change (Kalvova & Nemesova,
1997; Ciais et al., 2005). The plant’s competitive ability strongly relies on the water
availability during growth. In this way, the sequestration of the resource water is the pre-
requisite for growing structures, occupying space, exploiting that space for resources and, as
a consequence, out-competing neighbouring plants (Matyssek, 1999). In order to occupy and
exploit space, the rapidity in space occupation (e.g. the growth rate) is crucial for the
competitive success relative to neighbours. The implications of water shortage for the
metabolism and growth of trees have been studied intensively with emphasis mainly on
above-ground processes, and prognoses at the whole-tree level are greatly limited by the
lack of below-ground investigations (Joslin et al., 2000; Leuschner et al., 2001). Furthermore,
the root-growth strategies were found to differ distinctly between conifers and angiosperm
tree species (Bauhus & Messier, 1999; Schmid & Kazda, 2005). Consequently, a multi-level
whole-tree approach has to be adopted for quantifying drought responses of adult trees in
context of plant competition (Bréda & Granier, 1996).
Plant strategies to cope with drought normally involve a mixture of stress avoidance (e.g.
deep rooted perennials or winter/spring annuals) and tolerance “strategies” (e.g. drought-
tolerant sclerophyls) that vary with genotype. Plants can also endure drought conditions by
avoiding tissue dehydration, while maintaining tissue water potential as high is possible, or
by tolerating low tissue water potential. Dehydration avoidance is associated with a variety of
adaptive traits: (1) minimising water loss (e.g. by closing stomata, shedding of older leaves)
and (2) maximising water uptake (e.g. by adjusting the allocation pattern, namely increasing
investment in the roots; Jackson et al., 2000). Plant adjustments to the low resources include
altered leaf and/or root structure: whereas short-lived organs can be discarded in response
to stress, long-lived organs must optimise their resource gain. This response results in lower
turnover rates and therefore higher nutrient-use efficiency, which means that plants can
partially compensate for lower rate of carbon gain by investing less in new constructions
Introduction
19
xxvi
(Casper et al., 2001). However, long-lived structures have to tolerate and survive periods of
hostile environment, which require various protective mechanisms ranging from anatomical
and morphological characteristics to the biochemical mechanisms as osmotic adjustment
(Smirnoff, 1995). Another tolerance strategy to survive the dry season is the partial plant
dormancy (Mittler et al., 2001). Acclimatory changes in the root/shoot ratio or the temporary
accumulation of reserves in the stem under water deficit are accompanied by alterations in
carbon and nitrogen metabolism, the fine regulation of which is still largely unknown
(Pinheiro et al., 2001).
Under severe drought, it has been documented for soybean seedling experimental system
(Matyssek et al., 1991) that the water capacitance of roots does not support the above
ground growth, rather the roots exploit their own water storage and that of the shoot for
assuring their own growth. This behaviour appears to be the reason for the typically
enhanced root/shoot ratio of plants which grow under edaphically dry site conditions
(Matyssek, 1999). For forest trees it has been reported that species with deeper root systems
and higher root/shoot ratios are generally better adapted to dry climatic regimes than
shallow-rooted species (Caldwell & Richards, 1986; Kozlowski et al., 1991). Additionally,
several experimental studies indicate that, when trees experience moisture stress in one part
of the rooting zone, root growth increases in areas where water is still available, usually at
grater depths (Hendrick & Pregitzer, 1996). However, Osunubi & Davies (1981) found this to
be the case for seedlings of a deep-rooted tree species, but not for a shallow-rooted species.
Typically in dry habitats was found that taproots reaching deep and moist soil horizons or the
groundwater table provide water to the horizontally growing, shallow fine-root zone
underneath the soil surface, where root turn-over can be high (so called “hydraulic lift”,
Caldwell & Richards, 1989). By this, the environment (rhizosphere) within the shallow root
zone becomes favourable and stimulates for further root growth. The water released from
roots has implications for biotic interactions with rhizospheric organisms and other plants
attracted by the upper-most soil horizons.
In the southern part of Central Europe (where the experimental site is being situated) the
summer of 2003 was characterised by above-average insolation, distinctly enhanced daily
mean temperatures and exceptional drought conditions (Raspe, 2003). Such extremes
regarding Central-European summer conditions set the stage for evaluating the below-
ground responsiveness of both competitors to drought in a mixed beech-spruce stand
“Kranzberg Forst” near Freising/Germany.
Introduction
20
xxvii
1.5 Aim of the study
The focal point was on the tree root activities at the experimental site “Kranzberger Forst”. In
consistency with previous aboveground studies (from 1999 to 2002; Reiter et al., 2005), the
main aim was to quantify the physiological basis of belowground competitiveness between
deciduous broad-leaved Fagus sylvatica and evergreen coniferous Picea abies trees which
grew in a mixed forest during the experimental period of 2002 through 2004. Both species
are strong competitors according to comparable ecological power (Otto, 1994), and are of
major economic interest in Central-European forestry. In the present work, the below-ground
competitive ability of the experimental plants was investigated through combining
conventional with novel approaches of a quantitative, space-related assessment of
cost/benefit relationships. These latter approaches had successfully been used in previous
studies of aboveground competitiveness (Grams et al., 2002; Reiter et al., 2005; Kozovits et
al., 2005a, b). From main interests is to assert the explanatory power of the space-related
“cost/benefit relationship” approach for competition-related below-ground studies. In the
present work, tree response to free-air ozone fumigation at the crown level was related to
different water availability across the three experimental years (including the extraordinary
summer drought of 2003) to analyse the belowground responsiveness of both competitors to
disturbance under forest stand conditions.
The hypotheses to be examined were:
(i) Limited carbon gain by the foliage, as caused by O3 stress or water limitation, results
in stimulation of compensatory fine-root production;
(ii) Spruce being more conservative in resource turnover is less affected below-ground
by ozone stress than beech; conversely, relative to beech, the root system of spruce
is more affected by drought;
(iii) Ozone exposure enhances the CO2 efflux from the soil, whereas drought reduces this
efflux;
(iv) “Autotrophic” soil respiration (SRa: by roots and mycorrhizosphere) and
“heterotrophic” soil respiration (SRh: by free-living soil micro-organisms) differ in their
response to changing soil temperature and soil water content, with higher sensitivity
reflected in SRa;
(v) The responses of beech and spruce plants to O3 stress and water limitation depend
on type of competition (i.e. intra- or interspecific);
(vi) Below-ground competitiveness of adult beech and spruce trees is determined by
similar efficiency ratios as above-ground competitiveness.
Introduction
21
xxviii
2 MATERIAL AND METHODS
2.1 Site description
Measurements were made in a mixed forest of adult European beech (Fagus sylvatica L.)
and Norway spruce (Picea abies [L.] KARST) at “Kranzberger Forst” (48o25’08’’N,
11o39’41’’E, 490 m a.s.l.; Pretzsch et al. 1998, http://www.sfb607.de) near Freising/Germany.
Two groups of approximately 60-year-old beeches (60 to 100 individuals each) were
surrounded by spruce trees which were seven years younger but overtopped beech in
height. An understorey of Rubus fruticosa agg., Oxalis acetosella and the moss Hylocomium
splendens (Hedw.) B.S.G. (ground coverage of 5 to15 %) was present only under spruce.
Rooting depth was about 1m in a luvisol (FAO classification) which had developed from loess
over tertiary sediments and provided ample water and nutrient supply. Local climate
classified as temperate (sub-atlantic to sub-continental) was characterized by a mean daily
air temperature and annual precipitation of 7.8°C and 785 mm, respectively (30-year record
each, 1970 through 2000), with periods of snow cover between December and February.
Climatic data during the 3-year study period (2002, 2003 and 2004) are shown in Tab. 1.
The summer of 2003 was characterised by above-average Tair of the growing season and
exceptional drought conditions. The climatic extremes across the study years regarding
Central-European summer conditions set the stage for evaluating the responsiveness of both
competitors to drought in the mixed beech-spruce stand of “Kranzberger Forst”.
Table 1: Climatic data summarized for 2002, 2003, and 2004 and for the 30-year record 1970 through 2000. Air temperature (Tair) and precipitation (P) were measured at neighbouring Level II monitoring site “Freising”, LWF. Soil temperature (Ts) was recorded at the border of the humus layer and mineral soil at the site “Kranzberger Forst”. Growing season is defined as May 1 through September 30 (according to Otto, 1994).
Year
Mean annual Tair (oC)
Mean Tair of growing season (oC)
Mean Ts (oC)
Mean Ts of growing season (oC)
Annual P (mm)
P during growing season (mm)
2002
8.88
15.74
8.13
13.44
1015
539
2003
8.81
18.01
7.93
14.28
558
279
2004
8.07
15.13
8.09
13.04
779
373
1970-2000*
7.82
14.81
n.d.
n.d.
786
442
* Data from DWD station „Weihenstephan“; n.d. = not determined
Material and Methods
22
xxix
2.2 Species description
2.2.1 European Beech (Fagus sylvatica L.)
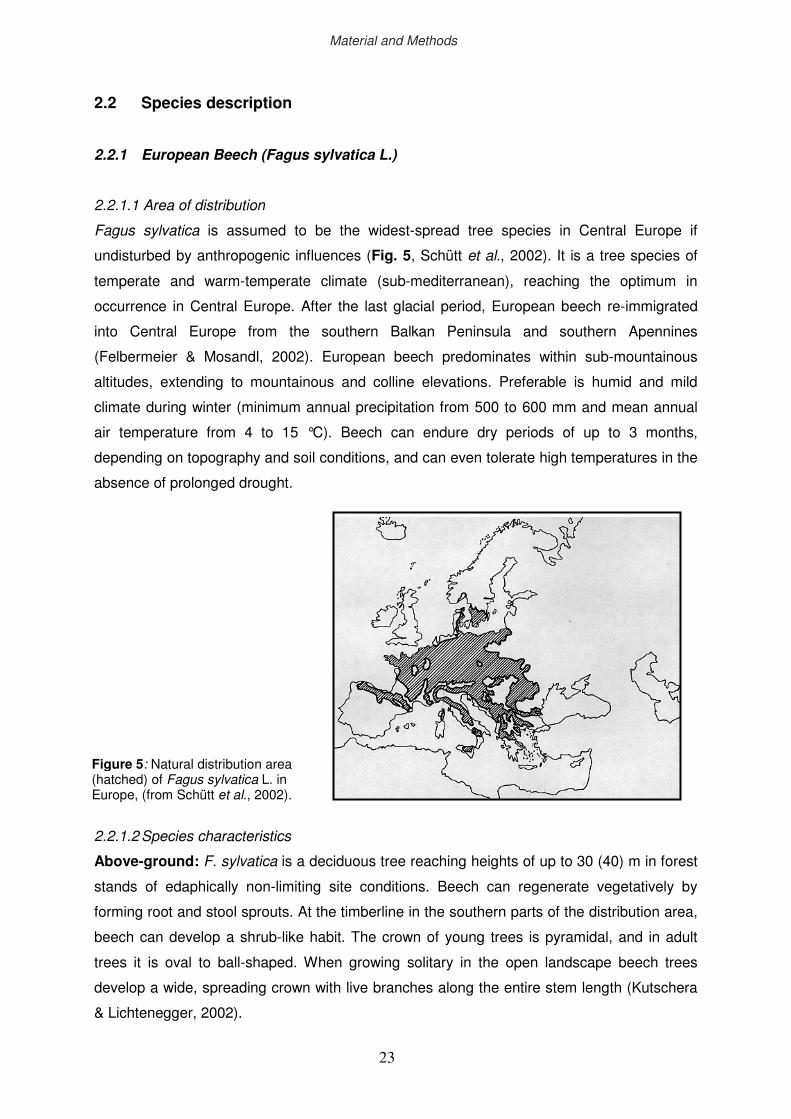
2.2.1.1 Area of distribution
Fagus sylvatica is assumed to be the widest-spread tree species in Central Europe if
undisturbed by anthropogenic influences (Fig. 5, Schütt et al., 2002). It is a tree species of
temperate and warm-temperate climate (sub-mediterranean), reaching the optimum in
occurrence in Central Europe. After the last glacial period, European beech re-immigrated
into Central Europe from the southern Balkan Peninsula and southern Apennines
(Felbermeier & Mosandl, 2002). European beech predominates within sub-mountainous
altitudes, extending to mountainous and colline elevations. Preferable is humid and mild
climate during winter (minimum annual precipitation from 500 to 600 mm and mean annual
air temperature from 4 to 15 °C). Beech can endure dry periods of up to 3 months,
depending on topography and soil conditions, and can even tolerate high temperatures in the
absence of prolonged drought.
2.2.1.2 Species characteristics
Above-ground: F. sylvatica is a deciduous tree reaching heights of up to 30 (40) m in forest
stands of edaphically non-limiting site conditions. Beech can regenerate vegetatively by
forming root and stool sprouts. At the timberline in the southern parts of the distribution area,
beech can develop a shrub-like habit. The crown of young trees is pyramidal, and in adult
trees it is oval to ball-shaped. When growing solitary in the open landscape beech trees
develop a wide, spreading crown with live branches along the entire stem length (Kutschera
& Lichtenegger, 2002).
Figure 5: Natural distribution area (hatched) of Fagus sylvatica L. in Europe, (from Schütt et al., 2002).
Material and Methods
23
xxx
Below-ground: Beech develops a typical “heart-root system”, occupying moderately deep
soil layers as depending on topography and soil conditions. The majority of coarse roots (>2
mm in diameter) proliferate vertically in the proximity of the stem basis, reaching deeper soil
layers. In beech stands, the numerous and densely packed root ramifications often show
symphyses within or between root systems of individual trees. In adult beech trees, roots
contribute little to the total plant biomass (13 to 17%, according to Möller et al., 1954), which
is explained by the low fraction of large roots (diameter >20 mm). The widely reported high
root density in beech is due to the high fraction of fine roots (diameter < 2 mm) which are
located together with small roots (2-5 mm in diameter) within soil layers rich in organic
matter. Coarse roots of the mineral soil rather than topsoil are characterised by low
branching into fine roots (Kutschera & Lichtenegger, 2002). The fine roots of beech are
highly colonised by ectomycorrhizal fungi (Leuschner et al., 2004).
Deep-rooting is not strongly pronounced in beech: The mean rooting depth is 120-140 cm
(Köstler et al., 1968). In compacted loamy soils, as luvisoils, beech is rooting at a maximum
depth of 80 to 90 cm. On poorly aerated and waterlogged soils, rooting depth can be
restricted to 50-70 cm. At favourable site conditions (soil temperature > 0°C), root growth in
beech can be maintained during the whole year with 2 periods of intense increment: in spring
(April/May) and in fall, after a short break in summer (Göttsche, 1972). Beech fine roots are
protected against pathogenic infection and drought due to cell-wall cutinisation in the
rhizodermis (Kutschera & Lichtenegger 2002). Leuschner et al. (2001) reported increasing
mortality of finest roots (diameter < 1mm) in beech during summer drought but compensatory
production upon re-wetting of the soil.
2.2.2 Norway Spruce (Picea abies (L.) Karsten)
2.2.2.1 Area of distribution
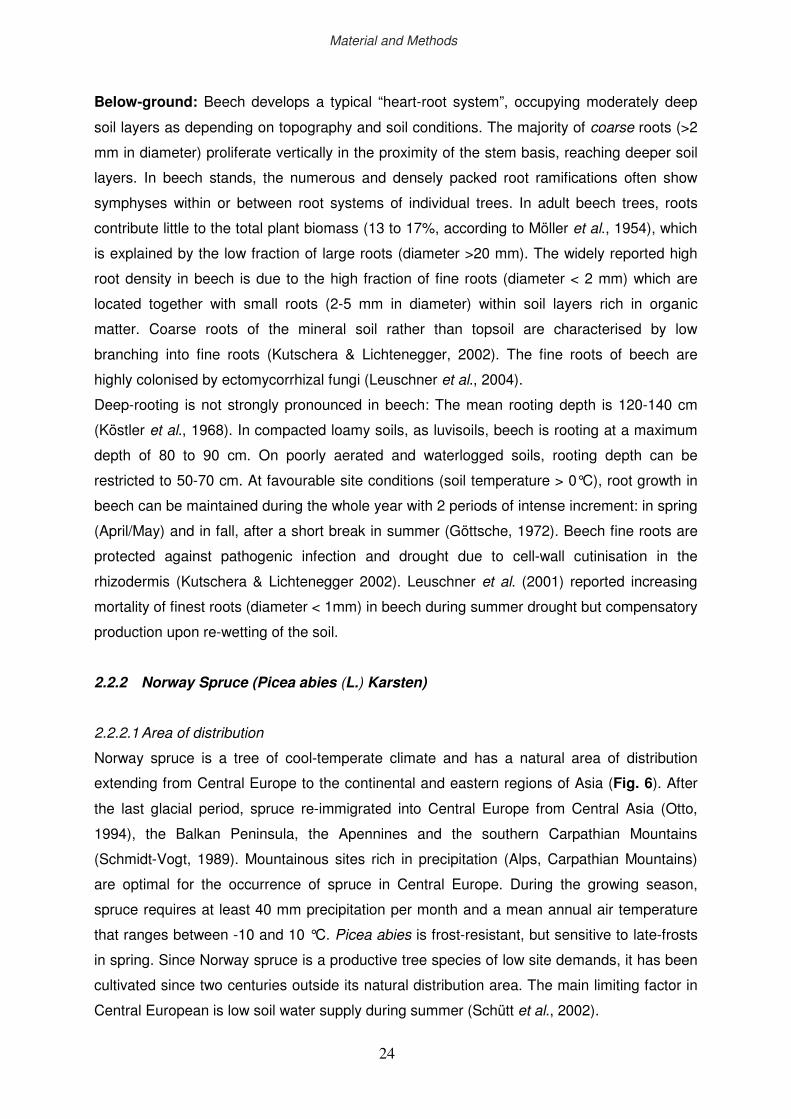
Norway spruce is a tree of cool-temperate climate and has a natural area of distribution
extending from Central Europe to the continental and eastern regions of Asia (Fig. 6). After
the last glacial period, spruce re-immigrated into Central Europe from Central Asia (Otto,
1994), the Balkan Peninsula, the Apennines and the southern Carpathian Mountains
(Schmidt-Vogt, 1989). Mountainous sites rich in precipitation (Alps, Carpathian Mountains)
are optimal for the occurrence of spruce in Central Europe. During the growing season,
spruce requires at least 40 mm precipitation per month and a mean annual air temperature
that ranges between -10 and 10 °C. Picea abies is frost-resistant, but sensitive to late-frosts
in spring. Since Norway spruce is a productive tree species of low site demands, it has been
cultivated since two centuries outside its natural distribution area. The main limiting factor in
Central European is low soil water supply during summer (Schütt et al., 2002).
Material and Methods
24
xxxi
2.2.2.2 Species characteristics
Above-ground: P. abies is an evergreen tree that reaches heights of up to 40 (50) m on
edaphically non-limiting sites. It grows in a monopodial way, forming a straight and cylindrical
stem. The crown is pyramidal and its length and form depends on the stand structure and
climate. Wide crowns are typical in trees growing at lower altitudes, and more tapered
crowns are characteristic in northern Europe and in mountainous regions (Schmidt-Vogt,
1989). Three different branching patterns exist: the prevailing “brush” type, a “comb” type,
and a “plate” type. All these types of branching are genetically fixed and can occur on
different individuals within the same stand. Vegetative regeneration in spruce is rarely
observed, but can occur at cold and N-exposed sites (Kutschera & Lichtenegger, 2002).
Below-ground: Spruce forms shallow root systems, characterized by a flat root plate with
numerous vertical ramifications. In adult trees, this plate forms robust sinker roots. On poorly
aerated, loamy or wet soils, the sinker roots are poorly developed and reach low depth only.
Flat root plates are also formed in cold or warm but dry forest soils. However, on well
aerated, nutrient-rich and moist soils, the sinker roots of spruce can reach a depth of 150 to
170 cm. Horizontally spruce roots can spread across 18 m (Köstler et al., 1968). Symphyses
are often observed in spruce stands and may be present in 35% of the trees. Since 60 to
80% of the root system is located within the upper soil horizons, spruce is susceptible to
wind-throw. Fine-root production depends on soil temperature, moisture and aeration. Fine-
root density decreases rapidly with soil depth. In adult trees, roots amount to 15 and 25% in
the total plant biomass depending on site conditions. Fine roots of Norway spruce are highly
ectomycorrhizal (Göttsche, 1972).
Figure 6: Natural distribution area (hatched) of Picea abies in Europe (from Schütt et al., 2002).
Material and Methods
25
xxxii
The mean rooting depth of spruce is 80 to 100 cm, whereas the maximal fine root density is
located at the transition between organic (Oh) and humic (Ah) topsoil layers (Göttsche, 1972;
Ammer & Wagner, 2002). A remarkably low fine-root density was observed within the organic
topsoil as a result of drought (Kutschera & Lichtenegger, 2002). Distorted vertical
ramifications of coarse roots were present in loamy, poorly aerated mineral soil. Fine-root
growth of Norway spruce is restricted in strongly compacted soil horizons (e.g. at soil density
>1.3 kg l-1; Köstler et al., 1968) or in waterlogged soils. Root growth of spruce initiates in
spring before bud burst and reaches a maximum by early summer. In the absence of drought
and at soil temperatures above 6°C (Ladefoged, 1939; from Puhe, 2003), intense root growth
can occur in autumn and continue through early winter. Summer drought may disrupt root
growth so that root tips become suberized and stay brownish as during winter, thus the
discolouration rapidly extends to the root tip (Puhe, 2003). Fine roots of P. abies reduce
growth when exposed to increased N input and increased soil acidity, being accompanied by
reduced mycorrhizal frequency (Kutschera & Lichtenegger 2002).
2.2.3 Central European mixed forests with Fagus sylvatica and Picea abies
Central European forests tend to display homogeneous structure during the final stage of
development (Schütz, 1990). Natural mixed forests prevail in the transition zone between
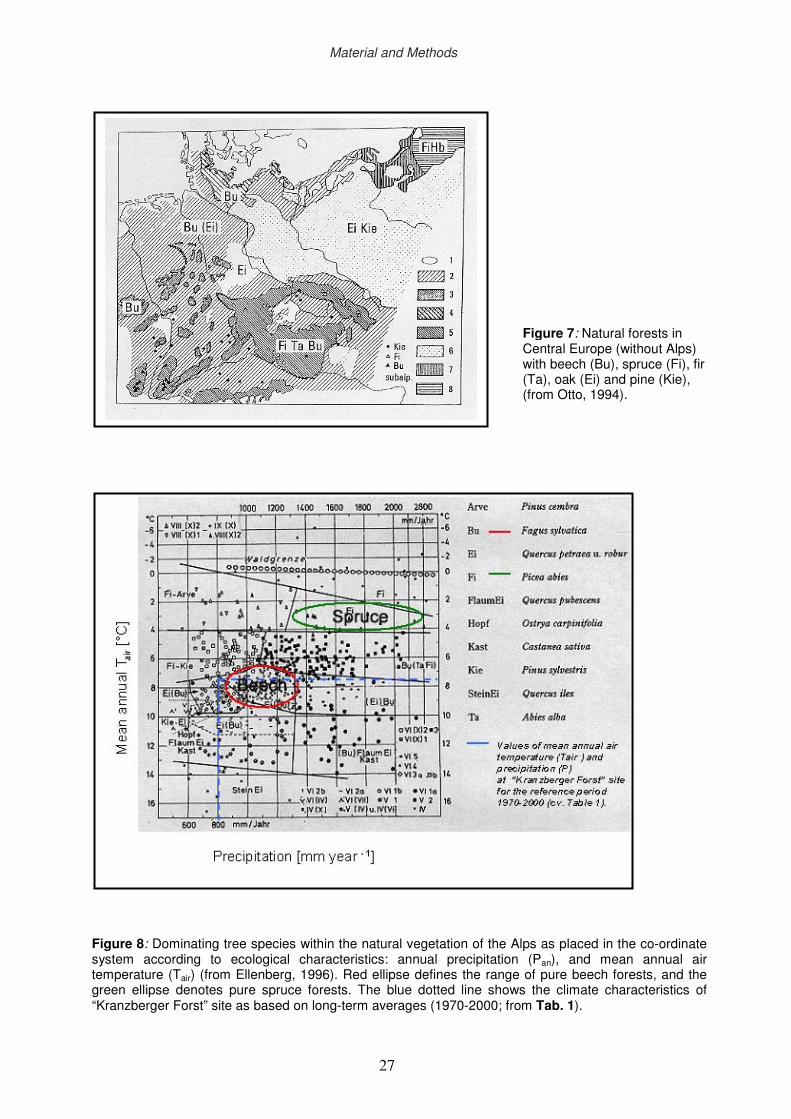
different climate regions (Fig. 7). One example is the natural beech-fir-spruce forest, which is
one of the most productive forests in Europe (Otto, 1994). However, mixed forests with only
beech and spruce exist rarely in nature (e.g. predominantly in mountainous regions). The
higher physiological power of beech may be one reason (Otto, 1994). The physiological
power is defined by Otto (1994) as the interaction of three factors. One factor is related to the
species-specific requirement for climate and soil properties. Beech typically grows on warmer
sites with less annual precipitation in comparison with spruce (Fig. 8). The second factor is
the species-specific competitive ability. At comparable shade tolerance, biomass production
and regeneration capacity, beech shows higher stand stability than spruce. However, the
below-ground competitive ability of both tree species, when growing under same stand
conditions, has rarely been studied (Schmid & Kazda, 2002). This latter issue was, however,
the aim of this present study. The third factor is related to the external hazards of the
species. Spruce is more endangered from forest fire and biotic enemies than beech. As an
example, a study in Switzerland showed that heartwood decay in spruce accelerated in
mixed culture with beech, but decreased when spruce grew in mixture with fir (Schütz, 1990).
Material and Methods
26
xxxiii
Figure 8: Dominating tree species within the natural vegetation of the Alps as placed in the co-ordinate system according to ecological characteristics: annual precipitation (Pan), and mean annual air temperature (Tair) (from Ellenberg, 1996). Red ellipse defines the range of pure beech forests, and the green ellipse denotes pure spruce forests. The blue dotted line shows the climate characteristics of “Kranzberger Forst” site as based on long-term averages (1970-2000; from Tab. 1).
Figure 7: Natural forests in Central Europe (without Alps) with beech (Bu), spruce (Fi), fir (Ta), oak (Ei) and pine (Kie), (from Otto, 1994).
Material and Methods
27
xxxiv
Since spruce shows very high productivity in natural stands, spruce was planted on former
beech stands across Central and Eastern Europe, as the need for timber increased during
the 18th century. Nowadays, cultivation of pure spruce and mixed beech-spruce forests has
become a major economic interest in Central-European forestry. Mixed beech-spruce forests
are preferable because of their stabilising effect on biodiversity (Schütz, 1990). According to
common silvicultural practice, beech trees are usually planted as small (500 to 1000 m2) or
big (1000 to 5000 m2) groups in view of effective management (Ammer, pers. comm.).
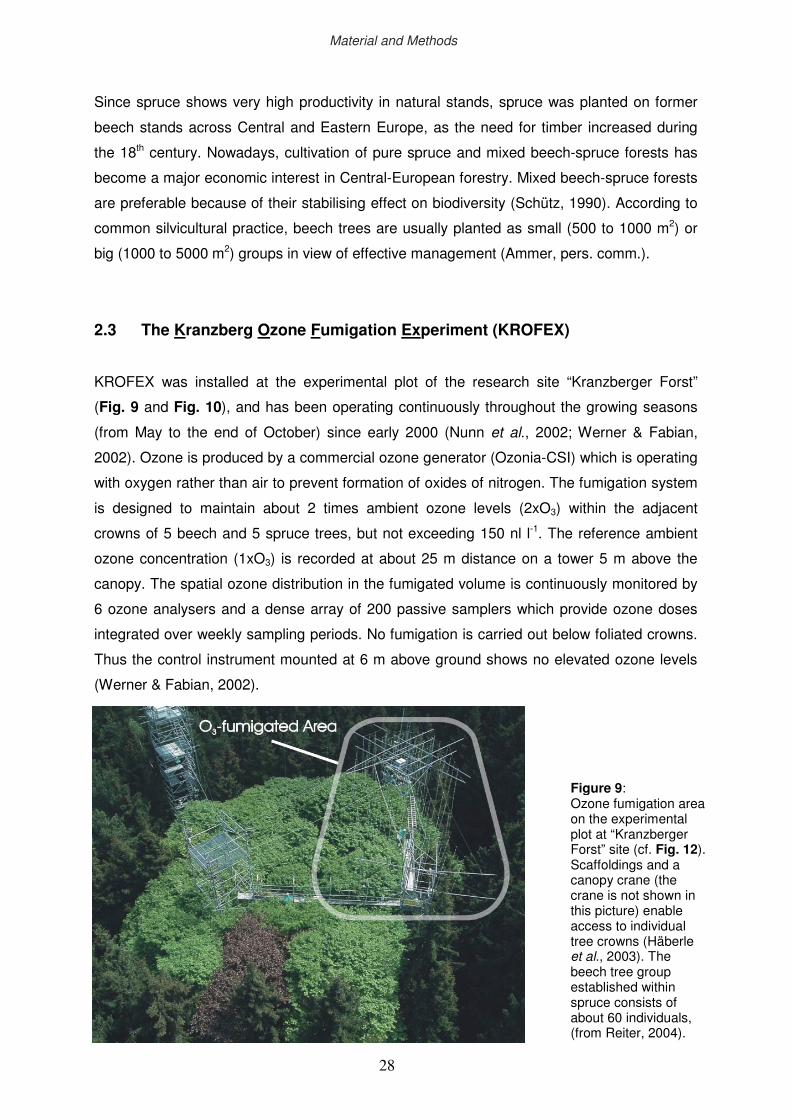
2.3 The Kranzberg Ozone Fumigation Experiment (KROFEX)
KROFEX was installed at the experimental plot of the research site “Kranzberger Forst”
(Fig. 9 and Fig. 10), and has been operating continuously throughout the growing seasons
(from May to the end of October) since early 2000 (Nunn et al., 2002; Werner & Fabian,
2002). Ozone is produced by a commercial ozone generator (Ozonia-CSI) which is operating
with oxygen rather than air to prevent formation of oxides of nitrogen. The fumigation system
is designed to maintain about 2 times ambient ozone levels (2xO3) within the adjacent
crowns of 5 beech and 5 spruce trees, but not exceeding 150 nl l-1. The reference ambient
ozone concentration (1xO3) is recorded at about 25 m distance on a tower 5 m above the
canopy. The spatial ozone distribution in the fumigated volume is continuously monitored by
6 ozone analysers and a dense array of 200 passive samplers which provide ozone doses
integrated over weekly sampling periods. No fumigation is carried out below foliated crowns.
Thus the control instrument mounted at 6 m above ground shows no elevated ozone levels
(Werner & Fabian, 2002).
Figure 9: Ozone fumigation area on the experimental plot at “Kranzberger Forst” site (cf. Fig. 12). Scaffoldings and a canopy crane (the crane is not shown in this picture) enable access to individual tree crowns (Häberle et al., 2003). The beech tree group established within spruce consists of about 60 individuals, (from Reiter, 2004).
Material and Methods
28
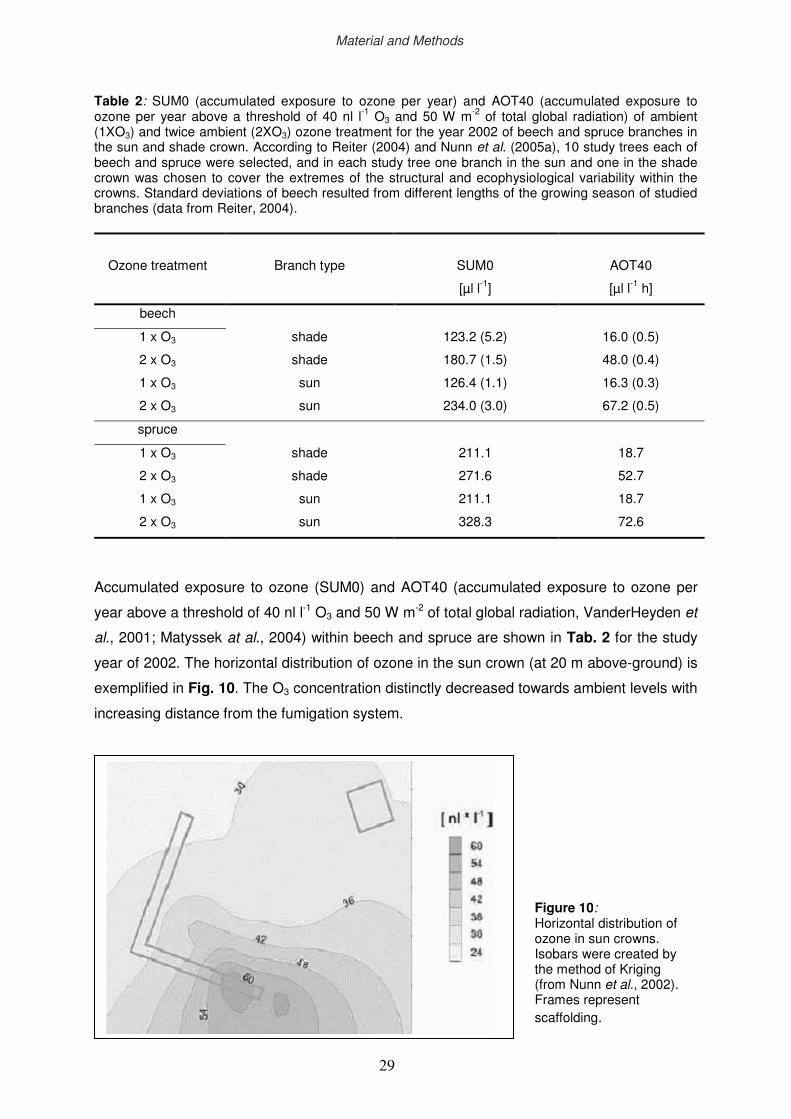
xxxv
Table 2: SUM0 (accumulated exposure to ozone per year) and AOT40 (accumulated exposure to ozone per year above a threshold of 40 nl l-1 O3 and 50 W m-2 of total global radiation) of ambient (1XO3) and twice ambient (2XO3) ozone treatment for the year 2002 of beech and spruce branches in the sun and shade crown. According to Reiter (2004) and Nunn et al. (2005a), 10 study trees each of beech and spruce were selected, and in each study tree one branch in the sun and one in the shade crown was chosen to cover the extremes of the structural and ecophysiological variability within the crowns. Standard deviations of beech resulted from different lengths of the growing season of studied branches (data from Reiter, 2004).
Ozone treatment
Branch type
SUM0
[µl l-1]
AOT40
[µl l-1 h]
beech
1 x O3 shade 123.2 (5.2) 16.0 (0.5)
2 x O3 shade 180.7 (1.5) 48.0 (0.4)
1 x O3 sun 126.4 (1.1) 16.3 (0.3)
2 x O3 sun 234.0 (3.0) 67.2 (0.5)
spruce
1 x O3 shade 211.1 18.7
2 x O3 shade 271.6 52.7
1 x O3 sun 211.1 18.7
2 x O3 sun 328.3 72.6
Accumulated exposure to ozone (SUM0) and AOT40 (accumulated exposure to ozone per
year above a threshold of 40 nl l-1 O3 and 50 W m-2 of total global radiation, VanderHeyden et
al., 2001; Matyssek at al., 2004) within beech and spruce are shown in Tab. 2 for the study
year of 2002. The horizontal distribution of ozone in the sun crown (at 20 m above-ground) is
exemplified in Fig. 10. The O3 concentration distinctly decreased towards ambient levels with
increasing distance from the fumigation system.
Figure 10: Horizontal distribution of ozone in sun crowns. Isobars were created by the method of Kriging (from Nunn et al., 2002). Frames represent scaffolding.
Material and Methods
29
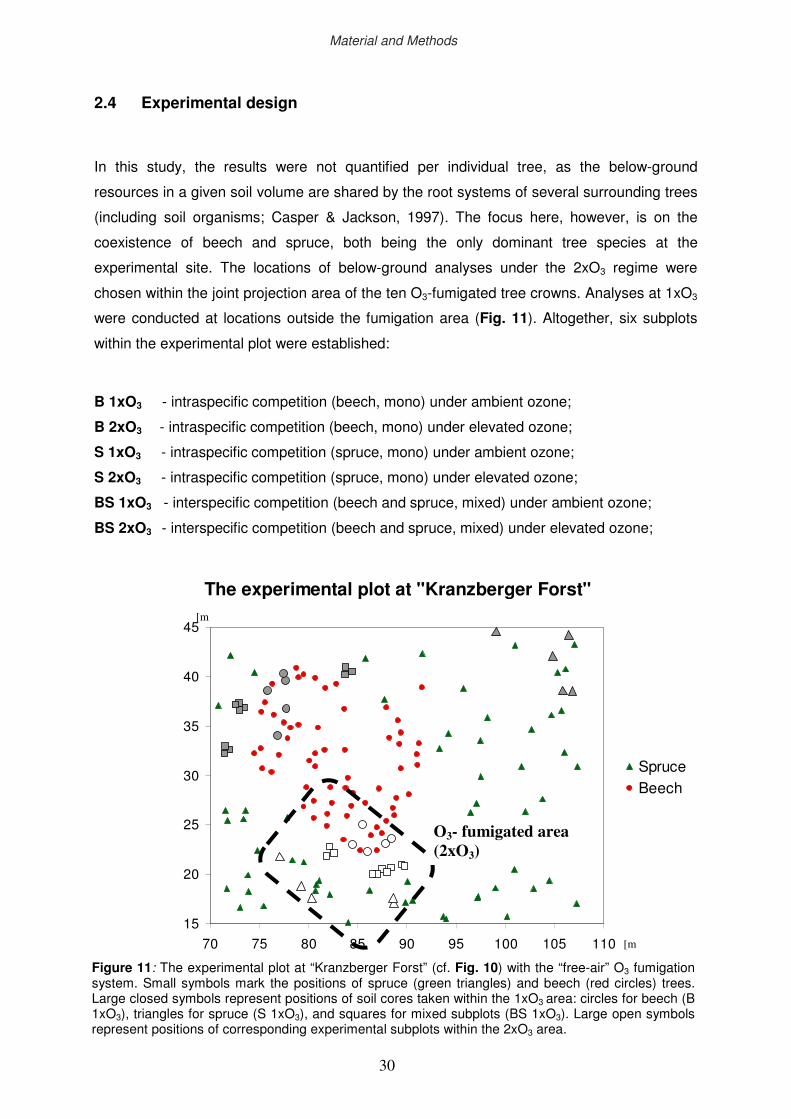
xxxvi
2.4 Experimental design
In this study, the results were not quantified per individual tree, as the below-ground
resources in a given soil volume are shared by the root systems of several surrounding trees
(including soil organisms; Casper & Jackson, 1997). The focus here, however, is on the
coexistence of beech and spruce, both being the only dominant tree species at the
experimental site. The locations of below-ground analyses under the 2xO3 regime were
chosen within the joint projection area of the ten O3-fumigated tree crowns. Analyses at 1xO3
were conducted at locations outside the fumigation area (Fig. 11). Altogether, six subplots
within the experimental plot were established:
B 1xO3 - intraspecific competition (beech, mono) under ambient ozone;
B 2xO3 - intraspecific competition (beech, mono) under elevated ozone;
S 1xO3 - intraspecific competition (spruce, mono) under ambient ozone;
S 2xO3 - intraspecific competition (spruce, mono) under elevated ozone;
BS 1xO3 - interspecific competition (beech and spruce, mixed) under ambient ozone;
BS 2xO3 - interspecific competition (beech and spruce, mixed) under elevated ozone;
[m
]
[m
]
The experimental plot at "Kranzberger Forst"
15
20
25
30
35
40
45
70 75 80 85 90 95 100 105 110
SpruceBeech
O3- fumigated area
(2xO3)
Figure 11: The experimental plot at “Kranzberger Forst” (cf. Fig. 10) with the “free-air” O3 fumigation system. Small symbols mark the positions of spruce (green triangles) and beech (red circles) trees. Large closed symbols represent positions of soil cores taken within the 1xO3 area: circles for beech (B 1xO3), triangles for spruce (S 1xO3), and squares for mixed subplots (BS 1xO3). Large open symbols represent positions of corresponding experimental subplots within the 2xO3 area.
Material and Methods
30
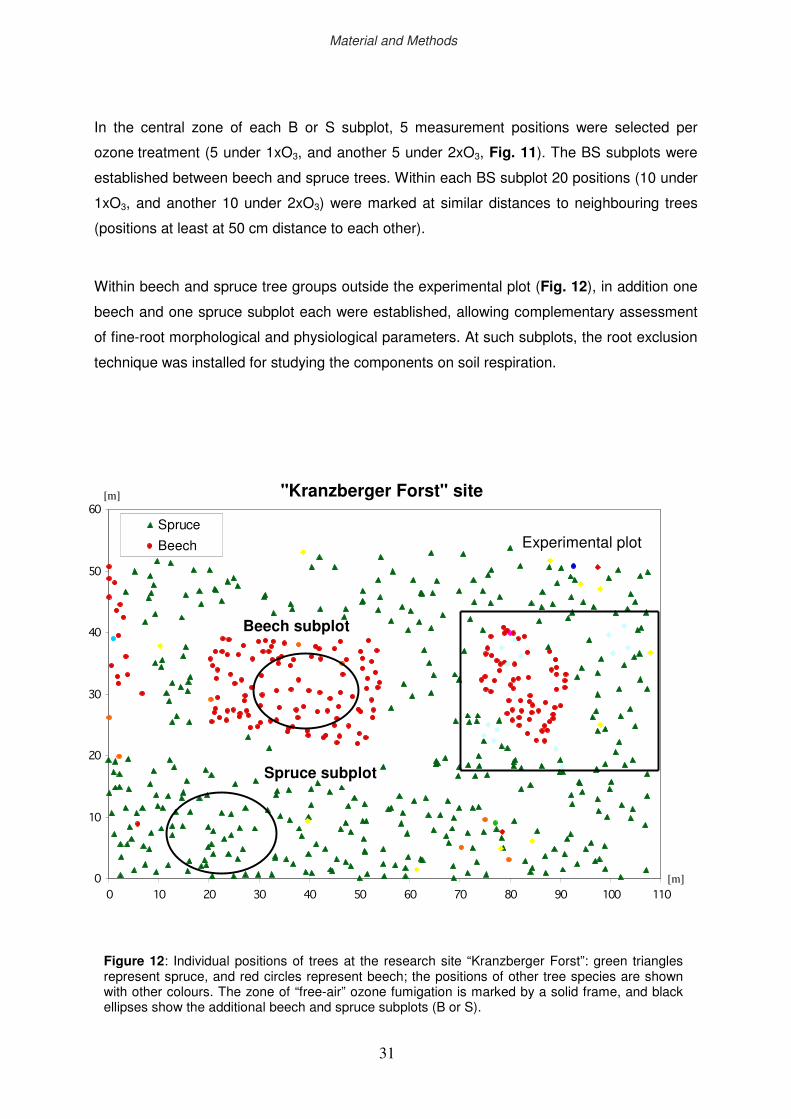
xxxvii
In the central zone of each B or S subplot, 5 measurement positions were selected per
ozone treatment (5 under 1xO3, and another 5 under 2xO3, Fig. 11). The BS subplots were
established between beech and spruce trees. Within each BS subplot 20 positions (10 under
1xO3, and another 10 under 2xO3) were marked at similar distances to neighbouring trees
(positions at least at 50 cm distance to each other).
Within beech and spruce tree groups outside the experimental plot (Fig. 12), in addition one
beech and one spruce subplot each were established, allowing complementary assessment
of fine-root morphological and physiological parameters. At such subplots, the root exclusion
technique was installed for studying the components on soil respiration.
Figure 12: Individual positions of trees at the research site “Kranzberger Forst”: green triangles represent spruce, and red circles represent beech; the positions of other tree species are shown with other colours. The zone of “free-air” ozone fumigation is marked by a solid frame, and black ellipses show the additional beech and spruce subplots (B or S).
0
10
20
30
40
50
60
0 10 20 30 40 50 60 70 80 90 100 110
Spruce
Beech
Beech subplot
Spruce subplot
[m]
[m] "Kranzberger Forst" site
Experimental plot
Material and Methods
31
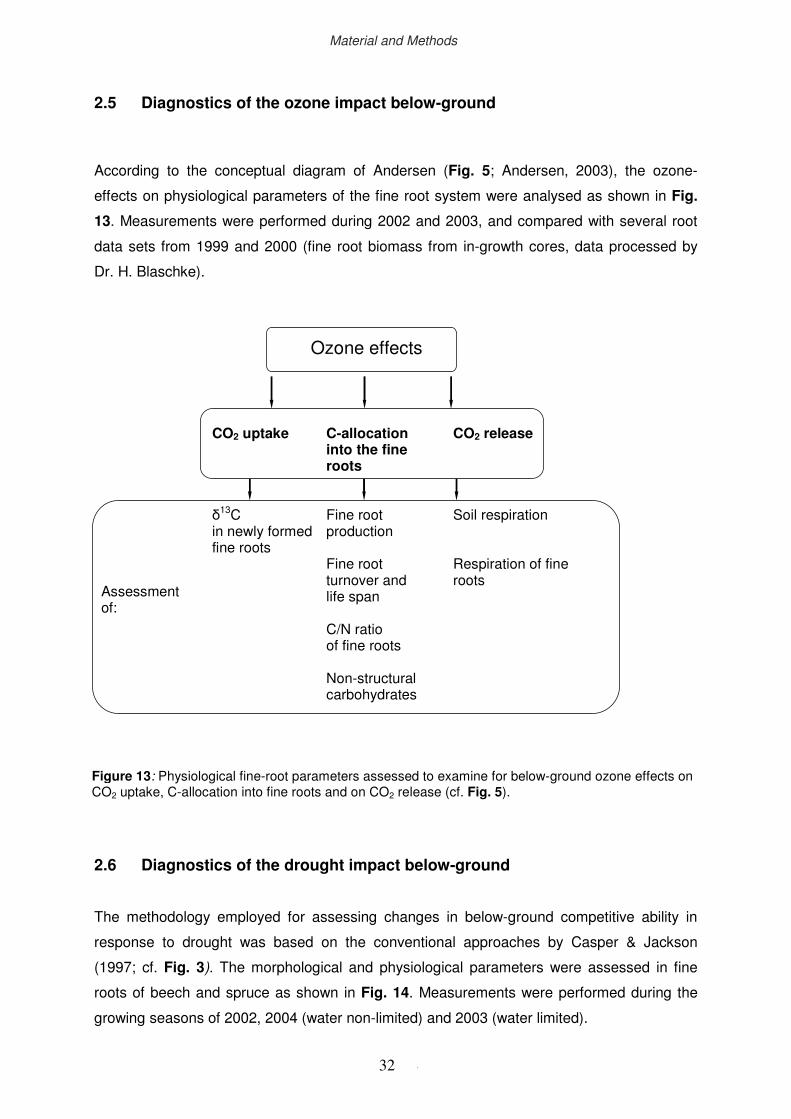
xxxviii
2.5 Diagnostics of the ozone impact below-ground
According to the conceptual diagram of Andersen (Fig. 5; Andersen, 2003), the ozone-
effects on physiological parameters of the fine root system were analysed as shown in Fig.
13. Measurements were performed during 2002 and 2003, and compared with several root
data sets from 1999 and 2000 (fine root biomass from in-growth cores, data processed by
Dr. H. Blaschke).
2.6 Diagnostics of the drought impact below-ground
The methodology employed for assessing changes in below-ground competitive ability in
response to drought was based on the conventional approaches by Casper & Jackson
(1997; cf. Fig. 3). The morphological and physiological parameters were assessed in fine
roots of beech and spruce as shown in Fig. 14. Measurements were performed during the
growing seasons of 2002, 2004 (water non-limited) and 2003 (water limited).
Figure 13: Physiological fine-root parameters assessed to examine for below-ground ozone effects on CO2 uptake, C-allocation into fine roots and on CO2 release (cf. Fig. 5).
Ozone effects
CO2 uptake
C-allocation into the fine roots
CO2 release
Assessment of:
δ
13C in newly formed fine roots
Fine root production Fine root turnover and life span C/N ratio of fine roots Non-structural carbohydrates
Soil respiration Respiration of fine roots
Material and Methods
32
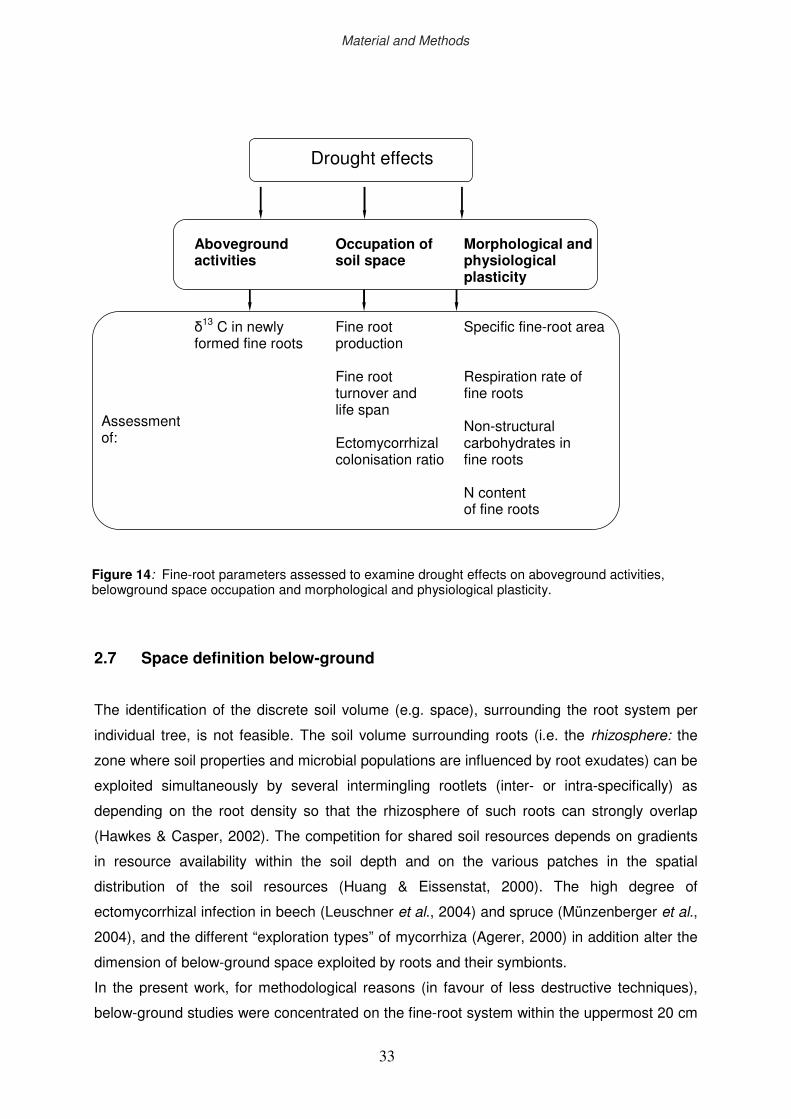
xxxix
2.7 Space definition below-ground
The identification of the discrete soil volume (e.g. space), surrounding the root system per
individual tree, is not feasible. The soil volume surrounding roots (i.e. the rhizosphere: the
zone where soil properties and microbial populations are influenced by root exudates) can be
exploited simultaneously by several intermingling rootlets (inter- or intra-specifically) as
depending on the root density so that the rhizosphere of such roots can strongly overlap
(Hawkes & Casper, 2002). The competition for shared soil resources depends on gradients
in resource availability within the soil depth and on the various patches in the spatial
distribution of the soil resources (Huang & Eissenstat, 2000). The high degree of
ectomycorrhizal infection in beech (Leuschner et al., 2004) and spruce (Münzenberger et al.,
2004), and the different “exploration types” of mycorrhiza (Agerer, 2000) in addition alter the
dimension of below-ground space exploited by roots and their symbionts.
In the present work, for methodological reasons (in favour of less destructive techniques),
below-ground studies were concentrated on the fine-root system within the uppermost 20 cm
Figure 14: Fine-root parameters assessed to examine drought effects on aboveground activities, belowground space occupation and morphological and physiological plasticity.
Drought effects
Aboveground activities
Occupation of soil space
Morphological and physiological plasticity
Assessment of:
δ
13 C in newly formed fine roots Xylem flow rate through coarse roots
Fine root production Fine root turnover and life span Ectomycorrhizal colonisation ratio
Specific fine-root area Respiration rate of fine roots Non-structural carbohydrates in fine roots N content of fine roots
Material and Methods
33
xl
of the soil. Here, the strongest competition is to be expected between the fine roots of
neighbouring trees for space occupation and resource capturing, since the topsoil (0 to 20
cm depth) is the densely rooted and the nutrient-richest zone at this site (Schuhbäck, 2004;
Mainiero, pers. comm.). Additionally, a gradient in the nutrient and water supply exists within
this soil depth (Schubäck, 2004). Therefore, two sub-samples were distinguished: (1) organic
sub-sample (O+Ah), consisting of the litter layer (L), the organic fermentation layers (Of1 and
Of2), the organic humus layer (Oh), and the humic topsoil horizon (Ah); and (2) mineral sub-
sample (B), consisting of a loamy subsoil horizon (Bv). The boundary between both sub-
samples was defined visually by the change in colour (black to dark-brown in O+Ah and
brown in B), supported by several differences in the soil properties. For example, sub-sample
(O+Ah) compared to sub-sample (B) showed higher pH-values, lower soil density and higher
C/N ratio (for more detailed description of soil properties at “Kranzberger Forst” see
Schuhbäck, 2004). On the other hand, surface soil layers integrated within (O+Ah) are
typically characterised by higher fluctuations in the soil water content. During prolonged
drought, a higher mortality rate of the shallow fine-root system was recorded underneath the
soil surface, as compared to fine-roots that grew in the mineral subsoil (Wells et al., 2002).
2.8 Assessment of climate conditions
Air temperature, volumetric soil water content and precipitation for the experimental period
2002-2004 were obtained on daily basis from the adjacent Level II monitoring site “Freising”,
located at “Kranzberger Forst” (48°24’24’’N 11°39’22’’E; data are provided by
Waldklimastation, Sachgebiet II, Bayerische Landesanstalt für Wald und Forstwirtschaft,
Freising). Additionally, soil temperature (Ts) was recorded at the experimental site by 10-
minute intervals at 0, 10, 20 and 30 cm depth through a PTC thermistor set (Thermor-1, UP,
Germany). Daily averages were calculated, and the most shallow soil temperature measured
at the boundary between the humus layer and the mineral soil (defined as 0 cm soil depth)
was used for further analysis. Volumetric soil water content (SWC) was recorded by time-
domain reflectometry (“TDR”; field measuring devise TRIME-FM2, two-rod probe, length 10
cm; IMKO GmbH, Germany) in July 23 of 2002 at each position of total soil respiration
measurement (section 2.20), and continuously from June 12 through July 24 of 2003 at 3
positions within beech and spruce tree group (TRIME-MUX6, IMKO GmbH, Germany). Two-
rod probes (P2Z, length 16 cm, measurement range 0-50%, accuracy +1%) were vertically
placed into the humus layer and the mineral soil. A calibration curve was used to convert soil
dielectricity into volumetric soil water content SWC [%]. Averages of the 3 positions were
used for comparison with modelling of available soil water (ASW, mm m-2; section 2.21.2).
Material and Methods
34
xli
2.9 Assessment of standing fine root biomass
Standing fine root biomass was assessed at the experimental plot by sequential soil coring
(SC), (Vogt et al., 1998). This technique was used to estimate the amount of root standing
biomass at a given time for a given soil volume. Fine root sampling was conducted with
sharp soil cores (length 20 cm, diameter 3.8 cm) that were manually driven into the topsoil.
Soil cores were collected in four sampling dates: the last week of March 2002, the second
week of August and November 2002, and during the first week of April 2003. For each
sampling date new coring positions were chosen in a distance of about 20 cm around the
measurement positions of total soil respiration (SRt) (see Fig. 11, 40 cores per sampling
date). During the measurement period (one year) it was expected to document the maximal
standing fine root biomass in August and the minimal in winter or spring months (according
to Göttsche, 1972; for both beech and spruce). The soil cores were transferred to plastic
bags and stored at 4°C until processing (maximal for four weeks). In the laboratory, each soil
corer was divided in two sub-samples: organic (O+Ah) and mineral (B), the thickness and
volume of each were recorded. Both soil sub-samples were processed separately: roots
were extracted by hand and only fine roots (diameter < 2mm) were considered in the
analysis. Living (RB, biomass) and dead (RN, necromass) roots were distinguished (in case
of doubt under microscope) using degree of cohesion of stele and periderm, root elasticity,
and colour according to Hertel (1999). For distinguishing the two species, differences in
colour (beech: dark reddish brown; spruce: yellow to brown), and ramification (beech:
smooth and numerously; spruce: chunkier and more evenly) were used. RB and RN were
dried at 65°C for 48 h, and the data were expressed as root density RD (e.g. dry mass per
unit soil volume [mg l-1]).
2.10 Annual fine-root production
2.10.1 “Minimum-maximum” method
This method was used for estimation of the annual fine root production (FRP) calculated as a
difference between the maximum and the minimum fine root mass (RB+RN) assessed by SC
during the measuring period of one year (McClaugherty et al., 1982). For calculation the
annual FRP root mass data assessed for both soil sub-samples according to section 2.9
were pooled and presented as fine-root density [mg l-1] (e.g. as the pooled root dry mass in
the total volume of the soil corer). The method assumes that arbitrary size classes (e.g., <
2.0 mm) accurately reflects the dynamic portion of the root system over the time of interest,
and that pools of live and dead roots are near steady-state (Pregitzer, 2002). Only significant
Material and Methods
35
xlii
differences between minimum and maximum values have to be considered for this
calculation approach (McClaugherty et al., 1982).
2.10.2 In-growth coring method
In-growth coring (IC) technique was used additionally to sequential soil coring for estimating
the annual fine-root production (Vogt et al., 1998; Hertel & Leuschner, 2002). The holes of
the SC extracted in March 2002 (soil volume 227 ml) served as in-growth cores. Each coring
hole was re-filled with mineral soil and organic layer (Bv and O+Ah, respectively), using
homogenised substrate from the site according to the natural profile. Positions of in-growth
cores were marked at the soil surface with PVC rings of the same diameter. Annual fine-root
production was assessed by sampling the in-growth cores in December 2002 and extracting
the newly formed fine-roots. The rootlets were manually removed from each sample and
oven-dried (at 65°C for 48 h) to estimate root density as dry mass per unit soil volume [mg l-
1]. Simultaneously, the coring holes were re-filled and marked again as described above, and
re-sampled in December 2003. Additionally, fine root recovery rate (FRR; in percent of initial
root density) was calculated. To do so, fine root density in the in-growth cores at harvests (in
December 2002 and in December 2003) was related to the initial fine root density as
assessed by SC in March 2002 (Hertel & Leuschner, 2002). The method assumes that
recovery of roots is unbiased (Pregitzer, 2002).
2.11 Fine root dynamics
2.11.1 Fine-root turnover
Fine root turnover (RT) refers to the process by which roots are produced, die and
decompose (Eissenstat, 2002). It has been defined as the ratio of annual fine-root production
to either the maximum, mean or minimum belowground standing biomass of fine roots
(different methods are referred in Gill & Jackson, 2000). Here, fine-root turnover was
calculated according Hendrick & Pregitzer (1993), who defined turnover as fine root
production (FRP; mg l-1) related to the minimum standing root biomass (FRBmin; mg l-1). For
this calculation FRP was obtained from IC during 2002 and 2003; FRBmin in 2002 was the
minimum standing fine root biomass obtained by SC along the period from March 2002 to
April 2003, and in 2003 FRBmin was the biomass assessed by SC in April 2003. This method
calculates the average RT and is based on roots of approximately the same age, and is a
good alternative to a single-root model, which requires studies on individual rootlets (e.g. by
Material and Methods
36
xliii
using minirhizotrons). When expressed in %, RT shows the proportion of fine-root biomass
that is renewed (newly produced or dies) during a certain period (in this study one year).
2.11.2 Root longevity
Root longevity, or life span (RL, yr), represents in this study the length of the time period for
which the fine roots of a given tree species were present alive in the soil. RL is calculated for
2002 and 2003 as the inverse value of root turnover (Eissenstat, 2002).
2.11.3 Root mortality rate
Root mortality rate (RM, %) was calculated as the proportion of the necromass (RN, g) in the
total standing fine root mass (e.g. RM = RN / (RB + RN) x 100), both assessed by means of
sequential soil coring during fine-root samplings as in section 2.9.
2.12 Functional categories of fine roots
Recent studies report about differences in form and function within fine roots of the same
diameter (Pregitzer, 2002; Wells & Eissenstat, 2001). The position and age of an individual
root is directly related to its life-span and physiological function and seems to be more
important than the mere diameter. However, root diameter size classes (Vogt & Peterson,
1991) are still used in most root studies, because they can be quite easily detected by
automatic scanning techniques. To avoid large variations and misinterpretations when results
are scaled to the stand level, three functional categories were established within beech and
spruce fine roots (Fig. 15) according to their position at the root system and anatomical
differences:
LRprim: long lateral roots with primary xylem (distal root parts);
LRsec : long lateral roots with secondary xylem (proximal root parts);
ShR : short roots, which were predominantly mycorrhizal.
Eight to ten individual rootlets per tree species, ozone treatment and sampling date
(samplings made during April, June, August, October and December 2003) were extracted
from the humus layer plus the uppermost 5 cm of the mineral soil and served for
determination of the dry weights DW [g] of roots from each fine-root category (DWLRprim,
DWLRsec and DWShR; cf. Appendix: Tabs. 1A & 1B), and of the proportion PTR [%] of each of
the three fine-root categories in the total rootlet biomass (PTRLRprim, PTRLRsec and PTRShR; cf.
Material and Methods
37

xliv
Appendix: Tab. 1A & 1B). DW was used for calculation of the assessed fine-roots
parameters (XX), such as fine-root respiration RR, N-content, C content etc. of the individual
cuttings according to:
XXi = (XX LRprim x DW LRprim + XX LRsec x DW LRsec + XXShR x DW ShR) / DWi Eq. 1
where:
XXi is the calculated parameter of the individual fine rootlet i in beech or spruce respectively,
and DWi is the total dry fine rootlet weight [g];
XXLRprim, XXLRsec and XXShR are the values of the parameter assessed on roots from
categories LRprim, LRsec and ShR;
DWLRprim, DWLRsec and DWShR are the dry weights [g] of roots from each category within the
individual fine rootlet.
Material and Methods
38
xlv
Figure 15: Both long lateral roots with secondary xylem LRsec (A.) and long lateral roots with primary xylem LRprim (B.) have similar mean diameters but their transverse-sections show different anatomical properties. During water limited August of 2003 LRprim in spruce stop to grow: the primary cortex suberize and the inactive roots develop a metacutinized apex to prevent dormant root tips from desiccation. Classification based only on root colour is also misleading, because “white“ fine roots can be either slowly growing short mycorrhizal roots ShR (beech, left site, bottom) or fast growing LRprim (spruce, right, bottom). Similarly, “brown” colour comprises ShR (beech, left, top), primary dormant long roots LRprim and secondary long roots LRsec (spruce, right, top). * Red lines show positions of the transverse-sections.
Material and Methods
39
xlvi
2.13 Morphological parameters of fine roots
The stored images of fine-roots extracted from soil corers (cf. section 2.9) and in-growth
cores (cf. section 2.10.2), used before for root respiration measurements (cf. section 2.18), or
developed in the rhizotrones (cf. section 2.19), were later processed in a batch mode using
WhinRHIZO® (Regent instruments, Canada) to assess root morphological parameters as:
surface area (A, cm2), total length (L, cm), total volume (V, cm3), mean diameter (D, mm),
and number of root tips (NRT). The dry weight of each sample was defined after 48 h
desiccation at 65°C, and the following key fine-root parameters were calculated:
Specific fine-root surface area (SRA):
Fine-root surface area [cm2 g-1] Eq. 2
Fine-root biomass
Specific fine-root length (SRL):
Fine-root length [cm g-1] Eq. 3
Fine-root biomass
Specific root tip density (STD):
Number of root tips [N cm-1] Eq. 4
Fine-root length
The three specific parameters, which are connected with the physiological activity of fine
roots and characterise the root-soil contact (Ostonen et al., 1999), were used for studying the
root ecomorphology, e.g. the variability of the root morphology to changes in environmental
or soil characteristics.
2.14 Assessment of ectomycorrhizal colonisation rate
Species living in symbiosis with ectomycorrhizal fungi, such as beech and spruce, generally
have short, swollen lateral roots resulting in a distinctive root system (Blaschke & Weiss,
1990; Frank, 2005). Mycorrhized fine-roots develop a stronger tendency to branching, so that
the lateral rootlet branches occur at short intervals close behind the tip. These characteristic
lateral roots can be visible without a microscope and have been used to identify mycorrhized
parts. Scanned images (five per tree species) of short roots (ShR, cf. section 2.12) used
before in fine-root respiration measurements (seven sampling dates between August 2002
and December 2003, cf. section 2.18) were analysed using the gridline interception method
Material and Methods
40
xlvii
for recording the number and the rate of ectomycorrhizal colonisation of this fine root
category. The vertical and horizontal lines of the grid were followed, and intersect with root
tips and intersect with mycorrhizal root tips were counted separately
(http://www.ffp.csiro.au/research/mycorrhiza/root.html). However, this method provides
information about the present but not about the vitality of the ectomycorrhizal associations.
The ectomycorrhizal colonisation rate was calculated as the percentage of mycorrhizal to
total root tips.
2.15 Nutrient analysis in the fine roots
(Co-operation with the partner group of Prof. A. Göttlein, Chair of Forest Nutrition and Water
Resources, TUM)
Aliquots of each fine-root category (fine roots were sampled in May and in August 2003, and
were first used in root respiration measurements as described in section 2.18) served for
analysis of micro-and macroelements (inclusive C). Previously dried and milled root samples
were digested with HNO3, and analysed for major elements by ICP-AES. Total carbon and
nitrogen concentrations of plant samples were measured by combustion using an elemental
analyser (Leco, USA). The concentration of C and N were used to define the C/N ratio for
each fine-root category as well as to calculate efficiency ratios of competitiveness (see below
section 2.22).
2.16 Non-structural carbohydrate analysis
In August 2002, and in April, June, August and October 2003 in parallel to the sampling of
roots for root respiration measurements, other 5 rootlets per tree species were extracted
from the humus layer plus the uppermost 5 cm of the mineral soil and prepared for analyses
of sugar and starch content. Cut rootlets were covered with wet paper and transported in a
plastic bag to the lab to avoid root damage and desiccation. Three fine-root categories were
distinguished in beech and spruce: long roots with primary xylem (LRprim), long roots with
secondary xylem (LRsec), and short myccorrhized roots (ShR) (cf. section 2.12). Fine roots
were carefully cleaned from soil particles and dead root ramifications by brushing, frozen in
liquid nitrogen, and stored in a –80°C freezer until analysis. The samples were ground by
hand under liquid N and lyophilized. Extraction of sugars and starch was done after
Fleischmann (pers. comm.). Aliquots of samples (20 mg dry weight) were extracted with
twice-distilled water in three steps (each 10 min with gentle shaking at 80°C). The
supernatants were centrifuged, decanted, pooled and frozen until the measurement by
Material and Methods
41
xlviii
HPLC. The residual pellet was dried over 3 hours by low pressure desiccation. Starch in the
insoluble residue was extracted by amylase-incubation at 85°C for 30 min, centrifuged, and
an aliquot of the supernatant was incubated with amyloglucosidase at 37°C for 16 hours to
ensure complete hydrolysis to glucose, which concentration was measured by HPLC
(technical details are shown in Tab. 3). The peaks were quantified by comparing peak height
with a range of external standards (glucose, fructose, sucrose). Additionally, in spruce
samples, a content of pinitol was identified after analytical expertise by Prof. M. Popp
(University of Vienna, Austria).
Parameter
Sugars
Starch (glucose)
Column
Mobile phase
Aminex HPX-87C (BIORAD, München,
Germany), column 300x7.8 mm,
working temperature 85°C
H2O
Aminex HPX-87H (BIORAD, München,
Germany), column 300x7.8 mm,
working temperature 60°C
5 mM H2SO4
Pump L-6200A, Merck-Hitachi, München, Germany
Autosampler
Detector
Flow rate
Injection volume
Analysis Software
AS-96C (BIORAD, München, Germany)
Model 1755, Refractive Index Monitor (BIORAD, München, Germany)
0.6 ml/min
20 µl
Gold Nouveau (Beckmann, München, Germany)
2.17 Analysis of δ13C of newly produced fine-roots
(Co-operation with the partner group of Prof. H. Schnyder, Chair of Grassland Science, TUM)
During 1999, 2002 and 2003 the natural variations of δ13C [‰] were assessed in newly
formed fine-roots as obtained by in-growth technique (see section 2.10.2). Dried root material
was ground and 1 mg per sample was analysed for total N and C contents as well as the 13C/12C ratio, using an elemental analyser (Carlo Erba NA1110, Milan, Italy) interfaced to a
mass spectrometer (FinniganMAT Delta Plus, Thermo Electron Corporation, Bremen,
Germany). Similarly to leaf or wood tissues (Warren et al., 2001; Macfarlane & Adams, 1998;
Ferrio et al., 2003), high δ13C values in fine roots indicates stomatal limitation on
photosynthetic CO2 uptake during the period in which the carbon has been fixed. However,
carbon isotopes only correlate with WUE above a critical concentration of available nitrogen
(Hobbie & Colpaert, 2004), e.g. plants have to be N non-limited during assimilation.
Table 3: Technical parameters of the HPLC system used for analysis of sugars and starch (as glucose).
Material and Methods
42
xlix
2.18 Assessment of fine root respiration rate
The respiration rate (RR) of fine roots was measured by means of a differential infrared gas
analyser IRGA (CIRAS-2, PP-Systems, UK, http://www.ppsystems.com) in combination with
an open-chamber system (PLC Conifer, PP-Systems, UK). The measuring cuvette with a
window size 70 mm x 50 mm allowed RR assessment of fine root aliquots (parts) with fresh
weight 0.4 - 0.6 g. Making allowance for the high morphological and functional heterogeneity
of fine roots (diameter < 2 mm; Pregitzer, 2002) which resulted in high heterogeneity of the
measured RR values, so that the following sampling and measuring procedure was chosen:
(1) For measuring RR three functional fine-root categories were distinguished in
beech and spruce: long roots with primary xylem (LRprim), long roots with secondary xylem
(LRsec), and short mycorrhizal roots (ShR) (cf. section 2.12).
(2) Five to ten fine rootlets per tree species and sampling date were harvested at the
experimental plot from the topsoil (the uppermost 5 cm of the mineral soil plus humus layer)
and used for RR assessment. Another seven to ten rootlets per tree species and sampling
date were sampled in parallel and served for determination of the proportion of each of the
three functional fine-root categories in the total rootlet biomass (cf. section 2.12).
(3) Roots from each sample (4 to 6 replications) were carefully cleaned by brushing
off soil particles and dead root ramifications. An aliquot of 0.4 - 0.6 g fresh weight was put in
a mesh bag (mesh size 50 µm, window size of the bag 60 mm x 40 mm) which was then
immediately placed in the cuvette of the CO2-analyser. Mesh bag was used to protect the
IRGA and showed no influence on the RR during preliminary tests.
(4) Cuvette environment parameters were set as follows: air humidity of 90 % of the
ambient air humidity, flow rate of 0.2 l min-1, and the input CO2 concentration of the cuvette
was set to 400 µl l-1. Root sub-samples were tested for a possible effect of the CO2
concentration by determining respiration rates at both 400 and 1000 µl l-1, but no effect of
CO2 on RR was detected over that concentration range (in agreement with Burton et al.
2002). Cuvette temperature was chosen according to the task (see 2.18.1 and 2.18.2).
Respiration readings of each root sample were taken manually 2 to 4 min after closing the
cuvette when respiration rates had stabilized. Since root cuttings have not been rinsed
before RR measurement, microbial respiration in the adhering soil and organic debris was
measured as root respiration, but rates of microbial respiration per gram of forest soil
material are often orders of magnitude less than those we measured per gram of root tissue.
Thus the contribution of these materials to measured RR should be less than 5% of the
values (Zak et al., 2000).
(5) After finishing the measurements, root samples were covered with wet paper and
transported in plastic bags to the lab. They were rinsed and spread out in plastic trays filled
Material and Methods
43
l
with distilled water, and scanned in colour using a desktop scanner (HP Laserscanjet 4L) at
300 dpi for assessment of the SRA by means of WhinRhizo® (cf. 2.13). Respiration rates of
each sample were determined on a root dry weight basis [nmol CO2 g-1 s-1].
2.18.1 Assessment of the ozone impact on root respiration rate
In August 2002 the ozone impact on root respiration was tested at the experimental plot on
individual fine rootlets (five per tree species and O3-treatment) which were sampled and
measured as described in section 2.18. Respiration measurements were performed at a
cuvette temperature of 18°C and reported as respiration rates [nmol CO2 g-1 s-1].
2.18.2 Seasonal dynamics in fine-root respiration rate
The seasonal dynamics in RR was assessed on fine-roots as obtained at beech and spruce
subplots outside the “experimental plot” (Fig. 12). In April, June, August, September and
October 2003 the measurements were performed within each fine-root category and tree
species at three temperature levels (7, 15 and 22°C) for determining the response of RR to
change in temperature. The sampled fine rootlets were covered with wet paper and
transported to the lab in plastic bags where they remained until measuring at 10-15°C.
Respiration rates have been assessed within 3 hours after root excision, a time period which
had been prooved to show constant respiration rates of trenched fine-roots during
preliminary tests. At each temperature level 4 to 6 replications were measured per root
category and tree species, using always newly prepared root samples. The environmental
cuvette parameters during all measurements were set as described above (see section 2.18,
step 4).
Regression analysis was performed to examine the temperature response of fine-root
respiration during 2003. Fine-root categories and tree species were analysed separately.
Exponential regressions were developed by plotting the averaged RR against temperature by
using van’t Hoff equation:
RR = ρeθT Eq. 4
where ρ and θ are regression coefficients, and T is the sample temperature.
For each root category and each sampling date the respiratory Q10 values were determined
(Q10 is defined as the change in respiration in response to a 10°C change in temperature) by
using the equation:
Material and Methods
44
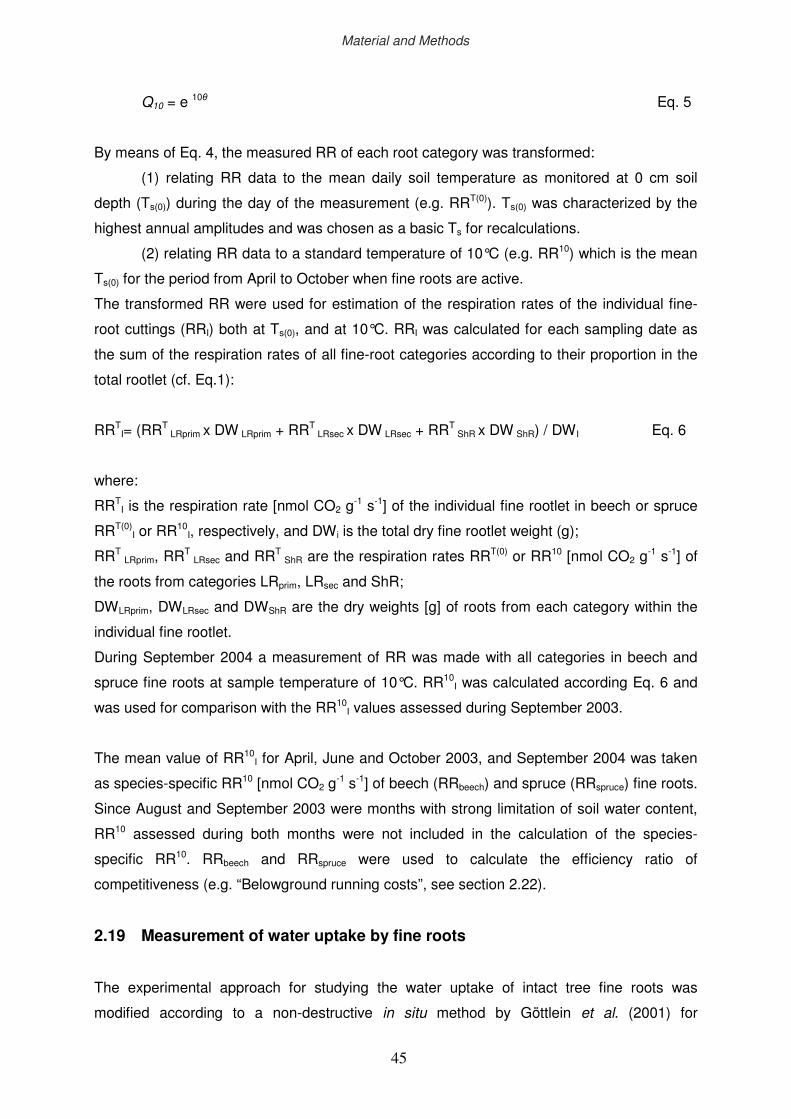
li
Q10 = e 10θ Eq. 5
By means of Eq. 4, the measured RR of each root category was transformed:
(1) relating RR data to the mean daily soil temperature as monitored at 0 cm soil
depth (Ts(0)) during the day of the measurement (e.g. RRT(0)). Ts(0) was characterized by the
highest annual amplitudes and was chosen as a basic Ts for recalculations.
(2) relating RR data to a standard temperature of 10°C (e.g. RR10) which is the mean
Ts(0) for the period from April to October when fine roots are active.
The transformed RR were used for estimation of the respiration rates of the individual fine-
root cuttings (RRI) both at Ts(0), and at 10°C. RRI was calculated for each sampling date as
the sum of the respiration rates of all fine-root categories according to their proportion in the
total rootlet (cf. Eq.1):
RRTI= (RRT
LRprim x DW LRprim + RRT LRsec x DW LRsec + RRT
ShR x DW ShR) / DWI Eq. 6
where:
RRTI is the respiration rate [nmol CO2 g
-1 s-1] of the individual fine rootlet in beech or spruce
RRT(0)I or RR10
I, respectively, and DWi is the total dry fine rootlet weight (g);
RRT LRprim, RRT
LRsec and RRT ShR are the respiration rates RRT(0) or RR10 [nmol CO2 g
-1 s-1] of
the roots from categories LRprim, LRsec and ShR;
DWLRprim, DWLRsec and DWShR are the dry weights [g] of roots from each category within the
individual fine rootlet.
During September 2004 a measurement of RR was made with all categories in beech and
spruce fine roots at sample temperature of 10°C. RR10I was calculated according Eq. 6 and
was used for comparison with the RR10I values assessed during September 2003.
The mean value of RR10I for April, June and October 2003, and September 2004 was taken
as species-specific RR10 [nmol CO2 g-1 s-1] of beech (RRbeech) and spruce (RRspruce) fine roots.
Since August and September 2003 were months with strong limitation of soil water content,
RR10 assessed during both months were not included in the calculation of the species-
specific RR10. RRbeech and RRspruce were used to calculate the efficiency ratio of
competitiveness (e.g. “Belowground running costs”, see section 2.22).
2.19 Measurement of water uptake by fine roots
The experimental approach for studying the water uptake of intact tree fine roots was
modified according to a non-destructive in situ method by Göttlein et al. (2001) for
Material and Methods
45
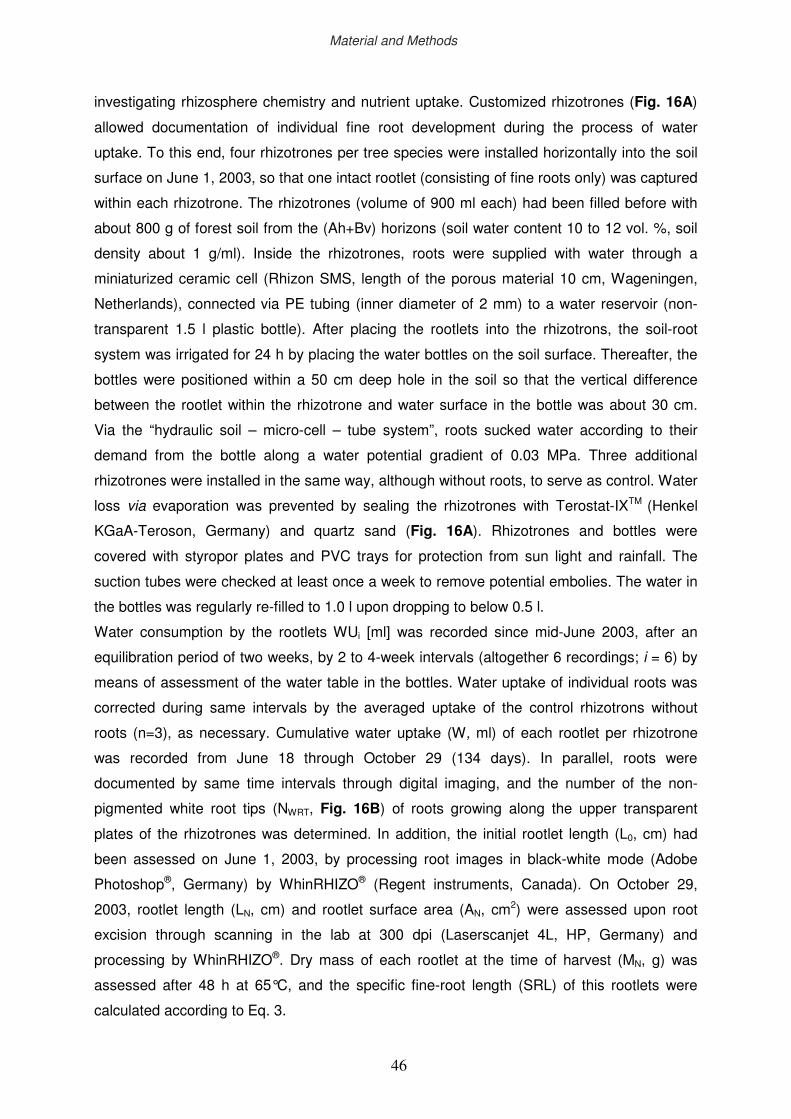
lii
investigating rhizosphere chemistry and nutrient uptake. Customized rhizotrones (Fig. 16A)
allowed documentation of individual fine root development during the process of water
uptake. To this end, four rhizotrones per tree species were installed horizontally into the soil
surface on June 1, 2003, so that one intact rootlet (consisting of fine roots only) was captured
within each rhizotrone. The rhizotrones (volume of 900 ml each) had been filled before with
about 800 g of forest soil from the (Ah+Bv) horizons (soil water content 10 to 12 vol. %, soil
density about 1 g/ml). Inside the rhizotrones, roots were supplied with water through a
miniaturized ceramic cell (Rhizon SMS, length of the porous material 10 cm, Wageningen,
Netherlands), connected via PE tubing (inner diameter of 2 mm) to a water reservoir (non-
transparent 1.5 l plastic bottle). After placing the rootlets into the rhizotrons, the soil-root
system was irrigated for 24 h by placing the water bottles on the soil surface. Thereafter, the
bottles were positioned within a 50 cm deep hole in the soil so that the vertical difference
between the rootlet within the rhizotrone and water surface in the bottle was about 30 cm.
Via the “hydraulic soil – micro-cell – tube system”, roots sucked water according to their
demand from the bottle along a water potential gradient of 0.03 MPa. Three additional
rhizotrones were installed in the same way, although without roots, to serve as control. Water
loss via evaporation was prevented by sealing the rhizotrones with Terostat-IXTM (Henkel
KGaA-Teroson, Germany) and quartz sand (Fig. 16A). Rhizotrones and bottles were
covered with styropor plates and PVC trays for protection from sun light and rainfall. The
suction tubes were checked at least once a week to remove potential embolies. The water in
the bottles was regularly re-filled to 1.0 l upon dropping to below 0.5 l.
Water consumption by the rootlets WUi [ml] was recorded since mid-June 2003, after an
equilibration period of two weeks, by 2 to 4-week intervals (altogether 6 recordings; i = 6) by
means of assessment of the water table in the bottles. Water uptake of individual roots was
corrected during same intervals by the averaged uptake of the control rhizotrons without
roots (n=3), as necessary. Cumulative water uptake (W, ml) of each rootlet per rhizotrone
was recorded from June 18 through October 29 (134 days). In parallel, roots were
documented by same time intervals through digital imaging, and the number of the non-
pigmented white root tips (NWRT, Fig. 16B) of roots growing along the upper transparent
plates of the rhizotrones was determined. In addition, the initial rootlet length (L0, cm) had
been assessed on June 1, 2003, by processing root images in black-white mode (Adobe
Photoshop®, Germany) by WhinRHIZO® (Regent instruments, Canada). On October 29,
2003, rootlet length (LN, cm) and rootlet surface area (AN, cm2) were assessed upon root
excision through scanning in the lab at 300 dpi (Laserscanjet 4L, HP, Germany) and
processing by WhinRHIZO®. Dry mass of each rootlet at the time of harvest (MN, g) was
assessed after 48 h at 65°C, and the specific fine-root length (SRL) of this rootlets were
calculated according to Eq. 3.
Material and Methods
46

liii
In accordance with studies on the relationship between root pigmentation and root growth
dynamics (Withington et al., 2003), it was assumed in the present study that high number of
non-pigmented root tips reflects the periods of fast growth (here length increment) of the
rootlets. This assumption allowed determining, in addition, the following rootlet parameters:
1. Total rootlet length (Li, cm) for each recording date:
Li = Li-1 + ri(LN – L0); Eq. 7
where:
Li is the rootlet length [cm] at the recording date i;
Li-1 is the rootlet length [cm] assessed at the previous recording date (for the first recording Li-
1 = L0);
(LN – L0) represent the length increment [cm] of each rootlet from June 1 through October 29
in 2003.
ri is the proportion of white root tips (NWRT) at the recording date i in the total number of white
root tips determined during the whole experimental period:
6
ri = NWRTi / ∑ NWRTi ; Eq. 8
i = 1
2. The mean standing rootlet length (Lmean, cm) of the study period was calculated
based on the individual rootlet lengths Li as:
6
Lmean = [ ∑ Ndays (Li + L i-1) / 2] /150 ; Eq. 9
i = 1
where:
(Li + L i-1) / 2 is the mean root length of the period between recordings i-1 and i ;
Ndays is the number of days of the time period between recordings i-1 and i ;
150 is the number of days from the June 1 (rootlet length L0) through October 29, 2003
(rootlet length LN).
3. The mean standing biomass (Mmean, g) of each rootlet of the study period was
calculated as:
Mmean = Lmean / SRL; Eq. 10
Material and Methods
47

liv
where Lmean [cm] is the mean standing rootlet length (Eq. 9) and SRL [cm g-1] is the specific
root length assessed at the end of the exposure in the rhizotrons.
4. The root production (RP, g) of each rootlet was assessed for the period of recorded
water consumption as:
RP = (LN – L1) / SRL; Eq. 11
where (LN – L1) is the length increment [cm] of the rootlets from June 18 through October 29
of 2003.
5. Fine root daily water uptake rate WU [ml day-1] for the periods between recordings
was assessed as:
WUdaily = WU(i-1) to i / Ndays ; Eq. 12
where:
WUdaily is the daily fine-root uptake rate [ml day-1] for the period between recordings i-1 and i;
WU(i-1) to i is the total water uptake for the period between recordings i-1 and i;
Ndays is the number of days between recordings i-1 and i.
6. The daily specific water uptake rate SWU [ml g-1 day-1] during the period of
recorded water consumption was calculated for each rootlet as:
a) SWUM = W / 134 / Mmean; Eq. 13
b) SWURP = W /134 / RP; Eq. 14
where W [ml] is the cumulative water uptake of each rootlet recorded from June 18 through
October 29 (the whole experimental period), and 134 is the number of days included in this
period.
For the whole experimental period, SWUM represents the daily water uptake rate of the
rootlets per mean standing root biomass (Mmean, g), and SWURP represents the daily water
uptake per unit of newly produced fine roots (RP, g). The SWUM is used to calculate
efficiency in competitiveness (see below).
Material and Methods
48
lv
Figure 16A: Miniaturized ceramic cells installed in rhizotrons as customized for studying, in situ, the water uptake of intact tree fine roots.
Figure 16B: Intact fine rootlet in beech: Non-pigmented fine root tips (marked by white circle) are well distinguished from the older root parts (marked in black). Photo: September 30 of 2003.
Material and Methods
49
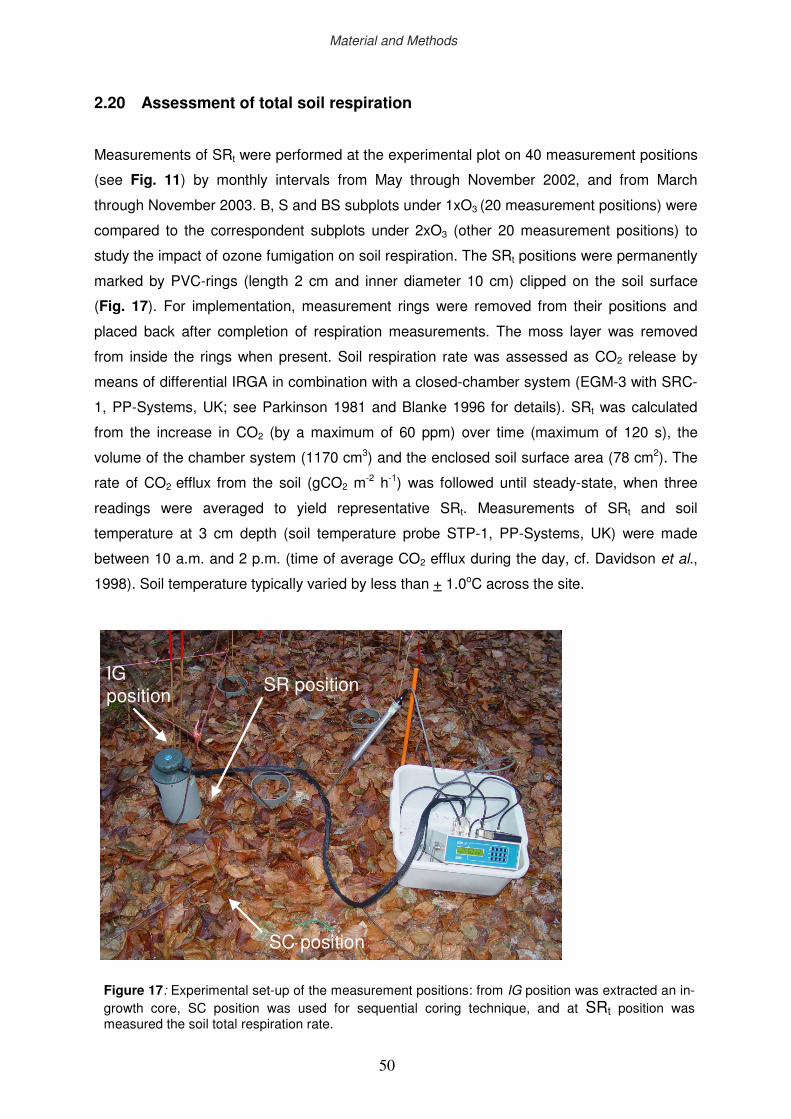
lvi
2.20 Assessment of total soil respiration
Measurements of SRt were performed at the experimental plot on 40 measurement positions
(see Fig. 11) by monthly intervals from May through November 2002, and from March
through November 2003. B, S and BS subplots under 1xO3 (20 measurement positions) were
compared to the correspondent subplots under 2xO3 (other 20 measurement positions) to
study the impact of ozone fumigation on soil respiration. The SRt positions were permanently
marked by PVC-rings (length 2 cm and inner diameter 10 cm) clipped on the soil surface
(Fig. 17). For implementation, measurement rings were removed from their positions and
placed back after completion of respiration measurements. The moss layer was removed
from inside the rings when present. Soil respiration rate was assessed as CO2 release by
means of differential IRGA in combination with a closed-chamber system (EGM-3 with SRC-
1, PP-Systems, UK; see Parkinson 1981 and Blanke 1996 for details). SRt was calculated
from the increase in CO2 (by a maximum of 60 ppm) over time (maximum of 120 s), the
volume of the chamber system (1170 cm3) and the enclosed soil surface area (78 cm2). The
rate of CO2 efflux from the soil (gCO2 m-2 h-1) was followed until steady-state, when three
readings were averaged to yield representative SRt. Measurements of SRt and soil
temperature at 3 cm depth (soil temperature probe STP-1, PP-Systems, UK) were made
between 10 a.m. and 2 p.m. (time of average CO2 efflux during the day, cf. Davidson et al.,
1998). Soil temperature typically varied by less than + 1.0oC across the site.
IG position
SR position
SC position
Figure 17: Experimental set-up of the measurement positions: from IG position was extracted an in-growth core, SC position was used for sequential coring technique, and at SRt position was measured the soil total respiration rate.
Material and Methods
50
lvii
2.21 Assessment of “autotrophic” and “heterotrophic” soil respiration
2.21.1 Root exclusion technique
This approach was used to resolve total soil respiration (SRt) into “autotrophic” (SRa) and
“heterotrophic” (SRh) soil respiration. To this end, SRt was measured on undisturbed
reference and SRh was measured on other nearby positions (e.g. root exclusion positions
where roots were removed 3 weeks before the first measurement) by monthly intervals from
July through November 2002, March through November 2003, and March through July 2004.
In June 2002, ten measurement positions were selected in each group of trees (distance
between group centres about 25 m): five for employing the root exclusion procedure, and
another five that stayed unchanged as reference. However, ground vegetation (i.e. mosses),
when present, was removed on all measurement positions. At the positions of root exclusion,
metal soil corers (length 10 cm, inner diameter 10 cm) were inserted into the forest floor to
allow soil excavation and removal of roots from a defined volume (785 ml). Live roots of each
soil core were sorted, and the fine root density (FRD, root diameter < 2mm) in each position
of root exclusion was determined as dry mass per unit of soil volume. Upon live root removal,
soil including root necromass was refilled into the coring holes (stabilized by PVC tubes:
length 10 cm, inner diameter 10 cm), accounting for the original position of soil material along
the corer length. The PVC tube also prevented lateral in-growth of roots, while the top and
bottom areas of tubes were kept open to ensure aeration as well as wet and dry deposition
and drainage. A re-equilibration period of 3 weeks was required after soil refilling to minimise
disturbance artefacts and re-attain respiratory steady-state conditions. SRa was calculated
as:
SRa = SRt – SRh, Eq. 15
where SRh is on positions upon fine-root removal, and SRt on undisturbed reference
positions. The proportion of SRa in SRt was calculated at each sampling date as
(1 – SRh/ SRt) x 100.
Soil volumes within tubes were checked at the end of the experiment (after two years) for in-
growth of fine-roots from below, which stayed confined, on average, to 3% in spruce, and 5%
in beech in relation to initial root mass each. At the same time, i.e. in July 2004, fine root
density was assessed at the reference positions by soil coring (corer length 10 cm, inner
diameter 10 cm).
Material and Methods
51
lviii
2.21.2 Modelling of “autotrophic” and “heterotrophic” soil respiration
(Co-operation with Dr. S. Raspe, LWF, Freising)
From the periodic SR measurements the continuous CO2 release of the different
measurement positions was modelled with respect to the dependency of SRa and SRh on soil
temperature and available soil water (ASW, mm m-2), and – in the case of beech – on litter
fall. Therefore, SRt was split into the proportions of SRa and SRh in view of their dynamics
under varying temperature and soil moisture regimes. In addition, survey data were
separated into a “soil water non-limited” data set (including 2002 and 2004), and a “soil water
limited” one, only comprising 2003. An exponential function described the temperature
dependency of SR underneath beech and spruce, respectively:
SRpr = a eb(Ts-10) Eq. 16
where:
SRpr is the predicted autotrophic or heterotrophic soil respiration rate (gCO2 m-2 h-1);
TS is soil temperature in 3 cm soil depth (°C);
a and b are coefficients as estimated from measured SR through non-linear least square fit.
When subtracting 10°C from TS, the coefficient a is an estimate of the respiratory CO2 efflux
at temperature of 10°C (Lavigne et al., 2004). The coefficient b is the temperature coefficient,
which is related to Q10 (Q10 = e10b). Differences in a and b between “soil water non-limited”
and “soil water limited” scenarios were analyzed for each tree group through t-test with
Bonferroni correction (Bärlocher, 1999).
To assess the variation of SR in response to plant-available soil water content, SR value of
each observation was standardised to a temperature of 10°C (Lavigne et al., 2004),
modifying Eq. 16:
SR10=SR/eb(Ts-10) Eq. 17
where:
SR is autotrophic or heterotrophic SR;
b the corresponding temperature coefficient.
Available soil water was modelled for the period 2002 through 2004 within the uppermost 40
cm of the soil profile by Dr. Stephan Raspe (LWF, Freising) through LWF-BROOK90
Material and Methods
52

lix
(Hammel and Kennel, 2001) for site conditions underneath groups of beech and spruce trees
each. Normalised SRa and SRh were related to the mean daily ASW throughout the study
period by means of linear response functions for independent analysis of beech and spruce.
When SRh was studied, the positive relationship at low ASW levels changed into negative at
high ASW, or vanished, as observed in spruce. In determining the species-specific
thresholds in ASW dependence of SRh10, an iterative approach was applied, repeating linear
analysis until yield of highest R2.
Equation 18 combines the effects of Ts and ASW on respiration:
SRpr =(c + d ASW) eb(Ts-10) Eq. 18
with c and d being coefficients (examined through t-test with Bonferroni correction for
statistically significant differences between species).
SRa and SRh measured in beech during November were excluded from modelling as the Ts
dependence on SR was interfered by additional C and N supply released from the shed
foliage in mid-October (Meier et al., 2005). The litter deposition stimulated SRt and SRa, for
which phenomenon was accounted for by correcting modelled SRh and SRa according to:
SRcor = SRpr + l(Ts-2), Eq. 19
where SRpr are predicted SRh or SRa from Nov. 2 (in agreement with the end of the “late
autumn” phenological phase; DWD, http://www.dwd.de) through the end of each year
(whenever mean daily Ts > 2°C at 0 cm depth), 2 is the threshold Ts in °C. Below this
threshold, all other environmental factors, but temperature, are believed to lose influence on
the belowground microbial activity (cf. Tibbett et al., 1998).
The correction factor l was calculated separately for 2002 and 2003 each as:
l = (SRsh–SRpr(t<2))/( Ts
sh –Ts(t<2)), Eq. 20
where SRsh is measured SRh or SRa during one week after complete fall of the foliage,
SRpr(t<2) is predicted SRh or SRa during the first day past Nov. 2 with mean daily Ts < 2°C, and
Tssh and Ts(t<2) are corresponding means of subsequent days.
Factor l of 2004 and 2002 were set equal to each other. Given the large inter-annual
variation of litter fall and slow decomposition in spruce stands (Pedersen & Bille-Hansen
1999; Hayes 1979), factor l was not included in the SR model for spruce.
Material and Methods
53
lx
SRa and SRh predicted for the days of SR measurement were re-calculated by means of Eq.
16 for the Ts (recorded in parallel at 3 cm soil depth) of such days. Model precision was
evaluated by comparison between re-calculated predicted and measured SRa and SRh each.
2.22 Efficiency ratios of competitiveness
Efficiency ratios have been defined to compare the competitiveness of beech and spruce
quantitatively (Grams et al., 2002). However, such “efficiencies” have been assessed mainly
for the aboveground plant organs (Reiter el al., 2005; Kozovits et al., 2005a).
2.22.1 Belowground space occupation
Belowground, the objects of plant competition (e.g. soil water and nutrients) are located
along gradients within the soil volume. Space occupation requires C investment into root
structures (e.g. “structural costs”). The soil volume (previously defined in section 2.7) per unit
of C investment into standing fine-root biomass was taken as a measure of the “efficiency of
belowground space occupation” (BSO):
Occupied soil volume
BSO = ———————————————————— [m3 g-1] Eq. 21
C-investment into standing fine-root biomass
In mono-specific subplots, covered by trees of only one species (i.e. beech or spruce), the
space occupied by roots was the mean soil volume (i.e., of the three sampling campaigns
during March, August and December of 2002) of each soil sub-sample (organic O+Ah or
mineral B) as determined by the SC technique. C investment into fine roots was defined by
the mean standing fine-root biomass (i.e., of the three sampling campaigns in March, August
and December of 2002; for details see section 2.9) and the C content of fine roots (45,4 %
and 46,6 % of dry mass in beech and spruce, respectively; assessment see section 2.15).
In mixed subplots, the soil volume within each soil sub-sample was shared by both tree
species. To assess the portion of the soil volume which was occupied by spruce or beech
fine roots, the following approach was applied separately for each tree species:
(1) Annual means of soil sub-sample volume (SV(O+Ah) or SV(B), cm3) and the
respective root volume (RV(O+Ah) or RV(B), cm3) were calculated for all subplots based on
samplings in March, August and December of 2002.
Material and Methods
54
lxi
(2) The ratio between a given soil volume and the contained volume of the root
biomass was defined as the factor k. It was assumed that beech and spruce trees, when
growing in monoculture and under 1xO3 (undisturbed control conditions), develop a root
structure ensuring “optimal resource exploitation” of the surrounding space and this structure
avoids overlapping zones of nutrient depletion (e.g. adjusting exploitation rates to approach
short-term steady state; Tsur & Zemel, 2004). Hence, the factor kc for fine-roots under
control conditions was defined as:
kc= SVc / RVc; Eq. 22
where:
SVc [cm3] is the annual mean volume of the soil sub-sample O+Ah (SVc(O+Ah)) or B (SVc(B)), as
assessed by the SC technique in the control beech or spruce group;
RVc is the annual mean volume of the living roots extracted from the correspondent soil sub-
sample O+Ah (RVc(O+Ah), cm3) or B (RVc(B), cm3) in the control beech or spruce group.
The factor kc yields the space per unit of root volume in which plants including mycorrhizae
and associated bacteria exploit available resources (Casper et al., 2003: “zone of influence”).
Roots with far-reaching mycorrhizae can be characterized by wide ratios of soil versus root
volume.
(3) The factor kc was used to predict the soil volume SVpr which should be occupied
by beech (SVpr beech) or spruce (SVpr spruce) roots in mixed subplots (according to the root
volume while assuming similar efficiency as for roots growing in monoculture):
SVpr = kc RV; Eq. 23
where:
SVpr [cm3] is SVpr beech or SVpr spruce within soil sub-samples O+Ah or B;
RV [cm3] is RVbeech or RVspruce within soil sub-samples O+Ah or B as assessed by SC in the
mixed subplots;
(4) The soil volume predicted to be occupied by beech or spruce fine roots in mixed
subplots (Eq. 23) was assessed in proportion [PSV, %] to the predicted total soil volume
TSVpr (TSVpr = SVpr beech + SVpr spruce) of each sub-sample:
PSV = SVpr / TSVpr x 100; Eq. 24
where:
PSV is the proportion of soil volume [%] occupied by beech (PSVbeech) or spruce (PSVspruce)
within soil sub-sample O+Ah or B;
Material and Methods
55
lxii
SVpr is SVpr beech or SVpr spruce within the corresponding soil sub-sample;
TSVpr is the corresponding total soil sub-sample volume [cm3] which was predicted to be
shared by beech and spruce. An overlapping of the zones of nutrient depletion of beech and
spruce roots from mixed plots was expected when TSVpr was calculated higher than the total
SV assessed by SC.
(5) The calculated PSV were set equal to the in situ portions of soil volume occupied
with respect to beech and spruce fine-roots each when growing in mixture. Therefore, the
soil volume occupied by beech fine roots (SV(O+Ah)beech for soil sub-sample O+Ah and
SV(B)beech for soil sub-sample B) was assessed as:
SV(O+Ah)beech = PSV(O+Ah)beech x SV(O+Ah); Eq. 25
SV(B)beech = PSV(B)beech x SV(B) ; Eq. 26
where:
SV(O+Ah) and SV(B) are the annual mean volumes assessed by SC of the soil sub-samples
O+Ah and B, respectively (see step 1). The same calculation was performed for spruce.
The approach presented here served to divide the measured volume of soil sub-samples
SV(O+Ah) or SV(B) into two parts: one occupied by beech and the other one occupied by spruce
fine-roots. These soil volumes were inputs in Eq. 21 to assess the “efficiency of belowground
space occupation” (BSO) of beech and spruce within mixed subplots. The C investment into
fine roots (cf. Eq. 21) was defined in mixed subplots as explained for the mono-specific
subplots (see above).
This approach is relatively simplified, since the “zone of influence” becomes a fixed, circular
shape, which represents fine-roots as a homogeneous system. The below-ground zone of
influence was characterized here in a field setting, both in intra- and interspecific competition,
where, as advantage compared to pot studies, lateral root growth was not constrained by the
size of the plot.
2.22.2 Belowground space exploitation
The “overlapping concept” model outlined by Fitter et al. (1991) implies that the increase in
root branching (or changes in root morphology) can lead to decrease in exploitation
efficiency. Similarly, Casper et al. (2003) demonstrated that decreases in inter-branch
distances would result in decreases in exploitation efficiency. Therefore, it is important to
quantify the space exploitation (e.g. the benefit from the root structure present in a given soil
volume) as well – not only the space occupation (e.g. the physical presence of roots within
the soil volume). Here, the “efficiency of belowground space exploitation” (BSE) is
Material and Methods
56
lxiii
accounting for root function in terms of resource uptake as related to the occupied soil
volume:
Resource uptake
BSE = ————————— [ml l-1 day-1] Eq. 27
Occupied soil volume
BSE here is the Daily specific water uptake rate SWU [ml g -1 day-1] along the annual mean
standing fine-root biomass of beech or spruce assessed during 2002 as fine-root density [mg
l-1] for both sub-samples of the soil cores. To this end, SWU was multiplied by the annual
mean fine root density [g l-1] in beech or spruce as assessed for both soil sub-samples.
2.22.3 Belowground “running costs”
The efficiency of “running costs” (BRC) is related to the maintenance of the present root
structures (e.g. to the “functional costs”) and is determined here by dividing the volume of
already occupied soil by carbon “costs” for root growth and respiration to sustain occupation
and exploitation this soil volume:
Occupied soil volume
BRC = ———————————————— [m3 g-1] Eq. 28
C investment into root respiration
Occupied soil volume is defined here as previously described in section 2.22.1.
Carbon costs of root respiration were calculated for one growing season from April 1 through
October 31 by using the annual mean (species-specific) standing fine-root biomass of the
year 2002 (from SC technique) and the mean fine-root respiration rate at 10°C (RR10I beech
and RR10I spruce, for more details see section 2.18.2).
2.23 Statistical analyses
Statistical evaluation was made by using SPSS (version 13.0, SPSS INC., Chicago, IL,
USA). Differences between means, factorial effects and factorial interactions were tested
with the General Linear Model procedure (GLM: repeated measures, univariate or
multivariate analysis with or without covariates) of the SPSS software. Data had been tested
for homogeneity using Lavene Test for Equality of Variances, and in case of unbalanced
design a non-parametrical Mann-Whitney-U-test (for independent samples) or Wilcoxon test
Material and Methods
57

lxiv
(for dependent samples) has been applied. Significance was determined at p<0.05 in all
analyses. Graphics design, correlation and regression analyses were performed by Origin
(version 6.0, Microcal Software Inc., USA). The differences between regression coefficients
were tested by t-tests (using SPSS) and by adjusting the alpha level (e.g. Bonferroni method;
Bärlocher, 1999).
Material and Methods
58
lxv
3 RESULTS
3.1 Climatic variation at “Kranzberger Forst” during 2002-2004
Climate conditions at “Kranzberger Forst” varied largely during the three study years
between extremely moist conditions during 2002 and extreme drought during 2003 (annual
means of climatic parameters during 2002 through 2004 see Tab. 1, and seasonal dynamics
of air temperature Tair, soil temperature, Ts, precipitation, Pa, and soil water content, SWC,
see Fig. 21). Ts at 0 cm soil depth was generally above 0°C throughout the three study
years, rising gradually between February and August, and declining between September and
January of the subsequent year. Mean annual Ts only slightly varied across the study period
(Tab. 1), however, was highest during the growing season of 2003, and lowest in 2004
because of cool conditions in May and June (Fig. 21). Pa of both 2002 and 2003, but not so
of 2004, differed significantly from the average of the reference period (RP, i.e. 1970-2000;
Tab. 1). Pa in 2002 was enhanced by 30% relative to the long-term average due to intense
rainfall during March and August. As a consequence, volumetric soil water content (SWC, %)
at 5 cm soil depth remained, throughout the growing season, above 14% which is the
minimum level of plant-available water in this soil (Raspe et al., 2004). On the contrary,
extreme summer drought prevailed in 2003 as a result of a 30% reduction in Pa and an
increase in air temperature by 3.2°C (during the growing season) relative to the respective
long-term averages. Water reserves at 5 cm soil depth were depleted until mid-July, when
SWC declined to the minimum of 14% (Fig. 21). Recovery of SWC did not occur before the
end of December 2003. During 2004, SWC at 5 cm depth was lower than during 2002, but
never reached the minimum of 14%. In summary, 2002 had highest Pa (1015 mm) and
highest mean air temperature (8.88°C) during the study period and contrasted with 2003
which displayed exceptionally low Pa (558 mm) at similar temperature; conditions in 2004
were representative of the long-term averages.
Comparing total monthly precipitation with mean monthly air temperature by means of a
Walter’s climate diagram (Fig. 22) indicates the temperature level to overpass that of
precipitation during March through April and August through September of 2003. Drought is
reflected, in particular, during the second half of the growing season. The extremely dry and
warm summer of 2003 set the stage for evaluating the responsiveness of the two competing
tree species, beech and spruce, to water limitation under the mixed-stand conditions of
“Kranzberger Forst”.
Results
59
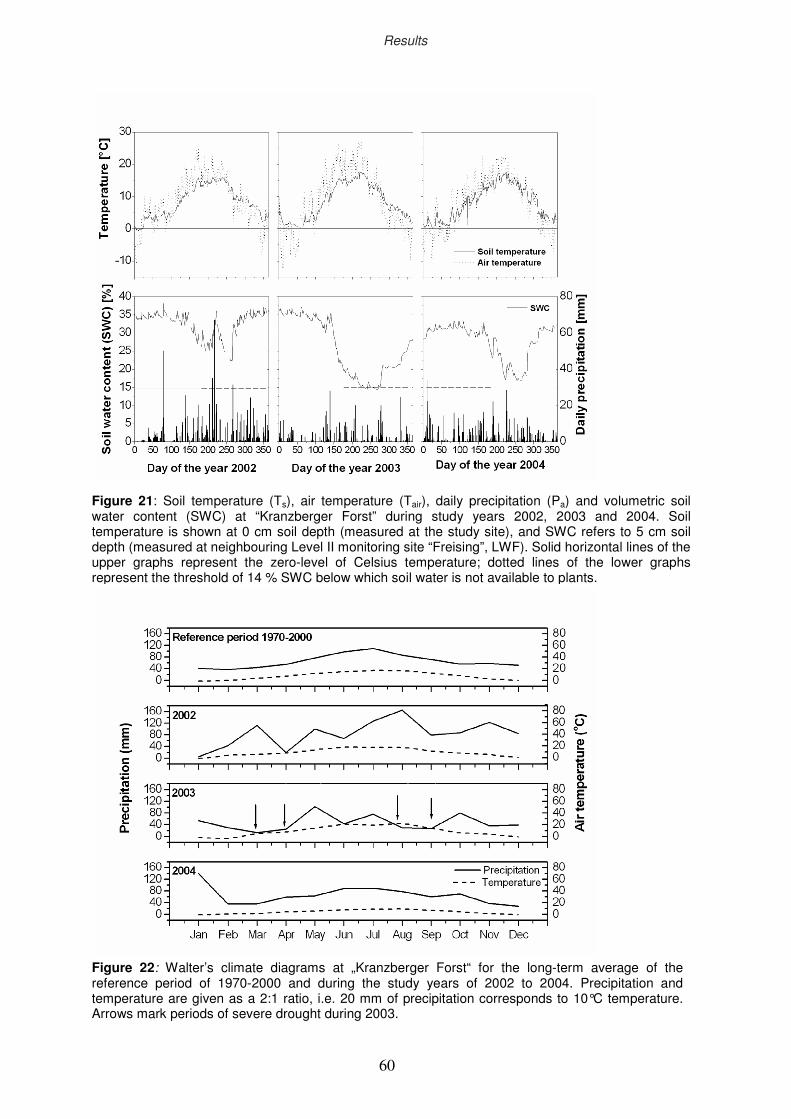
lxvi
Figure 21: Soil temperature (Ts), air temperature (Tair), daily precipitation (Pa) and volumetric soil water content (SWC) at “Kranzberger Forst” during study years 2002, 2003 and 2004. Soil temperature is shown at 0 cm soil depth (measured at the study site), and SWC refers to 5 cm soil depth (measured at neighbouring Level II monitoring site “Freising”, LWF). Solid horizontal lines of the upper graphs represent the zero-level of Celsius temperature; dotted lines of the lower graphs represent the threshold of 14 % SWC below which soil water is not available to plants.
Figure 22: Walter’s climate diagrams at „Kranzberger Forst“ for the long-term average of the reference period of 1970-2000 and during the study years of 2002 to 2004. Precipitation and temperature are given as a 2:1 ratio, i.e. 20 mm of precipitation corresponds to 10°C temperature. Arrows mark periods of severe drought during 2003.
Results
60
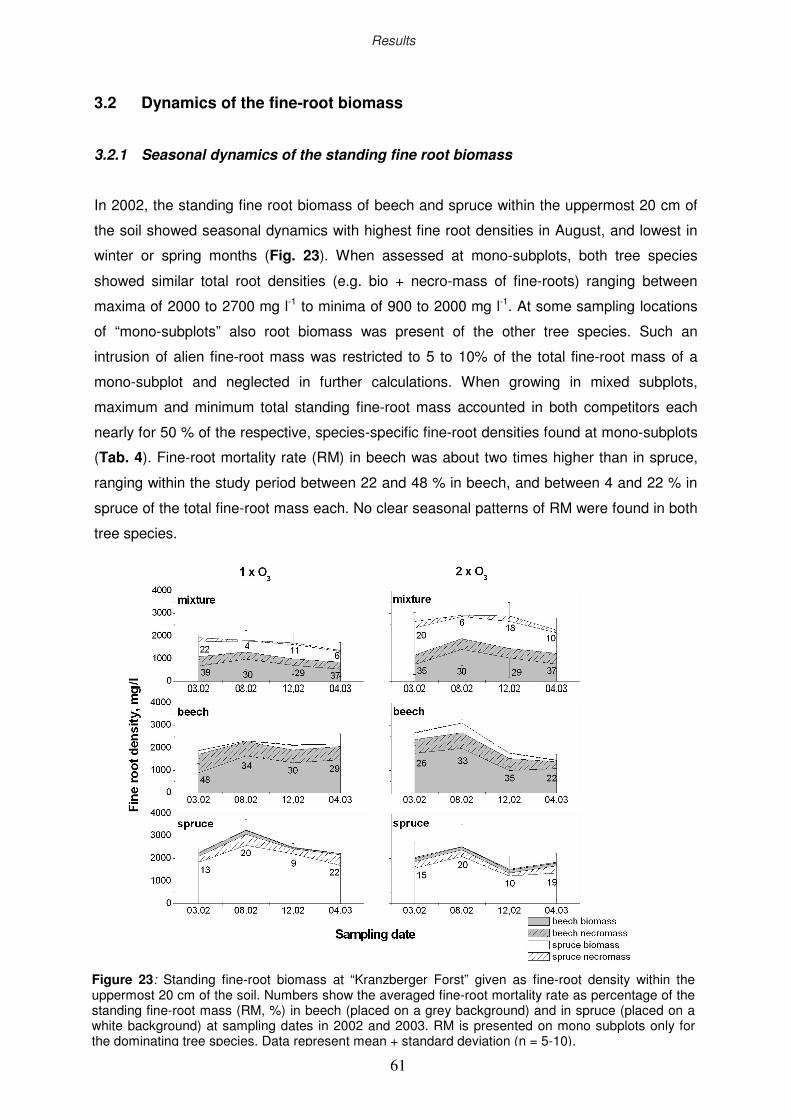
lxvii
3.2 Dynamics of the fine-root biomass
3.2.1 Seasonal dynamics of the standing fine root biomass
In 2002, the standing fine root biomass of beech and spruce within the uppermost 20 cm of
the soil showed seasonal dynamics with highest fine root densities in August, and lowest in
winter or spring months (Fig. 23). When assessed at mono-subplots, both tree species
showed similar total root densities (e.g. bio + necro-mass of fine-roots) ranging between
maxima of 2000 to 2700 mg l-1 to minima of 900 to 2000 mg l-1. At some sampling locations
of “mono-subplots” also root biomass was present of the other tree species. Such an
intrusion of alien fine-root mass was restricted to 5 to 10% of the total fine-root mass of a
mono-subplot and neglected in further calculations. When growing in mixed subplots,
maximum and minimum total standing fine-root mass accounted in both competitors each
nearly for 50 % of the respective, species-specific fine-root densities found at mono-subplots
(Tab. 4). Fine-root mortality rate (RM) in beech was about two times higher than in spruce,
ranging within the study period between 22 and 48 % in beech, and between 4 and 22 % in
spruce of the total fine-root mass each. No clear seasonal patterns of RM were found in both
tree species.
Figure 23: Standing fine-root biomass at “Kranzberger Forst” given as fine-root density within the uppermost 20 cm of the soil. Numbers show the averaged fine-root mortality rate as percentage of the standing fine-root mass (RM, %) in beech (placed on a grey background) and in spruce (placed on a white background) at sampling dates in 2002 and 2003. RM is presented on mono subplots only for the dominating tree species. Data represent mean + standard deviation (n = 5-10).
Results
61
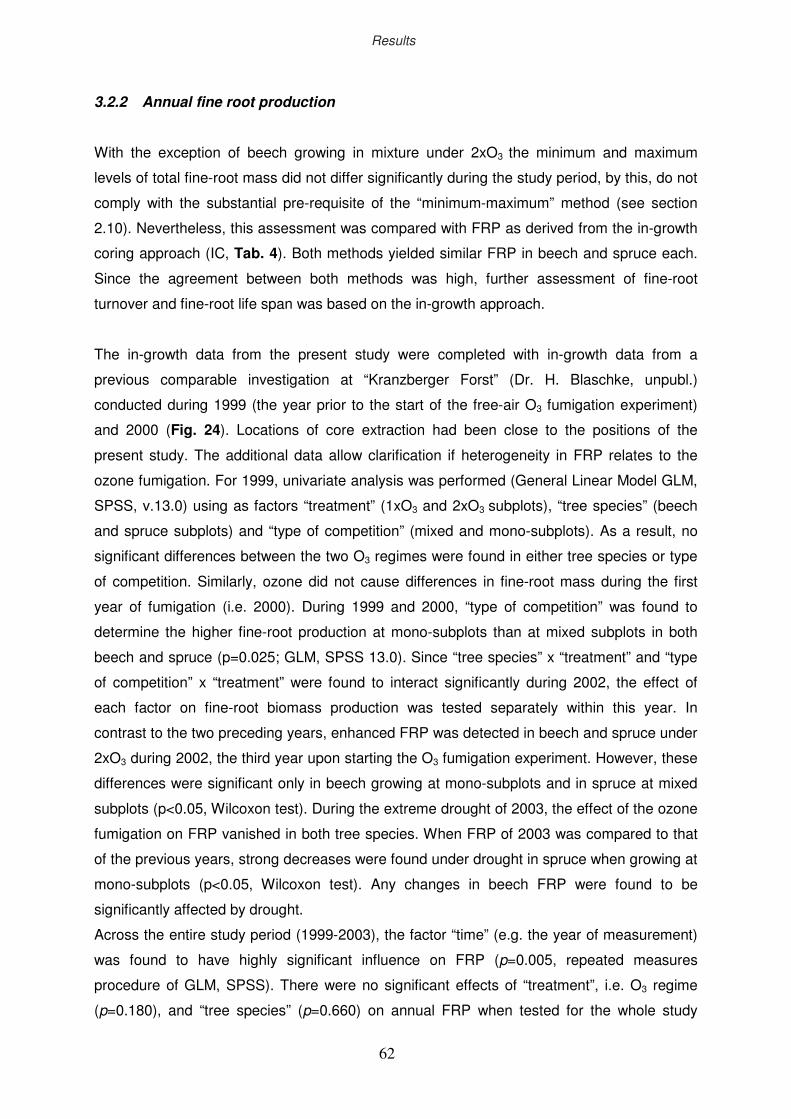
lxviii
3.2.2 Annual fine root production
With the exception of beech growing in mixture under 2xO3 the minimum and maximum
levels of total fine-root mass did not differ significantly during the study period, by this, do not
comply with the substantial pre-requisite of the “minimum-maximum” method (see section
2.10). Nevertheless, this assessment was compared with FRP as derived from the in-growth
coring approach (IC, Tab. 4). Both methods yielded similar FRP in beech and spruce each.
Since the agreement between both methods was high, further assessment of fine-root
turnover and fine-root life span was based on the in-growth approach.
The in-growth data from the present study were completed with in-growth data from a
previous comparable investigation at “Kranzberger Forst” (Dr. H. Blaschke, unpubl.)
conducted during 1999 (the year prior to the start of the free-air O3 fumigation experiment)
and 2000 (Fig. 24). Locations of core extraction had been close to the positions of the
present study. The additional data allow clarification if heterogeneity in FRP relates to the
ozone fumigation. For 1999, univariate analysis was performed (General Linear Model GLM,
SPSS, v.13.0) using as factors “treatment” (1xO3 and 2xO3 subplots), “tree species” (beech
and spruce subplots) and “type of competition” (mixed and mono-subplots). As a result, no
significant differences between the two O3 regimes were found in either tree species or type
of competition. Similarly, ozone did not cause differences in fine-root mass during the first
year of fumigation (i.e. 2000). During 1999 and 2000, “type of competition” was found to
determine the higher fine-root production at mono-subplots than at mixed subplots in both
beech and spruce (p=0.025; GLM, SPSS 13.0). Since “tree species” x “treatment” and “type
of competition” x “treatment” were found to interact significantly during 2002, the effect of
each factor on fine-root biomass production was tested separately within this year. In
contrast to the two preceding years, enhanced FRP was detected in beech and spruce under
2xO3 during 2002, the third year upon starting the O3 fumigation experiment. However, these
differences were significant only in beech growing at mono-subplots and in spruce at mixed
subplots (p<0.05, Wilcoxon test). During the extreme drought of 2003, the effect of the ozone
fumigation on FRP vanished in both tree species. When FRP of 2003 was compared to that
of the previous years, strong decreases were found under drought in spruce when growing at
mono-subplots (p<0.05, Wilcoxon test). Any changes in beech FRP were found to be
significantly affected by drought.
Across the entire study period (1999-2003), the factor “time” (e.g. the year of measurement)
was found to have highly significant influence on FRP (p=0.005, repeated measures
procedure of GLM, SPSS). There were no significant effects of “treatment”, i.e. O3 regime
(p=0.180), and “tree species” (p=0.660) on annual FRP when tested for the whole study
Results
62
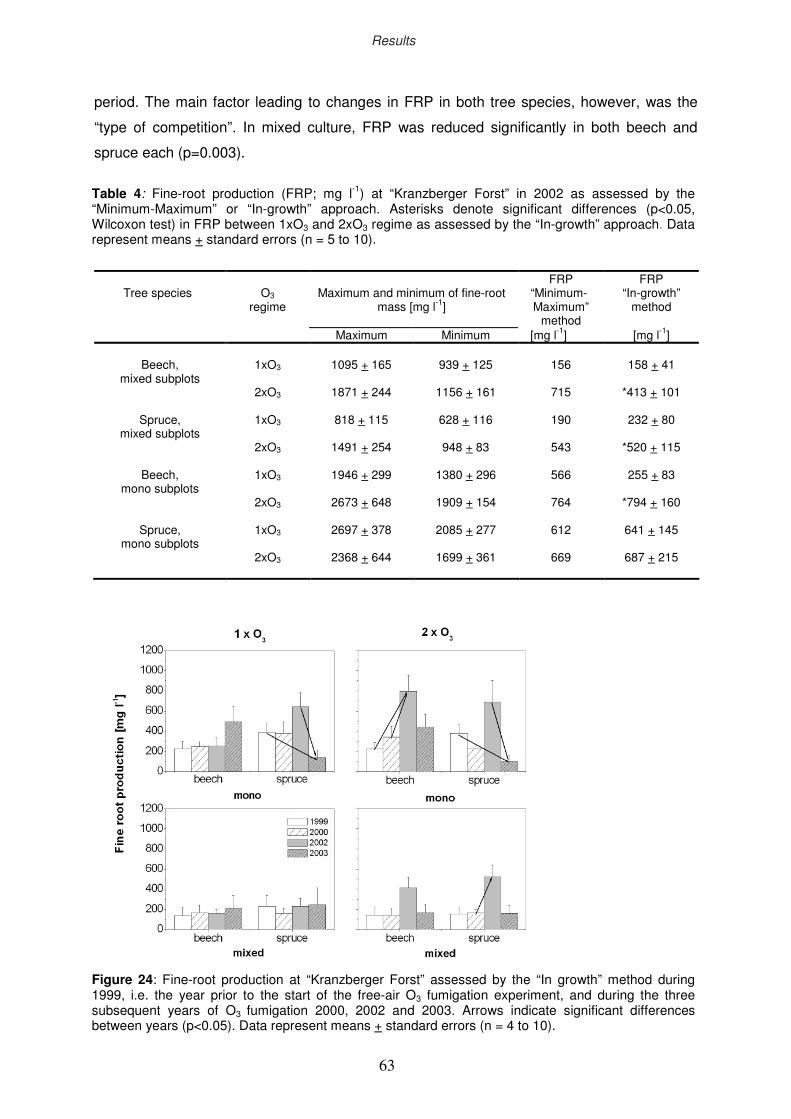
lxix
period. The main factor leading to changes in FRP in both tree species, however, was the
“type of competition”. In mixed culture, FRP was reduced significantly in both beech and
spruce each (p=0.003).
Tree species
O3
regime
Maximum and minimum of fine-root
mass [mg l-1]
FRP “Minimum-Maximum”
method
FRP “In-growth”
method
Maximum Minimum [mg l-1] [mg l-1]
Beech, mixed subplots
1xO3
1095 + 165
939 + 125
156
158 + 41
2xO3 1871 + 244 1156 + 161 715 *413 + 101
Spruce,
mixed subplots 1xO3 818 + 115 628 + 116 190 232 + 80
2xO3 1491 + 254 948 + 83 543 *520 + 115
Beech,
mono subplots 1xO3 1946 + 299 1380 + 296 566 255 + 83
2xO3 2673 + 648 1909 + 154 764 *794 + 160
Spruce,
mono subplots 1xO3 2697 + 378 2085 + 277 612 641 + 145
2xO3 2368 + 644 1699 + 361 669 687 + 215
Table 4: Fine-root production (FRP; mg l-1) at “Kranzberger Forst” in 2002 as assessed by the “Minimum-Maximum” or “In-growth” approach. Asterisks denote significant differences (p<0.05, Wilcoxon test) in FRP between 1xO3 and 2xO3 regime as assessed by the “In-growth” approach. Data represent means + standard errors (n = 5 to 10).
Figure 24: Fine-root production at “Kranzberger Forst” assessed by the “In growth” method during 1999, i.e. the year prior to the start of the free-air O3 fumigation experiment, and during the three subsequent years of O3 fumigation 2000, 2002 and 2003. Arrows indicate significant differences between years (p<0.05). Data represent means + standard errors (n = 4 to 10).
Results
63
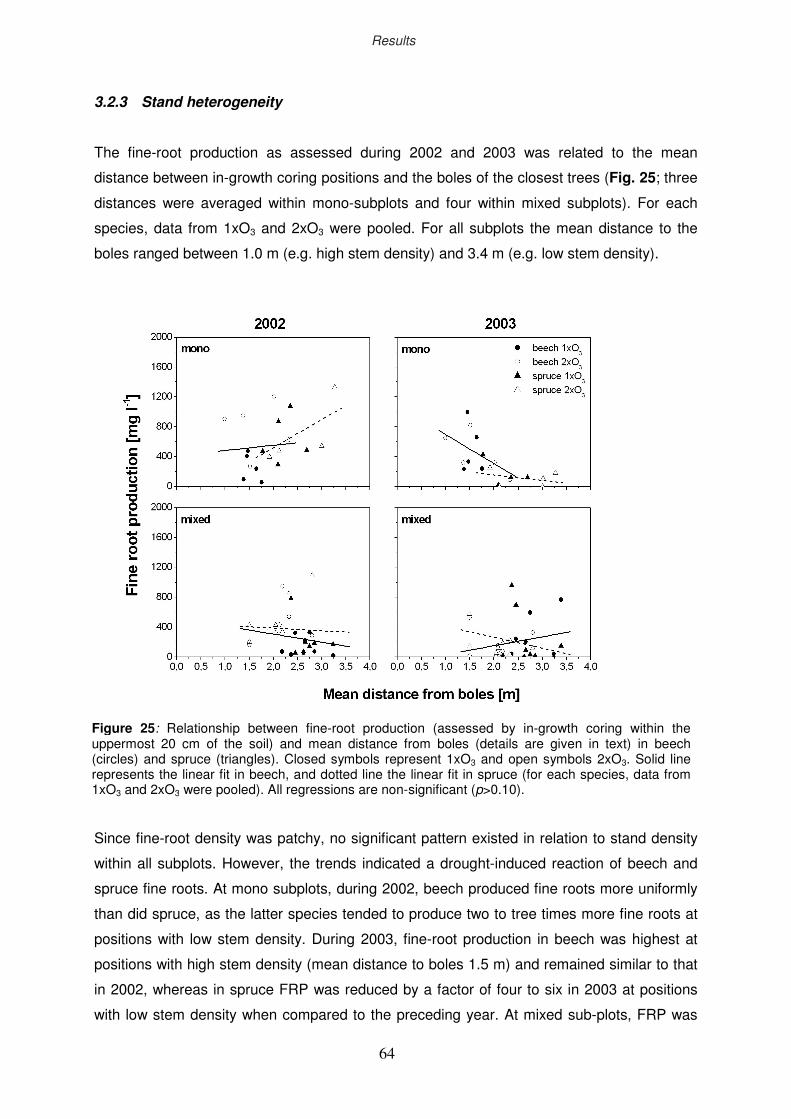
lxx
3.2.3 Stand heterogeneity
The fine-root production as assessed during 2002 and 2003 was related to the mean
distance between in-growth coring positions and the boles of the closest trees (Fig. 25; three
distances were averaged within mono-subplots and four within mixed subplots). For each
species, data from 1xO3 and 2xO3 were pooled. For all subplots the mean distance to the
boles ranged between 1.0 m (e.g. high stem density) and 3.4 m (e.g. low stem density).
Since fine-root density was patchy, no significant pattern existed in relation to stand density
within all subplots. However, the trends indicated a drought-induced reaction of beech and
spruce fine roots. At mono subplots, during 2002, beech produced fine roots more uniformly
than did spruce, as the latter species tended to produce two to tree times more fine roots at
positions with low stem density. During 2003, fine-root production in beech was highest at
positions with high stem density (mean distance to boles 1.5 m) and remained similar to that
in 2002, whereas in spruce FRP was reduced by a factor of four to six in 2003 at positions
with low stem density when compared to the preceding year. At mixed sub-plots, FRP was
Figure 25: Relationship between fine-root production (assessed by in-growth coring within the uppermost 20 cm of the soil) and mean distance from boles (details are given in text) in beech (circles) and spruce (triangles). Closed symbols represent 1xO3 and open symbols 2xO3. Solid line represents the linear fit in beech, and dotted line the linear fit in spruce (for each species, data from 1xO3 and 2xO3 were pooled). All regressions are non-significant (p>0.10).
Results
64
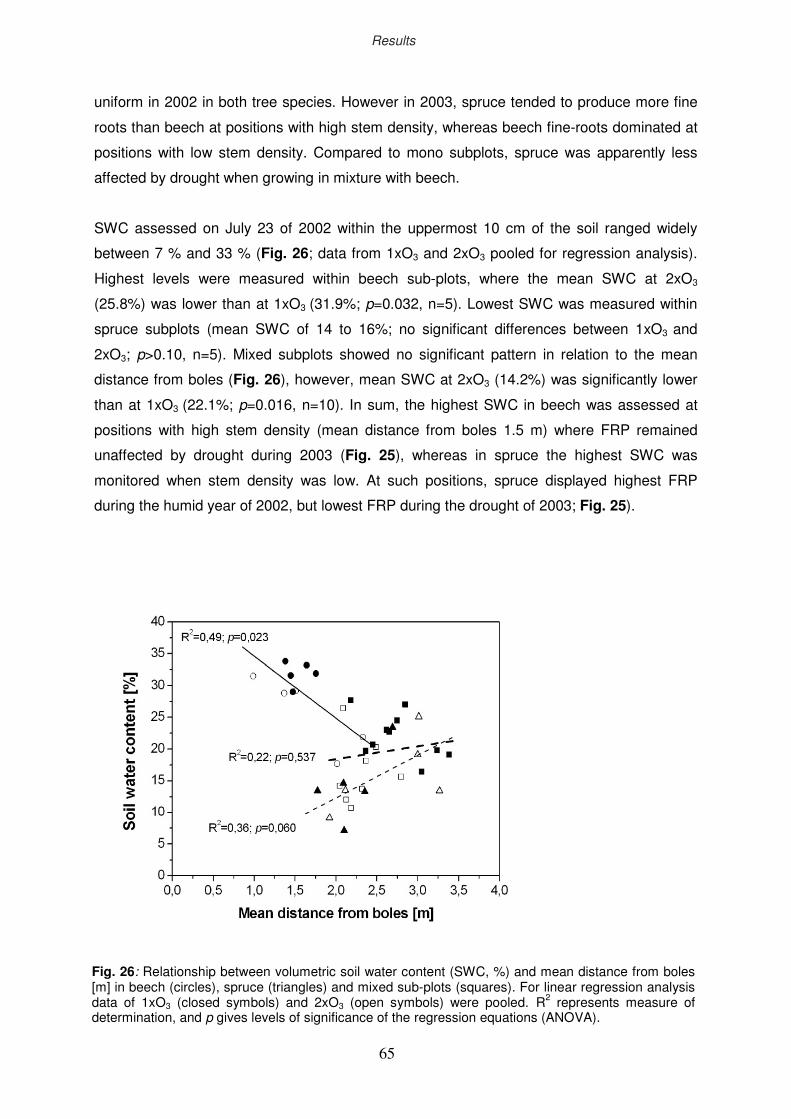
lxxi
uniform in 2002 in both tree species. However in 2003, spruce tended to produce more fine
roots than beech at positions with high stem density, whereas beech fine-roots dominated at
positions with low stem density. Compared to mono subplots, spruce was apparently less
affected by drought when growing in mixture with beech.
SWC assessed on July 23 of 2002 within the uppermost 10 cm of the soil ranged widely
between 7 % and 33 % (Fig. 26; data from 1xO3 and 2xO3 pooled for regression analysis).
Highest levels were measured within beech sub-plots, where the mean SWC at 2xO3
(25.8%) was lower than at 1xO3 (31.9%; p=0.032, n=5). Lowest SWC was measured within
spruce subplots (mean SWC of 14 to 16%; no significant differences between 1xO3 and
2xO3; p>0.10, n=5). Mixed subplots showed no significant pattern in relation to the mean
distance from boles (Fig. 26), however, mean SWC at 2xO3 (14.2%) was significantly lower
than at 1xO3 (22.1%; p=0.016, n=10). In sum, the highest SWC in beech was assessed at
positions with high stem density (mean distance from boles 1.5 m) where FRP remained
unaffected by drought during 2003 (Fig. 25), whereas in spruce the highest SWC was
monitored when stem density was low. At such positions, spruce displayed highest FRP
during the humid year of 2002, but lowest FRP during the drought of 2003; Fig. 25).
Fig. 26: Relationship between volumetric soil water content (SWC, %) and mean distance from boles [m] in beech (circles), spruce (triangles) and mixed sub-plots (squares). For linear regression analysis data of 1xO3 (closed symbols) and 2xO3 (open symbols) were pooled. R2 represents measure of determination, and p gives levels of significance of the regression equations (ANOVA).
Results
65
lxxii
3.2.4 Fine-root turnover
During 2002, in both tree species the turnover rate (RT, %) of fine roots was found to be
higher under 2xO3 than under 1xO3 (Tab. 5). Under 1xO3, about 30 % of beech fine roots
were renewed at both mono and mixed subplots. In spruce, about 40% (at the mono-subplot)
to 50% (at the mixed subplot) of fine roots died and were newly produced, showing higher
dynamics of fine-root biomass at 1xO3 compared to beech. Under 2xO3, the turnover rate of
beech fine roots was found to be two to three times higher compared to1xO3, with higher RT
levels at mono than mixed subplots (79% and 55% respectively). In spruce growing under
2xO3, renewal of fine roots was found to increase less distinctly than in beech. At 2xO3, RT in
spruce was enhanced by 7% (mixed subplots) and by 20% (mono subplots) relative to 1xO3.
As affected by drought during 2003, RT of fine roots produced under 1xO3 increased (beech
at mono and mixed subplots) or remained at a level similar (spruce at mixed subplots) to that
in 2002. RT of spruce growing at mono subplots declined dramatically to 8% in 2003. The
combination of drought and 2xO3 caused, in general, a decline of RT by a factor of two to
three in relation to 2002. Hence, spruce responded again with strong reduction in RT
dynamics, renewing only 8% of the standing fine-root biomass.
3.3.5 Life span of fine roots
Root life span (RL) similarly to fine-root turnover differed in this study largely between tree
species, O3 regimes, types of competition and years (Tab. 5). However some pattern in its
dynamics could be found. The non-limiting water supply combined with 2xO3 resulted in the
shortest life span of fine roots (1.3 to 2 years) of both beech and spruce trees, independent
of the type of competition. The limited water supply combined with 2xO3 enhanced the
longevity of both beech and spruce fine roots when growing in mixture (RL of 4.5 to 5.6
years). When growing at mono subplots, the combination of both 2xO3 and severe drought
induced different responses in beech and spruce: in beech RL was lowered compared to the
mixture (by up to 2.5 years), but in spruce RL increased strongly by up to 12 years. During
2003, fine-root longevity of about 12 years was detected also in spruce mono-subplots even
under 1xO3, which indicates the dominating role of drought in limiting fine-root dynamics in
spruce. Conversely, in beech the neighbourhood with spruce was likely to be a crucial factor
in stimulating high fine-root longevity when water became limiting under 2xO3.
Results
66
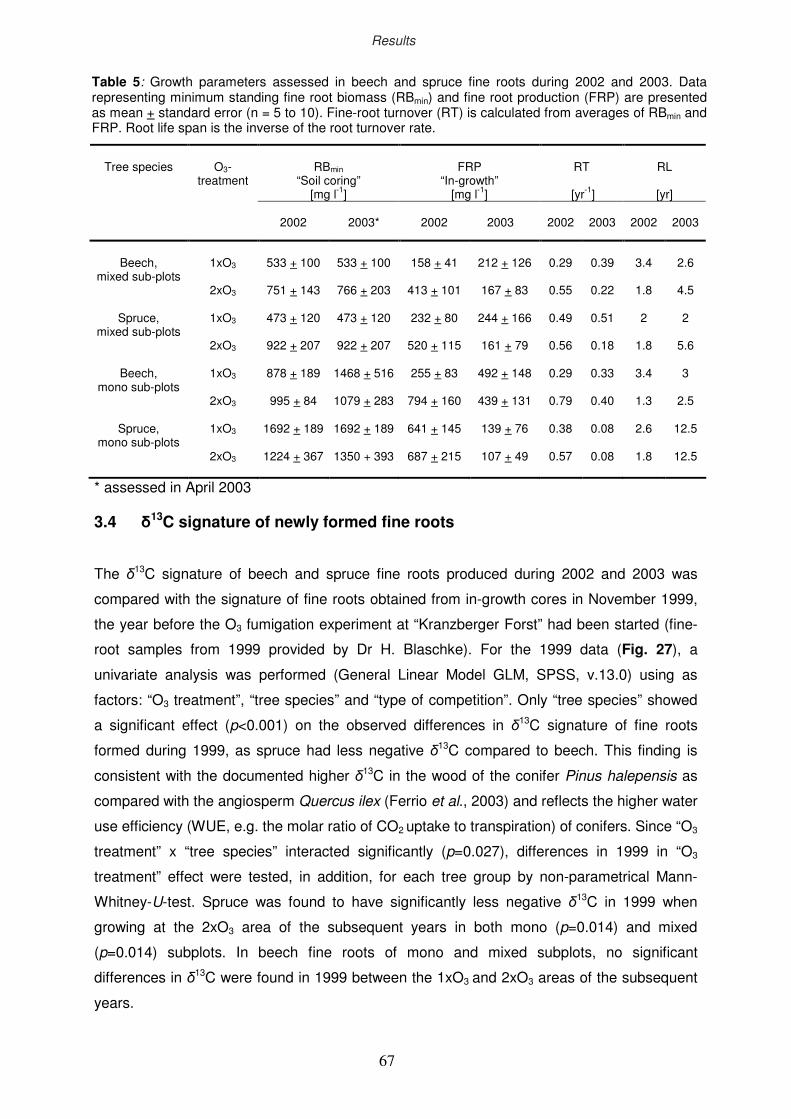
lxxiii
RBmin
“Soil coring” [mg l-1]
FRP
“In-growth” [mg l-1]
RT
[yr-1]
RL
[yr]
Tree species
O3-
treatment
2002
2003*
2002
2003
2002
2003
2002
2003
Beech,
mixed sub-plots
1xO3
533 + 100
533 + 100
158 + 41
212 + 126
0.29
0.39
3.4
2.6
2xO3 751 + 143 766 + 203 413 + 101
167 + 83 0.55 0.22 1.8 4.5
Spruce, mixed sub-plots
1xO3 473 + 120 473 + 120 232 + 80
244 + 166 0.49 0.51 2 2
2xO3 922 + 207 922 + 207 520 + 115
161 + 79 0.56 0.18 1.8 5.6
Beech, mono sub-plots
1xO3 878 + 189 1468 + 516 255 + 83
492 + 148 0.29 0.33 3.4 3
2xO3 995 + 84 1079 + 283 794 + 160
439 + 131 0.79 0.40 1.3 2.5
Spruce, mono sub-plots
1xO3 1692 + 189 1692 + 189 641 + 145
139 + 76 0.38 0.08 2.6 12.5
2xO3 1224 + 367 1350 + 393 687 + 215
107 + 49 0.57 0.08 1.8 12.5
* assessed in April 2003 3.4 δ
13C signature of newly formed fine roots
The δ13C signature of beech and spruce fine roots produced during 2002 and 2003 was
compared with the signature of fine roots obtained from in-growth cores in November 1999,
the year before the O3 fumigation experiment at “Kranzberger Forst” had been started (fine-
root samples from 1999 provided by Dr H. Blaschke). For the 1999 data (Fig. 27), a
univariate analysis was performed (General Linear Model GLM, SPSS, v.13.0) using as
factors: “O3 treatment”, “tree species” and “type of competition”. Only “tree species” showed
a significant effect (p<0.001) on the observed differences in δ13C signature of fine roots
formed during 1999, as spruce had less negative δ13C compared to beech. This finding is
consistent with the documented higher δ13C in the wood of the conifer Pinus halepensis as
compared with the angiosperm Quercus ilex (Ferrio et al., 2003) and reflects the higher water
use efficiency (WUE, e.g. the molar ratio of CO2 uptake to transpiration) of conifers. Since “O3
treatment” x “tree species” interacted significantly (p=0.027), differences in 1999 in “O3
treatment” effect were tested, in addition, for each tree group by non-parametrical Mann-
Whitney-U-test. Spruce was found to have significantly less negative δ13C in 1999 when
growing at the 2xO3 area of the subsequent years in both mono (p=0.014) and mixed
(p=0.014) subplots. In beech fine roots of mono and mixed subplots, no significant
differences in δ13C were found in 1999 between the 1xO3 and 2xO3 areas of the subsequent
years.
Table 5: Growth parameters assessed in beech and spruce fine roots during 2002 and 2003. Data representing minimum standing fine root biomass (RBmin) and fine root production (FRP) are presented as mean + standard error (n = 5 to 10). Fine-root turnover (RT) is calculated from averages of RBmin and FRP. Root life span is the inverse of the root turnover rate.
Results
67
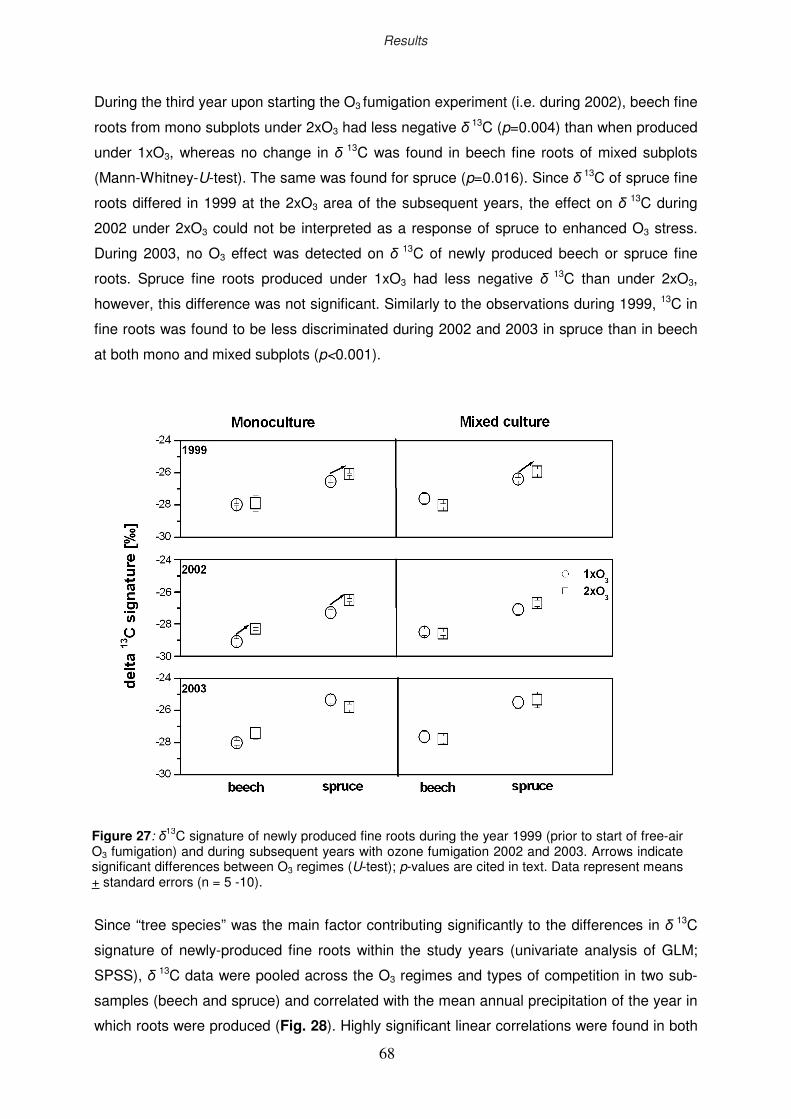
lxxiv
During the third year upon starting the O3 fumigation experiment (i.e. during 2002), beech fine
roots from mono subplots under 2xO3 had less negative δ 13C (p=0.004) than when produced
under 1xO3, whereas no change in δ 13C was found in beech fine roots of mixed subplots
(Mann-Whitney-U-test). The same was found for spruce (p=0.016). Since δ 13C of spruce fine
roots differed in 1999 at the 2xO3 area of the subsequent years, the effect on δ 13C during
2002 under 2xO3 could not be interpreted as a response of spruce to enhanced O3 stress.
During 2003, no O3 effect was detected on δ 13C of newly produced beech or spruce fine
roots. Spruce fine roots produced under 1xO3 had less negative δ 13C than under 2xO3,
however, this difference was not significant. Similarly to the observations during 1999, 13C in
fine roots was found to be less discriminated during 2002 and 2003 in spruce than in beech
at both mono and mixed subplots (p<0.001).
Since “tree species” was the main factor contributing significantly to the differences in δ 13C
signature of newly-produced fine roots within the study years (univariate analysis of GLM;
SPSS), δ 13C data were pooled across the O3 regimes and types of competition in two sub-
samples (beech and spruce) and correlated with the mean annual precipitation of the year in
which roots were produced (Fig. 28). Highly significant linear correlations were found in both
Figure 27: δ13C signature of newly produced fine roots during the year 1999 (prior to start of free-air O3 fumigation) and during subsequent years with ozone fumigation 2002 and 2003. Arrows indicate significant differences between O3 regimes (U-test); p-values are cited in text. Data represent means + standard errors (n = 5 -10).
Results
68
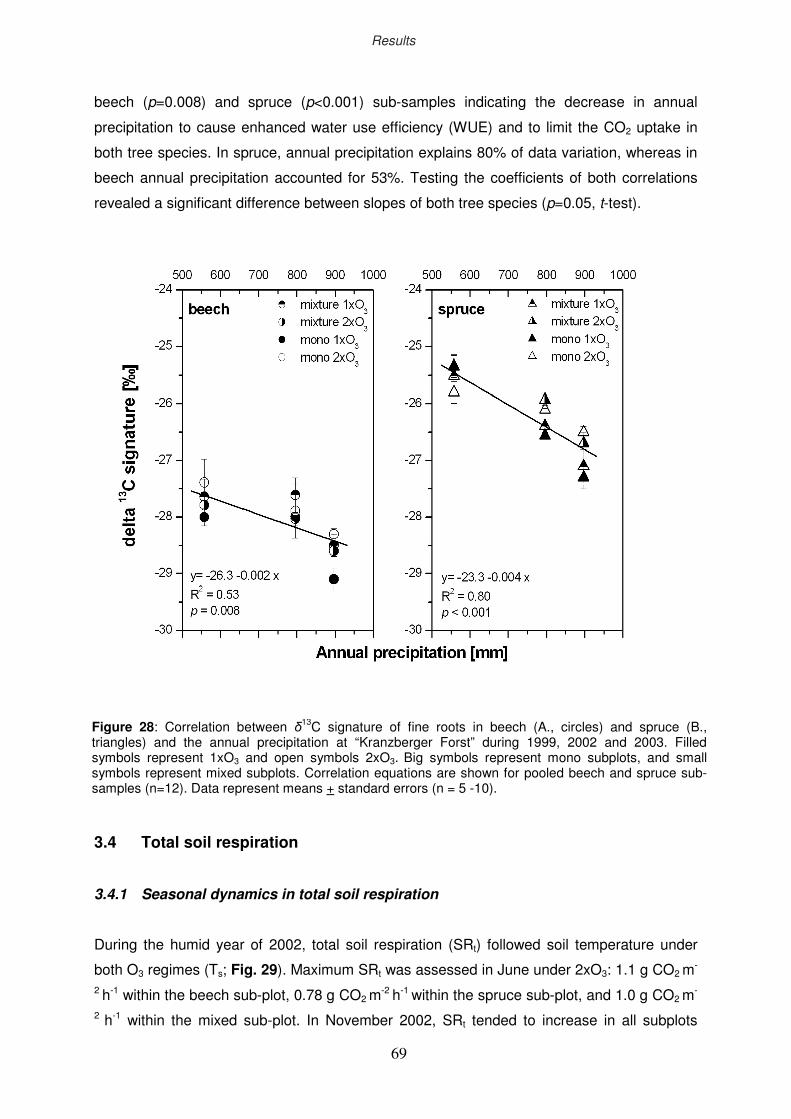
lxxv
beech (p=0.008) and spruce (p<0.001) sub-samples indicating the decrease in annual
precipitation to cause enhanced water use efficiency (WUE) and to limit the CO2 uptake in
both tree species. In spruce, annual precipitation explains 80% of data variation, whereas in
beech annual precipitation accounted for 53%. Testing the coefficients of both correlations
revealed a significant difference between slopes of both tree species (p=0.05, t-test).
3.4 Total soil respiration
3.4.1 Seasonal dynamics in total soil respiration
During the humid year of 2002, total soil respiration (SRt) followed soil temperature under
both O3 regimes (Ts; Fig. 29). Maximum SRt was assessed in June under 2xO3: 1.1 g CO2 m-
2 h-1 within the beech sub-plot, 0.78 g CO2 m-2 h-1 within the spruce sub-plot, and 1.0 g CO2 m
-
2 h-1 within the mixed sub-plot. In November 2002, SRt tended to increase in all subplots
Figure 28: Correlation between δ13C signature of fine roots in beech (A., circles) and spruce (B., triangles) and the annual precipitation at “Kranzberger Forst” during 1999, 2002 and 2003. Filled symbols represent 1xO3 and open symbols 2xO3. Big symbols represent mono subplots, and small symbols represent mixed subplots. Correlation equations are shown for pooled beech and spruce sub- samples (n=12). Data represent means + standard errors (n = 5 -10).
Results
69
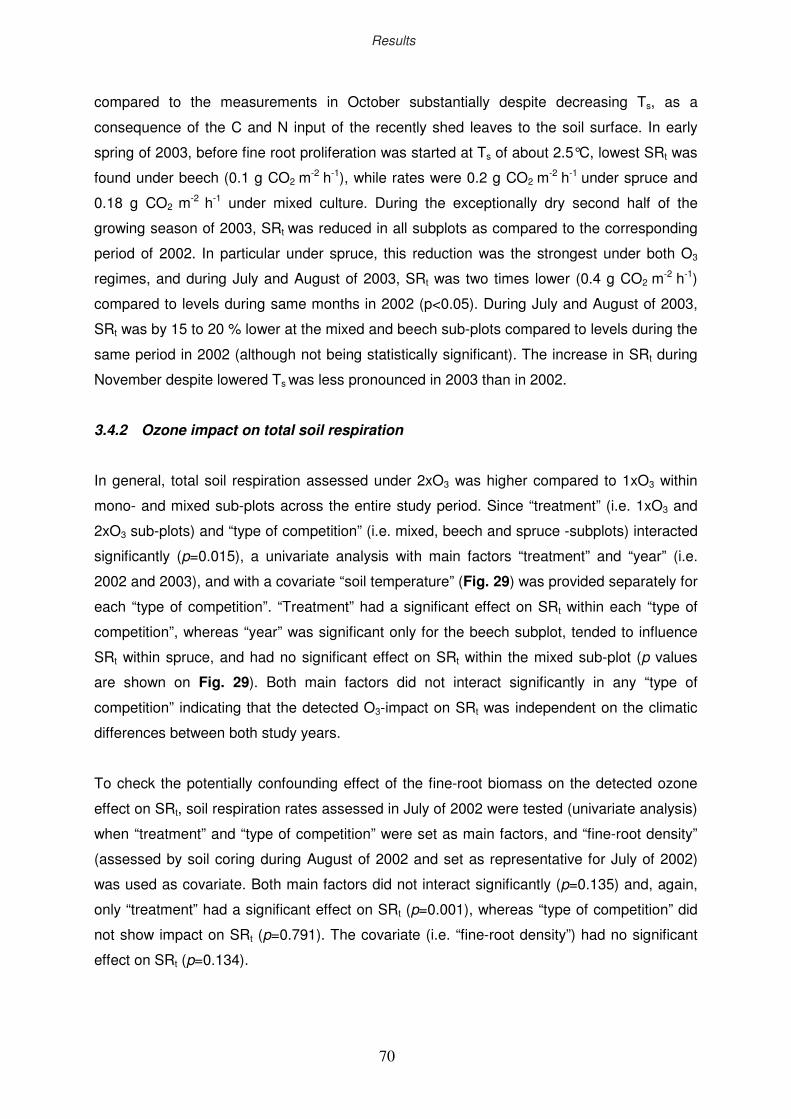
lxxvi
compared to the measurements in October substantially despite decreasing Ts, as a
consequence of the C and N input of the recently shed leaves to the soil surface. In early
spring of 2003, before fine root proliferation was started at Ts of about 2.5°C, lowest SRt was
found under beech (0.1 g CO2 m-2 h-1), while rates were 0.2 g CO2 m
-2 h-1 under spruce and
0.18 g CO2 m-2 h-1 under mixed culture. During the exceptionally dry second half of the
growing season of 2003, SRt was reduced in all subplots as compared to the corresponding
period of 2002. In particular under spruce, this reduction was the strongest under both O3
regimes, and during July and August of 2003, SRt was two times lower (0.4 g CO2 m-2 h-1)
compared to levels during same months in 2002 (p<0.05). During July and August of 2003,
SRt was by 15 to 20 % lower at the mixed and beech sub-plots compared to levels during the
same period in 2002 (although not being statistically significant). The increase in SRt during
November despite lowered Ts was less pronounced in 2003 than in 2002.
3.4.2 Ozone impact on total soil respiration
In general, total soil respiration assessed under 2xO3 was higher compared to 1xO3 within
mono- and mixed sub-plots across the entire study period. Since “treatment” (i.e. 1xO3 and
2xO3 sub-plots) and “type of competition” (i.e. mixed, beech and spruce -subplots) interacted
significantly (p=0.015), a univariate analysis with main factors “treatment” and “year” (i.e.
2002 and 2003), and with a covariate “soil temperature” (Fig. 29) was provided separately for
each “type of competition”. “Treatment” had a significant effect on SRt within each “type of
competition”, whereas “year” was significant only for the beech subplot, tended to influence
SRt within spruce, and had no significant effect on SRt within the mixed sub-plot (p values
are shown on Fig. 29). Both main factors did not interact significantly in any “type of
competition” indicating that the detected O3-impact on SRt was independent on the climatic
differences between both study years.
To check the potentially confounding effect of the fine-root biomass on the detected ozone
effect on SRt, soil respiration rates assessed in July of 2002 were tested (univariate analysis)
when “treatment” and “type of competition” were set as main factors, and “fine-root density”
(assessed by soil coring during August of 2002 and set as representative for July of 2002)
was used as covariate. Both main factors did not interact significantly (p=0.135) and, again,
only “treatment” had a significant effect on SRt (p=0.001), whereas “type of competition” did
not show impact on SRt (p=0.791). The covariate (i.e. “fine-root density”) had no significant
effect on SRt (p=0.134).
Results
70
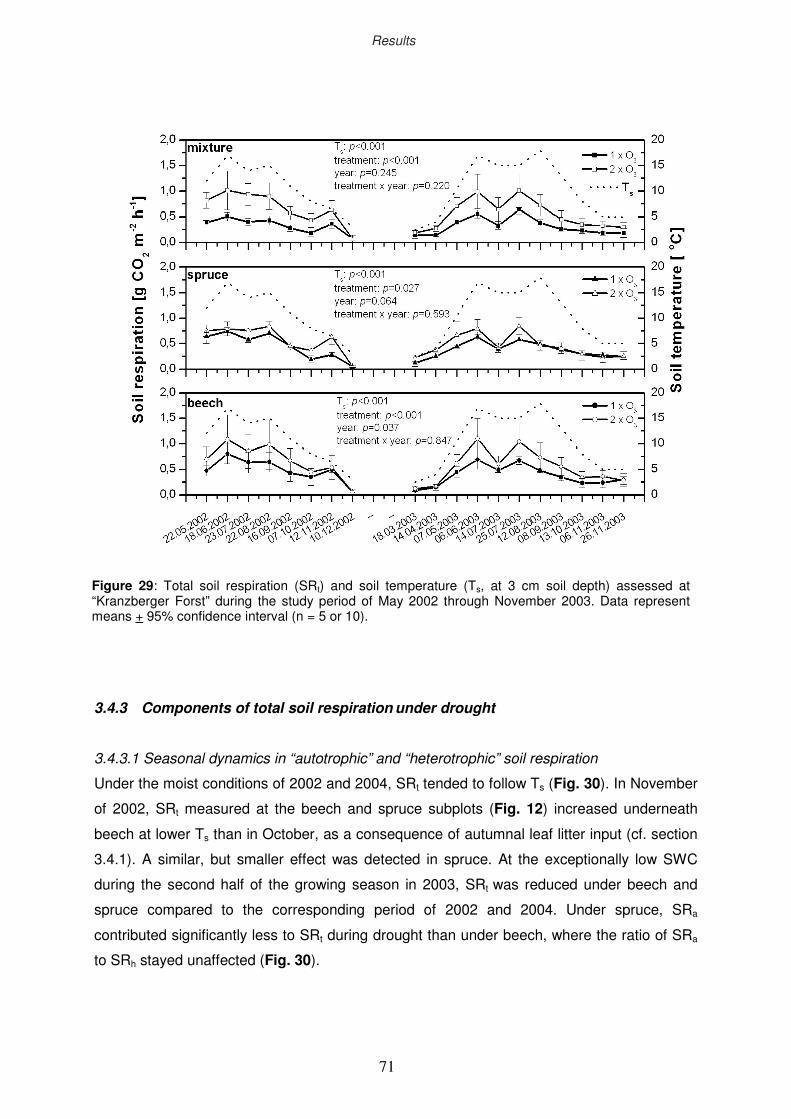
lxxvii
3.4.3 Components of total soil respiration under drought
3.4.3.1 Seasonal dynamics in “autotrophic” and “heterotrophic” soil respiration
Under the moist conditions of 2002 and 2004, SRt tended to follow Ts (Fig. 30). In November
of 2002, SRt measured at the beech and spruce subplots (Fig. 12) increased underneath
beech at lower Ts than in October, as a consequence of autumnal leaf litter input (cf. section
3.4.1). A similar, but smaller effect was detected in spruce. At the exceptionally low SWC
during the second half of the growing season in 2003, SRt was reduced under beech and
spruce compared to the corresponding period of 2002 and 2004. Under spruce, SRa
contributed significantly less to SRt during drought than under beech, where the ratio of SRa
to SRh stayed unaffected (Fig. 30).
Figure 29: Total soil respiration (SRt) and soil temperature (Ts, at 3 cm soil depth) assessed at “Kranzberger Forst” during the study period of May 2002 through November 2003. Data represent means + 95% confidence interval (n = 5 or 10).
Results
71
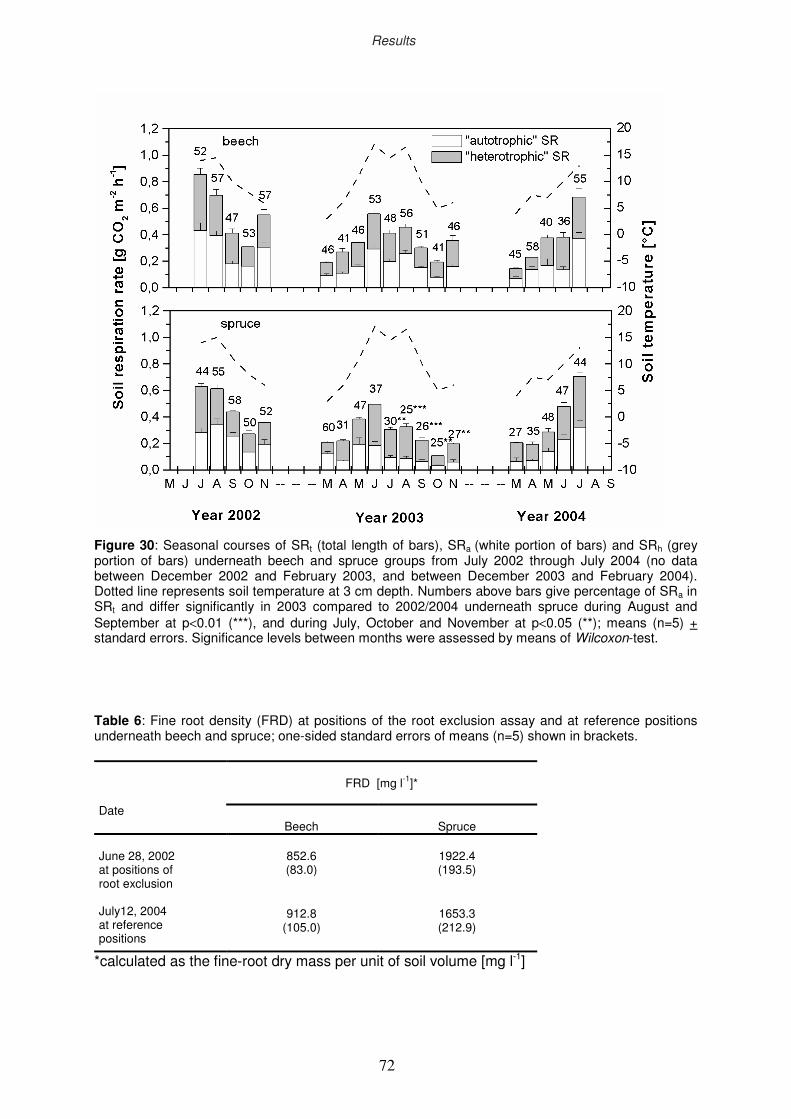
lxxviii
Figure 30: Seasonal courses of SRt (total length of bars), SRa (white portion of bars) and SRh (grey portion of bars) underneath beech and spruce groups from July 2002 through July 2004 (no data between December 2002 and February 2003, and between December 2003 and February 2004). Dotted line represents soil temperature at 3 cm depth. Numbers above bars give percentage of SRa in SRt and differ significantly in 2003 compared to 2002/2004 underneath spruce during August and September at p<0.01 (***), and during July, October and November at p<0.05 (**); means (n=5) + standard errors. Significance levels between months were assessed by means of Wilcoxon-test.
Table 6: Fine root density (FRD) at positions of the root exclusion assay and at reference positions underneath beech and spruce; one-sided standard errors of means (n=5) shown in brackets.
FRD [mg l-1]*
Date
Beech
Spruce June 28, 2002 at positions of root exclusion
852.6 (83.0)
1922.4 (193.5)
July12, 2004 at reference positions
912.8 (105.0)
1653.3 (212.9)
*calculated as the fine-root dry mass per unit of soil volume [mg l-1]
Results
72
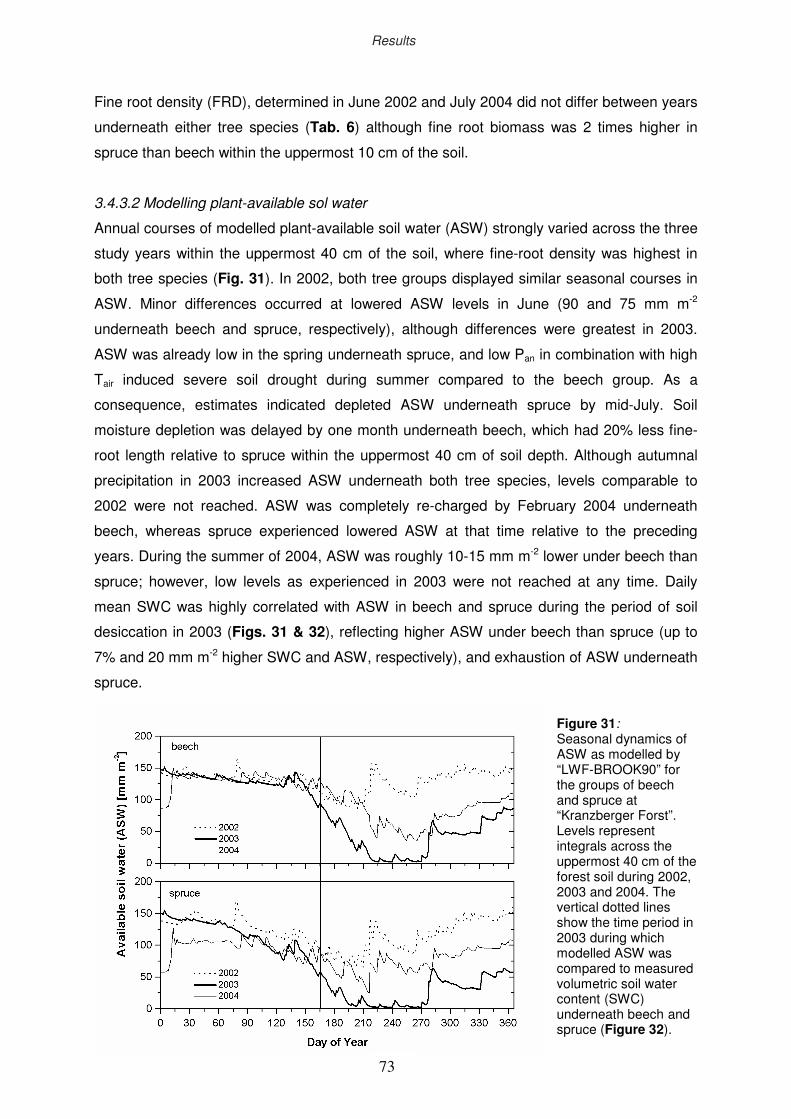
lxxix
Fine root density (FRD), determined in June 2002 and July 2004 did not differ between years
underneath either tree species (Tab. 6) although fine root biomass was 2 times higher in
spruce than beech within the uppermost 10 cm of the soil.
3.4.3.2 Modelling plant-available sol water
Annual courses of modelled plant-available soil water (ASW) strongly varied across the three
study years within the uppermost 40 cm of the soil, where fine-root density was highest in
both tree species (Fig. 31). In 2002, both tree groups displayed similar seasonal courses in
ASW. Minor differences occurred at lowered ASW levels in June (90 and 75 mm m-2
underneath beech and spruce, respectively), although differences were greatest in 2003.
ASW was already low in the spring underneath spruce, and low Pan in combination with high
Tair induced severe soil drought during summer compared to the beech group. As a
consequence, estimates indicated depleted ASW underneath spruce by mid-July. Soil
moisture depletion was delayed by one month underneath beech, which had 20% less fine-
root length relative to spruce within the uppermost 40 cm of soil depth. Although autumnal
precipitation in 2003 increased ASW underneath both tree species, levels comparable to
2002 were not reached. ASW was completely re-charged by February 2004 underneath
beech, whereas spruce experienced lowered ASW at that time relative to the preceding
years. During the summer of 2004, ASW was roughly 10-15 mm m-2 lower under beech than
spruce; however, low levels as experienced in 2003 were not reached at any time. Daily
mean SWC was highly correlated with ASW in beech and spruce during the period of soil
desiccation in 2003 (Figs. 31 & 32), reflecting higher ASW under beech than spruce (up to
7% and 20 mm m-2 higher SWC and ASW, respectively), and exhaustion of ASW underneath
spruce.
Figure 31: Seasonal dynamics of ASW as modelled by “LWF-BROOK90” for the groups of beech and spruce at “Kranzberger Forst”. Levels represent integrals across the uppermost 40 cm of the forest soil during 2002, 2003 and 2004. The vertical dotted lines show the time period in 2003 during which modelled ASW was compared to measured volumetric soil water content (SWC) underneath beech and spruce (Figure 32).
Results
73
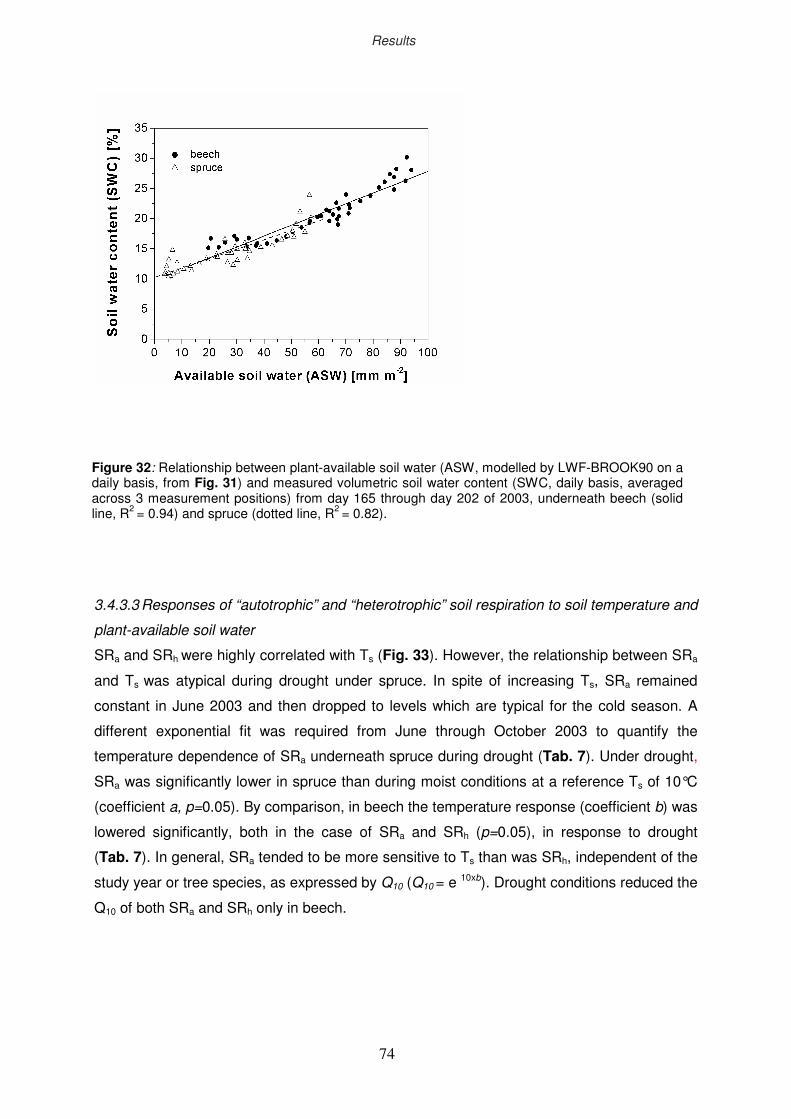
lxxx
3.4.3.3 Responses of “autotrophic” and “heterotrophic” soil respiration to soil temperature and
plant-available soil water
SRa and SRh were highly correlated with Ts (Fig. 33). However, the relationship between SRa
and Ts was atypical during drought under spruce. In spite of increasing Ts, SRa remained
constant in June 2003 and then dropped to levels which are typical for the cold season. A
different exponential fit was required from June through October 2003 to quantify the
temperature dependence of SRa underneath spruce during drought (Tab. 7). Under drought,
SRa was significantly lower in spruce than during moist conditions at a reference Ts of 10°C
(coefficient a, p=0.05). By comparison, in beech the temperature response (coefficient b) was
lowered significantly, both in the case of SRa and SRh (p=0.05), in response to drought
(Tab. 7). In general, SRa tended to be more sensitive to Ts than was SRh, independent of the
study year or tree species, as expressed by Q10 (Q10 = e 10xb). Drought conditions reduced the
Q10 of both SRa and SRh only in beech.
Figure 32: Relationship between plant-available soil water (ASW, modelled by LWF-BROOK90 on a daily basis, from Fig. 31) and measured volumetric soil water content (SWC, daily basis, averaged across 3 measurement positions) from day 165 through day 202 of 2003, underneath beech (solid line, R2 = 0.94) and spruce (dotted line, R2 = 0.82).
Results
74
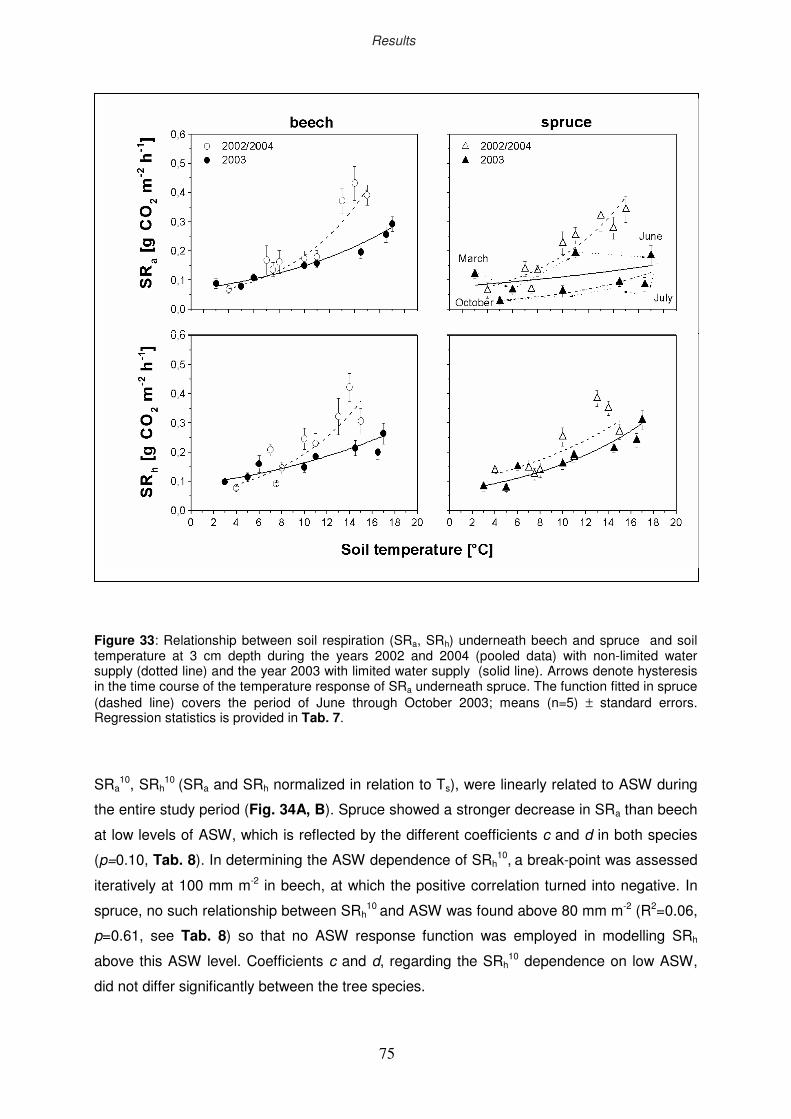
lxxxi
Figure 33: Relationship between soil respiration (SRa, SRh) underneath beech and spruce and soil temperature at 3 cm depth during the years 2002 and 2004 (pooled data) with non-limited water supply (dotted line) and the year 2003 with limited water supply (solid line). Arrows denote hysteresis in the time course of the temperature response of SRa underneath spruce. The function fitted in spruce (dashed line) covers the period of June through October 2003; means (n=5) ± standard errors. Regression statistics is provided in Tab. 7.
SRa10, SRh
10 (SRa and SRh normalized in relation to Ts), were linearly related to ASW during
the entire study period (Fig. 34A, B). Spruce showed a stronger decrease in SRa than beech
at low levels of ASW, which is reflected by the different coefficients c and d in both species
(p=0.10, Tab. 8). In determining the ASW dependence of SRh10, a break-point was assessed
iteratively at 100 mm m-2 in beech, at which the positive correlation turned into negative. In
spruce, no such relationship between SRh10 and ASW was found above 80 mm m-2 (R2=0.06,
p=0.61, see Tab. 8) so that no ASW response function was employed in modelling SRh
above this ASW level. Coefficients c and d, regarding the SRh10 dependence on low ASW,
did not differ significantly between the tree species.
Results
75
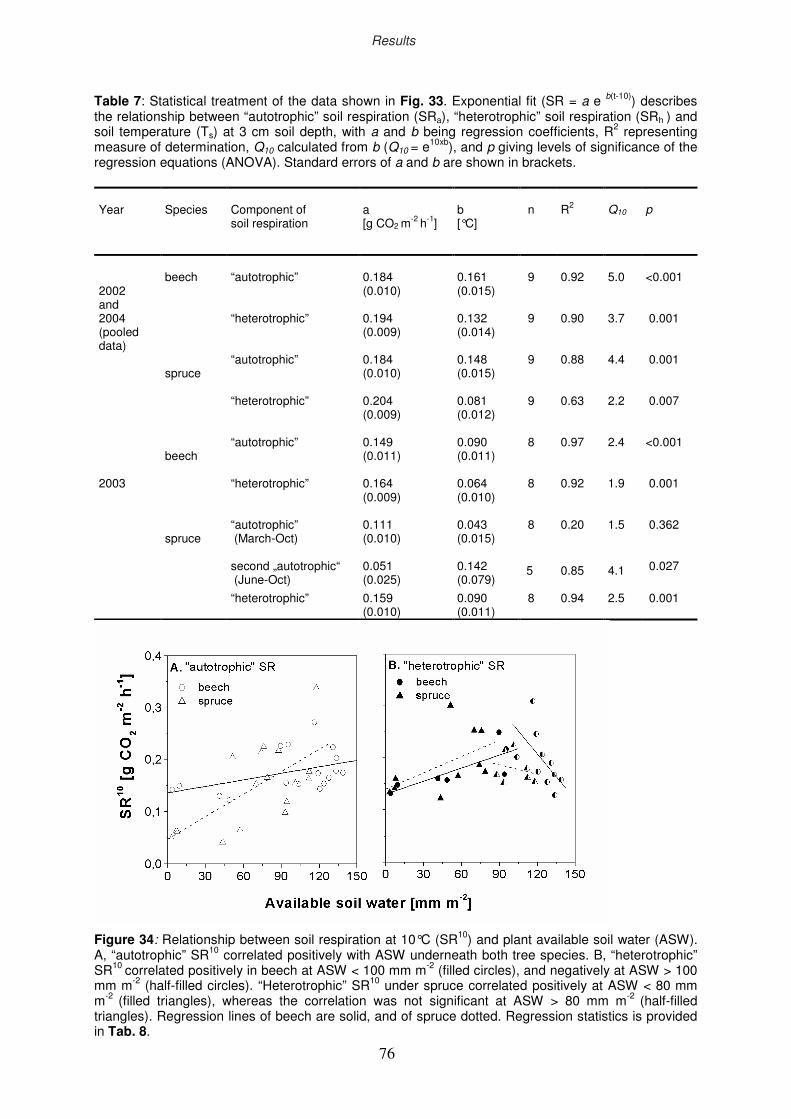
lxxxii
Table 7: Statistical treatment of the data shown in Fig. 33. Exponential fit (SR = a e b(t-10)) describes the relationship between “autotrophic” soil respiration (SRa), “heterotrophic” soil respiration (SRh ) and soil temperature (Ts) at 3 cm soil depth, with a and b being regression coefficients, R2 representing measure of determination, Q10 calculated from b (Q10 = e10xb), and p giving levels of significance of the regression equations (ANOVA). Standard errors of a and b are shown in brackets. Year
Species
Component of soil respiration
a [g CO2 m
-2 h-1]
b [°C]
n
R2
Q10
p
“autotrophic”
0.184 (0.010)
0.161 (0.015)
9
0.92
5.0
<0.001
beech
“heterotrophic”
0.194 (0.009)
0.132 (0.014)
9 0.90
3.7 0.001
“autotrophic”
0.184 (0.010)
0.148 (0.015)
9 0.88
4.4 0.001
2002 and 2004 (pooled data)
spruce
“heterotrophic”
0.204 (0.009)
0.081 (0.012)
9 0.63
2.2 0.007
“autotrophic”
0.149 (0.011)
0.090 (0.011)
8 0.97
2.4 <0.001 beech
“heterotrophic”
0.164 (0.009)
0.064 (0.010)
8 0.92
1.9 0.001
“autotrophic” (March-Oct) second „autotrophic“ (June-Oct)
0.111 (0.010) 0.051 (0.025)
0.043 (0.015) 0.142 (0.079)
8 5
0.20 0.85
1.5 4.1
0.362 0.027
2003
spruce
“heterotrophic”
0.159 (0.010)
0.090 (0.011)
8 0.94
2.5 0.001
Figure 34: Relationship between soil respiration at 10°C (SR10) and plant available soil water (ASW). A, “autotrophic” SR10 correlated positively with ASW underneath both tree species. B, “heterotrophic” SR10 correlated positively in beech at ASW < 100 mm m-2 (filled circles), and negatively at ASW > 100 mm m-2 (half-filled circles). “Heterotrophic” SR10 under spruce correlated positively at ASW < 80 mm m-2 (filled triangles), whereas the correlation was not significant at ASW > 80 mm m-2 (half-filled triangles). Regression lines of beech are solid, and of spruce dotted. Regression statistics is provided in Tab. 8.
Results
76
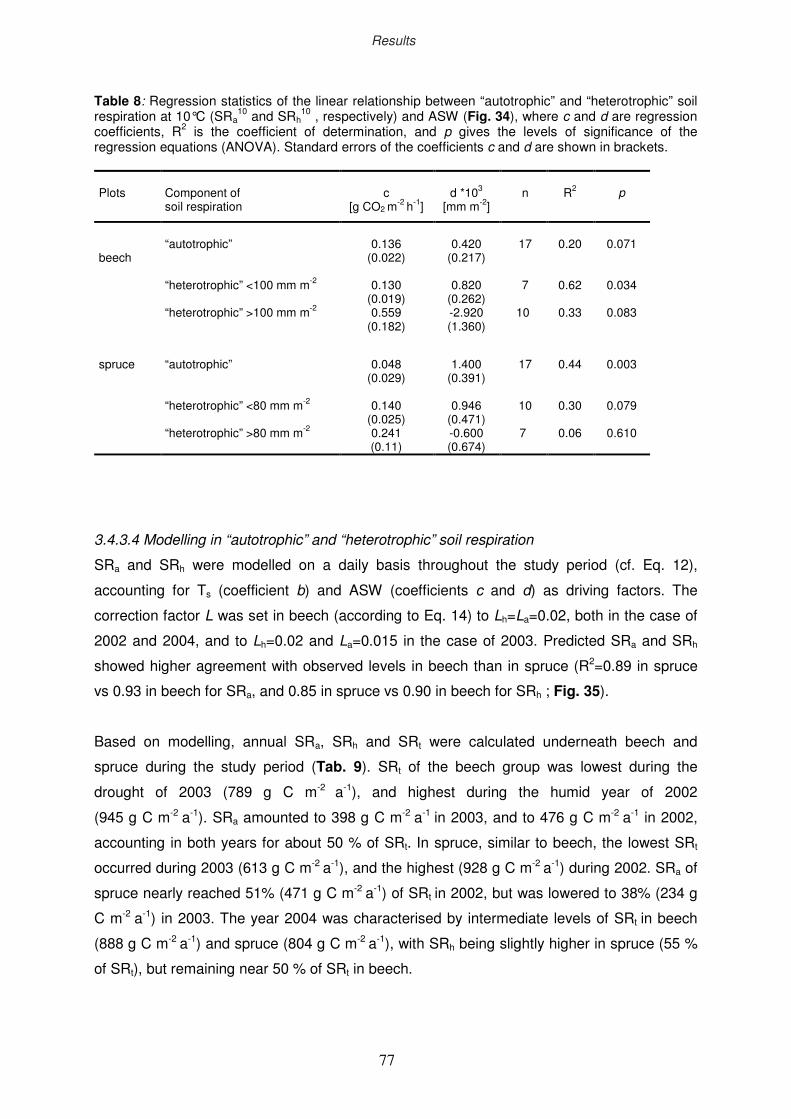
lxxxiii
Table 8: Regression statistics of the linear relationship between “autotrophic” and “heterotrophic” soil respiration at 10°C (SRa
10 and SRh10 , respectively) and ASW (Fig. 34), where c and d are regression
coefficients, R2 is the coefficient of determination, and p gives the levels of significance of the regression equations (ANOVA). Standard errors of the coefficients c and d are shown in brackets.
Plots
Component of soil respiration
c
[g CO2 m-2 h-1]
d *103
[mm m-2]
n
R2
p
“autotrophic”
0.136
(0.022)
0.420
(0.217)
17
0.20
0.071
beech
“heterotrophic” <100 mm m-2 “heterotrophic” >100 mm m-2
0.130 (0.019) 0.559
(0.182)
0.820 (0.262) -2.920 (1.360)
7
10
0.62
0.33
0.034
0.083
“autotrophic”
0.048
(0.029)
1.400
(0.391)
17
0.44
0.003
spruce
“heterotrophic” <80 mm m-2 “heterotrophic” >80 mm m-2
0.140 (0.025) 0.241 (0.11)
0.946 (0.471) -0.600 (0.674)
10
7
0.30
0.06
0.079
0.610
3.4.3.4 Modelling in “autotrophic” and “heterotrophic” soil respiration
SRa and SRh were modelled on a daily basis throughout the study period (cf. Eq. 12),
accounting for Ts (coefficient b) and ASW (coefficients c and d) as driving factors. The
correction factor L was set in beech (according to Eq. 14) to Lh=La=0.02, both in the case of
2002 and 2004, and to Lh=0.02 and La=0.015 in the case of 2003. Predicted SRa and SRh
showed higher agreement with observed levels in beech than in spruce (R2=0.89 in spruce
vs 0.93 in beech for SRa, and 0.85 in spruce vs 0.90 in beech for SRh ; Fig. 35).
Based on modelling, annual SRa, SRh and SRt were calculated underneath beech and
spruce during the study period (Tab. 9). SRt of the beech group was lowest during the
drought of 2003 (789 g C m-2 a-1), and highest during the humid year of 2002
(945 g C m-2 a-1). SRa amounted to 398 g C m-2 a-1 in 2003, and to 476 g C m-2 a-1 in 2002,
accounting in both years for about 50 % of SRt. In spruce, similar to beech, the lowest SRt
occurred during 2003 (613 g C m-2 a-1), and the highest (928 g C m-2 a-1) during 2002. SRa of
spruce nearly reached 51% (471 g C m-2 a-1) of SRt in 2002, but was lowered to 38% (234 g
C m-2 a-1) in 2003. The year 2004 was characterised by intermediate levels of SRt in beech
(888 g C m-2 a-1) and spruce (804 g C m-2 a-1), with SRh being slightly higher in spruce (55 %
of SRt), but remaining near 50 % of SRt in beech.
Results
77
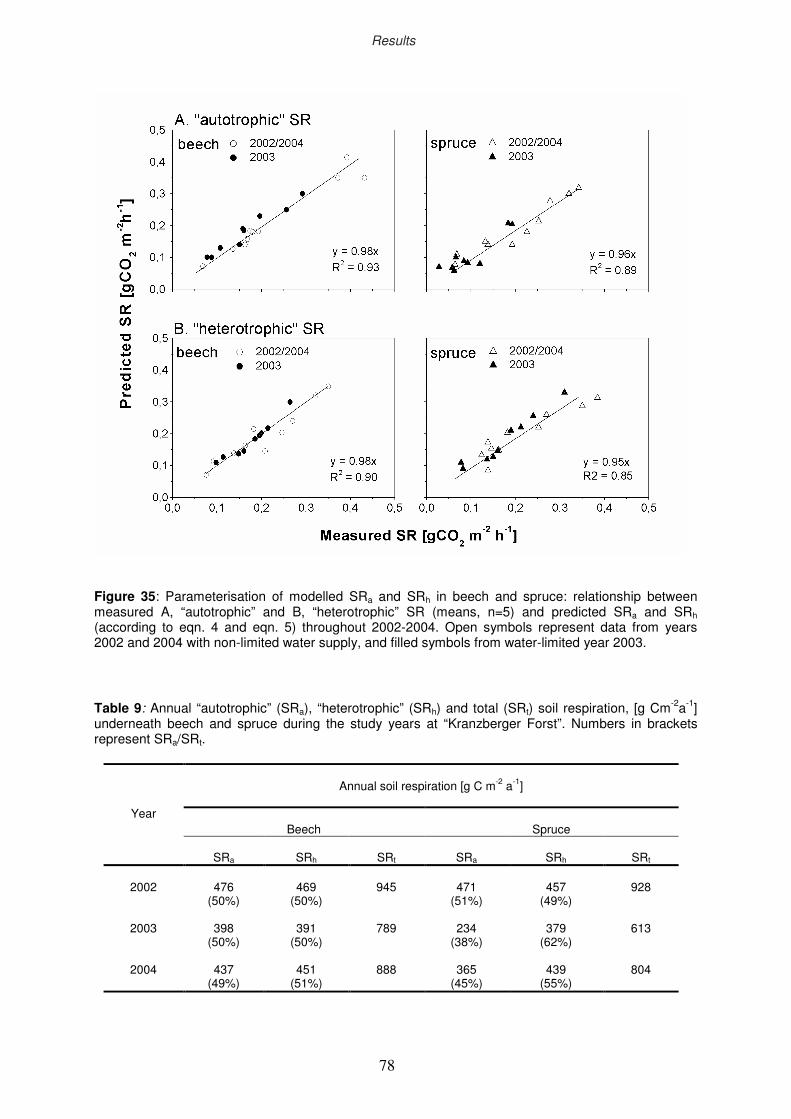
lxxxiv
Figure 35: Parameterisation of modelled SRa and SRh in beech and spruce: relationship between measured A, “autotrophic” and B, “heterotrophic” SR (means, n=5) and predicted SRa and SRh (according to eqn. 4 and eqn. 5) throughout 2002-2004. Open symbols represent data from years 2002 and 2004 with non-limited water supply, and filled symbols from water-limited year 2003.
Table 9: Annual “autotrophic” (SRa), “heterotrophic” (SRh) and total (SRt) soil respiration, [g Cm-2a-1] underneath beech and spruce during the study years at “Kranzberger Forst”. Numbers in brackets represent SRa/SRt.
Annual soil respiration [g C m-2 a-1]
Beech
Spruce
Year
SRa
SRh
SRt
SRa
SRh
SRt
2002
476
(50%)
469
(50%)
945
471
(51%)
457
(49%)
928
2003
398
(50%)
391
(50%)
789
234
(38%)
379
(62%)
613
2004
437
(49%)
451
(51%)
888
365
(45%)
439
(55%)
804
Results
78
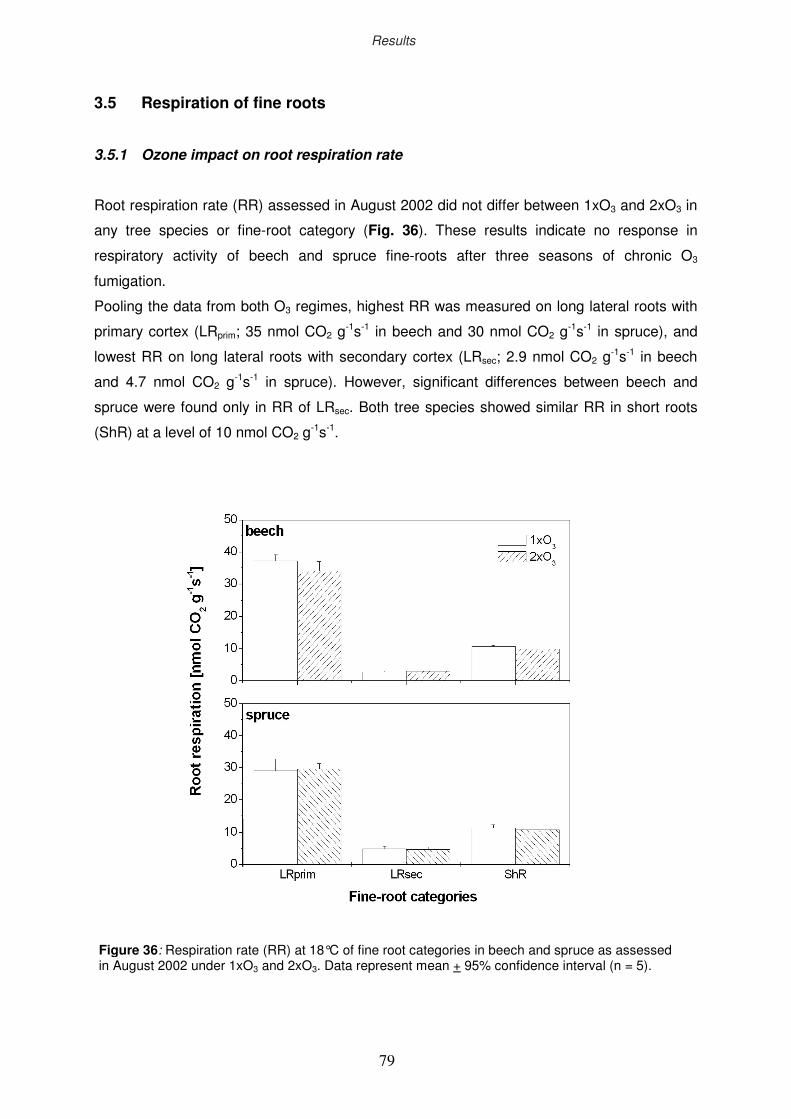
lxxxv
3.5 Respiration of fine roots
3.5.1 Ozone impact on root respiration rate
Root respiration rate (RR) assessed in August 2002 did not differ between 1xO3 and 2xO3 in
any tree species or fine-root category (Fig. 36). These results indicate no response in
respiratory activity of beech and spruce fine-roots after three seasons of chronic O3
fumigation.
Pooling the data from both O3 regimes, highest RR was measured on long lateral roots with
primary cortex (LRprim; 35 nmol CO2 g-1s-1 in beech and 30 nmol CO2 g
-1s-1 in spruce), and
lowest RR on long lateral roots with secondary cortex (LRsec; 2.9 nmol CO2 g-1s-1 in beech
and 4.7 nmol CO2 g-1s-1 in spruce). However, significant differences between beech and
spruce were found only in RR of LRsec. Both tree species showed similar RR in short roots
(ShR) at a level of 10 nmol CO2 g-1s-1.
Figure 36: Respiration rate (RR) at 18°C of fine root categories in beech and spruce as assessed in August 2002 under 1xO3 and 2xO3. Data represent mean + 95% confidence interval (n = 5).
Results
79
lxxxvi
3.5.2 Seasonal dynamics in temperature sensitivity of RR
In beech, the highest respiration rates and sensitivity to temperature were assessed during
2003 in LRprim (Fig. 37A & Tab. 10A): RR at 10°C (RR10) ranged between
9.46 nmol CO2 g-1 s-1 in October and 17.06 nmol CO2 g
-1 s-1 in April, while Q10 ranged between
1.2 and 2.2 in September and June, respectively. Within the three fine-root categories, LRsec
displayed the lowest RR10 (from 2.4 nmol CO2 g-1 s-1 in October to 4.14 nmol CO2 g
-1 s-1 in
April) and the lowest temperature sensitivity: Q10 ranged between 1.05 (in the dry
September) and 1.24 (in October, when SWC recovered to 20%, see Fig. 21). Both LRprim
and LRsec show high respiratory activity in June (after completion of leaf flush completed) and
towards the end of October (after leaf shedding). Short roots (ShR) in beech showed medial
levels of RR10 and Q10 throughout the study period when compared to both long root
categories (LRprim and LRsec).
During water limitation in August and September, RR10 of LRsec and ShR was reduced by
near 50% compared to April and June, whereas RR10 of LRprim remained on comparable level
(Tab. 10A). Q10 of LRsec and ShR showed a strong decrease during both dry months
declining to 1.05 in September, than increased after rain events in October.
In spruce, contrary to beech, highest RR10 and highest sensitivity to temperature were found
in ShR (Fig. 37B & Tab. 10B). Except for August, Q10 of this latter fine-root category ranged
between 1.2 during drought in August and 1.8 in October when SWC recovered to 20%. RR10
in ShR was between 2.95 nmol CO2 g-1 s-1 (August) and 8.15 nmol CO2 g
-1 s-1 (April). Spruce
long lateral roots with secondary periderm (LRsec) displayed, similarly to beech LRsec, less C
release: RR10 ranged between 2.64 and 3.7 nmol CO2 g-1 s-1; Q10 here was between 1.0 and
1.37 (Tab. 10B). Compared to beech, LRprim in spruce had 2 to 3 times lower RR10 and lower
seasonal dynamics of Q10, an indication of lower energy costs relative to beech for root
length increment during the study period of 2003. In general, spruce displayed lower
seasonal dynamics of Q10 than beech, but also lower variation in RR10 between fine root
categories (Tab. 10).
Results
80
lxxxvii
Figure 37: Temperature response of respiration (RR, according to Eq. 4) in, A, beech and B, spruce fine roots. Lines represent the response curve of LRprim (solid thin line), LRsec (solid bold line) and ShR (dashed line). Data shown as means ± standard errors (n = 4 to 6). Regression statistics is provided in Tab. 10.
Results
81
lxxxviii
A. beech
Sampling date
Fine-root category
Intercept, ρ [nmol CO2g
-1s-1]
Slope, θ [°C]
Q10
R2
RR10
[nmol CO2g-1s-1]
April 24 (day 114)
LRprim LRsec ShR
12.66 3.51 5.58
0.029 0.047 0.017
1.35 1.18 1.60
0.83 0.96 0.99
17.06 4.14 8.90
June 27 (day 178)
LRprim LRsec ShR
5.53 3.33 3.79
0.079 0.018 0.075
2.20 1.20 2.12
0.99 0.97 0.99
12.16 4.04 8.02
August 22 (day 234)
LRprim LRsec ShR
8.06 2.54 3.90
0.035 0.009 0.015
1.41 1.09 1.16
0.85 0.25 0.60
11.38 2.77 4.50
September 18 (day 261)
LRprim LRsec ShR
12.88 2.65 5.78
0.018 0.004 0.004
1.20 1.05 1.05
0.92 0.38 0.78
15.36 2.75 5.99
October 30 (day 303)
LRprim LRsec ShR
5.11 1.94 5.55
0.062 0.022 0.031
1.85 1.24 1.37
0.99 0.93 0.95
9.46 2.40 7.59
B. spruce
Sampling date
Fine-root category
Intercept, ρ [nmol CO2g
-1s-1]
Slope, θ [°C]
Q10
R2
RR10
[nmol CO2g-1s-1]
April15 (day 105)
LRprim LRsec ShR
4.18 3.28 5.75
0.035 0.007 0.035
1.42 1.10 1.42
0.99 0.43 0.94
5.93 3.52 8.15
June 26 (day 177)
LRprim LRsec ShR
6.79 2.61 4.90
0.010 0.029 0.039
1.11 1.37 1.47
0.68 0.99 0.99
7.53 3.49 7.19
August 21 (day 233)
LRprim LRsec ShR
1.52 2.03 2.43
0.041 0.026 0.019
1.50 1.30 1.20
0.88 0.82 0.61
2.28 2.64 2.95
September 17 (day 260)
LRprim LRsec ShR
4.18 2.62 3.66
0.023 0.035 0.027
1.26 1.41 1.30
0.67 0.97 0.82
5.25 3.70 4.77
October 28 (day 301)
LRprim LRsec ShR
2.85 2.62 2.47
0.04 0.027 0.058
1.40 1.30 1.80
0.99 0.89 0.96
4.00 3.44 4.41
Table 10: Statistical treatment of the data shown in Fig. 37, A, beech and B, spruce. Exponential fit (RR = ρeθT) describes the relationship between root respiration (RR) and temperature, with ρ and θ being regression coefficients, Q10 calculated from θ (Q10 = e10xθ), R2 representing measure of determination, and RR10 giving RR data at a standard temperature of 10°C.
Results
82
lxxxix
3.5.3 Respiration rate of individual fine rootlets (RRI) in beech and spruce
The respiration rate of individual beech and spruce fine rootlets (RRI) was assessed
according to Eq. 6 (section 2.18.2). Both RRT(0)I (i.e. RRI at mean daily soil temperature Ts(0)
monitored at 0 cm soil depth) and RR10I (i.e. RRI at a standard temperature of 10°C) were
significantly higher in beech than in spruce during the whole study period of 2003 (Fig. 38).
In August of 2003, RRT(0)I decreased significantly underneath trees of both species relative to
June at higher Ts(0), as a consequence of advanced summer drought. In beech, RR10I
showed no significant differences between the harvests except for April of 2003 when the
seasonal maximum of 9.9 nmol CO2g-1s-1 was assessed. In spruce, only in August of 2003,
RR10I decreased significantly (2.75 nmol CO2g
-1s-1) compared to the other samplings, and
represented the seasonal minimum in RR10I during the study year.
During September of 2004, RR10I in beech was 8.9+0.9 nmol CO2 g-1s-1 and in spruce
7.1+0.6 nmol CO2 g-1s-1. In both species, levels were higher as compared to RR10
I when
assessed during September of 2003 (7.1+1.5 and 4.3+0.1 nmol CO2 g-1s-1 for beech and
spruce, respectively; Fig. 38). However, only the difference in spruce was significant. The
species-specific respiration rate in beech (RRbeech) was found to amount to 8.14+0.89 nmol
CO2 g-1s-1 while the species-specific respiration rate in spruce (RRspruce) was 5.74+0.64 nmol
CO2 g-1s-1 (calculation according to section 2.18.2; data as means + standard errors). RRbeech
and RRspruce served to define the “running costs” (e.g. the efficiency ratio of competitiveness)
of beech and spruce fine-roots.
Figure 38: Respiration rates (RRI) calculated for individual beech and spruce fine rootlets. The upper graph represents respiration rates RRT(0)
I at mean daily soil temperature Ts(0) (monitored at 0 cm soil depth); the lower graph shows respiration rates RR10
I at a standard
temperature of 10°C. Data as means + 95% confidence interval (n=5-10).
Results
83
xc
3.6 Morphological parameters of fine roots
3.6.1 Seasonal dynamics of the specific fine-root area
In beech, the lowest specific fine-root area (SRA, cm2g-1) was found in long lateral roots with
secondary xylem (LRsec; ranging between 58 cm2 g-1 in August 2003 and 105 cm2 g-1 in
November 2002), relative to long lateral roots with primary xylem (LRprim) and short roots
(ShR). SRA of both latter fine-root categories was similar and 5 to 8 times higher than that of
LRsec (Fig. 39). In general, SRA tended to be lowered in all fine-root categories during the
drought period of 2003; however, only SRA of ShR assessed in October of 2003 was
significantly different compared to the level in October 2002 (p<0.05).
In spruce, the lowest SRA was found in the LRsec (SRA ranging between 78 cm2 g-1 and 140
cm2 g-1; Fig. 39). SRA ranges of LRprim and ShR were 140 cm2 g-1 to 222 cm2 g-1 and
263 cm2 g-1 to 405 cm2 g-1, respectively, which showed a strong morphological differentiation
of these both categories. Under the drought of 2003, spruce tended to reduce SRA in all fine-
root categories, although significant differences existed only in ShR between August 2003
and August 2002. Only SRA of ShR lay on a similar level in both tree species. SRA of LRprim
and ShR in beech were two to three times higher compared to SRA of the corresponding
fine-root categories in spruce.
Figure 39: Seasonal dynamics in specific fine root area (SRA) of the three fine-root categories of beech and spruce as assessed during 2002 and 2003: long lateral roots with primary xylem (LR prim; open symbols), long lateral roots with secondary xylem (LR sec; filled symbols) and short roots (ShR; half-filled symbols). Arrows show significant differences in SRA at p<0.05. Data represent mean + 95% confidence interval (n = 5 to 7).
Results
84
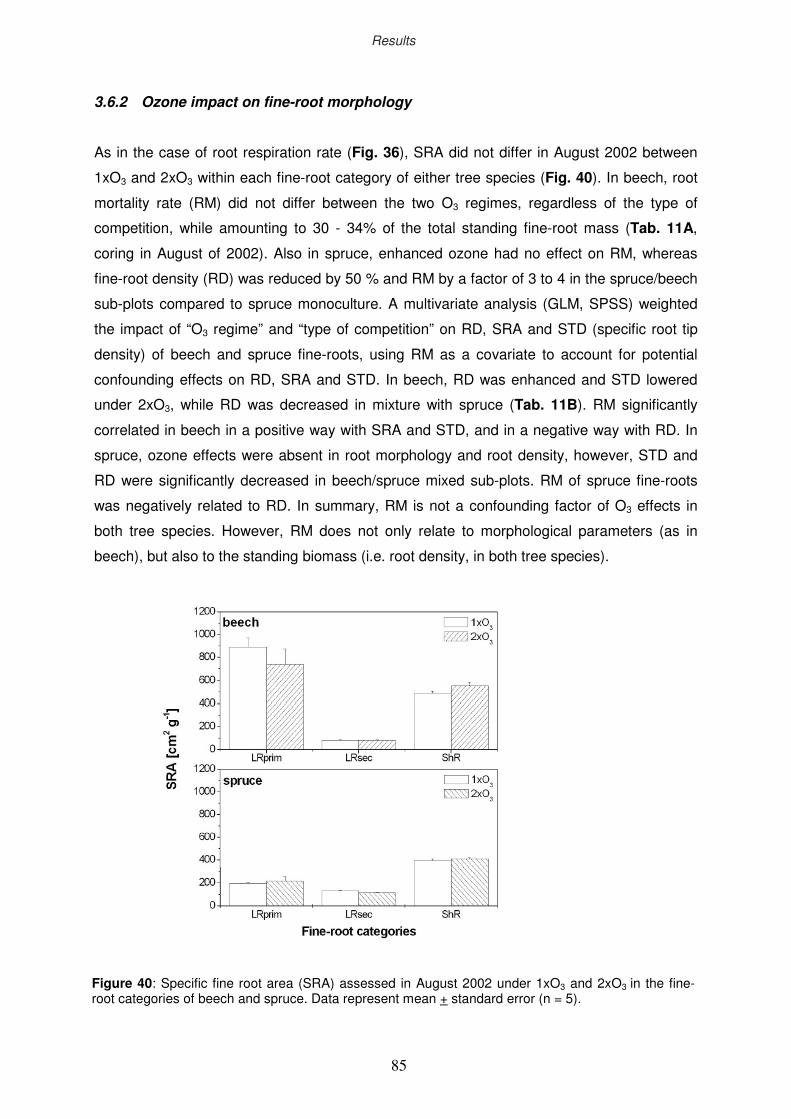
xci
3.6.2 Ozone impact on fine-root morphology
As in the case of root respiration rate (Fig. 36), SRA did not differ in August 2002 between
1xO3 and 2xO3 within each fine-root category of either tree species (Fig. 40). In beech, root
mortality rate (RM) did not differ between the two O3 regimes, regardless of the type of
competition, while amounting to 30 - 34% of the total standing fine-root mass (Tab. 11A,
coring in August of 2002). Also in spruce, enhanced ozone had no effect on RM, whereas
fine-root density (RD) was reduced by 50 % and RM by a factor of 3 to 4 in the spruce/beech
sub-plots compared to spruce monoculture. A multivariate analysis (GLM, SPSS) weighted
the impact of “O3 regime” and “type of competition” on RD, SRA and STD (specific root tip
density) of beech and spruce fine-roots, using RM as a covariate to account for potential
confounding effects on RD, SRA and STD. In beech, RD was enhanced and STD lowered
under 2xO3, while RD was decreased in mixture with spruce (Tab. 11B). RM significantly
correlated in beech in a positive way with SRA and STD, and in a negative way with RD. In
spruce, ozone effects were absent in root morphology and root density, however, STD and
RD were significantly decreased in beech/spruce mixed sub-plots. RM of spruce fine-roots
was negatively related to RD. In summary, RM is not a confounding factor of O3 effects in
both tree species. However, RM does not only relate to morphological parameters (as in
beech), but also to the standing biomass (i.e. root density, in both tree species).
Figure 40: Specific fine root area (SRA) assessed in August 2002 under 1xO3 and 2xO3 in the fine-root categories of beech and spruce. Data represent mean + standard error (n = 5).
Results
85
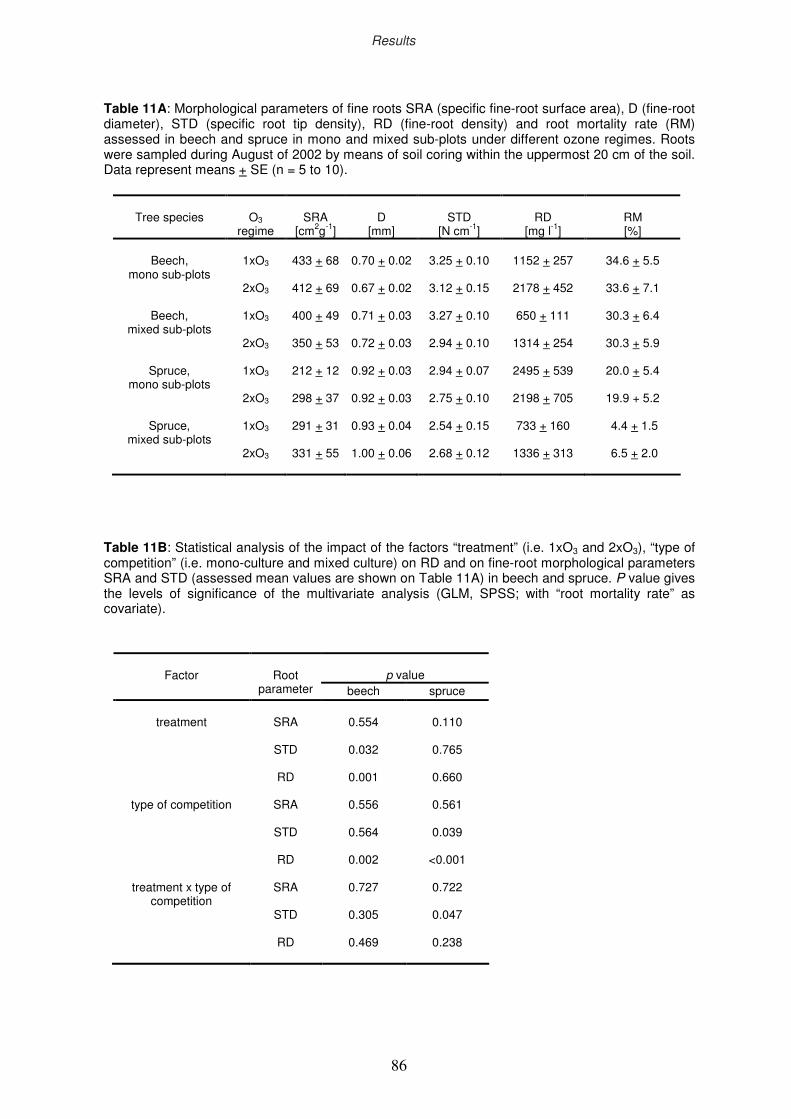
xcii
Tree species
O3
regime
SRA
[cm2g-1]
D
[mm]
STD
[N cm-1]
RD
[mg l-1]
RM [%]
Beech,
mono sub-plots
1xO3
433 + 68
0.70 + 0.02
3.25 + 0.10
1152 + 257
34.6 + 5.5
2xO3 412 + 69
0.67 + 0.02 3.12 + 0.15 2178 + 452 33.6 + 7.1
Beech, mixed sub-plots
1xO3 400 + 49 0.71 + 0.03 3.27 + 0.10 650 + 111 30.3 + 6.4
2xO3 350 + 53 0.72 + 0.03 2.94 + 0.10
1314 + 254 30.3 + 5.9
Spruce, mono sub-plots
1xO3 212 + 12 0.92 + 0.03 2.94 + 0.07 2495 + 539 20.0 + 5.4
2xO3 298 + 37 0.92 + 0.03 2.75 + 0.10
2198 + 705 19.9 + 5.2
Spruce, mixed sub-plots
1xO3 291 + 31 0.93 + 0.04 2.54 + 0.15 733 + 160 4.4 + 1.5
2xO3 331 + 55 1.00 + 0.06 2.68 + 0.12
1336 + 313 6.5 + 2.0
p value
Factor
Root
parameter beech spruce
treatment
SRA
STD
RD
0.554
0.032
0.001
0.110
0.765
0.660
type of competition
treatment x type of competition
SRA
STD
RD
SRA
STD
RD
0.556
0.564
0.002
0.727
0.305
0.469
0.561
0.039
<0.001
0.722
0.047
0.238
Table 11A: Morphological parameters of fine roots SRA (specific fine-root surface area), D (fine-root diameter), STD (specific root tip density), RD (fine-root density) and root mortality rate (RM) assessed in beech and spruce in mono and mixed sub-plots under different ozone regimes. Roots were sampled during August of 2002 by means of soil coring within the uppermost 20 cm of the soil. Data represent means + SE (n = 5 to 10).
Table 11B: Statistical analysis of the impact of the factors “treatment” (i.e. 1xO3 and 2xO3), “type of competition” (i.e. mono-culture and mixed culture) on RD and on fine-root morphological parameters SRA and STD (assessed mean values are shown on Table 11A) in beech and spruce. P value gives the levels of significance of the multivariate analysis (GLM, SPSS; with “root mortality rate” as covariate).
Results
86
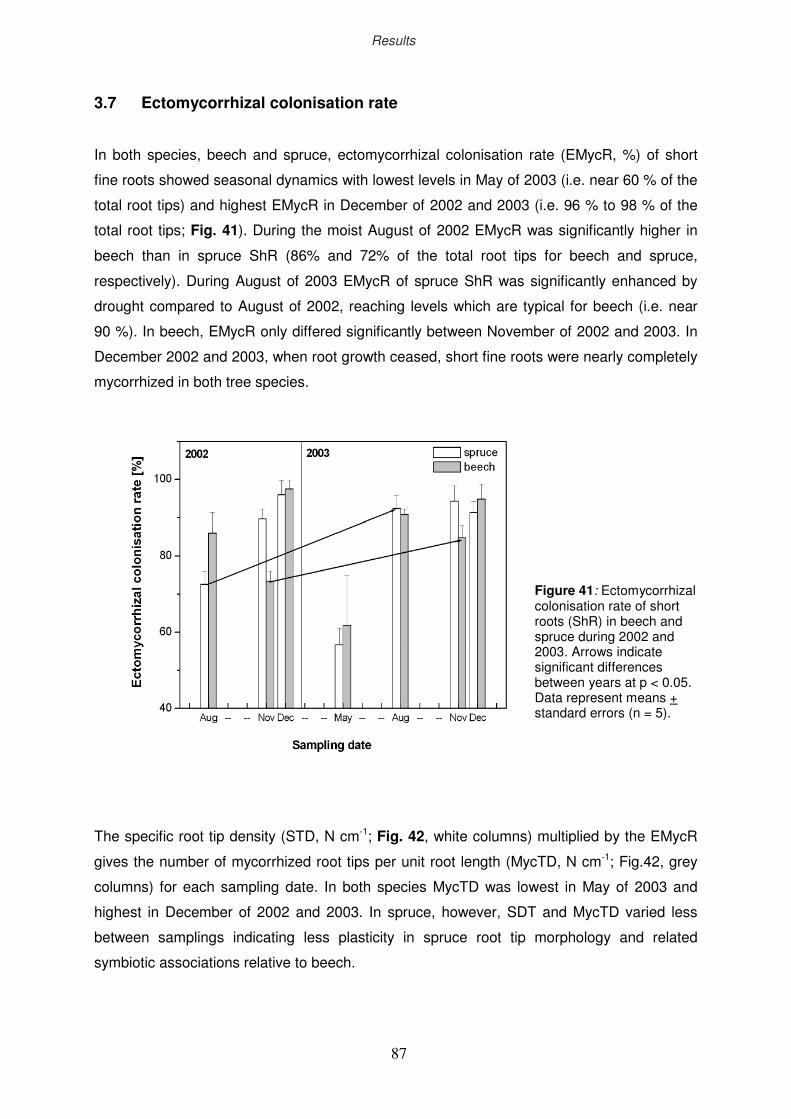
xciii
3.7 Ectomycorrhizal colonisation rate
In both species, beech and spruce, ectomycorrhizal colonisation rate (EMycR, %) of short
fine roots showed seasonal dynamics with lowest levels in May of 2003 (i.e. near 60 % of the
total root tips) and highest EMycR in December of 2002 and 2003 (i.e. 96 % to 98 % of the
total root tips; Fig. 41). During the moist August of 2002 EMycR was significantly higher in
beech than in spruce ShR (86% and 72% of the total root tips for beech and spruce,
respectively). During August of 2003 EMycR of spruce ShR was significantly enhanced by
drought compared to August of 2002, reaching levels which are typical for beech (i.e. near
90 %). In beech, EMycR only differed significantly between November of 2002 and 2003. In
December 2002 and 2003, when root growth ceased, short fine roots were nearly completely
mycorrhized in both tree species.
The specific root tip density (STD, N cm-1; Fig. 42, white columns) multiplied by the EMycR
gives the number of mycorrhized root tips per unit root length (MycTD, N cm-1; Fig.42, grey
columns) for each sampling date. In both species MycTD was lowest in May of 2003 and
highest in December of 2002 and 2003. In spruce, however, SDT and MycTD varied less
between samplings indicating less plasticity in spruce root tip morphology and related
symbiotic associations relative to beech.
Figure 41: Ectomycorrhizal colonisation rate of short roots (ShR) in beech and spruce during 2002 and 2003. Arrows indicate significant differences between years at p < 0.05. Data represent means + standard errors (n = 5).
Results
87
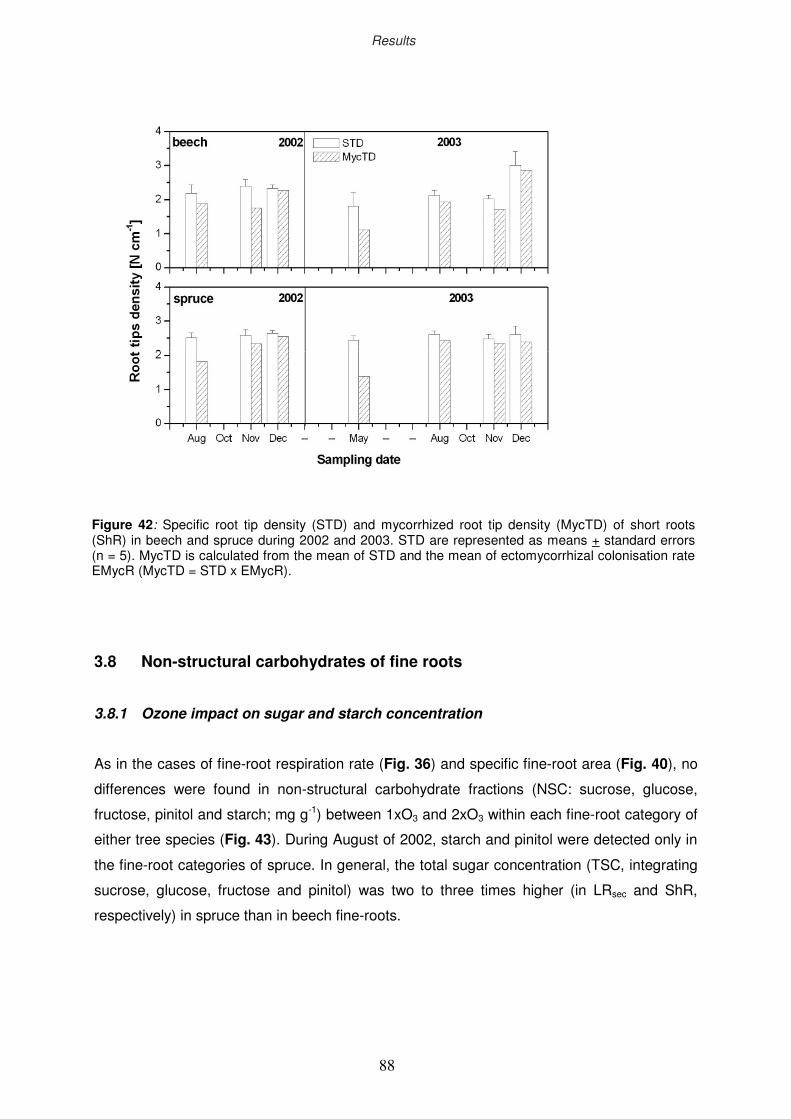
xciv
3.8 Non-structural carbohydrates of fine roots
3.8.1 Ozone impact on sugar and starch concentration
As in the cases of fine-root respiration rate (Fig. 36) and specific fine-root area (Fig. 40), no
differences were found in non-structural carbohydrate fractions (NSC: sucrose, glucose,
fructose, pinitol and starch; mg g-1) between 1xO3 and 2xO3 within each fine-root category of
either tree species (Fig. 43). During August of 2002, starch and pinitol were detected only in
the fine-root categories of spruce. In general, the total sugar concentration (TSC, integrating
sucrose, glucose, fructose and pinitol) was two to three times higher (in LRsec and ShR,
respectively) in spruce than in beech fine-roots.
Figure 42: Specific root tip density (STD) and mycorrhized root tip density (MycTD) of short roots (ShR) in beech and spruce during 2002 and 2003. STD are represented as means + standard errors (n = 5). MycTD is calculated from the mean of STD and the mean of ectomycorrhizal colonisation rate EMycR (MycTD = STD x EMycR).
Results
88
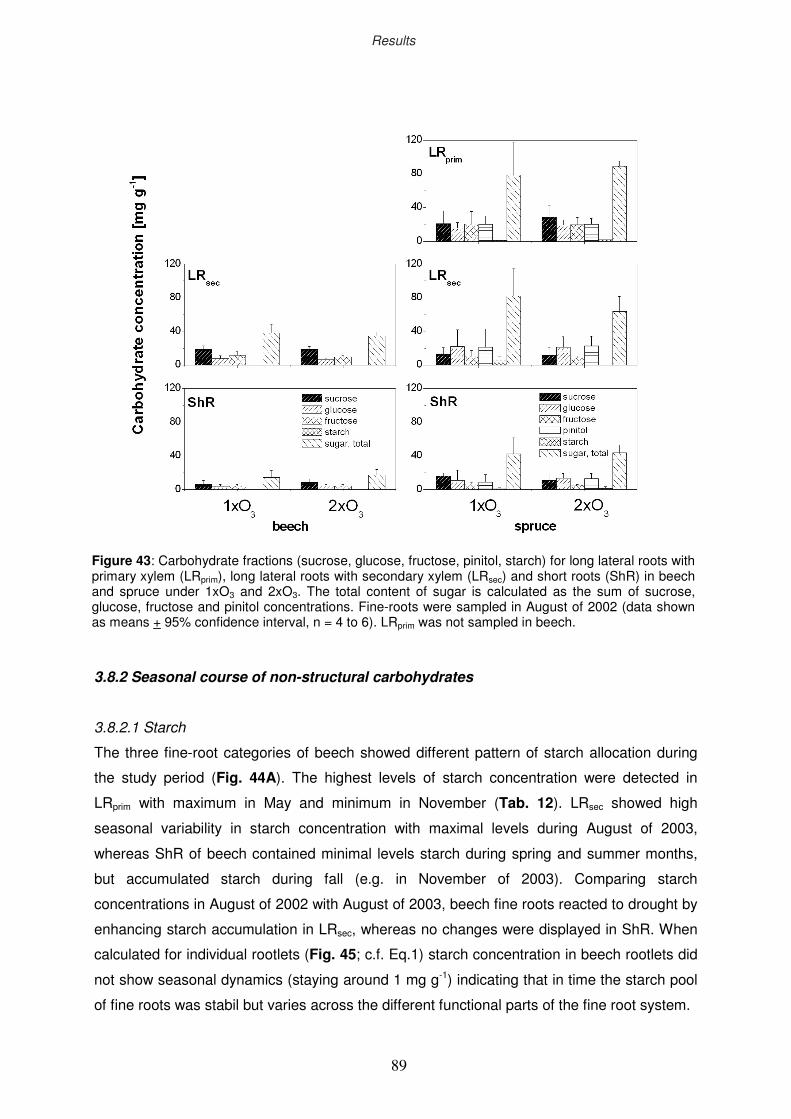
xcv
3.8.2 Seasonal course of non-structural carbohydrates
3.8.2.1 Starch
The three fine-root categories of beech showed different pattern of starch allocation during
the study period (Fig. 44A). The highest levels of starch concentration were detected in
LRprim with maximum in May and minimum in November (Tab. 12). LRsec showed high
seasonal variability in starch concentration with maximal levels during August of 2003,
whereas ShR of beech contained minimal levels starch during spring and summer months,
but accumulated starch during fall (e.g. in November of 2003). Comparing starch
concentrations in August of 2002 with August of 2003, beech fine roots reacted to drought by
enhancing starch accumulation in LRsec, whereas no changes were displayed in ShR. When
calculated for individual rootlets (Fig. 45; c.f. Eq.1) starch concentration in beech rootlets did
not show seasonal dynamics (staying around 1 mg g-1) indicating that in time the starch pool
of fine roots was stabil but varies across the different functional parts of the fine root system.
Figure 43: Carbohydrate fractions (sucrose, glucose, fructose, pinitol, starch) for long lateral roots with primary xylem (LRprim), long lateral roots with secondary xylem (LRsec) and short roots (ShR) in beech and spruce under 1xO3 and 2xO3. The total content of sugar is calculated as the sum of sucrose, glucose, fructose and pinitol concentrations. Fine-roots were sampled in August of 2002 (data shown as means + 95% confidence interval, n = 4 to 6). LRprim was not sampled in beech.
Results
89
xcvi
All fine-root categories of spruce showed during the study period a similar pattern of starch
allocation with maxima in May (Fig. 44 & Tab. 12) which declined during the remainder of the
growing season. Slight increase of starch concentration in LRsec and LRprim was displayed in
November. All fine-root categories of spruce showed a similar drought response, reflecting
lowered starch concentration under the water limitation of August 2003 relative to the moist
conditions of the same month in 2002; however, differences were significant only in the case
of LRprim (p < 0.05). In contrast to beech, starch concentration in spruce rootlets was 8 mg g-1
during late spring but decreased during the growing season to levels which were comparable
to those of beech rootlets.
3.8.2.2 Sugars
During May and July of 2003, LRprim of beech displayed similar total sugar concentration
(TSC integrating sucrose, glucose, fructose, and, in case of spruce, pinitol; Fig. 44 &
Tab. 12) which increased in August of 2003 as a result of enhanced sucrose (p<0.05) and
fructose (n.s.) concentration, and in November of 2003 as a result of enhanced glucose
(p<0.05) concentration. LRsec of beech had the lowest TSC in May (i.e. before leaf flush)
which increased during the remainder of the growing season as a consequence of enhanced
fructose (p<0.05) and glucose (n.s.) concentrations. In the dry August of 2003, the increase
of fructose (p<0.05) and sucrose (n.s.) levels in LRsec resulted in 30% higher TSC compared
to August of 2002. Similarly as found in LRprim, ShR of beech had comparable TSC during
May and July of 2003, however TSC of ShR during these months was two times lower than
TSC of LRprim. During August and November of 2003 total sugar content of ShR was doubled
compared to the levels of May and July as a result of a significantly higher (near three times,
p<0.05) sucrose level in this fine-root category. During the drought of August 2003, TSC of
ShR was more than two times higher than found in August of the previous year, with sucrose
and fructose showing the highest increase in 2003 (four and two times, respectively each;
p<0.05). In summary, sucrose was the largest carbohydrate fraction in all beech fine-root
categories (40 to 65% of TSC), followed by fructose (20 to 35% of TSC) and glucose (10 to
25% of TSC). During August of 2003, enhanced sucrose (in ShR) and fructose levels (in
LRsec) were detected in the fine roots of beech as a response to drought.
When calculated at the individual rootlet level (Fig. 45; cf. Eq.1), TSC of the beech rootlets
was about 30 mg g-1 in May and July, and increased to 45 mg g-1 in August and November.
Hence, the seasonal course of TSC during the study year of 2003 was caused by the
seasonal course of the sucrose fraction.
Results
90
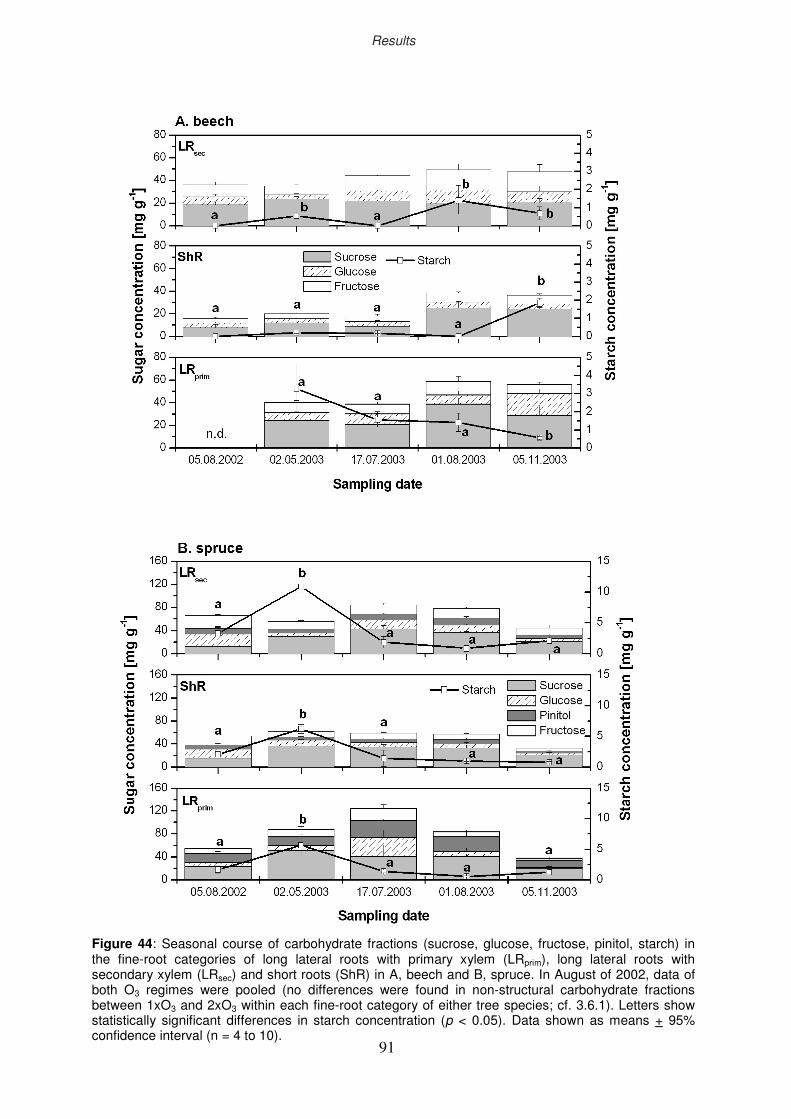
xcvii
Figure 44: Seasonal course of carbohydrate fractions (sucrose, glucose, fructose, pinitol, starch) in the fine-root categories of long lateral roots with primary xylem (LRprim), long lateral roots with secondary xylem (LRsec) and short roots (ShR) in A, beech and B, spruce. In August of 2002, data of both O3 regimes were pooled (no differences were found in non-structural carbohydrate fractions between 1xO3 and 2xO3 within each fine-root category of either tree species; cf. 3.6.1). Letters show statistically significant differences in starch concentration (p < 0.05). Data shown as means + 95% confidence interval (n = 4 to 10).
Results
91
xcviii
Spruce showed a different pattern of the carbohydrate fractions in TSC compared to beech
(Fig. 44 & Tab. 12). LRprim had the highest sucrose concentration during May, which
decreased during the remainder of the growing season and reached a minimum in
November. Sucrose remained the largest fraction of TSC in LRprim of spruce (35 to 55% of
TSC), followed by pinitol contributing between 15% (in May of 2003) and 30-35% to TSC (in
August and November of 2003). Glucose and fructose reached their seasonal maximum in
LRprim during July of 2003 and occurred at minimum levels during November of 2003. When
comparing carbohydrate fractions of LRprim between August of 2002 and 2003, sucrose
(p<0.01) and pinitol (p<0.05) concentrations were twice as high under the drought of 2003.
TSC in LRsec of spruce displayed minimum levels in May and November of 2003. During the
summer months of 2002 and 2003 TSC was enhanced by 30 to 40% compared to May and
November of 2003 as a result of a significant increase of glucose (p<0.05) and of an
increases of other carbohydrates (n.s.). In 2003, changes in sucrose concentration defined
the seasonal dynamics of TSC in ShR of spruce with highest levels, in contrast to beech, in
May, and lowest in November. Similar seasonal dynamics also occurred in the case of the
other TSC fractions. In August of 2002 and 2003, TSC in ShR and LRsec was similar,
although during the drought of 2003 the sucrose fraction in both fine-root categories
increased by a factor of two (p<0.05), whereas glucose and fructose fractions decreased
(n.s.). Pinitol concentration of the resent fine-root categories was not affected by the
contrasting water availability. In summary, sucrose was the largest carbohydrate fraction in
all spruce fine-root categories (35 to 55% of TSC), except for LRsec and ShR as sampled in
August of 2002 when the contribution of sucrose to TSC was comparable with those of
glucose and fructose (i.e. 20 % of TSC). In the LRprim, pinitol was the second largest fraction
in spruce fine roots, contributing 15 to 35% to TSC, whereas across the other fine-root
categories the concentrations of glucose, pinitol and fructose were found to be similar (i.e. 10
to 25% of TSC). In response to drought, spruce enhanced the sucrose level in all fine-root
categories.
Spruce rootlets had two times higher TSC relative to beech at the beginning of the growing
season. During summer, TSC increased in spruce (n.s.) compared to May, and decreased
significantly in November to about 40 mg g-1. As in the case of beech, the seasonal dynamics
of TSC was caused in spruce by the seasonal dynamics of the sucrose fraction which
contributed 60 to 65% to TSC in both tree species. In general, the higher sucrose level and
the existence of a pinitol fraction in the fine-roots of spruce accounted for the higher TSC as
compared to that of the rootlets in beech.
Results
92
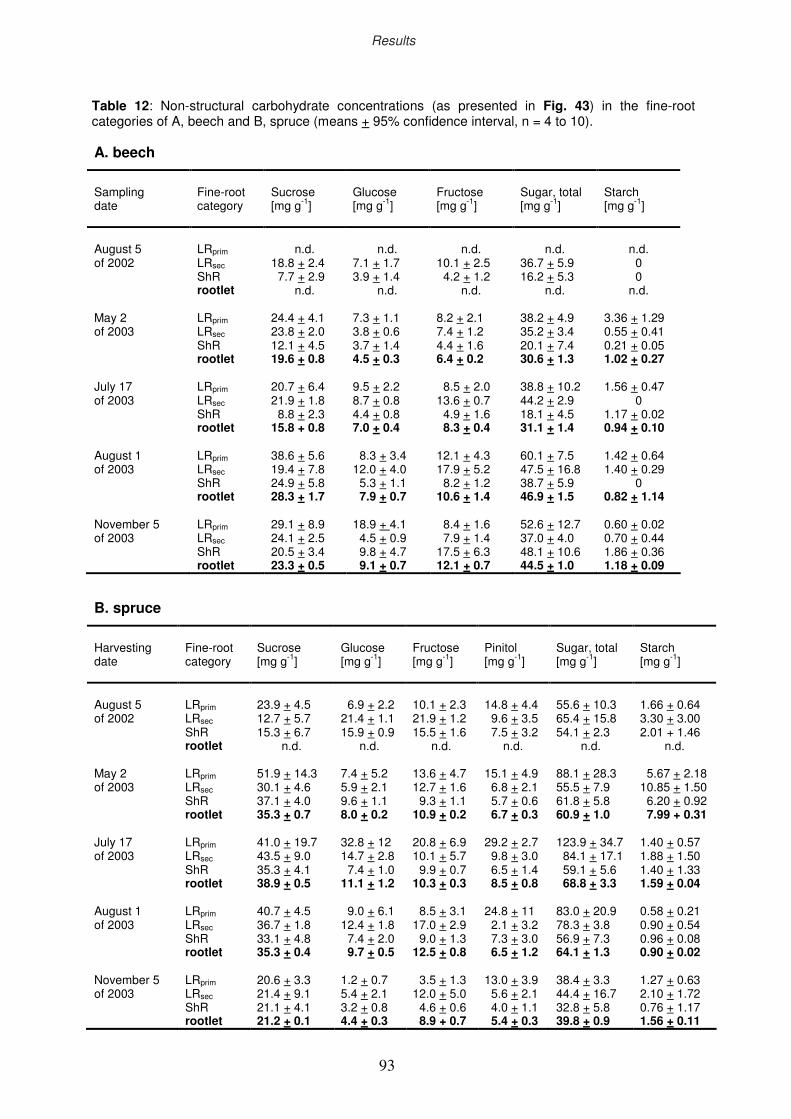
xcix
A. beech
Sampling date
Fine-root category
Sucrose [mg g-1]
Glucose [mg g-1]
Fructose [mg g-1]
Sugar, total [mg g-1]
Starch [mg g-1]
August 5 of 2002
LRprim LRsec ShR rootlet
n.d.
18.8 + 2.4 7.7 + 2.9
n.d.
n.d.
7.1 + 1.7 3.9 + 1.4
n.d.
n.d.
10.1 + 2.5 4.2 + 1.2
n.d.
n.d.
36.7 + 5.9 16.2 + 5.3
n.d.
n.d.
0 0
n.d.
May 2 of 2003
LRprim LRsec ShR rootlet
24.4 + 4.1 23.8 + 2.0 12.1 + 4.5 19.6 + 0.8
7.3 + 1.1 3.8 + 0.6 3.7 + 1.4 4.5 + 0.3
8.2 + 2.1 7.4 + 1.2 4.4 + 1.6 6.4 + 0.2
38.2 + 4.9 35.2 + 3.4 20.1 + 7.4 30.6 + 1.3
3.36 + 1.29 0.55 + 0.41 0.21 + 0.05 1.02 + 0.27
July 17 of 2003
LRprim LRsec ShR rootlet
20.7 + 6.4 21.9 + 1.8 8.8 + 2.3 15.8 + 0.8
9.5 + 2.2 8.7 + 0.8 4.4 + 0.8 7.0 + 0.4
8.5 + 2.0 13.6 + 0.7 4.9 + 1.6 8.3 + 0.4
38.8 + 10.2 44.2 + 2.9 18.1 + 4.5 31.1 + 1.4
1.56 + 0.47 0
1.17 + 0.02 0.94 + 0.10
August 1 of 2003
LRprim LRsec ShR rootlet
38.6 + 5.6 19.4 + 7.8 24.9 + 5.8 28.3 + 1.7
8.3 + 3.4 12.0 + 4.0 5.3 + 1.1 7.9 + 0.7
12.1 + 4.3 17.9 + 5.2 8.2 + 1.2 10.6 + 1.4
60.1 + 7.5 47.5 + 16.8 38.7 + 5.9 46.9 + 1.5
1.42 + 0.64 1.40 + 0.29
0 0.82 + 1.14
November 5 of 2003
LRprim LRsec ShR rootlet
29.1 + 8.9 24.1 + 2.5 20.5 + 3.4 23.3 + 0.5
18.9 + 4.1 4.5 + 0.9 9.8 + 4.7 9.1 + 0.7
8.4 + 1.6 7.9 + 1.4 17.5 + 6.3 12.1 + 0.7
52.6 + 12.7 37.0 + 4.0 48.1 + 10.6 44.5 + 1.0
0.60 + 0.02 0.70 + 0.44 1.86 + 0.36 1.18 + 0.09
B. spruce
Harvesting date
Fine-root category
Sucrose [mg g-1]
Glucose [mg g-1]
Fructose [mg g-1]
Pinitol [mg g-1]
Sugar, total [mg g-1]
Starch [mg g-1]
August 5 of 2002
LRprim LRsec ShR rootlet
23.9 + 4.5 12.7 + 5.7 15.3 + 6.7
n.d.
6.9 + 2.2 21.4 + 1.1 15.9 + 0.9
n.d.
10.1 + 2.3 21.9 + 1.2 15.5 + 1.6
n.d.
14.8 + 4.4 9.6 + 3.5 7.5 + 3.2
n.d.
55.6 + 10.3 65.4 + 15.8 54.1 + 2.3
n.d.
1.66 + 0.64 3.30 + 3.00 2.01 + 1.46
n.d.
May 2 of 2003
LRprim LRsec ShR rootlet
51.9 + 14.3 30.1 + 4.6 37.1 + 4.0 35.3 + 0.7
7.4 + 5.2 5.9 + 2.1 9.6 + 1.1 8.0 + 0.2
13.6 + 4.7 12.7 + 1.6 9.3 + 1.1 10.9 + 0.2
15.1 + 4.9 6.8 + 2.1 5.7 + 0.6 6.7 + 0.3
88.1 + 28.3 55.5 + 7.9 61.8 + 5.8 60.9 + 1.0
5.67 + 2.18 10.85 + 1.50 6.20 + 0.92 7.99 + 0.31
July 17 of 2003
LRprim LRsec ShR rootlet
41.0 + 19.7 43.5 + 9.0 35.3 + 4.1 38.9 + 0.5
32.8 + 12 14.7 + 2.8 7.4 + 1.0 11.1 + 1.2
20.8 + 6.9 10.1 + 5.7 9.9 + 0.7 10.3 + 0.3
29.2 + 2.7 9.8 + 3.0 6.5 + 1.4 8.5 + 0.8
123.9 + 34.7 84.1 + 17.1 59.1 + 5.6 68.8 + 3.3
1.40 + 0.57 1.88 + 1.50 1.40 + 1.33 1.59 + 0.04
August 1 of 2003
LRprim LRsec ShR rootlet
40.7 + 4.5 36.7 + 1.8 33.1 + 4.8 35.3 + 0.4
9.0 + 6.1 12.4 + 1.8 7.4 + 2.0 9.7 + 0.5
8.5 + 3.1 17.0 + 2.9 9.0 + 1.3 12.5 + 0.8
24.8 + 11 2.1 + 3.2 7.3 + 3.0 6.5 + 1.2
83.0 + 20.9 78.3 + 3.8 56.9 + 7.3 64.1 + 1.3
0.58 + 0.21 0.90 + 0.54 0.96 + 0.08 0.90 + 0.02
November 5 of 2003
LRprim LRsec ShR rootlet
20.6 + 3.3 21.4 + 9.1 21.1 + 4.1 21.2 + 0.1
1.2 + 0.7 5.4 + 2.1 3.2 + 0.8 4.4 + 0.3
3.5 + 1.3 12.0 + 5.0 4.6 + 0.6 8.9 + 0.7
13.0 + 3.9 5.6 + 2.1 4.0 + 1.1 5.4 + 0.3
38.4 + 3.3 44.4 + 16.7 32.8 + 5.8 39.8 + 0.9
1.27 + 0.63 2.10 + 1.72 0.76 + 1.17 1.56 + 0.11
Table 12: Non-structural carbohydrate concentrations (as presented in Fig. 43) in the fine-root categories of A, beech and B, spruce (means + 95% confidence interval, n = 4 to 10).
Results
93
c
3.9 Nutritional analyses 3.9.1 Nutritional status of the fine-root categories Six essential elements - N, P, Na, K, Ca and Mg - were compared between fine-root
categories and sampling dates (two each in May and August of 2003; Fig. 46) because of
their importance to a range of plant-physiological activities (Gordon and Jackson 2000). In all
fine-root categories of beech, N, P and K concentrations [mg g-1] were higher in August than
in May (Tab. 13). In contrast, the concentration of the other nutrients (except of Mn in LRsec)
was significantly lower in August than in May in all fine-root categories. However, C:N ratio of
all fine-root categories did not differ between May and August of 2003. At both sampling
dates, highest concentrations of these elements were found in LRprim (except of Ca with
highest concentrations in ShR during May of 2003), followed by ShR and lowest levels in
LRsec. Conversely, LRsec of beech had the highest C investment into structure per unit of
acquired N and P, followed by ShR (see averaged ratios of C:N and C:N:P in living fine roots
in Tab. 13). Apparently, LRprim had the lowest C investment per unit of acquired N and P
relative to the other fine-root categories of beech.
Figure 45: Concentrations of the carbohydrate fractions and the total sugar concentration (i.e. integral of sucrose, glucose, fructose and, in case of spruce, pinitol) of individual rootlets of beech and spruce during 2003 (means + 95% confidence interval, n = 4 to 10).
Results
94
ci
When calculated on an individual rootlet basis (Tab. 13 & Fig. 47), N, P and K contents were
enhanced, and the contents of the other elements were lowered in August relative to May. As
a consequence, C:N and C:N:P ratios of beech rootlets changed in August (cf. Tab. 13),
indicating lower construction costs per unit of nutrient acquisition (i.e. of N and P) compared
to May of 2003.
Compared to beech, spruce showed different nutrient status of their fine-root categories in
the absence of distinct dynamics in the element levels between the sampling dates (Tab.
13). In August of 2003, K concentration was strongly enhanced in LRprim and LRsec, and
lowered in ShR (Tab. 13 & Fig. 46). At the same time, Ca concentration declined in LRprim,
but increased in LRsec and ShR. Na concentration of all fine-root categories was two to three
times lower in August than in May. In general, the lowest element concentrations were
detected in LRsec, as already described for beech. In August, the C:N ratio was slightly
enhanced in ShR but stayed unchanged in LRprim and LRsec compared to respective levels in
May. Within the fine-root categories of spruce, the highest C investment into structure per
unit of acquired N and P was detected in LRsec, followed by ShR, while the lowest C
investment per unit of acquired N and P was found, similarly as for beech fine root
categories, in LRprim.
When calculated on an individual rootlet basis (Fig. 47), Ca and Mg contents were enhanced
in August compared to May 2003, and K content did not change, whereas N, P and Na
content decreased. In contrast to beech, the changes of C:N and C:N:P ratios in spruce
rootlets indicated enhanced C investment per unit of N and P acquisition in August compared
to May of 2003.
Results
95
cii
Table 13: Nutrient concentrations [mg g-1 or (*) µg g-1] in fine-root categories “long lateral roots with primary xylem” (LRprim), ”long lateral roots with secondary xylem” (LRsec), ”short roots” (ShR), and in individual rootlets of beech and spruce; root sampling in May and August of 2003 (cf. section 2.14). Bold letters represent significantly higher (p<0.05) concentrations between sampling dates. Data shown as means (n = 4 to 10) and 95% confidence interval (in brackets).
Fine-root categories Rootlet
LRprim LRsec ShR
Elements May August May August May August May August beech
C
N
P
Ca
K
Mg
Fe
Mn
Al
Zn*
Cu*
Na*
C:N
C:N :P
427 (2.5) 27.1 (0.7) 1.66 (0.05) 6.30 (0.60) 6.33 (0.34) 1.62 (0.06) 2.88 (0.29) 0.55 (0.03) 4.22 (0.80) 711 (104) 149 (44) 557 (98) 16 : 1 257 : 16 : 1
446 (4.1) 27.5 (0.6) 2.16 (0.08) 4.72 (0.63) 6.54 (0.53) 1.38 (0.06) 1.36 (0.27) 0.28 (0.02) 1.81 (0.41) 426 (53) 53 (9) 275 (29) 16 : 1 206 : 13 : 1
467 (1.5) 9.6 (0.3) 0.47 (0.01) 4.11 (0.14) 2.84 (0.06) 0.93 (0.01) 1.14 (0.16) 0.40 (0.01) 1.77 (0.11) 79 (2) 17 (3) 115 (7) 48 : 1 993 : 20 : 1
473 (0.5) 9.4 (0.5) 0.66 (0.04) 2.92 (0.23) 2.98 (0.18) 0.65 (0.04) 0.59 (0.02) 0.57 (0.03) 0.87 (0.16) 66 (8) 9 (1) 64 (7) 50 : 1 716 : 14 : 1
420 (5.5) 16.4 (0.5) 0.94 (0.01) 6.55 (0.37) 3.49 (0.11) 1.62 (0.04) 3.52 (0.23) 0.66 (0.03) 6.12 (0.41) 451 (143) 59 (23) 481 (36) 26 : 1 447 : 17 : 1
457 (1.5) 18.5 (0.5) 1.31 (0.02) 5.28 (0.39) 3.62 (0.09) 0.65 (0.08) 1.94 (0.08) 0.42 (0.04) 2.78 (0.12) 262 (40) 42 (6) 200 (4) 25 : 1 349 : 14 : 1
441 (1.4) 15.7 (0.6) 0.89 (0.04) 5.46 (0.08) 3.81 (0.13) 1.32 (0.02) 2.37 (0.07) 0.52 (0.01) 3.87 (0.11) 348 (21) 60 (5) 339 (15) 28 : 1 496 : 18 : 1
456 (1.2) 19.4 (0.1) 1.45 (0.06) 4.52 (0.12) 4.47 (0.12) 0.90 (0.02) 1.42 (0.06) 0.43 (0.01) 1.99 (0.09) 272 (15) 38 (2) 190 (10) 24 : 1 315 : 13 : 1
spruce
C
N
P
Ca
K
Mg
Fe
Mn
Al
Zn*
Cu*
Na*
C:N
C:N:P
447 (2.6) 12.7 (0.3) 2.20 (0.20) 5.87 (0.28) 6.62 (0.33) 0.90 (0.33) 0.31 (0.06) 0.64 (0.05) 0.39 (0.12) 145 (9) 11 (2) 661 (25) 35 : 1 203 : 6 : 1
460 (1.7) 14.0 (0.3) 1.94 (0.10) 4.89 (0.51) 9.60 (0.93) 1.25 (0.67) 0.17 (0.04) 0.69 (0.18) 0.21 (0.04) 84 (11) 18 (2) 145 (14) 33 : 1 237 : 7 : 1
443 (1.0) 12.0 (0.5) 0.90 (0.07) 3.86 (0.19) 3.28 (0.49) 0.86 (0.34) 0.12 (0.02) 1.05 (0.07) 0.15 (0.01) 76 (4) 8 (0.2) 114 (3) 37 : 1 492 : 13 : 1
462 (0.8) 11.8 (0.6) 1.06 (0.03) 4.68 (0.10) 4.74 (0.20) 0.99 (0.45) 0.25 (0.01) 1.02 (0.06) 0.30 (0.03) 65 (2) 9 (0.5) 78 (4) 38 : 1 436 : 11 : 1
463 (1.5) 22.0 (0.7) 1.69 (0.07) 5.68 (0.09) 5.10 (0.57) 1.23 (0.51) 0.50 (0.11) 1.01 (0.03) 0.33 (0.05) 338 (10) 20 (1) 356 (57) 21 : 1 272 : 13 : 1
467 (0.2) 19.2 (0.3) 1.31 (0.05) 6.37 (0.52) 3.03 (0.16) 1.26 (0.38) 0.36 (0.04) 0.93 (0.03) 0.54 (0.08) 192 (14) 28 (3) 170 (8) 24 : 1 356 : 17 : 1
454 (0.5) 17.5 (0.3) 1.41 (0.03) 4.97 (0.05) 4.47 (0.06) 1.06 (0.01) 0.34 (0.01) 1.05 (0.01) 0.26 (0.01) 223 (7) 15 (0.3) 280 (8) 26 : 1 321 : 12 : 1
464 (0.2) 15.6 (0.2) 1.26 (0.01) 5.60 (0.05) 4.34 (0.12) 1.15 (0.01) 0.29 (0.01) 0.96 (0.01) 0.40 (0.01) 128 (4) 19 (0.6) 129 (3) 30 : 1 368 : 12 : 1
Results
96
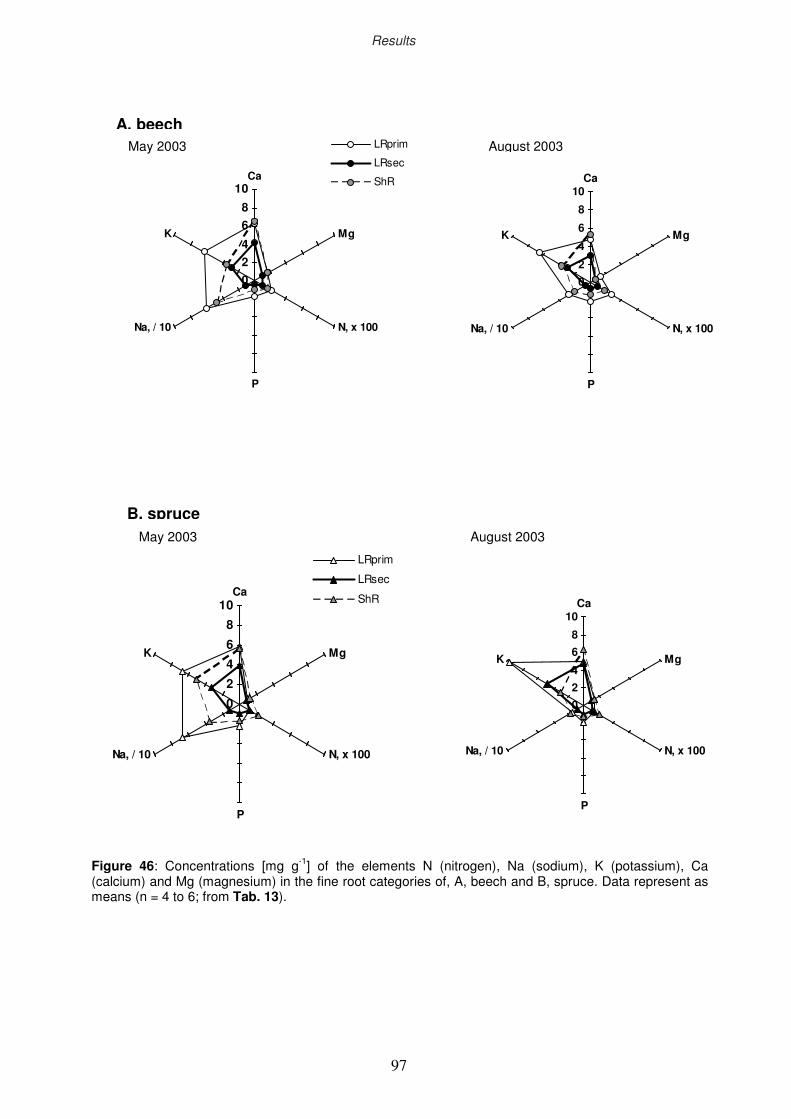
ciii
0
2
4
6
8
10Ca
Mg
N, x 100
P
Na, / 10
K
LRprim
LRsec
ShR
0
2
4
6
8
10Ca
Mg
N, x 100
P
Na, / 10
K
B. spruce May 2003 August 2003
Figure 46: Concentrations [mg g-1] of the elements N (nitrogen), Na (sodium), K (potassium), Ca (calcium) and Mg (magnesium) in the fine root categories of, A, beech and B, spruce. Data represent as means (n = 4 to 6; from Tab. 13).
0
2
4
6
8
10Ca
Mg
N, x 100
P
Na, / 10
K
0
2
4
6
8
10Ca
Mg
N, x 100
P
Na, / 10
K
LRprim
LRsec
ShR
August 2003
A. beech May 2003
Results
97
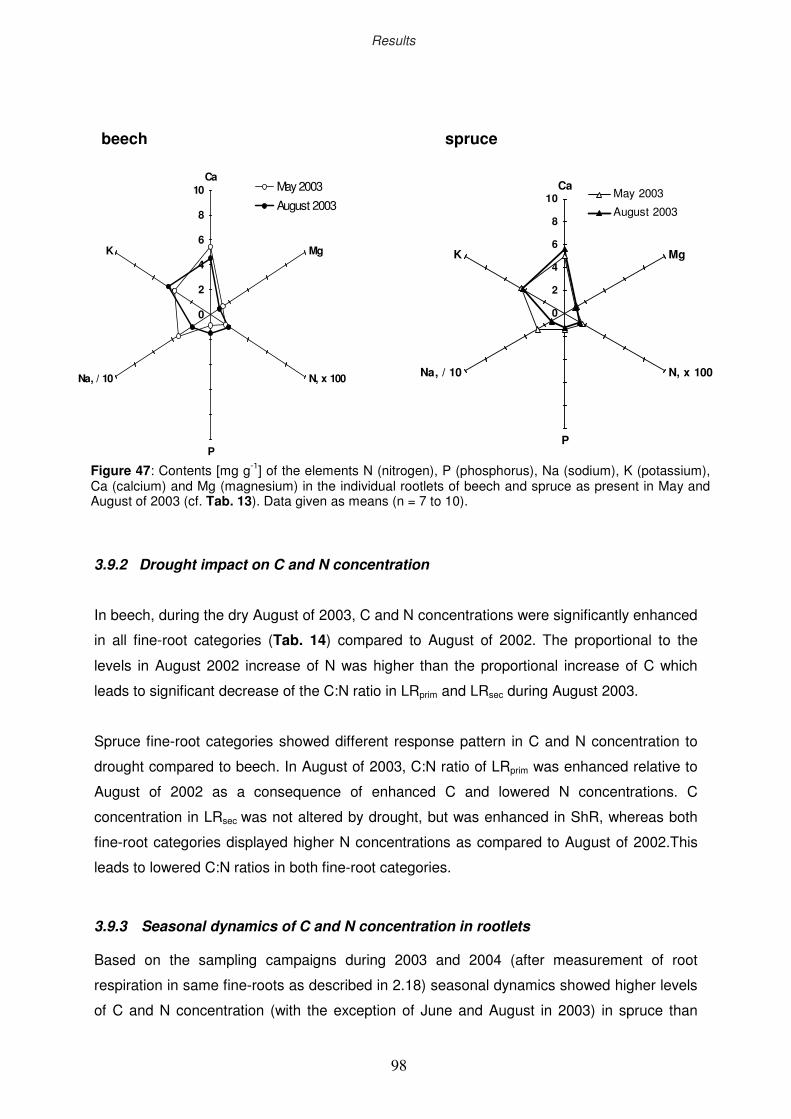
civ
3.9.2 Drought impact on C and N concentration
In beech, during the dry August of 2003, C and N concentrations were significantly enhanced
in all fine-root categories (Tab. 14) compared to August of 2002. The proportional to the
levels in August 2002 increase of N was higher than the proportional increase of C which
leads to significant decrease of the C:N ratio in LRprim and LRsec during August 2003.
Spruce fine-root categories showed different response pattern in C and N concentration to
drought compared to beech. In August of 2003, C:N ratio of LRprim was enhanced relative to
August of 2002 as a consequence of enhanced C and lowered N concentrations. C
concentration in LRsec was not altered by drought, but was enhanced in ShR, whereas both
fine-root categories displayed higher N concentrations as compared to August of 2002.This
leads to lowered C:N ratios in both fine-root categories.
3.9.3 Seasonal dynamics of C and N concentration in rootlets Based on the sampling campaigns during 2003 and 2004 (after measurement of root
respiration in same fine-roots as described in 2.18) seasonal dynamics showed higher levels
of C and N concentration (with the exception of June and August in 2003) in spruce than
0
2
4
6
8
10Ca
Mg
N, x 100
P
Na, / 10
K
May 2003
August 2003
0
2
4
6
8
10Ca
Mg
N, x 100
P
Na, / 10
K
May 2003
August 2003
beech spruce
Figure 47: Contents [mg g-1] of the elements N (nitrogen), P (phosphorus), Na (sodium), K (potassium), Ca (calcium) and Mg (magnesium) in the individual rootlets of beech and spruce as present in May and August of 2003 (cf. Tab. 13). Data given as means (n = 7 to 10).
Results
98
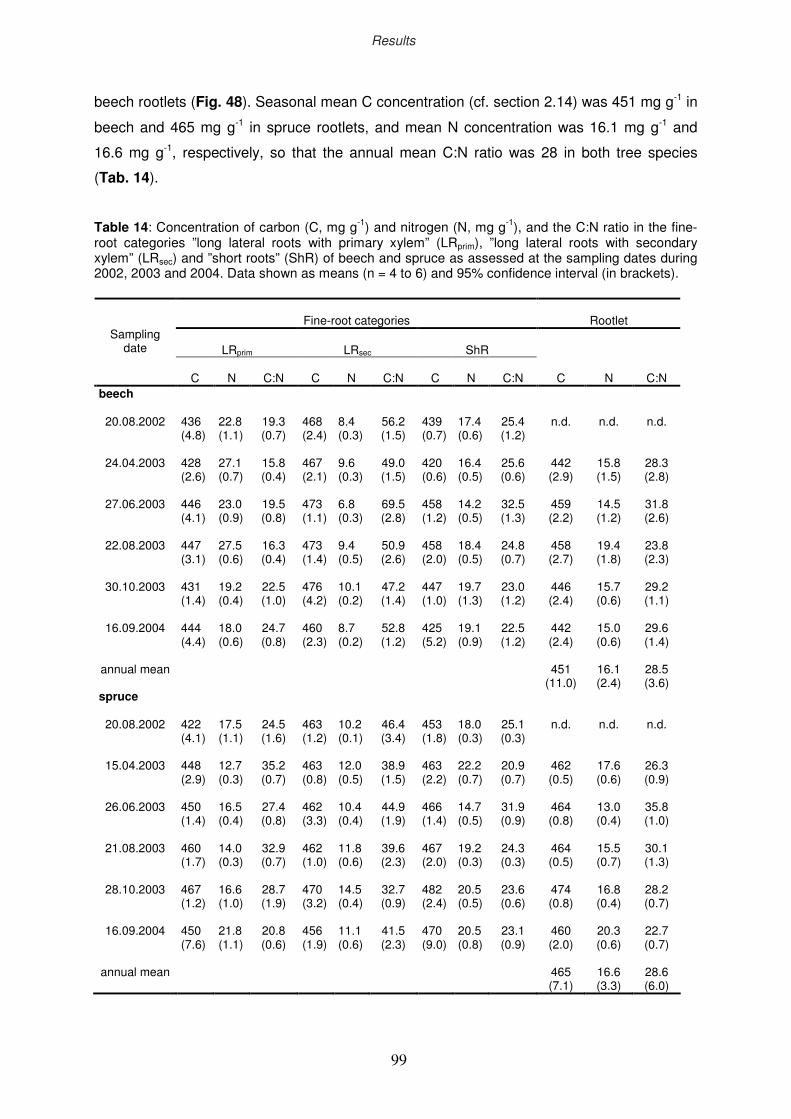
cv
beech rootlets (Fig. 48). Seasonal mean C concentration (cf. section 2.14) was 451 mg g-1 in
beech and 465 mg g-1 in spruce rootlets, and mean N concentration was 16.1 mg g-1 and
16.6 mg g-1, respectively, so that the annual mean C:N ratio was 28 in both tree species
(Tab. 14).
Table 14: Concentration of carbon (C, mg g-1) and nitrogen (N, mg g-1), and the C:N ratio in the fine-root categories ”long lateral roots with primary xylem” (LRprim), ”long lateral roots with secondary xylem” (LRsec) and ”short roots” (ShR) of beech and spruce as assessed at the sampling dates during 2002, 2003 and 2004. Data shown as means (n = 4 to 6) and 95% confidence interval (in brackets).
Fine-root categories
Rootlet
LRprim
LRsec
ShR
Sampling date
C
N
C:N
C
N
C:N
C
N
C:N
C
N
C:N
beech
20.08.2002
24.04.2003
27.06.2003
22.08.2003
30.10.2003
16.09.2004
annual mean
436 (4.8) 428 (2.6) 446 (4.1) 447 (3.1) 431 (1.4) 444 (4.4)
22.8 (1.1) 27.1 (0.7) 23.0 (0.9) 27.5 (0.6) 19.2 (0.4) 18.0 (0.6)
19.3 (0.7)
15.8 (0.4)
19.5 (0.8)
16.3 (0.4)
22.5 (1.0)
24.7 (0.8)
468 (2.4) 467 (2.1) 473 (1.1) 473 (1.4) 476 (4.2) 460 (2.3)
8.4 (0.3) 9.6 (0.3) 6.8 (0.3) 9.4 (0.5) 10.1 (0.2) 8.7 (0.2)
56.2 (1.5)
49.0 (1.5)
69.5 (2.8)
50.9 (2.6)
47.2 (1.4)
52.8 (1.2)
439 (0.7) 420 (0.6) 458 (1.2) 458 (2.0) 447 (1.0) 425 (5.2)
17.4 (0.6) 16.4 (0.5) 14.2 (0.5) 18.4 (0.5) 19.7 (1.3) 19.1 (0.9)
25.4 (1.2)
25.6 (0.6)
32.5 (1.3)
24.8 (0.7)
23.0 (1.2)
22.5 (1.2)
n.d.
442 (2.9)
459 (2.2)
458 (2.7)
446 (2.4)
442 (2.4)
451
(11.0)
n.d.
15.8 (1.5)
14.5 (1.2)
19.4 (1.8)
15.7 (0.6)
15.0 (0.6)
16.1 (2.4)
n.d.
28.3 (2.8)
31.8 (2.6)
23.8 (2.3)
29.2 (1.1)
29.6 (1.4)
28.5 (3.6)
spruce
20.08.2002
15.04.2003
26.06.2003
21.08.2003
28.10.2003
16.09.2004
annual mean
422 (4.1) 448 (2.9) 450 (1.4) 460 (1.7) 467 (1.2) 450 (7.6)
17.5 (1.1) 12.7 (0.3) 16.5 (0.4) 14.0 (0.3) 16.6 (1.0) 21.8 (1.1)
24.5 (1.6)
35.2 (0.7)
27.4 (0.8)
32.9 (0.7)
28.7 (1.9)
20.8 (0.6)
463 (1.2) 463 (0.8) 462 (3.3) 462 (1.0) 470 (3.2) 456 (1.9)
10.2 (0.1) 12.0 (0.5) 10.4 (0.4) 11.8 (0.6) 14.5 (0.4) 11.1 (0.6)
46.4 (3.4)
38.9 (1.5)
44.9 (1.9)
39.6 (2.3)
32.7 (0.9)
41.5 (2.3)
453 (1.8) 463 (2.2) 466 (1.4) 467 (2.0) 482 (2.4) 470 (9.0)
18.0 (0.3) 22.2 (0.7) 14.7 (0.5) 19.2 (0.3) 20.5 (0.5) 20.5 (0.8)
25.1 (0.3)
20.9 (0.7)
31.9 (0.9)
24.3 (0.3)
23.6 (0.6)
23.1 (0.9)
n.d.
462 (0.5)
464 (0.8)
464 (0.5)
474 (0.8)
460 (2.0)
465 (7.1)
n.d.
17.6 (0.6)
13.0 (0.4)
15.5 (0.7)
16.8 (0.4)
20.3 (0.6)
16.6 (3.3)
n.d.
26.3 (0.9)
35.8 (1.0)
30.1 (1.3)
28.2 (0.7)
22.7 (0.7)
28.6 (6.0)
Results
99
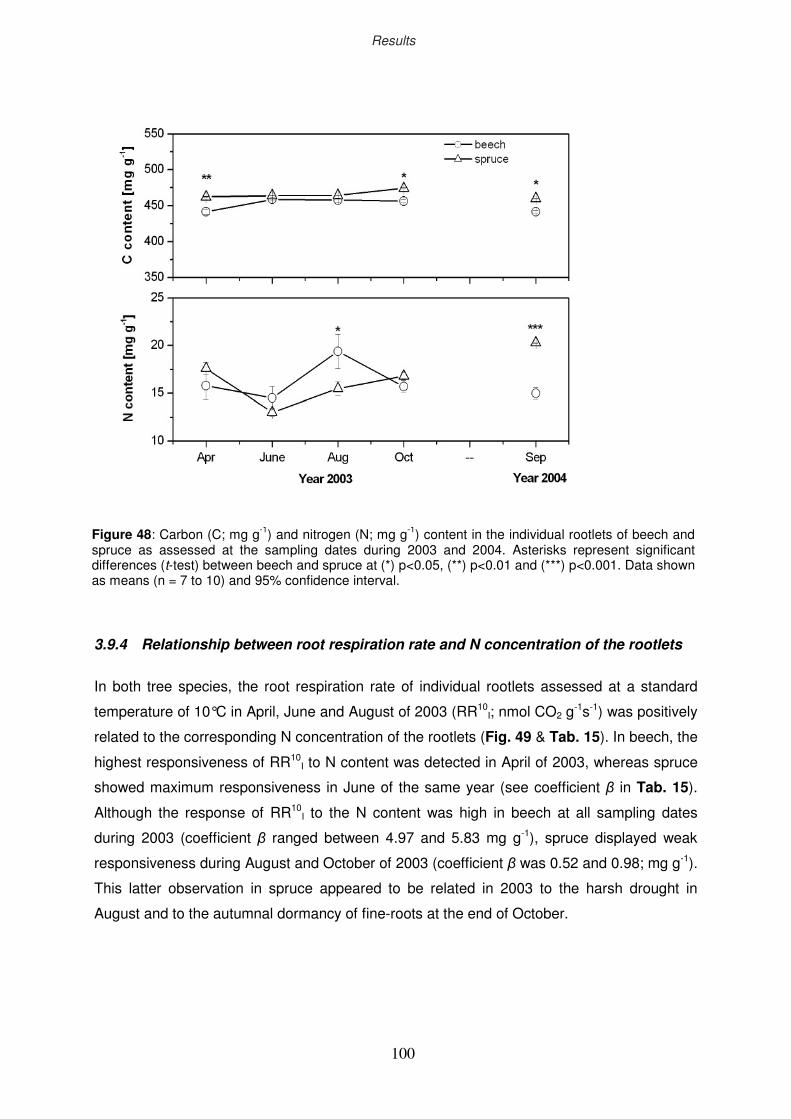
cvi
3.9.4 Relationship between root respiration rate and N concentration of the rootlets
In both tree species, the root respiration rate of individual rootlets assessed at a standard
temperature of 10°C in April, June and August of 2003 (RR10I; nmol CO2 g
-1s-1) was positively
related to the corresponding N concentration of the rootlets (Fig. 49 & Tab. 15). In beech, the
highest responsiveness of RR10I to N content was detected in April of 2003, whereas spruce
showed maximum responsiveness in June of the same year (see coefficient β in Tab. 15).
Although the response of RR10I to the N content was high in beech at all sampling dates
during 2003 (coefficient β ranged between 4.97 and 5.83 mg g-1), spruce displayed weak
responsiveness during August and October of 2003 (coefficient β was 0.52 and 0.98; mg g-1).
This latter observation in spruce appeared to be related in 2003 to the harsh drought in
August and to the autumnal dormancy of fine-roots at the end of October.
Figure 48: Carbon (C; mg g-1) and nitrogen (N; mg g-1) content in the individual rootlets of beech and spruce as assessed at the sampling dates during 2003 and 2004. Asterisks represent significant differences (t-test) between beech and spruce at (*) p<0.05, (**) p<0.01 and (***) p<0.001. Data shown as means (n = 7 to 10) and 95% confidence interval.
Results
100
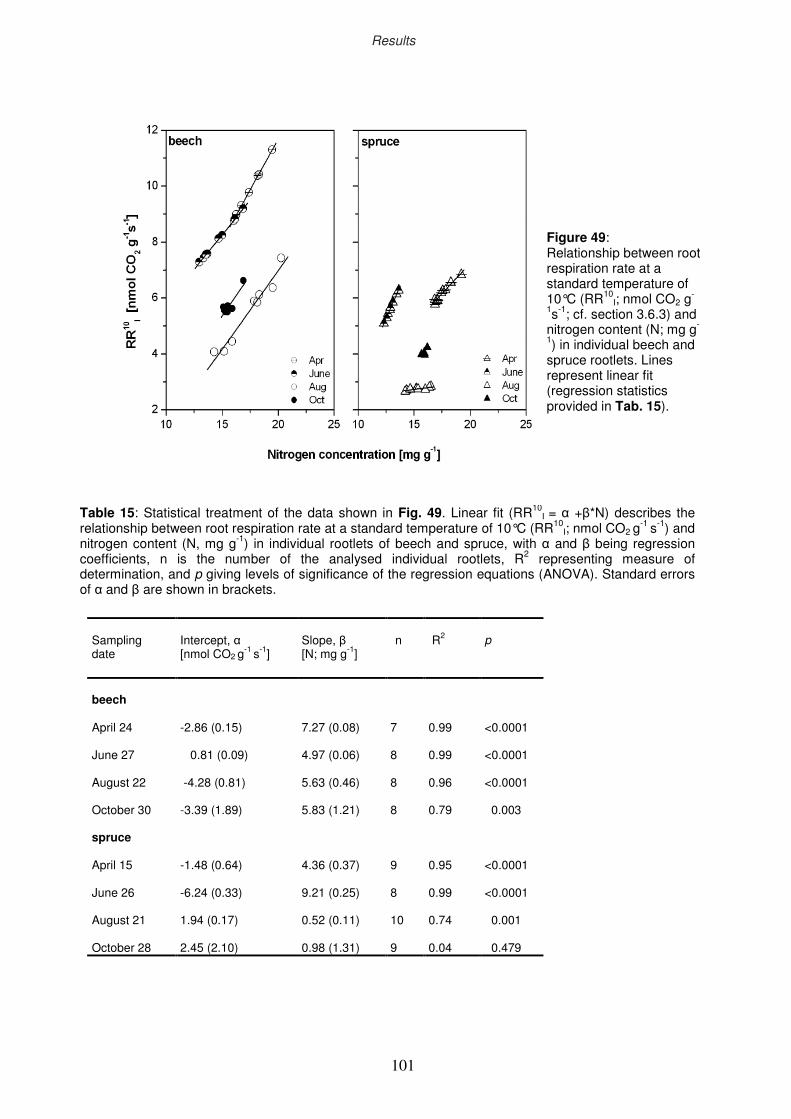
cvii
Figure 49: Relationship between root respiration rate at a standard temperature of 10°C (RR10
I; nmol CO2 g-
1s-1; cf. section 3.6.3) and nitrogen content (N; mg g-
1) in individual beech and spruce rootlets. Lines represent linear fit (regression statistics provided in Tab. 15).
Table 15: Statistical treatment of the data shown in Fig. 49. Linear fit (RR10I = α +β*N) describes the
relationship between root respiration rate at a standard temperature of 10°C (RR10I; nmol CO2 g
-1 s-1) and nitrogen content (N, mg g-1) in individual rootlets of beech and spruce, with α and β being regression coefficients, n is the number of the analysed individual rootlets, R2 representing measure of determination, and p giving levels of significance of the regression equations (ANOVA). Standard errors of α and β are shown in brackets.
Sampling date
Intercept, α [nmol CO2 g
-1 s-1]
Slope, β [N; mg g-1]
n
R2
p
beech April 24 June 27 August 22 October 30 spruce April 15 June 26 August 21 October 28
-2.86 (0.15) 0.81 (0.09) -4.28 (0.81) -3.39 (1.89) -1.48 (0.64) -6.24 (0.33) 1.94 (0.17) 2.45 (2.10)
7.27 (0.08) 4.97 (0.06) 5.63 (0.46) 5.83 (1.21) 4.36 (0.37) 9.21 (0.25) 0.52 (0.11) 0.98 (1.31)
7 8 8 8 9 8 10 9
0.99 0.99 0.96 0.79 0.95 0.99 0.74 0.04
<0.0001 <0.0001 <0.0001 0.003 <0.0001 <0.0001 0.001 0.479
Results
101
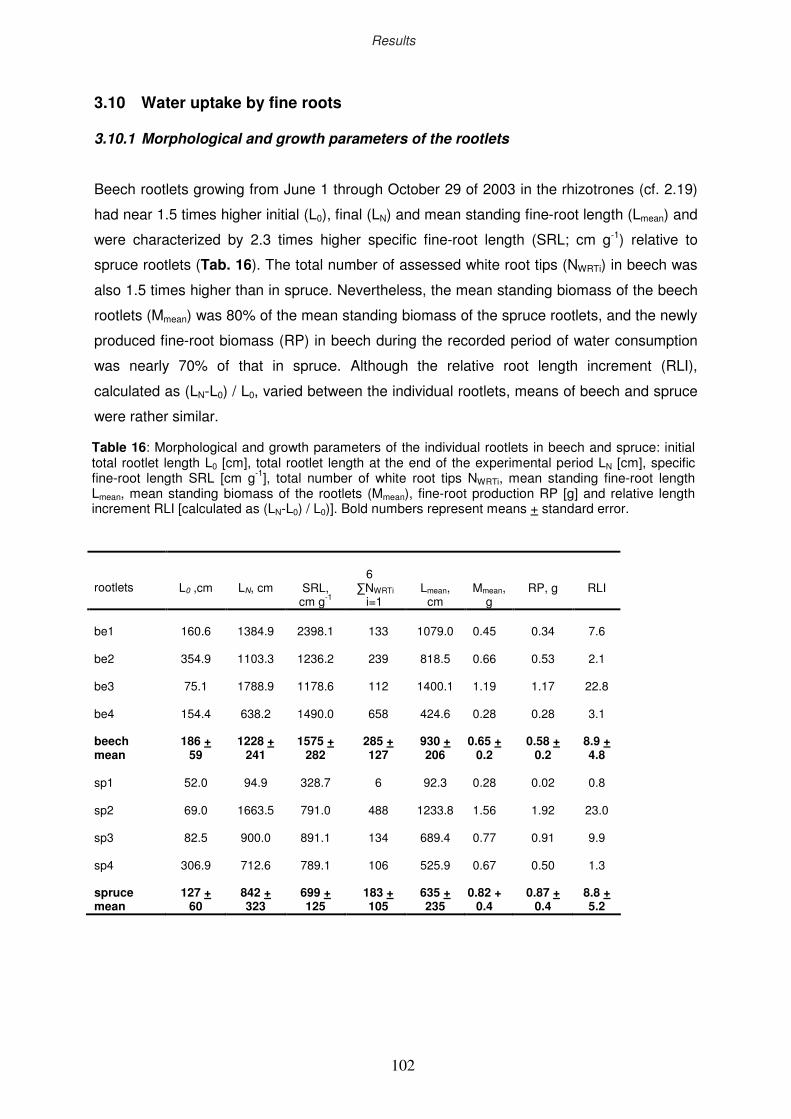
cviii
3.10 Water uptake by fine roots 3.10.1 Morphological and growth parameters of the rootlets Beech rootlets growing from June 1 through October 29 of 2003 in the rhizotrones (cf. 2.19)
had near 1.5 times higher initial (L0), final (LN) and mean standing fine-root length (Lmean) and
were characterized by 2.3 times higher specific fine-root length (SRL; cm g-1) relative to
spruce rootlets (Tab. 16). The total number of assessed white root tips (NWRTi) in beech was
also 1.5 times higher than in spruce. Nevertheless, the mean standing biomass of the beech
rootlets (Mmean) was 80% of the mean standing biomass of the spruce rootlets, and the newly
produced fine-root biomass (RP) in beech during the recorded period of water consumption
was nearly 70% of that in spruce. Although the relative root length increment (RLI),
calculated as (LN-L0) / L0, varied between the individual rootlets, means of beech and spruce
were rather similar.
rootlets
L0 ,cm
LN, cm
SRL,
cm g-1
6 ∑NWRTi
i=1
Lmean,
cm
Mmean,
g
RP, g
RLI
be1 be2 be3 be4 beech mean sp1 sp2 sp3 sp4 spruce mean
160.6
354.9
75.1
154.4
186 +
59
52.0
69.0
82.5
306.9
127 + 60
1384.9
1103.3
1788.9
638.2
1228 +
241
94.9
1663.5
900.0
712.6
842 + 323
2398.1
1236.2
1178.6
1490.0
1575 +
282
328.7
791.0
891.1
789.1
699 + 125
133
239
112
658
285 + 127
6
488
134
106
183 + 105
1079.0
818.5
1400.1
424.6
930 + 206
92.3
1233.8
689.4
525.9
635 + 235
0.45
0.66
1.19
0.28
0.65 +
0.2
0.28
1.56
0.77
0.67
0.82 + 0.4
0.34
0.53
1.17
0.28
0.58 +
0.2
0.02
1.92
0.91
0.50
0.87 + 0.4
7.6
2.1
22.8
3.1
8.9 + 4.8
0.8
23.0
9.9
1.3
8.8 + 5.2
Table 16: Morphological and growth parameters of the individual rootlets in beech and spruce: initial total rootlet length L0 [cm], total rootlet length at the end of the experimental period LN [cm], specific fine-root length SRL [cm g-1], total number of white root tips NWRTi, mean standing fine-root length Lmean, mean standing biomass of the rootlets (Mmean), fine-root production RP [g] and relative length increment RLI [calculated as (LN-L0) / L0)]. Bold numbers represent means + standard error.
Results
102
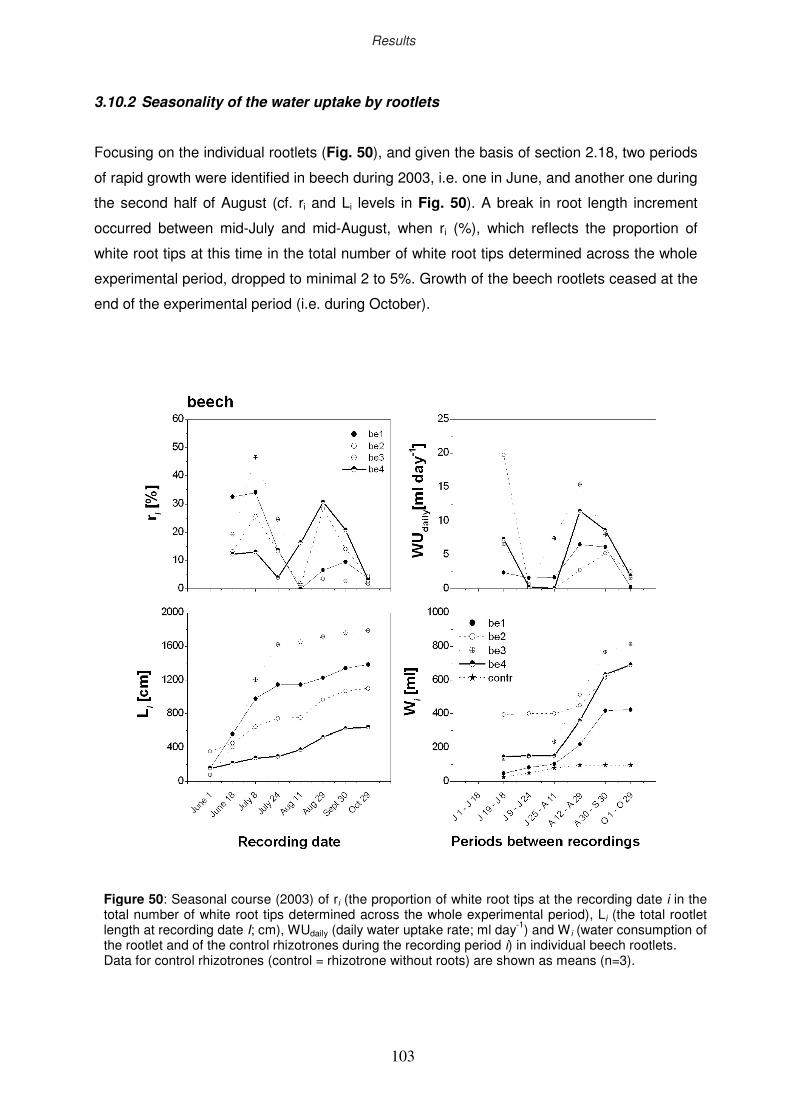
cix
3.10.2 Seasonality of the water uptake by rootlets
Focusing on the individual rootlets (Fig. 50), and given the basis of section 2.18, two periods
of rapid growth were identified in beech during 2003, i.e. one in June, and another one during
the second half of August (cf. ri and Li levels in Fig. 50). A break in root length increment
occurred between mid-July and mid-August, when ri (%), which reflects the proportion of
white root tips at this time in the total number of white root tips determined across the whole
experimental period, dropped to minimal 2 to 5%. Growth of the beech rootlets ceased at the
end of the experimental period (i.e. during October).
Figure 50: Seasonal course (2003) of ri (the proportion of white root tips at the recording date i in the total number of white root tips determined across the whole experimental period), Li (the total rootlet length at recording date I; cm), WUdaily (daily water uptake rate; ml day-1) and W i (water consumption of the rootlet and of the control rhizotrones during the recording period i) in individual beech rootlets. Data for control rhizotrones (control = rhizotrone without roots) are shown as means (n=3).
Results
103
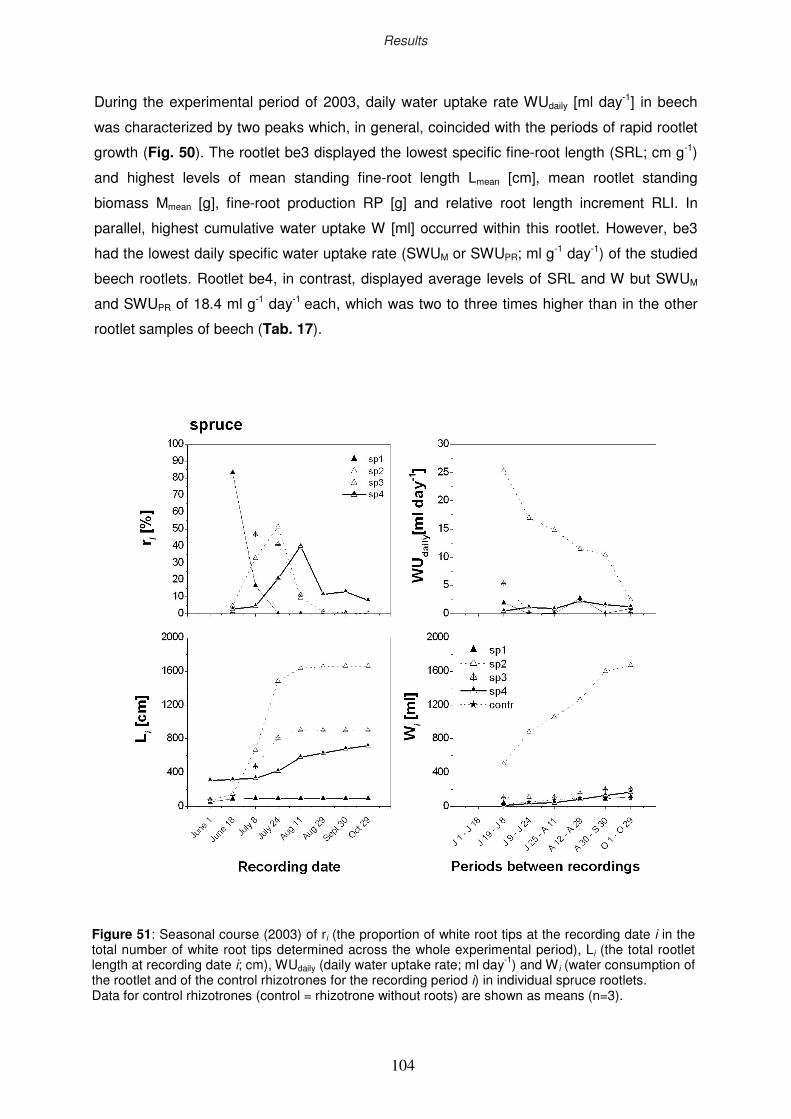
cx
During the experimental period of 2003, daily water uptake rate WUdaily [ml day-1] in beech
was characterized by two peaks which, in general, coincided with the periods of rapid rootlet
growth (Fig. 50). The rootlet be3 displayed the lowest specific fine-root length (SRL; cm g-1)
and highest levels of mean standing fine-root length Lmean [cm], mean rootlet standing
biomass Mmean [g], fine-root production RP [g] and relative root length increment RLI. In
parallel, highest cumulative water uptake W [ml] occurred within this rootlet. However, be3
had the lowest daily specific water uptake rate (SWUM or SWUPR; ml g-1 day-1) of the studied
beech rootlets. Rootlet be4, in contrast, displayed average levels of SRL and W but SWUM
and SWUPR of 18.4 ml g-1 day-1 each, which was two to three times higher than in the other
rootlet samples of beech (Tab. 17).
Figure 51: Seasonal course (2003) of ri (the proportion of white root tips at the recording date i in the total number of white root tips determined across the whole experimental period), Li (the total rootlet length at recording date i; cm), WUdaily (daily water uptake rate; ml day-1) and W i (water consumption of the rootlet and of the control rhizotrones for the recording period i) in individual spruce rootlets. Data for control rhizotrones (control = rhizotrone without roots) are shown as means (n=3).
Results
104
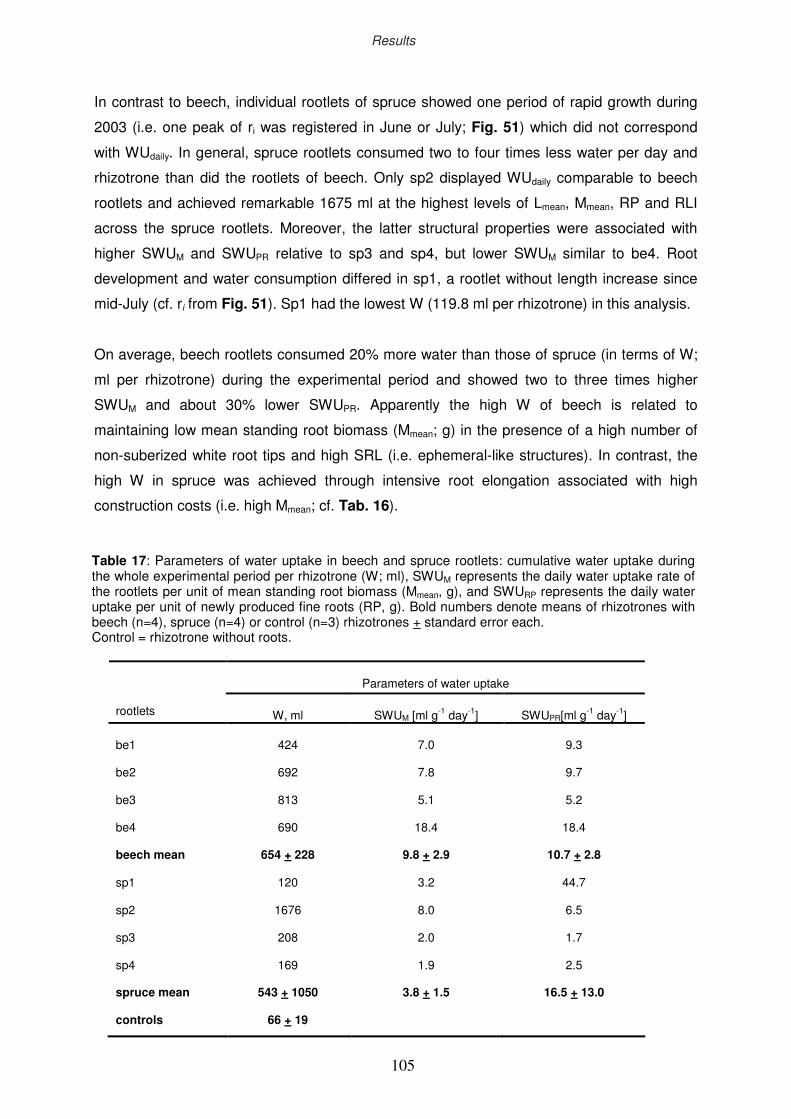
cxi
In contrast to beech, individual rootlets of spruce showed one period of rapid growth during
2003 (i.e. one peak of ri was registered in June or July; Fig. 51) which did not correspond
with WUdaily. In general, spruce rootlets consumed two to four times less water per day and
rhizotrone than did the rootlets of beech. Only sp2 displayed WUdaily comparable to beech
rootlets and achieved remarkable 1675 ml at the highest levels of Lmean, Mmean, RP and RLI
across the spruce rootlets. Moreover, the latter structural properties were associated with
higher SWUM and SWUPR relative to sp3 and sp4, but lower SWUM similar to be4. Root
development and water consumption differed in sp1, a rootlet without length increase since
mid-July (cf. ri from Fig. 51). Sp1 had the lowest W (119.8 ml per rhizotrone) in this analysis.
On average, beech rootlets consumed 20% more water than those of spruce (in terms of W;
ml per rhizotrone) during the experimental period and showed two to three times higher
SWUM and about 30% lower SWUPR. Apparently the high W of beech is related to
maintaining low mean standing root biomass (Mmean; g) in the presence of a high number of
non-suberized white root tips and high SRL (i.e. ephemeral-like structures). In contrast, the
high W in spruce was achieved through intensive root elongation associated with high
construction costs (i.e. high Mmean; cf. Tab. 16).
Table 17: Parameters of water uptake in beech and spruce rootlets: cumulative water uptake during the whole experimental period per rhizotrone (W; ml), SWUM represents the daily water uptake rate of the rootlets per unit of mean standing root biomass (Mmean, g), and SWURP represents the daily water uptake per unit of newly produced fine roots (RP, g). Bold numbers denote means of rhizotrones with beech (n=4), spruce (n=4) or control (n=3) rhizotrones + standard error each. Control = rhizotrone without roots.
Parameters of water uptake
rootlets
W, ml
SWUM [ml g-1 day-1]
SWUPR[ml g-1 day-1]
be1 be2 be3 be4 beech mean sp1 sp2 sp3 sp4 spruce mean controls
424
692
813
690
654 + 228
120
1676
208
169
543 + 1050
66 + 19
7.0
7.8
5.1
18.4
9.8 + 2.9
3.2
8.0
2.0
1.9
3.8 + 1.5
9.3
9.7
5.2
18.4
10.7 + 2.8
44.7
6.5
1.7
2.5
16.5 + 13.0
Results
105
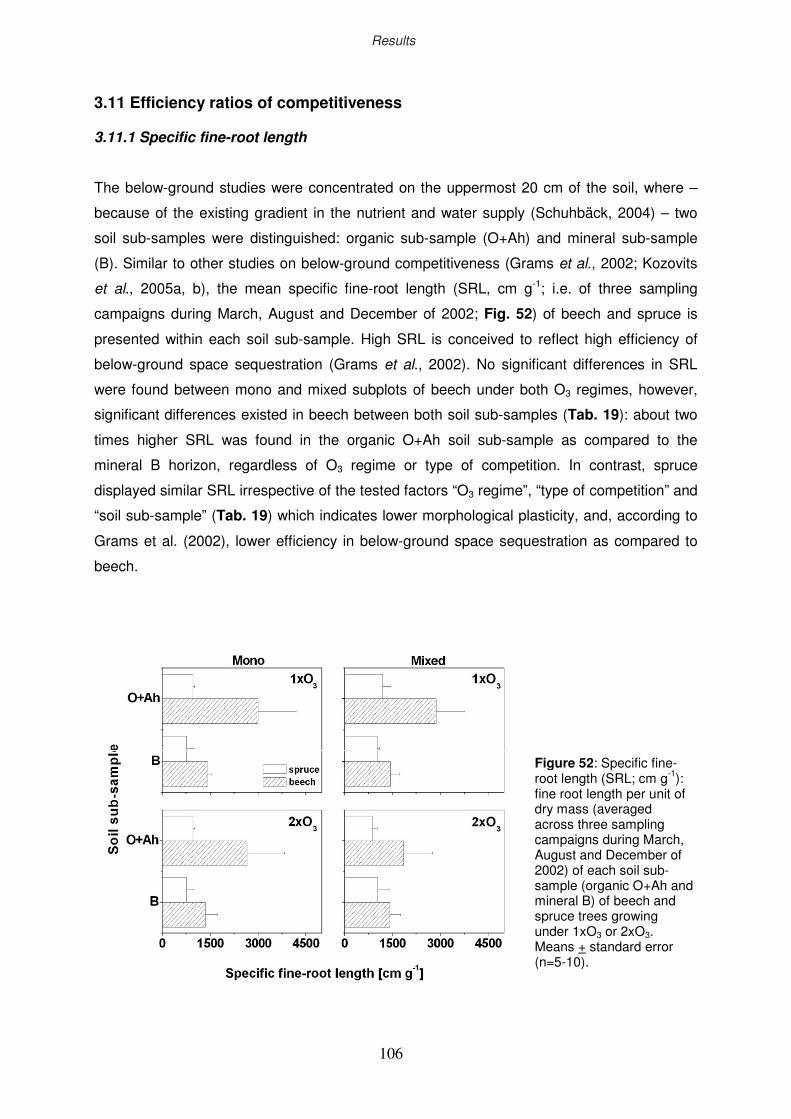
cxii
3.11 Efficiency ratios of competitiveness 3.11.1 Specific fine-root length
The below-ground studies were concentrated on the uppermost 20 cm of the soil, where –
because of the existing gradient in the nutrient and water supply (Schuhbäck, 2004) – two
soil sub-samples were distinguished: organic sub-sample (O+Ah) and mineral sub-sample
(B). Similar to other studies on below-ground competitiveness (Grams et al., 2002; Kozovits
et al., 2005a, b), the mean specific fine-root length (SRL, cm g-1; i.e. of three sampling
campaigns during March, August and December of 2002; Fig. 52) of beech and spruce is
presented within each soil sub-sample. High SRL is conceived to reflect high efficiency of
below-ground space sequestration (Grams et al., 2002). No significant differences in SRL
were found between mono and mixed subplots of beech under both O3 regimes, however,
significant differences existed in beech between both soil sub-samples (Tab. 19): about two
times higher SRL was found in the organic O+Ah soil sub-sample as compared to the
mineral B horizon, regardless of O3 regime or type of competition. In contrast, spruce
displayed similar SRL irrespective of the tested factors “O3 regime”, “type of competition” and
“soil sub-sample” (Tab. 19) which indicates lower morphological plasticity, and, according to
Grams et al. (2002), lower efficiency in below-ground space sequestration as compared to
beech.
Figure 52: Specific fine-root length (SRL; cm g-1): fine root length per unit of dry mass (averaged across three sampling campaigns during March, August and December of 2002) of each soil sub-sample (organic O+Ah and mineral B) of beech and spruce trees growing under 1xO3 or 2xO3. Means + standard error (n=5-10).
Results
106
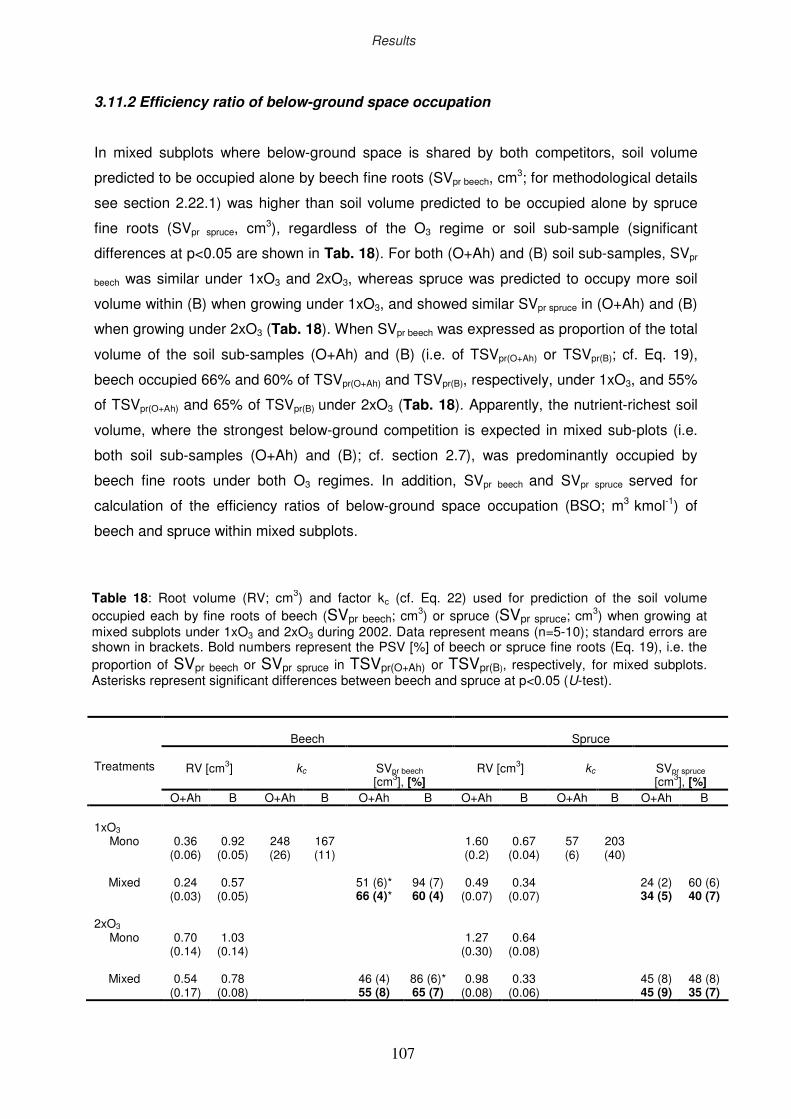
cxiii
3.11.2 Efficiency ratio of below-ground space occupation
In mixed subplots where below-ground space is shared by both competitors, soil volume
predicted to be occupied alone by beech fine roots (SVpr beech, cm3; for methodological details
see section 2.22.1) was higher than soil volume predicted to be occupied alone by spruce
fine roots (SVpr spruce, cm3), regardless of the O3 regime or soil sub-sample (significant
differences at p<0.05 are shown in Tab. 18). For both (O+Ah) and (B) soil sub-samples, SVpr
beech was similar under 1xO3 and 2xO3, whereas spruce was predicted to occupy more soil
volume within (B) when growing under 1xO3, and showed similar SVpr spruce in (O+Ah) and (B)
when growing under 2xO3 (Tab. 18). When SVpr beech was expressed as proportion of the total
volume of the soil sub-samples (O+Ah) and (B) (i.e. of TSVpr(O+Ah) or TSVpr(B); cf. Eq. 19),
beech occupied 66% and 60% of TSVpr(O+Ah) and TSVpr(B), respectively, under 1xO3, and 55%
of TSVpr(O+Ah) and 65% of TSVpr(B) under 2xO3 (Tab. 18). Apparently, the nutrient-richest soil
volume, where the strongest below-ground competition is expected in mixed sub-plots (i.e.
both soil sub-samples (O+Ah) and (B); cf. section 2.7), was predominantly occupied by
beech fine roots under both O3 regimes. In addition, SVpr beech and SVpr spruce served for
calculation of the efficiency ratios of below-ground space occupation (BSO; m3 kmol-1) of
beech and spruce within mixed subplots.
Beech
Spruce
RV [cm3]
kc
SVpr beech [cm3], [%]
RV [cm3]
kc
SVpr spruce [cm3], [%]
Treatments
O+Ah B O+Ah B O+Ah B O+Ah B O+Ah B O+Ah B 1xO3
Mono
Mixed
2xO3
Mono
Mixed
0.36 (0.06)
0.24
(0.03)
0.70 (0.14)
0.54
(0.17)
0.92 (0.05)
0.57
(0.05)
1.03 (0.14)
0.78
(0.08)
248 (26)
167 (11)
51 (6)* 66 (4)*
46 (4) 55 (8)
94 (7) 60 (4)
86 (6)* 65 (7)
1.60 (0.2)
0.49
(0.07)
1.27 (0.30)
0.98
(0.08)
0.67 (0.04)
0.34
(0.07)
0.64 (0.08)
0.33
(0.06)
57 (6)
203 (40)
24 (2) 34 (5)
45 (8) 45 (9)
60 (6) 40 (7)
48 (8) 35 (7)
Table 18: Root volume (RV; cm3) and factor kc (cf. Eq. 22) used for prediction of the soil volume occupied each by fine roots of beech (SVpr beech; cm3) or spruce (SVpr spruce; cm3) when growing at mixed subplots under 1xO3 and 2xO3 during 2002. Data represent means (n=5-10); standard errors are shown in brackets. Bold numbers represent the PSV [%] of beech or spruce fine roots (Eq. 19), i.e. the proportion of SVpr beech or SVpr spruce in TSVpr(O+Ah) or TSVpr(B), respectively, for mixed subplots. Asterisks represent significant differences between beech and spruce at p<0.05 (U-test).
Results
107
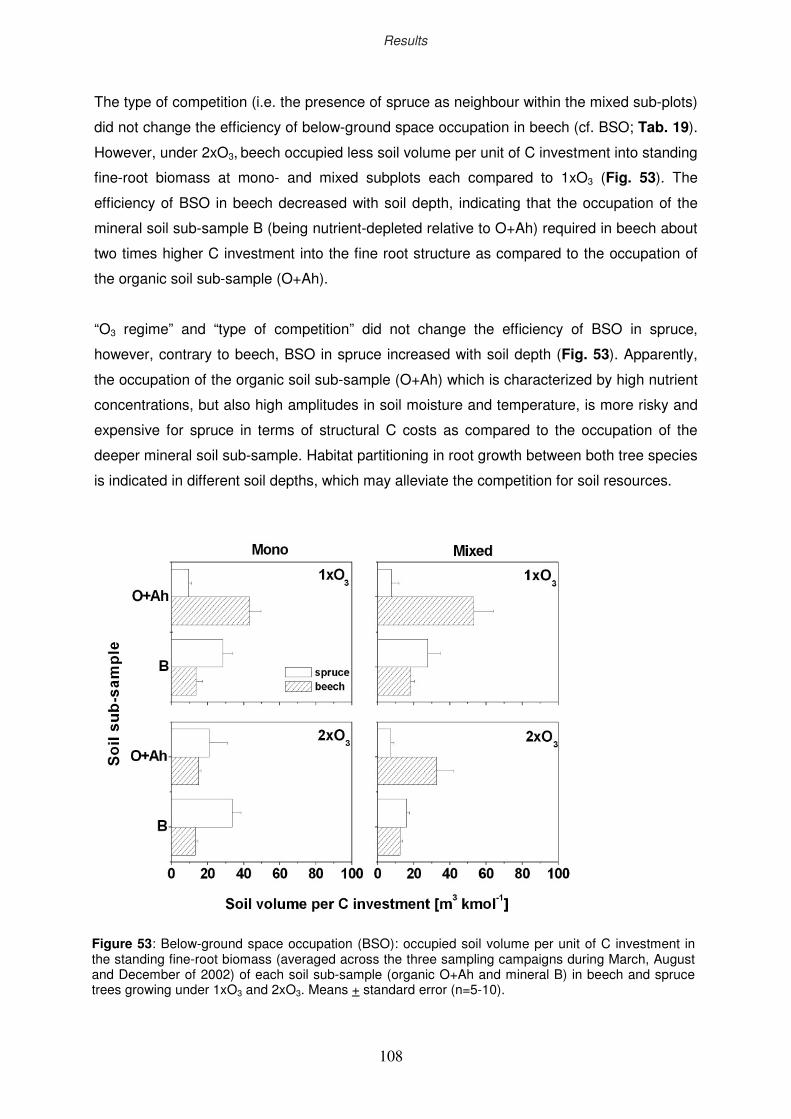
cxiv
The type of competition (i.e. the presence of spruce as neighbour within the mixed sub-plots)
did not change the efficiency of below-ground space occupation in beech (cf. BSO; Tab. 19).
However, under 2xO3, beech occupied less soil volume per unit of C investment into standing
fine-root biomass at mono- and mixed subplots each compared to 1xO3 (Fig. 53). The
efficiency of BSO in beech decreased with soil depth, indicating that the occupation of the
mineral soil sub-sample B (being nutrient-depleted relative to O+Ah) required in beech about
two times higher C investment into the fine root structure as compared to the occupation of
the organic soil sub-sample (O+Ah).
“O3 regime” and “type of competition” did not change the efficiency of BSO in spruce,
however, contrary to beech, BSO in spruce increased with soil depth (Fig. 53). Apparently,
the occupation of the organic soil sub-sample (O+Ah) which is characterized by high nutrient
concentrations, but also high amplitudes in soil moisture and temperature, is more risky and
expensive for spruce in terms of structural C costs as compared to the occupation of the
deeper mineral soil sub-sample. Habitat partitioning in root growth between both tree species
is indicated in different soil depths, which may alleviate the competition for soil resources.
Figure 53: Below-ground space occupation (BSO): occupied soil volume per unit of C investment in the standing fine-root biomass (averaged across the three sampling campaigns during March, August and December of 2002) of each soil sub-sample (organic O+Ah and mineral B) in beech and spruce trees growing under 1xO3 and 2xO3. Means + standard error (n=5-10).
Results
108
cxv
3.11.3 Efficiency ratio of below-ground space exploitation
Based on water uptake measurements on individual rootlets under 1xO3 (i.e. daily specific
water uptake rate SWUM, ml g-1 day-1; for methodological details see section 3.8) beech and
spruce fine roots at mono sub-plots showed similar efficiency of below-ground space
exploitation (i.e. BSE) as compared to the mixed sub-plots (Tab. 19 & Fig. 54). At both mono
and mixed sub-plots, beech consumed two to three times more soil water per unit of
occupied soil volume within the mineral soil sub-sample B, whereas spruce was two to three
times more efficient in BSE within the organic soil sub-sample (O+Ah). A decrease in
competition for water is indicated between beech and spruce as an outcome of the habitat
partitioning addressed in section 3.11.2.
3.11.4 Efficiency ratio of “running costs”
Efficiency ratio of “running costs” (BRC, i.e. occupied soil volume per unit of C release in
fine-root respiration) for maintenance and growth of fine roots in beech and spruce within a
given soil volume under both O3 regimes, types of competition and soil sub-samples showed
patterns during 2002 similar to those of the efficiency ratio of BSO. In beech, a significantly
higher efficiency ratio of BRC was detected under 1xO3 as compared to 2xO3 as well as
within the organic soil sub-sample (O+Ah) as compared to the mineral B (results of the
statistical evaluation shown in Tab. 19). “Type of competition” does not change the efficiency
ratio of BRC of the fine-roots in both tree species. In spruce, only “soil sub-sample” had a
significant effect on the efficiency ratio of BRC which increased with soil depth in a way
similar to the efficiency ratio of BSO.
Figure 54: Efficiency in below-ground space exploitation (BSE): daily water consumption in beech and spruce fine-roots per unit of occupied soil volume of each soil sub-sample (organic O+Ah and mineral B) assessed under 1xO3 during 2003. Means + standard error (n=5-10).
Results
109
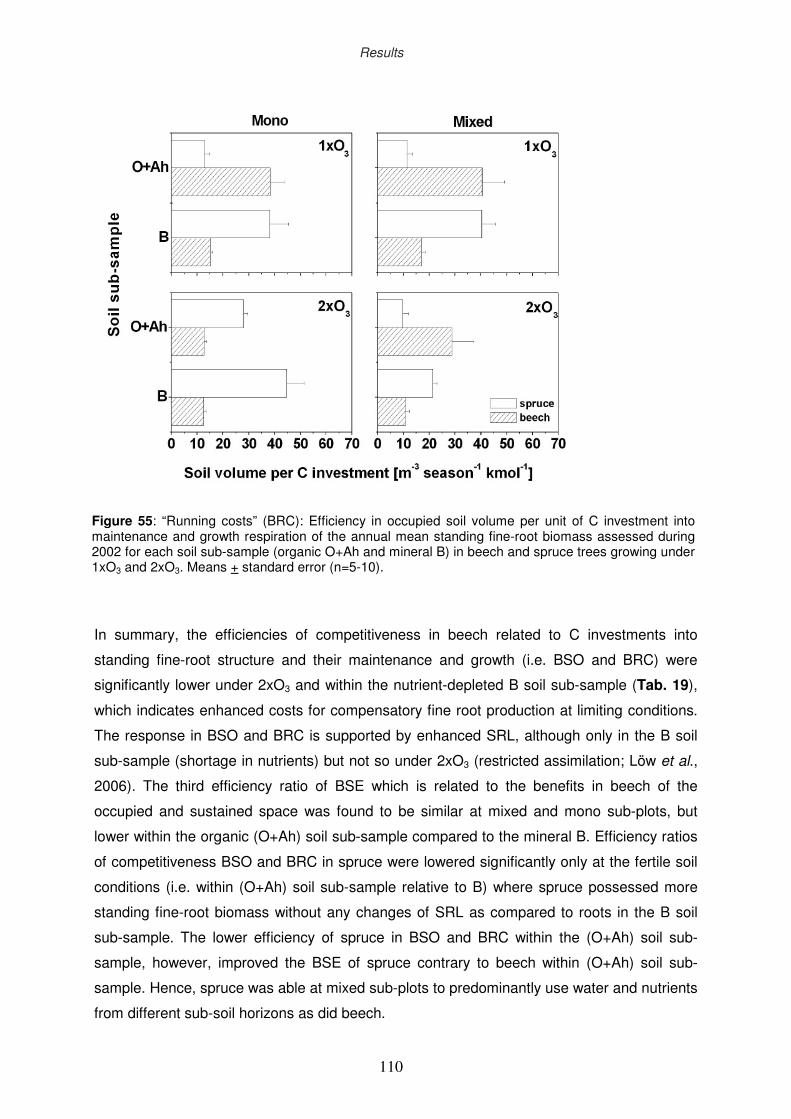
cxvi
In summary, the efficiencies of competitiveness in beech related to C investments into
standing fine-root structure and their maintenance and growth (i.e. BSO and BRC) were
significantly lower under 2xO3 and within the nutrient-depleted B soil sub-sample (Tab. 19),
which indicates enhanced costs for compensatory fine root production at limiting conditions.
The response in BSO and BRC is supported by enhanced SRL, although only in the B soil
sub-sample (shortage in nutrients) but not so under 2xO3 (restricted assimilation; Löw et al.,
2006). The third efficiency ratio of BSE which is related to the benefits in beech of the
occupied and sustained space was found to be similar at mixed and mono sub-plots, but
lower within the organic (O+Ah) soil sub-sample compared to the mineral B. Efficiency ratios
of competitiveness BSO and BRC in spruce were lowered significantly only at the fertile soil
conditions (i.e. within (O+Ah) soil sub-sample relative to B) where spruce possessed more
standing fine-root biomass without any changes of SRL as compared to roots in the B soil
sub-sample. The lower efficiency of spruce in BSO and BRC within the (O+Ah) soil sub-
sample, however, improved the BSE of spruce contrary to beech within (O+Ah) soil sub-
sample. Hence, spruce was able at mixed sub-plots to predominantly use water and nutrients
from different sub-soil horizons as did beech.
Figure 55: “Running costs” (BRC): Efficiency in occupied soil volume per unit of C investment into maintenance and growth respiration of the annual mean standing fine-root biomass assessed during 2002 for each soil sub-sample (organic O+Ah and mineral B) in beech and spruce trees growing under 1xO3 and 2xO3. Means + standard error (n=5-10).
Results
110
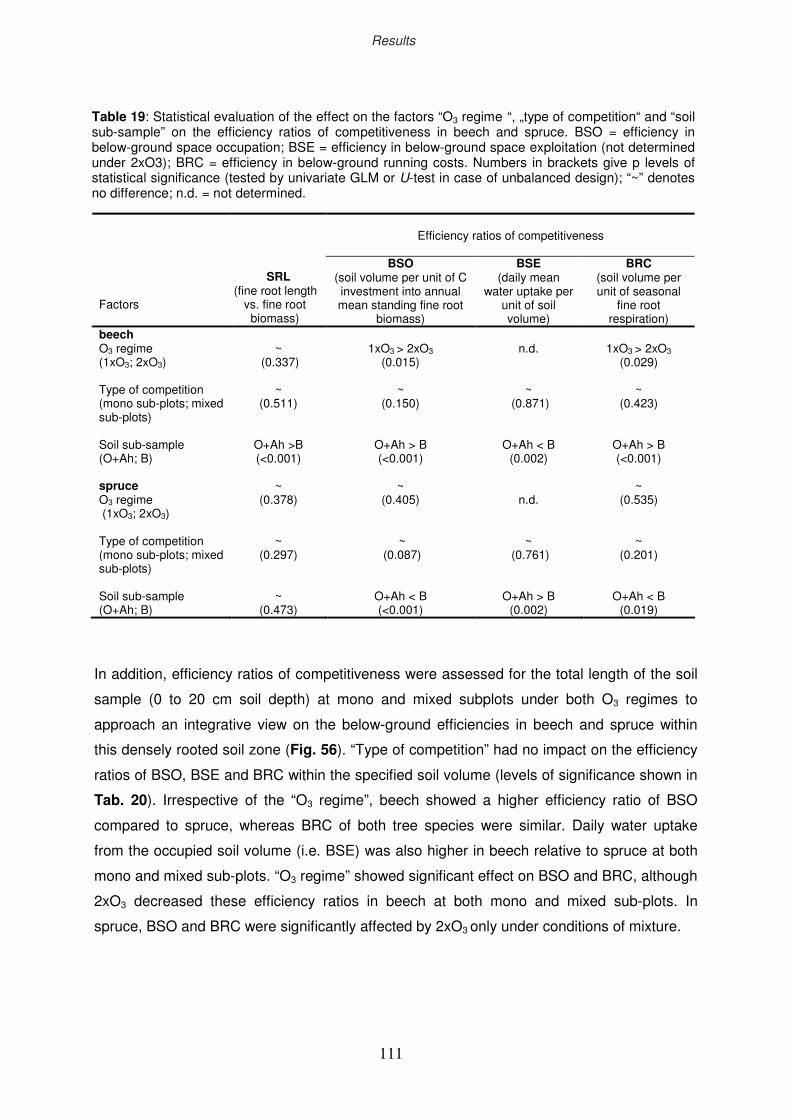
cxvii
In addition, efficiency ratios of competitiveness were assessed for the total length of the soil
sample (0 to 20 cm soil depth) at mono and mixed subplots under both O3 regimes to
approach an integrative view on the below-ground efficiencies in beech and spruce within
this densely rooted soil zone (Fig. 56). “Type of competition” had no impact on the efficiency
ratios of BSO, BSE and BRC within the specified soil volume (levels of significance shown in
Tab. 20). Irrespective of the “O3 regime”, beech showed a higher efficiency ratio of BSO
compared to spruce, whereas BRC of both tree species were similar. Daily water uptake
from the occupied soil volume (i.e. BSE) was also higher in beech relative to spruce at both
mono and mixed sub-plots. “O3 regime” showed significant effect on BSO and BRC, although
2xO3 decreased these efficiency ratios in beech at both mono and mixed sub-plots. In
spruce, BSO and BRC were significantly affected by 2xO3 only under conditions of mixture.
Table 19: Statistical evaluation of the effect on the factors “O3 regime “, „type of competition“ and “soil sub-sample” on the efficiency ratios of competitiveness in beech and spruce. BSO = efficiency in below-ground space occupation; BSE = efficiency in below-ground space exploitation (not determined under 2xO3); BRC = efficiency in below-ground running costs. Numbers in brackets give p levels of statistical significance (tested by univariate GLM or U-test in case of unbalanced design); “~” denotes no difference; n.d. = not determined.
Efficiency ratios of competitiveness
Factors
SRL (fine root length
vs. fine root biomass)
BSO (soil volume per unit of C investment into annual mean standing fine root
biomass)
BSE (daily mean
water uptake per unit of soil volume)
BRC (soil volume per unit of seasonal
fine root respiration)
beech O3 regime (1xO3; 2xO3)
~
(0.337)
1xO3 > 2xO3
(0.015)
n.d.
1xO3 > 2xO3
(0.029) Type of competition (mono sub-plots; mixed sub-plots)
~
(0.511)
~
(0.150)
~
(0.871)
~
(0.423)
Soil sub-sample (O+Ah; B)
O+Ah >B (<0.001)
O+Ah > B (<0.001)
O+Ah < B
(0.002)
O+Ah > B (<0.001)
spruce O3 regime (1xO3; 2xO3)
~
(0.378)
~
(0.405)
n.d.
~
(0.535)
Type of competition (mono sub-plots; mixed sub-plots)
~
(0.297)
~
(0.087)
~
(0.761)
~
(0.201)
Soil sub-sample (O+Ah; B)
~
(0.473)
O+Ah < B (<0.001)
O+Ah > B
(0.002)
O+Ah < B
(0.019)
Results
111
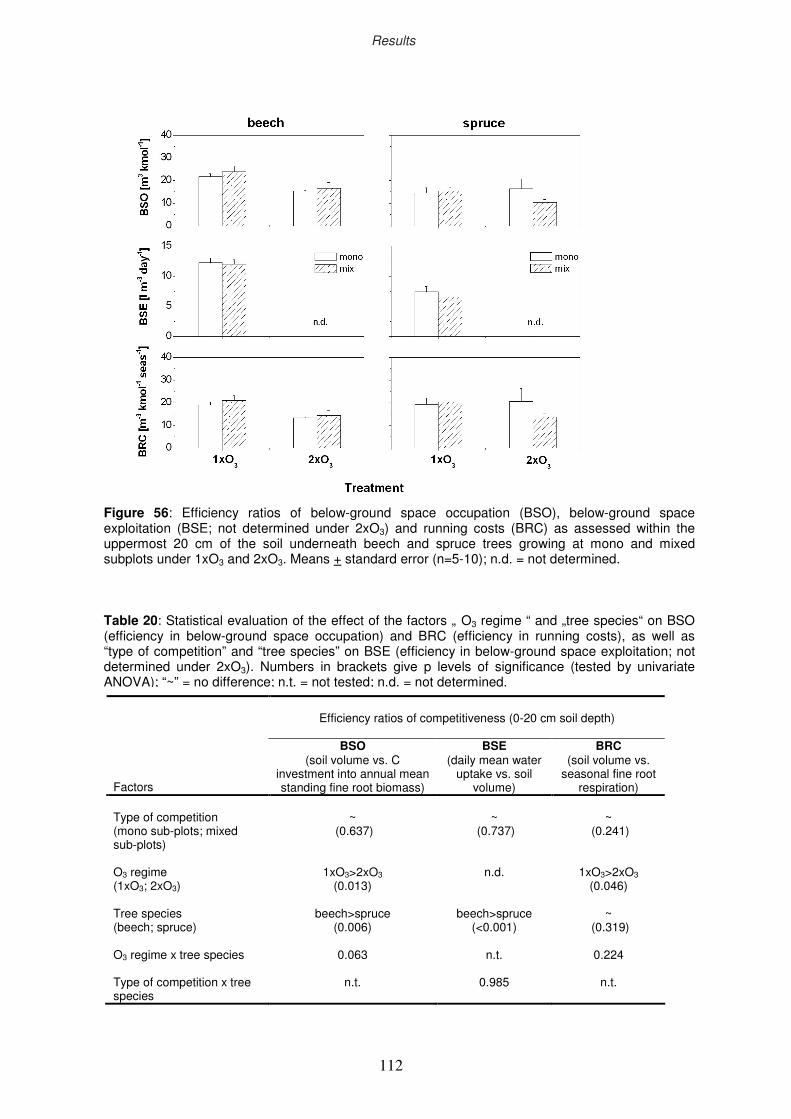
cxviii
Efficiency ratios of competitiveness (0-20 cm soil depth)
Factors
BSO (soil volume vs. C
investment into annual mean standing fine root biomass)
BSE (daily mean water
uptake vs. soil volume)
BRC (soil volume vs.
seasonal fine root respiration)
Type of competition (mono sub-plots; mixed sub-plots)
~
(0.637)
~
(0.737)
~
(0.241)
O3 regime (1xO3; 2xO3)
1xO3>2xO3
(0.013)
n.d.
1xO3>2xO3
(0.046) Tree species (beech; spruce)
beech>spruce
(0.006)
beech>spruce
(<0.001)
~
(0.319) O3 regime x tree species Type of competition x tree species
0.063
n.t.
n.t.
0.985
0.224
n.t.
Figure 56: Efficiency ratios of below-ground space occupation (BSO), below-ground space exploitation (BSE; not determined under 2xO3) and running costs (BRC) as assessed within the uppermost 20 cm of the soil underneath beech and spruce trees growing at mono and mixed subplots under 1xO3 and 2xO3. Means + standard error (n=5-10); n.d. = not determined.
Table 20: Statistical evaluation of the effect of the factors „ O3 regime “ and „tree species“ on BSO (efficiency in below-ground space occupation) and BRC (efficiency in running costs), as well as “type of competition” and “tree species” on BSE (efficiency in below-ground space exploitation; not determined under 2xO3). Numbers in brackets give p levels of significance (tested by univariate ANOVA); “~” = no difference; n.t. = not tested; n.d. = not determined.
Results
112
cxix
4 DISCUSSION
Below-ground studies on competitiveness are provided in a mature Fagus sylvatica / Picea
abies forest stand of high structural complexity. The high individual variability (all trees of
each species of same age, but not of same size; Wipfler et al., 2005; Löw et al., 2006) and
differences in stand density (Fig. 25) interacted with seasonal growth dynamics which was
driven by differing climatic conditions across the three study years (Figs. 21 & 22) and
heterogenic spatial distribution of soil resources (Schuhbäck, 2004). In addition, densely
packed root ramifications of adult beech and spruce trees show a high degree of aggregation
in root clusters (Schmid & Kazda, 2005), often forming symphyses within or even between
coarse roots of individual trees (Kutschera & Lichtenegger, 2002). In contrast to above-
ground structures which form distinct branches and individual crowns (Reiter et al., 2005),
the structural and functional distinction of the individual root systems of trees becomes hardly
feasible. Here, results from below-ground studies were not quantified per individual tree, but
at the stand level, as the latter level was found to reliably describe and predict species
growth in relation to intra and interspecific competition (Poorter & Navas, 2003).
To determine below-ground competitive success in plants, three types of space-related
cost/benefit relationships (i.e. “efficiencies”; cf. section 1.1.3) were used by combining
measures from different experimental approaches. The selection of response variables can
critically influence the interpretation of competition (Weigelt & Jolliffe, 2003). The explanatory
power of the efficiency ratios chosen in this study was validated by comparison with
conventional approaches and with the efficiency ratios defined previously for above-ground
structures (Reiter et al., 2005). Evaluations of below-ground competitive success in plants
can be confounded by methodology, when evaluating resource investments into root
structure (i.e. C costs for root production; Hendricks et al., 2006; Hertel & Leuschner, 2002)
and related maintenance (i.e. C costs for respiration; Lambers, 1979), or when assessing
returns (i.e. resource uptake from a highly heterogeneous environment; Bliss et al., 2002).
The physiological parameters assessed in this study are based on robust methods, which
were adapted to field conditions as necessary. A challenging question in comparing beech
and spruce was to divide the soil volume of mixed subplots into portions occupied by the
fine-roots and their symbionts of each of the species. Is below-ground physical space a
resource by its own which organisms compete for aside the soil function to provide nutrients
and water (McConnaughay & Bazzaz, 1991)? Which are the mechanisms of the root
systems of beech and spruce ensuring successful competition for soil nutrients under
changing environmental conditions (i.e. under experimentally enhanced ozone concentration
or naturally occurring prolonged drought)? Did the experimental design of the present study
Discussion
113
cxx
allow to assess the profiteer in the competitive interaction for soil resources and the extent of
contrasting resource exploitation strategies? The discussion will direct attention to such
questions. Along with quantifying the physiological basis of below-ground competitiveness
under forest stand conditions, physiological aspects will be discussed with respect to
silvicultural practice and predicted “global change” scenarios, since the sustainable
cultivation of mixed beech-spruce forests is of major economic interest in Central-European
forestry (Rennenberg et al., 2004; Ammer et al., 2005).
4.1 Climatic variation during the study period 2002-2004
Climatic conditions were highly variable during the three experimental years: from moist
conditions during 2002 and average rainfall in 2004 to severe drought during 2003 (Raspe et
al., 2004). Summer precipitation in 2003 was 30% lower during the growing season as
compared to the 30-year long-term average. Schume et al. (2004) and Jost et al. (2004)
reported on differences in forest hydrology between mixed and pure stands of European
beech and Norway spruce which occurred during the seasonal periods when the soil water
reserves were depleted. In our experiment, the variation in time of plant-available soil water
(ASW) within both tree groups was assessed using the model LWF-BROOK90 (Hammel &
Kennel, 2001; co-operation with Dr. S. Raspe, LWF). The modelled seasonal pattern in 2003
of ASW showed two periods of species-specific differences in soil hydrology: (1) during
spring, when soil drying started earlier under spruce than beech, and (2) during mid-summer,
when ASW was exhausted first under spruce. As a consequence, drought (i.e. the period
during which water was not plant-available) was prolonged under spruce (75 days compared
to 45 days in beech). At the stand level of a mixed spruce/beech forest in Lower Austria,
Schume et al. (2003) reported the species-specific exhaustion of soil moisture to be
predominantly caused by different transpiration rates. According Hietz et al. (2000)
transpiration rates of individual beech trees were up to six times higher than those of spruce
trees of comparable size. Although whole-tree transpiration was not assessed in the present
study, the daily water uptake per mean standing root biomass (SWUM) of the beech fine-root
system was found to excess that of spruce by a factor of three (Tab. 17). Blaschke (unpubl.)
reported for “Kranzberg Forest” the fine root density of beech to be twice as high (assessed
within the total rooting zone of 0 to 90 cm soil depth) as in spruce. Combining the higher
density of the beech fine-root system with the assessed SWUM, the daily water uptake by fine
roots within the total rooted zone in beech is concluded to exceed the corresponding
parameter in spruce by the factor of six. Such a difference is consistent with that between
whole-tree transpiration of individual beech and spruce trees as reported by Hietz (2000).
Discussion
114
cxxi
At “Kranzberger Forst” a spatial heterogeneity of volumetric soil water content (SWC) was
detected under both beech and spruce monospecific sub-plots (Fig. 26). In a study carried
out in mixed spruce-beech forests of Lower Austria, the spatial variation of soil re-wetting
was interpreted in relation to the different tree architecture of the two species (Jost et al.,
2004). The separate pathway of rain water uptake at the stand level via stem flow in beech,
mediated through funnel-like upward branch inclination and smooth stem surface, caused 13
to 30% higher water input around stems relative to precipitation (Patzner, 2004; Zirlewagen &
von Wilpert, 2001). In contrast, spruce displays higher interception due to the large foliage
surface area (Patzner, 2004; Beier, 1998). These differences in above-ground architecture
apparently have caused the spatial heterogeneity of volumetric soil water content (SWC)
detected in the present study under beech and spruce monospecific sub-plots at
“Kranzberger Forst”. Here, stand structure in terms of stem density was regarded as the
other important factor providing patches that favour re-charging of the soil water reservoir by
precipitation. In mono-subplots of beech, SWC measured at positions with high stem density
exceeded SWC at low density by a factor of 2 (Fig. 26), possibly as a consequence of the
higher water input via stem flow in the denser part of the stand. In contrast, SWC under
mono-subplots of spruce increased with decreasing stem density which is ascribed to the
larger crown gaps that allow precipitation to readily reach the stand floor. Consistent with the
water infiltration concentrating at stem base via stem flow, beech develops high uptake
capacity for water from the soil around stems due to a dense, deep-reaching and
homogeneous root system (Schmid & Kazda, 2002). Spruce, in contrast, forms a shallower
root system concentrated within the uppermost 30 cm of the soil (Schmid, 2002), possessing
high fine-root density within a 5 m radius, and maximum horizontal root extension up to 15 m
around tree trunks (Ammer & Wagner, 2002). By this spruce is restricted to exploit water
mostly from the top soil; however, because of the laterally expanding root system, spruce
can sequester soil recourses at higher distance from its stem base compared to beech.
As a result of the different water re-charging and exploitation patterns of both tree species,
no significant relation between SWC and stem density was found in the mixed subplot
(Fig. 26), although a slight increase in soil water was measured in less dense forest parts.
The spatial distribution of soil moisture in the mixed subplot was more homogenous
compared to the mono-specific subplots. These results imply mixed beech/spruce stands to
be characterized by more effective re-charge (i.e. water input into the soil) and use of soil
water relative to monocultures (being of relevancy for predicted “global change” scenarios;
Easterling et al., 2000).
Discussion
115
cxxii
In summary, the extent of drought during 2003 underneath mono and mixed-species tree
groups was modified by architectural as well as physiological features (i.e. transpiration rate;
Heitz et al., 2000) of beech and spruce. Stand density was found to contribute in a
contrasting way to the spatial variation of SWC within beech and spruce sub-plots, but had
no significant effect within mixed plots. The species-specific difference in forest hydrology
vanished during severe drought (Schume et al., 2003, Fig. 31 in this study).
4.2 Comparison of beech and spruce responses to drought
The variation in the climatic conditions between study years and the extremely dry and warm
summer of 2003 set the stage for evaluating the responsiveness of the two competing tree
species, beech and spruce, to water limitation under the mixed-stand conditions of
“Kranzberger Forst”. Plant responses to drought under field conditions are complex, and can
be synergistically or antagonistically modified by the superimposition of other stresses
(Chaves et al., 2002). Based on the conventional approach of Casper and Jackson (1997),
the physiological and/or morphological traits of beech and spruce fine-roots that determine
below-ground competitive ability under prolonged drought are discussed in the following with
respect to soil space occupation. In both species functional categories within the fine-root
fraction are important to understand the different strategies of conifer and angiosperm tree
species in soil exploitation (Bauhus & Messier, 1999).
4.2.1 Beech
Underneath beech growing in mono and mixed sub-plots under ambient ozone concentration
(1xO3), annual fine-root production (FRP) and fine-root turnover (RT) were enhanced by
drought, and, respectively, fine-root longevity (RL) was reduced. Leuschner et al. (2001)
reported from a mixed stand of Fagus sylvatica and Quercus petraea the mortality of finest
roots (diameter < 1 mm) in beech to increase during summer drought, while compensatory
finest-root production was stimulated, ensuring an unchanged standing biomass of this root
category. Such a plant response to reduced water availability was found to raise
carbohydrate partitioning to below-ground sinks while reducing C supply to other sinks in the
stand (Joslin & Wolfe, 1998). Lambers et al., (1998) discuss a possible mechanism for
sustaining the root biomass at dry soil conditions: low soil water potential sets the signal for
increasing the transport of assimilates to roots, which is probably due to the reduction of the
highly drought-sensitive extension growth of leaves (Smirnoff, 1995). Since photosynthesis is
less affected by drought than leaf growth (Kramer & Boyer, 1995), sugar translocation to
roots as well as root growth may be enhanced. This results in reduced transpiring foliage
Discussion
116
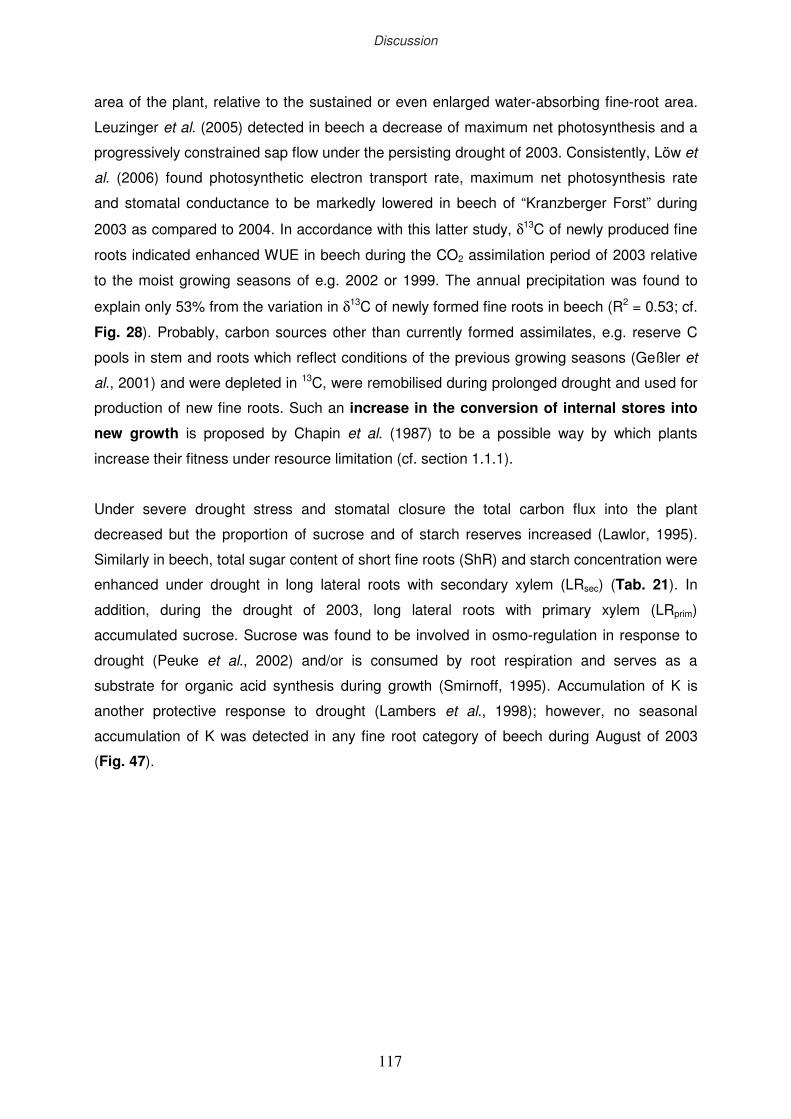
cxxiii
area of the plant, relative to the sustained or even enlarged water-absorbing fine-root area.
Leuzinger et al. (2005) detected in beech a decrease of maximum net photosynthesis and a
progressively constrained sap flow under the persisting drought of 2003. Consistently, Löw et
al. (2006) found photosynthetic electron transport rate, maximum net photosynthesis rate
and stomatal conductance to be markedly lowered in beech of “Kranzberger Forst” during
2003 as compared to 2004. In accordance with this latter study, δ13C of newly produced fine
roots indicated enhanced WUE in beech during the CO2 assimilation period of 2003 relative
to the moist growing seasons of e.g. 2002 or 1999. The annual precipitation was found to
explain only 53% from the variation in δ13C of newly formed fine roots in beech (R2 = 0.53; cf.
Fig. 28). Probably, carbon sources other than currently formed assimilates, e.g. reserve C
pools in stem and roots which reflect conditions of the previous growing seasons (Geßler et
al., 2001) and were depleted in 13C, were remobilised during prolonged drought and used for
production of new fine roots. Such an increase in the conversion of internal stores into
new growth is proposed by Chapin et al. (1987) to be a possible way by which plants
increase their fitness under resource limitation (cf. section 1.1.1).
Under severe drought stress and stomatal closure the total carbon flux into the plant
decreased but the proportion of sucrose and of starch reserves increased (Lawlor, 1995).
Similarly in beech, total sugar content of short fine roots (ShR) and starch concentration were
enhanced under drought in long lateral roots with secondary xylem (LRsec) (Tab. 21). In
addition, during the drought of 2003, long lateral roots with primary xylem (LRprim)
accumulated sucrose. Sucrose was found to be involved in osmo-regulation in response to
drought (Peuke et al., 2002) and/or is consumed by root respiration and serves as a
substrate for organic acid synthesis during growth (Smirnoff, 1995). Accumulation of K is
another protective response to drought (Lambers et al., 1998); however, no seasonal
accumulation of K was detected in any fine root category of beech during August of 2003
(Fig. 47).
Discussion
117
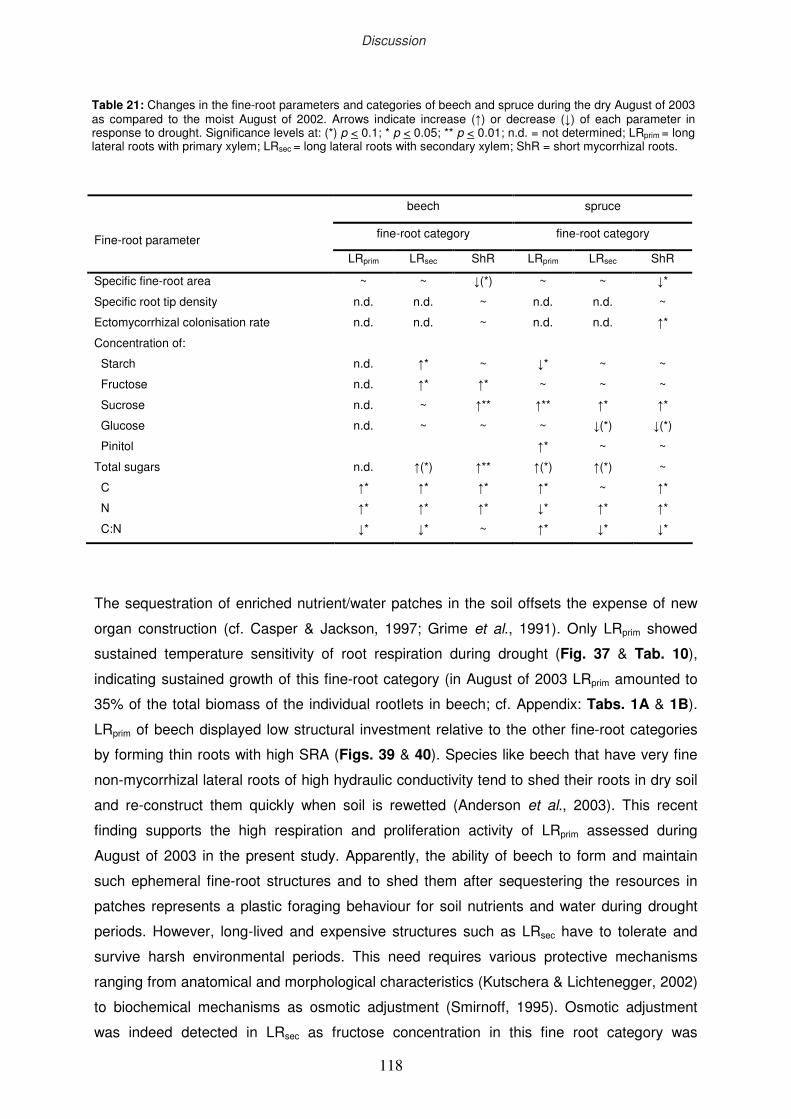
cxxiv
beech spruce
fine-root category fine-root category
Fine-root parameter
LRprim LRsec ShR LRprim LRsec ShR
Specific fine-root area
Specific root tip density
Ectomycorrhizal colonisation rate
Concentration of:
Starch
Fructose
Sucrose
Glucose
Pinitol
Total sugars
C
N
C:N
~
n.d.
n.d.
n.d.
n.d.
n.d.
n.d.
n.d.
↑*
↑*
↓*
~
n.d.
n.d.
↑*
↑*
~
~
↑(*)
↑*
↑*
↓*
↓(*)
~
~
~
↑*
↑**
~
↑**
↑*
↑*
~
~
n.d.
n.d.
↓*
~
↑**
~
↑*
↑(*)
↑*
↓*
↑*
~
n.d.
n.d.
~
~
↑*
↓(*)
~
↑(*)
~
↑*
↓*
↓*
~
↑*
~
~
↑*
↓(*)
~
~
↑*
↑*
↓*
The sequestration of enriched nutrient/water patches in the soil offsets the expense of new
organ construction (cf. Casper & Jackson, 1997; Grime et al., 1991). Only LRprim showed
sustained temperature sensitivity of root respiration during drought (Fig. 37 & Tab. 10),
indicating sustained growth of this fine-root category (in August of 2003 LRprim amounted to
35% of the total biomass of the individual rootlets in beech; cf. Appendix: Tabs. 1A & 1B).
LRprim of beech displayed low structural investment relative to the other fine-root categories
by forming thin roots with high SRA (Figs. 39 & 40). Species like beech that have very fine
non-mycorrhizal lateral roots of high hydraulic conductivity tend to shed their roots in dry soil
and re-construct them quickly when soil is rewetted (Anderson et al., 2003). This recent
finding supports the high respiration and proliferation activity of LRprim assessed during
August of 2003 in the present study. Apparently, the ability of beech to form and maintain
such ephemeral fine-root structures and to shed them after sequestering the resources in
patches represents a plastic foraging behaviour for soil nutrients and water during drought
periods. However, long-lived and expensive structures such as LRsec have to tolerate and
survive harsh environmental periods. This need requires various protective mechanisms
ranging from anatomical and morphological characteristics (Kutschera & Lichtenegger, 2002)
to biochemical mechanisms as osmotic adjustment (Smirnoff, 1995). Osmotic adjustment
was indeed detected in LRsec as fructose concentration in this fine root category was
Table 21: Changes in the fine-root parameters and categories of beech and spruce during the dry August of 2003 as compared to the moist August of 2002. Arrows indicate increase (↑) or decrease (↓) of each parameter in response to drought. Significance levels at: (*) p < 0.1; * p < 0.05; ** p < 0.01; n.d. = not determined; LRprim = long lateral roots with primary xylem; LRsec = long lateral roots with secondary xylem; ShR = short mycorrhizal roots.
Discussion
118
cxxv
enhanced during the dry August of 2003. As a response to drought, ShR of beech tended to
decrease SRA but maintained the ectomycorrhizal colonisation rate (EMycR). Symbiotic
association with the fungal partner represents a strong carbohydrate sink in the plant: up to
30% of the total photoassimilate production was found to be transferred to the fungal partner
(Nehls & Hampp, 2000). The plant, on the other hand, compensates for this carbohydrate
loss by increasing its photosynthetic capacity, enlarging the volume of exploited soil (via
fungal structures) and, by this, enhancing the exploration for nutrients (Agerer, 2001). In
response to drought, the carbohydrate demand of ShR in beech was enhanced, as a
considerable increase in sucrose concentration was detected in August of 2003 relative to
August of 2002. Simultaneously, root respiration of ShR was strongly reduced indicating less
growth in this fine-root category during drought (Fig. 37A). This finding was consistent with
Tibbett (2000) who suggested that root proliferation will become obsolete when roots are
colonized by ectomycorrhizal fungi (as fungal hyphae also proliferate into soil patches).
Because of their small size ectomycorrhizal hyphae are less expensive in construction than
fine roots in terms of C investment (Fitter, 1991) but require significant maintenance costs
(Andersen, 2003). Since beech allocates starch reserves during midsummer mainly into the
root system (Larcher, 1994), such a pattern of C partitioning apparently is advantageous for
producing and maintaining the ephemeral and mycorrhizal fine roots and their symbionts
during summer drought.
In summary, the construction of ephemeral-like fine-roots (as shown for LRprim) or
morphologically plastic ShR (with lowered SRA but retained EMycR) is interpreted as
metabolic feedbacks in beech for “optimising” the structure in response to drought. Such a
fine-root construction may allow beech to proliferate into nutrient-rich micro-sites. As a result,
the nutritional status of beech fine roots in terms of concentration of nitrogen was sustained
in beech during drought, perhaps indicating sustained N status of the whole plant. In addition
to the increased conversion of internal stores into new growth, the increased resource
uptake via constructing drought-induced ephemeral fine-roots may be another way by
which beech plant increases its fitness at low resource level (cf. section 1.1.1).
4.2.2 Spruce
In spruce growing under ambient ozone levels in mono sub-plots, the strong reduction of the
FRP and RT observed during 2003 compared to 2002 led to enhanced fine-root longevity of
remarkable 12.5 years. However, no changes in these fine-root parameters were observed in
spruce growing in mixture with beech. Nearly 80% of the fine-roots of spruce growing at
“Kranzberger Forst” were localized within the uppermost 15 cm of the soil (Mainiero, pers.
Discussion
119
cxxvi
comm.) where soil water was hardly available during June through September of 2003.
Apparently, sustaining the root biomass at such soil conditions (e.g. by enhanced transport of
assimilates to roots and stimulation of root proliferation) was not possible in the case of
spruce. Raised δ13C in newly formed fine roots during 2003 compared to 2002 indicate that
the reduced root growth during drought in spruce was accompanied by significant stomatal
limitation of photosynthetic CO2 uptake during assimilation period of 2003. Compared to
beech, spruce showed stronger correlation of δ13C in newly formed fine roots with the annual
precipitation (R2 = 0.80; cf. Fig. 28). These results indicate FRP of spruce to depend to a
larger extent on current assimilates than beech. On the other hand, during the dry summer of
2003 LRprim of spruce changed colour from white to brown due to suberization of cell walls in
the primary cortex (Fig. 15). Drought lowered the starch concentration of this fine-root
category, although carbohydrates in total were enhanced due to increased sucrose and
pinitol concentrations (Tab. 12). Both carbohydrate fractions deriving from recently fixed C
are important solutes which regulate the osmotic balance, protect membranes and serve as
carbohydrate depot during drought (Lambers et al., 1998). In addition, the K concentration of
LRprim was strongly enhanced in August of 2003 compared to levels in May of the same year.
The solute accumulation indicates biochemical adjustment of LRprim of spruce to drought.
Lipp & Andersen (2003) demonstrated lower respiration rate and lower sensitivity in
ponderosa pine to supply of current photosynthate in brown fine-roots compared to white
(non-suberized) fine-roots. Similarly, during August of 2003, brown LRprim of spruce showed
strong reduction in the respiration rate (RR) compared to June of 2003 so that RR dropped to
the level of LRsec. Since RR strongly relates to root growth rate (Lipp & Andersen, 2003), and
root growth rate defines the extent to which a plant explores soil for water and mineral
nutrients (Hsiao & Xu, 2000) water uptake through roots was apparently reduced in spruce.
In addition, Steudle (2000) points out the low cell hydraulic conductivity in roots to be
attributed to a high degree of suberization. In this way, the suberized cell walls of LRprim act
as a physical barrier to the movement of water and dissolved mineral nutrients into the plant.
This is consistent with the strongly reduced N concentration of LRprim during drought
(Tab. 14). At the same time, suberization which was concentrated in the root cortex should
reduce water loss from the root surface to the soil (cf. Taleisnik et al., 1999). Such
mechanism of decreasing resource loss (detected in the present study for spruce fine-
roots) is proposed by Chapin et al. (1987) to be a way for increasing plant fitness in the case
of limited resource supply.
In August 2003, osmotic adjustment such as enhanced sucrose content was detected also in
LRsec of spruce, however starch concentration decreased and total sugars remained at a
similar level as during moist August of 2002. Decrease of starch reserves apparently resulted
in low respiration rates in this fine-root category approaching levels of maintenance
Discussion
120
cxxvii
respiration. In addition, the enhanced K concentration in LRsec increased the drought
tolerance of this expensive and long-lived structure (i.e. LRsec showed the lowest SRA within
all fine-root categories). As response to drought, ShR of spruce significantly reduced SRA
and enhanced EMycR up to levels typical for the dormant season so that almost all root tips
were mycorrhized during drought. Mycorrhizal associations may enhance root lifespan and
resistance of fine-roots to drought (Eissenstat, 2002). The hyphae and rhizomorphs greatly
increase the volume of exploited soil (Agerer, 2001) and are shown to enlarge effectively the
phosphate-absorbing surface per unit C cost, despite the additional C demand of the fungus
(Lambers et al., 1998). Like in the other fine-root categories of spruce, drought enhanced
sucrose concentration of ShR at lowered fructose and glucose concentrations. Sucrose is
shown to be hydrolyzed to glucose and fructose and the resulting mono-saccharides are
taken up from the common apoplastic interface by both the fungal partner and root cortical
cells (Nehls & Hampp, 2000). This demand for photo-assimilates of highly mycorrhized fine-
roots in spruce apparently resulted in enhanced sucrose concentration and depleted fructose
and glucose concentrations in ShR. In addition, Langley et al. (2002) pointed out, that
mycorrhizal roots of regenerating shrub oaks tended to have a higher percentage of new C
than the corresponding non-mycorrhizal roots. In a mature deciduous forest in Switzerland,
Körner et al. (2005) found 64% of the newly fixed carbon to be allocated into mycorrhizal
fungi already by the end of the first year after applying δ13C labelling. If such a demand for
current assimilates also holds true for mycorrhizal roots in spruce, then, during periods of
restricted photosynthetic activity, spruce would allocate the new C mainly to ShR. Thereby,
the non-mycorrhized root tips will be neglected and the mycorrhized root tips will be
maintained, i.e. the density of mycorrhizal root tips will enhance as found in this study
(MycTD, see Fig. 42).
In summary, suberization of LRprim, shedding of non-mycorrhized root tips and maintenance
of ectomycorrhizatial colonisation on ShR are interpreted as “structural optimizations” of
spruce in response to drought (Pregitzer et al., 1993). This allows spruce to set their most
desiccation-sensitive fine-root category into dormancy and to sustain simultaneously soil
exploitation effectively through symbiotic associations. In spruce, nitrogen concentration
decreased by drought only in LRprim, whereas LRsec and ShR showed enhanced N relative to
the moist August of 2002. This indicates that the induced loss/reduction of metabolic activity
of LRprim during summer drought of 2003 was a decisive factor for the monitored strong
decline of the fine-root system in spruce in terms of reduced root extension growth (i.e. low
size increment).
Plant strategies to cope with drought involve stress avoidance and tolerance that vary with
genotype (Jackson et al., 2000). In addition, tolerance at one level (e.g., of the roots) may
allow drought avoidance at another (e.g., of the leaves) (Lambers et al., 1998). Data of the
Discussion
121
cxxviii
present study support evidence that stress avoidance and tolerance varied between the
different functional fine-root categories. The most drought-sensitive fine-root category of
beech, i.e. LRprim, showed drought-avoiding strategy via root shedding. Possibly, the
advantages of drought avoidance (i.e. high growth and uptake activity under favourable
conditions) are offset by the relatively low C costs of producing new ephemeral roots in
nutrient-rich zones or after even small events of rain. In contrast, ShR and LRsec of beech
(i.e. the more expensive fine-root categories in terms of C costs for structure) showed
increased tolerance to drought via physiological and biochemical adjustments. In spruce,
LRprim showed drought tolerance via entering into dormancy. As with ShR and LRsec, LRprim of
spruce has relatively high C costs of producing new roots and exhibits morphological and
physiological adaptations for drought tolerance or water conservation. Apparently, root
increment of LRprim occurs only after rains that are large enough to support growth. In
addition, above-ground stand characteristics such as annual stem diameter increment (SDI;
Wipfler, pers. comm.) indicated in beech a 35% decrease in SDI compared to the humid
2002, while FRP stayed unchanged relative to levels in the humid 2002. Compared with
beech, reductions in SDI on spruce were more pronounced in 2003 (65%, respectively), and
FRP was reduced by 70 %, relative to humid conditions in 2002 (Fig. 57). These results are
in consistency with the hypothesis of Grace (1990) that species with rapid growth and uptake
rates (i.e. beech) are more likely to be able to take advantage of nutrients when supplied in
pulses (i.e. during arid periods; James & Richards, 2006) than are species with low growth
and uptake rates (i.e. spruce) but tolerance of low resource levels.
4.2.3 Responses of beech and spruce to drought at the stand level
The maintenance of fine root biomass and symbiotic associations in beech, although being
costly in terms of carbon use for respiration, may be beneficial for beech in capturing water
upon re-wetting of the soil. This hypothesis is supported in the present study by the observed
differences in spatial distribution of newly produced fine-roots: compared to 2002, beech
tended to realize during dry 2003 the highest FRP at the densest and moistest parts of the
mono sub-plot. Similarly, Hodge (2004) observed morphological plasticity within root systems
in response to localized water and nutrient enrichment. However, Hartung (1996) noted the
progressive severity of drought to turn stimulation of root growth into inhibition, as found here
for less dense and dryer parts (apparently due to enhanced radiation and intense
evaporation) within the beech mono sub-plot. Stand density has high importance for root
functioning and, as a consequence, for whole-tree and stand performance when precipitation
becomes limiting. Results support and provide a physiological context to the finding of
Discussion
122
cxxix
Pretzsch (2005) that on sites with poor water and nutrient supply beech reacts with
increment reduction upon intense thinning.
During moist 2002, spruce but not beech increased fine-root production in the less dense
parts of the sub-plot, where SWC was shown to be higher. In consistency with the present
study, water uptake of soil underneath canopy gaps in spruce stands was found to be higher
relative to crown centres and edges (Zirlewagen & von Wilpert, 2001). However, during
extremely dry 2003, when water deficit underneath spruce extended through 75 days (cf.
Fig. 31), spruce strongly reduced FRP independent of the stand density. Hence, spruce root
systems responded to changes in soil water by strong decrease in FRP during drought years
and by increase of FRP during moist years. Root growth dynamics of this kind are regarded
as “opportunistic” (Pregitzer et al., 1993; Joslin & Wolfe, 1998), and result in large changes in
net root production when soil conditions vary from year to year. In summary, since drought
during 2003 persisted longer underneath spruce than beech (Fig. 31), the different extent of
soil water deficit supposedly resulted in contrasting physiological root responses in beech
and spruce, i.e. promotion versus inhibition of root growth, respectively. Hence, hypothesis (i)
formulated in this study (i.e. drought-induced limitation of C gain by the foliage results in
stimulation of compensatory fine-root production) was corroborated in case of beech, and
was rejected in case of spruce, when plants were growing under 1xO3.
In the mixed sub-plots, beech tended to produce more fine roots during dry 2003 at the parts
of the stand with lower tree dencity. During drought, spruce rather produced fine-roots at
dense stand parts, where water flux via stem flow into the soil apparently was enhanced
because of the close proximity to beech trees. In summary, the structure of the mixed sub-
plots allowed beech and especially spruce trees to sustain fine-root production during harsh
drought conditions in 2003. In this way, the below-ground response of competing plants to
water limitation was shown to depend on the type of competition, thus corroborating
hypothesis (v) for beech and spruce. In addition, the conclusion of Pretzsch (2004) is
supported that mixed stands are rather tolerant to changing site conditions and resilient upon
natural disturbances.
4.2.4 Drought effects on soil respiration components
4.2.4.1 Partitioning of total soil respiration (SRt) under spruce and beech as affected by
drought
During summer of 2003, when ASW was limited (75 days in spruce and 45 days in beech),
both SRt and SRh declined under beech and spruce, despite rising soil temperature. Similar
drought response of SRt is reported from Mediterranean mixed oak forest (Rey et al., 2002).
In the present study, the “autotrophic” soil respiration accounted for 41 to 58% of SRt under
beech, and for 25 to 60% of SRt under spruce which falls within the range of 22 to 70% as
Discussion
123
cxxx
reported for European forests (Epron et al., 1999; Janssens et al., 2001 & 2003). Underneath
beech, “autotrophic” soil respiration was reduced by drought to the same extent as was
“heterotrophic” soil respiration, since in 2003 no significant changes in the partitioning of SRt
occurred as compared to humid 2002/2004. Annual FRP under beech remained unchanged
by drought; however, indications of enhanced WUE during the CO2 assimilation period of
2003 were present (Fig. 28; cf. section 3.3). In woody plants, conductivity for water flow from
roots to leaves is approximated by the Hagen-Poiseuille law, i.e. proportionality to the fourth
power of the vessel diameter in the xylem (Lambers et al., 1998). Near 5% of the vessels in
the beech coarse roots (0.8 to 2 cm in diameter) have diameters between 50 and 100 µm,
and were responsible for more than 50% of the hydraulic conductance (Nikolova, unpubl.).
Such large vessels are successful for rapid water transport upon re-wetting of the soil. On
the other hand, large vessels have a high cavitation risk, which needs to be counteracted by
sensitivity in stomatal regulation to plant water status. At “Kranzberger Forst”, pre-dawn
water potential dropped in beech to extraordinarily low -1.4 MPa during 2003 (Löw et al.,
2006), although the daily minimum water potential did not fall below -2.0 MPa (consistent
with general observations in temperate forests; Larcher, 1994). This lower limit in minimum
water potential suggests that stomatal closure prevents cavitation (Tyree & Zimmermann,
2002) and – as a consequence – injury to photosynthesis. Högberg et al. (2002) reported
photosynthate to drive root respiration, which contributes to a large extent to the autotrophic
soil respiration (SRa). In addition to the sustained temperature sensitivity of root respiration
(RR) during drought (cf. the temperature response of RR in LRprim, Fig. 37), the correlation of
RR10I (i.e. the respiration rate of individual rootlets assessed at a standard temperature of
10°C) with the N content of the rootlets was high at all sampling dates during 2003. The high
correlation to N level confirmed the high metabolic activity of beech fine-roots during drought
(Burton et al., 2002) and simultaneously assured sustained contribution of SRa to SRt.
Under spruce, contrary to beech, the contribution of SRa to SRt was significantly reduced
during 2003 as compared to 2002/2004, which indicates a lower metabolic activity of roots
under drought conditions relative to that of free-living soil micro-organisms (i.e. SRh). Above-
ground, pre-down water potential measured in spruce (Löw, pers. comm.) dropped to
extraordinarily low -1.6 MPa during 2003, although the daily minimum water potential did not
fall below -2.0 MPa (similar values were reported for beech; Löw et al., 2006). Other
evergreen coniferous species (Abies lasiocarpa and Juniperus monosperma) were reported
by Pockman et al. (1995) to induce cavitation only at -3.5 MPa due to their small tracheid
diameters. Similarly, in spruce coarse roots more than 90% of the vessels had diameter less
than 30 µm (Nikolova, unpubl.). Vessels with narrow diameters have the disadvantage of low
hydraulic conductance but are less vulnerable to drought and freezing-induced cavitation
(Lambers et al., 1998). According to the wood density of spruce (i.e. 450 kg m-3; Fromm et
Discussion
124
cxxxi
al., 2001) stem water storage of spruce is estimated to make up about 50% of the fresh
biomass (Lambers et al., 1998). In contrast to beech, the lower limit in daily minimum water
potential of -2.0 MPa suggests in spruce that stomatal closure and partial dormancy of fine-
roots may serve rather to decrease water loss from tree water pool in stems and coarse roots
than to prevent the vessels with relatively small diameters from cavitation. Similarly as in
beech, stomatal closure in spruce can limit the photosynthesis. Since photosynthate drive
root respiration (Högberg et al., 2002; Bond-Lamberty et al., 2004), the decline of SRa
underneath spruce in 2003 was probably caused by reduced belowground C allocation rather
than soil properties (e.g. Ts, SWC). This is confirmed by a tree girdling experiment (Högberg
et al., 2001) as the seasonal pattern of photosynthesis was more important than soil
temperature in determining „root-mycorrhizal“ respiration (i.e. SRa). Obviously, the absence
of a temperature response in SRa during May-June 2003 may be interpreted as a decline of
RR to the level of maintenance respiration, required to maintain the existing fine-root
biomass. In contrast to beech, spruce fine-roots displayed weak correlation of RR10I during
August of 2003 with the N level, apparently indicating dormancy during this month. In
addition, prolonged drought may cause higher mortality within the shallow fine-root system in
spruce, as shown for peach and grape fine roots growing closely underneath the soil surface
(Wells et al., 2002; Anderson et al., 2003). Restricted root respiration and enhanced fine-root
mortality were reflected during 2003 by hysteresis in the time course of the temperature
response of SRa underneath spruce (Fig. 33).
4.2.4.2 Parameterisation for SRa and SRh modelling
The exponential response function of SRa and SRh to Ts, and the higher temperature
sensitivity of SRa compared to SRh (as expressed by Q10) which determined modelling in both
tree species corroborated hypothesis (iv), i.e. that SRa and SRh differ in their response to
changing Ts and SWC, with higher sensitivity reflected in SRa. This is consistent with findings
of Epron et al. (2001) that indicate higher Q10 in SRa than SRh, probably reflecting the
seasonality in shoot and root metabolic activities (Boone et al., 1998; Davidson et al., 2006).
In spruce, the relationship between Ts and SRa changed during 2003: SRa at 10°C (i.e.
coefficient a) declined significantly between June and October 2003, while the Ts sensitivity
of SRa (i.e. coefficient b) remained unchanged in relation to 2002/2004. The reduction in SRa
at 10o C was apparently related to the reduction in standing fine-root biomass that occurred
at the same time. In contrast, SRa in beech did not differ at 10°C between humid and dry
conditions, being consistent with sustained root standing biomass, while the sensitivity of SRa
to Ts decreased under drought. The difference in species-specific Ts/SRa response
relationships suggested physiological plasticity in beech fine roots compared to
morphological plasticity via root loss in spruce (Hodge, 2004).
Discussion
125
cxxxii
The moisture dependence of SRa10 was more pronounced in spruce than beech across the
entire range of ASW. However, the bimodal relationship between SRh10 and ASW was
species-independent, and the break-points of these relationships differed between beech
and spruce. Examining the effects of moisture regimes in soils of different texture on the
microbial activity, Schjønning et al., (2003) showed that CO2 evolution was stimulated by
increasing SWC, reaching a plateau with the break-point being determined by soil porosity,
i.e. CO2 evolution was found to increase by high porosity. “Kranzberger Forst”, porosity within
the uppermost 10 cm of the soil was higher underneath beech than spruce (0.57 m3 m-3 and
0.45 m3 m-3, respectively; after Schuhbäck, 2004). Hence, the species-related break-points
found in the present study were consistent with differences in soil porosity.
The correction factor L (accounting for respiratory stimulation upon autumnal leaf litter
production) enhanced modelling precision of SRa and SRh by 6 and 8%, respectively. As soil
micro-organisms are typically C-limited, they rapidly respond to changing supply of
decomposable substrate, unless limited by other factors (Zak et al., 1994; Ekblad &
Nordgren, 2002). Also, incorporation of soluble C and nutrients from freshly fallen leaf litter
into the soil may promote the growth of fine roots and ectomycorrhizal mycelium in beech,
altering SRa (cf. Wallander et al., 2001).
4.2.4.3 Intra-annual variation in SRa and SRh
SRt underneath beech (789 to 945 g C m-2 a-1) and spruce (613 to 928 g C m-2 a-1) were
within the range reported from European forests (760 + 340 g C m-2 a-1, Janssens et al.,
2001). Although broad-leaved deciduous and coniferous forests differ substantially in their
nutrient-cycling characteristics, Raich & Potter (1995) did not find apparent differences with
respect to CO2 efflux. This was consistent with the findings at “Kranzberger Forst” in water
non-limited 2002. The drought of 2003, however, reduced SRt in both species, despite similar
mean annual Ts throughout the three years (cf. Tab. 9). By this, hypothesis (iii) that drought
reduces the CO2 efflux from the soil was confirmed in both beech and spruce soils. The
relation between SRa, SRh, and annual means of Pan, Tair, TGR (total global radiation) and
stand characteristics (e.g. annual stem diameter increment = SDI; Wipfler, pers. comm.)
indicated that only SRa was dependent on tree species (Fig. 57). In beech, the decline of SRa
in 2003 by about 15% was paralleled by a 35% decrease in SDI, while FRP stayed
unchanged relative to levels in the humid 2002. In spruce, reductions in SRa and SDI were
more pronounced in 2003 (50 and 65%, respectively), and FRP was reduced by 70 %,
relative to humid conditions compared with beech. This decline in spruce supports the
hypothesis of Grime (1979; after Hodge, 2004) that morphological adjustments are more
costly than physiological adjustments in response to stress, such that only beech was able to
recover in SRa and SDI to pre-drought levels during 2004. The results indicate that mixed
Discussion
126
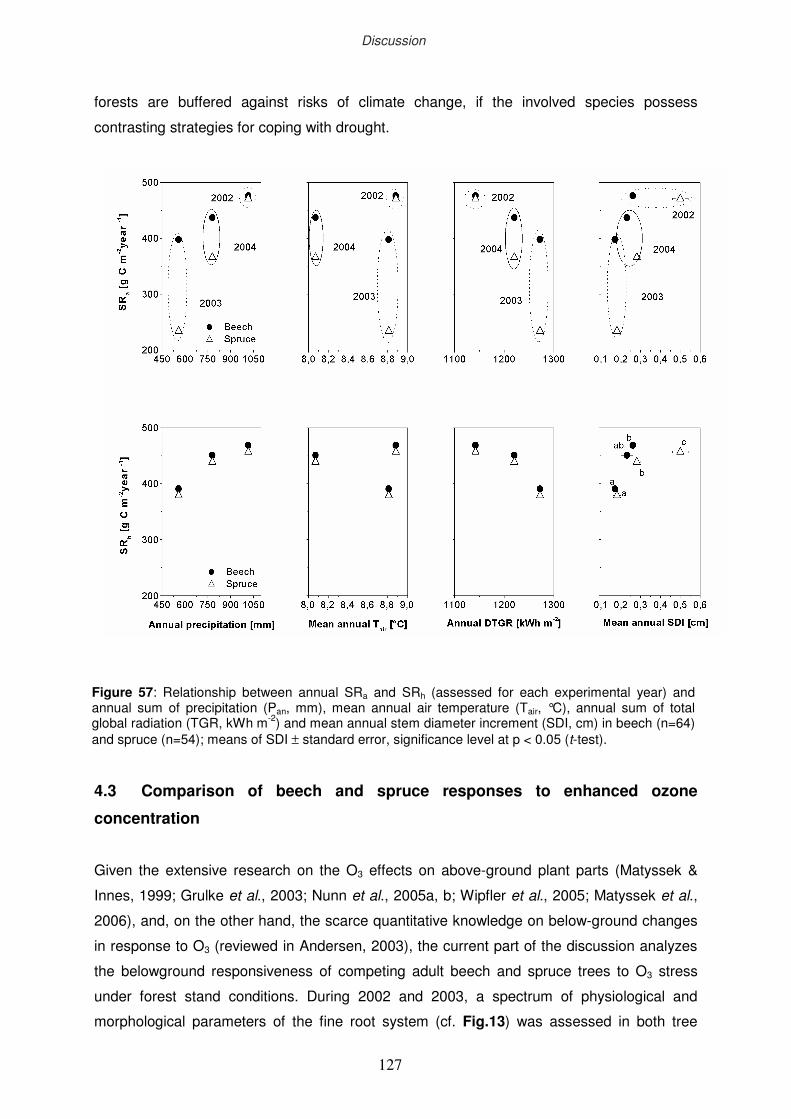
cxxxiii
forests are buffered against risks of climate change, if the involved species possess
contrasting strategies for coping with drought.
4.3 Comparison of beech and spruce responses to enhanced ozone
concentration
Given the extensive research on the O3 effects on above-ground plant parts (Matyssek &
Innes, 1999; Grulke et al., 2003; Nunn et al., 2005a, b; Wipfler et al., 2005; Matyssek et al.,
2006), and, on the other hand, the scarce quantitative knowledge on below-ground changes
in response to O3 (reviewed in Andersen, 2003), the current part of the discussion analyzes
the belowground responsiveness of competing adult beech and spruce trees to O3 stress
under forest stand conditions. During 2002 and 2003, a spectrum of physiological and
morphological parameters of the fine root system (cf. Fig.13) was assessed in both tree
Figure 57: Relationship between annual SRa and SRh (assessed for each experimental year) and annual sum of precipitation (Pan, mm), mean annual air temperature (Tair, °C), annual sum of total global radiation (TGR, kWh m-2) and mean annual stem diameter increment (SDI, cm) in beech (n=64) and spruce (n=54); means of SDI ± standard error, significance level at p < 0.05 (t-test).
Discussion
127
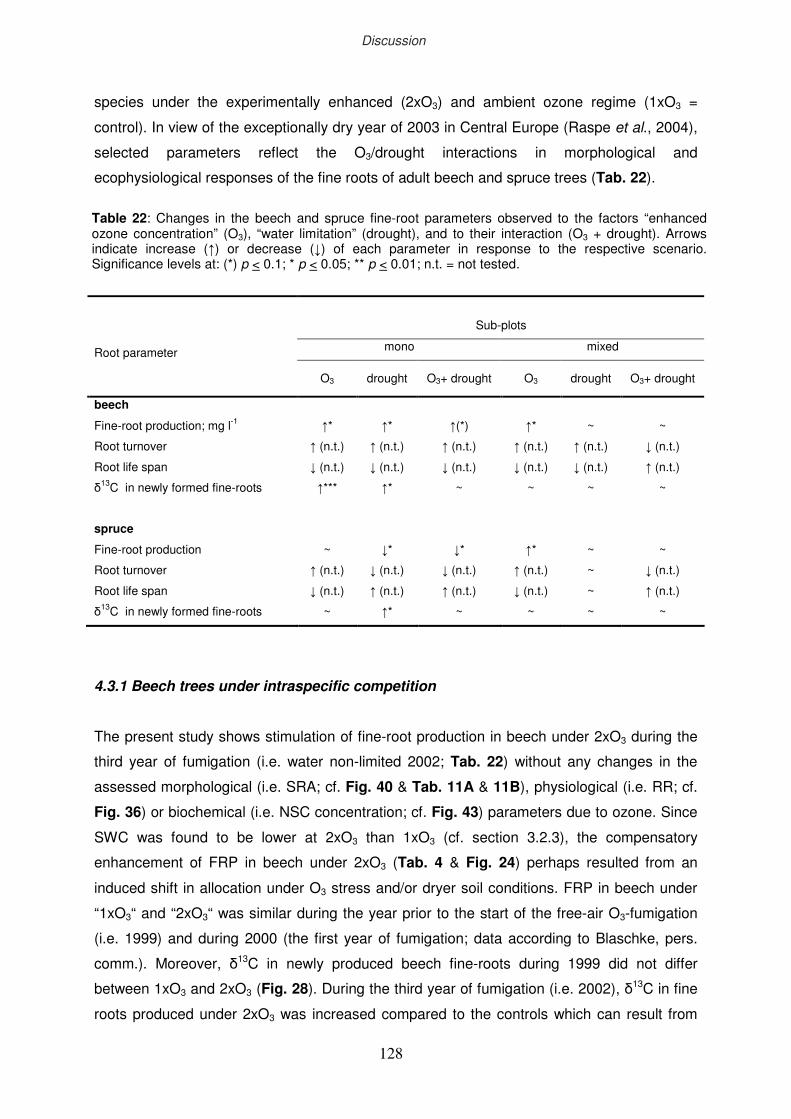
cxxxiv
species under the experimentally enhanced (2xO3) and ambient ozone regime (1xO3 =
control). In view of the exceptionally dry year of 2003 in Central Europe (Raspe et al., 2004),
selected parameters reflect the O3/drought interactions in morphological and
ecophysiological responses of the fine roots of adult beech and spruce trees (Tab. 22).
Sub-plots
mono mixed
Root parameter
O3 drought O3+ drought O3 drought O3+ drought
beech
Fine-root production; mg l-1
Root turnover
Root life span
δ13C in newly formed fine-roots
spruce
Fine-root production
Root turnover
Root life span
δ13C in newly formed fine-roots
↑*
↑ (n.t.)
↓ (n.t.)
↑***
~
↑ (n.t.)
↓ (n.t.)
~
↑*
↑ (n.t.)
↓ (n.t.)
↑*
↓*
↓ (n.t.)
↑ (n.t.)
↑*
↑(*)
↑ (n.t.)
↓ (n.t.)
~
↓*
↓ (n.t.)
↑ (n.t.)
~
↑*
↑ (n.t.)
↓ (n.t.)
~
↑*
↑ (n.t.)
↓ (n.t.)
~
~
↑ (n.t.)
↓ (n.t.)
~
~
~
~
~
~
↓ (n.t.)
↑ (n.t.)
~
~
↓ (n.t.)
↑ (n.t.)
~
4.3.1 Beech trees under intraspecific competition
The present study shows stimulation of fine-root production in beech under 2xO3 during the
third year of fumigation (i.e. water non-limited 2002; Tab. 22) without any changes in the
assessed morphological (i.e. SRA; cf. Fig. 40 & Tab. 11A & 11B), physiological (i.e. RR; cf.
Fig. 36) or biochemical (i.e. NSC concentration; cf. Fig. 43) parameters due to ozone. Since
SWC was found to be lower at 2xO3 than 1xO3 (cf. section 3.2.3), the compensatory
enhancement of FRP in beech under 2xO3 (Tab. 4 & Fig. 24) perhaps resulted from an
induced shift in allocation under O3 stress and/or dryer soil conditions. FRP in beech under
“1xO3“ and “2xO3“ was similar during the year prior to the start of the free-air O3-fumigation
(i.e. 1999) and during 2000 (the first year of fumigation; data according to Blaschke, pers.
comm.). Moreover, δ13C in newly produced beech fine-roots during 1999 did not differ
between 1xO3 and 2xO3 (Fig. 28). During the third year of fumigation (i.e. 2002), δ13C in fine
roots produced under 2xO3 was increased compared to the controls which can result from
Table 22: Changes in the beech and spruce fine-root parameters observed to the factors “enhanced ozone concentration” (O3), “water limitation” (drought), and to their interaction (O3 + drought). Arrows indicate increase (↑) or decrease (↓) of each parameter in response to the respective scenario. Significance levels at: (*) p < 0.1; * p < 0.05; ** p < 0.01; n.t. = not tested.
Discussion
128
cxxxv
raised WUE (i.e. through lowered gs) or increased phosphoenol pyruvate carboxylase
(PEPC) activity in fumigated beech trees (Matyssek et al., 1992; Saurer et al., 1995). Another
possible source of variation is that δ13C is higher at the bottom than at the top of the canopy
due to the contribution of 13C-depleted CO2 from soil respiration (Medina & Klinge, 1983; cf.
Lambers et al., 1998). For beech trees growing at “Kranzberger Forst”, Löw et al., (2006)
reported the levels of gs to be significantly reduced (under water non-limited conditions during
2004) in 2xO3 compared to 1xO3 regime, which was interpreted as a result of reduced cell
wall lignification of the stomata or disturbed osmotic control of the guard cells upon
membrane impairment. In addition, ozone had a negative effect on PEPC activity in sun
leaves under 2xO3 (Löw et al., 2005) which should rather decrease than increase δ13C, as
found in this study. Therefore, the elevated δ13C in fine-roots rather reflected raised WUE in
fumigated beech trees than alteration in the enzymatic activity of C uptake.
The stimulated FRP which was found in beech at 2xO3 during 2002 (i.e. the third year of
fumigation) can result from nutrient or water depletion that occurs as a result of changed root
biomass under O3 stress (Andersen, 2003), or can be driven by phytohormones (Lambers et
al., 1998). Grebenc et al. (2005) report from the same experimental site a doubled total
cytokinin concentration in fine root samples of fumigated trees, also higher ectomycorrhizal
diversity and higher total number of mycorrhizal fine root tips. All these findings correspond
to the higher turnover of fine roots reported in this study. In addition, enhanced fine-root
turnover and reduced longevity of fine-roots accompanied the stimulated fine-root growth in
beech under 2xO3. Such changes can alter rhizodeposition and nutrient and soil carbon
cycling under O3-fumigated beech trees. The ozone-induced increase in fine-root turnover
(near 2.5 times relative to the control sub-plot) leads to increased N release due to an
increasing amount of dying roots. Based on 15N-tracer experiments in forests under
temperate climate, Gebauer & Ehleringer (2000) pointed out that broadleaf stands show
higher nitrification rates and can utilize a greater fraction of the throughfall N deposition
compared to coniferous forests. Broadleaf stands also show a considerably higher nitrate
assimilation capacity and faster transport of the N to above-ground compartments. This
finding indicates that the higher N release due to increase in below-ground C allocation and
simultaneously enhanced fine-root turnover may result in faster internal cycling of N in O3-
exposed beech trees. Similarly, in their conceptual model for assessing both singular and
combined effects on plants raised under various nutrient supplies and O3 regimes, Greitner &
Winner (1989) found a shift in optimum nutrition (i.e. N) for growth of Salix nigra to high
supply as O3 concentrations increased. Nitrogen can be used for growth but also for
synthesis of secondary metabolites or repair processes in response to ozone (Kytoviita et al.,
2001). In addition, greater N input into the soil may increase rates of decomposition by
altering the activity of free-living soil micro-organisms (Andersen, 2003) and accelerate the
Discussion
129
cxxxvi
mineralization process. In summary, the capacity to ensure sufficient nutrient supply for
faster internal cycling via enhanced C allocation into fine-roots may be the strategy in beech
to cope with ozone stress. In support of this finding, based on the data from three
experimental years (i.e. 2002, 2003 and 2004), no significant O3 effect on stem diameter
increment (considered as a stress sensitive variable; Dittmar et al., 2003) was detected in
beech trees (Wipfler et al., 2005).
In general, ozone is known to alter the source-sink balance in plants, resulting initially in
carbon retention in shoots and decreased carbon allocation below-ground (Matyssek et al.,
1992; Matyssek & Sandermann, 2003; Andersen, 2003). The study of Löw et al. (2006)
conducted at the same experimental trees, detected significantly reduced net CO2 uptake
(under water non-limited conditions) under 2xO3, indicating limited carbon gain by the foliage,
as caused by O3 stress. Hence, hypothesis (i) formulated in this study (i.e. O3-induced
limitation of C gain by the foliage results in stimulation of compensatory fine-root production;
cf. section 4.2.1) was corroborated in the case of beech when growing in monoculture under
water non-limited conditions.
During 2003, drought alone or in combination with O3 (i.e. “O3+drought”) influenced beech
fine-root dynamics in a similar way as was found for the ozone impact alone (Tab. 22). For
beech growing in monoculture, this resulted in corroboration of hypothesis (i) in the case of
“water limitation” (i.e. drought-induced limitation of C gain by the foliage results in stimulation
of compensatory fine-root production). However, the ozone effect on δ13C of newly formed
beech fine-roots disappeared under “O3+drought” which indicated drought to overrule the
ozone impact on C uptake. In support of this view, Löw et al. (2006) point out (for the same
study trees at “Kranzberger Forst”) that the difference in gs between both O3 regimes
vanished during the dry period of 2003.
4.3.2 Spruce trees under intraspecific competition
In spruce fine-roots, no morphological (i.e. SRA; cf. Fig. 40 & Tab. 11A & 11B), physiological
(i.e. RR; cf. Fig. 36) or biochemical (i.e. NSC concentration; cf. Fig. 43) responses were
detected to sensitively respond to O3. No compensatory fine-root production occurred under
2xO3, however RT was moderately enhanced and, respectively, RL was moderately reduced
by O3 during water non-limited 2002 (Tab. 22). In addition, δ13C of newly-formed fine roots in
spruce was not altered by O3, reflecting responsiveness that differed from that in beech.
Discussion
130
cxxxvii
Since ozone mainly acts at the leaf level upon uptake through stomata into the mesophyll
and only indirectly affects other tree organs, stomatal behaviour has a crucial role in
regulating O3 uptake (Matyssek et al., 1995). In twigs of spruce trees fumigated with ozone
the irregular and delayed stomatal closure was found to result in a quotient of water uptake
to water loss of < 0.5 or lower, depending on the degree of injury (Maier-Maercker & Koch,
1991). The cited study highlights the long-term effects of O3 pollution as a specific
disturbance of plant water relations: The O3-fumigated needles of spruce showed lower
lignification in the walls of the stomatal apparatus, which results in malfunction of the stomata
in response to dry air. In the present work, the unchanged δ13C of newly formed fine-roots in
spruce indicate unchanged WUE under 2xO3. However, WUE (i.e. δ13C) may stay
unchanged, if adjustment between photosynthesis and gs occur (Lloyd & Faraquhar, 1994),
i.e. if photosynthesis in spruce declines in proportion to a decrease in gs. In general, conifers
(except for Larix) have lower gs and photosynthetic rates, and thus lower O3 uptake rates of
O3 than hardwood trees (Matyssek, 1986). However, based on the data from three
experimental years (i.e. 2002, 2003 and 2004; “Kranzberg Forst” site) Wipfler et al. (2005)
registered negative influence of ozone exposure on SDI (i.e. stem diameter increment) in
spruce trees growing under 2xO3 (in parallel, SDI of beech trees had remained unaffected).
The O3-induced reduction of stem growth in trees (Karnosky et al., 2001) was found to be
mediated by reduction in CO2 assimilation (Matyssek et al., 1992; Grulke et al., 2002), or
lowered C allocation to roots (Grulke et al., 1998) and their symbionts (Kytöviita et al., 2001).
At the same time, the C demand of the O3-exposed leaves can be significantly enhanced for
detoxification and repair (Matyssek & Sandermann, 2003) which may require rising N
demand in the leaves (Greitner & Winner, 1989; Kytöviita et al., 2001). Since nutrient
“foraging” mediated through enhanced root turnover is costly in spruce (cf. section 4.2.2), the
increase in N uptake may be achieved in this tree species at unchanged FRP (Tab. 22) but
increasing uptake surface via enhanced ectomycorrhizal colonization (Smith & Read, 1997).
The external mycelium of mycorrhizae was found to be the dominant pathway through which
C entered the soil organic matter (SOM) pool even exceeding the input via leaf litter and fine-
root turnover (Godbold et al., 2006), being a significant C sink in the tree. For spruce trees
growing in mono-culture the O3-induced decrease in SDI (Wipfler et al., 2005) may relate
rather to the enhanced C costs for the root symbiotic partner (i.e. enhanced C investment
into structure and maintenance of such structure) than to the enhanced C costs for the fine-
roots itself. However, the present study was concentrated on the analysis of O3-induced
reactions in the fine-root system of trees and not in fine-root symbiotic associations. The
results indicate in spruce that no compensatory fine-root production occurred under 2xO3,
thus rejecting hypothesis (i) for spruce growing in mono-culture under water non-limited
conditions.
Discussion
131
cxxxviii
During 2003, drought induced in spruce responses contrasting to those caused by ozone
(Tab. 22). Consistent with the drought-provoked reactions described on the levels of “fine-
root category” and “individual rootlet” (see section 4.2.2), parameters at the “stand level”
(Tab. 22) indicated acclimation of the root system (dormancy) and – as a consequence -
lowered nutrient cycling in the soil as during drought. Remarkably, the drought effect on δ13C
of newly formed fine-roots during 2003 was smaller in spruces growing under 2xO3 than 1xO3
(Fig. 28). Since ozone can induce defence reactions in leaves similar to those caused by
drought (Matyssek et al., 2006), the observed marginal changes in WUE of the spruce trees
growing at 2xO3 to drought may have resulted from “hardening” of the evergreen leaves
caused by the 3-year-long chronic ozone fumigation.
4.3.3 Beech and spruce trees under interspecific competition
In comparison to fine-root reactions of beech and spruce trees from monocultures, only
spruce from mixed sub-plots showed reaction to ozone under water non-limited conditions
(enhanced FRP in 2002 under 2xO3; Tab. 22). Fine-root parameters of beech from mixed
sub-plots to O3 were similar to those in response to drought; however no compensatory FRP
was detectable under water limitation. Remarkably, spruces growing in mixture, showed no
significant response to drought in any of the studied parameters. One possible explanation
may be the positive influence of beech on water and nutrient cycling in mixed stands,
however the extent of this influence is strongly site-specific (Rothe et al., 2002; Armbruster et
al., 2004). Apparently spruce which is more efficient in water uptake within the upper soil
horizons relative to beech (see efficiency ratio of space exploitation; Fig. 54), gained rain
water (supplied by short showers during the growing season of 2003; Fig. 21) before it could
infiltrate into deeper horizons rooted mainly by beech. In addition, the organic layer which is
thicker and more hydrophobic due to admixed needles at mixed sub-plots (Schuhbäck, 2004)
may reduce water inflow into the soil due to enhanced evaporation. Such an evaporative loss
is high especially after short rain events during hot summer days. Severity of drought can
arise for beech trees growing in mixture with spruce; in contrast, spruce seems to profit from
neighbouring beech.
Beech and spruce trees growing in mixture at “drought+O3” conditions reacted with lower root
turnover and sustained FRP (Tab. 22), indicating in both tree species the synergism of both
factors to lower internal cycling of nutrients (i.e. N). Since N has a crucial role in
detoxification and defence processes, it can be hypothesised that the prolongation of the
“drought+O3” period may result in exhaustion of stress capacity in trees of mixed sub-plots.
Under predicted “global change” scenarios (i.e. regional increase of drought, enhanced
Discussion
132
cxxxix
tropospheric ozone concentrations, altered precipitation pattern; Ciais et al., 2005) the
interspecific competition of beech and spruce has the potential to arise the severity of the
complex unfavourable conditions (i.e. “drought+O3”).
4.3.4 Total soil respiration
During both study years (i.e. 2002 and 2003), 2xO3 significantly increased total soil
respiration rate (SRt) independent of the tree species or type of competition (Fig. 29), thus
confirming hypothesis (iii) (i.e. ozone exposure enhanced the CO2 efflux from the soil) and
rejecting hypothesis (v) (i.e. the responses of beech and spruce plants to O3 stress depend
on type of competition). In addition, fine-root density did not appear to affect the response of
SRt to ozone in any sub-plot. In the free-air CO2 and O3 enrichment experiment with aspen
Pregitzer et al. (2006) found the greatest rates of SRt to occur in the interaction treatment
(CO2+O3), although SRt was lowest at elevated O3. Similarly, O3 exposure was found to
significantly disrupt CO2 release from soil and roots of ponderosa pine seedlings (Scagel &
Andersen, 1997). In a supplementary study Andersen & Scagel (1997) reported on the
nutrient availability to alter the belowground respiratory response to O3, such that the
response to O3 was greatest at low nutrient supply. Since SRa accounted for 41 to 58% of
SRt under beech and for 25 to 60% of SRt under spruce (Fig. 30), changes in root biomass
and activity (mirrored by their respiration rates and allocated assimilates; Högberg et al.
2002) may be expected to be reflected in SRt. However, in the present study, root biomass
was enhanced under 2xO3 only in beech, whereas RR and NSC concentrations in fine roots
of beech and spruce appeared to stay unaffected by O3 (Figs. 36 & 43). The latter findings
are in conflict with observations of decreased RR and NSC by O3 (Grulke et al., 2001;
Andersen, 2003). The positive effect of O3 on SRt detected in the present experiment may be
explained by stimulation of the rhizospheric activity, e.g. changes in the ectomycorrhizal
network (ECM; see for beech in Grebenc et al., 2005) and/or stimulation of free-living soil
decomposers. Such organisms use root exudates or plant detritus as C source (Coleman et
al., 2004). Since their activity is typically C-limited, they rapidly respond to changing supply of
decomposable substrate, unless limited by other factors (Zak et al., 1994; Ekblad &
Nordgren, 2002). In a short-term 14CO2 pulse and chase experiments in wheat seedlings,
McCrady & Andersen (2000) found out that the increase in soluble root exudation under O3
resulted in enhanced microbial activity in the rhizosphere. At “Kranzberger Forst” Grebenc et
al. (2005) reported for beech on enhanced diversity of ECM fungi and higher total number of
mycorrhizal fine roots in the O3-fumigated plots as compared to the control. This shift in the
mycorrhizal community was supposed to induce shift in fine root turnover (Grebenc et al.,
2005), which was supported in the present study for beech and spruce at mono and mixed
Discussion
133
cxl
sub-plots under 2xO3 (Tab. 22). Enhanced decomposition of dead fine roots and mycorrhizal
network was found to stimulate the growth of new fine roots and ectomycorrhizal mycelium
(Wallander et al., 2001) which apparently led to enhanced SRt at O3-fumigated sub-plots. In
addition, ozone can cause high nutrient content in leaf litter via incomplete N remobilization
from the foliage (Matyssek et al., 1993) which may result also in increased rates of
decomposition. In summary, the pathway through which O3 alters carbon flux to/from soil
may be enhanced rhizodeposition by: (1) increased root exudation and microbial activity in
the rhizosphere along active root apices (similarly found in a phytotrone experiment with
beech/spruce mixed cultures; cf. Pritsch et al., 2005), (2) enhanced diversity of ECM,
enlarged mycorrhizal network and turnover (Grebenc et al., 2005), and (3) enhanced fine-
root production and turnover (present study). These below-ground responses may increase
the supply of substrates, and, thus, the respiration activity of soil decomposers.
Statistical analysis (Fig. 29) showed a significant effect of the “year” (factor “year” reflects the
effect of climate conditions on SRt during the experimental years 2002, water non-limited, or
2003, dry) on SRt only in beech at the mono sub-plot. “Year” tended to influence SRt
underneath spruce at the mono sub-plot, and showed no effect on SRt in mixture. However,
the O3 impact on SRt was independent of the climatic differences between both study years
and remains the primary factor which determined enhanced SRt even during the harsh
drought of 2003. In the context of “global change” scenarios predicting increase of O3 levels,
the results from the case study in “Kranzberger Forst” indicate that forests with beech and
spruce, independent of the type of competition, have the capacity to enhance soil C efflux
into the atmosphere.
4.4 Belowground efficiency ratios of tree competitiveness
Quantitative assessments of the space-related cost/benefit relationships such as space
occupation, space exploitation and “running costs” (cf. section 1.1.3 & Grams et al., 2002)
were used as measures of the below-ground competitive ability of adult beech and spruce
forest trees. The present study focuses on space occupation and water uptake which occurs
along resource gradients within soil space (as assessed by organic and mineral soil sub-
samples; cf. section 2.7). Free-air ozone fumigation at the crown level was used in the
present study as an experimental tool to provoke the belowground responsiveness of both
competitors in allocation to disturbance under closed stand canopy conditions.
Discussion
134
cxli
4.4.1 Beech vs. spruce
Independent of the type of competition, the competitive below-ground advantage of beech
within the uppermost 20 cm of the soil was indicated by higher efficiency of space occupation
(BSO: occupied soil volume per C investment into mean standing biomass). When focusing
on the efficiency ratios along resource gradients within the soil, beech was more efficient in
BSO within the organic (O+Ah) soil sub-sample, whereas spruce had higher efficiency of
BSO within the mineral B soil sub-sample independent of growing in mixed or mono-culture
(Fig. 53). The efficiency in below-ground space occupation was determined by the species-
specific factor kc: beech fine roots showed a larger zone of influence (reflected in high factor
kc) within the organic soil sub-sample (O+Ah) compared to spruce, which had larger kc within
the mineral soil sub-sample B (Tab. 18). In beech, the difference in the factor kc between
(O+Ah) and B was found to relate to SRL assessed in fine-roots from both soil sub-samples
(Fig. 52). Beech occupied the organic soil sub-sample by forming thinner fine roots with
higher SRL (i.e. less investment into biomass per unit root length) as compared to the fine-
roots from the mineral soil. This shows a morphological adjustment/plasticity in beech fine-
roots along the studied resource gradient. Spruce showed differing kc in both soil sub-
samples, but contrasting with beech, displayed unchanged SRL along the soil gradient (Fig.
52 & Tab. 18). Since no morphological adjustment to the resource supply was detected in
spruce fine-roots, the enlargement of the “zone of influence” within B (as indicated by higher
kc within this soil sub-sample) probably profited from the higher mycorrizal biomass and its
extending network within the mineral soil. This conclusion is supported by the diversity of
ECM species (Agerer & Göttlein, 2003) and/or associated soil exploration types that changed
from a short to medium-distance range (Baier, 2006). Similar mechanism (i.e. to sustain the
occupied soil volume at lower construction costs by means of symbiotic associations) was
previously described for spruce as a possible response to drought stress (for more details
see section 4.2.2). In summary, the efficiency ratio of BSO indicated habitat partitioning in
root growth between both tree species. According to Gersani et al. (2001) such “ownership”
of space allows plants to favour efficiency rather than speed of uptake when developing its
root mass, architecture, and uptake kinetics. Similarly, a high degree of segregation (i.e.
clustering) was shown for coarse-root systems of beech and spruce by Schmid & Kazda
(2005): Regardless of soil property, significantly higher clustering of beech roots suggested
higher efficiency in below-ground space acquisition than in spruce.
Within the uppermost 20 cm of the soil, beech showed higher efficiency in space exploitation
(BSE: daily mean water uptake per occupied soil volume) relative to spruce. This competitive
advantage of beech was found at both mono and mixed sub-plots. Resource uptake, which is
the mechanism through which plants influence soil resource availability, can be affected by
Discussion
135
cxlii
the amount and spatial distribution of resource-acquiring organs (i.e. for nutrient ions with low
diffusive supply; Raynaud & Leadley 2004), but also by aboveground characteristics, such as
transpiration capacity (i.e. in the case that nutrients are primary supplied by mass flow;
Schulze et al., 1994). When focusing on the efficiency ratio of BSE along resource gradients
within the soil, spatial segregation of beech and spruce fine-roots within differing soil sub-
samples resulted in decreased competition for water: Spruce was more efficient within the
organic (O+Ah), whereas beech was more efficient within the mineral B soil sub-sample. In
addition, Bernston (1994) suggests features of root architecture, such as SRL or branching
pattern, to substantially determine the exploitation capacity of roots. In beech, high SRL were
accompanied by high efficiency in BSO, but low efficiency in BSE, and vice versa. In
contrast, the conservative morphology of spruce fine-roots (reflected by similar SRL within
both soil sub-samples) neither related to changes in BSO nor BSE within the soil profile
(Tab. 19). Overall, based on the studied fine-root parameters, the present investigation
provided evidence in support of the suggestion by Fitter (1991) that it is not possible to derive
a simple analytical relationship between root system architecture and resource acquisition
due to the complex spatial arrangement of roots within the soil.
Competitive advantage of beech over spruce is not indicated in mono and mixed sub-plots
when comparing the efficiency ratios of “running costs” (BRC: occupied soil volume per
seasonal fine-root respiration). The reason is the nearly 50% higher species-specific
respiration rate in beech than spruce, which led to comparable maintenance costs in both
competitors within the uppermost 20 cm of soil, although beech possessed a lower standing
fine-root biomass as compared to spruce. This is consistent with similar annual SRa in beech
and spruce (cf. non-limited 2002/2004; Tab. 6 & 9). Along the soil profile, the efficiency ratio
of BRC displayed a response pattern similar to BSO and contrasting with BSE: Beech
occupied more soil volume per unit C invested in respiration within (O+Ah) soil sub-sample,
whereas spruce was more efficient within B soil sub-sample.
4.4.2 Ozone impact
Beech was more efficient in BSO and BSE than was spruce at both mono- and mixed sub-
plots under 1xO3 (Fig. 56 & Tab. 20). However, the disturbance through elevated O3
enhanced investments of beech into fine-root structure and their maintenance, which led to
lowered efficiency of beech in BSO and BRC under 2xO3 (BSE was determined at 1xO3
only). Spruce, in contrast, showed similar C costs in occupation of below-ground space
under both O3 regimes and types of competition, corroborating – for this species –
hypothesis (ii) and rejecting hypothesis (v). This indicates, within the soil depth of 20 cm, the
competitive advantage of beech over spruce in terms of occupied below-ground space per
Discussion
136
cxliii
unit invested C to vanish under chronic O3-fumigation independent of the type of competition
so that hypothesis (v) is rejected in the case of beech. However, calculation of BRC in the
present study does not account for the maintenance costs for symbiotic associations in any
of both competitors. In beech growing at “Kranzberger Forst”, Grebenc et al. (2005) found an
enhanced diversity of ECM fungi and higher total number of mycorrhizal fine-roots under
2xO3. In addition to the stimulated fine-root production under 2xO3, the O3-enhanced activity
of the symbiotic associations apparently contributed to the higher CO2 efflux from soils, which
may contribute to the altered BRC of beech at O3-fumigated sub-plots. Also in spruce, the
higher CO2 soil efflux under 2xO3 at unchanged standing fine-root biomass (cf. Figs. 23 &
29) appeared to be related to an enhanced mycorrhizal network. Perhaps, ECM associations
significantly enhanced the below-ground C costs in spruce under 2xO3, mitigating the
efficiency ratio of “running costs”. In addition, Yanai et al. (1995) pointed out the mycorrhizal
hyphae to be more efficient than fine roots in terms of expenditure of C in the nutrients
uptake from the soil. Hence, the extension of the below-ground analysis of space-related
efficiency ratios towards costs/benefit relationships that account for the symbiotic
associations appears to be promising, as additional and profound understanding of below-
ground processes can be acquired, in particular, in view of changing environmental
conditions.
4.4.3 Mechanisms of below-ground competition between beech and spruce
Beech and spruce differed in their efficiencies in BSO and BSE with a significant competitive
advantage of beech within the uppermost 20 cm of the soil. This soil volume represents the
“biological space” richest in nutrients and water for both competitors (cf. McConnaughay &
Bazzaz, 1991) being characterized, in addition, by high spatial and temporal variability (i.e.
“patchy nutrient supply”; Bliss et al., 2002). Resource capturing and its relation to below-
ground production may influence the way of plant interaction (i.e. competition) in patchy
environments (O’Brien et al., 2005). Fine-roots of beech and spruce showed different
structural responses to variable environment: precision in nutrient foraging (i.e. flexible
response to local water- and nutrient-rich soil patches; cf. section 4.2.1) was detected in
beech, whereas spruce showed changes in size (i.e. in the spatial extension of a fine root
system; cf. section 4.2.2). As described by Volder et al. (2004), Leuschner et al. (2001) and
Eissenstat (2002), the present study showed root foraging in beech (and thus competitive
advantage in BSO) to be related to high fine-root production and turnover. The higher
mortality of beech roots possibly gave belowground space free for re-occupancy (i.e. “free
biological space”). At mixed sub-plots, such zones enriched in soil resources can
theoretically be re-occupied by both neighbours, since the three dimensions of a nutrient
Discussion
137
cxliv
patch render the associated space less likely to be claimed exclusively by one individual only
(Blair, 2001). Huang & Eissenstat (2000) found the species with greater specific fine-root
length (SRL) or finer roots to have more rapid root proliferation in response to enriched
nutrients than those with high SRL or thicker roots. The present study reports on higher SRL
in beech compared to spruce, independent of the type of competition, resource gradients or
O3 regime (Fig. 52). This suggests beech to profit efficiently from the enhanced mortality of
own fine-roots in terms of rapid re-occupancy of the “abandoned” space via development of
ephemeral fine-roots with high SRL. In addition, beech showed nearly two times higher SRL
within (O+Ah) compared to B. This morphological adjustment of beech fine-roots apparently
dominates over physiological aspects (i.e. high respiration rates) in competing for soil space,
and resulted in higher efficiency of space occupation in relation to the morphologically more
conservative spruce. As a result, habitat partitioning in root growth occurs between both
competitors, which apparently reduce competition for the soil resources present within below-
ground space. Findings support the statement of Casper & Jackson (1997) that competition
for soil resources is symmetric if competing plants are able to take up soil resources from
different horizons (i.e. due to habitat partitioning). In summary, data from the present study
appear to provide evidence for symmetric competition below-ground. At “Kranzberger Forst”,
a tendency of habitat partitioning within the whole rooted zone (0-90 cm soil depth) was
denoted by Blaschke (unpubl.). He found a shift towards a more superficially distributed fine-
root system of spruce in mixture with beech, which indicates a higher below-ground
competitive ability of beech compared to spruce in this stand. Similarly, Schmid & Kazda
(2002) found coarse and fine roots of spruce to show shifts towards the upper soil layers in
mixture with beech in an ageing mixed forest in Austria. In view of such findings, spruce
appears to be at higher risk than beech, regarding hazards such as prolonged drought or
wind-throw. Probably, the competitive exclusion from a given “biological space” may
represent the below-ground mechanism that enables beech to out-compete spruce on a
long-term scale.
Explanatory power of space-related cost/benefit relationships for below-ground studies of
competitiveness may be assessed by comparison with conventional approaches. Many
studies have focused on a subset of size-independent root architectural and morphological
features (i.e. topology, inter-root distances, root tip lengths, specific fine-root length; cf.
Bernston 1994; Farley & Fitter, 1999) for examining such aspects of root architecture on root
efficiency in space sequestration (cf. Kozovits et al., 2005a) or soil exploitation (cf. Fitter et
al., 1991). Other studies examined the role of size variations in the root system such as total
root length (Hodge et al., 2000), root production and abundance (Leuschner et al., 2001;
Hodge et al., 2000), root lifespan (Eissenstat 2002) on the below-ground competitive ability
of plants. In addition, changes in root physiology with root age were found to strongly
Discussion
138
cxlv
influence the acquisition of water and nutrients, affecting root efficiency and competitive
effectiveness of plants (Volder et al., 2004). Recently, a phytotron study was conducted to
investigate the intra and inter-specific competitive behaviour of juvenile beech and spruce
trees (Kozovits et al., 2005a, b) using fine-root length as a one-dimensional substitute of
estimating occupied soil volume. The below-ground space sequestration (i.e. the “structural
costs” assessed as the fine-root length per unit of biomass invested into fine roots) was then
assessed by comparing SRL of fine-roots between beech and spruce. In contrast to the
present study which found SRL to be independent of the type of competition in both tree
species, beech plants from the phytotrones showed morphological adjustment below-ground
in the presence of spruce, i.e. enhancement of SRL in mixed compared to monocultures. The
higher SRL of beech was interpreted as compensation for its lowered biomass per unit of soil
volume in mixed culture. Conversely, spruce plants from the phytotrones did not show
significant differences in SRL between types of competition, which is consistent with the
present study on adult forest trees. In addition, the presence of spruce in mixed culture was
supposed to decrease the amount of nutrients available for beech. Overall, Kozovits et al.
(2005a, b) concluded young beech from the phytotron study to be the weaker competitor for
below-ground resources. This conclusion contrasts with the findings from the present field
study, where beech turned out to be more efficient in below-ground space occupation than
spruce. However, such discrepancy in both studies may be related to the different
ontogenetic stage (i.e. young vs. adult trees) and/or different experimental conditions.
Explanatory power of space-related cost/benefit relationships in support of below-ground
studies of competitiveness was assessed also by comparison with the efficiency ratios
defined previously for above-ground structures. In the study conducted at “Kranzberger
Forst” on the same experimental trees, Reiter et al. (2005) concluded above-ground
competitiveness of both competitors to be determined by different strategies of space
sequestration, whereas space exploitation and “running costs” of transpiration and
respiration of the above-ground structures were similar in beech and spruce. In addition, the
physical interaction of swaying tree crowns in both tree species resulted in formation of
crown gaps. Since the relative annual increment of crown volume was larger in sun branches
of beech than spruce, the formation of crown gaps was considered to be advantageous in
beech, as trees of the latter species are able to more rapidly re-conquer abandoned canopy
space. The present study demonstrated below-ground interactions between adult beech and
spruce trees to be controlled by principles similar to those found above-ground so that
hypothesis (vi) is corroborated (i.e. below-ground competitiveness of adult beech and spruce
trees is determined by similar efficiency ratios as above-ground competitiveness). In addition,
the competitive success of beech over spruce in the present study was decided by the
Discussion
139 139
cxlvi
efficiency and different strategies of below-ground space occupation, hence confirming the
above-ground findings of Reiter et al. (2005) also for below-ground processes.
5 CONCLUSIONS
Under 1xO3, beech was the more successful competitor below-ground relative to spruce. The
success of beech was determined by the efficiency of space occupation (BSO), hence
confirming consistency with the above-ground findings of Reiter et al. (2005). The spatial
segregation of beech and spruce fine-roots within differing soil sub-samples (i.e. the habitat
partitioning in root growth between both competitors; cf. section 3.11.2) was interpreted as a
result of symmetric below-ground competition of beech and spruce trees (cf. section 1.2).
Competitive advantage of beech over spruce is not indicated in mono and mixed sub-plots
when comparing the efficiency ratios of “running costs” (BRC). The reason is the nearly 50%
higher species-specific fine-root respiration rate in beech than spruce, which led to
comparable maintenance costs in both competitors, although beech possessed a lower
standing fine-root biomass as compared to spruce.
When focusing on the efficiency ratio of space exploitation (BSE) along resource gradients
within the soil, the habitat partitioning in root growth between both competitors resulted in
different soil exploitation strategies: Spruce was more efficient within the organic, whereas
beech was more efficient within the mineral soil sub-sample. However, such a habitat
partitioning may result, on a long-term scale, in a shift towards a more superficially
distributed fine-root system of spruce in mixture with beech. Since the species with deeper
root systems are generally better adapted to dry climatic conditions than shallow-rooted
species (Caldwell & Richards, 1986), spruce growing in mixture with beech appears to be at
higher risk than beech at prolonged drought or regarding hazards like wind-throw. Such a
“competitive exclusion” via shifting the spruce fine-root system from mineral soil into more
“risky” organic soil was supposed to represent the below-ground mechanism that enables
beech to out-compete spruce in natural mixed forests on a long-term scale.
The extent of drought during 2003 persisted longer underneath mono-specific spruce sub-
plots than under mono-specific beech sub-plots, which resulted in contrasting physiological
root responses, i.e. promotion (in beech) versus inhibition (in spruce) of fine-root growth.
When growing in mixture, beech and especially spruce trees showed sustained fine-root
production during harsh drought conditions in 2003. This apparently resulted from the
different above- and belowground tree architecture (Schume et al., 2003) and physiological
properties (i.e. transpiration rates; Heitz et al., 2000) of the two species. It is concluded that,
Conclusions
140
cxlvii
on a short-term scale, beech/spruce managed forests (e.g. “Kranzberger Forst”) may be
buffered against risks of drought.
The competitive advantage of beech over spruce in BSO was found to vanish under chronic
enhanced O3 stress (i.e. during water non-limited 2002) independent of the type of
competition. However, no change in stem diameter increment (SDI) of beech trees was
detected under 2xO3 (SDI data according Wipfler et al., 2005). The capacity of beech trees to
maintain fine-root system with enhanced turnover and thus, to ensure sufficient nutrient
supply for faster internal cycling, was proposed to be the strategy of beech to cope with
ozone stress. In spruce, no changes in BSO occurred under 2xO3; however, in contrast to
beech, enhanced O3 stress induced decrease in SDI of spruce trees (Wipfler et al., 2005).
The present study shows that such a decrease in SDI was not related to enhanced C costs
of the spruce fine-roots per se.
Under 2xO3, significantly increased SRt was detected under both tree species and types of
competition. Fine-root density did not appear to affect the response of SRt to ozone in any
tree species or type of competition. The positive effect of O3 on SRt detected in the present
experiment may be explained by stimulation of the rhizospheric activity, e.g. changes in the
ectomycorrhizal network (ECM; see for beech in Grebenc et al., 2005) and/or stimulation of
free-living soil decomposers (e.g. due to high nutrient content in leaf litter via incomplete N
remobilization from the foliage; cf. Matyssek et al., 1993). In the context of “global change”
scenarios predicting increase of O3 levels, the results from the case study in “Kranzberger
Forst” indicate that forests with beech and spruce, independent of the type of competition,
have the capacity to enhance soil C efflux into the atmosphere.
The combination of factors “O3+drought” (i.e. during 2003 at 2xO3) influenced fine-root
dynamics in beech in a similar way as found for the O3 impact alone. However, the ozone
effect on δ13C of newly formed beech fine-roots (as a measure of WUE) disappeared under
“O3+drought” which indicated in this deciduous tree species drought to overrule the ozone
impact on C uptake. The combination of factors “O3+drought” during 2003 induced in spruce
responses contrasting with those caused by ozone: Results indicated acclimation of the fine-
root system (i.e. via passing into dormancy) and – as a consequence - lowered nutrient
cycling in the soil as during drought. The drought effect on δ13C of newly formed fine-roots
during 2003 was smaller in spruces growing under 2xO3 than 1xO3, which may have resulted
from “hardening” of the evergreen leaves caused by the 3-year-long chronic O3-fumigation.
Beech and spruce trees growing in mixture at “drought+O3” conditions reacted with lower root
Conclusions
141
cxlviii
turnover, indicating in both tree species the synergism of both factors to lower internal cycling
of nutrients.
The high degree of ectomycorrhizal infection in beech and spruce and the different
“exploration types” of mycorrhizae may alter the dimension of below-ground space
exploitation (Agerer, 2001). The extension of the below-ground analysis of space-related
efficiency ratios towards costs/benefit relationships that account for the symbiotic
associations is currently being studied in the SFB research program (www.sfb607.de; cf.
project B7). In addition, the biomass of the field-grown tree root system is predominantly
composed of coarse woody roots (Göttsche, 1972) which are partly permeable for ions and
are able to take up considerable amounts of water (Lindenmair, 2004). It appears to be
promising to include space-related cost/benefit relationships in future investigations of below-
ground plant competitiveness which account for the efficiency of the coarse-root system.
Analysis of below-ground plant competitiveness is provided in this case study at the stand
level under closed-canopy conditions of the experimental site “Kranzberger Forst”. The
competitive below-ground success of beech (i.e. determined by the efficiency of space
occupation) was associated with the capacity of the root system to exploit rapidly available
resources from soil via constructing fine-roots with high morphological plasticity and high
turnover. This finding supports the theory of Grime (1977), that the competitive success is a
reflection of the individual capacity to exploit resources rapidly (cf. section 1.1.2).
Additionally, the present study shows that beech which turned out to be the superior
competitor for light (Reiter et al., 2005) was superior competitor also for soil resources (i.e.
soil water, determined by the efficiency of space exploitation). This result was in agreement
with the statement of Grime (1977) that superior competitors for light would be equally
successful in competing for soil resources (cf. section 1.1.2). In general, the novel approach
of a quantitative, space-related assessment of cost/benefit relationships (i.e. based on
space-related “efficiencies” of resource turnover) proved suitable to analyse and clarify the
below-ground competitive ability of forest trees. This space-related perspective allowed
comparisons of the below-ground competitive ability between species of contrasting
seasonal growth dynamics (i.e. deciduous broadleaved Fagus sylvatica vs. evergreen
coniferous Picea abies) under variable spatio-temporal environmental conditions (in terms of
soil water availability, tropospheric O3 regimes and gradients in soil resources across organic
and mineral soil horizons). In addition, the differences in fine-root soil exploitation strategies
among both tree species shown in this study might be as important as those reported
aboveground (Reiter, 2004) to understand the principles of interspecific competition and
coexistence of beech and spruce trees under different environments of the Central European
forests.
Conclusions
142
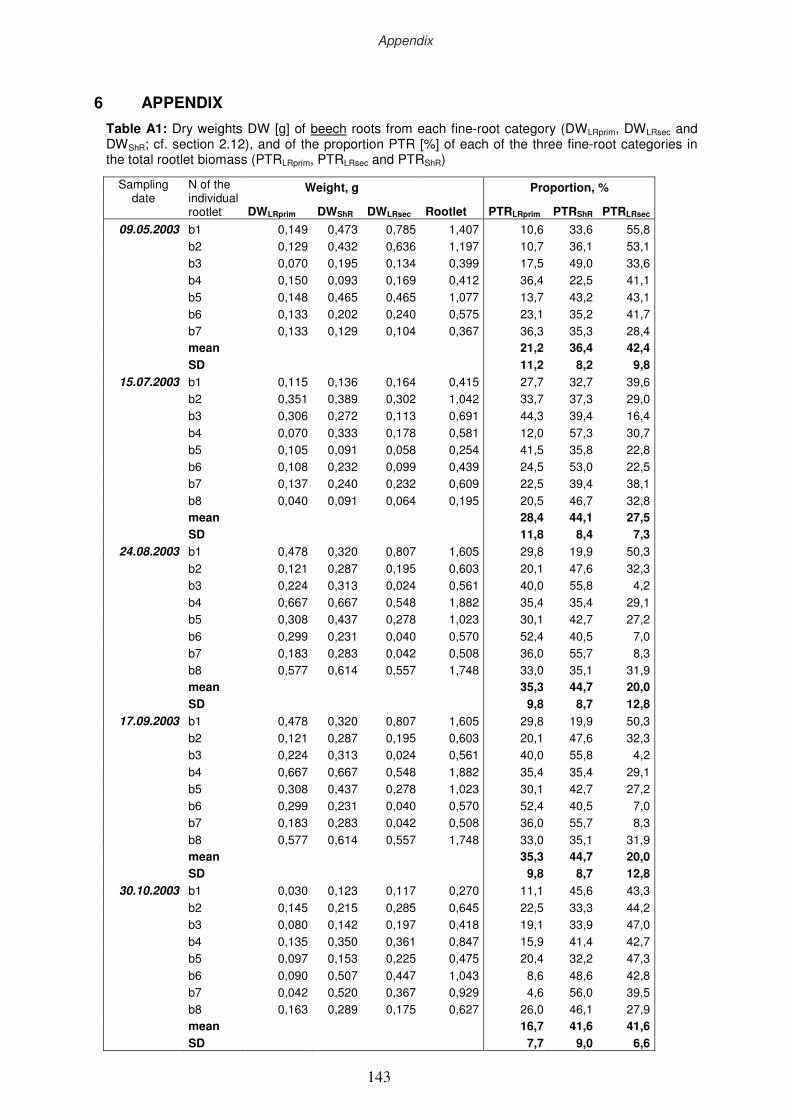
cxlix
6 APPENDIX
Table A1: Dry weights DW [g] of beech roots from each fine-root category (DWLRprim, DWLRsec and DWShR; cf. section 2.12), and of the proportion PTR [%] of each of the three fine-root categories in the total rootlet biomass (PTRLRprim, PTRLRsec and PTRShR)
Weight, g Proportion, % Sampling date
N of the individual rootlet DWLRprim DWShR DWLRsec Rootlet PTRLRprim PTRShR PTRLRsec
09.05.2003 b1 0,149 0,473 0,785 1,407 10,6 33,6 55,8 b2 0,129 0,432 0,636 1,197 10,7 36,1 53,1 b3 0,070 0,195 0,134 0,399 17,5 49,0 33,6 b4 0,150 0,093 0,169 0,412 36,4 22,5 41,1 b5 0,148 0,465 0,465 1,077 13,7 43,2 43,1 b6 0,133 0,202 0,240 0,575 23,1 35,2 41,7 b7 0,133 0,129 0,104 0,367 36,3 35,3 28,4 mean 21,2 36,4 42,4
SD 11,2 8,2 9,8
15.07.2003 b1 0,115 0,136 0,164 0,415 27,7 32,7 39,6 b2 0,351 0,389 0,302 1,042 33,7 37,3 29,0 b3 0,306 0,272 0,113 0,691 44,3 39,4 16,4 b4 0,070 0,333 0,178 0,581 12,0 57,3 30,7 b5 0,105 0,091 0,058 0,254 41,5 35,8 22,8 b6 0,108 0,232 0,099 0,439 24,5 53,0 22,5 b7 0,137 0,240 0,232 0,609 22,5 39,4 38,1 b8 0,040 0,091 0,064 0,195 20,5 46,7 32,8 mean 28,4 44,1 27,5
SD 11,8 8,4 7,3
24.08.2003 b1 0,478 0,320 0,807 1,605 29,8 19,9 50,3 b2 0,121 0,287 0,195 0,603 20,1 47,6 32,3 b3 0,224 0,313 0,024 0,561 40,0 55,8 4,2 b4 0,667 0,667 0,548 1,882 35,4 35,4 29,1 b5 0,308 0,437 0,278 1,023 30,1 42,7 27,2 b6 0,299 0,231 0,040 0,570 52,4 40,5 7,0 b7 0,183 0,283 0,042 0,508 36,0 55,7 8,3 b8 0,577 0,614 0,557 1,748 33,0 35,1 31,9 mean 35,3 44,7 20,0
SD 9,8 8,7 12,8
17.09.2003 b1 0,478 0,320 0,807 1,605 29,8 19,9 50,3 b2 0,121 0,287 0,195 0,603 20,1 47,6 32,3 b3 0,224 0,313 0,024 0,561 40,0 55,8 4,2 b4 0,667 0,667 0,548 1,882 35,4 35,4 29,1 b5 0,308 0,437 0,278 1,023 30,1 42,7 27,2 b6 0,299 0,231 0,040 0,570 52,4 40,5 7,0 b7 0,183 0,283 0,042 0,508 36,0 55,7 8,3 b8 0,577 0,614 0,557 1,748 33,0 35,1 31,9 mean 35,3 44,7 20,0
SD 9,8 8,7 12,8
30.10.2003 b1 0,030 0,123 0,117 0,270 11,1 45,6 43,3 b2 0,145 0,215 0,285 0,645 22,5 33,3 44,2 b3 0,080 0,142 0,197 0,418 19,1 33,9 47,0 b4 0,135 0,350 0,361 0,847 15,9 41,4 42,7 b5 0,097 0,153 0,225 0,475 20,4 32,2 47,3 b6 0,090 0,507 0,447 1,043 8,6 48,6 42,8 b7 0,042 0,520 0,367 0,929 4,6 56,0 39,5 b8 0,163 0,289 0,175 0,627 26,0 46,1 27,9 mean 16,7 41,6 41,6
SD 7,7 9,0 6,6
Appendix
143
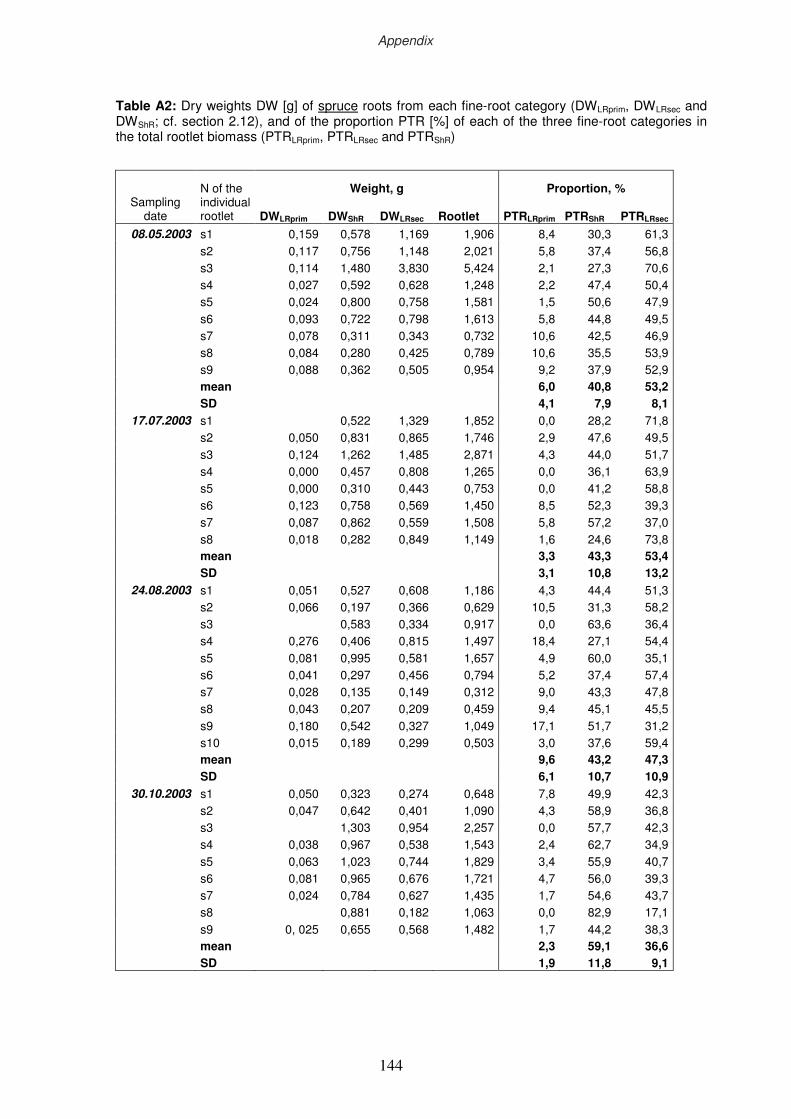
cl
Weight, g Proportion, % Sampling
date
N of the individual rootlet DWLRprim DWShR DWLRsec Rootlet PTRLRprim PTRShR PTRLRsec
08.05.2003 s1 0,159 0,578 1,169 1,906 8,4 30,3 61,3 s2 0,117 0,756 1,148 2,021 5,8 37,4 56,8 s3 0,114 1,480 3,830 5,424 2,1 27,3 70,6 s4 0,027 0,592 0,628 1,248 2,2 47,4 50,4 s5 0,024 0,800 0,758 1,581 1,5 50,6 47,9 s6 0,093 0,722 0,798 1,613 5,8 44,8 49,5 s7 0,078 0,311 0,343 0,732 10,6 42,5 46,9 s8 0,084 0,280 0,425 0,789 10,6 35,5 53,9 s9 0,088 0,362 0,505 0,954 9,2 37,9 52,9 mean 6,0 40,8 53,2
SD 4,1 7,9 8,1
17.07.2003 s1 0,522 1,329 1,852 0,0 28,2 71,8 s2 0,050 0,831 0,865 1,746 2,9 47,6 49,5 s3 0,124 1,262 1,485 2,871 4,3 44,0 51,7 s4 0,000 0,457 0,808 1,265 0,0 36,1 63,9 s5 0,000 0,310 0,443 0,753 0,0 41,2 58,8 s6 0,123 0,758 0,569 1,450 8,5 52,3 39,3 s7 0,087 0,862 0,559 1,508 5,8 57,2 37,0 s8 0,018 0,282 0,849 1,149 1,6 24,6 73,8 mean 3,3 43,3 53,4
SD 3,1 10,8 13,2
24.08.2003 s1 0,051 0,527 0,608 1,186 4,3 44,4 51,3 s2 0,066 0,197 0,366 0,629 10,5 31,3 58,2 s3 0,583 0,334 0,917 0,0 63,6 36,4 s4 0,276 0,406 0,815 1,497 18,4 27,1 54,4 s5 0,081 0,995 0,581 1,657 4,9 60,0 35,1 s6 0,041 0,297 0,456 0,794 5,2 37,4 57,4 s7 0,028 0,135 0,149 0,312 9,0 43,3 47,8 s8 0,043 0,207 0,209 0,459 9,4 45,1 45,5 s9 0,180 0,542 0,327 1,049 17,1 51,7 31,2 s10 0,015 0,189 0,299 0,503 3,0 37,6 59,4 mean 9,6 43,2 47,3
SD 6,1 10,7 10,9
30.10.2003 s1 0,050 0,323 0,274 0,648 7,8 49,9 42,3 s2 0,047 0,642 0,401 1,090 4,3 58,9 36,8 s3 1,303 0,954 2,257 0,0 57,7 42,3 s4 0,038 0,967 0,538 1,543 2,4 62,7 34,9 s5 0,063 1,023 0,744 1,829 3,4 55,9 40,7 s6 0,081 0,965 0,676 1,721 4,7 56,0 39,3 s7 0,024 0,784 0,627 1,435 1,7 54,6 43,7 s8 0,881 0,182 1,063 0,0 82,9 17,1 s9 0, 025 0,655 0,568 1,482 1,7 44,2 38,3 mean 2,3 59,1 36,6
SD 1,9 11,8 9,1
Table A2: Dry weights DW [g] of spruce roots from each fine-root category (DWLRprim, DWLRsec and DWShR; cf. section 2.12), and of the proportion PTR [%] of each of the three fine-root categories in the total rootlet biomass (PTRLRprim, PTRLRsec and PTRShR)
Appendix
144
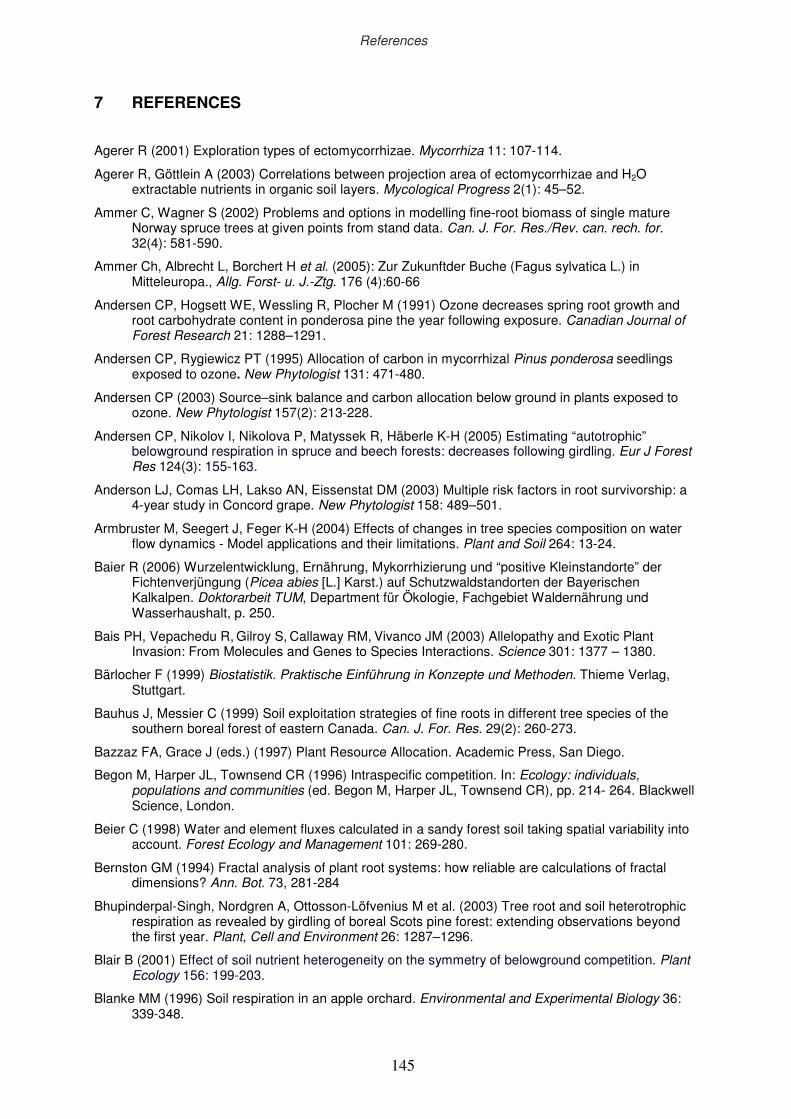
cli
7 REFERENCES
Agerer R (2001) Exploration types of ectomycorrhizae. Mycorrhiza 11: 107-114.
Agerer R, Göttlein A (2003) Correlations between projection area of ectomycorrhizae and H2O extractable nutrients in organic soil layers. Mycological Progress 2(1): 45–52.
Ammer C, Wagner S (2002) Problems and options in modelling fine-root biomass of single mature Norway spruce trees at given points from stand data. Can. J. For. Res./Rev. can. rech. for. 32(4): 581-590.
Ammer Ch, Albrecht L, Borchert H et al. (2005): Zur Zukunftder Buche (Fagus sylvatica L.) in Mitteleuropa., Allg. Forst- u. J.-Ztg. 176 (4):60-66
Andersen CP, Hogsett WE, Wessling R, Plocher M (1991) Ozone decreases spring root growth and root carbohydrate content in ponderosa pine the year following exposure. Canadian Journal of Forest Research 21: 1288–1291.
Andersen CP, Rygiewicz PT (1995) Allocation of carbon in mycorrhizal Pinus ponderosa seedlings exposed to ozone. New Phytologist 131: 471-480.
Andersen CP (2003) Source–sink balance and carbon allocation below ground in plants exposed to ozone. New Phytologist 157(2): 213-228.
Andersen CP, Nikolov I, Nikolova P, Matyssek R, Häberle K-H (2005) Estimating “autotrophic” belowground respiration in spruce and beech forests: decreases following girdling. Eur J Forest Res 124(3): 155-163.
Anderson LJ, Comas LH, Lakso AN, Eissenstat DM (2003) Multiple risk factors in root survivorship: a 4-year study in Concord grape. New Phytologist 158: 489–501.
Armbruster M, Seegert J, Feger K-H (2004) Effects of changes in tree species composition on water flow dynamics - Model applications and their limitations. Plant and Soil 264: 13-24.
Baier R (2006) Wurzelentwicklung, Ernährung, Mykorrhizierung und “positive Kleinstandorte” der Fichtenverjüngung (Picea abies [L.] Karst.) auf Schutzwaldstandorten der Bayerischen Kalkalpen. Doktorarbeit TUM, Department für Ökologie, Fachgebiet Waldernährung und Wasserhaushalt, p. 250.
Bais PH, Vepachedu R, Gilroy S, Callaway RM, Vivanco JM (2003) Allelopathy and Exotic Plant Invasion: From Molecules and Genes to Species Interactions. Science 301: 1377 – 1380.
Bärlocher F (1999) Biostatistik. Praktische Einführung in Konzepte und Methoden. Thieme Verlag, Stuttgart.
Bauhus J, Messier C (1999) Soil exploitation strategies of fine roots in different tree species of the southern boreal forest of eastern Canada. Can. J. For. Res. 29(2): 260-273.
Bazzaz FA, Grace J (eds.) (1997) Plant Resource Allocation. Academic Press, San Diego.
Begon M, Harper JL, Townsend CR (1996) Intraspecific competition. In: Ecology: individuals, populations and communities (ed. Begon M, Harper JL, Townsend CR), pp. 214- 264. Blackwell Science, London.
Beier C (1998) Water and element fluxes calculated in a sandy forest soil taking spatial variability into account. Forest Ecology and Management 101: 269-280.
Bernston GM (1994) Fractal analysis of plant root systems: how reliable are calculations of fractal dimensions? Ann. Bot. 73, 281-284
Bhupinderpal-Singh, Nordgren A, Ottosson-Löfvenius M et al. (2003) Tree root and soil heterotrophic respiration as revealed by girdling of boreal Scots pine forest: extending observations beyond the first year. Plant, Cell and Environment 26: 1287–1296.
Blair B (2001) Effect of soil nutrient heterogeneity on the symmetry of belowground competition. Plant Ecology 156: 199-203.
Blanke MM (1996) Soil respiration in an apple orchard. Environmental and Experimental Biology 36: 339-348.
References
145
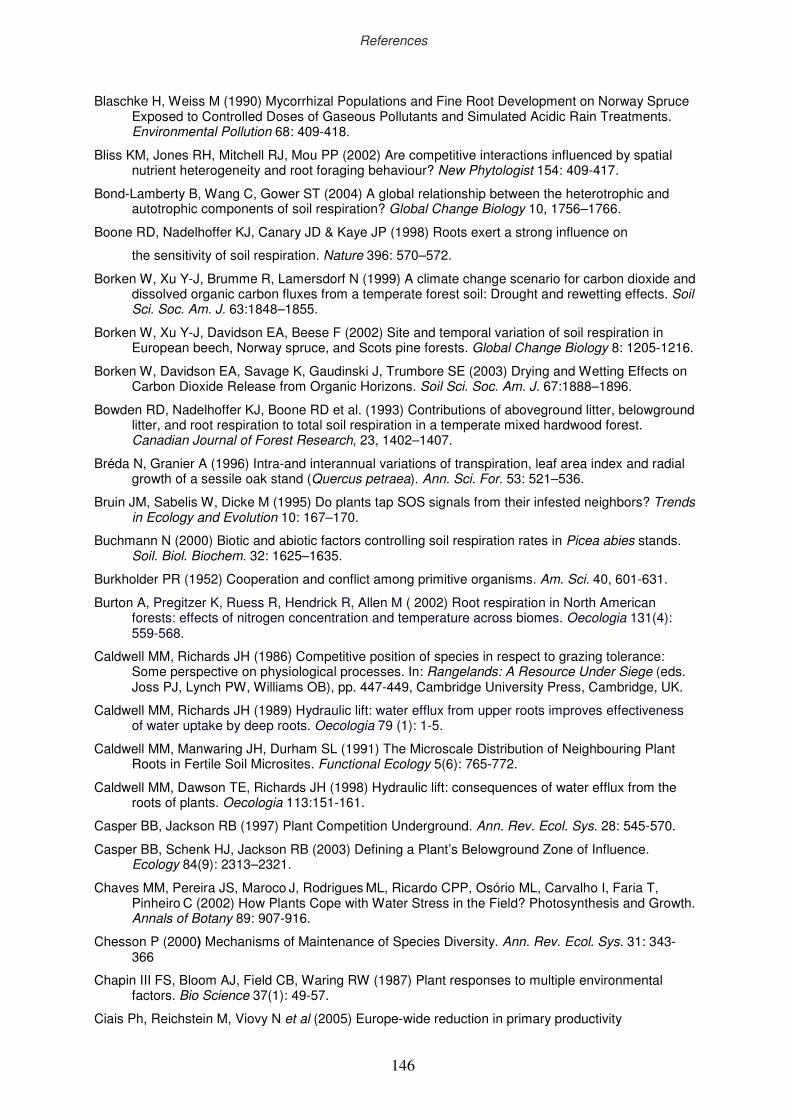
clii
Blaschke H, Weiss M (1990) Mycorrhizal Populations and Fine Root Development on Norway Spruce Exposed to Controlled Doses of Gaseous Pollutants and Simulated Acidic Rain Treatments. Environmental Pollution 68: 409-418.
Bliss KM, Jones RH, Mitchell RJ, Mou PP (2002) Are competitive interactions influenced by spatial nutrient heterogeneity and root foraging behaviour? New Phytologist 154: 409-417.
Bond-Lamberty B, Wang C, Gower ST (2004) A global relationship between the heterotrophic and autotrophic components of soil respiration? Global Change Biology 10, 1756–1766.
Boone RD, Nadelhoffer KJ, Canary JD & Kaye JP (1998) Roots exert a strong influence on
the sensitivity of soil respiration. Nature 396: 570–572.
Borken W, Xu Y-J, Brumme R, Lamersdorf N (1999) A climate change scenario for carbon dioxide and dissolved organic carbon fluxes from a temperate forest soil: Drought and rewetting effects. Soil Sci. Soc. Am. J. 63:1848–1855.
Borken W, Xu Y-J, Davidson EA, Beese F (2002) Site and temporal variation of soil respiration in European beech, Norway spruce, and Scots pine forests. Global Change Biology 8: 1205-1216.
Borken W, Davidson EA, Savage K, Gaudinski J, Trumbore SE (2003) Drying and Wetting Effects on Carbon Dioxide Release from Organic Horizons. Soil Sci. Soc. Am. J. 67:1888–1896.
Bowden RD, Nadelhoffer KJ, Boone RD et al. (1993) Contributions of aboveground litter, belowground litter, and root respiration to total soil respiration in a temperate mixed hardwood forest. Canadian Journal of Forest Research, 23, 1402–1407.
Bréda N, Granier A (1996) Intra-and interannual variations of transpiration, leaf area index and radial growth of a sessile oak stand (Quercus petraea). Ann. Sci. For. 53: 521–536.
Bruin JM, Sabelis W, Dicke M (1995) Do plants tap SOS signals from their infested neighbors? Trends in Ecology and Evolution 10: 167–170.
Buchmann N (2000) Biotic and abiotic factors controlling soil respiration rates in Picea abies stands. Soil. Biol. Biochem. 32: 1625–1635.
Burkholder PR (1952) Cooperation and conflict among primitive organisms. Am. Sci. 40, 601-631.
Burton A, Pregitzer K, Ruess R, Hendrick R, Allen M ( 2002) Root respiration in North American forests: effects of nitrogen concentration and temperature across biomes. Oecologia 131(4): 559-568.
Caldwell MM, Richards JH (1986) Competitive position of species in respect to grazing tolerance: Some perspective on physiological processes. In: Rangelands: A Resource Under Siege (eds. Joss PJ, Lynch PW, Williams OB), pp. 447-449, Cambridge University Press, Cambridge, UK.
Caldwell MM, Richards JH (1989) Hydraulic lift: water efflux from upper roots improves effectiveness of water uptake by deep roots. Oecologia 79 (1): 1-5.
Caldwell MM, Manwaring JH, Durham SL (1991) The Microscale Distribution of Neighbouring Plant Roots in Fertile Soil Microsites. Functional Ecology 5(6): 765-772.
Caldwell MM, Dawson TE, Richards JH (1998) Hydraulic lift: consequences of water efflux from the roots of plants. Oecologia 113:151-161.
Casper BB, Jackson RB (1997) Plant Competition Underground. Ann. Rev. Ecol. Sys. 28: 545-570.
Casper BB, Schenk HJ, Jackson RB (2003) Defining a Plant’s Belowground Zone of Influence. Ecology 84(9): 2313–2321.
Chaves MM, Pereira JS, Maroco J, Rodrigues ML, Ricardo CPP, Osório ML, Carvalho I, Faria T, Pinheiro C (2002) How Plants Cope with Water Stress in the Field? Photosynthesis and Growth. Annals of Botany 89: 907-916.
Chesson P (2000) Mechanisms of Maintenance of Species Diversity. Ann. Rev. Ecol. Sys. 31: 343-366
Chapin III FS, Bloom AJ, Field CB, Waring RW (1987) Plant responses to multiple environmental factors. Bio Science 37(1): 49-57.
Ciais Ph, Reichstein M, Viovy N et al (2005) Europe-wide reduction in primary productivity
References
146
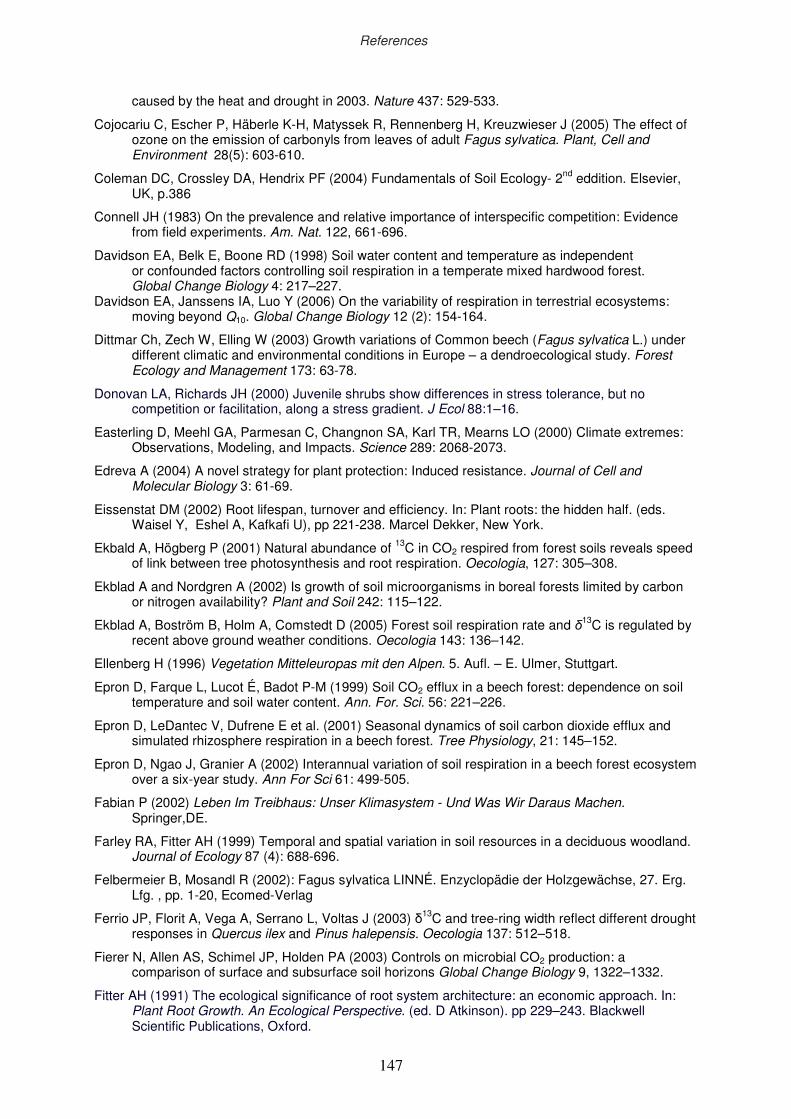
cliii
caused by the heat and drought in 2003. Nature 437: 529-533.
Cojocariu C, Escher P, Häberle K-H, Matyssek R, Rennenberg H, Kreuzwieser J (2005) The effect of ozone on the emission of carbonyls from leaves of adult Fagus sylvatica. Plant, Cell and Environment 28(5): 603-610.
Coleman DC, Crossley DA, Hendrix PF (2004) Fundamentals of Soil Ecology- 2nd eddition. Elsevier, UK, p.386
Connell JH (1983) On the prevalence and relative importance of interspecific competition: Evidence from field experiments. Am. Nat. 122, 661-696.
Davidson EA, Belk E, Boone RD (1998) Soil water content and temperature as independent or confounded factors controlling soil respiration in a temperate mixed hardwood forest. Global Change Biology 4: 217–227.
Davidson EA, Janssens IA, Luo Y (2006) On the variability of respiration in terrestrial ecosystems: moving beyond Q10. Global Change Biology 12 (2): 154-164.
Dittmar Ch, Zech W, Elling W (2003) Growth variations of Common beech (Fagus sylvatica L.) under different climatic and environmental conditions in Europe – a dendroecological study. Forest Ecology and Management 173: 63-78.
Donovan LA, Richards JH (2000) Juvenile shrubs show differences in stress tolerance, but no competition or facilitation, along a stress gradient. J Ecol 88:1–16.
Easterling D, Meehl GA, Parmesan C, Changnon SA, Karl TR, Mearns LO (2000) Climate extremes: Observations, Modeling, and Impacts. Science 289: 2068-2073.
Edreva A (2004) A novel strategy for plant protection: Induced resistance. Journal of Cell and Molecular Biology 3: 61-69.
Eissenstat DM (2002) Root lifespan, turnover and efficiency. In: Plant roots: the hidden half. (eds. Waisel Y, Eshel A, Kafkafi U), pp 221-238. Marcel Dekker, New York.
Ekbald A, Högberg P (2001) Natural abundance of 13C in CO2 respired from forest soils reveals speed of link between tree photosynthesis and root respiration. Oecologia, 127: 305–308.
Ekblad A and Nordgren A (2002) Is growth of soil microorganisms in boreal forests limited by carbon or nitrogen availability? Plant and Soil 242: 115–122.
Ekblad A, Boström B, Holm A, Comstedt D (2005) Forest soil respiration rate and δ13C is regulated by recent above ground weather conditions. Oecologia 143: 136–142.
Ellenberg H (1996) Vegetation Mitteleuropas mit den Alpen. 5. Aufl. – E. Ulmer, Stuttgart.
Epron D, Farque L, Lucot É, Badot P-M (1999) Soil CO2 efflux in a beech forest: dependence on soil temperature and soil water content. Ann. For. Sci. 56: 221–226.
Epron D, LeDantec V, Dufrene E et al. (2001) Seasonal dynamics of soil carbon dioxide efflux and simulated rhizosphere respiration in a beech forest. Tree Physiology, 21: 145–152.
Epron D, Ngao J, Granier A (2002) Interannual variation of soil respiration in a beech forest ecosystem over a six-year study. Ann For Sci 61: 499-505.
Fabian P (2002) Leben Im Treibhaus: Unser Klimasystem - Und Was Wir Daraus Machen. Springer,DE.
Farley RA, Fitter AH (1999) Temporal and spatial variation in soil resources in a deciduous woodland. Journal of Ecology 87 (4): 688-696.
Felbermeier B, Mosandl R (2002): Fagus sylvatica LINNÉ. Enzyclopädie der Holzgewächse, 27. Erg. Lfg. , pp. 1-20, Ecomed-Verlag
Ferrio JP, Florit A, Vega A, Serrano L, Voltas J (2003) δ13C and tree-ring width reflect different drought responses in Quercus ilex and Pinus halepensis. Oecologia 137: 512–518.
Fierer N, Allen AS, Schimel JP, Holden PA (2003) Controls on microbial CO2 production: a comparison of surface and subsurface soil horizons Global Change Biology 9, 1322–1332.
Fitter AH (1991) The ecological significance of root system architecture: an economic approach. In: Plant Root Growth. An Ecological Perspective. (ed. D Atkinson). pp 229–243. Blackwell Scientific Publications, Oxford.
References
147
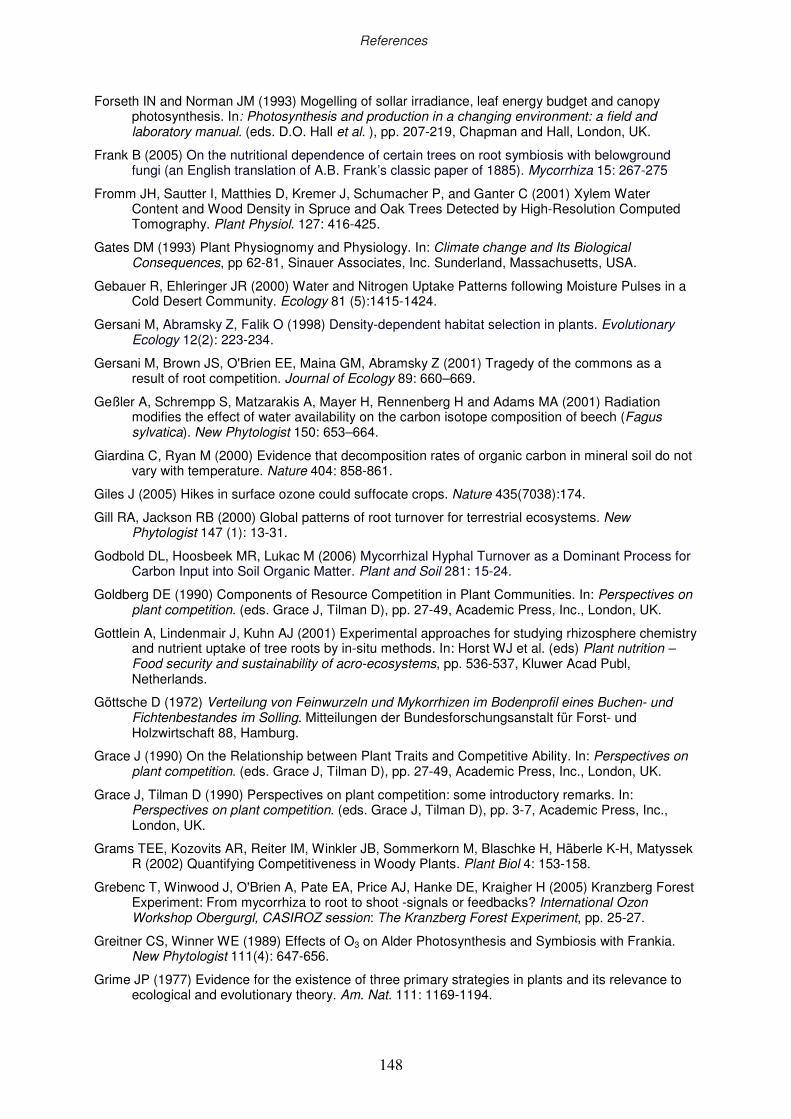
cliv
Forseth IN and Norman JM (1993) Mogelling of sollar irradiance, leaf energy budget and canopy photosynthesis. In: Photosynthesis and production in a changing environment: a field and laboratory manual. (eds. D.O. Hall et al. ), pp. 207-219, Chapman and Hall, London, UK.
Frank B (2005) On the nutritional dependence of certain trees on root symbiosis with belowground fungi (an English translation of A.B. Frank’s classic paper of 1885). Mycorrhiza 15: 267-275
Fromm JH, Sautter I, Matthies D, Kremer J, Schumacher P, and Ganter C (2001) Xylem Water Content and Wood Density in Spruce and Oak Trees Detected by High-Resolution Computed Tomography. Plant Physiol. 127: 416-425.
Gates DM (1993) Plant Physiognomy and Physiology. In: Climate change and Its Biological Consequences, pp 62-81, Sinauer Associates, Inc. Sunderland, Massachusetts, USA.
Gebauer R, Ehleringer JR (2000) Water and Nitrogen Uptake Patterns following Moisture Pulses in a Cold Desert Community. Ecology 81 (5):1415-1424.
Gersani M, Abramsky Z, Falik O (1998) Density-dependent habitat selection in plants. Evolutionary Ecology 12(2): 223-234.
Gersani M, Brown JS, O'Brien EE, Maina GM, Abramsky Z (2001) Tragedy of the commons as a result of root competition. Journal of Ecology 89: 660–669.
Geßler A, Schrempp S, Matzarakis A, Mayer H, Rennenberg H and Adams MA (2001) Radiation modifies the effect of water availability on the carbon isotope composition of beech (Fagus sylvatica). New Phytologist 150: 653–664.
Giardina C, Ryan M (2000) Evidence that decomposition rates of organic carbon in mineral soil do not vary with temperature. Nature 404: 858-861.
Giles J (2005) Hikes in surface ozone could suffocate crops. Nature 435(7038):174.
Gill RA, Jackson RB (2000) Global patterns of root turnover for terrestrial ecosystems. New Phytologist 147 (1): 13-31.
Godbold DL, Hoosbeek MR, Lukac M (2006) Mycorrhizal Hyphal Turnover as a Dominant Process for Carbon Input into Soil Organic Matter. Plant and Soil 281: 15-24.
Goldberg DE (1990) Components of Resource Competition in Plant Communities. In: Perspectives on plant competition. (eds. Grace J, Tilman D), pp. 27-49, Academic Press, Inc., London, UK.
Gottlein A, Lindenmair J, Kuhn AJ (2001) Experimental approaches for studying rhizosphere chemistry and nutrient uptake of tree roots by in-situ methods. In: Horst WJ et al. (eds) Plant nutrition – Food security and sustainability of acro-ecosystems, pp. 536-537, Kluwer Acad Publ, Netherlands.
Göttsche D (1972) Verteilung von Feinwurzeln und Mykorrhizen im Bodenprofil eines Buchen- und Fichtenbestandes im Solling. Mitteilungen der Bundesforschungsanstalt für Forst- und Holzwirtschaft 88, Hamburg.
Grace J (1990) On the Relationship between Plant Traits and Competitive Ability. In: Perspectives on plant competition. (eds. Grace J, Tilman D), pp. 27-49, Academic Press, Inc., London, UK.
Grace J, Tilman D (1990) Perspectives on plant competition: some introductory remarks. In: Perspectives on plant competition. (eds. Grace J, Tilman D), pp. 3-7, Academic Press, Inc., London, UK.
Grams TEE, Kozovits AR, Reiter IM, Winkler JB, Sommerkorn M, Blaschke H, Häberle K-H, Matyssek R (2002) Quantifying Competitiveness in Woody Plants. Plant Biol 4: 153-158.
Grebenc T, Winwood J, O'Brien A, Pate EA, Price AJ, Hanke DE, Kraigher H (2005) Kranzberg Forest Experiment: From mycorrhiza to root to shoot -signals or feedbacks? International Ozon Workshop Obergurgl, CASIROZ session: The Kranzberg Forest Experiment, pp. 25-27.
Greitner CS, Winner WE (1989) Effects of O3 on Alder Photosynthesis and Symbiosis with Frankia. New Phytologist 111(4): 647-656.
Grime JP (1977) Evidence for the existence of three primary strategies in plants and its relevance to ecological and evolutionary theory. Am. Nat. 111: 1169-1194.
References
148

clv
Grulke NE, Andersen CP, Fenn ME, Miller PR (1998) Ozone exposure and nitrogen deposition lowers root biomass of ponderosa pine in the San Bernardino Mountains, California. Environ Pollut 103: 63-73.
Grulke NW, Andersen CP, Hogsett WE (2001) Seasonal changes in above- and belowground carbohydrate concentrations of ponderosa pine along a pollution gradient. Tree Physiology 21: 173–181.
Grulke NE, Preisler KH, Fan CC, Retzlaff WA (2002) A statistical approach to estimate O3 uptake of ponderosa pine in a mediterranean climate. Environ Pollut 119(2): 163-75.
Grulke NE, Johnson R, Monschein S, Nikolova P, Tausz M (2003) Variation in morphological and biochemical O3 injury attributes of mature Jeffrey pine within canopies and between microsites. Tree Physiol. 23(13): 923-929.
Häberle KH, Reiter IM, Matyssek R, Leuchner M, Werner H, Fabian P, Heerdt C, Nunn AJ, Gruppe A, Simon U, Goßner M (2003) Canopy research in a mixed forest of beech and spruce in Southern Germany. In: BassetY, Horlyck V, Wright J (eds.) Studying Forest Canopies from Above: The international Canopy Crane Handbook: Smithsonian & UNEP, Panama, pp 71-78.
Hayes AJ (1979) The microbiology of plant litter decomposition. Sci. Prog., Oxf. 66: 25-42.
Hammel K and Kennel M (2001) Charakterisierung und Analyse der Wasserverfügbarkeit und des Wasserhaushalts von Waldstandorten in Bayern mit dem Simulationsmodell BROOK90. Forstliche Forschungsberichte185, München.
Hanson PJ, Wullschleger SA, Bohlman SA, Todd DE (1993) Seasonal and topographic patterns of forest floor CO2 efflux from upland oak forest. Tree Physiology 13: 1-15.
Hanson PJ, Edwards NT, Garten CT, Andrews JA (2000) Separating root and soil microbial contributions to soil respiration: a review of methods and observations. Biogeochemistry 48: 115–146.
Hartung W (1996) Trockenheit. In: Brunold Ch, Rüegsegger A, Brändle R (ed.) Stress bei Pflanzen. UTB, Verlag Paul Haupt, Stuttgart
Hawkes CV, Casper BB (2002) Lateral root function and root overlap among mycorrhizal and nonmycorrhizal herbs in a Florida shrubland, measured using rubidium as a nutrient analog. American Journal of Botany 89: 1289-1294.
Hendrick RI, Pregitzer KS (1993) Patterns of fine root mortality in two sugar maple forests. Nature 361: 59 – 61.
Hendrick RL, Pregitzer KS (1996) Temporal and Depth-Related Patterns of Fine Root Dynamics in Northern Hardwood Forests Journal of Ecology 84(2): 167-176.
Hendricks JJ, Hendrick RL, Wilson CA, Mitchell RJ, Pecot SD, Guo D (2006) Assessing the patterns and controls of fine root dynamics: an empirical test and methodological review. Journal of Ecology 94 (1), 40-57.
Herms DA, Mattson WJ (1992) The dilemma of plants: to grow or defend. Quarterly Review of Biology 67(3): 283-335.
Hertel D (1999) Das Feinwurzelsystem von Rein- und Mischbeständen der Rotbuche: Struktur, Dynamik und interspezifische Konkurrenz. Diss. Bot. 317: 1–190.
Hertel D, Leuschner Ch (2002) A comparison of four different fine root production estimates with ecosystem carbon balance data in a Fagus–Quercus mixed forest. Plant and Soil 239: 237–251.
Hietz P, Offenthaler I, Schume H, Richter H (2000) Transpiration and canopy conductance in a spruce stand and spruce-beech stand. In: Hasenauer H (ed.), Proc. of an Int. Conference on Forest Ecosystem Restoration, 10-12 Apr. 2000. Univ. Agric. Sci., Vienna, Austria, pp. 126-132.
Hsiao TC, Xu L-K (2000) Sensitivity of growth of roots versus leaves to water stress: biophysical analysis and relation to water transport. Journal of Experimental Botany 51(350):1595-1616
Hobbie EA, Colpaert JV (2004) Nitrogen availability and mycorrhizal colonization influence water use efficiency and carbon isotope patterns in Pinus sylvestris. New Phytologist 164: 515-528.
References
149
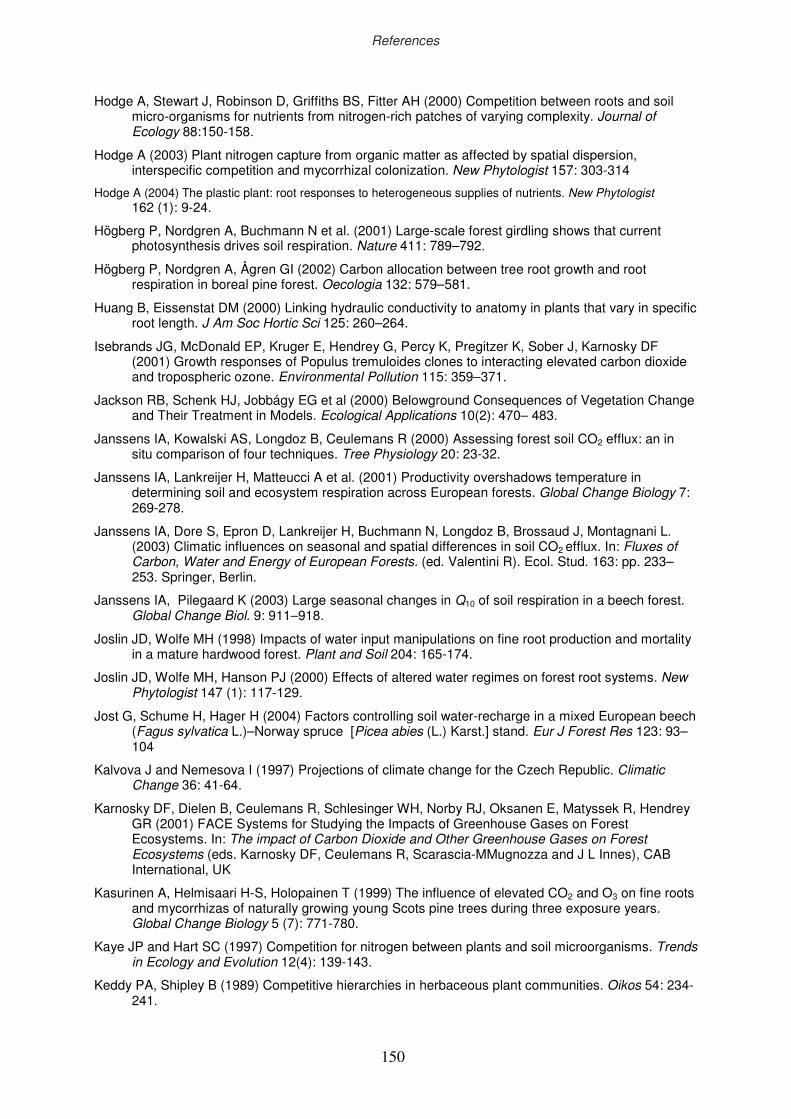
clvi
Hodge A, Stewart J, Robinson D, Griffiths BS, Fitter AH (2000) Competition between roots and soil micro-organisms for nutrients from nitrogen-rich patches of varying complexity. Journal of Ecology 88:150-158.
Hodge A (2003) Plant nitrogen capture from organic matter as affected by spatial dispersion, interspecific competition and mycorrhizal colonization. New Phytologist 157: 303-314
Hodge A (2004) The plastic plant: root responses to heterogeneous supplies of nutrients. New Phytologist 162 (1): 9-24.
Högberg P, Nordgren A, Buchmann N et al. (2001) Large-scale forest girdling shows that current photosynthesis drives soil respiration. Nature 411: 789–792.
Högberg P, Nordgren A, Ågren GI (2002) Carbon allocation between tree root growth and root respiration in boreal pine forest. Oecologia 132: 579–581.
Huang B, Eissenstat DM (2000) Linking hydraulic conductivity to anatomy in plants that vary in specific root length. J Am Soc Hortic Sci 125: 260–264.
Isebrands JG, McDonald EP, Kruger E, Hendrey G, Percy K, Pregitzer K, Sober J, Karnosky DF (2001) Growth responses of Populus tremuloides clones to interacting elevated carbon dioxide and tropospheric ozone. Environmental Pollution 115: 359–371.
Jackson RB, Schenk HJ, Jobbágy EG et al (2000) Belowground Consequences of Vegetation Change and Their Treatment in Models. Ecological Applications 10(2): 470– 483.
Janssens IA, Kowalski AS, Longdoz B, Ceulemans R (2000) Assessing forest soil CO2 efflux: an in situ comparison of four techniques. Tree Physiology 20: 23-32.
Janssens IA, Lankreijer H, Matteucci A et al. (2001) Productivity overshadows temperature in determining soil and ecosystem respiration across European forests. Global Change Biology 7: 269-278.
Janssens IA, Dore S, Epron D, Lankreijer H, Buchmann N, Longdoz B, Brossaud J, Montagnani L. (2003) Climatic influences on seasonal and spatial differences in soil CO2 efflux. In: Fluxes of Carbon, Water and Energy of European Forests. (ed. Valentini R). Ecol. Stud. 163: pp. 233–253. Springer, Berlin.
Janssens IA, Pilegaard K (2003) Large seasonal changes in Q10 of soil respiration in a beech forest. Global Change Biol. 9: 911–918.
Joslin JD, Wolfe MH (1998) Impacts of water input manipulations on fine root production and mortality in a mature hardwood forest. Plant and Soil 204: 165-174.
Joslin JD, Wolfe MH, Hanson PJ (2000) Effects of altered water regimes on forest root systems. New Phytologist 147 (1): 117-129.
Jost G, Schume H, Hager H (2004) Factors controlling soil water-recharge in a mixed European beech (Fagus sylvatica L.)–Norway spruce [Picea abies (L.) Karst.] stand. Eur J Forest Res 123: 93–104
Kalvova J and Nemesova I (1997) Projections of climate change for the Czech Republic. Climatic Change 36: 41-64.
Karnosky DF, Dielen B, Ceulemans R, Schlesinger WH, Norby RJ, Oksanen E, Matyssek R, Hendrey GR (2001) FACE Systems for Studying the Impacts of Greenhouse Gases on Forest Ecosystems. In: The impact of Carbon Dioxide and Other Greenhouse Gases on Forest Ecosystems (eds. Karnosky DF, Ceulemans R, Scarascia-MMugnozza and J L Innes), CAB International, UK
Kasurinen A, Helmisaari H-S, Holopainen T (1999) The influence of elevated CO2 and O3 on fine roots and mycorrhizas of naturally growing young Scots pine trees during three exposure years. Global Change Biology 5 (7): 771-780.
Kaye JP and Hart SC (1997) Competition for nitrogen between plants and soil microorganisms. Trends in Ecology and Evolution 12(4): 139-143.
Keddy PA, Shipley B (1989) Competitive hierarchies in herbaceous plant communities. Oikos 54: 234-241.
References
150
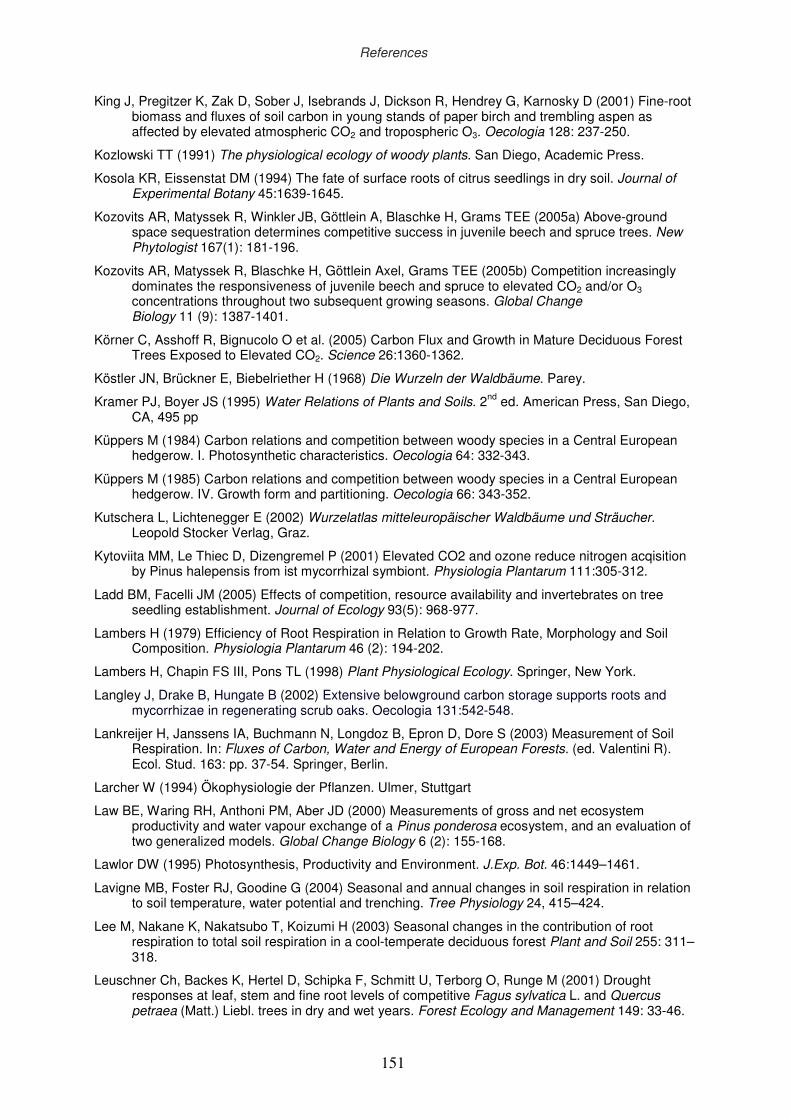
clvii
King J, Pregitzer K, Zak D, Sober J, Isebrands J, Dickson R, Hendrey G, Karnosky D (2001) Fine-root biomass and fluxes of soil carbon in young stands of paper birch and trembling aspen as affected by elevated atmospheric CO2 and tropospheric O3. Oecologia 128: 237-250.
Kozlowski TT (1991) The physiological ecology of woody plants. San Diego, Academic Press.
Kosola KR, Eissenstat DM (1994) The fate of surface roots of citrus seedlings in dry soil. Journal of Experimental Botany 45:1639-1645.
Kozovits AR, Matyssek R, Winkler JB, Göttlein A, Blaschke H, Grams TEE (2005a) Above-ground space sequestration determines competitive success in juvenile beech and spruce trees. New Phytologist 167(1): 181-196.
Kozovits AR, Matyssek R, Blaschke H, Göttlein Axel, Grams TEE (2005b) Competition increasingly dominates the responsiveness of juvenile beech and spruce to elevated CO2 and/or O3 concentrations throughout two subsequent growing seasons. Global Change Biology 11 (9): 1387-1401.
Körner C, Asshoff R, Bignucolo O et al. (2005) Carbon Flux and Growth in Mature Deciduous Forest Trees Exposed to Elevated CO2. Science 26:1360-1362.
Köstler JN, Brückner E, Biebelriether H (1968) Die Wurzeln der Waldbäume. Parey.
Kramer PJ, Boyer JS (1995) Water Relations of Plants and Soils. 2nd ed. American Press, San Diego, CA, 495 pp
Küppers M (1984) Carbon relations and competition between woody species in a Central European hedgerow. I. Photosynthetic characteristics. Oecologia 64: 332-343.
Küppers M (1985) Carbon relations and competition between woody species in a Central European hedgerow. IV. Growth form and partitioning. Oecologia 66: 343-352.
Kutschera L, Lichtenegger E (2002) Wurzelatlas mitteleuropäischer Waldbäume und Sträucher. Leopold Stocker Verlag, Graz.
Kytoviita MM, Le Thiec D, Dizengremel P (2001) Elevated CO2 and ozone reduce nitrogen acqisition by Pinus halepensis from ist mycorrhizal symbiont. Physiologia Plantarum 111:305-312.
Ladd BM, Facelli JM (2005) Effects of competition, resource availability and invertebrates on tree seedling establishment. Journal of Ecology 93(5): 968-977.
Lambers H (1979) Efficiency of Root Respiration in Relation to Growth Rate, Morphology and Soil Composition. Physiologia Plantarum 46 (2): 194-202.
Lambers H, Chapin FS III, Pons TL (1998) Plant Physiological Ecology. Springer, New York.
Langley J, Drake B, Hungate B (2002) Extensive belowground carbon storage supports roots and mycorrhizae in regenerating scrub oaks. Oecologia 131:542-548.
Lankreijer H, Janssens IA, Buchmann N, Longdoz B, Epron D, Dore S (2003) Measurement of Soil Respiration. In: Fluxes of Carbon, Water and Energy of European Forests. (ed. Valentini R). Ecol. Stud. 163: pp. 37-54. Springer, Berlin.
Larcher W (1994) Ökophysiologie der Pflanzen. Ulmer, Stuttgart
Law BE, Waring RH, Anthoni PM, Aber JD (2000) Measurements of gross and net ecosystem productivity and water vapour exchange of a Pinus ponderosa ecosystem, and an evaluation of two generalized models. Global Change Biology 6 (2): 155-168.
Lawlor DW (1995) Photosynthesis, Productivity and Environment. J.Exp. Bot. 46:1449–1461.
Lavigne MB, Foster RJ, Goodine G (2004) Seasonal and annual changes in soil respiration in relation to soil temperature, water potential and trenching. Tree Physiology 24, 415–424.
Lee M, Nakane K, Nakatsubo T, Koizumi H (2003) Seasonal changes in the contribution of root respiration to total soil respiration in a cool-temperate deciduous forest Plant and Soil 255: 311–318.
Leuschner Ch, Backes K, Hertel D, Schipka F, Schmitt U, Terborg O, Runge M (2001) Drought responses at leaf, stem and fine root levels of competitive Fagus sylvatica L. and Quercus petraea (Matt.) Liebl. trees in dry and wet years. Forest Ecology and Management 149: 33-46.
References
151
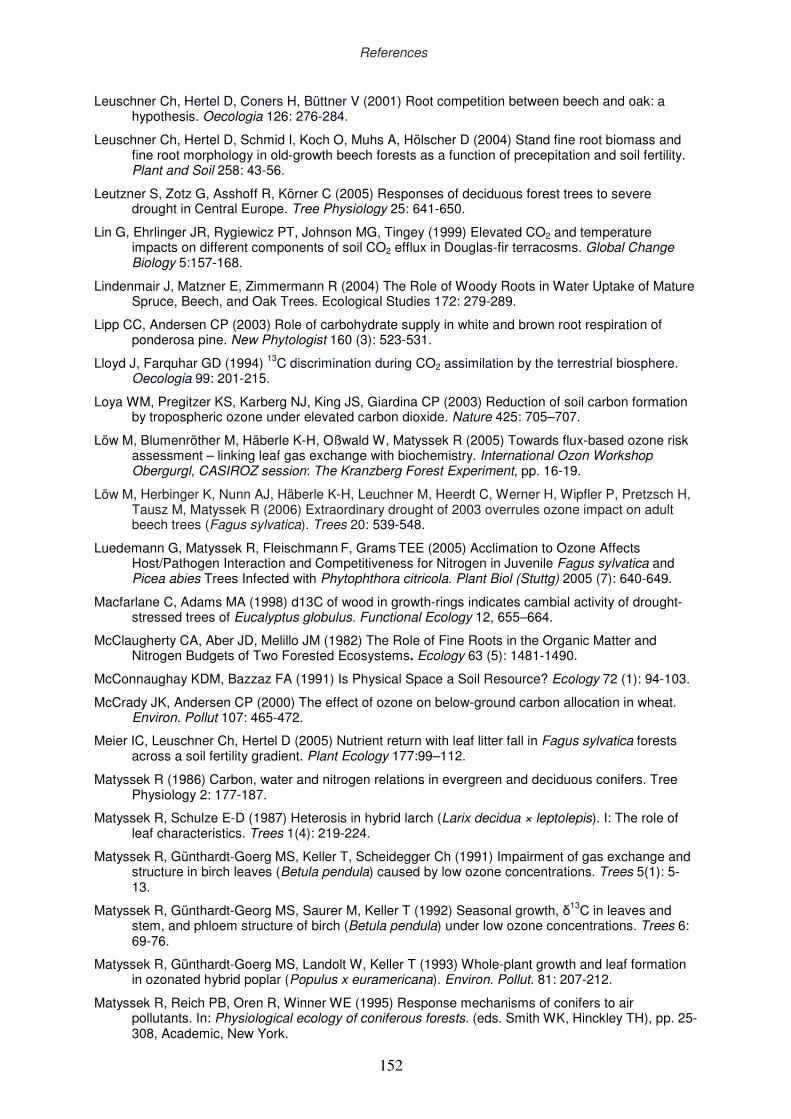
clviii
Leuschner Ch, Hertel D, Coners H, Büttner V (2001) Root competition between beech and oak: a hypothesis. Oecologia 126: 276-284.
Leuschner Ch, Hertel D, Schmid I, Koch O, Muhs A, Hölscher D (2004) Stand fine root biomass and fine root morphology in old-growth beech forests as a function of precepitation and soil fertility. Plant and Soil 258: 43-56.
Leutzner S, Zotz G, Asshoff R, Körner C (2005) Responses of deciduous forest trees to severe drought in Central Europe. Tree Physiology 25: 641-650.
Lin G, Ehrlinger JR, Rygiewicz PT, Johnson MG, Tingey (1999) Elevated CO2 and temperature impacts on different components of soil CO2 efflux in Douglas-fir terracosms. Global Change Biology 5:157-168.
Lindenmair J, Matzner E, Zimmermann R (2004) The Role of Woody Roots in Water Uptake of Mature Spruce, Beech, and Oak Trees. Ecological Studies 172: 279-289.
Lipp CC, Andersen CP (2003) Role of carbohydrate supply in white and brown root respiration of ponderosa pine. New Phytologist 160 (3): 523-531.
Lloyd J, Farquhar GD (1994) 13C discrimination during CO2 assimilation by the terrestrial biosphere. Oecologia 99: 201-215.
Loya WM, Pregitzer KS, Karberg NJ, King JS, Giardina CP (2003) Reduction of soil carbon formation by tropospheric ozone under elevated carbon dioxide. Nature 425: 705–707.
Löw M, Blumenröther M, Häberle K-H, Oßwald W, Matyssek R (2005) Towards flux-based ozone risk assessment – linking leaf gas exchange with biochemistry. International Ozon Workshop Obergurgl, CASIROZ session: The Kranzberg Forest Experiment, pp. 16-19.
Löw M, Herbinger K, Nunn AJ, Häberle K-H, Leuchner M, Heerdt C, Werner H, Wipfler P, Pretzsch H, Tausz M, Matyssek R (2006) Extraordinary drought of 2003 overrules ozone impact on adult beech trees (Fagus sylvatica). Trees 20: 539-548.
Luedemann G, Matyssek R, Fleischmann F, Grams TEE (2005) Acclimation to Ozone Affects Host/Pathogen Interaction and Competitiveness for Nitrogen in Juvenile Fagus sylvatica and Picea abies Trees Infected with Phytophthora citricola. Plant Biol (Stuttg) 2005 (7): 640-649.
Macfarlane C, Adams MA (1998) d13C of wood in growth-rings indicates cambial activity of drought-stressed trees of Eucalyptus globulus. Functional Ecology 12, 655–664.
McClaugherty CA, Aber JD, Melillo JM (1982) The Role of Fine Roots in the Organic Matter and Nitrogen Budgets of Two Forested Ecosystems. Ecology 63 (5): 1481-1490.
McConnaughay KDM, Bazzaz FA (1991) Is Physical Space a Soil Resource? Ecology 72 (1): 94-103.
McCrady JK, Andersen CP (2000) The effect of ozone on below-ground carbon allocation in wheat. Environ. Pollut 107: 465-472.
Meier IC, Leuschner Ch, Hertel D (2005) Nutrient return with leaf litter fall in Fagus sylvatica forests across a soil fertility gradient. Plant Ecology 177:99–112.
Matyssek R (1986) Carbon, water and nitrogen relations in evergreen and deciduous conifers. Tree Physiology 2: 177-187.
Matyssek R, Schulze E-D (1987) Heterosis in hybrid larch (Larix decidua × leptolepis). I: The role of leaf characteristics. Trees 1(4): 219-224.
Matyssek R, Günthardt-Goerg MS, Keller T, Scheidegger Ch (1991) Impairment of gas exchange and structure in birch leaves (Betula pendula) caused by low ozone concentrations. Trees 5(1): 5-13.
Matyssek R, Günthardt-Georg MS, Saurer M, Keller T (1992) Seasonal growth, δ13C in leaves and stem, and phloem structure of birch (Betula pendula) under low ozone concentrations. Trees 6: 69-76.
Matyssek R, Günthardt-Goerg MS, Landolt W, Keller T (1993) Whole-plant growth and leaf formation in ozonated hybrid poplar (Populus x euramericana). Environ. Pollut. 81: 207-212.
Matyssek R, Reich PB, Oren R, Winner WE (1995) Response mechanisms of conifers to air pollutants. In: Physiological ecology of coniferous forests. (eds. Smith WK, Hinckley TH), pp. 25-308, Academic, New York.
References
152
clix
Matyssek R (1999) How do plants grow under severe drought. In: Different pathways through life - biochemical aspects of plant biology and medicine. (eds. Denke A, Dornisch K, Fleischmann F, Graßmann J, Heiser I, Hippeli S, Oßwald W, Schempp H ), pp. 427-446, Lincom Studies in Biochemistry, Lincom Europa, München.
Matyssek R, Innes JL (1999) Ozone - a Risk Factor for Trees and Forests in Europe. Water, Air &Soil Pollution 116: 199-226.
Matyssek R, Schnyder H, Elstner E-F, Munch J-C, Pretzsch H, Sandermann H (2002) Growth and Parasite Defence in Plants; the Balance between Resource Sequestration and Retention: In Lieu of a Guest Editorial. Plant Biol. 4: 133-136.
Matyssek R, Sandermann H (2003) Impact of ozone on trees: an ecophysiological perspective. Progress in Botany 64: 349–404.
Matyssek R, Wieser G, Nunn AJ, Kozovits AR, Reiter IM, Heerdt C, Winkler JB, Baumgarten M, Häberle K-H, Grams TEE, Werner H, Fabian P, Havranek WM (2004) Comparison between AOT40 and ozone uptake in forest trees of different species, age and site conditions. Atmospheric Environment 38: 2271–2281.
Matyssek R, Wieser G, Nunn AJ et al. (2006) How sensitive are forest trees to ozone? – New research on an old issue. In: Omasa, K., Nouchi, I., De Kok, L.J., (Eds.) Plant Responses to Air Pollution and Global Change. Springer Verlag Tokyo
McCrady JK, Andersen CP (2000) The effect of ozone on below-ground carbon allocation in wheat. Environmental Pollution 107(3): 465-472.
Mittler R, Merquiol E, Hallak-Herr E, Rachmilevitch S, Kaplan A, & Cohen M (2001) Living under a 'dormant' canopy: a molecular acclimation mechanism of the desert plant Redama raetam. Plant Journal 25: 407–416.
Mittler R (2002) Oxidative stress, antioxidants and stress tolerance. Trends in Plant Science 7(9): 405-410.
Möller CM, Müller D, Nielsen J (1954) Respiration in stem and branches of beech. Det Forstlige Forsoegsvaesen I Danmark 21: 273–301.
Musselman RC, McCool PM, Lefohn AS (1994) Ozone descriptors for an air quality standard to protect vegetation. Journal of the Air and Waste Management Association 44: 1383-1390.
Münzenberger B, Golldack J, Ullrich A, Schmincke B, Hüttl RF (2004) Abundance, diversity, and vitality of mycorrhizae of Scots pine ( Pinus sylvestris L.) in lignite recultivation sites. Mycorrhiza 14: 193-202.
Nehls U, Hampp R (2000) Carbon allocation in ectomycorrhizas. Physiological and Molecular Plant Pathology 57(3): 95-100.
Nobel PS (1991) Physiochemical and Environmental Plant Physiology. Academic Press, San Diego.
Nunn AJ, Reiter IM, Haberle K-H, Werner H, Langebartels C, Sandermann H, Heerdt C, Fabian P, Matyssek R (2002) “Free-Air” Ozone Canopy Fumigation in an Old-Growth Mixed Forest: Concept and Observations in Beech. Phyton (Austria), Vol. 42:105-119.
Nunn AJ, Reiter IM, Häberle K-H, Langebartels Ch, Bahnweg G, Pretzsch H, Sandermann H, Matyssek R (2005a) Response patterns in adult forest trees to chronic ozone stress: identification of variations and consistencies. Environmental Pollution 136: 365-369.
Nunn AJ, Kozovits AR, Reiter IM et al. (2005b) Comparison of ozone uptake and sensitivity between a phytotron study with young beech and a field experiment with adult beech (Fagus sylvatica). Environmental Pollution 137: 494-506.
O’Brien EE, Gersani M, Brown JS (2005) Root proliferation and seed yield in response to spatial heterogeneity of below-ground competition. New Phytologist 168: 401–412.
Olofsdotter M, Jensen LB, Courtois B (2002) Improving crop competitive ability using allelopathy - an example from rice. Plant Breeding 121: 1-9.
Ostonen I, Lõhmus K and Rein Lasn R (2004)The role of soil conditions in fine root ecomorphology in Norway spruce (Picea abies (L.) Karst.). Plant and Soil 208: 283-292.
References
153 153
clx
Osunubi O, Davies WJ (1981) Root growth and water relations of oak and birch seedlings. Oecologia (Berlin) 51: 343-350.
Otto H-J (1994). Waldökologie, Eugen Ulmer Verlag, Stuttgart.
Parkinson KJ (1981) An improved method for measuring soil respiration in the field. J. Appl. Ecol. 18: 221-228.
Patzner KM (2004) Die Transpiration von Waldbäumen als Grundlage der Validierung und Modellierung der Bestandestranspiration in einem Wassereinzugsgebiet des Flusses “Ammer” PhD Thesis, Ecophysiology of Plants, Technische Universität München, Freising, p 168.
Pedersen JB and Bille-Hansen J (1999) A comparison of litterfall and element fluxes in even aged Norway spruce, sitka spruce and beech stands in Denmark. Forest Ecology and Management 114: 55-70.
Peuke AD, Schraml C, Hartung W, Rennenberg H (2002) Identification of drought-sensitive beech ecotypes by physiological parameters. New Phytologist 154(2): 373-387.
Pinheiro C, Chaves M, Ricardo CP (2001) Alterations in carbon and nitrogen metabolism induced by water deficit in the stems and leaves of Lupinus albus L. Journal of Experimental Botany 52: 1063-1070.
Pockman WT, Sperry SI & O'leary JW(1995) Sustained and significant negative water pressure in xylem. Nature 378: 715 – 716.
Polle A (1998) Photochemical oxidants: uptake and detoxification mechanisms. In: Responses of plant metabolism to air pollution. (eds. DeKok LJ, Stulen I) Backhuys Publishers, Leiden, pp. 95-116.
Poorter H, Navas M-L (2003) Plant growth and competition at elevated CO2: on winners, losers and functional groups. New Phytologist 157 (2), 175-198.
Pregitzer KS, Hendrick RL, Fogel R (1993) The demography of fine roots in response to patches of water and nitrogen. New Phytol 125:575–580.
Pregitzer KS (2002) The fine roots of trees – a new perspective. New Phytologist 154:267-273.
Pregitzer KS, Loya W, Kubiske M, Zak D (2006) Soil respiration in northern forests exposed to elevated atmospheric carbon dioxide and ozone. Oecologia 148: 503-516.
Pretzsch H, Kahn M, Grote R (1998) Die Fichten-Buchen-Mischbestände des Sonderforschungsbereiches “Wachstum oder Parasitenabwehr?” im Kranzberger Forst. Forstw. Centr. 117: 201-207.
Pretzsch H (2004) Diversity and Productivity in Forests: Evidence from Long-Term Experimental Plots. Ecological Studies 176
Pretzsch H (2004) Gesetzmäßigkeit zwischen Bestandesdichte und Zuwachs. Lösungsansatz am Beispiel von Reinbeständen aus Fichte (Picea abies [L.] Karst.) und Buche (Fagus sylvatica L.) Tagungsbericht anläßlich der Jahrestagung 2004 der Sektion Ertragskunde im Deutschen Verband Forstlicher Forschungsanstalten,Stift Schlägl, Österreich, pp.165-179.
Pritsch K, Luedemann G, Matyssek R, Hartmann A, Schloter M, Scherb H, Grams TEE (2005) Mycorrhizosphere Responsiveness to Atmospheric Ozone and Inoculation with Phytophthora citricola in a Phytotron Experiment with Spruce/Beech Mixed Cultures. Blant biol 7: 718-727.
Puhe J (2003) Growth and development of the root system of Norway spruce (Picea abies) in forest stands—a review. Forest Ecology and Management 175: 253-273
Pumpanen J, Ilvesniemi H, Perämäki M, Hari P (2003) Seasonal patterns of soil CO2 efflux and soil air CO2 concentration in a Scots pine forest: comparison of two chamber techniques. Global Change Biology 9: 371-382.
Raghothama KG, Karthikeyan AS (2005) Phosphate Acquisition. Plant and Soil 274: 37-49.
Raich JW and Potter CS (1995) Global patterns of carbon dioxide emissions from soils. Global Biochemical Cycles 9, 23-36.
Raich JW, Tufekcioglu A (2000) Vegetation and soil respiration: correlations and controls. Biogeochemistry, 48: 71–90.
Raidl S (1997) Studien zur Ontogenie an Rhizomorphen von Ektomykorrhizen. Brbl Mycol 169: 1-184.
References
154
clxi
Raspe S (2003) Die Trockenheit und ihre Folgen für den Wald in Bayern. LWF aktuell 40: 26-27.
Raspe S, Grimmeisen W, Schultze B (2004) Der Sommer 2003 grub dem Wald das Wasser ab. In: Bayer. Landesanstalt für Wald und Forstwirtschaft (LWF) (ed.): Auswirkungen der Trockenheit 2003, Waldschutzsituation 2004. LWF aktuell 43: 4-6, Freising.
Raich JW and Potter CS (1995) Global Patterns of Carbon Dioxide Emissions from Soils. Global Biogeochemical Cycles 9: 23-36.
Raynaud X, Leadley PW (2004) Soil characteristics play a key role in modelling nutrient competition in plant communities. Ecology 85(8): 2200-2214
Reichstein M, Tenhunen JD, Roupsard O, Ourcival J-M, Rambal S, Dore S, Valentini R (2002) Ecosystem respiration in two Mediterranean evergreen Holm Oak forests: drought effects and decomposition dynamics. Functional Ecology 16: 27-39.
Reiter IM (2004) Space-related resource investments and gains of adult beech (Fagus sylvatica) and spruce (Picea abies) as a quantification of aboveground competitiveness. PhD Thesis, Ecophysiology of Plants, Technische Universität München, Freising, p 167.
Reiter IM, Häberle K-H, Nunn AJ, Heerdt C, Reitmayer H, Grote R, Matyssek R (2005) Competitive strategies in adult beech and spruce: space-related foliar carbon investment versus carbon gain. Oecologia 146(3): 337-349.
Rennenberg H, Seiler W, Matyssek R, Geßler A, Kreuzwieser J (2004) Die Buche (Fagus sylvatica L.) – ein Waldbaum ohne Zukunft im südlichen Mitteleuropa? Allgemeine Forst- und Jagdzeitung 175: 210-224.
Rey A, Pegoraro E, Tedeschi V et al. (2002) Annual variation in soil respiration and its components in a coppice oak forest in Central Italy. Global Change Biology, 8: 851–866.
Retzlaff WA, Weinstein DA, Laurence JA, Gollands B (1997) Simulating the growth of a 160-year-old sugar maple (Acer saccharum) tree with and without ozone exposure using the TREGROW model. Canadian Journal of Forest Research 27: 783–789.
Rustad LE, Huntington TG, Boone RD (2000) Controls on soil respiration: Implications for climate change. Biogeochemistry 48: 1–6.
Saleem A, Loponen J, Kalevi Pihlaja K, Oksanen E (2001) Effects of Long-Term Open-Field Ozone Exposure on Leaf Phenolics of European Silver Birch (Betula pendula Roth). Journal of Chem. Ecol. 27: 1049-1062.
Saurer M, Maurer S, Matyssek R, Landolt W, Günthardt-Goerg MS, Siegenthaler U (1995) The influence of ozone and nutrition on δ13C in Betula pendula. Oecologia 103: 397-406.
Scagel CF, Andersen CP (1997) Seasonal changes in root and soil respiration of ozone-exposed ponderosa pine (Pinus ponderosa) grown in different substrates. New Phytologist 136: 627-643
Schenk HJ, Callaway RM, Mahall BE (1999) Spatial root segregation: are plants territorial? Advances in Ecological Research 28: 145–180.
Schlesinger WH and Andrews JA (2000) Soil respiration and the global carbon cycle. Biogeochemistry 48: 7–20.
Schmid I (2002) The influence of soil type and interspecific competition on the fine root system of Norway spruce and European beech. Basic Appl. Ecol. 3: 339-346.
Schmid I, Kazda M (2002) Root distribution of Norway spruce in monospecific and mixed stands on different soils. Forest Ecology and Management 159: 37-47.
Schmid I, Kazda M (2005) Clustered root distribution in mature stands of Fagus sylvatica and Picea abies. Oecologia 144: 25-31.
Schmidt-Vogt H (1989) Die Fichte. Bd. 2, T.1: Wachstum, Züchtung, Boden, Umwelt, Holz; Ein Handbuch in 2 Bänden. Parey, Hamburg
Schuhbäck T (2004) Nährelementenstatus und Bodenzustand an der Bestandesgrenze Buche-Fichte im Mischbestand Kranzberger Forst. Diploma Thesis, WZW, Technische Universität München, Freising, p 65.
Schulze E-D (1994) Flux control in biological systems. Academic Press, San Diego
References
155

clxii
Schume H, Jost G, Katzensteiner K (2003) Spatio-temporal analysis of the soil water content in a mixed Norway spruce (Picea abies(L.) Karst.) – European beech (Fagus sylvatica L.) stand. Geoderma 112: 273-287.
Schume H, Grabner M, Eckmüllner O (2004) The influence of an altered groundwater regime
on vessel properties of hybrid poplar. Trees 18:184–194.
Schütt P, Schuck HJ, Aas G (2002) Enzyklopädie der Holzgewächse. Handbuch und Atlas der Dendrologie. Ecomed Verlag
Schütz JP (1990) Sylviculture 1, Principles d’éducation des forêts. Presses polytechniques et universitaires Romandes, 243 p
Schjønning P, Thomsen IK, Moldrup P, Christensen BT, (2003) Linking Soil Microbial Activity to Water- and Air-Phase Contents and Diffusivities. Soil Sci. Soc. Am. J. 67:156–165.
Smith SE, Read DJ (1997) Mycorrhizal symbiosis. San Diego, Academic Press, CA
Smirnoff N (1995) Antioxidant systems and plant response to the environment. In: Environment and plant metabolism: flexibility and acclimation. (ed. Smirnoff N), pp. 217-243, Bios Scientific Publishers, Oxford.
Steudle E (2000) Water uptake by roots: effects of water deficit. Journal of Experimental Botany 51(350):1531-1542.
Subke J-A, Reichstein M, Tenhunen JD (2003) Explaining temporal variation in soil CO2 efflux in a mature spruce forest in South Germany. Soil Biology and Biochemistry 35: 1467-1483.
Taleisnik E, Peyrano G, Cordoba A, Arias C (1999) Water Retention Capacity in Root Segments Differing in the Degree of Exodermis Development. Ann. of Bot. 83:19-27.
Tang J, Qi Y, Xu M, Misson L, Goldstein A (2005) Forest thinning and soil respiration in ponderosa pine plantation in the Sierra Nevada. Tree Physiology 25: 57-66.
Thierron V, Laudelout H (1996) Contribution of root respiration to total CO2 efflux from the soil of a deciduous forest. Canadian Journal of Forest Research, 26: 1142–1148.
Tibbett M, Sanders FE, Cairney JWG (1998) The effect of temperature and inorganic phosphorus supply on growth and acid phosphatase production in arctic and temperate strains of ectomycorrhizal Hebeloma spp. in axenic culture. Mycol. Res. 102: 129-135.
Tibbett M (2000) Roots, Foraging and the Exploitation of Soil Nutrient Patches: The Role of Mycorrhizal Symbiosis. Functional Ecology 14(3): 397-399.
Tilman GD (1982) Resource Competition and Community Structure. Princenton Univ. Press, Princenton, New Jersey.
Tilman GD (1988) Plant Strategies and the Dynamics and Structure of Plant Communities. Princeton Monographs, Princeton, New Jersey.
Tsur Y, Zemel A (2004) Resource Exploitation, Biodiversity and Ecological Events. http://departments.agri.huji.ac.il/economics/indexe.html
Tyree MT, Zimmermann MH (2002) Xylem structure and the ascent of sap. Berlin, Germany: Springer Verlag.
Uddling J, Günthardt-Goerg MS, Matyssek R, Oksanen E, Pleijel H, Sellde´n G, Karlsson PE (2004). Biomass reduction of juvenile birch is more strongly related to stomatal uptake of ozone than to indices based on external exposure. Atmos. Environ (38): 4709–4719.
Utriainen J, Holopainen T (2001) Nitrogen availability modifies the ozone responses of Scots pine seedlings exposed in an open-field system. Tree Physiology 21(16): 1205-1213.
Utschig H, Bachmann M und Pretzsch H (2004) Das Trockenjahr 1976 bescherte langjährige Zuwachseinbrüche. LWF aktuell 43: 17-18.
VanderHeyden D, Skelly J, Innes J, Hug C, Zhang J, Landolt W, Bleuler P (2001) Ozone exposure thresholds and foliar injury on forest plants in Switzerland. Environmental Pollution 111: 321-331.
Vogt KA, Vogt DJ, Bloomfield J (1998) Analysis of some direct and indirect methods for estimating root biomass and production of forests at an ecosystem level. Plant and Soil 200: 71-89.
References
156
clxiii
Vogt KA, Peterson H. 1991. Root methods. In: Techniques and approaches in forest tree ecophysiology. (Lassoie JP & Hincley TM, eds.), CRC Press, 599 pp.
Volder A, Smart DR, Bloom AJ, Eissenstat DM (2005) Rapid decline in nitrate uptake and respiration with age in fine lateral roots of grape: implications for root efficiency and competitive effectiveness. New Phytologist 165: 493-502
Warren CR, McGrath JF, Adams MA (2001) Water availability and carbon isotope discrimination in conifers. Oecologia 127: 476–486.
Walker TS, Bais, HP, Grotewold E, Vivanco JM (2003) Root exudation and rhizosphere biology. Plant Physiology (132) 44–51.
Wallander H, Nilsson LO, Hagerberg D, Bååth E (2001) Estimation of the biomass and seasonal growth of external mycelium of ectomycorrhizal fungi in the field. New Phytologist 151: 753–760.
Warren CR, McGrath JF, Adams MA (2001) Water availability and carbon isotope discrimination in conifers. Oecologia 127: 476-486.
Weigelt A & Jolliffe P (2003) Indices of plant competition. Journal of Ecology 91 (5), 707-720.
Wells KE, Eissenstat DM (2001) Marked Differences in Survivorship among Apple Roots of Different Diameters. Ecology 82: 882-892.
Wells CE, Glenn MD, Eissenstat DM (2002) Changes in the risk of fine-root mortality
with age: a case study in peach, Prunus persica (Rosaceae). American Journal of Botany 89(1): 79–87.
Werner H, Fabian P (2002) Free-Air fumigation of mature trees. Environ Sci Pollut Res 8: 1-15.
Wieser G (2002) Seasonal variation of soil respiration in a Pinus cembra forest at the
upper timberline in the Central Austrian Alps. Tree Physiology 24: 475–480.
Withington JM, Elkin AD, Bu aj B, Olesi ski J, Tracy KN, Bouma TJ, Oleksyn J, Anderson LJ, Modrzy ski J, Reich PB, Eissenstat DM (2003). The impact of material used for minirhizotron tubes for root research. New Phytologist 160: 533-544.
Wipfler P, Seifert T, Heerdt C, Werner H, and Pretzsch H (2005) Growth of Adult Norway Spruce (Picea abies [L.] Karst.) and European Beech (Fagus sylvatica L.) Under Free-Air Ozone Fumigation. Plant biol 7: 611-618.
Xu M, Qi Y (2001) Separating the effects of moisture and temperature on soil CO2 efflux in a coniferous forest in the Sierra Nevada mountains. Plant Soil 237:15–23.
Yanai RD, Fahey TJ, Miller SL (1995) Efficiency of Nutrient Acquisition by Fine Roots and Mycorrhizae. In: Resource Physiology of Conifers. Academic Press Inc.
Zak DR, Tilman D, Parmenter RR, Rice CW, Fisher FM, Vose J, Milchunas D, Martin CW (1994) Plant Production and Soil Microorganisms in Late-Successional Ecosystems: A Continental-Scale Study. Ecology 75(8): 2333-2347.
Zak DR, Pregitzer KS, King JS, Holmes WE (2000) Elevated atmospheric CO2, fine roots and the response of soil microorganisms: a review and hypothesis. New Phytologist 147 (1): 201-222.
Zirlewagen D and von Wilpert K (2001) Modeling water and ion fluxes in a highly structured,
mixed-species stand. Forest Ecology and Management 143: 27-37.
References
157

clxiv
158
clxv
8 ACKNOWLEDGEMENTS Ich bedanke mich herzlich bei… Meiner Familie: Meinen Eltern Wasilka und Simeon für ALLES; Meinem Sohn Ivan für die Liebe und für die neue Auffassung meines Lebens; Meinem Ehemann Ivan für das Mitmachen und für den eingegangenen Kompromiss; Meinem Bruder Ivaylo und seiner Familie für die Unterstützung. Meinem Doktorvater: Prof. Dr. Rainer Matyssek für die Chance, meinen beruflichen Traum bei besten Arbeitsbedingungen erfüllen zu können, für die langen spannenden Diskussionsrunden, für seine intensive wissenschaftliche Betreuung und für die konstruktive und angenehme Arbeitsatmosphäre am Lehrstuhl. Meinen wissenschaftlichen Betreuern: Dr. Helmut Blaschke für seine unersetzbare Freundschaft, für seine unendlichen Informationsquellen, für die unermüdliche Hilfsbereitschaft und für die „ungesagten Worte/Gedanken“, über die man immer nachdenken könnte… Dr. Karl-Heinz Häberle für seine unersetzbare Unterstützung, für seinen gesunden Realismus, für unsere scharfen und konstruktiven Diskussionen, für die entscheidende Korrekturarbeit am Manuskript der vorliegenden Arbeit und für seinen wertvollen Tipp (die „drei heiligen K“), den ich am Anfang meiner Doktorandenzeit bekommen habe… Meinen Arbeitskollegen: Thomas Feuerbach, Peter Kuba, Johanna Lebherz und Ilse Süß für die freundlichen Unterstützung und ihren professionellen technischen Einsatz; Karin Beerbaum und Helga Brunner für die erfolgreiche Bekämpfung organisatorischer Probleme und für die angenehmen Gespräche während der Kaffeepausen; Allen Doktoranden am Lehrstuhl für deren ansteckenden Ehrgeiz, ihre Fachkompetenz und die freundliche Arbeitsatmosphäre; Meinen treuen HiWis Ivan und Kathy für deren Fleiß und unermüdliche Hilfsbereitschaft. Meinen Kooperationspartnern: Prof. Dr. Hans Schnyder und Dr. Rudi Schäufele (Lehrstuhl für Grünlandlehre, WZW, TUM) für die Ermöglichung der δ13C Bestimmung in Wurzeln; Prof. Dr. Hans Pretzsch, Dr. Thomas Seifert und Philip Wipfler (Lehrstuhl für Waldwachstumskunde, WZW, TUM) für die CT- Analysen der Grobwurzeln, Bereitstellung von SDI-Datensätzen, sowie für die freundliche Zusammenarbeit; PhD Christian P. Andersen (US Environmental Protection Agency, Western Ecology Division, OR) für die freundliche Unterstützung und die wertvollen Diskussionen, sowie für die gute Zusammenarbeit; Prof. Dr. Axel Göttlein und Günther Bartonek (Fachgebiet Waldernährung und Wasserhaushalt, WZW, TUM) für die Durchführung der C- und Nährstoffanalysen, sowie für die freundliche Zusammenarbeit; Dr. Stephan Raspe (Sachgebiet II, Standort und Umwelt, LWF) für die Berechnung des ASW, sowie für die produktive Zusammenarbeit; Prof. Dr. Wolfgang Oßwald, Dr. Frank Fleischmann und Tina Schmidt (Fachgebiet Pathologie der Waldbäume, WZW, TUM) für die Einweisung in die NSC-Analytik und ihre Hilfe bei manchen technischen Problemen ; Prof. Dr. Marianne Popp (Institut für Ökologie und Naturschutz der Universität Wien) für die Ermöglichung von Pinitol- Expertise; Dr. Holger Holland-Moritz (Zentrale Dienste und Forstpolitik, LWF) für die wertvollen statistischen Tipps; Dr. Michael Leuchner (Lehrstuhl für Ökoklimatologie, WZW, TUM) für die Bereitstellung von GTR-Datensätzen, sowie für die freundliche Zusammenarbeit. Meinen Freunden: Allen Familienfreunden, wohnhaft in Freising und in Landau/Pfalz, sowie Bettina, Dima, Nora, Bistra, Dyana und Ani, die während der Stunden der Erholung unersetzbar waren. Den Finanzstellen: Der DFG (Deutsche Forschungsgemeinschaft) für die Finanzierung dieser Arbeit im Rahmen des Sonderforschungsbereiches SFB 607/Projekt B4; Der Frauenförderung der TU München (HWP-II Programm) für die Finanzierung der Abschlussphase der Promotion.
159

clxvi
160

clxvii
Curriculum Vitae
Personal data Name
Petia Simeonova Nikolova
Address Horstschanze 31 D-76829 Landau in der Pfalz [email protected]
Date and place of birth 11.04.1970; Sofia, Bulgaria
Family status Married, 1 child Education and professional experience 1977 - 1984 1984 - 1986 1986 - 1988 5/1991 1988 – 1990 1990 – 1995 6/1995 1996 – 2001 1/2002 – 11/2006
Ivan Paschov Russian Primary school in Sofia, Bulgaria Karl Liebknecht German Grammar school in Sofia, Bulgaria 1st Grammar school in Usogorsk, Russia School leaving examinations in Mathematics, Physics, Chemistry, Biology, Russian and Bulgarian languages Karl Liebknecht Grammar school in Sofia, Bulgaria School leaving examination as private scholar in German language Technical University of Riga, Latvia Study of Informatics University of Forestry, Sofia, Bulgaria Study of Forestry MSc Thesis in Forest Genetics University of Forestry, Sofia, Bulgaria Assistant professor in Physiology and Ecophysiology of Forest Plants Technische Universität München, WZW, Ecophysiology of Plants PhD Thesis
161
clxviii
Personal publications
Nikolova P., H. Blaschke and R. Matyssek (2006): Digital in situ recording of fine-root architecture and growth dynamics. In: Handbook of Methods Used in Rhizosphere Research. COST 631 – Understanding and Modelling Interactions in the Root Environment (ed. Jörg Luster and Roger Finlay), pp. 170-171. WSL, Birmensdorf. Blaschke H., Nikolova P., Raidel S. and R. Matyssek (2006): Slim cases for digital recording of ectomycorrhiza formation in situ. In: Handbook of Methods Used in Rhizosphere Research. COST 631 – Understanding and Modelling Interactions in the Root Environment (eds. Jörg Luster and Roger Finlay), pp. 380-381. WSL, Birmensdorf. Andersen C. P., I. Nikolov, P. Nikolova, K.-H. Häberle and R. Matyssek (2005): Estimating “autotrophic” belowground respiration in spruce and beech forests: decreases following girdling. European Journal of Forest Research 124:155-163 Grulke N.E., Johnson R., Monschein S., Nikolova P. and M. Tausz (2003): Variation in morphological and biochemical O3 injury attributes of mature Jeffrey pine within canopies and microsites. Tree Physiology 23: 923-929 Schuetzenduebel A., P. Nikolova, C. Rudolf and A. Polle (2002): Cadmium and H2O2-induced oxidative stress in Populus × canescens roots. Pant Phys. And Biochem. 40: 577-584 Nikolova P. and A. Maier-Dinkel (2000): Cryoconservation of Juglans regia L. somatic embryos. Forestry Ideas 23: 11-16
Posters und Presentations
Nikolova P., S. Raspe, H. Blaschke, R. Matysek, K.-H. Häberle: 25.-26.09.2006: Drought effects on soil respiration components in a mature Fagus sylvatica/Picea abies forest. 17. Wissenschaftliche Arbeitstagung “Ökophysilogie des Wurzelraumes” Stuttgart-Hohenheim, Deutschland (oral presentation) Nikolova P., K.-H. Häberle, H. Blaschke, R. Matyssek: 3.-5.09.2006: Below-ground diagnostics of above-ground ozone impact on adult beech and spruce forest trees. 11. SETAC-GLB Jahrestagung Landau, Deutschland (oral presentation) Nikolova P., S. Raspe, H. Blaschke, R. Matysek, K.-H. Häberle: 3.-5.04.2006: Drought effects on soil respiration components in a mature Fagus sylvatica/Picea abies forest. 11. Jahrestagung des Experimentalkreises “Experimentelle Ökologie der GfÖ”, Ulm, Deutschland (oral presentation) Nikolova P., H. Blaschke, K.-H. Häberle, R. Matyssek: 17.-23.07.2005: Fine roots of beech and spruce: functional categories revisited. XVII International Botanical Congress, Wien, Österreich (poster presentation) Nikolova P., H. Blaschke, K.-H. Häberle, R. Matyssek: 17.-19.11.2004: The summer of 2003: a test scenario for the root competitiveness of adult beech and spruce. International Scientific Conference Impacts of the Drought and Heat in 2003 on Forests, Freiburg, Deutschland (oral presentation) Nikolova P., H. Blaschke, K.-H. Häberle, R. Matyssek: 6.-8. 10.2004: The summer of 2003: a test scenario for the root competitiveness of adult beech and spruce. Forstwissenschaftliche Tagung, Freising, Deutschland (poster presentation)
162
clxix
Nikolova P., H. Blaschke, K.-H. Häberle, R. Matyssek: 12.-17.09.2004: The summer of 2003: a test scenario for the root competitiveness of adult beech and spruce. International Congress Rhizosphere 2004 - Perspectives and Challenges - A Tribute to Lorenz Hiltner in München, Deutschland (poster presentation) Nikolova P., H. Blaschke, K.-H. Häberle, R. Matyssek: 5.-8.04.2004: The exceptional summer of 2003 as a test scenario for the root competition between adult beech and spruce forest trees. 9. Jahrestagung des Experimentalkreises “Experimentelle Ökologie der GfÖ”, Potsdam, Deutschland (oral presentation) Nikolova P., H. Blaschke, K.-H. Häberle, R. Matyssek: 5.-8.04.2004: Use of computer tomography and microscopy for localisation and analysis of the conductive xylem area in coarse roots. 9. Jahrestagung des Experimentalkreises “Experimentelle Ökologie der GfÖ”, Potsdam, Deutschland (poster presentation) Nikolova P., H. Blaschke, K.-H. Häberle, R. Matyssek: 08.-10.04.2003: Belowground competition between beech and spruce in a mixed forest and the influence of tropospheric ozone. 8. Jahrestagung des Experimentalkreises “Experimentelle Ökologie der GfÖ”, Hohenheim, Deutschland (oral presentation)
163
Copyright © 2022 FDOKUMEN


![genetic variation of norway spruce (picea abies [l.] karst ...](https://static.fdokumen.com/doc/165x107/633d6582b988f9753c06267d/genetic-variation-of-norway-spruce-picea-abies-l-karst-.jpg)