Replacement Patterns of Beech and Sugar Maple in Warren Woods, Michigan
26
Replacement Patterns of Beech and Sugar Maple in Warren Woods, Michigan Thomas L. Poulson; William J. Platt Ecology, Vol. 77, No. 4. (Jun., 1996), pp. 1234-1253. Stable URL: http://links.jstor.org/sici?sici=0012-9658%28199606%2977%3A4%3C1234%3ARPOBAS%3E2.0.CO%3B2-B Ecology is currently published by Ecological Society of America. Your use of the JSTOR archive indicates your acceptance of JSTOR's Terms and Conditions of Use, available at http://www.jstor.org/about/terms.html. JSTOR's Terms and Conditions of Use provides, in part, that unless you have obtained prior permission, you may not download an entire issue of a journal or multiple copies of articles, and you may use content in the JSTOR archive only for your personal, non-commercial use. Please contact the publisher regarding any further use of this work. Publisher contact information may be obtained at http://www.jstor.org/journals/esa.html. Each copy of any part of a JSTOR transmission must contain the same copyright notice that appears on the screen or printed page of such transmission. The JSTOR Archive is a trusted digital repository providing for long-term preservation and access to leading academic journals and scholarly literature from around the world. The Archive is supported by libraries, scholarly societies, publishers, and foundations. It is an initiative of JSTOR, a not-for-profit organization with a mission to help the scholarly community take advantage of advances in technology. For more information regarding JSTOR, please contact [email protected]. http://www.jstor.org Thu Jan 3 22:20:27 2008
-
Upload
independent -
Category
Documents
-
view
0 -
download
0
Transcript of Replacement Patterns of Beech and Sugar Maple in Warren Woods, Michigan

Replacement Patterns of Beech and Sugar Maple in Warren Woods, Michigan
Thomas L. Poulson; William J. Platt
Ecology, Vol. 77, No. 4. (Jun., 1996), pp. 1234-1253.
Stable URL:
http://links.jstor.org/sici?sici=0012-9658%28199606%2977%3A4%3C1234%3ARPOBAS%3E2.0.CO%3B2-B
Ecology is currently published by Ecological Society of America.
Your use of the JSTOR archive indicates your acceptance of JSTOR's Terms and Conditions of Use, available athttp://www.jstor.org/about/terms.html. JSTOR's Terms and Conditions of Use provides, in part, that unless you have obtainedprior permission, you may not download an entire issue of a journal or multiple copies of articles, and you may use content inthe JSTOR archive only for your personal, non-commercial use.
Please contact the publisher regarding any further use of this work. Publisher contact information may be obtained athttp://www.jstor.org/journals/esa.html.
Each copy of any part of a JSTOR transmission must contain the same copyright notice that appears on the screen or printedpage of such transmission.
The JSTOR Archive is a trusted digital repository providing for long-term preservation and access to leading academicjournals and scholarly literature from around the world. The Archive is supported by libraries, scholarly societies, publishers,and foundations. It is an initiative of JSTOR, a not-for-profit organization with a mission to help the scholarly community takeadvantage of advances in technology. For more information regarding JSTOR, please contact [email protected].
http://www.jstor.orgThu Jan 3 22:20:27 2008

Ecology, 77(4). 1996. pp. 1234-1253 0 1996 by the Ecological Society of America
REPLACEMENT PATTERNS OF BEECH AND SUGAR MAPLE IN WARREN WOODS. MICHIGAN1
THOMASL. POULSON Departnzent of Biological Sciences (mlc 066), University of Illinois at Chicago, 845 West Taylor Street, Chicago,
Illino~s60607-7060 USA
WILLIAMJ. PLATT Department of Plant Biology, 502 Life Sciences Building, Louisiana State University, Baton Rouge,
Louisiana 70803-1 705 USA
Abstract. Factors responsible for patterns of canopy tree replacement were studied for 22 yr in Warren Woods, Michigan, USA, an old-growth forest codominated by American beech (Fagus grandifolia) and sugar maple (Acer sacclzarum). Our goal was to distinguish among four hypotheses: autogenic succession, allogenic succession, autogenic coexistence, and allogenic coexistence.
We could discern neither successional change toward increasing dominance by sugar maple or beech nor beech self-replacement by root sprouts. In the forest as a whole, from 1933 to 1980, sugar maple remained dominant in small understory size classes, and beech remained dominant in larger understory size classes and in the canopy.
We could identify no plausible species-specific canopy influences or consistent responses of understory individuals that could be the basis for autogenic succession or autogenic coexistence. No significant differences existed below canopy beech or below canopy maple in: ( 1 ) beech root influence as measured by Ep$agus root parasites; ( 2 ) light intensity as measured by extension growth of 0.2-0.8 m tall sugar maple; (3) leaf litter as measured by densities of beech and sugar maple leaves just after autumn leaf fall; or ( 4 ) inhibition as measured by death of sapling beech and sugar maple. Comparisons under single canopy trees and under monospecific patches showed that understory beech were larger than maple, and this pattern was accentuated below monospecific canopy patches both of maple and beech. This suggested autogenic succession, but coring data were not consistent with this hypothesis, because the largest subcanopy stems of beech and maple were established less often after conspecific or after heterospecific canopy individuals existed above them than before or at the same time.
We could not falsify an allogenic coexistence hypothesis that beech or maple advantage changes as light levels fluctuate with frequencies and sizes of treefall gaps. Maples that had recently reached canopy height had been suppressed for an average of only 20 yr, but most had undergone multiple cycles of suppression and release associated with multiple treefall gap events. In contrast beech that had recently reached canopy height had been suppressed an average of 121 yr despite having a similar number of suppression-release cyiies as maple. Differences betweell paired individuals, matched for light microenviron- ments and height, confirmed our hypothesis that the strong apical dominance of maple led to an advantage in fast upward growth in vertical light gradients of gaps and the long lateral branches of beech led to an advantage in an understory with light flecks and in horizontal light gradients from nearby gaps. Beech's better performance in the understory and maple's better performance in gaps led us to predict that beech would decrease in dominance in the canopy if treefall rate increased. From 1949-1974 treefall gaps averaged 0.16 trees per hectare per year and consisted of mostly single treefalls; we projected that in these gaps beech to maple ratios in the canopy would become 1 to 1 . From 1975 to 1994 treefall gaps averaged 1.64 trees per hectare per year and consisted of mostly multiple treefalls; we projected that in these gaps the ratio of beech to maple winners will become 1 to 2.5.
We conclude that species-specific differences in response to light level, with allogenic spatial and temporal fluctuation in frequency and area of treefall gaps, are sufficient to explain patterns of beech and sugar maple replacement in the canopy in the old-growth forest at Warren Woods.
Kej words: Acer saccharum; allogenic; autogenic; beech; coexistence; Fagus grandifolia; forest old-growth; reciprocal replacement; self-replacement; successiorz; sugar maple; treefall gaps.
' Manuscript received 11 September 1994; revised 20 July 1995; accepted 2 September 1995; final version received 13 October 1995.

June 1996 BEECH-SUGAR MAPLE REPLACEMENT 1235
INTRODUCTION (Fox 1977), coined reciprocal replacement by Woods
Many hypotheses have been proposed to explain pat- terns of tree replacement in eastern United States de- ciduous forests that are codominated by American beech (Fagus grandifolia) and sugar maple (Acer sac- charum) (Cain 1935, Williams 1936, Hough and Forbes 1943, Forcier 1975, Vankat et al. 1975, Fox 1977, Woods 1979, Brewer 1980, Poulson and Platt 1981, Runkle 1981, Canham 1988a, Poulson and Platt 1989, Brisson et al. 1994, Peters and Poulson 1994). One class of hypotheses involves directional changes (suc- cession) toward beech or sugar maple dominance. The second class of hypotheses involves nondirectional changes (coexistence is implied) in relative abundances of beech and sugar maple. In this study, in a forest codominated by beech and sugar maple at Warren Woods, Michigan, USA, we evaluate four hypotheses: autogenic succession, allogenic succession, autogenic coexistence, and allogenic coexistence.
Earlier workers in beech-maple forests who have suggested succession have not clearly differentiated be- tween autogenic succession and allogenic succession. Autogenic succession in forests is based on species- specific biology, generally shade tolerance and lon- gevity and specifically, in the case of beech, root sprouting (e.g., Horn 1971). Allogenic succession could be based on very slow climatic change, slow topographic change that increases kinds of habitat (e.g., Braun 1950),or fast anthropogenic change such as low- ering of the water table (e.g., Brewer 1980). Many workers have been impressed by the dominance of sug- ar maple in small size classes and so have predicted that maple might increase in the canopy, but they have not necessarily implied a monospecific climax as the end point and have not suggested a specific mechanism (e.g., Esten 1932, Cain 1935). Other researchers have predicted that beech might increase in the canopy be- cause beech can root sprout (e.g., Horn 1971, Forcier 1975, Brisson et al. 1994) or because beech saplings always have some growth or survival advantage (e.g., Williams 1936, Braun 1950, Laufersweiler 1955, Van-kat et al. 1975, Donnelly 1986).
To examine hypotheses of successional change in Warren Woods we examined changes in size distribu- tions of beech and sugar maple over about half a cen- tury. In the same area of the forest, we compared size distributions in 1980 to those measured by Cain (1935) in 1933. In addition we used the past diameter growth rate measurements of beech and sugar maple from cores to project what the size distributions in 1980 should be if the relative abundances of saplings and poles in 1980 were the same as for seedlings and juveniles in 1933.
Previous workers in beech-maple forests have been clear about mechanisms of coexistence but have not categorized them as autogenic or allogenic. Autogenic coexistence could be based on an alternation of species
(1979) , due to either interspecific facilitation or intra- specific inhibition. Autogenic coexistence could also be based on self-replacement due to either intraspecific facilitation (e.g., beech root sprouting, Forcier 1975) or interspecific inhibition. Allogenic coexistence is based on differential capabilities of the two species to respond to understory and gap light levels with fluc- tuation in frequency and sizes of treefall gaps. The general hypothesis is that maple will be favored with high rates of treefall and mostly multiple tree gaps whereas beech will be favored with low rates of treefall and mostly single tree gaps (Hough and Forbes 1943, Poulson and Platt 1981, 1989, Canham 1985, 1988a, 1990, Canham and Marks 1985). At Warren Woods, Michigan, Donnelly (1986) showed that beech tolerates understory conditions better than maple. Others (Poul- son and Platt 1981, 1989, Canham 1988a) have sug- gested that beech grows faster upward in the understory and maple grows faster upward in gaps. In addition we have proposed (Poulson and Platt 1989) trade-offs for each species. Beech survives for a long time in the shaded understory while slowly increasing in height, but it does not grow rapidly upward in gaps. In contrast maple survives only a short time in the shaded under- story but rapidly increases in height in gaps.
To explore autogenic coexistence hypotheses we as- sessed possible canopy species-specific influences on the sizes, growth, and survival of understory beech and maple. Because species-specific influences should be stronger beneath monospecific patches, we also com- pared the influences of single beech and maple to those of multiple beech and maple. To explore the allogenic coexistence hypothesis we assessed growth, survival, and projected winners in treefall gaps under different gap disturbance regimes. We characterized suppression and release histories for both "losers" that died and "winners" that reached the canopy. We also measured current height and lateral branch growth of paired beech and maple in the increasing light level from be- neath canopy trees, to single treefall gaps, and to mul- tiple treefall gaps.
By collecting data over a 22-yr period from 1973 to 1995, we have gained a number of insights about dy- namics of beech and sugar maple at Warren Woods. During this period, rates of treefall and size distribu- tions of gaps changed sharply. As a result we were able to measure responses of beech and sugar maple to a wide array of environmental conditions. This long-term study has enabled us to develop a conceptual model of forest dynamics that may be explored in other decid- uous forests in the eastern United States.
Warren Woods is a well-studied beech-sugar maple forest located =6 km from the shore of Lake Michigan in Berrien County, Michigan. Warren Woods is an old- growth forest in which the interior of the forest has

1236 THOMAS L. POULSON AND WILLIAM J. PLATT Ecology, Vol. 77, No. 4
had minimal past and no current anthropogenic dis- turbances (Billington 1924, Cain 1935, Brewer 1980, Donnelly and Murphy 1987, Poulson and Platt 1989, Peters 1992). During the 22 yr of our study, even along the edges, there has been no discernible deer-browsing (T. L. Poulson, unp~dblished data). Based on witness tree analysis at the time of settlement this area generally was a mosaic of beech-sugar maple and oak-hickory forest and Warren Woods in particular was codomi-nated by beech and sugar maple (Kenoyer 1934, Brewer et al. 1984). During the period of our studies beech and sugar maple were codominant and all sizes of both species were common. Canopy individuals were 30- 40 m tall, had crowns of 25-250 mZ, and were 35-120 cm diameter at breast height (dbh). The oldest beech were at least 300 yr old (Peters 1992). Species requiring more light are, in order of increasing light needs, red maple (Acer rubrum) > black cherry (Prunus serotina) > tulip tree (Liriodendron tulipifera) > white ash (Fraxinus americana) > basswood (Tiliu americana) > red oak (Quercus rubra) and comprise only 3-4% of canopy individuals (Cain 1935, Donnelly and Mur- phy 1987); red maple and basswood are only common in poorly drained areas. Of the light-demanding species the most common canopy individuals (tulip tree > black cherry > white ash) are an integral part of the tree community since all diameters and heights can be found in some parts of the study site (King 1994, King and Poulson 1994).
Our study site includes the undisturbed areas that others have studied (Billington 1924, Cain 1935, Fox 1977, Woods 1979, Brewer 1980, Donnelly 1986, Don- nelly and Murphy 1987, Poulson and Platt 1989, Peters 1992, Peters and Poulson 1994). It is an irregularly shaped 16-ha area of flat uplands that is 0.03-1.5 n~ above the water table in spring (we do not report here on areas with standing water in spring). The northern border of our site runs parallel to and 5 m south of Warren Woods Road. The western boundary is 20 m from a field edge. The eastern and southern boundaries are the edge of a slope down to the Galien River (see maps in Brewer 1980). The soils are mostly a loamy, mixed, mesic Aquic Arenic Hapludalf with a sandy, mixed mesic Psammentic Haplandalf on the slightly elevated areas (Larson 1980). The study site has great spatial heterogeneity in light intensity due to local dif- ferences in frequencies and size of treefall gaps of dif- ferent ages
Sampling
Our study has disadvantages and advantages. The main advantage of our 22-yr study was increased un- derstanding over time. We continued to revise early hypotheses and test new hypotheses. We were also able to take advantage of a natural experiment as rates and sizes of treefall increased dramatically starting in 1975.
One disadvantage is that our sampling varied over the course of 22 yr as we refined our hypotheses. In ad- dition we did not always sample randomly and did not establish permanent plots or transects. However, except for study of the same area sampled by Cain (1935), we took particular care to sample from each = l -ha grid in the 16-ha study area. In addition we used paired sampling whenever possible. We measured growth and survival of saplings of paired seed origin and sprout origin. We measured extension growth in paired beech and maple saplings that we matched for height and light microenvironment. We measured litter influence, beech root influence, and light influence (extension growth of <1 m tall maple) under adjacent beech and sugar maple canopy trees.
Successional hypotheses
To explore hypotheses of autogenic or allogenic suc- cession we determined whether size distributions had changed over the last half century and whether self- replacement of beech by root sprouts would favor suc- cession toward beech.
Size category distributions in 1933 and 1980.-In 1980 we sampled 25 quadrats of 100 m2 in the same approximate area studied by Cain (1935). Trees were assigned to the same five size classes reported by Cain: seedlings (<30 cm tall), juveniles (>30 cm tall but <2.5 cm dbh), saplings (>2.5 cm dbh but <15 cm dbh), poles ( > I 5 cm dbh but <45 cm dbh), and canopy trees (>45 cm dbh). We pooled our data from the 25 quadrats to compare with Cain's 1933 data. We ob- tained frequency distributions for the five categories of each species and differences between the frequencies for each species in 1933 and 1980. We compared the differences using Kolmogorov-Smirnov two-sample tests (Siege1 1956).
Sprout-origin und seed-origin beech saplings.-To determine if sprout-origin and seed-origin saplings have different chances of reaching the canopy, we mea- sured paired individuals below beech canopy trees and adjacent to fallen beech trees. Sprout-origin saplings can be distinguished from seed-origin saplings by three characteristics. The most reliable character is the pres- ence of a tap root below a sapling stem. Sprout-origin saplings tend to have two horizontal parental roots that are bigger than the others and =180° apart. Because sprouts have few roots of their own and these are small, the bases of stems of sprout-origin saplings do not taper outward toward the ground.
We selected only live or recently fallen canopy beech >30 m tall with at least one sprout-origin and one seed- origin sapling within 4 m of the canopy beech trunk base. We used 15 beech with full crowns, seven with partial crowns, and eight that had recently tipped up or snapped off. Beneath trees of each category, we measured height and number of branches of the tallest sprout-origin and seed-origin sapling. Since large branches have much higher leaf areas than small

June 1996 BEECH-SUGAR MAPLE REPLACEMENT 1237
branches, we divided the number of branches < 1 cm diameter at the trunk by two. We also determined the frequency of beech canopy trees with nearby sprouts in four widely separated 0.5-ha areas.
Hypotheses of autogenic coexistence
To explore hypotheses of autogenic coexistence we examined evidence for species-specific influences of overstory on understory trees. We determined the effect of single and multiple canopy beech and sugar maple on species and sizes of juveniles. Beneath both species of canopy tree, we measured species-specific differ- ences in leaf litter, a root parasite index of beech roots, and a growth index of light intensity. We also examined overstory effects on understory sapling death. Finally we determined whether the largest understory tree al- ways established much later than the adjacent canopy tree as expected for autogenic influences.
Diameter-frequency distributions below single can- opy beech and sugar maple.-Our aim was to deter- mine if a large tree of one species autogenically influ- ences the abundance and/or size class distributions of con- or heterospecific juveniles. We measured all un- derstory stems of the two species in 100-m2 quadrats below each of the projected canopies of 20 beech and 20 sugar maple scattered throughout the study area. We rejected canopy trees within 10 m of the edge of treefall gaps. For juveniles <2.5 cm dbh we distinguished three height categories (<40 cm tall, 40-150 cm tall, and > I 5 0 cm tall). Stems between 2.5 and 32.5 cm dbh were grouped into 2.5-cm intervals.
Numbers per quadrat of each size class were aver- aged over the 20 plots below maple and the 20 plots below beech to form composite frequency distributions for understory stems of different sizes. The differences between size classes of maple below maple vs. below beech and between size classes of beech below maple vs. below beech were compared using a Kolmogorov- Smirnov two-sample test (Siege1 1956).
Single canopy tree vs. monospecijc patch inju- ence.-An autogenic influence on sizes attained by sap- lings should be greater under a monospecific patch than under a single beech or maple in a mixed canopy set- ting. We studied understory size distributions of beech and sugar maple in the mid-1970s before treefall gaps were so common that they influenced much of the un- derstory. We used the four monospecific patches of three to four canopy sugar maple we could find in the study area. From four different parts of the study site we selected four monospecific patches of beech that had three to six canopy trees in each. We also selected seven single canopy trees of beech and seven of sugar maple. These 14 trees were not adjacent to any recent treefall gaps or to monospecific patches. Under the vast majority of "single" trees we sampled within 3 m of the trunk so that any trunk-, root-, and canopy-related influences would be measured. Under monospecific canopy patches we sampled within a polygon described
by a line connecting the trunk bases of all canopy trees in the patch. Below both single trees and monospecific patches of canopy trees we measured the diameters of all stems > 1 cm dbh; and if none were >1 cm dbh we measured the diameter of the next smallest stem of beech and sugar maple.
Canopy species-specijc injuences via leaf litter a n d beech roots.-We reasoned that leaf litter or roots of canopy trees could have species-specific influences on establishment and survival. We sampled within 3.5 m of the trunks of 20 canopy sugar maple (70-93 cm dbh, mean 80.3) and 20 adjacent canopy beech (71-120 cm dbh, mean 85.9).
We could not reliably distinguish between beech and maple roots in the field so we used a specific root parasite, Epifugus, as an indirect measure of beech root distribution. Within 3.5 m of each beech and maple trunk we counted total numbers of Epifagus.
We estimated beech and sugar maple leaf litter den- sity in early November just after all the leaves fell. To sample leaf litter density, we pushed a wire down through the entire litter layer and counted the number of impaled leaves of beech and sugar maple (leaves of other species comprised 4 % of the total below any one tree). We did this 15 times as we walked around the trunk.
Canopy species-specijic influences on understory light intensity.-Since canopy beech have greater crown widths and depths than sugar maple (T. L. Poul-son and R. Peters, unpublished data) and have lower light transmission (Canham et al. 1994), light levels might differ at ground level beneath each of the two species. We used the most recent 5 yr of top branchlet extension growth of 0.2-0.8 m tall sugar maples as an integrated measure of light available at ground level. We measured the first maple encountered in each of four compass quadrants under 10 pairs of adjacent can- opy beech and canopy sugar maple. We used 0.2-0.8 m tall sugar maple because they are more abundant than beech at this size and their low density of 0.1- 0.5 per square metre prevented shading of each other. We believe that their growth is an adequate index of light since sugar maple extension growth is very sen- sitive to even slight increases in light from single branch falls and single tree gaps as far as 20 m away (Canham 1985, 1988a, b; T. L. Poulson, personal ob- servation). At the latitude of Warren Woods light levels may not drop to understory levels until as far as 20 m north from newly formed gaps (Canham 1988b), so we also recorded the distance and direction from our mea- sured maple to the edge of any treefall gap in the arc from east to south to west.
Overstory species-speci$c injuences on understory sapling death.-As a measure of any overstory species- specific inhibition we recorded deaths of 1-20 cm dbh saplings along 10 contiguous 10 m wide belt transects that summed to =2 ha in the northern part of the study area. We chose not to study deaths of <1 cm dbh in-
1238 THOMAS L. POULSON AND WILLIAM J. PLATT Ecology, Vol. 77, No. 4
dividuals because preliminary data showed that over- story influences on their death would be hard to dis- tinguish from death due to competition from other small beech and maple, competition with herbs (es- pecially for shallow-rooted maple), and dry summers (beech). We recorded the overstory influence on death of sugar maple or beech saplings as associated with overstory of a particular species only if the dead in- dividual was clearly below a canopy individual or mul- tiple taller individuals of only one species. In cases where the dead sapling was below both beech and sugar maple we recorded the overstory influence on death as "mixed."
Locations and times of establishment of canopy re- placement trees.-We used complete cores taken by Peters (1992) for this analysis. We report all cases where Peters cored both the largest understory tree and the adjacent canopy tree <4 m away. We believe that the age inaccuracies, due both to coring at a height of 1.5 m and to missing subtle annual rings along a core, are nonselective errors that apply equally to cores of the canopy tree and the projected replacement tree and are too small to affect our data analysis. The maximum difference in age error for coring at 1.5 m is 15 yr since maple and beech take 8-23 yr to grow this tall at Warren Woods. The maximum difference in age error by miss- ing annual rings from using a core rather than a com- plete cross section is =20 yr. We estimate this by com- paring the age determined from a cross section with the age determined along a single radius of the same cross section. Based on cores we could underestimate the age of beech by as much as 15% and the age of maple by as much as 5%. Thus for a 200-yr-old core, the real age of beech could be 230 and maple 210 yr old, a difference of 20 yr. These estimated maximum errors are small enough that we could clearly determine whether initial establishment of the understory tree oc- curred well before the overstory canopy tree (>SO yr, i.e., no chance for autogenic influence), about the same time as the canopy tree (-C 30 yr, i.e., no or little chance for autogenic influence), or well after the overstory canopy tree (>50 yr, i.e., a good chance for autogenic influence).
Hypotheses of allogenic coexistence
To explore hypotheses of allogenic coexistence we measured aspects of growth and survival in the un- derstory and attainment of canopy status in gaps during different disturbance regimes. Using radial and diam- eter growth of trunks we determined release and sup- pression histories of winners and losers. We measured vertical and horizontal branch growth as a function of height and of light microenvironments in saplings < 8 m tall and long lateral branch growth in saplings 16- 32 m tall. Finally we made projections of winners in gaps during a time with a low frequency of small tree- falls and a time with a high frequency of multiple tree- falls.
Release and suppression histories of winners and losers.-Numbers and durations of suppression-re-lease cycles prior to reaching the canopy are reflected in past radial trunk growth of winners that have recently achieved canopy height of 30 m. We mainly used com- plete cores (R. Peters, personal communication) to as- sess suppression-release cycles and used Peters' (1992) criterion of 1-mm radial growth per year for at least four consecutive years to separate release from suppression. We made detailed drawings to scale of each cored winner canopy tree to see if its architecture correlated with its suppression history. We also drew cored moribund and recently dead loser trees to see if their architecture suggested even greater past suppres- sion than that shown by winners.
Because growth rings that are hard to distinguish or missing along one radius of a core may be clear along another radius, data from cross sections are more ac- curate than those from cores. We used finely sanded cross sections to obtain diameter growth histories of recent winners that had been in the canopy at time of treefall and recent losers in the understory. The recent canopy trees had been growing quickly at the time they were killed by windfall or knocked down by other fall- ing canopy trees. Because we used only winners that had recently fallen and were not hollow, we have data from only 4 sugar maple and 6 beech. For losers we have data on 10 beech and 7 maple.
We compiled growth curves of diameter (without bark) for the life-span of each winner and loser tree. At the same time, we measured the diameter of trees at 10-yr intervals. This enabled us to average out vari- ability in ring widths on opposite sides of each tree and among years within decades. We compared the average annual growth, measured as millimetrelyear diameter increments, over the life-spans of each winner and loser. In addition, we compared the average growth rate prior to and after the final releases that resulted in their growth into the canopy.
We conducted two analyses using one-way model I (fixed effects) ANOVA to test a priori hypotheses. First, we compared the average annnual growth rates of six winner beech and four winner sugar maple trees prior to and after the final releases that resulted in their growth into the canopy. The null hypotheses were that sugar maple and beech would not differ in growth rates either prior to or after final release. Second, we com- pared average annual growth rates of winners prior to final release to average annual growth rates of losers. The null hypotheses were that winner and loser beech or sugar maple would not differ in growth rate while in the understory.
Sapling extension growth a s a function of height and of light microenvironments.-In the late 1970s we mea- sured annual vertical extension growth of top shoots and horizontal growth of the longest lateral branches of paired beech and sugar maple saplings <3 m apart. We measured extension growth of saplings 1-2, 2-4,

June 1996 BEECH-SUGAR MAPLE REPLACEMENT 1239
and 4-8 m tall in each of three light microenviron- ments: ( I ) beneath a canopy tree; (2) in single-tree windfall gaps; and (3) in multiple-tree windfall gaps. Only one pair of saplings was measured in any local area. We used gaps older than 10 yr so we could obtain growth rate averages over a period of years that would hopefully even out stochastic effects such as rainfall and local branch gap and nearby canopy gap influences. We obtained five pairs in each of the nine height X
light microenvironment categories, a total of 90 sap- lings. We did not have more pairs because we had to search the entire study site to obtain five pairs in some categories.
Based on terminal bud scars, we obtained data for 10 yr of both total and net extension growth for each rapling. Using the deviation of top shoots from vertical and longest lateral branch from horizontal, we cor-rected total average extension growth rate to obtain the average net vertical and horizontal growth rates (see Canham 1985, 1990). In addition, we made scale draw- ings to assess any changes in architecture with increas- ing sapling height.
Despite pairing of saplings, F,,, tests for both ver- tical growth (F,,,,,, = 183; P < 0.0001) and horizontal growth (F,,,,,, = 928; P < 0.0001) indicated that var- iances were not homogeneous. Furthermore no trans- formations made the variances homogeneous. However differences of average yearly net extension growth be- tween each pair of beech and sugar maple resulted in data that had homogeneous variances for both vertical growth (F,,,,,, = 5.7; P > 0.05) and horizontal growth (F,,,,,, = 4.6; P > 0.05).
We analyzed the net difference data on extension growth using a model I two-way ANOVA (Sokal and Rohlf 1981). In addition to obtaining interaction effects between the main effects, we established a priori single degree of freedom orthogonal contrasts for each of the main effects. We reasoned that net vertical growth is important for growing upward in gaps into the canopy and net horizontal growth is important for growing out- ward to stochastically encounter light flecks and to di- rectionally respond to light gradients from nearby tree- fall gaps. Therefore, we compared (1) differences in vertical and horizontal extension growth beneath the canopy to that in gaps, and (2) differences in extension growth between single and multiple gaps. Our drawings of architecture showed differences with height so we also compared (1) differences in extension growth of the tallest (4-8 m) saplings to that of the two shorter size classes, and (2) differences in extension growth between the two shortest size classes.
Lateral branch growth of tall trees.-Our aim was to assess whether the lateral branch growth advantage that 1-8 m tall beech seemed to have over sugar maple was accentuated in the lower branches of 16-32 m tall stems. We measured extension growth of the longest lateral branch we could rope and bend down from seven adjacent pairs of beech and sugar maple in various
microhabitats. We measured most trees along Warren Woods Road because we could not rope branches and bend them down next to natural gaps. We sampled from both the north side of the road (higher intensity and partially direct light) and the south side of the road (lower intensity and all indirect light). Both in the un- derstory and along the road, we measured extension between terminal bud scars as far back in time from the branch end as we could (5-10 yr).
Projected replacement species in di8erent gap re-gimes.-In 1989, after we had found that beech was favored in the understory and sugar maple in gaps, it appeared to us that treefall rate and sizes of gaps had greatly increased. To assess whether our impression was accurate we compared canopy treefall rates (tipups and snapoffs) and gap sizes for the periods between 1949 and 1975 (prior to 1949 all fallen trees were re- moved for firewood) and between 1975 and 1994. We used the 1975 dividing time because Brewer and Mer- ritt (1978) had noted a great increase in tipups in 1975. We used release of branch extension growth of live saplings and decomposition stages of trunks of indi- vidual beech and maple to separate treefalls into the two time periods. Two large multiple tree gaps occurred in 1975 (Poulson and Platt 1989), and we used decom- position stages of these treefalls to help judge whether other old treefalls censused in 1994 dated from before 1975. For most treefalls extension growth of surviving saplings gave unambiguous measures of gap age. We compared treefall rates in seven areas of 0.4-1.2 ha throughout the study site.
We compared our projections of whether beech or maple would be winners in gaps for 1973-1975 and for 1989-1994. In both time periods we noted whether the gaps were created by isolated single treefalls, two to three treefalls that fell in tandem or had another gap nearby and so had overlapping light regimes, or four to eight treefalls that increased in area as a result of additional treefalls over a 10-20 yr period (Poulson and Platt 1989). More than one individual was pro- jected to replace the fallen tree if potential winners were in different positions in the canopy gap, about the same height, and with vigorous terminal branch growth.
Successional hypotheses
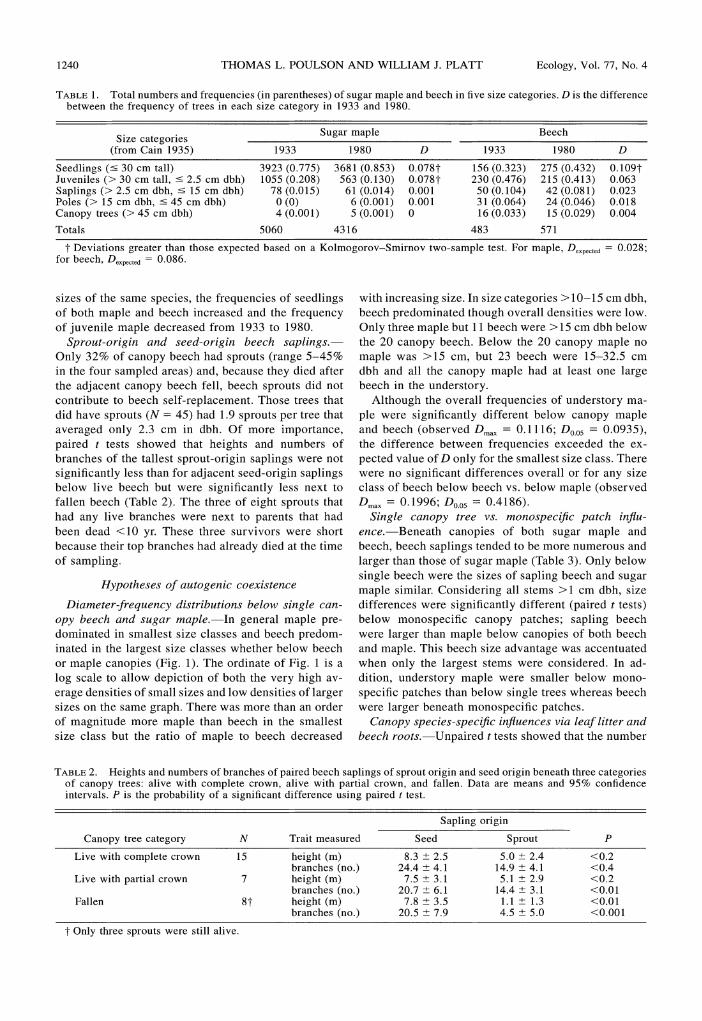
Size category distributions in 1933 and 1980.-In general total numbers and relative abundances of five size categories of beech and sugar maple were similar in 1933 and 1980 (Table 1). In both 1933 and 1980, sugar maple was more abundant than beech in the seed- ling, juvenile, and sapling (<15 cm dbh) size categories whereas beech was more abundant in the pole and can- opy size categories. Kolmogorov-Smirnov two-sample tests showed significant changes in frequencies of only two of the five size categories. Thus, relative to other
1240 THOMAS L. POULSON AND WILLIAM J. PLATT Ecology, Vol. 77, No. 4
TABLE 1. Total numbers and frequencies (in parentheses) of sugar maple and beech in five size categories. D is the difference between the frequency of trees in each size category in 1933 and 1980.
Size categories Sugar maple Beech
(from Cain 1935) 1933 1980 D 1933 1980 D
Seedlings (530 cm tall) 3923 (0.775) 3681 (0.853) 0.0787 156 (0.323) 275 (0.432) 0.1097 Juveniles (> 30 cm tall, 5 2.5 cm dbh) 1055 (0.208) 563 (0.130) 0.0787 230 (0.476) 215 (0.413) 0.063 Saplings (> 2.5 cm dbh, 5 15 cm dbh) 78 (0.015) 61 (0.014) 0.001 50 (0.104) 42 (0.081) 0.023 Poles (> 15 cm dbh, 5 45 cm dbh) 0 (0) 6 (0,001) 0.001 31 (0.064) 24 (0.046) 0.018 Canopy trees (> 45 cm dbh) 4 (0.001) 5 (0.001) 0 16 (0.033) 15 (0.029) 0.004
Totals 5060 4316 483 57 1
7 Deviations greater than those expected based on a Kolmogorov-Smirnov two-sample test. For maple, D,,,,,t,, = 0.028; for beech, D,,,,,,,,= 0.086.
sizes of the same species, the frequencies of seedlings with increasing size. In size categories >lo-15 cm dbh, of both maple and beech increased and the frequency beech predominated though overall densities were low. of juvenile maple decreased from 1933 to 1980. Only three maple but 11 beech were >15 cm dbh below
Sprout-origin and seed-origin beech saplings.- the 20 canopy beech. Below the 20 canopy maple no Only 32% of canopy beech had sprouts (range 5-45% maple was >15 cm, but 23 beech were 15-32.5 cm in the four sampled areas) and, because they died after dbh and all the canopy maple had at least one large the adjacent canopy beech fell, beech sprouts did not beech in the understory. contribute to beech self-replacement. Those trees that Although the overall frequencies of understory ma- did have sprouts (N = 45) had 1.9 sprouts per tree that ple were significantly different below canopy maple averaged only 2.3 cm in dbh. Of more importance, and beech (observed Dm,, = 0.1 116; Do,,, = 0.0935), paired t tests showed that heights and numbers of the difference between frequencies exceeded the ex- branches of the tallest sprout-origin saplings were not pected value of D only for the smallest size class. There significantly less than for adjacent seed-origin saplings were no significant differences overall or for any size below live beech but were significantly less next to class of beech below beech vs. below maple (observed fallen beech (Table 2). The three of eight sprouts that Dm,, = 0.1996; Do,,, = 0.4186). had any live branches were next to parents that had Single canopy tree vs. monospecijc patch injlu-been dead <10 yr. These three survivors were short ence.-Beneath canopies of both sugar maple and because their top branches had already died at the time beech, beech saplings tended to be more numerous and of sampling. larger than those of sugar maple (Table 3). Only below
single beech were the sizes of sapling beech and sugar Hypotheses of autogenic coexistence maple similar. Considering all stems >1 cm dbh, size
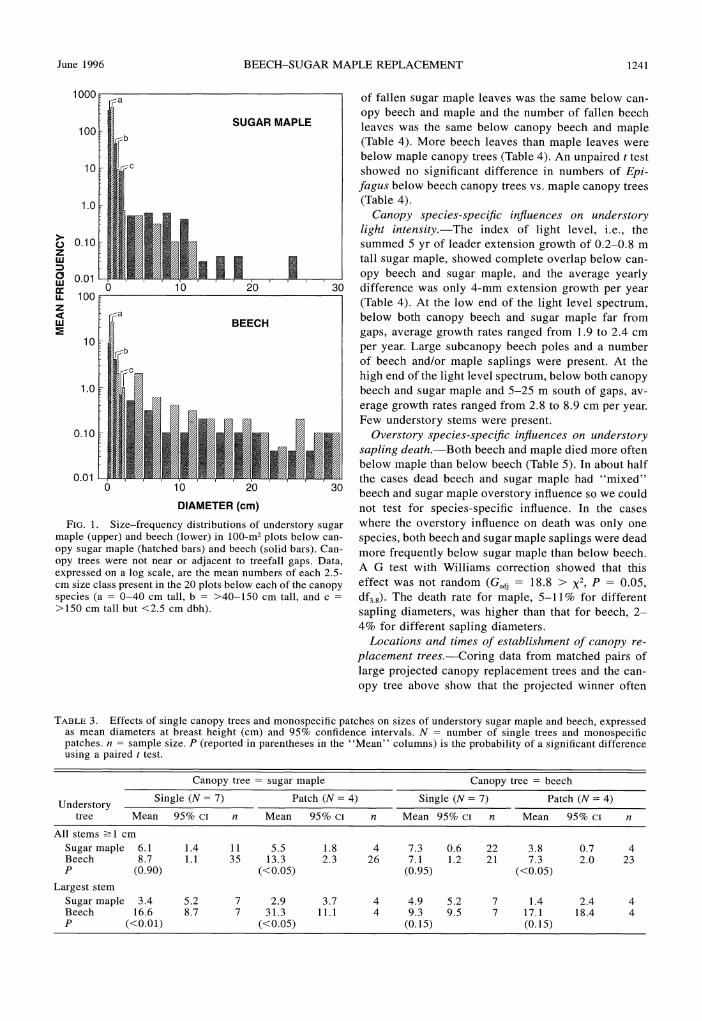
Diameter-frequency distributions below single can- differences were significantly different (paired t tests) opy beech and sugar maple.-In general maple pre- below monospecific canopy patches; sapling beech dominated in smallest size classes and beech predom- were larger than maple below canopies of both beech inated in the largest size classes whether below beech and maple. This beech size advantage was accentuated or maple canopies (Fig. 1). The ordinate of Fig. 1 is a when only the largest stems were considered. In ad- log scale to allow depiction of both the very high av- dition, understory maple were smaller below mono-erage densities of small sizes and low densities of larger specific patches than below single trees whereas beech sizes on the same graph. There was more than an order were larger beneath monospecific patches. of magnitude more maple than beech in the smallest Canopy species-specij5c injluences via leaf litter and size class but the ratio of maple to beech decreased beech roots.-Unpaired t tests showed that the number
TABLE2. Heights and numbers of branches of paired beech saplings of sprout origin and seed origin beneath three categories of canopy trees: alive with complete crown, alive with partial crown, and fallen. Data are means and 95% confidence intervals. P is the probability of a significant difference using paired t test.
Sapling origin
Canopy tree category N Trait measured Seed Sprout P
Live with complete crown 15 height (m) 8.3 2 2.5 5.0 ? 2.4 <0.2 branches (no.) 24.4 ? 4.1 14.9 i 4.1 <0.4
Live with partial crown 7 height (m) 7.5 ? 3.1 5.1 2 2.9 <0.2 branches (no.) 20.7 Ir 6.1 14.4 2 3.1 <0.01
Fallen 8 7 height (m) 7.8 ? 3.5 1.1 ? 1.3 <0.01 branches (no.) 20.5 2 7.9 4.5 ? 5.0 <0.001
7 Only three sprouts were still alive
June 1996 BEECH-SUGAR MAPLE REPLACEMENT 1241
SUGAR MAPLE
BEECH
DIAMETER (em)
I
FIG. 1. Size-frequency distributions of understory sugar maple (upper) and beech (lower) in 100-m2 plots below can- opy sugar maple (hatched bars) and beech (solid bars). Can- opy trees were not near or adjacent to treefall gaps. Data, expressed on a log scale, are the mean numbers of each 2.5- cm size class present in the 20 plots below each of the canopy species (a = 0-40 cm tall, b = >40-150 cm tall, and c =
>I50 cm tall but <2.5 cm dbhi.
of fallen sugar maple leaves was the same below can- opy beech and maple and the number of fallen beech leaves was the same below canopy beech and maple (Table 4). More beech leaves than maple leaves were below maple canopy trees (Table 4). An unpaired t test showed no significant difference in numbers of Epi- fagus below beech canopy trees vs. maple canopy trees (Table 4).
Canopy species-specific injluences on understory light intensity.-The index of light level, i.e., the summed 5 yr of leader extension growth of 0.2-0.8 m tall sugar maple, showed complete overlap below can- opy beech and sugar maple, and the average yearly difference was only 4-mm extension growth per year (Table 4). At the low end of the light level spectrum, below both canopy beech and sugar maple far from gaps, average growth rates ranged from 1.9 to 2.4 cm per year. Large subcanopy beech poles and a number of beech and/or maple saplings were present. At the high end of the light level spectrum, below both canopy beech and sugar maple and 5-25 m south of gaps, av- erage growth rates ranged from 2.8 to 8.9 cm per year. Few understory stems were present.
Overstory species-specijic in$uences on understory sapling death.-Both beech and maple died more often below maple than below beech (Table 5). In about half the cases dead beech and sugar maple had "mixed" beech and sugar maple overstory influence so we could not test for species-specific influence. In the cases where the overstory influence on death was only one species, both beech and sugar maple saplings were dead more frequently below sugar maple than below beech. A G test with Williams correction showed that this effect was not random (Gad, = 18.8 > x2,P = 0.05, df,,). The death rate for maple, 5-1 1% for different sapling diameters, was higher than that for beech, 2- 4% for different sapling diameters.
Locations and times of establishment of canopy re- placement trees.-Coring data from matched pairs of large projected canopy replacement trees and the can- opy tree above show that the projected winner often
TABLE3. Effects of single canopy trees and monospecific patches on sizes of understory sugar maple and beech, expressed as mean diameters at breast height (cm) and 95% confidence intervals. N = number of single trees and monospecific patches. n = sample size. P (reported in parentheses in the "Mean" columns) is the probability of a significant difference using a paired t test.
Canopy tree = sugar maple Canopy tree = beech
Understory Single (N = 7)
tree Mean 95% CI n
All stems 2 1 cm Sugar maple 6.1 Beech 8.7
1.4 1.1
11 35
P (0.90)
Largest stem Sugar maple 3.4 Beech 16.6
5.2 8.7
7 7
P (<0.01)
Patch (N = 4)
Mean 95% CI n
5.5 1.8 4 13.3 2.3 26
(<0.05)
2.9 3.7 4 31.3 11.1 4
(<0.05)
Single (N = 7)
Mean 95% CI n
7.3 0.6 22 7.1 1.2 21
(0.95)
4.9 5.2 7 9.3 9.5 7
(0.15)
Patch (N = 4)
Mean 95% CI n
3.8 0.7 4 7.3 2.0 23
(<0.05)
1.4 2.4 4 17.1 18.4 4 (0.15)

1242 THOMAS L. POULSON AND WILLIAM J. PLATT Ecology, Vol. 77, No. 4
TABLE 4. Three possible canopy species-specific influences on understory individuals beneath sugar maple and beech canopy trees: leaf litter, expressed as the number of sugar maple and beech leaves, density of beech roots, as indicated by numbers of Epifagus, and understory light regimes, as indicated by the 5-yr extension growth of sugar maples. Data are means and 95% confidence intervals. P is probability of a significant difference using unpaired t tests.
Canopy tree
Sugar maple Beech Possible canouv suecies-s~ecific influence ( N = 8) (N= 8)
Leaf litter (no. leaves) Beech Sugar maple
Beech roots (no. Epifagus)
Light regimes (5-yr extension growth of sugar maple, cm)
established before or at the same time as the canopy tree (Table 6). Of 17 maple eight established after beech, two established after maple, and seven estab- lished about the same time as maple. Of 24 beech 11 established after beech, two about the same time as beech, four after maple, six about the same time as maple, and one before maple. For both species, those establishing after the canopy tree above them were smaller than those establishing about the same time.
Hypotheses of allogenic coexistence
Release and suppression histories of winners and losers.-Coring data showed that beech that recently attained canopy status had no more episodes of sup- pression than maple but were suppressed significantly longer and had their final release at significantly larger sizes and older ages than successful maple (Table 7). Successful maple showed a continuum from no past suppression to multiple episodes of past suppression and release. At one extreme were maples with radial growth that showed no suppression or short 5-11 yr episodes of suppression. They grew at an average of 1.5 mm per year with only a gradual increase at final release. All had straight and evenly tapered trunks and branches. In addition all live branches, dead branch stubs, and branch scars angled upward. These maple were in groups of two to six and we inferred that each group had grown to canopy height in a single large gap. At the other extreme were maples with radial growth that showed several longer 11-22 yr episodes of sup- pression. They grew at an average of only 0.6 mm per year and had sudden increases at final release. These
TABLE 5. Numbers of dead sugar maple and beech saplings (1-20 cm dbh) beneath monospecific or mixed-species groups of overstory trees. Numbers in parentheses are per- centages of row totals.
Overstory trees
Sugar maple Beech Mixed Total
Dead sugar maple 22 (32.3) 4 (5.9) 42 (61.8) 68 Dead beech 13 (34.2) 5 (13.2) 20 (52.6) 38
displayed two kinds of architecture along their trunks. They had sections with straight trunks, straight as-cending branches, and/or upward angled branch stubs and branch scars. They also had sections with crooked trunks, gnarled horizontal branches, and/or horizon- tally oriented branch stubs and branch scars. These maple were mostly single but a few were in pairs, and we inferred that both categories had grown to canopy height in series of small gap openings.
All successful beech showed radial growth fluctua- tions associated with multiple cycles of suppression and release, but none showed architectural correlates of suppression. All had lower branches that were long and close to horizontal and all top branches that curved gradually upward at angles of 45-60", The only change at final release was that upper branches became thicker. Based on this transition in branch thickness, beech height at final release ranged from 10 to 25 m. This reflects the great range in duration of suppression ep- isodes for beech (Table 7).
Diameter growth of recent canopy winners was sig- nificantly more rapid for maple than for beech (Fig. 2). The average annual diameter growth (mean -+ 1 SE)
over the life-span of sugar maple (3.3 5 0.40 mmlyr) was 1.5 times that of beech (2.2 i 0.17 mmlyr). Var- iances within maple and beech were homogeneous (F, ,,,,,= 3.48; P > 0.10). A one-way ANOVA indi- cated significant differences between species (F,,, =
8.65; P < 0.025). Winner maple grew significantly faster than beech
before their final releases but grew at the same rates after final release (Fig. 2). Final releases for maple were at 5-15 cm dbh and final releases for beech were at 9- 27 cm dbh. The variances of growth within maple and beech were homogeneous (before: F,,,,,, = 2.82, P > 0.10; after: F,,, ,,,= 1.54, P > 0.10). Before final release, the mean annual diameter growth of maple (2.4 -+ 0.28 mmlyr) was 1.6 times greater than that of beech (1.5 -+ 0.45 mmlyr); one-way ANOVA showed that these differences were significant (F,,, = 11.92; P < 0.01). In contrast, after final release maple diameter growth (4.2 i 0.87 mmlyr) and beech diameter growth

June 1996 BEECH-SUGAR MAPLE REPLACEMENT 1243
TABLE6. Numbers and sizes of subcanopy trees that became established before, at about the same time as, or after the canopy sugar maple or beech beneath which those subcanopy trees were located. Only the largest subcanopy tree beneath any given canopy tree was sampled. Relative times of establishment of each canopy tree and the largest subcanopy tree beneath it were determined from annual rings counts in cores of these trees. Sizes are mean diameters at breast height (cm) and 95% confidence intervals.
Estimated time of establishment for subcanopv trees beneath:
Sugar maple Beech
About Before About same time After Before same time After
Replacement tree Mean Mean Mean Mean Mean Mean (projected) F95% CI n 295% CI n F95% CI n F95% CI n 295% CI n F95% CI n
Sugar maple (total n = 17) Size (cm) ... 0 19.5 2 2.1 7 8.0 2 ... 0 ... 0 9.3 + 1.2 8
Beech (total n = 24) Size (cm) 51.0 1 25.2 F 3.6 6 14 + 1.3 4 ... 0 31.5 2 18.6 F 3.8 11
(4.0 i 0.70 mmlyr) were not significantly different (ANOVA, F,,, = 0.68; P > 0.50).
Before entering the canopy, winner maple had sig- nificantly higher diameter growth rates than loser ma- ple that never entered the canopy, but growth rates of winner and loser beech were not significantly different. Variances were homogeneous for winners and losers within both species (sugar maple F,,, ,,, = 5.62 and beech F,,, ,,,= 3.93; P > 0.05 in both cases). The mean annual diameter growth of maple losers was 1.37 -+ 0.20 mmlyr, which is 57% of the growth rate of winners. This difference was significant by a one-way ANOVA ( F,,,,= 7.29; P < 0.005). In contrast, the mean annual diameter growth of beech losers was 1.34 i 0.34 mmlyr, which is 87% of the growth rate of winners. This difference was not significant (F,,,, =
0.30; P > 0.50). Sapling extension growth as a function of height and
of light microenvironment.-Beech had a horizontal growth advantage in all light microenvironments and a vertical growth advantage in the shade and light flecks of the understory whereas maple had a great vertical 2 mmlyr,'
growth advantage in the direct sun of multiple tree gaps (Fig. 3) . Vertical extension growth of maple increased ,,/,/, /,<''
TABLE7. Sizes and ages at final release (resulting in growth into the canopy) and suppression history (number of epi- sodes and durations) for recent canopy trees and winner subcanopy trees based on complete cores and some cross sections. Data are means and 95% confidence intervals. P is probability of a significant difference using unpaired t tests.
BEECH History Sugar maple Beech P
Final release Dbh (cm) 9.6 i4.08 21.2 F 6.03 0.002 Age (yr) 43.2 i 14.28 148.4 2 40.85 <0.001
Suppression history FIG.2. Cumulative diameter growth of four canopy sugar
Episodes (no.) 2.1 F 0.84 2.4 i 0.68 0.48 maple (upper) and six canopy beech (lower) based on com- Duration (yr) plete sections of trunks taken shortly after treefall. Data are
Mean 10.5 F 3.04 67.5 F 42.52 0.007 diameters plotted every 10 yr. Cumulative diameter growth Longest 12.4 F 3.14 83.9 i40.33 0.001 for constant rates of one and two mmlyr are indicated by Total 20.1 F 5.88 121.8 m 42.01 <0.001 dashed lines.

1244 THOMAS L. POULSON AND WILLIAM J. PLATT Ecology, Vol. 77, No. 4
BENEATH IN SINGLE IN MULTIPLE -CANOPY TREES TREEFALL GAPS TREEFALL GAPS
-70 - ooBeech Net
0-aBeech Total 60 - HMaple Net
- r--.Maple Total
HEIGHT CLASSES (m)
markedly with increasing light from beneath canopy trees to within single tree gaps to within multiple tree gaps. In contrast vertical growth of beech increased only slightly with increasing light. In large gaps ma- ple's total extension and net vertical growth of top branches were higher than for beech in all height class- es and increased greatly with increasing sapling height. However, in the shade maple's total and net vertical growth were less than for beech in all height classes. Because the tallest beech grew faster and the tallest maple grew slower, beech's vertical growth advantage in the shade increased with height.
The differences in net vertical extension growth be- tween beech and maple resulted in significant light mi- croenvironment effects in the ANOVA and the a priori orthogonal contrasts (Table 8, numbers refer to item numbers in this table). Light microenvironments had a significant main effect (1). In addition, effects of can- opy trees and gaps were significant (2) as were effects of single compared to multiple tree gaps (3). The sig- nificant differences in vertical extension growth among the three height classes (4) resulted primarily from dif- ferences between growth of the tallest compared to the two shorter height classes (5); differences in growth between the two shorter height classes were not sig- nificant (6). Significant interactions (7) among the ef-
FIG. 3. Vertical (upper) and horizontal (lower) extension growth (cmlyr) of sugar maple (closed circles) and beech (open circles) saplings of three height classes in three light microenvironments. All values are means 2 standard errors. See Table 8 for statistics.
fects of light microhabitats and height classes resulted from the switch from a beech to a sugar maple advan- tage with increasing height in single tree gaps and the striking increase in height growth advantage of maple in large gaps (Fig. 3).
Despite the horizontal growth advantage of all height classes of beech in all light microenvironments (Fig. 3), there were few significant effects. Overall, light microenvironments had no significant effects on dif- ferences in net horizontal growth rates between beech and maple (8) but an a priori orthogonal contrast showed significant differences between beech and ma- ple horizontal growth in gaps compared to under can- opy trees (9). While horizontal growth of maple was much less than that of beech under canopy trees, in single and multiple tree gaps the differences were much reduced and were not significant (10). Net horizontal growth among height classes was not significant (1 1, 12, 13). In addition, interactions among light micro- habitats and height classes were not significant (14) since beech net horizontal extension growth was great- er than for maple in all light microhabitats and for all height classes (Fig. 3).
Our observations of architecture help explain the dif- ferences between net and total extension growth of sug- ar maple and beech (Fig. 3). In large treefall gaps beech

June 1996 BEECH-SUGAR MAPLE REPLACEMENT 1245
TABLE8. Two-way model I ANOVA of the differences between sugar maple and beech saplings in average annual net vertical (upper) and horizontal (lower) branch extension growth. Paired beech and sugar maple of three different heights (1-2 m [S], 2-4 m [MI, 4-8 m [L]) were located in three light microenvironments (beneath a canopy tree [BC], in a single treefall gap [SG], and in a multiple treefall gap [MG]). There were five replicates of each of the nine different microen- vironmenttheight combinations. Effects of light microenvironment and height were partitioned into orthogonal single degree of freedom contrasts (indented in the table) to test a priori hypotheses; "vs." designates these orthogonal contrasts (see Results). Comparisons are numbered for identification in the Results.
No. Source df Mean square F P
Vertical growth 1 Light microenvironment (LM) 2 4300.86 49.9 <0.001 2 BC vs. (SG + MG) 1 3717.18 43.2 <0.001 3 SG vs. M G 1 4884.52 56.7 <0.001 4 Height class (H) 2 302.8 1 3.52 <0.05 5 L vs. (S + M) 1 605.28 7.03 <0.05 6 S vs. M 1 0.34 0.01 >0.75 7 LM X H 4 347.64 4.04 <0.01
Residual 36 86.08
Horizontal growth 8 Light microenvironment (LM) 2 41.76 2.57 >0.10 9 B C vs. (SG + MG) 1 83.51 5.14 <0.05
10 SG vs. MG 1 0.01 0.00 >0.90 11 Height class (H) 2 50.71 3.12 >0.05 12 L vs. (S + M) 1 34.22 2.11 >0.10 13 S vs. M 1 67.20 4.13 >0.05 14 L M X H 4 24.28 1.49 >0.10
Residual 3 6 16.24
saplings showed plagiotropic growth with no clear leader so total extension growth was much greater than net vertical extension growth. In contrast, sugar maple in large gaps showed orthotropic growth with a single leader so there was little difference between total ex-tension growth and net vertical extension growth. On the other hand maple saplings in multiple tree gaps showed greater differences than beech in total and net horizontal extension growth of the longest lateral branches. Especially in these large gaps, the lateral branches of maple tended to grow upward at =45O an- gles. In contrast, lateral branches of beech were very close to horizontal in all light microenvironments.
Lateral branch growth of tall trees.-Compared to maple, 1-8 m tall saplings of beech had no significant advantage in horizontal growth except in the shade (Ta- ble 8), but our impression was that beech's horizontal branch growth advantage increased with height. In 0.5 m tall saplings the longest beech horizontal branches were only slightly longer than maple's, but in 8-25 m tall saplings the longest beech branches were 4-10 m and the longest maple branches were only 2-4 m. The reason for longer branches in beech seems to be that yearly horizontal extension growth of 16-32 m tall beech was greater than that of maple in paired trees in all light regimes (Table 9). As far back toward the branch base as we could discern terminal bud scars, beech showed a strong tendency to increase its yearly extension growth increment but maple did not. Thus in the earliest years that we could read the record in both species (5-10 yr ago), beech's advantage ranged from 62 to 151 cm per year with an aggregate advantage over the 5-10 yr that ranged from 85 to 247 cm (Table
9). In the understory the longest beech branches were those that extended toward nearby gaps along diffuse light gradients.
Projected replacement species in different gap re-gimes.-Frequencies and sizes of gaps increased from pre-1975 to post-1975 (Table 10). After 1975 the order of magnitude increase in treefall rate was statistically significant (paired t [6]= -5.81, P = 0.001). At the time we started our studies in 1973 many local areas had not had any treefalls in at least 24 yr (pre-1949 fallen trees had been removed for firewood), the ma- jority of gaps were single treefalls, and there were no large multiple tree gaps that enlarged with time. By 1994 only a few local areas had not had treefalls since 1975, a minority of gaps were single treefalls, and the majority of gaps were multiple ireefalls that enlarged with time due to new treefalls (Table 10).
Our projection of winners in all gaps changed from 17 beech and 17 maple prior to 1975 to 38 beech and 86 maple after 1975 (Table 10). Between 1973 and 1975 we studied 24 beech gaps and could find only six maple gaps. Only two of the gaps were produced by a double treefall. In these 30 gaps we had 34 projected winners for an average of 1.06 projected winners per treefall. All projected winners were beech or sugar maple and most gaps were single treefalls. Between 1989 and 1994 we projected 136 winners in 47 additional gaps formed by falls of 87 trees for an average of 1.85 pro- jected winners per treefall. We projected 86 maple win- ners, 38 beech winners, 7 tulip tree winners, 3 black cherry winners, and 2 white ash winners. Prior to 1975 beech had a strong tendency to replace maple and ma- ple tended to replace beech, but after 1975 maple had

1246 THOMAS L. POULSON AND WILLIAM J. PLATT Ecology, Vol. 77, No. 4
TABLE9. Horizontal extension growth of lower lateral branches of paired individuals of 16-32 m tall sugar maple and beech in a variety of light regimes. Measurements are sequential, beginning at the branch tip (left) and extending towards the trunk (right). The total number of years of growth measured and the total branch growth involved are presented in the columns to the right.
Total
Annual extension growth (cm), branch Total exten-
tip inward toward trunk (left-right) number sion
Light regime Species Tip +
+ + + + + + Trunk
of years
growth (cm)
Light flecks Sugar maple 2 3 6 13 10 8 13 7 6 4 10 72 Forest interior Beech 7 5 5 7 12 19 29 31 44 64 10 223
Diffuse light Sugar maple 14 15 10 6 4 6 8 From side Beech 21 16 16 7 2 26 135
Diffuse light Sugar maple 13 13 7 7 11 13 From side Beech 11 14 26 15 81 164
Directlight Sugarmaple 12 23 4 16 21 12 18 From side Beech 8 15 35 35 33 69 109
Direct light Sugar maple 27 24 17 40 28 From side Beech 36 52 39 62 107
Direct light Sugar maple 33 9 37 30 52 36 42 25 From above Beech 17 33 23 18 37 76 65 161
Direct light Sugar maple 28 105 37 36 21 35 17 15 From above Beech 33 58 21 69 53 47 57 77
a strong tendency to replace beech and also tended to sion, or allogenic succession. In this discussion we first replace maple (Table 10). deal with these unsupported hypotheses and then con-
sider the evidence for allogenic coexistence in more detail.
Hypotheses for patterns of species replacement in Autogenic and allogenic succession.-We do not the canopy have data over a long enough time period to clearly
Our study supports the hypothesis of allogenic co- reject succession, but none of our data or data in the
existence of American beech and sugar maple in War- literature are consistent with succession.
ren Woods. While it is not possible, even with more All information shows that beech and sugar maple
than two decades of study, to reject other hypotheses have been codominant in Warren Woods for over 100
beyond "a shadow of a doubt," our data are not con- yr. Witness tree data from the mid-1800s show only
sistent with autogenic coexistence, autogenic succes- beech and sugar maple in the Warren Woods area with beech predominant. Sketchy accounts from the late 1800s (recounted by Cain 1935), data from the early
TABLE10. Treefall rates (means and 95% confidence in- tervals), numbers of sugar maple and beech gapmakers, 1900s (Billington 1924, Cain 1935), and more recent number of trees of each species projected to replace the data (Brewer et al. 1984, Donnelly 1986, and this pa- gapmakers, and the percentages of gaps formed by single isolated treefalls, single treefalls in close proximity, and per) all indicate a preponderance of sugar maple in the
multiple treefalls during two periods: 1949-1974 (25 yr) seedling and small sapling size classes with a prepon- and 1975-1994 (19 yr). derance of beech in the pole and canopy tree size class-
es. However all ages and sizes of both species have Census period been present throughout the study area since at least
Data 1949-1974 1975-1994 1933. In addition all sizes of more light-demanding Treefall rate (trees,ha-'.yr-') canopy tree species, such as tulip tree, have been pres- Sugar maple gapmakers (N) ent but have comprised, at most, 5% of the canopy
M replacing B replacing individuals. Thus Warren Woods shows the uneven size
Beech gapmakers (N) and age structure expected of an old-growth forest in M replacing dynamic equilibrium (Frelich 1995). B replacing
In the early 1900s (Billington 1924, Cain 1935),Percentages of gap types compared to 1980 (Brewer 1980), more light-demand-
% isolated, single trees ing species of canopy trees, understory trees, shrubs, % nearby, 2-3 trees, light regimes interacting and summer herbs were present in a higher, but still
% adjacent, 4-8 trees, small, proportion. We suggest that this was due to al- gaps growing over time logenic fluctuation in light regimes due to stochastic

June 1996 BEECH-SUGAR MAPLE REPLACEMENT 1247
changes in storm frequency and intensity and not to any catastrophic disturbance within the past several centuries (e.g., Dunn et al. 1983, Canham and Loucks 1984, Peterson and Pickett 1991). If autogenic succes- sion with high light levels had followed a catastrophic disturbance, then we would expect to have seen tree species height stratified by height in the order of their shade tolerance. Adjacent to our study site, in a small area apparently clearcut in the late 1800s, we did see evidence of succession with only light-demanding oaks, white ash, and tulip tree in the canopy, more shade-tolerant red and sugar maple in the subcanopy, and only shade-tolerant beech in the understory. In con- trast in our study site both sugar maple and beech of many heights were present and light-demanding spe- cies were rare and of all heights (see also Donnelly 1986, Poulson and Platt 1989, King 1994). Furthermore between 1933 and 1980 beech did not increase in the canopy as expected if succession were approaching a climax of the most shade-tolerant species and if the propensity of beech to root sprout had given it an ad- ditional advantage in self-replacement (e.g., Horn 1971, Forcier 1975, Brisson ~t al. 1994). In fact in our study area root sprouts were rare and always died after the adjacent beech canopy tree fell.
To explain the decline in light-demanding species in the understory from the early 1900s to the late 1970s, Brewer (1980) hypothesized that the anthropogenic ef- fect of lowering the water table favored sugar maple regeneration. He argued that sugar maple's increased density, coupled with early leaf expansion and heavy shading, caused the decline of the light-demanding spe- cies present in the early 1900s. If this were true, then it would be a case of allogenic succession. Instead, with the high treefall rates and increased gap sizes after 1975, frequencies of light-demanding species are in- creasing again (King 1994; T. L. Poulson, personal observation).
Our strongest evidence against successional change is that the relative abundances of sugar maple and beech large saplings and poles have not changed in the way projected from data on relative abundances of seedlings and small saplings in 1933. If succession had occurred, then today we should see a relative abundance of sugar maple and beech in the large sapling and pole size classes that parallels the 1933 relative abundances in the seedling and small sapling size classes; we did not see this.
Additional evidence for lack of succession toward beech or maple is that we did not see an increase in large understory individuals of beech or maple in 1980. Our growth rate data show that they clearly could have increased greatly in size and changed the numbers and proportions of large saplings and poles if there had been succession. Based on measured growth rates of winner sugar maple, maple could have increased between 12 (not yet finally released) and 20 cm (finally released) if there were succession toward sugar maple. If there
had been succession toward beech, then there could have been beech diameter increases of between 7.5 (not yet finally released) and 20 cm (finally released).
Thus if there had been succession toward increasing beech or sugar maple dominance, we should have de- tected it. Instead size-frequency distributions of larger size classes of beech and sugar maple from 1933 to 1980 were not significantly different.
Autogenic coexistence.-Our strongest evidence against autogenic coexistence, either by self-replace- ment or reciprocal replacement, is the change in our projections of species winners in treefall gaps as rates of treefall and sizes of gaps increased after 1975. Be- fore 1975 we projected equal numbers of beech and maple as winners and a tendency toward reciprocal replacement. With higher light levels after 1975, we projected twice as many maple as beech winners and a tendency for sugar maple to replace both beech and sugar maple.
We found no significant canopy species-specific au- togenic influences of soil chemistry as assessed by beech or maple leaf litter, of light intensity as assessed by extension growth of 0.2-0.8 m tall maple, and of beech roots as assessed by numbers of Epijagus. We believe that possible autogenic influences, due to known species differences in leaf chemistry (Brisson et al. 1994) and canopy light transmission (Canham et al. 1994) and suspected differences in throughfall and stemflow, are nullified because many sizes of both beech and maple co-occur in the subcanopy and un- derstory. We believe that possible autogenic influences of roots of one species are nullified because roots of both species certainly co-occur at all places. Complete excavations of roots in forests show that all root sizes of large trees are found several crown diameters away from the trunk (Stout 1956, Perry 1982).
We suggest that any strong species-specific autogen- ic effects in forests will be found only during sucession when species clearly stratify by height. Under these conditions light transmission and both stem flow and throughfall water chemistry would show the greatest species differences because they would be most local- ized. Litter and root differences would be less because of the summed effects from different canopy, midstory, and understory species.
Unlike Woods (1979) we found no reciprocal spe- cies-specific overstory influence on understory sapling death. In comparison to Woods' study at Warren Woods, we looked at many more deaths (106 vs. 18) of a greater height range (1-20 m vs. 2-4 m) and as- cribed death to a particular species only if the overstory individuals were all of one species. Of our dead trees 58% were under mixed species influence (vs. 5% for Woods). For those deaths ascribable to one species, 5 of 18 beech deaths and 22 of 26 maple deaths were under maple. Observations in the field suggest to us that most deaths were associated with strong intra- and interspecific thinning of losers in areas where maple

1248 THOMAS L. POULSON AND WILLIAM J. PLATT Ecology, Vol. 77, No. 4
densities were extremely high during and soon after gap closure.
We clearly falsified the autogenic coexistence mech- anism of beech self-replacement by root sprouts. Few beech had any sprout-origin saplings and they died soon after the adjacent canopy beech fell.
In the mid- 1970s we used the same measures as Fox (1977) to detect autogenic influences but unlike Fox found no evidence for reciprocal replacement. We looked for effects on individuals > 2 m tall, because any reciprocal effects on seedling recruitment or growth (e.g., Cypher and Boucher 1982) must persist to at least the sapling stage if they are to influence entry into the canopy. In addition Jurik (1986a, b) found no significant differences between beech and sugar maple in leaf respiration, photosynthesis, or mor- phology, and we saw distinct architectural differences between beech and sugar maple only for individuals >2 m tall. Fox found a significant trend for understory sapling and pole beech and maple to be larger beneath the heterospecific species only under monospecific can- opy patches. These projected replacements would not have been significantly differmt, however, had "ties" been given to maple rather than beech. We gave ties to maple because our data on extension growth showed that maple's upward growth in gaps is much faster than beech's (see also Canham 1988a, 1989). Our data are consistent with those of Fox (1977) in that they show a strong asymmetry in diameter with beech larger than maple whether under a single canopy tree or mono- specific canopy patches of beech or maple. These re- sults weaken the case for reciprocal replacement, which requires symmetric species-specific influences, but are not inconsistent with self-replacement of beech. How- ever our coring data are not consistent with beech self- replacement or other autogenic influences on replace- ment. Subcanopy trees often established earlier than or at the same time as the conspecific or heterospecific canopy trees above them. To be consistent with auto- genic self-replacement or reciprocal replacement they should all have established after the tree above.
Allogenic coexistence with species trade-offs in sur-vival and growth.-Our data are consistent with the hypothesis of allogenic coexistence, which predicts that the species that has the advantage will change with the changes in light level that result from fluctuations in rates of treefall and sizes of gaps. In Warren Woods, beech has the advantage in times of low treefall rate and small gaps because it can survive longer than maple in the shaded understory. Both beech and sugar maple are considered very shade tolerant relative to other can- opy tree species (Fowells 1965, Poulson and Platt 1989, Canham et al. 1994). However, because vertical rates of growth of seedlings and small saplings are too slow to reach the canopy before gap closure (Donnelly 1986), both require multiple gap episodes to reach the canopy if only branch gaps or small single tree gaps occur (Runkle 1982, Runkle and Yetter 1987). With the
disturbance regime of primarily single treefalls prior to 1975 in Warren Woods, the few maple that reached the canopy had much shorter periods of suppression than successful beech and had their final release at much smaller sizes and younger ages. At Warren Woods, small maple are more numerous than beech but have a much higher death rate than beech in the un- derstory (Donnelly 1986). Before 1975 most seedling size maple were never even close to a gap and many saplings that experienced a single gap died before a second gap occurred in their immediate area. Since 1975, however, the understory light levels have con- tinued to increase as yearly treefall rates have remained an order of magnitude higher, gaps have become larger, gaps have stayed open longer, and many gaps have increased in area as a result of new treefalls (Poulson and Platt 1989, Young and Hubbell 1991). This has shifted the advantage to maple because understory ma- ple survive longer in the higher understory light levels around multiple tree gaps and have a much greater vertical height growth advantage over beech in multiple tree gaps.
Trade-offs that we have shown for survival of sup- pression, lateral extension growth, and vertical exten- sion growth are central to our predictions that the pre- dominant species to replace fallen canopy trees will change with rates and sizes of disturbance. We believe the trade-offs are related to architectural differences because Jurik (1986a, b) found no differences between sugar maple and beech in photosynthetic physiology or morphology at the leaf and seedling scale. Archi- tecturally, beech has plagiotropic growth with no single leader and its uppermost branches are never vertically oriented. As a result, net vertical growth is always less than total extension growth of upper branches in gaps. Nonetheless, in the shaded understory beneath canopy trees, both total and net vertical extension growth are much greater for beech than sugar maple, and this beech advantage increases somewhat as heights of sap- lings increase. In addition to beech's vertical growth advantage in the understory, its long lateral branches increase the chances of encountering light flecks and other transiently available light. In addition when beech is near gaps, those lateral branches on the gap side are always longer than other branches. This indicates that beech branches grow toward nearby gaps along diffuse light gradients. This advantage over maple in horizon- tal branch growth increased with height of saplings from 8 to 32 m. We suggest that this growth pattern explains beech's ability to tolerate understory condi- tions longer than sugar maple. Finally, our data indicate that beech are released from suppression at light levels that still suppress sugar maple.
The change from suppression to nonsuppression with very slight increases in light level helps to explain why our results on relative times of suppression for suc- cessful beech and sugar maple differ from those of Canham (1985, 1988a, 1990) and Donnelly (1986).

1249 June 1996 BEECH-SUGAR MAPLE REPLACEMENT
Thus beech can tolerate low light levels that would kill maple, and beech is released from suppression at light levels that still suppress maple.
We suggest that differences between our results and Canham's are explained by the fact that understory light levels had been as low as 1% of full sun for a long time at Warren Woods (Poulson and Platt 1981, 1989, Canham et al. 1990, King 1994) whereas they were =3% of full sun in Canham's Adirondack sites. Compared to maple, Canham found that successful beech had been suppressed for fewer total years, had shorter individual suppression episodes, and were both of smaller diameters and younger ages at final release. This is the opposite of our results in Warren Woods where beech predominates in the canopy. Canham's study sites had been previously cleared and were suc- cessional with sugar maple predominant in the canopy and a virtual monoculture of beech in the subcanopy and understory. Maple canopies transmit more light than beech canopies (Canham et al. 1994), and this could explain the 3% understory light levels at Can- ham's sites.
At Warren Woods our results on suppression differ from Donnelly's (1986) in that he found that beech were suppressed only slightly longer than sugar maple, and we found that successful beech had been sup- pressed for much longer than maple. This difference appears to have resulted from differences in technique and definition of suppression. First, Donnelly defined suppression by 10 successive years at <2.0 mm per year diameter growth while we defined suppression by four successive years at that growth rate. Second, we used a number of complete sections, which gave us greater ability to detect rings in suppressed trees than could be detected using cores alone as Donnelly did.
A conceptual model of allogenic coexistence
Using our data from Warren Woods, which show that the survival and growth advantages of sugar maple and beech shifted with frequencies and sizes of treefall gaps, we have developed a conceptual model of canopy tree replacement based on field sketches of actual parts of Warren Woods (Fig. 4). The effects on forest struc- ture of differences in frequencies and sizes of gaps are shown in four pairs of panels in which the joint result of local and nearby gaps is a change from understory light levels of =I% full sun (panel 1 left) to as much as 30% full sun (panel 4 right).
Sizes and frequencies of treefall gaps increased dra- matically during our study at Warren Woods. When we initiated our study in 1973 most of the forest resembled panel 1, although a few areas resembled panel 2 and, rarely, panel 3. Beginning in 1975 a 10-fold increase in treefall rate resulted in many gaps that were multiple treefalls and that remained open for longer and even increased in area over time. We suggest the following explanation for these changes. The initial increase in frequency and size of gaps in 1975 was the result of a
stochastic increase in storm frequency and intensity (Fujita 1976, Brewer and Merritt 1978, Donnelly 1986). Subsequently the frequency and intensity of storms remained high and/or a positive feedback has kept gaps open longer. New treefalls tend to occur along the edges of previous large gaps (Poulson and Platt 1989, Young and Hubbell 1991), and we suggest that increase in gap size increases wind turbulence in the gap.
As depicted in panel 1, low frequencies and small sizes of treefall gaps favor replacement of canopy trees by beech, but sugar maple has a refuge since multiple individuals occasionally make it to the canopy in a very large beech gap. The left panel shows a site where no local treefalls have occurred for about a century and there are no nearby gaps. Beech crowns have become wide and deep so the understory is very dark. While both sugar maple and beech seedlings are present, only beech survive to taller sizes. Beech's slow upward growth in light flecks and branch gaps ensures that it will eventually be the replacement species when a local gap occurs. Occasionally, as shown by the central can- opy beech, only < I m tall beech and sugar maple are present before a treefall and so maple has the vertical growth rate advantage when a gap occurs. As shown in the right panel, a local beech gap is so large (200- 275 m2) that it does not close by ingrowth of the sur- rounding canopy and maple poles come to dominate the gap with slower growing beech below. We project that this will become a monospecific patch of maple. It will have subcanopy beech, which will become the next canopy trees when the current winner maple even- tually fall.
Panel 2 depicts the effects of a two to three fold higher frequency of treefall with occasional multiple treefalls and more frequent co-occurrence of light input from both local and nearby gaps to a local area (Poulson and Platt 1989). As shown in the left panel, beech in the understory are taller than maple, although some maple have reached sapling height in light from a past nearby gap and local branch gaps. Most of these maple are severely suppressed with thin, flattened crowns and most will die. However a few could reach canopy height if not too suppressed and not below a beech sapling at the time of local gap formation. Such a sit- uation is shown in the right panel after a double treefall. The winner maple shows a twisted trunk typical of individuals that respond with orthotropic growth to changing light gradients in gaps by "snaking" up and around long lateral branches of canopy beech that are growing into the gap. In this situation most maple are quickly resuppressed and die while understory beech continue to grow upward and will come to dominate the subcanopy. As a result beech continue to be the dominant replacement species.
Panel 3 shows the effects of still higher frequencies of branch gaps and single treefall gaps with an increas- ing number of multiple treefall gaps. Before local tree-

THOMAS L. POULSON AND WILLIAM J. PLATT Ecology, Vol. 77, No. 4
25 YR BEFORE TREEFALL 25 YR AFTER TREEFALL
no gaps nearby
local gaps every 100-200 y r
< 1% full sun
Bc 6-8 to Mc 1 canopy tree ratio
huge B canopies cast deep shade; multiple M winners in a huge B treefall rare sapling B are suppressed
nearby gaps every 50- 100 y r 3 local gaps every 60- 100 y r (2 )
1-3% full sun
Bc 3-4 to Mc 1 many B in understory; M usually B replaces almost every treefall die during first suppression
nearby gaps every 20-50 y r
local gaps every 40-60 y r ( 3 )
1-6% full sun
Bc 2-3 to Mc 1 more B than M in understory; M or B replace B; M endure 1-4 suppression cycles B almost always replaces M
nearby gaps every 0-20 y r
local gaps every 0-40 y r (4)
1-30% full sun
B,-1 to 1-2 M,- more M than B in understory; gaps grow with time; M replaces most M rarely completely suppressed B and some M; B replaces some M
FIG.4. A conceptual model of allogenic coexistence showing that infrequent and small treefall gaps (panel 1) favor beech (open silhouettes) whereas frequent and large gaps (panel 4) favor sugar maple (closed silhouettes) attainment of canopy height. Panels 2 and 3 show intermediate situations. The left panel of each pair, 25 yr before a local treefall, shows how the understory percentages of full sunlight levels, due to branch gaps and nearby gaps, affect the forest structure and relative success of beech and sugar maple. The right panel, 25 yr after a local treefall (x's show former positions of crown tops of fallen trees), shows responses of species to gaps. Vertical and horizontal axes are drawn to a 10-m scale and only individuals >1 cm dbh and >1-2 m tall are shown. B, = beech canopy tree; IM, = sugar maple canopy tree.
fall, understory light levels are 1-6% full sun. There episodes of suppression and have narrow, deep crowns. are regular branch gaps, some nearby gaps, and higher When a local gap occurs, these tall maple quickly grow light transmission through the canopy; beech crowns upward and can even bypass taller beech as shown in are narrow and shallow since branches fall faster than the right panel. The bypassed beech continue to grow they regenerate. As shown in the left panel, there are beneath the winner maple. Thus when the new canopy many beech and maple of various heights in the un- maple eventually falls, the long lateral branches of sub- derstory. The taller maple have survived several short canopy beech have already filled the canopy gap. Thus

June 1996 BEECH-SUGAR MAPLE REPLACEMENT 1251
beech almost always replaces maple in the canopy al- though both beech and maple replace beech.
Panel 4 shows that maple will be the predominant replacement species under conditions of very high fre- quencies and large sizes of treefall gaps, but beech continues to have a refuge since it can grow upward under maple and under more light-demanding species that now occasionally reach the canopy. As shown in the left panel frequent light input from nearby treefall gaps and local branch gaps has allowed understory ma- ple to become more common than, and as tall or taller than, beech. Thus, as shown in the right panel, after a multiple treefall more maple than beech will enter the canopy. Nonetheless maple cannot exclude beech be- cause beech continue to grow upward beneath maple. Despite the occurrence of large and growing gaps, spe- cies more light demanding than beech and sugar maple are not likely to have much influence on canopy dy- namics. These light-demanding species make it to the canopy in Warren Woods only in parts of large gaps where all tall understory beech and maple were knocked down at the time of gap formation (Poulson and Platt 1989, King and Poulson 1994). As of 1994 we projected that only ~ 5 % of the canopy will be light- demanding species and that they will be replaced by maple or beech that can grow well under the relatively high light levels transmitted through the canopies of light-demanding species (Canham et al. 1991).
PERSPECTIVEAND CONCLUSIONS
Our insights have critically depended on visiting Warren Woods many times in different seasons and over a 22-yr time span when frequencies and sizes of treefall gaps varied dramatically. It did not occur to us until the mid-1980s that we were seeing a sustained departure from near equilibrium conditions and not simply slight temporal and spatial variation in distur- bance regimes. The change in forest dynamics, coupled with our earlier understanding of trade-offs in survival in the understory and upward growth in gaps for beech and sugar maple, allowed us to develop a conceptual model of allogenic coexistence. The robust aspect of our model is that we predict that beech and sugar maple will continue to coexist over a wide range of distur- bance regimes despite great fluctuations in their relative abundances in the canopy.
At Warren Woods we have not yet seen large-scale disturbances that result in the successional mosaic im- plied by an intermediate disturbance model. While large-scale catastrophic disturbances will eventually occur, they are likely to be rare events that occur on a time scale of millennia (e.g., Dunn et al. 1983, Canham and Loucks 1984, Frelich 1995) rather than on eco- logical time scales of decades to centuries. Nonetheless chronic disturbances on an ecological time scale are dependable and do produce continual allogenic change in light regimes. Thus equilibrium conditions are tran- sient at best in Warren Woods and other forests influ-
enced by frequent noncatastrophic disturbances (e.g., Platt et al. 1990, Platt and Schwartz 1990, Slater et al. 1995). We caution students of forest dynamics that, at least prior to European colonization of North America, the relative time forests have been influenced by non- catastrophic disturbances was probably much longer than the time free from disturbances or in successional recovery from catastrophic disturbances. Thus our con- ceptual model of allogenic coexistence may have wide- spread and general applicability.
Above all we are grateful to the W. K. Warren Foundation for preserving Warren Woods and to Stanley Cain for his quantitative study half a century ago. Many colleagues and students have been sounding boards for our ideas and helped us in the field during our 22 years of work at Warren Woods; you know who you are and we thank you one and all. We particularly thank Larry Barden, Richard Brewer, Joel Brown, Charlie Canham, Gerry Donnelly, Tom Givnish, Jeff Glitz- enstein, Jon Higgins, Kevin Hogan. Henry Horn, John King, Glen Kroh, John Lussenhop, Bob Peet, Peter Murphy, Mac McIntosh, Jim Runkle, Terry Sharik, John Vankat, and Don Waller. For detailed comments that helped us focus on our main message we thank Carol Augspurger and two anony- mous reviewers. Maggie Platt and especially Liz Poulson have patiently helped us to improve our prose. And, finally we give special thanks to Rob Peters who has been helpful in every possible way.
Barden, L. S. 1980. Tree replacement in small canopy gaps of a cove hardwood forest in the southern Appalachians. Oikos 35:16-19.
Billington, C. 1924. The flowering plants and ferns of Warren Woods, Berrien County, Michigan. Papers of the Michigan Academy of Sciences, Arts, and Letters 4:81-110.
Braun, E. L. 1950. Deciduous forests of eastern North Amer- ica. Blakiston Company, Philadelphia, Pennsylvania, USA.
Brewer, L. G., T. W. Holder, and H. A. Raup. 1984. Preset- tlement vegetation of southwestern Michigan. Michigan Botanist, Supplement to Volume 23, Number 4.
Brewer, R. 1980. A half-century of changes in the herb layer of a climax deciduous forest in Michigan. Journal of Ecol- ogy 68:823-832.
Brewer, R., and P. J. Merritt. 1978. Windthrow and tree re- placement in a climax beech-maple forest. Oikos 30: 149- 152.
Brisson, J., Y. Bergeron, A. Bouchard, and A. Leduc. 1994. Beech-maple dynamics in an old-growth forest in southern Quebec, Canada. Ecoscience 1:40-46.
Cain, S. A. 1935. Studies on virgin hardwood forests: 111. Warren Woods, a beech-maple climax forest in Berrien County, Michigan. Ecology 16:500-513.
Canham, C. D. 1985. Suppression and release during canopy recruitment in Acer saccharum. Bulletin of the Torrey Bo- tanical Club 112:134-145.
. 1988a. Growth and canopy architecture of shade- tolerant trees: the response of Acer saccharum and Fagus grandifolia to canopy gaps. Ecology 69:786-795.
. 1988b. An index for understory light levels in and around canopy gaps. Ecology 69: 1634-1637.
. 1989. Different responses to gaps among shade- tolerant tree species. Ecology 70:548-550.
, 1990. Suppression and release during canopy re- cruitment in Fagus grandifolia. Bulletin of the Torrey Bo- tanical Club 117: 1-7.
Canham, C. D., J. S. Denslow, W. J. Platt, J. R. Runkle, T. A. Spiess, and P. S. White. 1990. Light regimes below

1252 THOMAS L. POULSON AND WILLIAM J. PLATT Ecology, Vol. 77, No. 4
closed canopies and tree-fall gaps in temperate and tropical forests. Canadian Journal of Forest Research 20:620-63 1.
Canham, C. D., A. C. Finzi, S. W. Pacala, and D. H. Burbank. 1994. Causes and consequences of resource heterogeneity in forests: Interspecific variation in light transmission by canopy trees. Canadian Journal of Forest Research 24:337- 349.
Canham, C. D., and 0 . L. Loucks. 1984. Catastrophic windthrow in the presettlement forest of Wisconsin. Ecol- ogy 65:803-809.
Canham, C. D., and P. L. Marks. 1985. The response of woody plants to disturbance: patterns of establishment and growth. Pages 197-216 in S. T. A. Pickett and P. S. White, editors. The ecology of natural disturbances and patch dy- namics. Academic Press, Orlando, Florida, USA.
Connell, J. H., and R. 0 . Slatyer. 1977. Mechanisms of suc- cession in natural communities and their role in community stability and organization. American Naturalist 111: 11 19- 1144.
Connell, J. H., J. G. Tracey, and L. J. Webb. 1984. Com- pensatory recruitment, growth, and mortality as factors maintaining rain forest tree diversity. Ecological Mono- graphs 54: 141-164.
Cypher, J., and D. H. Boucher. 1982. Beech-maple coexis-tence and seedling growth rates at Mont-Saint-Hilaire, Que- bec. Canadian Journal of Botany 60: 1279-1281.
Donnelly, G. T. 1986. Forest composition as determined by gap dynamics: A beech-maple forest in Michigan. Disser- tation. Michigan State University, Ann Arbor, Michigan, USA.
Donnelly, G. T., and P. G. Murphy. 1987. Warren Woods as forest primeval: a comparison of forest composition with presettlement beech-sugar maple forests of Berrien Coun- ty, Michigan. Michigan Botanist 26: 17-26.
Dunn, C. P., G. R. Gunenspergen, and J. R. Dorney. 1983. Catastrophic wind disturbance in an old-growth hemlock- hardwoods forest, Wisconsin. Canadian Journal of Botany 61:211-217.
Esten, M. M. 1932. A statistical study of a beech-maple association at Turkey Run State Park, Parke County, In- diana. Butler University Botanical Studies 2:183-201.
Forcier, L. K. 1975. Reproductive strategies and the co-oc- currence of climax tree species. Science 189:808-810.
Fowells, H. A,, editor. 1965. Silvics of forest trees of the United States. United States Department of Agriculture Handbook 271.
Fox, J. T. 1977. Alternation and coexistence of tree species. American Naturalist 111:69-89.
Frelich, L. E. 1995. Old forest in the Lakes states today and before European settlement. Natural Areas Journal 15: 157- 167.
Fujita, T. T. 1976. Tornado map for the United States for the past 50 years. University of Chicago, Chicago, Illinois, USA.
Horn, H. S. 1971. The adaptive geometry of trees. Mono- graphs in Population Biology, Number 3. Princeton Uni- versity Press, Princeton, New Jersey, USA.
Hough, A. F., and R. D. Forbes. 1943. The ecological silvics of forests in the high plateaus of Pennsylvania. Ecological Monographs 13:299-320.
Jurik, T. W. 1986a. Seasonal patterns of leaf photosynthetic capacity in successional northern hardwood tree species. American Journal of Botany 73:131-138.
. 1986b. Temporal and spatial patterns of specific leaf weight in successional northern hardwood species. Amer- ican Journal of Botany 73:1083-1092.
Kenoyer, L. A. 1934. Forest distribution in southwest Mich- igan as interpreted from the original land survey. Papers of the Michigan Academy of Sciences, Arts, and Letters 19:67-111.
King, J. L. 1994. Persistence of black cherry, white ash, and tulip poplar in an old-growth beech-maple forest. Thesis. University of Illinois, Chicago, Illinois, USA.
King, J. L., and T. L. Poulson. 1994. Tree seedlinglsapling responses to light heterogeneity. Bulletin of the Ecological Society of America 74:309.
Larson, J. D. 1980. Soil survey of Berrien County, Michigan. United States Department of Agriculture, Soil Conserva- tion Service, Washington, D.C.
Laufersweiler, J. D. 1955. Changes with age in the proportion of the dominants in a beech-maple forest in central Ohio. Ohio Journal of Science 55:73-80.
Perry, T. 0 . 1982. The ecology of tree roots and the practical significance thereof. Journal of Arboriculture 8: 197-21 1.
Peters, R. 1992. Ecology of beech forests in the northern hemisphere. Dissertation. Wageningen Agricultural Uni- versity, Wageningen, The Netherlands.
Peters, R., and T. L. Poulson. 1994. Stem growth and canopy dynamics in a world-wide range of Fagus forests. Journal of Vegetation Science 5:421-432.
Peterson, C. J., and S. T. A. Pickett. 1991. Treefall and re- sprouting following catastrophic windthrow in an old-growth hemlock-hardwoods forest. Forest Ecology and Management 42:205-2 17.
Platt, W. J., G. W. Evans, and S. L. Rathbun. 1988. The population dynamics of a long-lived conifer (Pinus palus- tris). American Naturalist 131:491-525.
Platt, W. J., and M. W. Schwartz. 1990. Temperate hardwood forests. Pages 194-229 in R. Myers and J. Ewel, editors. Ecosystems of Florida. University of Florida Press, Orlan- do, Florida, USA.
Poulson, T. L., and W. J. Platt. 1981. Dynamics of tree re- placement in a beech-maple forest at Warren Woods, Mich- igan. Bulletin of the Ecological Society of America 62:135.
Poulson, T. L., and W. J. Platt. 1982. Root sprouts: unim- portant in beech regeneration at Warren Woods. Bulletin of the Ecological Society of America 63:202.
Poulson, T. L., and W. J. Platt. 1989. Gap light regimes influence canopy tree diversity. Ecology 70:553-555.
Runkle, J. R. 1981. Gap regeneration in some old-growth forests of eastern United States. Ecology 62:1041-1051.
. 1982. Patterns of disturbance in some old-growth mesic forests of eastern North America. Ecology 63:1533- 1546.
Runkle, J. R., and T. C. Yetter. 1987. Treefalls revisited: gap dynamics in the southern Appalachians. Ecology 68:417- 424.
Siegel, S. 1956. Nonparametric statistics for the behavioral sciences. McGraw Hill, New York, New York, USA.
Slater, H. H., W. J. Platt, D. B. Baker, and H. A. Johnson. 1995. Effects of Hurricane Andrew on damage and mor- tality of trees in subtropical hardwood hammocks of Long Pine Key, Everglades National Park, Florida, USA. Journal of Coastal Research 18: 197-207.
Sokal, R. R., and E J. Rohlf. 1981. Biometry. W. H. Freeman, San Francisco, California, USA.
Steingraeber, D. A,, L. J. Kascht, and D. H. Franck. 1979. Variation of shoot morphology and bifurcation ratio in sug- ar maple (Acer saccharum) saplings. American Journal of Botany 66:441-445.
Stout, B. B. 1956. Studies of the root systems of deciduous trees. Harvard Black Rock Forest Bulletin, Number 15.
Vankat, J. L., W. H. Blackwell, Jr., and W. E. Hopkins. 1975. The dynamics of Hueston Woods and a review of the ques- tion of the successional status of the southern beech-maple forest. Castanea 40:290-3 11.
Whittaker, R. H., and S. A. Levin. 1977. The role of mosaic phenomena in natural communities. Theoretical Population Biology 12:117-139.
Williams, A. B. 1936. The composition and dynamics of a

June 1996 BEECH-SUGAR MAPLE REPLACEMENT 1253
beech-maple climax community. Ecological Monographs Young, T. P., and S. E. Hubbell. 1991. Crown asymmetry, 6:317-408. treefalls, and repeat disturbance of broad-leaved forest
Woods, K. D. 1979. Reciprocal replacement and the main- gaps. Ecology 72:1464-1471. tenance of codominance in a beech-maple forest. Oikos 33:31-39.
ERRATUM
An article by S. D. Wilson and D. Tilman (1993, "Plant competition and resource availability in re-sponse to disturbance and fertilization," Ecology 74[2]:599-611,Fig. 3C), shows a negative correlation between above- and belowground competition in old- field vegetation. The correlation is spurious because the variables were calculated using terms that had some identical values. Aboveground competition (A ) was calculated as A = (R,, - R,,)IR,,, where R is the relative growth rate of transplants and the subscripts denote competition treatments (RN: transplants grown with roots of neighbors; AN: with all neighbors; NN: with no neighbors). Belowground competition ( B )was calculated as B = (R,, - R,,)IR,,. As R,, increases in size, A becomes large and B becomes small, pro- ducing a negative correlation between A and B.
The problem can be overcome by calculating each
A and B with different values of R,,, RAN,and R,,. In our experiment, there were three replicate subplots of each competition treatment in each of 40 plots. Com- petition treatments were assigned randomly to the nine subplots. We originally used the mean growth rate in each competition treatment in each plot to calculate A and B, and, thus, A and B in our figure are not inde- pendent. In a new analysis, we calculated A and B independently in each plot using the growth rates from randomly selected subplots. The same subplot was nev- er used for calculating both A and B. We did this five times and found that A and B were negatively correlated in each case. The P values associated with the corre- lations were 0.0009, 0.0077, 0.0253, 0.0338, and 0.3125 (combined P < 0.001). The new analysis in- dicates that above- and belowground competition are indeed negatively correlated.

You have printed the following article:
Replacement Patterns of Beech and Sugar Maple in Warren Woods, MichiganThomas L. Poulson; William J. PlattEcology, Vol. 77, No. 4. (Jun., 1996), pp. 1234-1253.Stable URL:
http://links.jstor.org/sici?sici=0012-9658%28199606%2977%3A4%3C1234%3ARPOBAS%3E2.0.CO%3B2-B
This article references the following linked citations. If you are trying to access articles from anoff-campus location, you may be required to first logon via your library web site to access JSTOR. Pleasevisit your library's website or contact a librarian to learn about options for remote access to JSTOR.
Literature Cited
A Half-Century of Changes in the Herb Layer of a Climax Deciduous Forest in MichiganRichard BrewerThe Journal of Ecology, Vol. 68, No. 3. (Nov., 1980), pp. 823-832.Stable URL:
http://links.jstor.org/sici?sici=0022-0477%28198011%2968%3A3%3C823%3AAHOCIT%3E2.0.CO%3B2-A
Studies on Virgin Hardwood Forest: III. Warren's Woods, A Beech-Maple Climax Forest inBerrien County, MichiganStanley A. CainEcology, Vol. 16, No. 3. (Jul., 1935), pp. 500-513.Stable URL:
http://links.jstor.org/sici?sici=0012-9658%28193507%2916%3A3%3C500%3ASOVHFI%3E2.0.CO%3B2-1
Suppression and Release during Canopy Recruitment in Acer saccharumCharles D. CanhamBulletin of the Torrey Botanical Club, Vol. 112, No. 2. (Apr. - Jun., 1985), pp. 134-145.Stable URL:
http://links.jstor.org/sici?sici=0040-9618%28198504%2F06%29112%3A2%3C134%3ASARDCR%3E2.0.CO%3B2-9
Growth and Canopy Architecture of Shade-Tolerant Trees: Response to Canopy GapsCharles D. CanhamEcology, Vol. 69, No. 3. (Jun., 1988), pp. 786-795.Stable URL:
http://links.jstor.org/sici?sici=0012-9658%28198806%2969%3A3%3C786%3AGACAOS%3E2.0.CO%3B2-W
http://www.jstor.org
LINKED CITATIONS- Page 1 of 5 -

An Index For Understory Light Levels in and Around Canopy GapsCharles D. CanhamEcology, Vol. 69, No. 5. (Oct., 1988), pp. 1634-1638.Stable URL:
http://links.jstor.org/sici?sici=0012-9658%28198810%2969%3A5%3C1634%3AAIFULL%3E2.0.CO%3B2-3
Different Respones to Gaps Among Shade-Tollerant Tree SpeciesCharles D. CanhamEcology, Vol. 70, No. 3. (Jun., 1989), pp. 548-550.Stable URL:
http://links.jstor.org/sici?sici=0012-9658%28198906%2970%3A3%3C548%3ADRTGAS%3E2.0.CO%3B2-F
Suppression and Release During Canopy Recruitment in Fagus grandifoliaCharles D. CanhamBulletin of the Torrey Botanical Club, Vol. 117, No. 1. (Jan. - Mar., 1990), pp. 1-7.Stable URL:
http://links.jstor.org/sici?sici=0040-9618%28199001%2F03%29117%3A1%3C1%3ASARDCR%3E2.0.CO%3B2-7
Catastrophic Windthrow in the Presettlement Forests of WisconsinCharles D. Canham; Orie L. LoucksEcology, Vol. 65, No. 3. (Jun., 1984), pp. 803-809.Stable URL:
http://links.jstor.org/sici?sici=0012-9658%28198406%2965%3A3%3C803%3ACWITPF%3E2.0.CO%3B2-O
Mechanisms of Succession in Natural Communities and Their Role in Community Stabilityand OrganizationJoseph H. Connell; Ralph O. SlatyerThe American Naturalist, Vol. 111, No. 982. (Nov. - Dec., 1977), pp. 1119-1144.Stable URL:
http://links.jstor.org/sici?sici=0003-0147%28197711%2F12%29111%3A982%3C1119%3AMOSINC%3E2.0.CO%3B2-H
Compensatory Recruitment, Growth, and Mortality as Factors Maintaining Rain Forest TreeDiversityJoseph H. Connell; J. G. Tracey; Leonard J. WebbEcological Monographs, Vol. 54, No. 2. (Jun., 1984), pp. 141-164.Stable URL:
http://links.jstor.org/sici?sici=0012-9615%28198406%2954%3A2%3C141%3ACRGAMA%3E2.0.CO%3B2-M
http://www.jstor.org
LINKED CITATIONS- Page 2 of 5 -

Reproductive Strategies and the Co-occurrence of Climax Tree SpeciesLawrence K. ForcierScience, New Series, Vol. 189, No. 4205. (Sep. 5, 1975), pp. 808-810.Stable URL:
http://links.jstor.org/sici?sici=0036-8075%2819750905%293%3A189%3A4205%3C808%3ARSATCO%3E2.0.CO%3B2-9
Alternation and Coexistence of Tree SpeciesJohn F. FoxThe American Naturalist, Vol. 111, No. 977. (Jan. - Feb., 1977), pp. 69-89.Stable URL:
http://links.jstor.org/sici?sici=0003-0147%28197701%2F02%29111%3A977%3C69%3AAACOTS%3E2.0.CO%3B2-V
The Ecology and Silvics of Forests in the High Plateau of PennsylvaniaA.F. Hough; R. D. ForbesEcological Monographs, Vol. 13, No. 3. (Jul., 1943), pp. 299-320.Stable URL:
http://links.jstor.org/sici?sici=0012-9615%28194307%2913%3A3%3C299%3ATEASOF%3E2.0.CO%3B2-8
Seasonal Patterns of Leaf Photosynthetic Capacity in Successional Northern Hardwood TreeSpeciesThomas W. JurikAmerican Journal of Botany, Vol. 73, No. 1. (Jan., 1986), pp. 131-138.Stable URL:
http://links.jstor.org/sici?sici=0002-9122%28198601%2973%3A1%3C131%3ASPOLPC%3E2.0.CO%3B2-D
Temporal and Spatial Patterns of Specific Leaf Weight in Successional Northern HardwoodTree SpeciesThomas W. JurikAmerican Journal of Botany, Vol. 73, No. 8. (Aug., 1986), pp. 1083-1092.Stable URL:
http://links.jstor.org/sici?sici=0002-9122%28198608%2973%3A8%3C1083%3ATASPOS%3E2.0.CO%3B2-M
Stem Growth and Canopy Dynamics in a World-Wide Range of Fagus ForestsRob Peters; Thomas L. PoulsonJournal of Vegetation Science, Vol. 5, No. 3. (Jun., 1994), pp. 421-432.Stable URL:
http://links.jstor.org/sici?sici=1100-9233%28199406%295%3A3%3C421%3ASGACDI%3E2.0.CO%3B2-2
http://www.jstor.org
LINKED CITATIONS- Page 3 of 5 -

The Population Dynamics of a Long-Lived Conifer (Pinus palustris)William J. Platt; Gregory W. Evans; Stephen L. RathbunThe American Naturalist, Vol. 131, No. 4. (Apr., 1988), pp. 491-525.Stable URL:
http://links.jstor.org/sici?sici=0003-0147%28198804%29131%3A4%3C491%3ATPDOAL%3E2.0.CO%3B2-D
Gap Light Regimes Influence Canopy Tree DiversityThomas L. Poulson; William J. PlattEcology, Vol. 70, No. 3. (Jun., 1989), pp. 553-555.Stable URL:
http://links.jstor.org/sici?sici=0012-9658%28198906%2970%3A3%3C553%3AGLRICT%3E2.0.CO%3B2-N
Gap Regeneration in Some Old-growth Forests of the Eastern United StatesJames Reade RunkleEcology, Vol. 62, No. 4. (Aug., 1981), pp. 1041-1051.Stable URL:
http://links.jstor.org/sici?sici=0012-9658%28198108%2962%3A4%3C1041%3AGRISOF%3E2.0.CO%3B2-K
Patterns of Disturbance in Some Old-Growth Mesic Forests of Eastern North AmericaJames Reade RunkleEcology, Vol. 63, No. 5. (Oct., 1982), pp. 1533-1546.Stable URL:
http://links.jstor.org/sici?sici=0012-9658%28198210%2963%3A5%3C1533%3APODISO%3E2.0.CO%3B2-I
Treefalls Revisited: Gap Dynamics in the Southern AppalachiansJames R. Runkle; Todd C. YetterEcology, Vol. 68, No. 2. (Apr., 1987), pp. 417-424.Stable URL:
http://links.jstor.org/sici?sici=0012-9658%28198704%2968%3A2%3C417%3ATRGDIT%3E2.0.CO%3B2-T
Variation of Shoot Morphology and Bifurcation Ratio in Sugar Maple (Acer saccharum)SaplingsDavid A. Steingraeber; Lawrence J. Kascht; Daniel H. FranckAmerican Journal of Botany, Vol. 66, No. 4. (Apr., 1979), pp. 441-445.Stable URL:
http://links.jstor.org/sici?sici=0002-9122%28197904%2966%3A4%3C441%3AVOSMAB%3E2.0.CO%3B2-Z
http://www.jstor.org
LINKED CITATIONS- Page 4 of 5 -

The Composition and Dynamics of a Beech-Maple Climax CommunityArthur B. WilliamsEcological Monographs, Vol. 6, No. 3. (Jul., 1936), pp. 317-408.Stable URL:
http://links.jstor.org/sici?sici=0012-9615%28193607%296%3A3%3C317%3ATCADOA%3E2.0.CO%3B2-I
Crown Asymmetry, Treefalls, and Repeat Disturbance of Broad-Leaved Forest GapsTruman P. Young; Stephen P. HubbellEcology, Vol. 72, No. 4. (Aug., 1991), pp. 1464-1471.Stable URL:
http://links.jstor.org/sici?sici=0012-9658%28199108%2972%3A4%3C1464%3ACATARD%3E2.0.CO%3B2-U
http://www.jstor.org
LINKED CITATIONS- Page 5 of 5 -