
Forces in a Warren Girder - Laboratory Report
10
“Forces in a Warren Girder” Laboratory Class 1 University of Strathclyde Ermand Mani - 25 marzo 2015 LABORATORY CLASS 2 - CL11 TENSION TEST ERMAND MANI
-
Upload
strathclyde -
Category
Documents
-
view
62 -
download
0
Transcript of Forces in a Warren Girder - Laboratory Report

“Forces in a Warren Girder” Laboratory Class 1 University of Strathclyde
Ermand Mani - 25 marzo 2015
LABORATORY CLASS 2 - CL11 TENSION TEST ERMAND MANI

IntroductionThe purpose of this lab is to examine and analyze forces taken in an experiment using a warren girder and comparing them with the theoretical forces calculated with mathematical methods of joints and the method of sections.
The experiment
The pin Jointed Frame experiment allows you to detect the forces that are acting o the members of the structure and determine if the structure could be classified as statical determinate or indeterminate structure.
We are using a Warren Girder structure controlled by an electronic load cell used to apply forces in the members of the structure,and the sensors, called strain gauges, will determine the load applied and the results are shown on the digital force apparatus used during the experiment. The sensors also, collect information in order to measure the forces in the members and determine the compression or the tensile forces in each member. Therefore, when the member stretches or compresses, the strain gauge stretches or compresses the same amount.
The digital strain results are given in micro strain (x10 ). Using te strain, the area where the force is applied and the elastic (Young’s) modulus of each member, we can convert the strains into each member forces.
LABORATORY CLASS 2 - CL11 TENSION TEST ERMAND MANI

Experimental procedure 1. Make sure apparatus is set properly.
2. Annotate in the appropriate table 2, the number of each member.
3. Annotate in the appropriate table 1, the diameter of each member measured using the micrometer gauge.
4. Carefully apply a load of 100N (in the direction of loading) and zero the load cell. After a load of 500N is applied, carefully check that the frame is stable and secure. Return the load to zero and carefully zero the load cell again (this may take a few tries as the indicator is very sensitive). Zero the digital dial gauge, which measures the deflection of one of the joints.
5. Carefully apply loads in 100N increments and record the strain in each member in the appropriate table and the deflection of the joints.
6. Return the load to zero. The experiment is now complete.
LABORATORY CLASS 2 - CL11 TENSION TEST ERMAND MANI
Fig. 4. Digital Load Force Display
Fig. 3 Experimental Warren girder apparatus

LABORATORY CLASS 2 - CL11 TENSION TEST ERMAND MANI

Analysis of Results 1. Subtract the zero readings from the measured strains in order to
determine the true strains. Record these values in Table 3.
2. Calculate the equivalent member forces at 450N and record the values in Table 4 (experimental force). You will need the information below: To get the elastic modulus you need to calculate the stress over the strain:
E= σ/ε
where E represents the elastic modulus (N/m2); σ represents stress in
the member (N/m2) and ε represents the true strain in the member.
Note to obtain the cross sectional area of each member, se the measured diameter
The elastic modulus for steel E = 210 GN/m2.
****See the attached calculations sheet for the complete calculations.****
LABORATORY CLASS 2 - CL11 TENSION TEST ERMAND MANI

3. Select one compression member (strut) and one tension member (tie) and plot the graph of the strain and the loads and comment on your graph. Members choosen from Table 3 are member 2(T) and 7(C).
LABORATORY CLASS 2 - CL11 TENSION TEST ERMAND MANI
Comment
As we can see from the graph, as the load increases the true strain in the member which is in tension, tends to increase drastically especially between load of 200N and load 300N. If we continue to increase the load, we see the same member tends to obtain a continual increase. In a different way, goes the true strain of member in compression. Therefore the strain, in member in compression increases directly with the load increase.
Graph - load against strain
True
stra
in v
alue
s (µ
)
0
45
90
135
180
Load (N)0 100 200 300 400 450
Member 2 Member 7

4. We can get the theoretical force at each member using the method of joint. **** See calculations sheet for further and complete calculations. ****
LABORATORY CLASS 2 - CL11 TENSION TEST ERMAND MANI
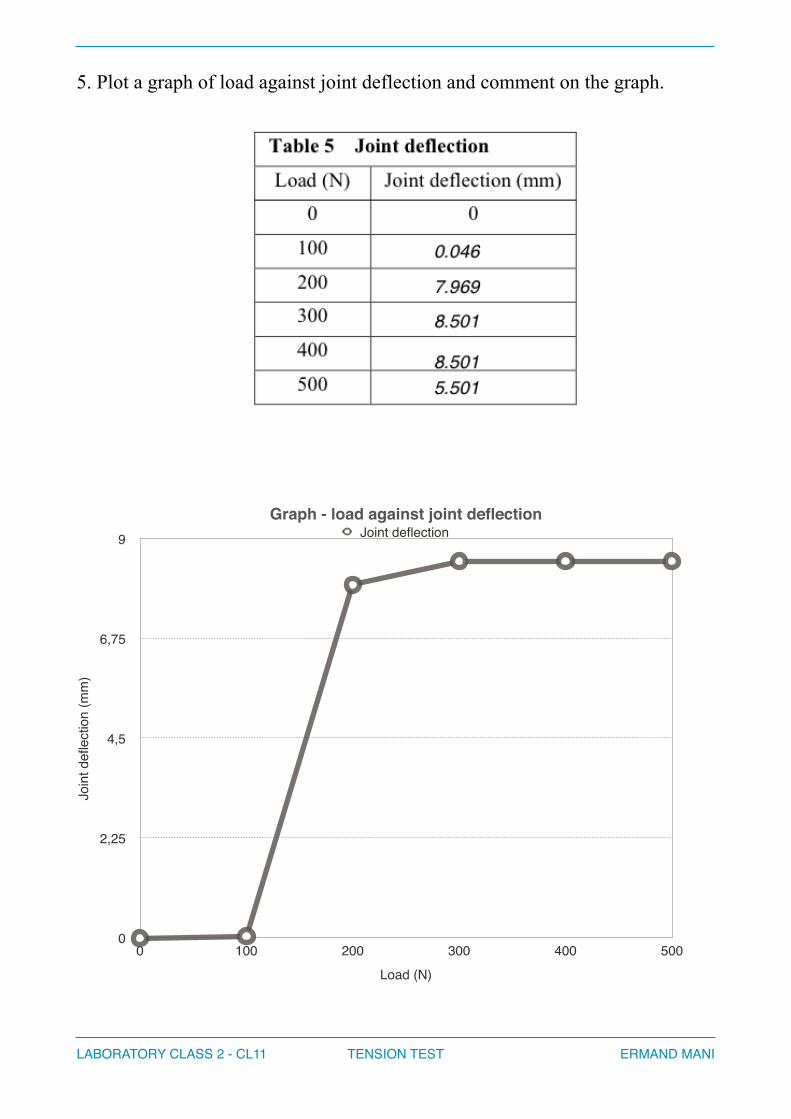
5. Plot a graph of load against joint deflection and comment on the graph.
Discussion
LABORATORY CLASS 2 - CL11 TENSION TEST ERMAND MANI
Graph - load against joint deflection
Join
t defl
ectio
n (m
m)
0
2,25
4,5
6,75
9
Load (N)0 100 200 300 400 500
Joint deflection

Discussion
If we look at the table 4, the values for the experimental force are different with the values theoretical value. It was because the device was not working properly. as the instrument could go up to 500 as requested from the lab handout. Secondly, it maybe from environment in the lab. The device were probably sensitive with vibration due to the pressure test there were also due, during this experiment. But the member N. 7 is almost same with theoretical force.
There are positive and negative forces with tensile and compression condition at all member. The structure can fail if the load effect exceeds from the stable condition of the structure. The best result to keep the structure stable, is not overload the structure and keep it less then the structure ability can hold, in order to be stable and safe in a real life condition.
LABORATORY CLASS 2 - CL11 TENSION TEST ERMAND MANI
Comment
As we can see from the graph, the deformation remains close to 0 even though, a force of 100N is applied. The deformation is drastically increased from 200N to 300N where there is a difference of 7.923mm and then remains unchanged in increasing respectively the strength of 100N until 450N. It is important do underline the fact that this graph is similar to the graph of loads against strain in Table 3.

Conclusion
During the experiment, it has been used different load values from 0N till 450N to determine the different results from the warren girder structure. We need to take in consideration the fact that the instrument used could go up to 500 as requested and we took 450N instead, as the maximum load. Only calculations done mathematically can determine the stability of the structure. Some mistake are made when reading the values, because it is impossibile to keep the instrument in good condition due different factors: the age of the instrument, the environment around it. If the instrument are not set perfectly, it will be impossible and very dangerous for an engineer to build a real-life structure with an old and not perfectly set experimental instrument. There will be a small percentage to accept in order to carry on to validating the results given from the experiment, but we need to prevent the situation where the structure is not affected from the wrong experimental results of the forces and taking in consideration the mathematically made calculations.
For this purpose it is important to keep the equipment at the highest maintenance and used it by a trained member of staff in order to give to the students correct values to work with.
LABORATORY CLASS 2 - CL11 TENSION TEST ERMAND MANI