The P-wave velocity structure of the mantle below the Iberian Peninsula: evidence for subducted...
22
Tectonophysics, 221 (1993) 13-34 Elsevier Science Publishers B.V., Amsterdam 13 The P-wave velocity structure of the mantle below the Iberian Peninsula: evidence for subducted lithosphere below southern Spain Maria JosC Blanc0 a and Wim Spakman b a Departamento de Geofuica, Uniuersidad Complutense de Madrid, Spain b Department of Geophysics, University of Utrecht, The Netherlands (Received March 13, 1991; revised version accepted September 16, 1991) ABSTRACT Blanco, M.J. and Spakman, W., 1993. The P-wave velocity structure of the mantle below the Iberian Peninsula: evidence for subducted lithosphere below southern Spain. In: J. Badal, J. Gallart and H. Paulssen (Editors), Seismic Studies of the Iberian Peninsula. Tectonophysics, 221: 13-34. The P-wave velocity structure of the mantle below the Iberian Peninsula is investigated with the method of delay-time tomography. More than 200,000 delay-times are inverted for simultaneous estimates of P-wave velocity anomalies, event mislocation and origin time errors, and station corrections. Below the Betic-Alboran area we find a positive anomaly between 200 and 700 km depth which in shape and amplitude resembles the image of a subducted lithosphere slab. Laterally this anomaly exhibits a clear SW-NE trend. In view of the low level of spatial resolution encountered we focus in our analysis on assessing the reliability of the slab-like image. Arguments in favor of the existence of a slab structure in the upper mantle are developed from inversions of subsets of the data. The resolving power for imaging a slab below the Betic-Alboran region is investigated using sensitivity analyses with a velocity model for a subducted slab. We conclude that a slab-structure exists in the mantle below the Betic and Alboran region and that it can be imaged with sufficient reliability. We interpret the anomaly as the image of subducted lithosphere. The slab is presumably detached from the surface. We propose that subduction took place during at least part of the Oligocene followed by slab detachment in the early Miocene. Introduction Most of the seismological studies of the Iberian Peninsula (Fig. 1) have resulted in information about the crust and the lithosphere-astheno- sphere system (e.g., Payo, 1970, 1972; Banda et al., 1980, 1981, 1983; Panza et al., 1980; Marillier and Mueller, 1985; Snieder, 1988; Badal et al., 1990; Paulssen and Visser, 1993-this issue). Some insight in the structure of the deeper mantle is obtained from seismic tomography studies (Spak- man, 1986, 1990, 1991; Granet and Trampert, 1989; Nolet, 1990). The tomographic results ob- Correspondence to: Dr. M.J. Blanco, Instituto Geografico Na- cional, Avd. Anaga, 35; planta 11, 38001 Santa Cruz de Tenerife, Tenerife, Spain. Fax: 34 22 243017. tained below the Iberian Peninsula have only a limited resolution for structural detail, i.e., detail on the scale of 200-300 km or less seems poorly resolved, which hampers the interpretation of the mantle images in terms of mantle processes. Still, it is in the mantle where we may find important leads for studying the large scale evolution of the Iberian Peninsula. For instance, evidence for ac- tive deep mantle processes is given by the pecu- liar deep seismicity at about 640 km (e.g., Buforn et al., 1991). For lack of alternatives, the cause of these events is generally ascribed to the dynamics of a detached piece of cold lithosphere (e.g., Chung and Kanamori, 1976). It is called detached because there is no mantle seismicity between a depth of about 150 km and the depth of the deep events. A different indication that a subducted slab exists below Iberia was found in a tomo- 0040-1951/93/$06.00 0 1993 - Elsevier Science Publishers B.V. All rights reserved
-
Upload
independent -
Category
Documents
-
view
1 -
download
0
Transcript of The P-wave velocity structure of the mantle below the Iberian Peninsula: evidence for subducted...

Tectonophysics, 221 (1993) 13-34
Elsevier Science Publishers B.V., Amsterdam
13
The P-wave velocity structure of the mantle below the Iberian Peninsula: evidence for subducted lithosphere
below southern Spain
Maria JosC Blanc0 a and Wim Spakman b
a Departamento de Geofuica, Uniuersidad Complutense de Madrid, Spain b Department of Geophysics, University of Utrecht, The Netherlands
(Received March 13, 1991; revised version accepted September 16, 1991)
ABSTRACT
Blanco, M.J. and Spakman, W., 1993. The P-wave velocity structure of the mantle below the Iberian Peninsula: evidence for subducted lithosphere below southern Spain. In: J. Badal, J. Gallart and H. Paulssen (Editors), Seismic Studies of the Iberian Peninsula. Tectonophysics, 221: 13-34.
The P-wave velocity structure of the mantle below the Iberian Peninsula is investigated with the method of delay-time tomography. More than 200,000 delay-times are inverted for simultaneous estimates of P-wave velocity anomalies, event mislocation and origin time errors, and station corrections. Below the Betic-Alboran area we find a positive anomaly between 200 and 700 km depth which in shape and amplitude resembles the image of a subducted lithosphere slab. Laterally this anomaly exhibits a clear SW-NE trend. In view of the low level of spatial resolution encountered we focus in our analysis on assessing the reliability of the slab-like image. Arguments in favor of the existence of a slab structure in the upper mantle are developed from inversions of subsets of the data. The resolving power for imaging a slab below the Betic-Alboran region is investigated using sensitivity analyses with a velocity model for a subducted slab. We conclude that a slab-structure exists in the mantle below the Betic and Alboran region and that it can be imaged with sufficient reliability. We interpret the anomaly as the image of subducted lithosphere. The slab is presumably detached from the surface. We propose that subduction took place during at least part of the Oligocene followed by slab detachment in the early Miocene.
Introduction
Most of the seismological studies of the Iberian Peninsula (Fig. 1) have resulted in information about the crust and the lithosphere-astheno- sphere system (e.g., Payo, 1970, 1972; Banda et al., 1980, 1981, 1983; Panza et al., 1980; Marillier and Mueller, 1985; Snieder, 1988; Badal et al., 1990; Paulssen and Visser, 1993-this issue). Some insight in the structure of the deeper mantle is obtained from seismic tomography studies (Spak- man, 1986, 1990, 1991; Granet and Trampert, 1989; Nolet, 1990). The tomographic results ob-
Correspondence to: Dr. M.J. Blanco, Instituto Geografico Na- cional, Avd. Anaga, 35; planta 11, 38001 Santa Cruz de Tenerife, Tenerife, Spain. Fax: 34 22 243017.
tained below the Iberian Peninsula have only a limited resolution for structural detail, i.e., detail on the scale of 200-300 km or less seems poorly resolved, which hampers the interpretation of the mantle images in terms of mantle processes. Still, it is in the mantle where we may find important leads for studying the large scale evolution of the Iberian Peninsula. For instance, evidence for ac- tive deep mantle processes is given by the pecu- liar deep seismicity at about 640 km (e.g., Buforn et al., 1991). For lack of alternatives, the cause of these events is generally ascribed to the dynamics of a detached piece of cold lithosphere (e.g., Chung and Kanamori, 1976). It is called detached because there is no mantle seismicity between a depth of about 150 km and the depth of the deep events. A different indication that a subducted slab exists below Iberia was found in a tomo-
0040-1951/93/$06.00 0 1993 - Elsevier Science Publishers B.V. All rights reserved

14
graphic study by Spakman (1990). The slab-image obtained is, however, of questionable accuracy due to poor sampling of the Iberian mantle by the ray path data used, and also because the eastern part of the Iberian Peninsula was located near the edge of the investigated area. These results and the puzzling dynamics in the deeper mantle motivated us to perform a more detailed tomographic investigation of the P velocity struc- ture of the mantle below the Iberian Peninsula, using data from both regional and teleseismic events. Specifically, we are interested in locating the mantle structure which is related to the deep seismicity.
Data selection and delay-time tomography
We apply the method of delay-time tomogra- phy developed by Spakman and Nolet (1988) and Spakman (1988, 1991) to study the P-wave veloc- ity structure of the mantle beneath the Iberian Peninsula. P delay-time data were selected from the ISC bulletin tapes (years 1964-19861, but only from events that are recorded regionally or glob-
M.J. BLANC0 AND W. SPAKMAN
ally by at least 10 seismological stations. Regional
events contributed data from stations up to 90” of epicentral distance, i.e., from both regional and distant stations. For distant events, i.e., with epi- centers outside the boundaries of the region of interest (Fig. 11, we only selected the delay-times observed in the regional stations. Over 200,000 delay-times were selected within these limits. No- tice that we combine data from regional and teleseismic events in our analysis.
The celf model employed to parameterize the slowness field of the mantle consists of 1” X 1”
cells arranged in 20 layers to a depth of 1420 km. Each layer consists of 18 X 18 cells. The thickness of the cells increases gradually with depth from 33 km for the crust and lithosphere to 100 km in the lower mantle to a depth of 1420 km (see Table 1).
The delay-times are inverted for simultaneous estimates of (1) cell slowness anomalies, (2) event mislocation and origin time errors, and (3) station delay-time corrections. For teleseismic events, only one time correction is computed instead of all four event parameters. We remark that the
Fig. 1. The lberian Peninsula and surrounding regions. Below the area displayed, the mantle velocity structure is investigated down
to a depth of 1420 km. The epicenters displayed in the Left panel belong to the local subset of the earthquakes used in this study.
The panel to the right shows the location of regional stations from which data are used. Note that also delay-time data are used
from events and stations located outside the region displayed. Solid lines within the Iberian Peninsula delineate major tectonic
units.

P-WAVE VELOCITY STRUCTURE OF THE MANTLE: EVIDENCE FOR SUBDUCTED LITHOSPHERE BELOW S SPAIN 15
TABLE I
Cell layer division and average velocity of model PM2
km km km/s
0 33 6.228 33 70 7,853 70 120 8.028
120 170 8.117
170 220 8.109
220 27.5 8.176
275 330 8.414
330 390 8.732
390 460 9.319
460 530 9.710
530 600 9.941
600 670 10.151
670 740 10.899
740 820 11.016
820 920 11.183 920 1020 11.360
1020 1120 Il.535
1120 1220 11.686
1220 1320 11.841
1320 1420 11.988
event parameters pertain to clusters of events and are, hence, average estimates for the misloca- tion and origin time error of a number of events near to each other (see Spakman and Nolet, 1988, for this approach). In our case, we discrimi- nate between regional and teleseismic event clus- ters. Regional event clusters are defined as all events in cells of a size of 0.5” X 0.5” X 35 km, where “regional” is used here to denote all events within 30” of distance to the center of the Iberian Peninsula. To define teleseismic event clusters, we used larger cells of a size of 2.5” x 2.5” x 100 km. Of course, these cells stand in no relation to the cell model used for tomography; they are merely used to identify event clusters. In the inversion the only distinction between regional and teleseismic events lies in the number of un- knowns to parameterize the event mislocation (see also Spakman and Nolet, 1988, and Spak- man, 1991, for how we combine event parameters and velocity heterogeneity in a tomographic in- version).
Because we invert for event and station pa- rameters, there is no need to correct the data prior to inversion with, e.g., the average event delays and/or the average station delays. Hence,
we work with the actual ISC delay-times and not with so-called relative residuals. Only one correc- tion of the data is necessarily applied prior to inversion and is related to the particular choice of the reference velocity model. The reference model is used in tomography to linearize the model equations, and for the computation of the ray path geometry, and the relocation and station correction coefficients (e.g., Spakman, 1991). The accuracy of the reference model, in the sense of approximating the laterally averaged Earth struc- ture, is of utmost importance for the reliability of the tomographic results (Van der Hilst and Spak- man, 1989; Zielhuis et al., 1989). The approach developed by the latter authors was used by Spakman et al. (1991) to derive-from 2.1 million ISC delays-a reference model, called PM2 (Fig. 21, valid for P delay-time tomography of the Eu-
P-velocity (km/s) 6 7 8 9 10 11 12
Fig. 2. Radial P-velocity models: Jeffrey+Bullen (JB) velocity and PM2. The latter model is determined by Spakman et al. (1991) and serves as a better reference model for delay-time tomography of the European-Mediterranean mantle includ-
ing the mantle below Iberian Peninsula. See aiso Table 1.

16 M.J. BLANC0 AND W. SPAKMAN
ropean-Mediterranean mantle including the mantle below the Iberian Peninsula. In our study we will use model PM2 Since the ISC data have
been computed using the Jeffreys-Bullen travel time tables, we have to correct the data prior to inversion for the difference in travel-time com- puted from model PM2 and the Jeffreys-Bullen tables. To compute this correction we still use the ISC event location, because any mislocation of the (ISO events in the PM2 model can be ac- counted for by the event parameters included in the inversion (Van der Hilst, 1990). A density-plot of the corrected data as a function of epicentral distance and delay-time value is shown in Figure 3. The data are more or less evenly distributed about the line of zero delay which corresponds to the predicted reference travel time in model PM2.
and Saunders (19821, introduced in seismic to- mography by Nolet (1985). We follow the inver- sion procedure as described by Spakman and Nolet (1988). The inversions are slightly damped only to make sure that the smallest eigenvalues of the problem do not have large effect on the solution, and lateral smoothing of cell slowness amplitudes is applied during inversion. In addi- tion to delay-time inversions, we also performed sensitivity analyses with a number of synthetic velocity models. The synthetic tests are carried out to obtain estimates of accuracy and spatial resolution.
Inversion results
The inversion of the tomographic equations is performed with the LSQR algorithm of Paige
The first inversion we perform is of all the delay-time data with values between -3 and +3 s. We take these delay-time limits to exclude data
delay ti~~s:96000 1 128
Fig. 3. Density-plot of delay-time value vs. epicentral distance. Delay-time counts are made in “boxes” of 0.1 s by 0.5”. The contouring is logarithmic. The delay-time data are computed relative to model PM2. The line of zero delay corresponds to the
reference travel time in model PM2. Only data between - 3 and + 3 s (lines) are used in this study.
P-WAVE VELOCITY STRUCTURE OF THE MANTLE: EVIDENCE FOR SUBDUCI-ED LITHOSPHERE BELOW S SPAIN 17
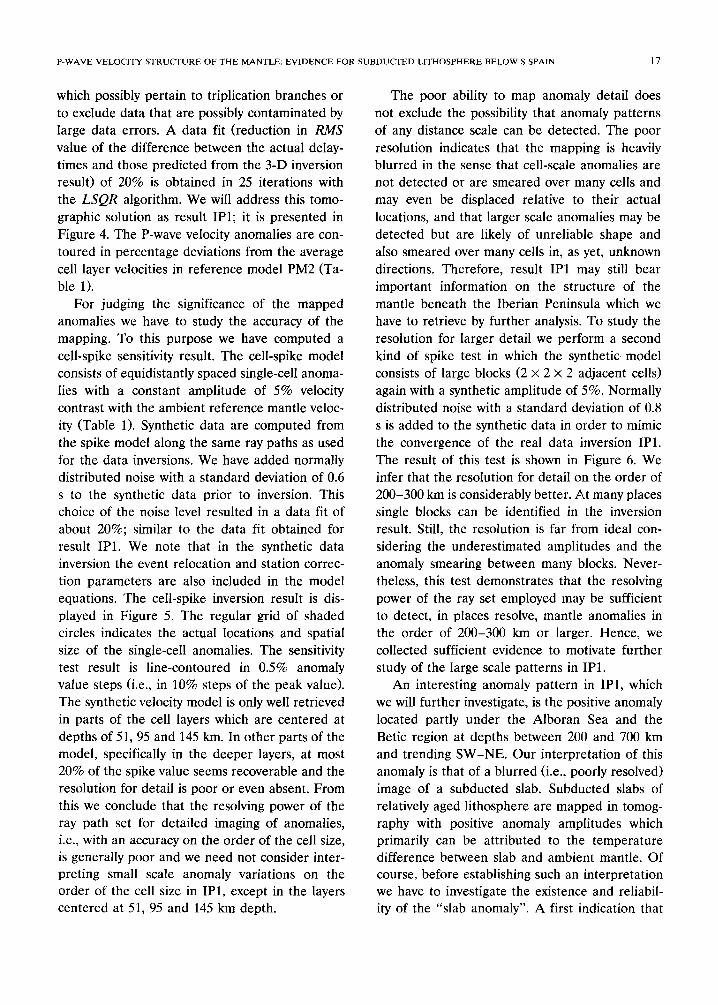
which possibly pertain to triplication branches or to exclude data that are possibly contaminated by large data errors. A data fit (reduction in Rit4S value of the difference between the actual delay- times and those predicted from the 3-D inversion result) of 20% is obtained in 25 iterations with the LSQR algorithm. We will address this tomo- graphic solution as result IPl; it is presented in Figure 4. The P-wave velocity anomalies are con- toured in percentage deviations from the average cell layer velocities in reference model PM2 (Ta- ble 1).
For judging the significance of the mapped anomalies we have to study the accuracy of the mapping. To this purpose we have computed a cell-spike sensitivity result. The cell-spike model consists of equidistantly spaced single-cell anoma- lies with a constant amplitude of 5% velocity contrast with the ambient reference mantle veloc- ity (Table 1). Synthetic data are computed from the spike model along the same ray paths as used for the data inversions. We have added normally distributed noise with a standard deviation of 0.6 s to the synthetic data prior to inversion. This choice of the noise level resulted in a data fit of about 20%; similar to the data fit obtained for result IPl. We note that in the synthetic data inversion the event relocation and station correc- tion parameters are also included in the model equations. The cell-spike inversion result is dis- played in Figure 5. The regular grid of shaded circles indicates the actual locations and spatial size of the single-cell anomalies. The sensitivity test result is line-contoured in 0.5% anomaly value steps (i.e., in 10% steps of the peak value). The synthetic velocity model is only well retrieved in parts of the cell layers which are centered at depths of 51,95 and 145 km. In other parts of the model, specifically in the deeper layers, at most 20% of the spike value seems recoverable and the resolution for detail is poor or even absent. From this we conclude that the resolving power of the ray path set for detailed imaging of anomalies, i.e., with an accuracy on the order of the cell size, is generally poor and we need not consider inter- preting small scale anomaly variations on the order of the cell size in IPl, except in the layers centered at 51, 95 and 145 km depth.
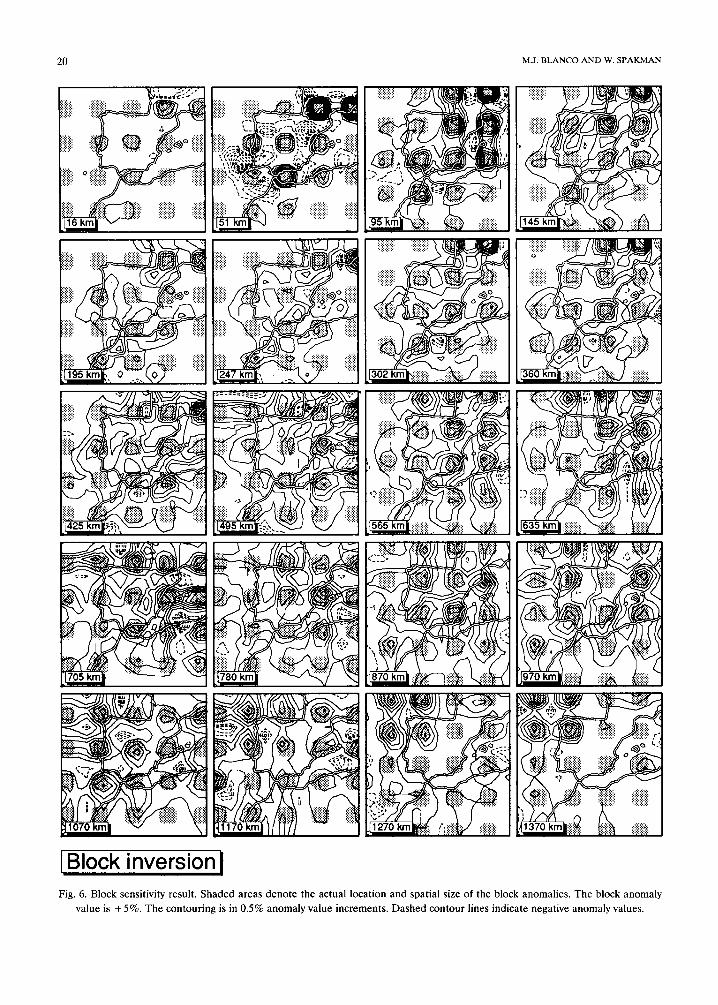
The poor ability to map anomaly detail does not exclude the possibility that anomaly patterns of any distance scale can be detected. The poor resolution indicates that the mapping is heavily blurred in the sense that cell-scale anomalies are not detected or are smeared over many cells and may even be displaced relative to their actual locations, and that larger scale anomalies may be detected but are likely of unreliable shape and also smeared over many cells in, as yet, unknown directions, Therefore, result IPl may still bear important information on the structure of the mantle beneath the Iberian Peninsula which we have to retrieve by further analysis. To study the resolution for larger detail we perform a second kind of spike test in which the synthetic model consists of large blocks (2 x 2 x 2 adjacent cells) again with a synthetic amplitude of 5%. Normally distributed noise with a standard deviation of 0.8 s is added to the synthetic data in order to mimic the convergence of the real data inversion IPl. The result of this test is shown in Figure 6. We infer that the resolution for detail on the order of 200-300 km is considerably better. At many places single blocks can be identified in the inversion result. Still, the resolution is far from ideal con- sidering the underestimated amplitudes and the anomaly smearing between many blocks. Never- theless, this test demonstrates that the resolving power of the ray set employed may be sufficient to detect, in places resolve, mantle anomalies in the order of 200-300 km or larger. Hence, we collected sufficient evidence to motivate further study of the large scale patterns in IPl.
An interesting anomaly pattern in IPl, which we will further investigate, is the positive anomaly located partly under the Alboran Sea and the Betic region at depths between 200 and 700 km and trending SW-NE. Our interpretation of this anomaly is that of a blurred (i.e., poorly resolved) image of a subducted slab. Subducted slabs of relatively aged lithosphere are mapped in tomog- raphy with positive anomaly amplitudes which primarily can be attributed to the temperature difference between slab and ambient mantle. Of course, before establishing such an interpretation we have to investigate the existence and reliabil- ity of the “slab anomaly”. A first indication that

M.J. BLANC0 AND W. SPAKMAN
1 Data inversion: IPI 1 -2.0% +2*0%
Fig. 4. Tomographic result IPl: velocity anomalies relative to model PM2. Numbers indicate the depth at the center of a cell-layer.

P-WAVE VELOCITY STRUCTURE OF THE MANTLE: EVIDENCE FOR SUBDUCTED LI-lXOSPHERE BtLOW S SPAIN 19
lSpike inversion: IPlJ Fig. 5. Spike sensltwlty result. Grey spots denote the actual location of the cell-spikes. The spike anomaly value is -i-5%. The
contouring is in 0.5% anomaly value increments. Dashed contour lines indicate negative anomaly values.
20 M.J. BLANC0 AND W. SPAKMAN
Block inversion 1
Fig. 6. Block sensitivity result. Shaded areas denote the actual location and spatial size of the block anomalies. The block anomaly
value is + 5%. The contouring is in 0.5% anomaly value increments. Dashed contour lines indicate negative anomaly values.

P-WAVE VELOCITY STRUCTURE OF THE MANTLE: EVIDENCE FOR SUBDUCTED LITHOSPHERE BELOW S SPAIN 21
the resolution may be sufficient to map a sub- ducted slab below the Betic-Alboran region stems from the block inversion result. In Figure 7 we display two cross-sections through the block model which demonstrate that single blocks are reasonably resolved in depth and that not much anomaly smearing occurs across the 670 km boundary between upper and lower mantle. On itself this may be taken as sufficient indication that the “slab anomaly” is a resolvable, at least detectable, feature. However, since the sensitivi~ tests only give an indication about the resolving power of the ray set employed and not of the actual delay-time data (and actual ray paths) it is interesting to try to derive the existence of this anomaly (i.e., existence below the Betic-Alboran region and in the upper mantle) from the actual data. Furthermore, it is interesting to design a sensitivity test with a synthetic slab model to
200
demonstrate explicitly to what extent a subducted slab can be resolved with our reference-model ray set. A similar test has been used by Spakman et al. (1989) to study the resolution for subducting slabs in the NW Pacific. To these purposes we will try to answer the following two questions: (1) is the “slab anomaly” a mapping of heterogeneity located in the upper mantle below the Betic and Alboran Sea’?, and (2) can a subducted slab lo- cated in the upper mantle below the Betic and Alboran Sea be imaged with sufficient reliability?
Locating the “slab anomaly”
To answer the first question, we performed additional inversions with two different data sets. The first data set is restricted to teleseismic data (48-90”) and is thus confined to combinations of either regional stations and distant events or re-
Fig. 7. Two cross-sections through the block sensitivity result of Figure 6. Shaded areas denote the actual location and spatial size of the block anomalies. The block anomaly value is + 5%. The contouring is in 0.25% anomaly value increments. Dashed contour
lines indicate negative anomaly values.

M.J. BLANC0 AND W. SPAKMAN
[Data inversion: IP2 1 -2.0% +2.0% Fig. 8. Tomographic result IP2 determined from inverting the delay times from regional station and distant event combinations with
epicentral distances between 48 and 90” (“teleseismic data”).
P-WAVE. VELOCITY STRUCTURE OF THE MANTLE: EVIDENCE FOR SUBIXJCTED LITHOSPHERE BELOW S SPAIN 23
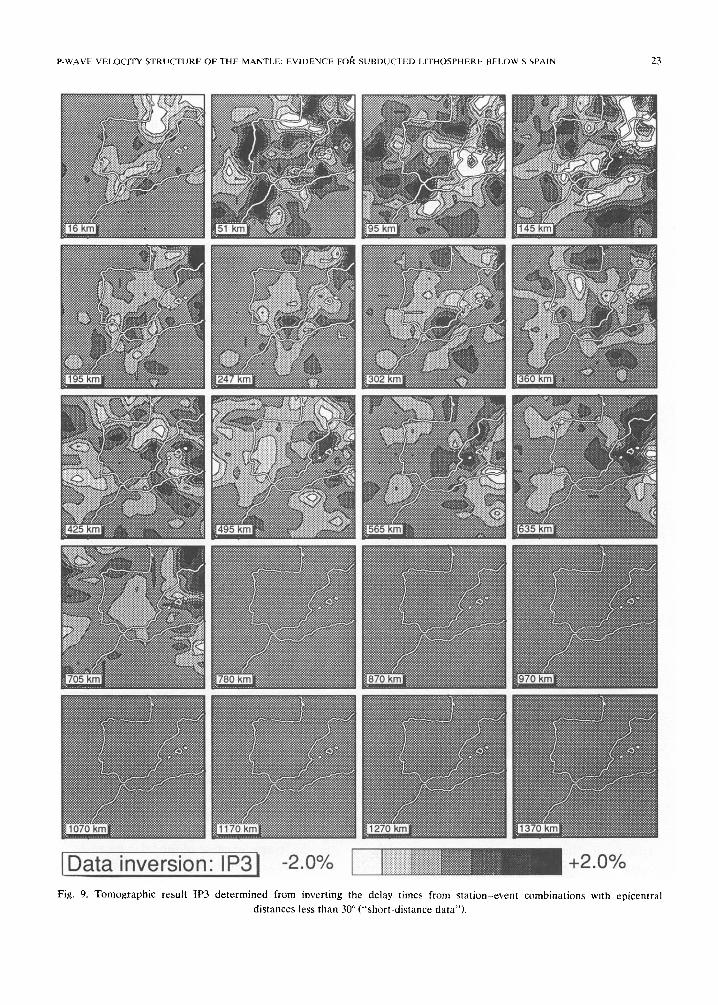
(Data inversion: IP31 -2.0% Fig. 9. Tomographic resutt IP3 determined from inverting the delay times from station-event combinations with epicentral
distances less than 30” (“short-distance data”).

24 M.J. BLANC0 AND W. SPAKMAN
gional events and distant stations. The ray paths pertaining to this data set sample the upper man- tle of the source (station) region, the lower man- tle between source (station) region and the cell model, and the rays enter (leave) the cell model in its lower mantle extension. The inversion result is called IP2 and is displayed in Figure 8. The second data set consists of the data from station-event combinations with epicentral dis- tance smaller than 30”. The ray paths belonging to these delay-time data sample the upper 750 km of the mantle in and outside the cell model. The inversion result will be addressed as result IP3 and is shown in Figure 9. Except for the upper mantle volume within the cell model, the two ray paths sets sample different mantle re- gions. The data gap of 30-48” ensures this (the gap of 18” corresponds to the lateral dimensions of the cell model). We will use the characteristics of the ray sets to demonstrate that the “slab anomaly” has an origin in the upper mantle.
We remark that the resolving power of the data sets used to compute IPl, IP2, and IP3 is different. From sensitivity analyses with cell- spikes similar to that shown for IPl in Figure 5 we have inferred that the IP2 result is slightly better resolved in the lower mantle than IPl and poorer in the upper mantle, and that IP3 is slightly better resolved in the upper part of the upper mantle and poorer in the lower part of the upper mantle. The resolution of IPl can be seen as a combination of these results; the resolution is slightly impaired in the uppermost mantle and the lower mantle, but slightly improved in the central part of the cell model. However, differ- ences in resolution are small.
In both results IP2 and IP3 we find a positive anomaly below the Betic and Alboran Sea. The “slab anomalies” in IPl and IP2 compare best. In IP3 the anomaly has a somewhat different shape but is still detected. Let us consider the “slab anomaly” in some detail. In Figure 10 we have plotted 2 cross-sections through the core of the anomaly for inversion result IPl, IP2, and IP3. One section (left) is taken perpendicular to the apparent strike direction of the anomaly. The other section runs parallel to the strike. The “slab anomaly” in results IPl and IP2 is rather
similar. In IP3 the anomaly has an irregular shape and consists of two parts which, as we will discuss below, is due to lack of resolving power of the
IP3 data set in the lower part of the upper mantle.
In general, we find that mapped anomaly pat- terns exhibit somewhat elongated shapes. This apparent elongation is a result of poor resolution which causes smearing of anomalies in the main directions of ray sampling. This can be exempli- fied by studying the cell hit-count (Fig. 11). The cell hit-count is the number of rays sampling a particular cell. The three-dimensional variation in the ray sampling influences the inversion result strongly (see Spakman and Nolet, 1988; Spak- man, 1988). The main directions of ray-illumina- tion can be inferred from the main trends in the hit count and these are in-line with the direction of apparent elongation of the anomalies. One could demonstrate these trends explicitly by com- puting the ray density tensor GCissling, 1988) which contains all directional information. For our purposes the hit-count variation as displayed in Figure 11 suffices. Specifically, we can use this information to explain why the “slab anomaly” in IP3 deviates from that in IP2. Since IP3 is con- structed from short distance data only, the ray paths sample the upper mantle at relative shallow angles (see hit-count pattern). The “slab anomaly” is smeared along these shallow angle directions, quite opposite to the smearing in IP2. Further- more, the lower part of the “slab anomaly” is poorly illuminated by rays (low hit-count) which affects the resolution even more, i.e., in negative sense. These inferences are examples of the gen- eral statement we made in the previous section with regard to the poor resolution.
The rays from which IP2 is constructed enter the cell model in the lower mantle. The rays from which IP3 is constructed only sample the upper mantle. The cross-sectional volume of both ray- sets is the upper mantle inside the cell model. As the “slab anomaly” is present in both results IP2 and IP3, we have found an important indication that the structural cause of the “slab anomaly” is at least located in the upper mantle of the cell model, a lower mantle extension is not excluded. But, one could ask: could the slab anomaly be a

P-WAVh VELOCI’I’Y STRUCTURE OF THE MANTLE: EVIDENCE FOR SUBDUCTED LITHOSPHERk2 BEl,OW S SPAIN 2s
400
g 600 c g 800
foO0
1200
200
400
5 600 r g 800
1000
1200
200
400
g 600
800
1000
1200
0 500 1000 1500 2000 0 500 1000 1500 2000
Fig. 10. Two cross-sections through the tomographic results IPl, 1P2, and IP3. The horizontal straight line in the map at the top of
each column of panels indicates the exact location of the section. The cross-section to the left is taken perpendicular to the
apparent strike of the slab anomaly. The other section runs along strike of the anomaly. Dots in the maps and cross-sections
indicate the locations of earthquakes. Notice the deep event at 640 km near the center of the cross sections.

M.J. BLANC0 AND W. SPAKMAN
0 500 1000 1500 2000
200
400
g 600 z B 800
1000
1200
200
400
E 600
f 0 800 D
1000
1200
Fig. 11. The cell hit-count for the same sections as in Figure 10. The contouring scale is logarithmic, i.e. 4 corresponds to a
hit-count of 10,000 rays. Note that the cell hit-count displayed for the sections is computed from the three-dimensional
ray-sampling of the cells. For reference we plotted the contours of the positive anomalies of Figure 10 with thick lines.

P-WAVE VELOCITY STRUCTURE OF THE MANTLE: EVIDENCE FOR SUBDUCTED Ll’fHOSI’HERt BELOW S SPAIN 27
mapping of velocity structures outside the cell
model or could it be a projection of station delay-time averages into cell anomalies, all due to poor resolution. Our answer is that this is not very likely. Recall that we also estimate in the inversions the station delay-time corrections and event mislocation parameters for all stations and events. For those stations and events outside the cell model these model parameters also absorb, in a way, the effects of mantle heterogeneity between the cell model and station location, and between the cell model and event, respectively (Spakman and Nolet, 19881. This considerably reduces the likelyhood that the “‘slab anomaly” is an erroneous mapping of velocity structure actu- ally located outside the cell model or a projection of station averages on to the slowness cells. Moreover, any artifacts related to velocity struc- tures located outside the cell model would rather be confined to those cells which are located in the vicinity of the edge of the cell model instead of creating a large amplitude anomaly in the upper central part of the cell model.
The average station delays for stations in the Betic and along the eastern margin of Spain are invariably positive (Fig. 12) indicating that nega- tive velocity anomalies would be expected be- neath the stations (if the station residuals can be related to velocity heterogeneity in the first place), and that an erroneous mapping of the station delay into celI-anomalies will not result into an anomaly with a positive amplitude but into one with a negative amplitude.
The arguments put forward above strongly support the existence of a high-velocity body in the upper mantle below southern Spain.
Synthetic slab tests
In order to tackle the resolution problem from a different angle let us consider the second ques- tion: if a subducted slab exists in the upper man- tle below the Betic and Alboran Sea, can it be imaged with sufficient reliability using our data set? We investigate this with sensitivity analysis using synthetic slab models.
We constructed a synthetic velocity anomaly model of a subducting slab that resembles the
Fig. 12. Average station-delays for regional stations with more
than 20 observations. The stations are located at the center of
the symbols plotted. The size of the symbols is proportional to
the station-delay (see key). The station-delays are computed
from delay times relative to model PM?.
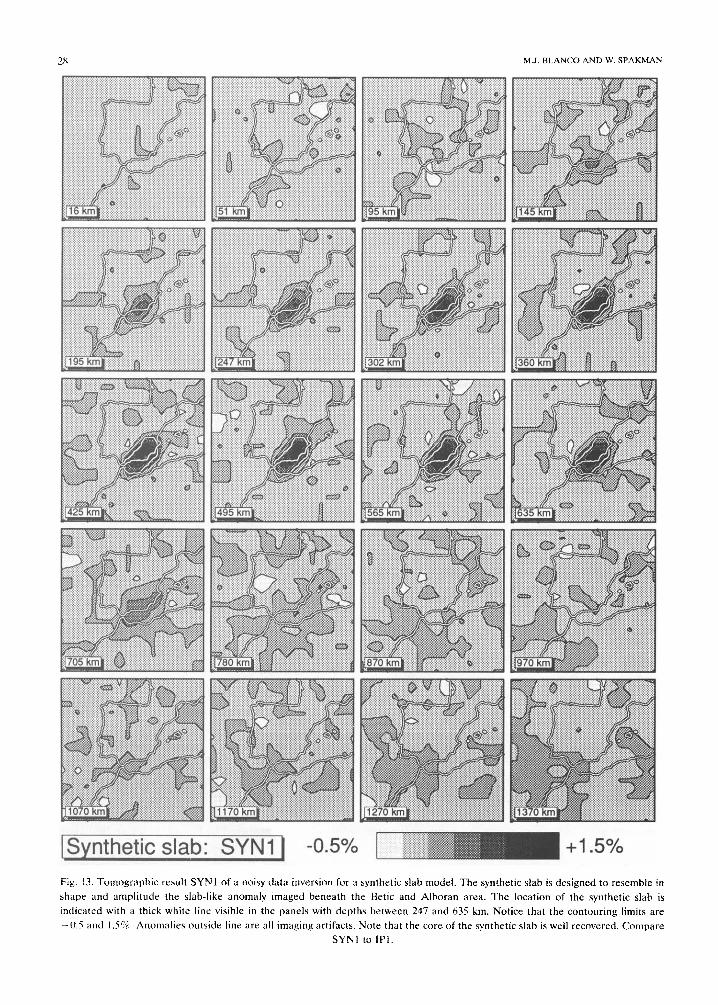
shape and amplitude (2% in the core and tapered to 0% at the edge) of the anomaly mapped in IPl. The spatial outlines of the synthetic model are displayed in Figures 13 and 14. Synthetic delay-times are computed from this model using the actual ray paths. We performed an inversion of the exact synthetic data (result SYNO, data fit 60%), an inversion of noisy synthetic data (result SYNI, signal to noise ratio 0.15, data fit 4%), and an inversion of noisy synthetic data with epicen- tral distances between 0 and 30” (result SYN2, data fit 4%).
in map-view we only show result SYNl (Fig. 13). From SYNl we can readily infer that, even in the case of a very poor data fit, the synthetic model is well recovered. Al1 anomaly patterns outside the boundaries of the synthetic slab are of course resolution artifacts. Specificaliy, anomaly leaking into the lower mantle is clearly visible. Cross-sections through the sensitivity test results are displayed in Figure 14. Note that even in the case SYNO (no data noise!) small resolu- tion problems exist. The smearing of the synthetic slab anomaly along the main directions of ray-il- lumination corroborates our earlier findings in
M.J. BLANC0 AND W. SPAKMAN
1 Synthetic slab: SYNI 1 -0.5% + 1.5%
Fig. 13. Tomographic result SYNI of a noisy data inversion for a synthetic slab model. The synthetic slab is designed to resemble in
shape and amplitude the slab-like anomaly imaged beneath the Betic and Alboran area. The location of the synthetic slab is
indicated with a thick white line visible in the panels with depths between 247 and 635 km. Notice that the contouring limits are
-0.5 and 1.5V. Anomalies outside line are all imaging artifacts. Note that the core of the synthetic slab is well recovered. Compare
SYNI to IP1.

P-WAVE VELOC‘ITY STRUCTURE OF THE MANTLE: EVIDENCE FOR SURDUCTED I.1 I‘HOSPHEKt BtLOW S SPAIN 29
200
400
g 600
f &? 800 0
1000
1200
200
400
$ 600
8 800
1000
1200
200
400
g 600
$ 600
1000
1200
Fig. 14.
-0.5% +I 25% -0.5% +I .5%
Two cross-sections through the synthetic results SYNO, 1, and 2. The cross-sections are the same as for the actual data
results. The thick white line indicates the actual boundary of the synthetic slab. Note that the core of the synthetic slab is well
recovered in SYNO (from noise-free data) and SYNl (from very noisy data) and poorly in SYN2 (from very noisy data with
epicentral distances less than 30”). Contouring as in Figure 13. Notice that imaging artifacts resemble those in the real data results.
SYNO and SYNl should be compared to result IPI. Result SYNZ must be compared to IP3.

30 M.J. BLANC0 AND W. SPAKMAN
200
400
600
f $ 800 0
1000
1200
200
400
z f 600
B 800
1000
1200
200
400
g 600
800
1000
1200
Fig. 15. Two cross-sections through the synthetic results SYN4, SYNS, and SYN6 along the same profiles as in Figure 14. The boundary of the synthetic (input) model is indicated by thick white contour lines and consists for SYN4 of a high velocity lithosphere (+ 2%) of 70 km, a low velocity zone ( - 2%) between 70 and 220 km, and below 220 km the model is the same as in the first slab test (SYNl). For SYN5 the lithosphere is 120 km in thickness. SYN6 is made from a continuous slab between 0 and 670 km and - 1% low velocities surrounding the slab between 0 and 220 km. Contouring as in Figure 13. Compare SYN4, SYNS, and
SYN6 to SYNI and IPI.

P-WAVE VELOCITY STRUCTURE OF THE MANTLE: EVIDENCE FOR SUBDUCTED LITHOSPHERE BELOW S SPAIN 31
the data results IPl, IP2, and IP3. From the result SYN2 we can infer that short-distance data primarily reconstruct the upper part of the syn- thetic slab anomaly. The occurrence of strong lateral smearing in result IP3 is well supported by the similar resolution artifacts in SYN2.
In spite of the poor resolution for small objects (cf. spike test, Fig. 51, the tests demonstrate that the resolution provided by the reference-model rays in mapping larger objects is reasonably good beneath southern Spain, even when we force a small signal to noise ratio on the synthetic data. Therefore, if a slab-like structure is present be- low southern Spain and the Betic, we can detect it with sufficient reliability. Moreover, from the close correlation between the anomaly smearing in the synthetics (SYNl, SYN2) and data results (IPI, IP3) (where the “slab anomaly” is con- cerned) we find another (but indirect) indication that a slab-like velocity structure actually exists at depths between 200 and 700 km below southern Spain and the Alboran sea.
The real data results IPl and IP3 suggest that the slab structure is overlain by low velocities and hence may not be connected to the Betic-Al- boran lithosphere. Similar observations have been made for the Hellenic slab below western Greece and for subduction beneath Italy; they are inter- preted as an image of slab detachment from the shallow lithosphere (Spakman et al., 1988; Spak- man, 1990). To obtain insight into the resolution for a slab detachment configuration, we per- formed additional tests with three synthetic slab models, modelled below the Betic-Alboran re- gion. The first model possesses a high-velocity lithosphere of 70 km, a low-velocity zone of - 2% from 70 to 220 km, and, for depths larger than 220 km, the model is the same as before. The inversion result is called SYN4. The second model has a thicker lithosphere of 120 km (+ 2%), and a thinner low-velocity zone from 120 to 220 km (-2%). This inversion result is called SYNS. The last model consists of a continuous slab from 0 to 670 km of a +2% anomaly value, which is sur- rounded by a low-velocity lithosphere and as- thenosphere of - 1% from 0 to 220 km, for the entire Iberian region. The inversion result is called SYN6. In all these tests we added normally dis-
tributed noise with a standard deviation of 0.5 s to the synthetic data. The three results are dis- played in Figure 15 for the two cross-sections and
can be compared to IPl, and SYNl. We can infer that the slab detachment configuration is resolv- able (SYN4), even for a thin low-velocity zone (SYNS), although in the latter case some smear- ing across the low-velocity zone does occur. The test SYN6 is made to demonstrate that we could image a continuous slab, even if the upper 220 km of the slab is surrounded by only negative anomalies. This demonstrates that low velocities above the slab image in IPl (i.e., above 200 km) are probably due to other causes than anomaly smearing from adjacent low-velocity structures (if these were present). Below 200 km the anomaly patterns in SYN4, SYNS, and SYN6 are quite similar to those of SYNl (Fig. 14) which indicates that the large scale structure of the lithosphere- asthenosphere system in the Betic-Alboran re- gion is to a large degree independently resolvable from the lower part of the upper mantle. Since the slab image in IPl resembles more the detach- ment configuration (or a configuration where a high-velocity lithosphere seems largely absent lo- cally), we use these tests.in support of our inter- pretation of slab detachment below the Betic-Al- boran region.
Discussion and conclusions
In this paper we applied delay-time tomogra- phy to retrieve the P-wave velocity structure of the mantle beneath the Iberian Peninsula. The method of tomography applied attempts to ac- count for the effects of event mislocation, origin time errors, and station statics on the data. The data are well centered with respect to the travel- time predictions determined from radial velocity model PM2 (Fig. 3) which at least indicates that the non-linear effects of reference model prob- lems related to ISC delay-times (Van der Hilst and Spakman, 1989) have been reduced. Other effects of non-linearity (e.g., ray bending due lo the velocity heterogeneity) are not considered in the present method, nor the effects of possibly remaining systematic errors/signal in the data (see also below). Therefore, the results obtained

32 M.J. BLANC0 AND W. SPAKMAN
here can only be considered as a first approxima- tion to the real Earth structure, although we do not anticipate a significant improvement of the results when we would account for ray bending effects in a more elaborate approach to delay-time tomography. This, because the noise level in the data is rather high and the resolving power of the ray set suffers from dominating directions in ray illumination as inferred from the hit-count pat- terns. An improvement could be obtained by in- cluding data from new station-event combina- tions allowing for a more isotropic illumination of the mantle region below the Iberian Peninsuia. For other uncertainties and problems in delay- time tomography see Spakman (1991).
All our inferences about resolution are derived from sensitivity analyses with synthetic velocity models. It is important to realize that sensitivity analysis gives only insight in the resolving power of the ray set employed, and not of the actual delay-time data and real ray paths. Care is taken to mimic with the sensitivity tests the convergence behaviour of the real data inversions (by adding normalty distributed noise with a sufficiently large standard deviation to the synthetic data). Sensi- tivity tests are very useful in the case that the reference ray paths are good approximations of the actual ray paths, and if the noise in the actual delay-times is uncorrelated, has zero mean and possesses a symmetric distribution. As remarked above, we believe that the only ray path devia- tions of the real paths with respect to the refer- ence paths are primarily due to the velocity het- erogeneity since we corrected for reference model influences. The large scale velocity heterogenei~ itself is of modest amplitude (a few percent at most) and will therefore not result in too large ray path deviations. Our ray set is probably accu- rate enough to infer resolution estimates from sensitivity analyses in this respect.
With regard to the noise in the delay-time data, we can say that the data between -3 and +3 s are about symmetrically distributed and therefore it is very reasonable to assume that also the data errors will be symmetricahy distributed. Systematic and correlated errors errors remain difficult to assess. One test is useful to investigate effects of noise with the same statistical distribu-
tion as the data: the permuted-data test (for
details, see Spakman and Nolet, 1988; Spakman, 1991). In this test, the actual delay-time data are randomly permuted prior to inversion while keep- ing the order of the tomographic equations fixed. In this way the correlation between delay-times on the one hand and ray paths, events and sta- tions on the other hand is destroyed, but the statistical distribution of the delay-times stays the same. The inversion of the permuted data set rendered only a few small scale anomaly patterns with small amplitudes on the order of O.l-0.3% and with no correlation with the patterns in result IPl, which demonstrates that large errors (with data’s distribution) will not lead to large scale and/or high amplitude heterogeneity in the in- version, an observation which gives additional credit to the applicability of sensitivity tests for resolution analysis. Furthermore, the result of this test leads us to conclude that IPl is a signifi- cant inversion result on the structure of the Iberian mantle (see Spakman, 1991, for how to arrive at this conclusion). In fact, this is the only indication we have that IPl is a significant result. Sensitivity tests are not informative in this re- spect.
From the start we have concluded that the resolving power of data set for imaging small-scale structure on the order of 100 km is very limited, except for parts of the upper 150 km. From the block-model inversion (Figs. 6, 7) we inferred reasonable resolution for mantle structures with dimensions of a few hundred km or more. In view of the poor resolution for detail our analysis has been focussed on locating the spatially large ve- locity structure that has caused the mapping of a slab-like anomaly in the upper mantle beneath the eastern Betic and the Alboran sea. The block inversion result already indicated the good poten- tial of the data set to resotve the slab structure. We demonstrated from the results of inversions of subsets of the data for different epicentral distance ranges that the likely location for this velocity structure is at least in the upper mantle below southern Spain. A lower mantle extension of the slab anomaly is not excluded by this ap- proach. To arrive at this point we also invoked the argument that the event mislocation and sta-

P-WAVE VEL.OCITY STRUCTURE OF THE MANTLE: EVIDENCE FOR SUBDUCTED LITHOSPHERE BELOW S SPAIN 33
tion parameters largely absorb the effects of lat- eral heterogeneity outside the cell model. We proceeded our analysis with a resolution test for a
synthetic slab structure located at the same place and with a similar amplitude as the slab-like anomaly in the data inversion results. Our con- clusion from this test is that the resolution for large objects below southern Spain is reasonably good. We put effort in demonstrating how image blurring effects are related to the hit-count pat- tern. Specifically, the similarity between the reso- lution artifacts (e.g., anomaly smearing) in the real data results and in the synthetic results point (indirectly> at the actual existence of a high-veloc- ity body below southern Spain.
In conclusion and adding all inferences, we have demonstrated that it is likely that a slab-like structure resembling the geometry as inferred from the inversion rest&s actually exists beneath southern Spain. We interpret the anomaly be- tween 200 km and 700 km as the mapping of a subducted slab. From the slab image in IPl (Fig. 10) we cannot infer a clear dip-direction more accurate than about vertical. In map-view the slab has a clear SW-NE strike direction and is of limited lateral extent. The slab is located primar- ily below the Alboran sea and eastern Betic. The slab-inte~retation is corroborated by the exis- tence of very deep seismic&y at 640 km located in the core of the slab anomaly. An indication for a subducted slab was found earlier by Spakman (1986, 1990) who obtained a slab image from inverting primarily short-distance data. The im- age is poorer resolved but is similar in shape to that in result IP2.
We are not the first to suggest that subducted lithosphere is present below southern Spain. Its presence has been invoked by many authors to explain the deep seismicity (e.g., Udias et al., 1976; Chung and Kanamori, 1976; Buforn et al., 1988, 1991). Our reasoning, however, is opposite: we have found slab of considerabIe length and merely invoke the presence of the deep seismicity to corroborate this result.
Our results suggest that the slab is not con- nected to high-velocity lithosphere at the surface and can be interpreted as detached. The resolu- tion provided by our ray set has been demon-
strated to be sufficient for imaging slab detach- ment and our results resemble more a detached
slab configuration than that of a continuous slab. In fact, it seems that locally also a distinct high- velocity lithosphere is lacking in the Betic-Al- boran region, a result which has already been inferred from surface wave studies (Panza et al., 1980; Marillier and Mueller, 1985; Suhadolc and Panza, 1989). The low velocities found above the slab may be partly due to continental lithosphere involved in the present interaction between Iberia and the African plate. Another cause of the low- velocity material found directly above the slab may be asthenospheric material which by lateral inflow has occupied the space created by detach-
ment. At the time it occurs an important conse-
quence of slab detachment is the dynamic re- sponse of the crust-lithosphere system directly above the slab. Prior to detachment the elastic energy stored in the down-bended part of the slab above the future detachment level will be released upon slab detachment and may cause large uplift in the region above the slab (Wortel and Spakman, 1992). In the Betic region the most recent phase of important uplift occurred in the early Miocene. To explain this tectonic phase Platt and Vissers (1989) postulated the detach- ment of a “cold lithosphere root” below the Betic region. Combining our inferences with those of Wortel and Spakman, and of PIatt and Vissers we can tentatively place the time of slab detachment in the early Miocene and consequently subduc- tion took place during at least part of the Oligocene,
This research was carried out while M.J. Blanc0 was a visiting scientist at the Department of Geophysics of the University of Utrecht (fan 1989) supported by a grant from the Universidad Complutense (Madrid). We have benefited from the constructive comments made by E. Kissling, M.J.R. Wortel and an anonymous reviewer.
References
Badal, J., Corchete, V., Payo, G., Canas, J.A., Pujades, L. and Ser6n, F.J., 1990. Processing and inversion of long-period

34 M.J. BLANC0 AND W. SPAKMAN
surface-wave data collected in the Iberian Peninsula. Geo-
phys. J. Int., 100: 193-202.
Banda, E., Ansorge, J., Boloix, M. and Cordoba, D., 1980.
Structure of the crust and upper mantle beneath the
Balearic Islands (western Mediterranean). Earth Planet.
Sci. Lett., 49: 1219-230.
Banda, E., Suriiiach, E., Aparicio, A., Sierra, J. and Ruiz de
la Parte, E., 1981. Crust and upper mantle structure of the
central Iberian Meseta (Spain). Geophys. J.R. Astron.
sot., 67: 779-789.
Banda, E., Udias, A., Mueller, St., Mezcua, J., Boloix, M.,
Gallart, J. and Aparicio, A., 1983. Crustal structure be-
neath Spain from deep seismic sounding experiments.
Phys. Earth Planet. Inter., 31: 277-280.
Buforn, E., Udias, A. and Mezcua, J., 1988. Seismicity and
focal mechanisms in south Spain. Bull. Seismol. Sot. Am.,
78: 2008-2024. i Buforn, E., Udias, A., Mezcua, J. and Madariaga, R., 1991. A
deep earthquake under south Spain. Bull. Seismol. Sot.
Am., 81: 1403-1407.
Chung, W.-Y. and Kanamori, H., 1976. Source process and
tectonic implications of the Spanish deep-focus earth-
quake of March 29, 1954. Phys. Earth Planet. Inter., 13:
85-96.
Granet, M. and Trampert, J., 1989. Large-scale P-velocity
structures in the Euro-Mediterranean area. Geophys. J.
Int., 99: 583-594.
I&sling, E., 1988. Geotomography with local earthquake data.
Rev. Geophys., 26(4): 659-698.
Marillier, F. and Mueller, St., 1985. The western Mediter-
ranean region as an upper-mantle transition zone between
two lithospheric plates. Tectonophysics, 118: 113-130.
Nolet, G., 1985. Solving or resolving inadequate and noisy
tomographic systems. J. Comput. Phys., 61: 463-482.
Nolet, G., 1990. Partitioned waveform inversion and two-di-
mensional structure under the network of autonomously
recording seismographs. J. Geophys. Res., 95: 8499-8512.
Paige, C.C. and Saunders, M.A., 1982. LSQR: an algorithm
for sparse linear equations and sparse least squares. ACM
Trans. Math. Soft., 8: 43-71
Panza, G.F., Mueller, St. and Calgagnile, G., 1980. The gross
features of the lithosphere-asthenosphere system in Eu-
rope from seismic surface waves and body waves. Pure
Appl. Geophys., 118: 1209-1213.
Paulssen, H. and Visser, J., 1993. The crustal structure in
Iberia inferred from P-wave coda. In: J. Badal, J. Gallart
and H. Paulssen (Editors), Seismic Studies of the Iberian
Peninsula. Tectonophysics, 221: 111-123.
Payo, G., 1970. Structure of the crust and upper mantle by
means of a long period triangular array. Geophys. J.R.
Astron. Sot, 20: 493-508.
Payo, G., 1972. Crust-mantle velocities in the Iberian Penin-
sula and tectonic implications of the seismicity in this area.
Geophys. J.R. Astron. Sot, 30: 85-99.
Platt, J. and Vissers, R.L.M., 1989. Extensional collapse of
thickened continental lithosphere: A working hypothesis
for the Alboran Sea and Gibraltar arc. Geology, 17: 540-
543.
Snieder, R., 1988. Large scale waveform inversions of surface
waves for lateral heterogeneity, II: Application to surface
waves in Europe and the Mediterranean. J. Geophys. Res
93: 12067-12080.
Spakman, W., 1986. Subduction beneath Eurasia in connec-
tion with the Mesozoic Tethys. Geol. Mijnbouw, 65: 145-
153.
Spakman, W., 1988. Upper Mantle Delay Time Tomography.
Thesis, Univ. Utrecht, Utrecht. Geol. Ultraiectina, 53, 200
PP.
Spakman, W., 1990. Images of the upper mantle of central
Europe and the Mediterranean. Terra Nova, 2: 542-533.
Spakman, W., 1991. Delay time tomography of the upper
mantle below Europe, the Mediterranean, and Asia Mi-
nor. Geophys. J. Int., 107: 309-332.
Spakman, W. and Nolet, G., 1988. Imaging algorithms, accu-
racy and resolution in delay time tomography. In: N.J.
Vlaar, G. Nolet, M.J.R. Wortel and S.A.L. Cloetingh
(Editors), Mathematical Geophysics: a Survey of Recent
Developments in Seismology and Geodynamics. Reidel,
Dordrecht, pp. 155-188.
Spakman, W., Wortel, M.J.R. and Vlaar, N.J., 1988. The
Hellenic subduction zone: a tomographic image and its
geodynamic implications. Geophys. Res. Lett., 15: 60-63.
Spakman, W., Stein, S., Van der Hilst, R.D. and Wortel,
M.J.R., 1989. Resolution experiments for NW Pacific Sub-
duction Zone Tomography. Geophys. Res. Lett., 16: 1097-
1100.
Spakman, W., Van der Lee, S. and Van der Hilst, R.D., 1991.
Structure of the European-Mediterranean mantle to a
depth of 1400 km: preliminary results from P delay-time
tomography. Terra Abstr., 3(l): 173.
Suhadolc, P. and Panza, G.F., 1989. Physical properties of the
lithosphere-asthenosphere system in Europe from geo-
physical data. In: Boriani et al. (Editors), The Lithosphere
in Italy. Acad. Naz. Lincei, Rome, pp. 15-40.
Udias, A., Lopez-Arroyo, A. and Mezcua, J., 1976. Seismo-
tectonics of the Azores-Alboran region. Tectonophysics,
31: 259-289.
Van der Hilst, R.D., 1990. Tomography with P, PP and pP
Delay-Time Data and the Three-Dimensional Mantle
Structure below the Caribbean region. Thesis, Univ.
Utrecht, Utrecht, 250 pp.
Van der Hilst, R.D. and Spakman, W., 1989. Importance of
the reference model in linearized tomographic inversions:
images of subduction below the Caribbean plate. Geophys.
Res. Lett., 16: 1093-1097.
Wortel, M.J.R., and Spakman, W., 1992. Structure and dy-
namics of subducted lithosphere in the Mediterranean
region, Proc. K. Ned. Akad. Wet., 1992: in press.
Zielhuis, A., Spakman, W. and Nolet, G., 1989. A reference
model for tomographic imaging of the upper mantle shear
velocity structure beneath Europe. In: R. Cassinis, G.
Panza and G. Nolet (Editors), Digital Seismology and
Modeling of the Lithosphere. Plenum, London, pp. 333-
340.