
Large-scale climatic variability and radial increment variation of Picea abies (L.) Karst. in...
12
Trees (2003) 17:173–184 DOI 10.1007/s00468-002-0220-4 ORIGINAL ARTICLE Harri Mäkinen · Pekka Nöjd · Hans-Peter Kahle · Ulrich Neumann · Björn Tveite · Kari Mielikäinen · Heinz Röhle · Heinrich Spiecker Large-scale climatic variability and radial increment variation of Picea abies (L.) Karst. in central and northern Europe Received: 18 March 2002 / Accepted: 2 September 2002 / Published online: 28 September 2002 # Springer-Verlag 2002 Abstract High-frequency variation of Norway spruce radial increment [Picea abies (L.) Karst.] and its depen- dence on various climatic variables was compared in stands across latitudinal and altitudinal transects in southwestern and eastern Germany, Norway, and Finland. The tested variables included local temperature and precipitation, northern hemisphere temperature anoma- lies, and the climatic teleconnection patterns (North Atlantic Oscillation, East Atlantic, East Atlantic Jet, East Atlantic/West Russia, and Scandinavian patterns). Cli- matic impact on radial increment increased towards minimum and maximum values of the long-term temper- ature and precipitation regimes, i.e. trees growing under average conditions respond less strongly to climatic variation. Increment variation was clearly correlated with temperature. Warm Mays promoted radial increments in all regions. If the long-term average temperature sum at a stand was below 1,200–1,300 degree days, above average summer temperature increased radial increment. In regions with more temperate climate, water availability was also a growth-limiting factor. However, in those cases where absolute precipitation sum was clearly related to radial increment variation, its effect was dependent on temperature-induced water stress. The estimated dates of initiation and cessation of growing season and growing season length were not clearly related to annual radial increment. Significant correlations were found between radial increment and climatic teleconnection indices, especially with the winter, May and August North Atlantic Oscillation indices, but it is not easy to find a physiological interpretation for these findings. Keywords North Atlantic Oscillation · Picea abies · Precipitation · Radial increment variation · Temperature Introduction Radial growth variation of coniferous trees in central and northern Fennoscandia is mainly related to current summer temperatures (Mikola 1950; MȨkinen et al. 2000; Miina 2000). In contrast, growth variation of conifers in central Europe is mainly correlated with precipitation (e.g. Eckstein et al. 1989; Kahle 1994; Kahle and Spiecker 1996). In recent studies, the effect of precipitation on annual radial growth of Norway spruce [Picea abies (L.) Karst.] has also been demonstrated in southern and central Finland (Henttonen 1990; MielikȨi- nen et al. 1996). MȨkinen et al. (2001) observed that low precipitation may even be related to damage and dying off of Norway spruce on drought-sensitive sites in southern Finland. In addition to a latitudinal gradient, a difference in factors controlling tree growth has been observed between low and high altitudes (e.g. Kahle 1994; Dittmar and Elling 1999). Although the growth response to weather variation differs between geographical regions, a common pattern in growth variation was recently observed for central Europe and Fennoscandia (MȨkinen et al. 2002). This suggests that there are limiting as well as favourable factors for tree growth that are common for the entire area. The common pattern of growth variation could be explained by large-scale weather patterns. H. MȨkinen ( ) ) · P. NɆjd Finnish Forest Research Institute, P.O. Box 18, 01301 Vantaa, Finland e-mail: [email protected] Tel.: +358-9-85705308 Fax: +358-9-85705361 H.-P. Kahle · H. Spiecker Institute for Forest Growth, University of Freiburg, Tennenbacherstrasse 4, 79085 Freiburg, Germany U. Neumann · H. RɆhle Institute of Forest Growth and Forest Informatics, University of Dresden, Wilsdrufferstrasse 18, 01737 Tharandt, Germany B. Tveite Norwegian Forest Research Institute, Hoegskolevn. 12, 1432 ĸs, Norway K. MielikȨinen Finnish Forest Research Institute, Unioninkatu 40, 00170 Helsinki, Finland
-
Upload
uni-freiburg -
Category
Documents
-
view
4 -
download
0
Transcript of Large-scale climatic variability and radial increment variation of Picea abies (L.) Karst. in...
Trees (2003) 17:173–184DOI 10.1007/s00468-002-0220-4
O R I G I N A L A R T I C L E
Harri M�kinen · Pekka N�jd · Hans-Peter Kahle ·Ulrich Neumann · Bj�rn Tveite · Kari Mielik�inen ·Heinz R�hle · Heinrich Spiecker
Large-scale climatic variability and radial increment variationof Picea abies (L.) Karst. in central and northern Europe
Received: 18 March 2002 / Accepted: 2 September 2002 / Published online: 28 September 2002� Springer-Verlag 2002
Abstract High-frequency variation of Norway spruceradial increment [Picea abies (L.) Karst.] and its depen-dence on various climatic variables was compared instands across latitudinal and altitudinal transects insouthwestern and eastern Germany, Norway, and Finland.The tested variables included local temperature andprecipitation, northern hemisphere temperature anoma-lies, and the climatic teleconnection patterns (NorthAtlantic Oscillation, East Atlantic, East Atlantic Jet, EastAtlantic/West Russia, and Scandinavian patterns). Cli-matic impact on radial increment increased towardsminimum and maximum values of the long-term temper-ature and precipitation regimes, i.e. trees growing underaverage conditions respond less strongly to climaticvariation. Increment variation was clearly correlated withtemperature. Warm Mays promoted radial increments inall regions. If the long-term average temperature sum at astand was below 1,200–1,300 degree days, above averagesummer temperature increased radial increment. Inregions with more temperate climate, water availabilitywas also a growth-limiting factor. However, in thosecases where absolute precipitation sum was clearly related
to radial increment variation, its effect was dependent ontemperature-induced water stress. The estimated dates ofinitiation and cessation of growing season and growingseason length were not clearly related to annual radialincrement. Significant correlations were found betweenradial increment and climatic teleconnection indices,especially with the winter, May and August NorthAtlantic Oscillation indices, but it is not easy to find aphysiological interpretation for these findings.
Keywords North Atlantic Oscillation · Picea abies ·Precipitation · Radial increment variation · Temperature
Introduction
Radial growth variation of coniferous trees in central andnorthern Fennoscandia is mainly related to currentsummer temperatures (Mikola 1950; M�kinen et al.2000; Miina 2000). In contrast, growth variation ofconifers in central Europe is mainly correlated withprecipitation (e.g. Eckstein et al. 1989; Kahle 1994; Kahleand Spiecker 1996). In recent studies, the effect ofprecipitation on annual radial growth of Norway spruce[Picea abies (L.) Karst.] has also been demonstrated insouthern and central Finland (Henttonen 1990; Mielik�i-nen et al. 1996). M�kinen et al. (2001) observed that lowprecipitation may even be related to damage and dying offof Norway spruce on drought-sensitive sites in southernFinland. In addition to a latitudinal gradient, a differencein factors controlling tree growth has been observedbetween low and high altitudes (e.g. Kahle 1994; Dittmarand Elling 1999).
Although the growth response to weather variationdiffers between geographical regions, a common patternin growth variation was recently observed for centralEurope and Fennoscandia (M�kinen et al. 2002). Thissuggests that there are limiting as well as favourablefactors for tree growth that are common for the entirearea. The common pattern of growth variation could beexplained by large-scale weather patterns.
H. M�kinen ()) · P. N�jdFinnish Forest Research Institute, P.O. Box 18, 01301 Vantaa,Finlande-mail: [email protected].: +358-9-85705308Fax: +358-9-85705361
H.-P. Kahle · H. SpieckerInstitute for Forest Growth, University of Freiburg,Tennenbacherstrasse 4, 79085 Freiburg, Germany
U. Neumann · H. R�hleInstitute of Forest Growth and Forest Informatics,University of Dresden, Wilsdrufferstrasse 18, 01737 Tharandt,Germany
B. TveiteNorwegian Forest Research Institute, Hoegskolevn. 12, 1432 �s,Norway
K. Mielik�inenFinnish Forest Research Institute, Unioninkatu 40, 00170 Helsinki,Finland
Verwendete Distiller 5.0.x Joboptions
Dieser Report wurde automatisch mit Hilfe der Adobe Acrobat Distiller Erweiterung "Distiller Secrets v1.0.5" der IMPRESSED GmbH erstellt. Sie koennen diese Startup-Datei für die Distiller Versionen 4.0.5 und 5.0.x kostenlos unter http://www.impressed.de herunterladen. ALLGEMEIN ---------------------------------------- Dateioptionen: Kompatibilität: PDF 1.2 Für schnelle Web-Anzeige optimieren: Ja Piktogramme einbetten: Ja Seiten automatisch drehen: Nein Seiten von: 1 Seiten bis: Alle Seiten Bund: Links Auflösung: [ 600 600 ] dpi Papierformat: [ 595.276 785.197 ] Punkt KOMPRIMIERUNG ---------------------------------------- Farbbilder: Downsampling: Ja Berechnungsmethode: Bikubische Neuberechnung Downsample-Auflösung: 150 dpi Downsampling für Bilder über: 225 dpi Komprimieren: Ja Automatische Bestimmung der Komprimierungsart: Ja JPEG-Qualität: Mittel Bitanzahl pro Pixel: Wie Original Bit Graustufenbilder: Downsampling: Ja Berechnungsmethode: Bikubische Neuberechnung Downsample-Auflösung: 150 dpi Downsampling für Bilder über: 225 dpi Komprimieren: Ja Automatische Bestimmung der Komprimierungsart: Ja JPEG-Qualität: Mittel Bitanzahl pro Pixel: Wie Original Bit Schwarzweiß-Bilder: Downsampling: Ja Berechnungsmethode: Bikubische Neuberechnung Downsample-Auflösung: 600 dpi Downsampling für Bilder über: 900 dpi Komprimieren: Ja Komprimierungsart: CCITT CCITT-Gruppe: 4 Graustufen glätten: Nein Text und Vektorgrafiken komprimieren: Ja SCHRIFTEN ---------------------------------------- Alle Schriften einbetten: Ja Untergruppen aller eingebetteten Schriften: Nein Wenn Einbetten fehlschlägt: Warnen und weiter Einbetten: Immer einbetten: [ ] Nie einbetten: [ ] FARBE(N) ---------------------------------------- Farbmanagement: Farbumrechnungsmethode: Alle Farben zu sRGB konvertieren Methode: Standard Arbeitsbereiche: Graustufen ICC-Profil: RGB ICC-Profil: sRGB IEC61966-2.1 CMYK ICC-Profil: U.S. Web Coated (SWOP) v2 Geräteabhängige Daten: Einstellungen für Überdrucken beibehalten: Ja Unterfarbreduktion und Schwarzaufbau beibehalten: Ja Transferfunktionen: Anwenden Rastereinstellungen beibehalten: Ja ERWEITERT ---------------------------------------- Optionen: Prolog/Epilog verwenden: Nein PostScript-Datei darf Einstellungen überschreiben: Ja Level 2 copypage-Semantik beibehalten: Ja Portable Job Ticket in PDF-Datei speichern: Nein Illustrator-Überdruckmodus: Ja Farbverläufe zu weichen Nuancen konvertieren: Nein ASCII-Format: Nein Document Structuring Conventions (DSC): DSC-Kommentare verarbeiten: Nein ANDERE ---------------------------------------- Distiller-Kern Version: 5000 ZIP-Komprimierung verwenden: Ja Optimierungen deaktivieren: Nein Bildspeicher: 524288 Byte Farbbilder glätten: Nein Graustufenbilder glätten: Nein Bilder (< 257 Farben) in indizierten Farbraum konvertieren: Ja sRGB ICC-Profil: sRGB IEC61966-2.1 ENDE DES REPORTS ---------------------------------------- IMPRESSED GmbH Bahrenfelder Chaussee 49 22761 Hamburg, Germany Tel. +49 40 897189-0 Fax +49 40 897189-71 Email: [email protected] Web: www.impressed.de
Adobe Acrobat Distiller 5.0.x Joboption Datei
<< /ColorSettingsFile () /AntiAliasMonoImages false /CannotEmbedFontPolicy /Warning /ParseDSCComments false /DoThumbnails true /CompressPages true /CalRGBProfile (sRGB IEC61966-2.1) /MaxSubsetPct 100 /EncodeColorImages true /GrayImageFilter /DCTEncode /Optimize true /ParseDSCCommentsForDocInfo false /EmitDSCWarnings false /CalGrayProfile () /NeverEmbed [ ] /GrayImageDownsampleThreshold 1.5 /UsePrologue false /GrayImageDict << /QFactor 0.9 /Blend 1 /HSamples [ 2 1 1 2 ] /VSamples [ 2 1 1 2 ] >> /AutoFilterColorImages true /sRGBProfile (sRGB IEC61966-2.1) /ColorImageDepth -1 /PreserveOverprintSettings true /AutoRotatePages /None /UCRandBGInfo /Preserve /EmbedAllFonts true /CompatibilityLevel 1.2 /StartPage 1 /AntiAliasColorImages false /CreateJobTicket false /ConvertImagesToIndexed true /ColorImageDownsampleType /Bicubic /ColorImageDownsampleThreshold 1.5 /MonoImageDownsampleType /Bicubic /DetectBlends false /GrayImageDownsampleType /Bicubic /PreserveEPSInfo false /GrayACSImageDict << /VSamples [ 2 1 1 2 ] /QFactor 0.76 /Blend 1 /HSamples [ 2 1 1 2 ] /ColorTransform 1 >> /ColorACSImageDict << /VSamples [ 2 1 1 2 ] /QFactor 0.76 /Blend 1 /HSamples [ 2 1 1 2 ] /ColorTransform 1 >> /PreserveCopyPage true /EncodeMonoImages true /ColorConversionStrategy /sRGB /PreserveOPIComments false /AntiAliasGrayImages false /GrayImageDepth -1 /ColorImageResolution 150 /EndPage -1 /AutoPositionEPSFiles false /MonoImageDepth -1 /TransferFunctionInfo /Apply /EncodeGrayImages true /DownsampleGrayImages true /DownsampleMonoImages true /DownsampleColorImages true /MonoImageDownsampleThreshold 1.5 /MonoImageDict << /K -1 >> /Binding /Left /CalCMYKProfile (U.S. Web Coated (SWOP) v2) /MonoImageResolution 600 /AutoFilterGrayImages true /AlwaysEmbed [ ] /ImageMemory 524288 /SubsetFonts false /DefaultRenderingIntent /Default /OPM 1 /MonoImageFilter /CCITTFaxEncode /GrayImageResolution 150 /ColorImageFilter /DCTEncode /PreserveHalftoneInfo true /ColorImageDict << /QFactor 0.9 /Blend 1 /HSamples [ 2 1 1 2 ] /VSamples [ 2 1 1 2 ] >> /ASCII85EncodePages false /LockDistillerParams false >> setdistillerparams << /PageSize [ 595.276 841.890 ] /HWResolution [ 600 600 ] >> setpagedevice

Large-scale changes in position and dynamics of airmasses have caused similar weather patterns in large areasbordering the North Atlantic (Rogers and van Loon 1979;Haas 1992; Hurrell 1995; Klaus et al. 1997; Rod� et al.1997; Gerstengarbe et al. 1999). A substantial portion ofthe variability on the climate of the Atlantic sector isassociated with the North Atlantic Oscillation (NAO)(Van Loon and Rogers 1978; Greatbatch 2000; Thompsonand Wallace 2001). The NAO is defined as an air pressuredifferential between the subtropical Atlantic and theIcelandic region. During a positive NAO phase low-pressure anomalies occur over Iceland in combinationwith high-pressure anomalies across the subtropicalAtlantic. A positive NAO produces stronger than averagewesterly winds from the Atlantic Ocean. In winter –which is the period of the strongest pressure gradient – apositive NAO causes warm moist conditions in centraland northern Europe. During a negative NAO anomaly,westerly winds are less frequent, which results in colderand drier conditions. Other northern hemisphere telecon-nection patterns that dominate the air mass circulation indifferent seasons have been documented by Wallace andGutzler (1981) and Barnston and Livezey (1987).
The East Atlantic pattern (EA) is the second and theEast Atlantic Jet (EA Jet) the third of the three prominentmodes of low-frequency variability over the NorthAtlantic (Barnston and Livezey 1987). The EA alsoconsists of north-south pressure anomaly centres spanningthe entire North Atlantic but the different location of theanomaly centres makes EA distinct from NAO. The EAJet also consist of a north-south dipole of anomalycentres, one located over the high latitudes of the easternNorth Atlantic and Scandinavia, and the other over NorthAfrica and the Mediterranean Sea. Other prominentclimatological teleconnection patterns affecting centraland northern Europe are East Atlantic/West Russia(EATL/WRUS), and Scandinavian (SCAND) patterns(Barnston and Livezey 1987). The EA appears during allmonths except May–August, EA Jet between April andAugust, EATL/WRUS during all months excluding June–August and SCAND throughout the year except June–July. The NAO and EA Jet are, thus, the most prominentpatterns during the radial growth period of trees (May–July) in the study area.
Several studies have related ring width variation ofNorway spruce to local weather variables (e.g. Henttonen1990; Kahle 1994; Bednarz et al. 1998–1999). Suchstudies offer few indications of how tree-growth respondsto large-scale weather patterns. Comparison of treegrowth time series sampled from several geographicalregions may enable one to identify the importantenvironmental driving factors of growth variation andeven the underlying mechanisms behind it. Several papershave recently been published on the relationship betweenNAO patterns and radial growth variation (e.g. D’Arrigoet al. 1993; Cook et al. 1998, 2002; Lindholm et al. 2001).The potential of the NAO to affect the ecology of plantsand animals in the northern hemisphere was recentlyreviewed by Post et al. (1999). However, empirical
studies of the effects of other indices describing large-scale weather variability on tree growth are scarce (e.g.Schweingruber et al. 1987; Fritts 1991; Meko et al. 1993;Schweingruber and Briffa1996). The papers mentionedabove also suggest that the variation of NAO and othercirculation patterns might be useful for extending ourunderstanding of the common patterns of tree growthvariation in central and northern Europe.
The study is based on material sampled from standsgrowing along a transect running from central Europe tonorthern Fennoscandia, different altitudes being repre-sented in each study region. In the first part of the study,we described medium- and high-frequency changes inradial increment and determined how radial incrementvaries across the latitudinal and altitudinal gradients(M�kinen et al. 2002). In addition, simple regionalincrement-climate relationships were presented. The aimof this second part of the study was to analyse possiblecausal factors behind the common patterns of Norwayspruce radial increment throughout the entire study area.Our starting hypothesis was that radial increment varia-tion is related to changes in precipitation and temperature.In addition, we evaluated relationships between thevariations of different air mass circulation patterns,northern hemisphere temperature anomalies and radialincrement variation.
Materials and methods
The material was collected across a transect starting from southernGermany and extending to the Arctic spruce timberline inFennoscandia. The four study regions were located in southwesternGermany, eastern Germany, Norway, and Finland. In addition tothe south-north gradient, the sample included maritime and morecontinental areas at similar latitudes. Within regions, sampling wascarried out across elevational gradients from lowlands up tomountains. In Finland, unlike in the other regions, the sampledstands represented similar altitudes, simply because altitudinaldifferences within the country are small. The study stands weregrouped into ‘sub-regions’ according to their elevation and latitudewithin each region (Table 1).
Mature dominant trees without visible signs of damage wererandomly selected as sample trees. The number of sample trees in astand ranged from 4 to 15 (Table 1). Increment cores or stem discswere taken at 1.3 m height using the standard sampling proceduresof each participating institute, and radial increments were measuredto an accuracy of 0.01 mm.
Ring-width series were standardised with the aim of removingvariation caused by tree maturation and stand dynamics. Prior tostandardisation, the radial increment series were transformed tologarithmic values in order to stabilise the tendency of the varianceto increase with increasing radial increment. First, a stiff splinefunction with a 50% frequency cutoff in 75 years was fitted to thering-width series in order to remove the low-frequency variationcaused by tree ageing (Cook and Peters 1981). Radial incrementindex chronologies were then calculated as the ratio between theobserved and estimated values. In the second phase, a more flexiblespline function with a 50% frequency cutoff in 10 years was fittedto the index chronologies, which had been obtained as a result ofthe first phase of detrending. Values of this flexible spline wereconsidered as medium-term variation. High-frequency indices werecalculated as the ratio between the indices calculated in the firstphase and the flexible spline. These indices describe short-termradial increment variation, while long-term and medium-term
174
variation is removed. In addition, an autoregressive model was usedto remove remaining autocorrelation from the high-frequencychronologies (prewhitening, Box et al. 1994). Mean chronologieswere calculated for each sub-region based on the individual standseries. The chronologies were constructed by using the ARSTANsoftware (Holmes et al. 1986). The material is described in detail inM�kinen et al. (2002).
Measured monthly mean temperature and precipitation sumdata from weather stations in the neighbourhood of the sampledstands were interpolated for each stand (for details see M�kinen etal. 2002). For each stand, the effective temperature sum (degreedays, d.d.), the date of initiation and cessation of growing season,and the length of growing season were estimated from the monthlymean temperatures according to a smoothing spline interpolation aspresented by Ojansuu and Henttonen (1983). The effectiveminimum temperature was defined as 5�C. The initiation andcessation of growing season were defined as the date whenaccumulation of temperature sum begins and ends. The length ofgrowing season was calculated as the difference between thecessation and initiation dates.
The state of the NAO was quantified by the NAO index, whichis based on the mean difference in sea level surface pressuresbetween Gibraltar and Reykjavik, Iceland (Jones et al. 1997).1
NAO is particularly important in winter. NAO exhibits, however,little variation in its climatological mean structure from month-to-month and it is one of the most prominent climatologicalteleconnection patterns in all seasons (Rogers 1990).
Relationships between mean temperatures, precipitation sums,teleconnection anomaly indices and high-frequency radial incre-ment chronologies were analysed by correlation and cross-corre-lation analysis. The northern hemisphere temperature anomalieswere also used to characterise large-scale temperature variations(Jones et al. 1999)2. The maximum common overlap period 1910–1995 was used in the subsequent analysis for local precipitation andtemperature, NAO, and northern hemisphere temperature. BecauseEA, EA Jet, EATL/WRUS, and SCAND indices were onlyavailable after 19503, the period of 1950–1995 was used for thosevariables.
Results
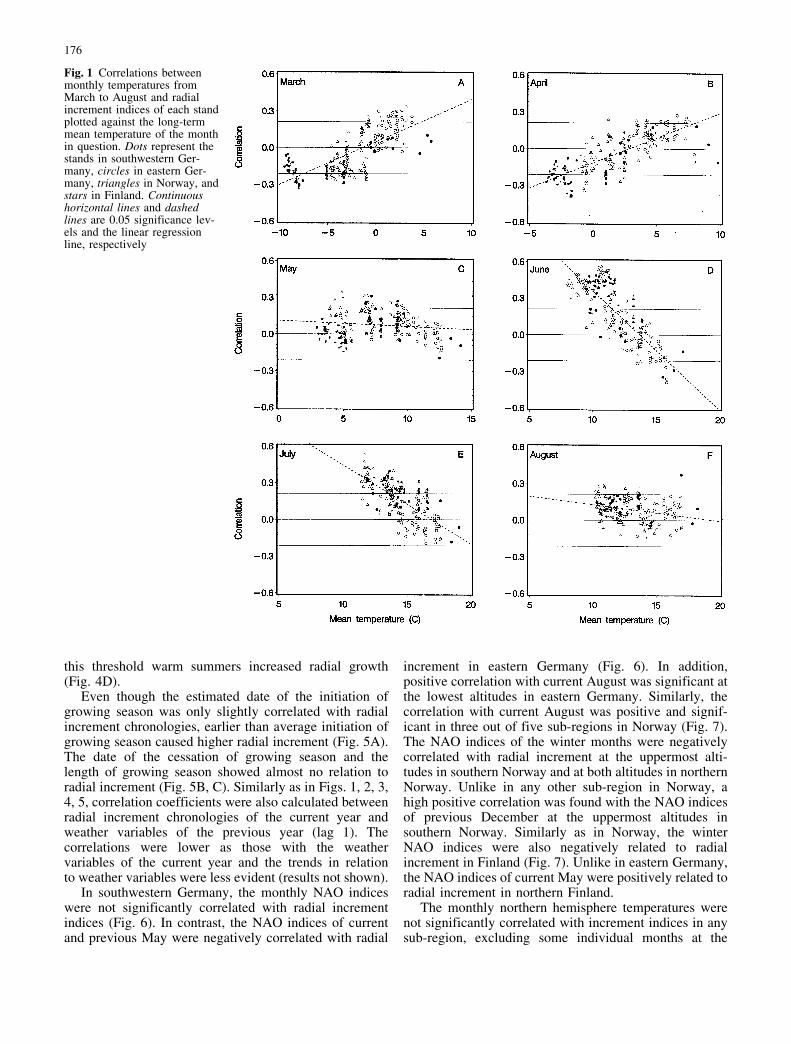
Correlations between the high-frequency radial incrementchronologies of individual stands and March and Apriltemperature tend to increase in regions with higher long-term mean March and April temperatures (Fig. 1 A, B).For May temperatures, an equally clear trend was notfound (Fig. 1C). In contrast to the spring temperatures, aclearly decreasing trend of the correlations was foundwith increasing average temperatures of June and July(Fig. 1D, E). In August, the decreasing trend of thecorrelations virtually disappeared (Fig. 1F).
No such trends were evident in correlations betweenradial increment chronologies and monthly precipitationsums from March to August (Fig. 2). When the correla-tions between increment chronologies and monthly pre-cipitation sum were plotted against long-term averagetemperatures of each month, an increasing trend was,however, found in May and June, i.e. higher than averageprecipitation was positively related to annual radialincrement in regions with higher mean temperature, butnegatively in regions with lower temperature (Fig. 3 C,D). An increasing trend in correlations with increasingtemperatures was also found in July, but the trend wasrather small in August (Fig. 3E, F).
Correlations between radial increment chronologiesand cumulative temperature sums in May were small(Fig. 4A). Even though few (14%) correlations werestatistically significant (P<0.05), almost all of them werepositive. For the summer months, the correlationsbetween cumulative temperature sum and incrementindices have a clear decreasing trend when plotted againstthe long-term average cumulative temperature sum(Fig. 4B, C). In regions with lower temperature sum,cumulative temperature sum was clearly positively cor-related with radial increment and the correlations werealso significant, but in regions with higher temperaturesum this was not the case. In regions with annualtemperature sum exceeded 1,200–1,300 d.d., radialincrement was not related to temperature sum, but below
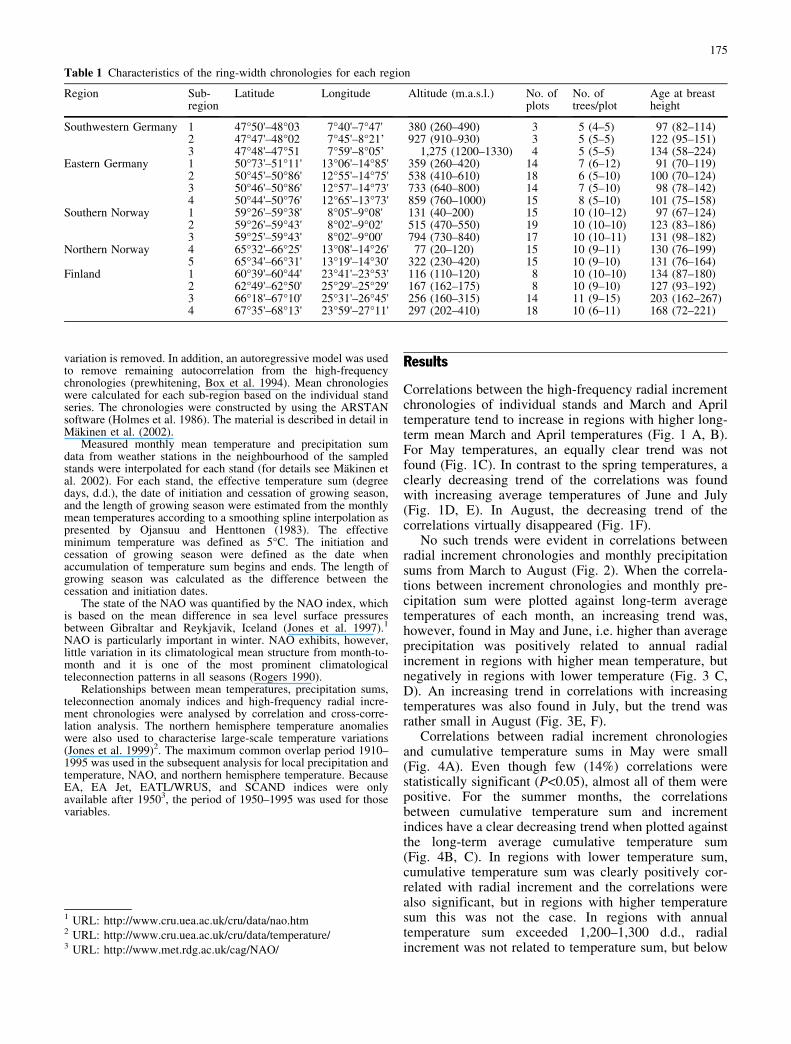
Table 1 Characteristics of the ring-width chronologies for each region
Region Sub-region
Latitude Longitude Altitude (m.a.s.l.) No. ofplots
No. oftrees/plot
Age at breastheight
Southwestern Germany 1 47�50'–48�03 7�40'–7�47' 380 (260–490) 3 5 (4–5) 97 (82–114)2 47�47'–48�02 7�45'–8�21’ 927 (910–930) 3 5 (5–5) 122 (95–151)3 47�48'–47�51 7�59'–8�05’ 1,275 (1200–1330) 4 5 (5–5) 134 (58–224)
Eastern Germany 1 50�73'–51�11' 13�06'–14�85' 359 (260–420) 14 7 (6–12) 91 (70–119)2 50�45'–50�86' 12�55'–14�75' 538 (410–610) 18 6 (5–10) 100 (70–124)3 50�46'–50�86' 12�57'–14�73' 733 (640–800) 14 7 (5–10) 98 (78–142)4 50�44'–50�76' 12�65'–13�73' 859 (760–1000) 15 8 (5–10) 101 (75–158)
Southern Norway 1 59�26'–59�38' 8�05'–9�08' 131 (40–200) 15 10 (10–12) 97 (67–124)2 59�26'–59�43' 8�02'–9�02' 515 (470–550) 19 10 (10–10) 123 (83–186)3 59�25'–59�43' 8�02'–9�00' 794 (730–840) 17 10 (10–11) 131 (98–182)
Northern Norway 4 65�32'–66�25' 13�08'–14�26' 77 (20–120) 15 10 (9–11) 130 (76–199)5 65�34'–66�31' 13�19'–14�30' 322 (230–420) 15 10 (9–10) 131 (76–164)
Finland 1 60�39'–60�44' 23�41'–23�53' 116 (110–120) 8 10 (10–10) 134 (87–180)2 62�49'–62�50' 25�29'–25�29' 167 (162–175) 8 10 (9–10) 127 (93–192)3 66�18'–67�10' 25�31'–26�45' 256 (160–315) 14 11 (9–15) 203 (162–267)4 67�35'–68�13' 23�59'–27�11' 297 (202–410) 18 10 (6–11) 168 (72–221)
1 URL: http://www.cru.uea.ac.uk/cru/data/nao.htm2 URL: http://www.cru.uea.ac.uk/cru/data/temperature/3 URL: http://www.met.rdg.ac.uk/cag/NAO/
175
this threshold warm summers increased radial growth(Fig. 4D).
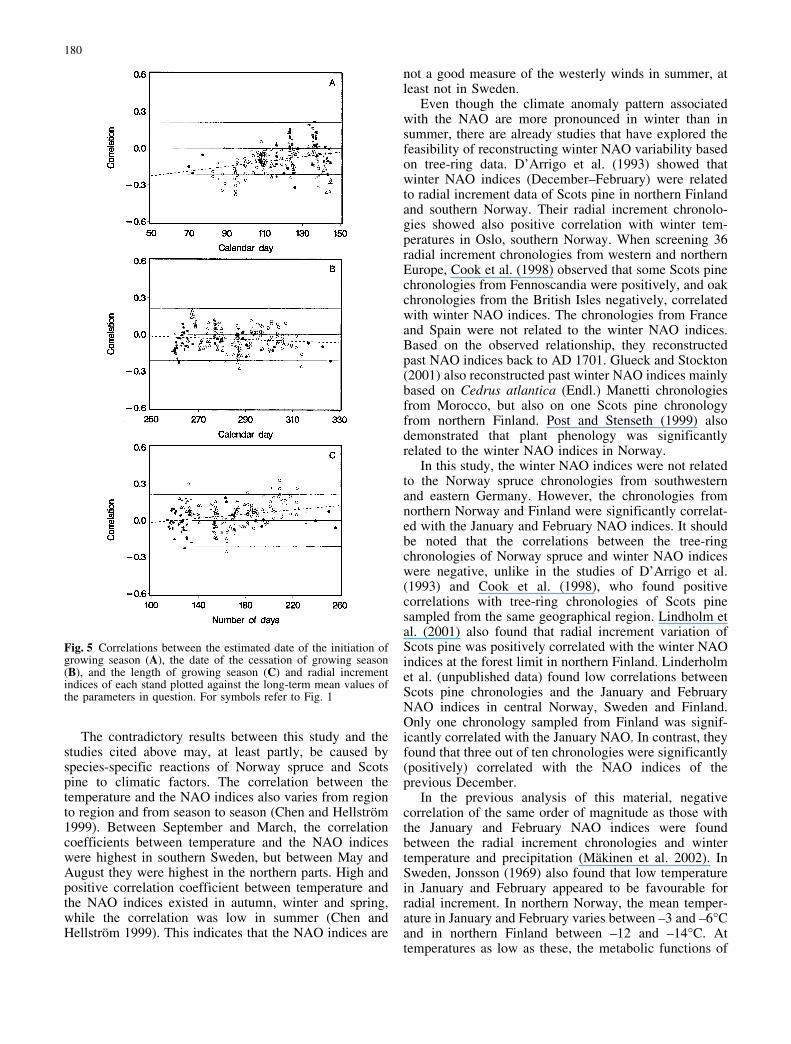
Even though the estimated date of the initiation ofgrowing season was only slightly correlated with radialincrement chronologies, earlier than average initiation ofgrowing season caused higher radial increment (Fig. 5A).The date of the cessation of growing season and thelength of growing season showed almost no relation toradial increment (Fig. 5B, C). Similarly as in Figs. 1, 2, 3,4, 5, correlation coefficients were also calculated betweenradial increment chronologies of the current year andweather variables of the previous year (lag 1). Thecorrelations were lower as those with the weathervariables of the current year and the trends in relationto weather variables were less evident (results not shown).
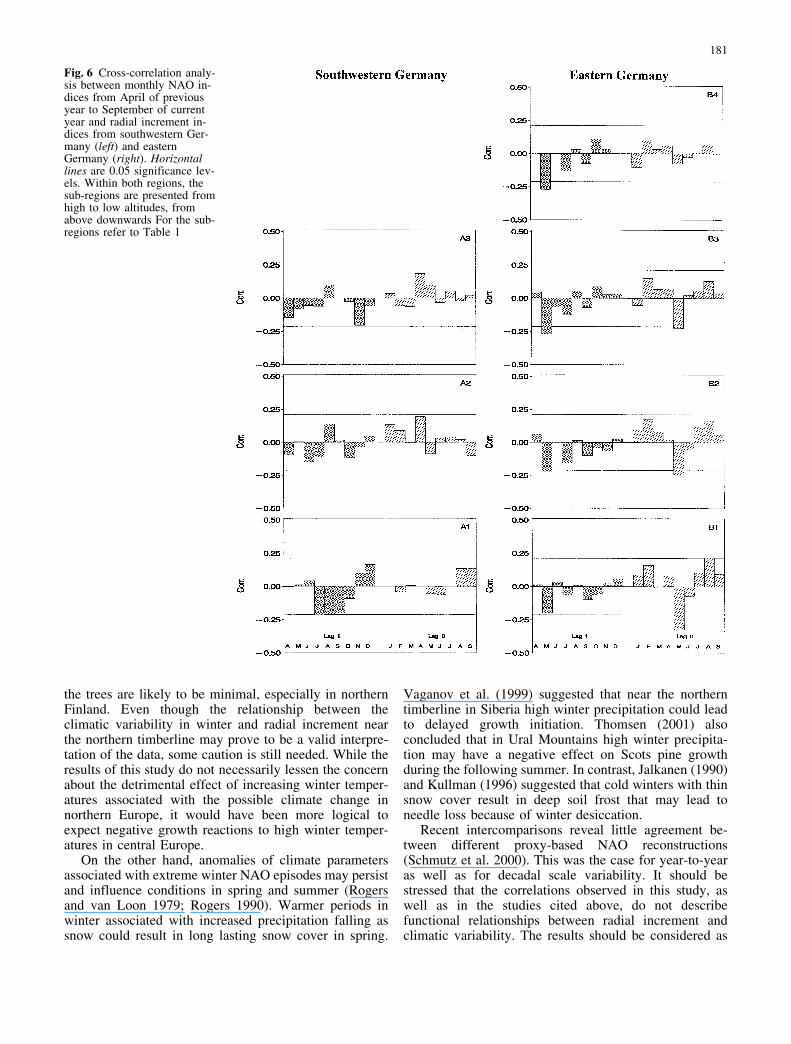
In southwestern Germany, the monthly NAO indiceswere not significantly correlated with radial incrementindices (Fig. 6). In contrast, the NAO indices of currentand previous May were negatively correlated with radial
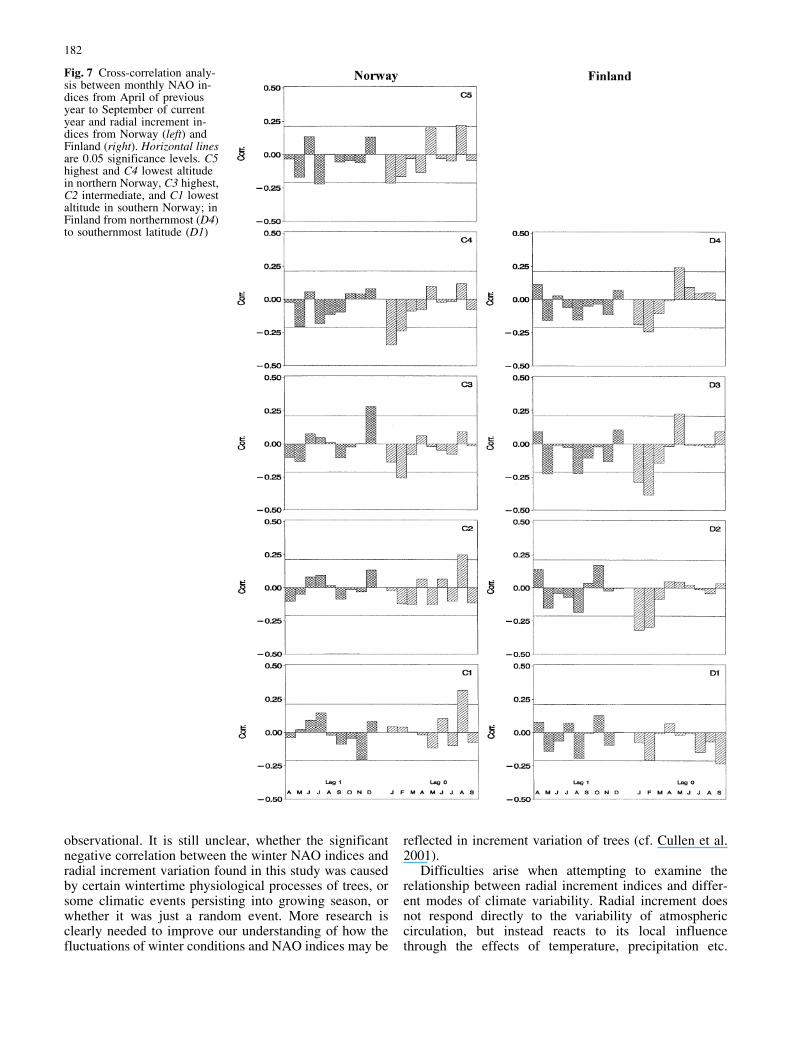
increment in eastern Germany (Fig. 6). In addition,positive correlation with current August was significant atthe lowest altitudes in eastern Germany. Similarly, thecorrelation with current August was positive and signif-icant in three out of five sub-regions in Norway (Fig. 7).The NAO indices of the winter months were negativelycorrelated with radial increment at the uppermost alti-tudes in southern Norway and at both altitudes in northernNorway. Unlike in any other sub-region in Norway, ahigh positive correlation was found with the NAO indicesof previous December at the uppermost altitudes insouthern Norway. Similarly as in Norway, the winterNAO indices were also negatively related to radialincrement in Finland (Fig. 7). Unlike in eastern Germany,the NAO indices of current May were positively related toradial increment in northern Finland.
The monthly northern hemisphere temperatures werenot significantly correlated with increment indices in anysub-region, excluding some individual months at the
Fig. 1 Correlations betweenmonthly temperatures fromMarch to August and radialincrement indices of each standplotted against the long-termmean temperature of the monthin question. Dots represent thestands in southwestern Ger-many, circles in eastern Ger-many, triangles in Norway, andstars in Finland. Continuoushorizontal lines and dashedlines are 0.05 significance lev-els and the linear regressionline, respectively
176

uppermost altitudes in southern Norway, as well as incentral Finland (results not shown). Several significantcorrelations were also found between increment indicesand monthly EA, EA Jet, EATL/WRUS, and SCANDindices (results not shown). However, no clear altitudinal,latitudinal, or longitudinal trends were observed in thesecorrelations. In addition, they are difficult to explainlogically. In many cases, the correlation of a certainmonth was significantly negative, but that of the follow-ing month significantly positive, or vice versa. Further-more, the correlation of the current September was inmany cases significant at regions, where radial incrementinvariably ceases by the end of August.
Discussion
Effect of temperature and precipitation
As pointed out by Fritts (1976), trees growing in extremeconditions respond strongly to climatic variation. Theresults of this study also suggest that climatic control ofradial increment increases towards minimum and maxi-mum values of the environmental parameters, i.e. treesgrowing under average conditions respond less strongly toclimatic variation. On the other hand, the relationshipbetween radial increment and climatic variation may bemore complex in average conditions, and the factors thataffect radial increment may change from year-to-yearresulting in low correlations between increment indicesand individual weather variables.
Environmental factors controlling radial increment andits variation were rather different in different regions andalso at different altitudes within each region. The resultsof this study are consistent with previous findings
Fig. 2 Correlations betweenmonthly precipitation sum fromMarch to August and radialincrement indices of each standplotted against the long-termmean precipitation sum of themonth in question. For symbolsrefer to Fig. 1
177

showing that radial increment variation of coniferoustrees is related to summer temperature in central andnorthern Europe (Mikola 1950; Kahle 1994; Bednarz etal. 1998–1999; Meyer and Br�ker 2001). In spring, hightemperatures favour radial increment in the warmerregions. In contrast, March and April temperatures werenegatively correlated with radial increment in the coolerregions, even though most of the correlations were notsignificant. No self-evident biologically plausible expla-nation is available for the latter finding. A possible reasonfor the negative correlation might be that high temper-atures in late winter and early spring may increaserespiration and evapotranspiration at a time, when thelosses cannot be replaced by photosynthesis and wateruptake (e.g. Tranquillini 1979). The influence of the latewinter and early spring temperatures on increment ratemight be worth investigating in more detail in order togain a better understanding of the relationship betweenradial increment and weather variation.
Warm May was favourable for radial increment inalmost all sub-regions. Thereafter, clearly differentincrement responses to high temperatures were found(cf. Hofgaard et al. 1999). Above-average June and Julytemperatures were related to high level of increment incooler regions, but in warmer regions high temperatureswere negatively correlated with increment. An annualtemperature sum of about 1,200–1,300 d.d. seems to bethe threshold value. At regions with warmer climate,warmer than average summers are unfavourable forNorway spruce radial increment. Accordingly, incrementvariation of Norway spruce proved to be related totemperature mainly in central and northern Finland wheretemperature sum varies between 500–1,000 d.d. (M�kinenet al. 2000; Miina 2000). In the warmest regions insouthern Finland the temperature sum rises to 1,300, andprevious studies have suggested that increment variationmay also be related to precipitation (Henttonen 1990;Mielik�inen et al. 1996). Southern Finland might thus be
Fig. 3 Correlations betweenmonthly precipitation sum fromMarch to August and radialincrement indices of each standplotted against the long-termmean temperature of the monthin question. For symbols referto Fig. 1
178

considered a transition zone, where the effect of precip-itation can be significant, but mainly on drought-sensitivesites (M�kinen et al. 2001).
It was also evident that absolute precipitation sumalone was not the increment-determining factor. Hightemperature can be considered as a factor promotingdrought stress that reduces water availability in the soilbecause of high evapotranspiration. In the warmer sub-regions, the limiting effect of low precipitation on radialincrement clearly increased with increasing averagetemperature during the summer months (cf. Jonsson1969; Tuhkanen 1984; Spiecker 1991). Even though anegative correlation to summer precipitation was found inthe cooler regions, a positive increment reaction todrought is less likely to occur. The correlation may wellbe due to an inverse relationship between precipitationand temperature.
The dates of the initiation and cessation of growingseason, as well as the length of growing season, wererather weakly related to annual radial increment (cf.Worrall 1973). Growth rate during the most vigorousgrowing period is probably a more important factordetermining annual radial increment than the length ofgrowing season.
Teleconnection patterns
The NAO indices of current May were negativelycorrelated with radial increment in eastern Germany andpositively correlated in northern Finland. The oppositecorrelations could be caused by a common NAO-induced
weather event that causes different increment reactions incentral and northern Europe. Alternatively, the high andlow phases of NAO could result in different weatherevents in different geographical regions. In easternGermany, the correlations with May precipitation andtemperature were, however, considerably lower than thecorrelations with the May NAO indices (M�kinen et al.2002). In northern Finland, the correlation with Maytemperature was also lower; with May precipitation it wasof the same order of magnitude as that with May NAOindices. Similarly, the correlation with current Augustprecipitation and temperature in Norway were lower thanthe correlation with August NAO indices (M�kinen et al.2002). It is not clear whether NAO affects radialincrement by some other mechanisms in addition toaffecting temperature and precipitation.
Linderholm et al. (unpublished data) found lowcorrelations between Scots pine (Pinus sylvestris L.)chronologies sampled from central Norway, centralSweden and central Finland and the May and AugustNAO indices. In contrast, three chronologies fromNorway were negatively correlated with July NAOindices. Their chronologies sampled from Sweden andFinland were not correlated with the summer NAOindices, excluding one chronology from Sweden thatcorrelated positively with the June NAO indices (Linder-holm et al., unpublished data). Lindholm et al. (2001) alsofound that radial increment variation of Scots pine wasnot related to the summer NAO indices in southern andcentral Finland and in Russian Karelia. In contrast, theirchronologies sampled from northern Finland were posi-tively correlated with the summer NAO indices.
Fig. 4 Correlations betweencumulative temperature sum inMay to July and total annualtemperature sum and radial in-crement indices of each standplotted against the long-termmean temperature sum of themonth in question. For symbolsrefer to Fig. 1
179
The contradictory results between this study and thestudies cited above may, at least partly, be caused byspecies-specific reactions of Norway spruce and Scotspine to climatic factors. The correlation between thetemperature and the NAO indices also varies from regionto region and from season to season (Chen and Hellstr�m1999). Between September and March, the correlationcoefficients between temperature and the NAO indiceswere highest in southern Sweden, but between May andAugust they were highest in the northern parts. High andpositive correlation coefficient between temperature andthe NAO indices existed in autumn, winter and spring,while the correlation was low in summer (Chen andHellstr�m 1999). This indicates that the NAO indices are
not a good measure of the westerly winds in summer, atleast not in Sweden.
Even though the climate anomaly pattern associatedwith the NAO are more pronounced in winter than insummer, there are already studies that have explored thefeasibility of reconstructing winter NAO variability basedon tree-ring data. D’Arrigo et al. (1993) showed thatwinter NAO indices (December–February) were relatedto radial increment data of Scots pine in northern Finlandand southern Norway. Their radial increment chronolo-gies showed also positive correlation with winter tem-peratures in Oslo, southern Norway. When screening 36radial increment chronologies from western and northernEurope, Cook et al. (1998) observed that some Scots pinechronologies from Fennoscandia were positively, and oakchronologies from the British Isles negatively, correlatedwith winter NAO indices. The chronologies from Franceand Spain were not related to the winter NAO indices.Based on the observed relationship, they reconstructedpast NAO indices back to AD 1701. Glueck and Stockton(2001) also reconstructed past winter NAO indices mainlybased on Cedrus atlantica (Endl.) Manetti chronologiesfrom Morocco, but also on one Scots pine chronologyfrom northern Finland. Post and Stenseth (1999) alsodemonstrated that plant phenology was significantlyrelated to the winter NAO indices in Norway.
In this study, the winter NAO indices were not relatedto the Norway spruce chronologies from southwesternand eastern Germany. However, the chronologies fromnorthern Norway and Finland were significantly correlat-ed with the January and February NAO indices. It shouldbe noted that the correlations between the tree-ringchronologies of Norway spruce and winter NAO indiceswere negative, unlike in the studies of D’Arrigo et al.(1993) and Cook et al. (1998), who found positivecorrelations with tree-ring chronologies of Scots pinesampled from the same geographical region. Lindholm etal. (2001) also found that radial increment variation ofScots pine was positively correlated with the winter NAOindices at the forest limit in northern Finland. Linderholmet al. (unpublished data) found low correlations betweenScots pine chronologies and the January and FebruaryNAO indices in central Norway, Sweden and Finland.Only one chronology sampled from Finland was signif-icantly correlated with the January NAO. In contrast, theyfound that three out of ten chronologies were significantly(positively) correlated with the NAO indices of theprevious December.
In the previous analysis of this material, negativecorrelation of the same order of magnitude as those withthe January and February NAO indices were foundbetween the radial increment chronologies and wintertemperature and precipitation (M�kinen et al. 2002). InSweden, Jonsson (1969) also found that low temperaturein January and February appeared to be favourable forradial increment. In northern Norway, the mean temper-ature in January and February varies between –3 and –6�Cand in northern Finland between –12 and –14�C. Attemperatures as low as these, the metabolic functions of
Fig. 5 Correlations between the estimated date of the initiation ofgrowing season (A), the date of the cessation of growing season(B), and the length of growing season (C) and radial incrementindices of each stand plotted against the long-term mean values ofthe parameters in question. For symbols refer to Fig. 1
180
the trees are likely to be minimal, especially in northernFinland. Even though the relationship between theclimatic variability in winter and radial increment nearthe northern timberline may prove to be a valid interpre-tation of the data, some caution is still needed. While theresults of this study do not necessarily lessen the concernabout the detrimental effect of increasing winter temper-atures associated with the possible climate change innorthern Europe, it would have been more logical toexpect negative growth reactions to high winter temper-atures in central Europe.
On the other hand, anomalies of climate parametersassociated with extreme winter NAO episodes may persistand influence conditions in spring and summer (Rogersand van Loon 1979; Rogers 1990). Warmer periods inwinter associated with increased precipitation falling assnow could result in long lasting snow cover in spring.
Vaganov et al. (1999) suggested that near the northerntimberline in Siberia high winter precipitation could leadto delayed growth initiation. Thomsen (2001) alsoconcluded that in Ural Mountains high winter precipita-tion may have a negative effect on Scots pine growthduring the following summer. In contrast, Jalkanen (1990)and Kullman (1996) suggested that cold winters with thinsnow cover result in deep soil frost that may lead toneedle loss because of winter desiccation.
Recent intercomparisons reveal little agreement be-tween different proxy-based NAO reconstructions(Schmutz et al. 2000). This was the case for year-to-yearas well as for decadal scale variability. It should bestressed that the correlations observed in this study, aswell as in the studies cited above, do not describefunctional relationships between radial increment andclimatic variability. The results should be considered as
Fig. 6 Cross-correlation analy-sis between monthly NAO in-dices from April of previousyear to September of currentyear and radial increment in-dices from southwestern Ger-many (left) and easternGermany (right). Horizontallines are 0.05 significance lev-els. Within both regions, thesub-regions are presented fromhigh to low altitudes, fromabove downwards For the sub-regions refer to Table 1
181
observational. It is still unclear, whether the significantnegative correlation between the winter NAO indices andradial increment variation found in this study was causedby certain wintertime physiological processes of trees, orsome climatic events persisting into growing season, orwhether it was just a random event. More research isclearly needed to improve our understanding of how thefluctuations of winter conditions and NAO indices may be
reflected in increment variation of trees (cf. Cullen et al.2001).
Difficulties arise when attempting to examine therelationship between radial increment indices and differ-ent modes of climate variability. Radial increment doesnot respond directly to the variability of atmosphericcirculation, but instead reacts to its local influencethrough the effects of temperature, precipitation etc.
Fig. 7 Cross-correlation analy-sis between monthly NAO in-dices from April of previousyear to September of currentyear and radial increment in-dices from Norway (left) andFinland (right). Horizontal linesare 0.05 significance levels. C5highest and C4 lowest altitudein northern Norway, C3 highest,C2 intermediate, and C1 lowestaltitude in southern Norway; inFinland from northernmost (D4)to southernmost latitude (D1)
182
Several significant correlations were found between radialincrement indices and the other climatic teleconnectionpatterns. However, these correlations showed no logicalgeographical or temporal patterns. Furthermore, most ofthe teleconnection patterns used in this study are notprominent during the active radial growth period insummer. Therefore, their interpretation was even morequestionable than the interpretation of the NAO indices.When many correlations are calculated, it is likely thatsome significant correlations are found by chance. Asother studies on the relationship between these telecon-nection indices and increment variation are lacking, it washard to deduce whether the observed correlations werespurious or real.
In conclusion, the results of this study indicate that theradial increment of Norway spruce is strongly related totemperature in central and northern Europe. However, theradial increment reactions to higher than average temper-atures differed in different geographical regions. WarmMays will promote tree growth in all the regions, but highJune and July temperatures appear to be detrimental forradial increment in warm regions, where not enoughwater is available. Some factors synchronising radialincrement were common to the entire study area. Thecommon influencing factors may be related to theclimatic teleconnection patterns, especially to the NAO.However, our findings on the statistical link between theNAO and radial increment of Norway spruce differ fromthose reported in previous studies, which concentrated ondifferent tree species. Further studies are needed toproduce a more complete understanding of the effects oflarge-scale climatic oscillations on tree growth in Europe.
Acknowledgements We thank the field and laboratory assistantsfor their work during the study. The research was supported by theEuropean Union (Fair3-CT96-1310).
References
Barnston AG, Livezey RE (1987) Classification, seasonality andpersistence of low-frequency atmospheric circulation patterns.Monthly Weather Rev 15:1083–1126
Bednarz Z, Jaroszewicz B, Ptak J, Szwagrzyk J (1998–1999)Dendrochronology of Norway spruce [Picea abies (L.) Karst.]in the Babia G�ra national park, Poland. Dendrochronologia16–17:45–55
Box GEP, Jenkins GM, Reinsel GC (1994) Time series analysis –forecasting and control. Prentice Hall, Engelwood Cliffs, N.J.
Chen D, Hellstr�m C (1999) The influence of the North AtlanticOscillation on the regional temperature variability in Sweden:spatial and temporal variations. Tellus 51A:505–516
Cook ER, Peters K (1981) The smoothing spline: a new approach tostandardizing forest interior tree-ring width series for dendro-climatic studies. Tree-Ring Bull 41:45–53
Cook ER, D’Arrigo RD, Briffa KR (1998) A reconstruction of theNorth Atlantic Oscillation using tree-ring chronologies fromNorth America and Europe. Holocene 8:9–17
Cook ER, D’Arrigo RD, Mann ME (2002) A well-verified,multiproxy reconstruction of the winter North Atlantic Oscil-lation index since AD 1400. J Clim 15:1754–1764
Cullen HM, D’Arrigo RD, Cook ER (2001) Multiproxy recon-structions of the North Atlantic Oscillation. Paleoceanography16:27–39
D’Arrigo RD, Cook ER, Jacoby GC, Briffa KR (1993) NAO andsea surface temperatures in tree-ring records from the NorthAtlantic sector. Q Sci Rev 12:431–440
Dittmar C, Elling W (1999) Radial growth of Norway spruce andEuropean beech in relation to weather and altitude. ForstwissCentralbl 118:251–270
Eckstein D, Krause C, Bauch J (1989) Dendroecological investi-gations of spruce trees [Picea abies (L.) Karst.] of differentdamage and canopy classes. Holzforschung 43:411–417
Fritts HC (1976) Tree rings and climate. Academic Press, LondonFritts HC (1991) Reconstructing large-scale climatic patterns from
tree-ring data: a diagnostic analysis. University of ArizonaPress, Tucson
Gerstengarbe F-W, Werner PC, R�ge U (1999) Katalog derGroswetterlagen Europas (1881–1998) nach Paul Hess undHelmut Brezowsky. Potsdam Institute for Climate ImpactResearch, Germany. Internet edition: http://www.pik-pots-dam.de/~uwerner/gwl/welcome.htm
Glueck MF, Stockton CW (2001) Reconstruction of the NorthAtlantic Oscillation. Int J Climatol 21:1453–1465
Greatbatch RJ (2000) The North Atlantic Oscillation. StochasticEnviron Res Risk Assess 14:213–242
Haas U (1992) Grosswetter-Singularit�ten in Mitteleuropa: Ver�n-derungen im kollektiven Witterungsverlauf seit dem Ende des19. Jahrhunderts. M�nster Geograph Arb 35:1–240
Henttonen H (1990) Variation in the diameter growth of Norwayspruce in southern Finland. (in Finnish with English summary).PhD thesis. University of Helsinki, Finland
Hofgaard A, Tardif J, Bergeron Y (1999) Dendroclimatic responseof Picea mariana and Pinus banksiana along a latitudinalgradient in the eastern Canadian boreal forest. Can J For Res29:1333–1346
Holmes RL, Adams RK, Fritts HC (1986) Tree-ring chronologies ofwestern North America: California, eastern Oregon and north-ern Great Basin, with procedures used in the chronologydevelopment work, including users manuals for computerprograms COFECHA and ARSTAN. Laboratory of Tree-RingResearch, University of Arizona, Tucson. Chronol Ser No VI
Hurrell JW (1995) Decadal trends in the North Atlantic Oscillation:regional temperatures and precipitation. Science 269:676–679
Jalkanen R (1990) Root cold stress causing a premature yellowingof oldest Scots pine needles. In: Merrill W, Ostry ME (eds)Recent research on foliage diseases, conference proceedings.General Technical Report WO-56:34–37. USDA Forest Ser-vice, Washington, D.C.
Jones PD, J�nsson T, Wheeler D (1997) Extension to the NorthAtlantic Oscillation using early instrumental pressure observa-tions from Gibraltar and South-West Iceland. Int J Climatol17:1433–1450
Jones PD, New M, Parker DE, Martin S, Rigor IG (1999) Surfaceair temperature and its changes over the past 150 years. RevGeophys 37:173–199
Jonsson B (1969) Studies of variations in the widths of annual ringsin Scots pine and Norway spruce due to weather conditions inSweden. (in Swedish with English summary). Rapp UppsatsInst Skogsprod Skogsh�gsk 16:1–297
Kahle H-P (1994) Modelling growth-climate relationships ofNorway spruce in high elevations of the Black Forest. (inGerman with English summary). PhD thesis, University ofFreiburg, Germany
Kahle H-P, Spiecker H (1996) Adaptability of radial growth ofNorway spruce to climate variations: results of a site specificdendroecological study in high elevations of the Black Forest(Germany). Radiocarbon 38:785–801
Klaus D, Niemayer I, Paeth H, Poth A, Stein G, Vos M (1997)�nderungen der Zirkulationsstruktur im europ�isch-atlantis-chen Sektor und deren m�gliche Ursachen. Steiner, Stuttgart
183

Kullman L (1996) Recent cooling and recession of Norway spruce[Picea abies (L.) Karst.] in the forest-alpine tundra ecotone ofthe Swedish Scandes. J Biogeogr 23:843–854
Lindholm M, Eggertsson , Lovelius N, Raspopov O, Shumilov O,L��nelaid A (2001) Growth indices of North European Scotspine record the seasonal North Atlantic Oscillation. BorealEnviron Res 6:275–284
M�kinen H, N�jd P, Mielik�inen K (2000) Climatic signal inannual growth variation of Norway spruce [Picea abies (L.)Karst.] along a transect from central Finland to the Arctictimberline. Can J For Res 30:769–777
M�kinen H, N�jd P, Mielik�inen K (2001) Climatic signal inannual growth variation in damaged and healthy stands ofNorway spruce [Picea abies (L.) Karst.] in southern Finland.Trees 15:177–185
M�kinen H, N�jd P, Kahle H-P, Neumann U, Tveite B, Mielik�i-nen K, R�hle H, Spiecker H (2002) Radial growth variation ofNorway spruce [Picea abies (L.) Karst.] across latitudinal andaltitudinal gradients in central and northern Europe. For EcolManage (in press)
Meko D M, Cook ER, Stahle DW, Stockton CW, Hughes MK(1993) Spatial patterns of tree-growth anomalies in the UnitedStates and southeastern Canada. J Clim 6:1773–1786
Meyer FD, Br�ker OU (2001) Climate response in dominant andsuppressed spruce trees, Picea abies (L.) Karst. on a subalpineand lower montane site in Switzerland. Ecoscience 8:105–114
Mielik�inen K, Timonen M, N�jd P (1996) Growth variation ofScots pine and Norway spruce in Finland 1964–1993. (inFinnish). Folia For 1996:309–320
Miina J (2000) Dependence of tree-ring, earlywood and latewoodindices of Scots pine and Norway spruce on climatic factors ineastern Finland. Ecol Model 132:259–273
Mikola P (1950) On variations in tree growth and their significanceto growth studies. (in Finnish with English summary). CommunInst For Fenn 38(5):1–131
Ojansuu R, Henttonen H (1983) Estimation of local values ofmonthly mean temperature, effective temperature sum andprecipitation sum from the measurements made by the FinnishMeteorological Office. (in Finnish with English summary).Silva Fenn 17:143–160
Post E, Stenseth NC (1999) Climatic variability, plant phenology,and northern ungulates. Ecology 80:1322–1339
Post E, Forchhammer MC, Stenseth NC (1999) Population ecologyand the North Atlantic Oscillation (NAO). Ecol Bull 47:117–125
Rod� X, Baert E, Comin FA (1997) Variations in seasonal rainfallin southern Europe during the present century: relationshipswith the North Atlantic Oscillation and the El Nio-SouthernOscillation. Clim Dyn 13:275–284
Rogers JC (1990) Patterns of low-frequency monthly sea levelpressure variability (1899–1986) and associated wave cyclonefrequencies. J Clim 3:1364–1379
Rogers JC, van Loon H (1979) The seesaw in winter temperaturesbetween Greenland and northern Europe. II. Some oceanic andatmospheric effects in middle and high latitudes. MonthlyWeather Rev 107:509–519
Schmutz C, Luterbacher J, Gyalistras D, Xoplaki E, Wanner H(2000) Can we trust proxy-based NAO index reconstructions?Geophys Res Lett 27:1135–1138
Schweingruber FH, Briffa KR (1996) Tree-ring density networksfor climate reconstruction. In: Jones PD, Bradley RS, Jouzel J(eds) Climatic variations and forcing mechanisms of the last2000 years. Springer, Berlin Heidelberg New York, pp 43–66
Schweingruber FH, Br�ker OU, Sch�r E (1987) Temperatureinformation from a European dendroclimatological samplingnetwork. Dendrochronologia 5:9–33
Spiecker H (1991) Growth variation and environmental stresses:long-term observations on permanent research plots in South-western Germany. Water Air Soil Pollut 54:247–256
Thompson DWJ, Wallace JM (2001) Regional climate impacts ofthe Northern hemisphere annual mode and associated climatetrends. Science 293:85–89
Thomsen G (2001) Response to winter precipitation in ring-widthchronologies of Pinus sylvestris L. from the northwesternSiberian plain, Russia. Tree-Ring Res 57:15–29
Tranquillini W (1979) Physiological ecology of the Alpinetimberline. Springer, Berlin Heidelberg New York
Tuhkanen S (1984) A circumboreal system of climate phytogeo-graphical regions. Acta Bot Fenn 127:1–50
Vaganov EA, Hughes MK, Kirdyanov AV, Schweingruber FH,Silkin PP (1999) Influence of snowfall and melt timing on treegrowth in subarctic Eurasia. Nature 400:149–151
Van Loon H, Rogers JC (1978) The seesaw in winter temperaturesbetween Greenland and northern Europe. I. General descrip-tion. Monthly Weather Rev 106:296–310
Wallace JM, Gutzler DJ (1981) Teleconnections in the geopotentialheight field during the Northern Hemisphere winter. MonthlyWeather Rev 109:784–812
Worrall J (1973) Seasonal, daily, and hourly growth of height andradius in Norway spruce. Can J For Res 3:501–511
184


![A close-up view of wood structure and properties across a growth ring of Norway spruce ( Picea abies [L] Karst](https://static.fdokumen.com/doc/165x107/6314ef2c3ed465f0570b5bd7/a-close-up-view-of-wood-structure-and-properties-across-a-growth-ring-of-norway.jpg)