Odor Thresholds and Irritation Levels of Several Chemical ...
FREQUENCY DISCRIMINATION THRESHOLDS: THE EFFECT OF INCREMENT VERSUS
DECREMENT DETECTION OF FREQUENCY
Liat Kishon-Rabin, Daphne Ari-Even Roth, Batya Van Dijk, Tamar Yinon and Ofer Amir
Department of Communication Disorders, Sackler Faculty of Medicine, Tel Aviv University, Israel
ABSTRACT
Difference limen for frequency (DLF) is traditionally tested using a frequency increment detection paradigm in which listeners are requested to distinguish between a reference tone and a series of comparison tones of higher frequency. Sporadic findings indicated that an increment paradigm is not necessarily comparable to a decrement paradigm, in which the comparison tones are lower than the reference tone. The purpose of the present study was to test whether the ability to detect frequency increments is different from that of frequency decrements. DLFs of 16 young women were measured at 200 Hz and 1,000 Hz, using detection of both frequency increment and decrement paradigms. Results indicated that: (1) the frequency increment detection paradigm was significantly smaller (i.e., superior) to the decrement paradigm for the DLF task at 200 Hz, (2) for both frequencies, the number of participants who exhibited better DLF using the frequency increment detection paradigm was significantly larger than the number of those who had better DLFs using the frequency decrement paradigm, and (3) for both frequencies, strong correlations were found between DLFs obtained in the increment versus the decrement paradigms. These results have implications: (1) to studies whose subjects may have reduced sensitivities at fre-quencies higher than the reference tone (such as the hearing impaired),
Reprint requests to: Liat Kishon-Rabin, Ph.D., Department of Communication Disorders, The Chaim Sheba Medical Center, Tel-Hashomer, Israel 52621 e-mail: [email protected]
© F r e u n d Pub l i sh ing House Ltd., 2004 29 Brought to you by | Tel Aviv University (Tel Aviv University)Authenticated | 172.16.1.226
Download Date | 5/16/12 6:57 AM
Vol. 15, No. 1-2, 2004 Frequency Discrimination Thresholds: Effect of Increment vs Decrement Detection of Frequency
and (2) to models related to the role of auditory feedback on voice accuracy and to the underlying processes of frequency discrimination.
KEY WORDS
frequency discrimination, frequency difference limen, DLF, frequency increment, frequency decrement
INTRODUCTION
Frequency discrimination, that is, the ability to detect changes in frequency over time, has been investigated extensively (e.g., /1 -10/). The common procedure for estimating difference limen for frequency (DLF) consists of comparing tones of varying frequencies (comparison tones) to a fixed standard frequency (reference tone). Most of the published data in this area (with one exception 121) have utilized procedures in which the comparison tones exceeded that of the reference tone (e.g., /5-10/). Thus, in all these studies, subjects were required to detect an increment in frequency.
Surprisingly, the question of whether the decision to use increments or decrements in frequency directly affects frequency discrimination thresholds has not yet been addressed. This question is of interest for several reasons. A practical reason relates to the fact that hearing impaired individuals may yield poorer frequency discrimination thresholds (i.e., larger DLF thresholds) because of reduced sensitivity at higher frequencies. Although not stated specifically, we suspect that Tyler et al. 121, in their study of frequency discrimination in the hearing impaired, chose to measure the smallest detectable decrement in frequency due to this reason. They found that their control group of normal hearing subjects exhibited larger frequency discrimination thresholds than cited in the literature. The authors attributed these results to the heterogeneity of their subjects in terms of training and psychoacoustic abilities. Tyler et al. did not consider, however, the possibility that the discrepancy between their results and previous studies stemmed from the fact that their subjects were required to detect decrements in frequency, while all other studies evaluated detection of increments in frequency. The assumption that detecting
30 Brought to you by | Tel Aviv University (Tel Aviv University)Authenticated | 172.16.1.226
Download Date | 5/16/12 6:57 AM
L. Kishon-Rabin et al. Journal of Basic & Clinical Physiology & Pharmacology
decrements is comparable to detecting increments in frequency is, therefore, not trivial and requires a more systematic validation.
Another reason for our interest in the possible effect of direction on the ability to detect changes in frequency is related to the hypothesis that auditory ability, and specifically frequency discrimination thresholds, is related to accuracy of vocal production /11/. Amir et αϊ, for example, found that in a tone imitation task, subjects produced tones that were lower than the reference tones more often than tones higher than the reference tones / l l / . In an attempt to explain these results, the authors raised the possibility that subjects had poorer frequency discrimination abilities for frequencies lower than the target frequencies compared to frequencies that are higher than the target frequency. This, however, has not been previously investigated.
The purpose of the present study was, therefore, to test whether detection of increment versus decrement of frequency yield different frequency discrimination thresholds.
METHODS
Subjects
Sixteen women, with a mean age of 23 years (SD 2.3) participated in the study. All participants reported no previous musical training (less than 1 year), no experience in psychoacoustic testing, and no voice or singing training. All participants underwent hearing screening and had pure-tone air-conduction thresholds of less than 15 dB HL bilaterally at octave frequencies from 250-4,000 Hz /12/.
Stimuli
Stimuli consisted of two reference tones: 1,000 and 200 Hz. For each reference tone, two sets of 20 comparison tones were generated. For the 1,000 Hz reference tone, one set of comparison stimuli varied from 1,001 to 1,020 Hz in 1 Hz steps (regarded as the DLF 'incre-ment' paradigm). The other set varied from 980 to 999 Hz in 1 Hz steps (regarded as the DLF 'decrement' paradigm). For the 200 Hz reference tone, one set of comparison stimuli varied from 200.5 to 210 Hz in 0.5 Hz steps (DLF 'increment' paradigm) and the other set varied from 190 to 199.5 Hz in 0.5 Hz steps (DLF 'decrement'
31 Brought to you by | Tel Aviv University (Tel Aviv University)
Authenticated | 172.16.1.226Download Date | 5/16/12 6:57 AM
Vol. 15, No. 1-2, 2004 Frequency Discrimination Thresholds: Effect of Increment vs Decrement Detection of Frequency
paradigm). Prior to testing, listeners were trained using the 1,000 Hz reference tone with two additional sets of comparison tones: one set varied from 1,002 to 1,040 Hz in 2 Hz steps (for training of the DLF 'increment' paradigm) and the second set varied and from 960 to 998 Hz in 2 Hz steps (for the training of the DLF 'decrement" paradigm). The duration of each stimulus was 300 ms, with a steady state portion of 250 ms and 25 ms rise/fall cosine ramps. Stimuli were digitally generated at a sampling rate of 22,050 Hz and 16-bit using a sound-editing program (Sound Forge 6.0), and were stored on the hard disk of the computer.
The frequency response of the headphone (TDH-50) was measured using a Bruel & Kjaer sound-lever meter (Model 2209). This was done to discount the possibility that intensity changes of 1 dB or more may cue frequency differences for the reference tone of 200 Hz due to limitations of the equipment. Measurements showed a relatively flat frequency response within the range of 80-15,000 Hz with intensity differences of less than 1 dB at the 200 Hz frequency region.
Procedure
For each reference tone, the frequency discrimination threshold was estimated using a three-interval, three alternative forced-choice adaptive procedure. Each presentation (trial) consisted of three stimuli: two identical reference tones and one comparison tone. The comparison tone was presented randomly as either first, second or third in the sequence. A visual marker on the computer monitor accompanied each audio presentation. The subjects were required to identify the different stimulus among the three. A two-down, one-up rule was used to estimate the frequency difference corresponding to 71% correct point on the psychometric function /13/.
The first trial consisted of the reference and comparison tones differing by the largest step size. For example, the first trial of the training of DLF increment task was 1,000, 1,000, 1,040 Hz. In this example, DLF, that is the difference between the reference and the comparison tones, was 40 Hz. After two consecutive correct responses, DLF was decreased. In contrast, after an incorrect response, DLF was increased. In each turning point of the decrease/increase, DLF was reduced until a minimal step size was reached (with a minimum size of 2 Hz for the training sets, 0.5 Hz for 200 Hz, and
32 Brought to you by | Tel Aviv University (Tel Aviv University)Authenticated | 172.16.1.226
Download Date | 5/16/12 6:57 AM

L. Kishon-Rabin et al. Journal of Basic & Clinical Physiology & Pharmacology
1 Hz for 1,000 Hz). Threshold was calculated as the geometric mean of the DLFs of eight turn-points at minimal step size.
Each subject was seated in a sound-treated room and listened to the stimuli, transmitted via GSI-61 audiometer and presented binaurally through headphones (TDH 50) at 65 dB HL for 1,000 Hz and at 70 dB HL for 200 Hz. Signal presentation, subject response, feedback and scoring were under software control (Psycho software, by Arthur Boothroyd). For each subject, training and testing lasted approxi-mately 1 hour. A 10-minute break was given to each subject after the first 30 minutes of the procedure. After training, a total of three threshold estimates was obtained for each reference tone at each paradigm. The order of reference tones (200 Hz, 1,000 Hz) and conditions (DLF increment, DLF decrement) were counterbalanced across subjects.
RESULTS
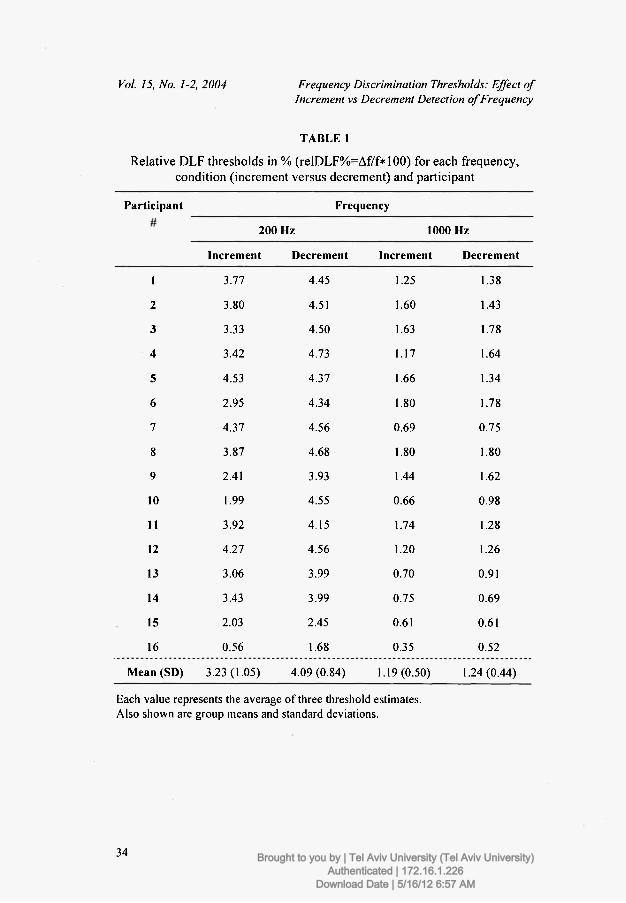
The raw results, in DLF, were transformed to relative DLF thresholds in percent (relDLF% = DLF/f* 100). A repeated-measures analysis of variance was conducted on the transformed data, in order to test the main effects of learning (during three threshold repetitions), frequency (200 and 1,000 Hz) and paradigm ('increment' versus 'decrement'). Results showed no statistically significant difference among the three thresholds obtained (p >0.05), indicating no signifi-cant learning effect. Based on this conclusion, all three thresholds were averaged for each participant at each testing paradigm and frequency, and were regarded as the representing thresholds. The mean data for each individual participant for the different test conditions are shown in Table 1.
The distribution of the mean relative DLF thresholds for each reference frequency and for the two test paradigms is illustrated in Figure 1. In this box plot graph, the box represents the inter-quartile range, which contains 50% of all values. The line within the box marks the median, the whiskers above and below the box extend to the 90th and 10Ih percentiles and the outlying data are graphed as filled circles. Mean frequency discrimination threshold for the 200 Hz reference tone (relDLF% = 3.66) was three times larger than for the 1,000 Hz tone (relDLF% = 1.21). Statistical analysis confirmed a significant main effect for Frequency (F( 1,12) = 156.2, ρ <0.0001).
33 Brought to you by | Tel Aviv University (Tel Aviv University)Authenticated | 172.16.1.226
Download Date | 5/16/12 6:57 AM
Vol. 15, No. 1-2, 2004 Frequency Discrimination Thresholds: Effect of Increment vs Decrement Detection of Frequency
TABLE 1
Relat ive D L F thresholds in % ( r e l D L F % = A f / f * 1 0 0 ) for each f r equency , condi t ion ( increment versus decrement ) and part icipant
Participant Frequency
200 Hz 1000 Hz
Increment Decrement Increment Decrement
1 3.77 4.45 1.25 1.38
2 3.80 4.51 1.60 1.43
3 3.33 4.50 1.63 1.78
4 3.42 4.73 1.17 1.64
5 4.53 4.37 1.66 1.34
6 2.95 4.34 1.80 1.78
7 4.37 4.56 0.69 0.75
8 3.87 4.68 1.80 1.80
9 2.41 3.93 1.44 1.62
10 1.99 4.55 0.66 0.98
11 3.92 4.15 1.74 1.28
12 4.27 4.56 1.20 1.26
13 3.06 3.99 0.70 0.91
14 3.43 3.99 0.75 0.69
15 2.03 2.45 0.61 0.61
16 0.56 1.68 0.35 0.52
Mean (SD) 3.23 (1.05) 4.09 (0.84) 1.19(0.50) 1.24 (0.44)
Each value represents the average of three threshold estimates. Also shown are group means and standard deviations.
34 Brought to you by | Tel Aviv University (Tel Aviv University)Authenticated | 172.16.1.226
Download Date | 5/16/12 6:57 AM

L. Kishon-Rabin et al. Journal of Basic & Clinical Physiology & Pharmacology
c
5.0
4.5 -
4.0 -
3.5
• • . . ...
Uj Ο 3.0 Η
Q I 2.5 -\ φ LL > ^ 2 0
9 . JP 1.5 Φ
Qί 1.0 -I
.5
0.0
decrement increment decrement increment ^ paradigm J paradigm J
Reference Tone= 2 0 0 ^ 7 1 θ 0 θ Υ ί ζ ~
τ — —
1
Fig. 1: Distribution of the subjects' mean frequency discrimination thresholds, in re/DLF% (DLF/f*100), for the reference frequencies 200 and 1,000 Hz, each at the 'increment' and 'decrement' paradigms. The box represents the inter-quartile range, which contains 50% of values. The line within the box marks the median, the whiskers above and below the box extend to the 90th
and 10th percentiles, and the outlying data are graphed as filled circles.
Further inspection of the data shows that listeners had a wider range of values for the 200 Hz task, in comparison with the 1,000 Hz, regardless of testing paradigm. Accordingly, standard deviations for the 200 Hz task were markedly larger than for the 1,000 Hz task (1.05 and 0.84 versus 0.5 and 0.44 for the 'increment' and 'decrement' paradigms, respectively). In a test for equality-of-variance, these differences were found to be statistically significant (p <0.05).
The statistical analysis also showed a significant Paradigm effect (F(l ,12) = 24.18, ρ = 0.0004) where the relDLF% for the 'decrement' paradigm was greater than for the 'increment' (2.21 vs 2.66, respectively), and a significant Frequency χ Paradigm interaction (F(l,12) = 42.02, ρ <0.0001). Contrast analysis revealed that the
35 Brought to you by | Tel Aviv University (Tel Aviv University)Authenticated | 172.16.1.226
Download Date | 5/16/12 6:57 AM
Vol. 15, No. 1-2, 2004 Frequency Discrimination Thresholds: Effect of Increment vs Decrement Detection of Frequency
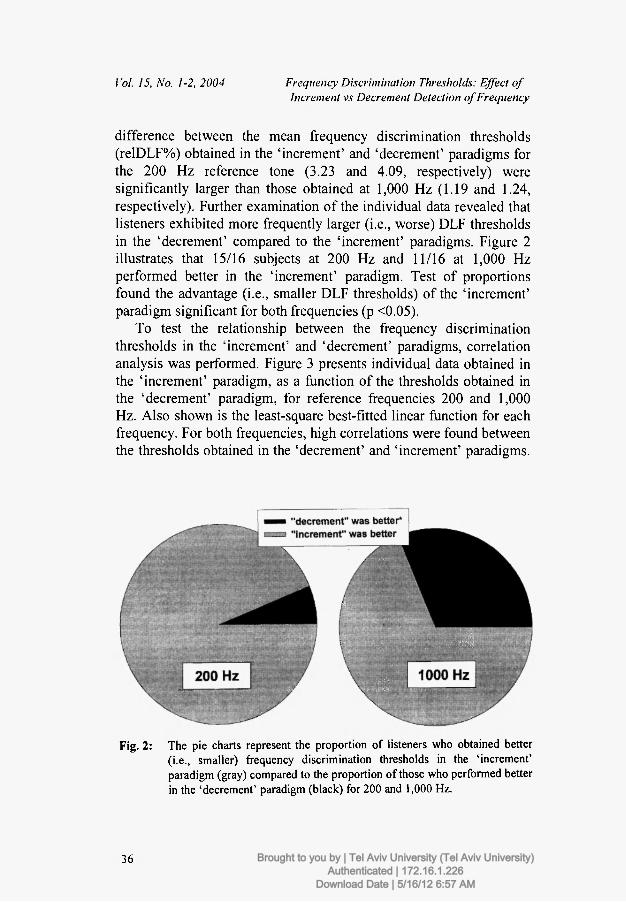
difference between the mean frequency discrimination thresholds (relDLF%) obtained in the 'increment' and 'decrement' paradigms for the 200 Hz reference tone (3.23 and 4.09, respectively) were significantly larger than those obtained at 1,000 Hz (1.19 and 1.24, respectively). Further examination of the individual data revealed that listeners exhibited more frequently larger (i.e., worse) DLF thresholds in the 'decrement' compared to the 'increment' paradigms. Figure 2 illustrates that 15/16 subjects at 200 Hz and 11/16 at 1,000 Hz performed better in the 'increment' paradigm. Test of proportions found the advantage (i.e., smaller DLF thresholds) of the 'increment' paradigm significant for both frequencies (p <0.05).
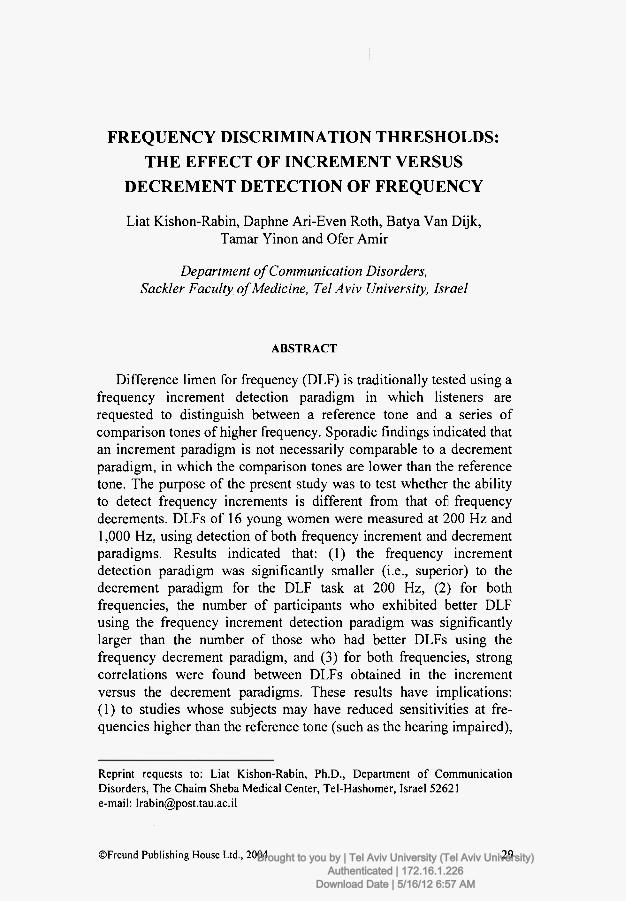
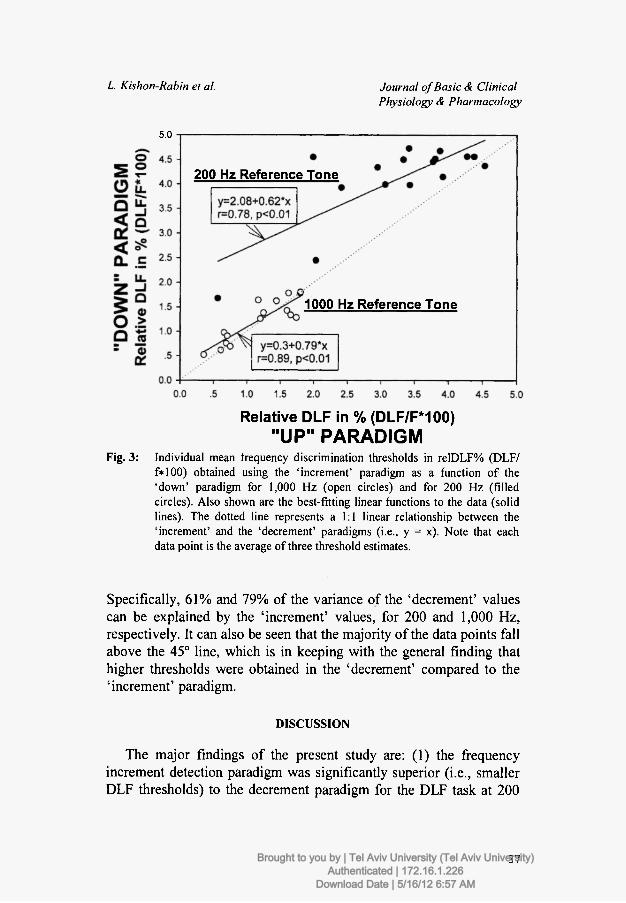
To test the relationship between the frequency discrimination thresholds in the 'increment' and 'decrement' paradigms, correlation analysis was performed. Figure 3 presents individual data obtained in the 'increment' paradigm, as a function of the thresholds obtained in the 'decrement' paradigm, for reference frequencies 200 and 1,000 Hz. Also shown is the least-square best-fitted linear function for each frequency. For both frequencies, high correlations were found between the thresholds obtained in the 'decrement' and 'increment' paradigms.
Fig. 2: The pie charts represent the proportion of listeners who obtained better (i.e., smaller) frequency discrimination thresholds in the 'increment' paradigm (gray) compared to the proportion of those who performed better in the 'decrement' paradigm (black) for 200 and 1,000 Hz.
36 Brought to you by | Tel Aviv University (Tel Aviv University)Authenticated | 172.16.1.226
Download Date | 5/16/12 6:57 AM
L. Kishon-Rabin et al. Journal of Basic & Clinical Physiology & Pharmacology
5.0
200 Hz Reference Tone
1000 Hz Reference Tone
Relative DLF in % (DLF/F*100) "UP" PARADIGM
Fig. 3: Individual mean frequency discrimination thresholds in relDLF% (DLF/ f*100) obtained using the 'increment' paradigm as a function of the 'down' paradigm for 1,000 Hz (open circles) and for 200 Hz (filled circles). Also shown are the best-fitting linear functions to the data (solid lines). The dotted line represents a 1:1 linear relationship between the 'increment' and the 'decrement' paradigms (i.e., y = x). Note that each data point is the average of three threshold estimates.
Specifically, 61% and 79% of the variance of the 'decrement' values can be explained by the 'increment' values, for 200 and 1,000 Hz, respectively. It can also be seen that the majority of the data points fall above the 45° line, which is in keeping with the general finding that higher thresholds were obtained in the 'decrement' compared to the 'increment' paradigm.
DISCUSSION
The major findings of the present study are: (1) the frequency increment detection paradigm was significantly superior (i.e., smaller DLF thresholds) to the decrement paradigm for the DLF task at 200
37 Brought to you by | Tel Aviv University (Tel Aviv University)Authenticated | 172.16.1.226
Download Date | 5/16/12 6:57 AM
Vol. 15, No. 1-2, 2004 Frequency Discrimination Thresholds: Effect of Increment v.s Decrement Detection of Frequency
Hz, (2) for both frequencies, the number of participants who exhibited better DLF using the frequency increment detection paradigm was significantly larger than the number of those who had better DLFs using the frequency decrement paradigm, and (3) there was a signi-ficant relationship between DLFs obtained in the increment versus the decrement paradigms.
The finding that the average relDLF% was significantly poorer only for the decrement paradigm at 200 Hz (and not for both frequencies) raises the possibility of a methodological effect that could have confounded the results for a particular frequency. A possible factor that may have influenced the results at 200 Hz is related to the amplitude cues that are the result of the frequency response of the headphone, especially at the very low frequencies. This possibility, however, had been tested and ruled out prior to the study (see Methods). On the other hand, the fact that the average DLF threshold measured here at 200 Hz (3.23) is in agreement with other studies at 250 Hz (e.g., 3.38 found by Kishon-Rabin et al. 161) contributes to the validation of the present data. Furthermore, the finding that for both frequencies, the majority of the participants exhibited better DLF values in the increment paradigm compared to the decrement para-digm suggests that there may indeed be an effect of the direction of frequency detection, and that increment detection is superior to decrement detection. Future studies investigating detection of incre-ment versus decrement of frequency in a wider range of frequencies may shed light on this issue.
The notion that asymmetries can occur when measuring minimal frequency changes in different directions derives from data showing asymmetry in the shape of a hypothetical auditory filter 714/ and in the pattern of excitation on the basilar membrane 111. Specifically, the slope of the low-frequency end is known to be steeper than the high-frequency end /7,15/. Models have been developed based on these asymmetries to explain frequency discrimination abilities. Zwicker, for example, in his 'place' model, suggested that changes in the excitation pattern evoked by the frequency change are detected at the point of the steepest slope, i.e., at the low-frequency edge of the excitation pattern /15/. Thus, it is possible that these asymmetries can influence the DLF when the direction of the frequency of the com-parison tones is changed. This line of reasoning, however, requires further investigation.
38 Brought to you by | Tel Aviv University (Tel Aviv University)Authenticated | 172.16.1.226
Download Date | 5/16/12 6:57 AM
L. Kishon-Rabin et al. Journal of Basic & Clinical Physiology ά Pharmacology
The information obtained in the present study may have interesting implications regarding the role of auditory feedback on vocal accuracy. There are data to suggest a relationship between auditory capabilities and vocal production /11,16-19/. Amir et al. / I I / , for example, reported that subjects with superior frequency discrimination thresholds showed accurate vocal production, although the reverse relationship did not hold true. The authors also reported that 72% of vocal productions were produced at frequencies lower than the target frequencies. They offered a possible explanation that subjects had poorer (i.e., larger) DLFs for frequencies lower than the target fre-quency compared to frequencies that are higher than the target frequency. The findings of the present study are in agreement with this explanation although further research is required.
Finally, the general finding of a linear relationship of the DLFs between the two paradigms (increment and decrement frequency detection) suggests that there is a common underlying process that affects frequency discrimination regardless of the direction of the comparison tones. In order to establish whether indeed the detection of increment in frequency is superior to the detection of decrement, future studies should involve a wider range of frequencies and additional DLF paradigms, such as two-interval forced choice (in which the listener would have to state which is the higher or the lower of the two frequencies), same/different, and modulation methods. It is also possible that more sensitive measures, such as reaction time and electrophysiological indices, may better reflect the difficulties that listeners may encounter in a specific paradigm /20/.
A C K N O W L E D G E M E N T S
We are grateful to Emma Sachratov and Shaul Nissim for their technical assistance and to Eti Shabtai for data analyses.
REFERENCES
1. Moore BCJ, Peters RW. Pitch discrimination and phase sensitivity in young and elderly subjects and its relationship to frequency selectivity. J Acoust Soc Am 1992;91:2881-2893.
39 Brought to you by | Tel Aviv University (Tel Aviv University)Authenticated | 172.16.1.226
Download Date | 5/16/12 6:57 AM

Vol. 15, No. 1-2, 2004 Frequency Discrimination Thresholds: Effect of Increment vs Decrement Detection of Frequency
2. Tyler RS, Wood EJ, Fernandez M. Frequency resolution and discrimination of constant and dynamic tones in normal and hearing-impaired listeners. J Acoust S o c A m 1983; 74: 1190-1199.
3 .Jes teadt W, Sims SL. Decision process in frequency discrimination. J Acoust Soc A m 1975; 57: 1161-1168.
4. Jesteadt W, Wier CC, Green DM. Frequency discrimination as a function of f requency and sensation level. J Acoust Soc Am 1977; 61: 178-185.
5. Sek A, Moore BCJ. Frequency discrimination as a function of f requency, measured in several ways. J Acoust Soc Am 1995; 97: 2479-2486.
6. Kishon-Rabin L, Amir O, Vexier Y, Zaltz Y. Pitch discrimination: Are profes-sional musicians better than non-musicians? J Basic Clin Physiol Pharmacol 2001; 12: 125-143.
7. Moore BCJ. Frequency difference l imens for short duration tones. J Acoust Soc A m 1973; 54: 610-619.
8. Delhommeau K, Micheyl C, Jouvent R, Collet L. Transfer of learning across durations and ears in auditory frequency discrimination. Percept Psychophys 2002; 64: 426-436.
9. Ari-Even Roth D, Amir O, Alaluf L, Buchsenspanner S, Kishon-Rabin L. The effect of training on frequency discrimination: generalization to untrained frequencies and to the untrained ear. J Basic Clin Physiol Pharmacol 2003; 14: 137-150.
10. Demany L, Semal C. Learning to perceive pitch differences. J Acoust Soc Am 2002; 111: 1377-1388.
11. Amir O, Amir N, Kishon-Rabin L. The effect of superior auditory skills on vocal accuracy. J Acoust Soc Am 2003; 113: 1102-1108.
12. ANSI Specifications for Audiometers. New York: ANSI, 1989. 13. Levitt H. Transformed up-down methods in psychoacoustics. J Acoust Soc Am
1 9 7 1 ; 4 9 : 4 6 7 - 4 7 7 . 14. Moore BCJ. An introduction to the psychology of hearing. San Diego, CA:
Academic Press, 1989; 159-167. 15. Zwicker Ε. Masking and psychological excitation as consequences of the ea r ' s
f requency analysis. In: Plomp R, Smoorenburg GF, eds. Frequency Analysis and Periodicity Detection. Leiden: Sij thoff, 1970.
16. Elman J. Effects of frequency-shif ted feedback on the pitch of vocal produc-tions. J Acoust Soc Am 1981; 70: 45-50.
17. Kishon-Rabin L, Taitelbaum R, Tobin Y, Hildesheimer Μ. The effect of partially restored hearing on speech production of postlingually deafened adults with cochlear implants. J Acoust Soc Am 1999; 106: 2843-2857.
18. Lane H, Tranel B. The Lombard sign and the role of hearing in speech. J Speech Hear Res 1971; 14: 677-709.
19. Jones J, Munhall KG. Perceptual calibration of F0 production: evidence from feedback perturbation. J Acoust Soc Am 2000; 108: 1246-1251.
20. Novitski N, Tervaniemi M, Huotilainen M, Naatanen R. Frequency discrimina-tion at different frequency levels as indexed by electrophysiological and behavioral measures. Cogn Brain Res 2004; 20: 26-36.
40 Brought to you by | Tel Aviv University (Tel Aviv University)Authenticated | 172.16.1.226
Download Date | 5/16/12 6:57 AM
Copyright © 2022 FDOKUMEN