Bagnasco High Frequency News
24
Cuaderno de Economía • Publicación del Departamento de Economía, Facultad de Ciencias Empresariales, Universidad Católica del Uruguay • ISSN 1688-3519 N. o 4 • Diciembre de 2009 Abstract. Using six years of high-frequency (tick) foreign exchange spot quotes between January 2003 and June 2008, as well as economic announcement schedules from G7-countries, we study the effect of the most relevant macroeconomic data releases on EURUSD, GBPUSD, USD/JPY, USDCHF, AUDUSD, USDCAD, EURGBP and EURJPY. Tick frequency, volatility indicators and average market- maker spreads were considered. The hypothesis about the important impacts of economic announce- ments over exchange rates, as well as the lack of a reliable and quantitatively-based extensive classi- fication of these announcements were the main drivers of our research. We confirm the importance of some of the most influential announcements for each of the G-7 countries. We also validate the practice of certain hedge fund managers of staying position-neutral during certain major data re- leases in order to avoid exposure to excessive volatility, as well as supplying hedge funds/risk manag- ers, traders and market practitioners with a detailed «data release catalogue» for supporting their risk management decisions. Finally, clean and reliable datasets become now available for future re- search, removing the entry barriers researchers’ usually face in this area. Keywords: ECONOMIC ANNOUNCEMENTS / TICK DATA / FOREIGN EXCHANGE MARKET (FOREX) / NEWS / TRADING / DATA RELEASES. Resumen. Empleando datos de tipo de cambio spot de alta frecuencia (tick) entre enero de 2003 y junio de 2008, así como calendarios de difusión de información económica de países del G-7, se estu- dia el efecto de estos anuncios sobre las cotizaciones de seis pares de monedas empleando variables como la frecuencia de ticks, indicadores de volatilidad y spreads. Las principales motivaciones para este estudio son la importancia del impacto de los anuncios de información económica sobre las cotizaciones y la falta de clasificaciones extensivas de indicadores de anuncios económicos basados en datos cuantitativos, provenientes de fuentes confiables. El estudio confirma la existencia de im- pacto de los principales indicadores sobre los tipos de cambio del G-7. Asimismo, se valida la práctica de gestión de riesgos aplicada por algunos Hedge Funds, bajo la cual neutralizan sus posiciones de mercado durante la emisión de importantes anuncios, a fin de evitar su exposición a volatilidades at Hedge Funds, Brokerage Companies and consulting firms; visiting professor/lecturer of International Finance/ Derivatives at the Catholic University, Uruguay, financial trainer/consultant for banks and financial companies in the fields of Derivatives/FX Markets/Quantitative Trading & Hedge Funds, ‹[email protected]›. ** Nicolás Sánchez. B.Sc. in Economics – Catholic University, Uruguay, ‹[email protected]›. ***Juan Sapriza. B.Sc. in Economics – Catholic University, * Andrés A. Bagnasco. Master in Data Mining / Statistical Learning – UNED, Madrid, Spain, Postgraduate Degree in Finance – UDELAR University, Uruguay, Chemical Engineer – UDELAR University – Developer/Quant - Occupied several positions as Risk Manager, Senior Quant Analyst and Trader The effect of Economic Data Releases on Foreign Exchange Markets based on high frequency data Andrés A. Bagnasco,* Nicolás Sánchez** y Juan C. Sapriza***
Transcript of Bagnasco High Frequency News

Cuaderno de Economía • Publicación del Departamentode Economía, Facultad de Ciencias Empresariales,
Universidad Católica del Uruguay • ISSN 1688-3519N.o 4 • Diciembre de 2009
Abstract. Using six years of high-frequency (tick) foreign exchange spot quotes between January2003 and June 2008, as well as economic announcement schedules from G7-countries, we study theeffect of the most relevant macroeconomic data releases on EURUSD, GBPUSD, USD/JPY, USDCHF,AUDUSD, USDCAD, EURGBP and EURJPY. Tick frequency, volatility indicators and average market-maker spreads were considered. The hypothesis about the important impacts of economic announce-ments over exchange rates, as well as the lack of a reliable and quantitatively-based extensive classi-fication of these announcements were the main drivers of our research. We confirm the importanceof some of the most influential announcements for each of the G-7 countries. We also validate thepractice of certain hedge fund managers of staying position-neutral during certain major data re-leases in order to avoid exposure to excessive volatility, as well as supplying hedge funds/risk manag-ers, traders and market practitioners with a detailed «data release catalogue» for supporting theirrisk management decisions. Finally, clean and reliable datasets become now available for future re-search, removing the entry barriers researchers’ usually face in this area.
Keywords: ECONOMIC ANNOUNCEMENTS / TICK DATA / FOREIGN EXCHANGE MARKET (FOREX) / NEWS / TRADING/ DATA RELEASES.
Resumen. Empleando datos de tipo de cambio spot de alta frecuencia (tick) entre enero de 2003 yjunio de 2008, así como calendarios de difusión de información económica de países del G-7, se estu-dia el efecto de estos anuncios sobre las cotizaciones de seis pares de monedas empleando variablescomo la frecuencia de ticks, indicadores de volatilidad y spreads. Las principales motivaciones paraeste estudio son la importancia del impacto de los anuncios de información económica sobre lascotizaciones y la falta de clasificaciones extensivas de indicadores de anuncios económicos basadosen datos cuantitativos, provenientes de fuentes confiables. El estudio confirma la existencia de im-pacto de los principales indicadores sobre los tipos de cambio del G-7. Asimismo, se valida la prácticade gestión de riesgos aplicada por algunos Hedge Funds, bajo la cual neutralizan sus posiciones demercado durante la emisión de importantes anuncios, a fin de evitar su exposición a volatilidades
at Hedge Funds, Brokerage Companies and consulting firms;visiting professor/lecturer of International Finance/Derivatives at the Catholic University, Uruguay, financialtrainer/consultant for banks and financial companies in thefields of Derivatives/FX Markets/Quantitative Trading & HedgeFunds, ‹[email protected]›.** Nicolás Sánchez. B.Sc. in Economics – Catholic University,Uruguay, ‹[email protected]›.***Juan Sapriza. B.Sc. in Economics – Catholic University,
* Andrés A. Bagnasco. Master in Data Mining / StatisticalLearning – UNED, Madrid, Spain, Postgraduate Degree inFinance – UDELAR University, Uruguay, Chemical Engineer –UDELAR University – Developer/Quant - Occupied severalpositions as Risk Manager, Senior Quant Analyst and Trader
The effect of Economic Data Releases on ForeignExchange Markets based on high frequency data
Andrés A. Bagnasco,* Nicolás Sánchez** y Juan C. Sapriza***
8 CUADERNO DE ECONOMÍA • 4
Objectives
The objective of this paper is to analyze theimpact of data releases over G-7 currency spotforeign exchange rates, based on high-fre-quency quotes (tick) data. The results couldvalidate the risk management practice carriedout by some hedge fund managers (e.g. Capri-corn FX) which consists in being market-neu-tral or off-the-market during the release of cer-tain important data/news in order to avoidbeing exposed to unnecessary volatility.
In order to reach this objective, this workdemands, and faces the challenge of creatingan empirical knowledge base or “catalog” ofeconomic indicators in order to aid hedge fundmanagers, risk managers and market practi-tioners in the decision-making process ofwhether to be or not in the market during suchevents. This roadmap is valuable as closingpositions before every data release naturallyimplies trading costs (liquidity/spreads, com-missions, opportunity costs, etc.).
Additionally, as consequence of the meticu-lous sorting of economic announcements, theacademic/research community now has thepossibility to access to a clean and reliablesource of information for future research efforts.
1. Introduction
The Foreign Exchange market is the biggestmarket in the world, according to the latest Tri-ennial Foreign Exchange Survey (BIS, 2007),over 3.2 billion dollars are traded on averageevery day. High-frequency traders and hedgefunds represent an increasing portion of it. It isa distributed Over The Counter (OTC) globalmarket; spot transactions account for approxi-mately 31% of the overall 2007 turnover.
According to the latest BIS survey (BIS, 2007),a few currencies (US Dollar [USD], Japanese Yen[JPY], Euro [EUR], Great Britain Pound [GBP], SwissFranc [CHF], Canadian Dollar [CAD] & Austral-ian Dollar [AUD]) known as G-7 account for
excesivas. Se presenta una herramienta o «catálogo de anuncios» de suma utilidad para gerentes deriesgo, especuladores y gerentes de fondos, con el fin de asistirlos en la toma de decisiones/gestiónde riesgos. Finalmente, se ponen a disposición de la comunidad académica fuentes de datos de altacalidad para futuras investigaciones.
Palabras clave: ECONOMIC ANNOUNCEMENTS / TICK DATA / FOREIGN EXCHANGE MARKET (FOREX) / NEWS /TRADING / DATA RELEASES.
0
500
1000
1500
2000
2500
3000
3500
1992 1995 1998 2001 2004 2007 -30
-20
-10
0
10
20
30
40
50
60
70
80
1995 1998 2001 2004 2007
Charts 1 & 2
Daily Volume (USD Billions) Volume Variation (%)*
Source: BIS (2007). * Variation vs. previous triennial survey.
A. A. BAGNASCO, N. SÁNCHEZ Y J. C. SAPRIZA • THE EFFECT OF ECONOMIC DATA RELEASES… 9
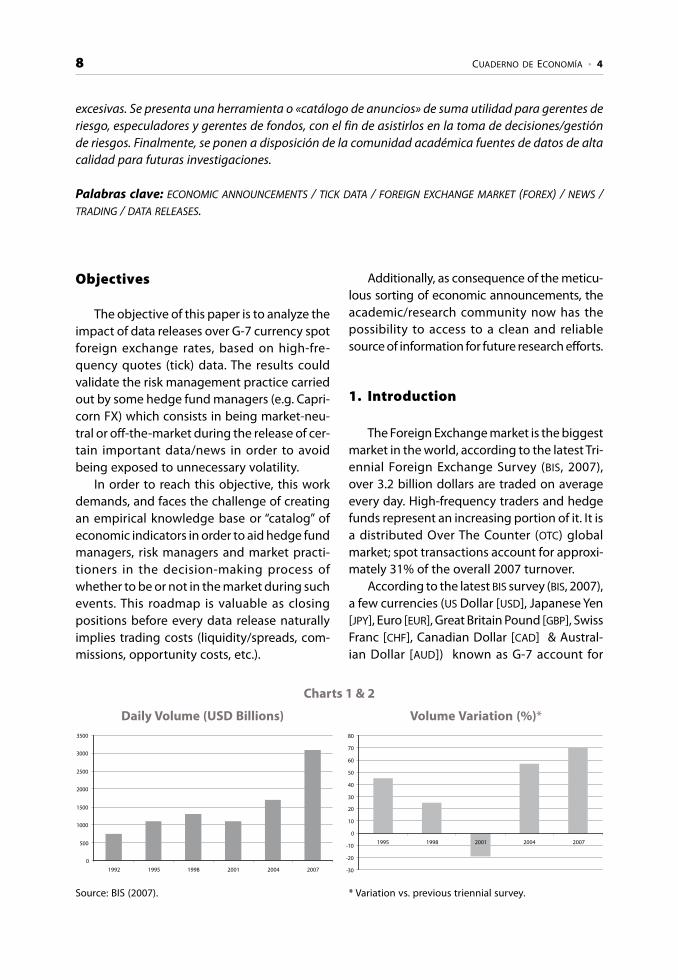
roughly 75% of the worldwide Foreign Ex-change (FX) market share. Market opens onSundays at about 5 PM EST, when New Zealandand Australian banks open; liquidity suddenlydrops on Fridays at 5 PM EST as US banks close.The market remains open 24 hours a day butpresenting a typical intraday and weekly sea-sonality well known in the academic commu-nity (i.e. Guençay et al., 2001). In the 80’s themarket was exclusively reserved to banks andfinancial companies as well as institutionaltraders, being the usual trade size in the orderof 5-10 million USD. IT (Information technolo-gies) evolution such as STP (straight thoughprocessing), Internet, as well as the entranceof new participants, lowered, the entry barri-ers in the 90’s now being a market accessibleat the retail level with competitive transactioncosts.
The bibliographic research conducted (de-tails further) reveals that releases have signifi-cant impact over exchange rates, volatilitiesand the number of quotes per unit of time (alsoknown as tick frequency). News is defined inthe bibliography (Parker, 2007) as the differ-ence between market expectations and actu-
al figures communicated during the data re-lease. We will adopt this definition throughoutthis paper.
For relevant data releases news severelyimpact exchange rates thus creating risks forthose who stay in the market during the an-nouncement. Systematic traders such as highfrequency/quantitative traders mostly rely ontechnical analysis tools enhanced by quantita-tive methodologies/technology. Technicalanalysis (as well as quantitative analysis) typi-cally rely on past historical prices and volumedata (where available) in order to generateforecasts and/or trading signals which formpart of their alpha models. Data releases some-times present extreme events; due to the short,rare and intense nature of these events, it isunlikely that their models hold true during re-leases leading to what it is known as model risk.
Unlike Black Swans – term coined by Nas-sim N. Taleb in his book The Black Swan (Zwick,2007) –, data releases present one unique na-ture: they are scheduled beforehand; hencemarket participants may decide whether theyeither want to be in the market or hedge/off-set their positions. Of course the variable
Chart 3Forex Market Concentration
Source: BIS-2007 Foreign Exchange Triennial Bank Survey.
10 CUADERNO DE ECONOMÍA • 4
“news” presents a stochastic behavior (i.e.getting out of the market minutes before a datarelease may lead to a cost (at least the spreadand/or commission) and there is no guaranteethat news will finally occur), but for the mostpart releases are precisely scheduled and pub-licly known in advance. Of course events suchas Sep11th terrorist attacks, or unscheduleddata releases made available during speechesmay also have extreme impacts but they arepart of the risks of being in the market (andunder such circumstances they could perfect-ly be called “Black Swans”). FX being the mostliquid market available, during data releasesparticipants become exposed to certain riskssuch as (but not limited to):
• Market Risk (adverse price excursion).• Liquidity risk (wider spreads / illiquidity
due to fast price moves / lack of deala-ble prices due to the effect of quote fil-tering algorithms).
• Model risk – quantitative/technical mod-els based on historical patterns/data af-fected by fundamental noise/expecta-tions.
• Lack of a “consensus price” during theprice discovery process and OTC distrib-uted market nature.
• Technological risk (execution delaysdue to server transaction capacity ex-ceeded as a result of crowded orderbooks, network delays due to intensetraffic, stop/limit orders price targetsbeing hit, etc).
• Magnified arbitrage opportunities/risks.• Other risks such as incorrect quotations
/ bank re-quotes, adverse post-trade dis-cretionary adjustments.
G-7 currencies not only present a liquidmarket but also data releases are properlyscheduled and calendars are easily available forfree at multiple websites as opposed to emerg-ing market currencies (exotic pairs). Anotheradvantage of G-7 countries is the lack of infor-mation leakage due to the procedures theirgovernments/central banks put in place in or-der to ensure simultaneous data diffusion/
press releases. These are enhanced by sophis-ticated legal frameworks which enforce insideinformation trading/leakage.
Market participants roughly have the sameinformation simultaneously (discarding laten-cy trading technologies implemented by highfrequency niche players), hence market partic-ipants can only speculate trying to anticipatehow the figures may look like once releasedbased on publicly available information.
Global calendars present a description ofthe releases/scheduled events, usually contain-ing data such as country, scheduled time anddate, the type of data/indicator. When availa-ble the “consensus estimate” as well as the pre-vious period figure is typically presented. Onan ex-post basis some calendars also includethe actual released indicator value. For the sakeof this paper we will use EST (New York time)since the US is by far the country which pre-sented most of the available data releases. Inaddition to it both quotes and calendars are inthe same format which simplifies the databasejoin between both data sources, disregardingdaylight saving time changes.
2. Previous researchand theoretical framework
One of the articles which motivated thisresearch was a hedge fund manager interviewpublished at Futures Magazine named: “Cap-ricorn FX; Tested Methods That Work” (Zwick,2007). The technical-analysis based fund Man-agement state that they avoid being in themarket during major data releases due to theincrease in volatility associated during suchevents (higher risks) as well as evidencing thattechnically-based systems (which mainly relyon past historical quote information) do notperform well as a forecasting tool during suchparticular moments. They summarize theirtrading experience during releases in a verygraphic way stating that “it’s like flipping acoin”. Technically-based systems (as well asquant ones) typically suffer during data releases

A. A. BAGNASCO, N. SÁNCHEZ Y J. C. SAPRIZA • THE EFFECT OF ECONOMIC DATA RELEASES… 11
due to fundamental and irrational noise whichmay not be contained in past prices as well asbeing exposed to the previously mentionedrisks. Given that closing or hedging existingopen positions imply a cost (spreads, commis-sions, liquidity, lost trading opportunities [op-portunity costs], etc.), practitioners (mainlyrisk managers, traders, hedge fund managers)may be attracted by having an “indicator road-map” in order to determine the relevance ofdifferent data releases to decide whether theyshould stay or not in the market during a giv-en release.
Our main driver for this research is to sup-ply the academic and trading community witha reliable source of information (not availablefrom freely available sources) to serve as a ba-sis for further research as well as aiding hedgefund managers /market practitioners in theirdecision-making process.
Balduzzi, Elton & Green (1998) analyzed theimpact of announcements in the bond marketsover price, volumes and bid-ask spreads. As aresult of using high frequency data, they wereable to determine which indicators had themajor impacts over price and traded volumes.They also outline that news effects on the cit-ed variables take place in less than one minuteafter the announcement. They also concludethat spreads rapidly widen (same behavior withvolatility) after the announcement returning topre-release figures between 5-15 minutes af-ter the announcement.
Eddelbuttel & McCurdy (1998) studied theimpact of data releases over the Dollar-DeutscheMark using 1-hour intervals. They concludedthat there is a significant relationship betweenvolatility and data release frequencies.
Andersen, Bollerslev, Diebold & Vega (2003)used 5-minute quote data for a period of sixyears for the Deutsche Mark, UK Pound, Japa-nese Yen, Swiss Franc, and the Euro in an effortto model the surprise impact (news) of eco-nomic indicators over the currency exchangerates. These authors found that markets reactin an asymmetric form; that is that “bad news”typically presents higher impacts (overshoot)
than “good news”. They defined bad news asthose published twice in a row below consen-sus expectations. It should be noted that in thisresearch, the authors used a more extensivedataset, not only in terms of currencies, but alsoin terms of indicators and time frame, result-ing an insightful paper. They also conclude thatreleases which contain a news componenthave an immediate effect over the quote con-ditional mean, while variance adjustmentspresent longer-term gradual adjustments.
Andersen, Bollerslev, Diebold & Vega(2007) studied the response of US, British andGerman bonds as well as stocks to macroeco-nomic announcements. For each of the mar-kets they used high frequency return data.They found that for similar instruments mar-kets react in different ways, depending on theoverall economy status. They conclude thatthe news (or surprise) component in data re-leases create jumps in the conditional pricemean. Their results contradict other papersstating that price changes in these marketsdepended mostly from private informationand contagion effects than from public infor-mation and data releases.
Bauwens, Omranen, Giot (2003) analyzedthe impact of nine scheduled and unscheduledannouncements over the EUR/USD volatility.They stress the impact of such announcementsover the FX volatility as well as focusing on theincrease in volatility, instants before the datarelease particularly on scheduled releases. Theysuggest that these moments are seen to theeyes of speculators as an “opportunity to an-ticipate what the market will do” and obtainsome profits. They used 5-minute intervals cov-ering the period May-Nov 2001.
Laakkonen (2004) focused on the news im-pact over the currency volatility, using previ-ously scheduled releases both from the US andEurope for the EURUSD pair using 5-minute in-tervals. Results match those of previous re-searchers, being the volatility significantly af-fected by relevant releases. He also concludesthat bad news affect more exchange rates thangood ones. They also found that scheduled
12 CUADERNO DE ECONOMÍA • 4
releases without news (surprise component)also increase volatilities, but they suggest us-ing longer historical datasets in order to con-firm such result.
Chaboud, Chernenko, Howorka, Iyer, Liu,Wright (2004) analyzed the effects of news onrates and volumes based on EBS (Electronic Bro-king Service) data, which enriched quote datawith traded volumes. They describe intradayimpacts in volume and volatilities for EURUSD
and USD/JPY. Results were in line with previousresearch, adding that news also increase trad-ing volumes, presenting some persistence fora relatively long period of time. Even if the an-nouncement match consensus expectations,traded volumes increase. These results agreewith those of Laakonen (2004).
Ito, Hashimoto (2006) also used EBS data foranalyzing USD/JPY and EURUSD pairs, findingthat yields and volatility experience a U-shapedcurve for the Tokyo and London participantsbut not for the ones from New York.
They observed that activity and volatility donot increase towards the end of business hoursin the New York market, even on Fridays (aheadof weekend hours of non-trading). It is foundthat there exists a high positive correlationbetween volatility and activities and a nega-tive correlation between volatility and the bid-ask spread. A negative correlation is observedbetween the number of deals and the widthof bid-ask spread during business hours.
John C. Parker (2007) presents an excellentand insightful paper titled “The Impact of Eco-nomic News on Financial Markets”, he also usedhigh frequency data. He studied the impactbefore, during and after the releases over dif-ferent markets. He analyzed US and Europeanreleases in an effort to determine which releas-es are actually relevant for each market. Thepaper is coherent with previous research in thefact that markets rapidly react to releases, butunlike some of them and due to the utilizationof 1-minute returns he finds that markets usu-ally react in less than one minute.
Laakkonnen & Lanne (2008) found that badnews present a higher impact than good news
for US and European markets, also stressingthat the effect they have actually depend onthe crisis/prosperity statuses of the consideredeconomies. Bad news during prosperity timespresent significantly higher impacts.
Bartolini, Goldberd & Sacarny (2008) fo-cused on how economic releases affect thestock, bond and currency markets; stressingthat important releases such as GDP advance,non-farm payrolls and the private manufactur-ing report result into significant and persistentmarket impact. The response observed at mul-tiple assets is coherent in sign and magnitude;gaining value with news which translate intoeconomic growth. They agree that daily datashould be complemented with high frequen-cy data in order to enhance analysis results.
Baumohl (2005) qualitatively classify (strict-ly ordinally such as minor, important, very im-portant, etc) data releases based on their impacton exchange rates but without stating any aca-demic support behind them. The book presentsan interesting coverage of US data releases froma descriptive point of view. A summary of it canbe found at Sánchez & Sapriza (2009).
In order to conduct a stricter research it isnecessary to count with properly selected andcleansed quote data, as well as a reliable eco-nomic data release calendar with good dataquality, in order to join both sources. None ofthe data sources was available to us when westarted our research; the resulting datasets areproperly cleaned, filtered, completed, system-atically coded, resulting into highly reliabledatasets. The efforts devoted to data manage-ment were considerable due to the poor dataquality of available datasources.
Based on our bibliographic research wenoticed that few papers are focused on theimpact of data releases on exchange ratesusing high frequency data and particularly noone extensively quantify/rate their impactbased on the magnitude of their impact forG-7 currency pairs, being this the aim of ourresearch.
A. A. BAGNASCO, N. SÁNCHEZ Y J. C. SAPRIZA • THE EFFECT OF ECONOMIC DATA RELEASES… 13
3. Economic Data Releaseseasonality preliminary analysis
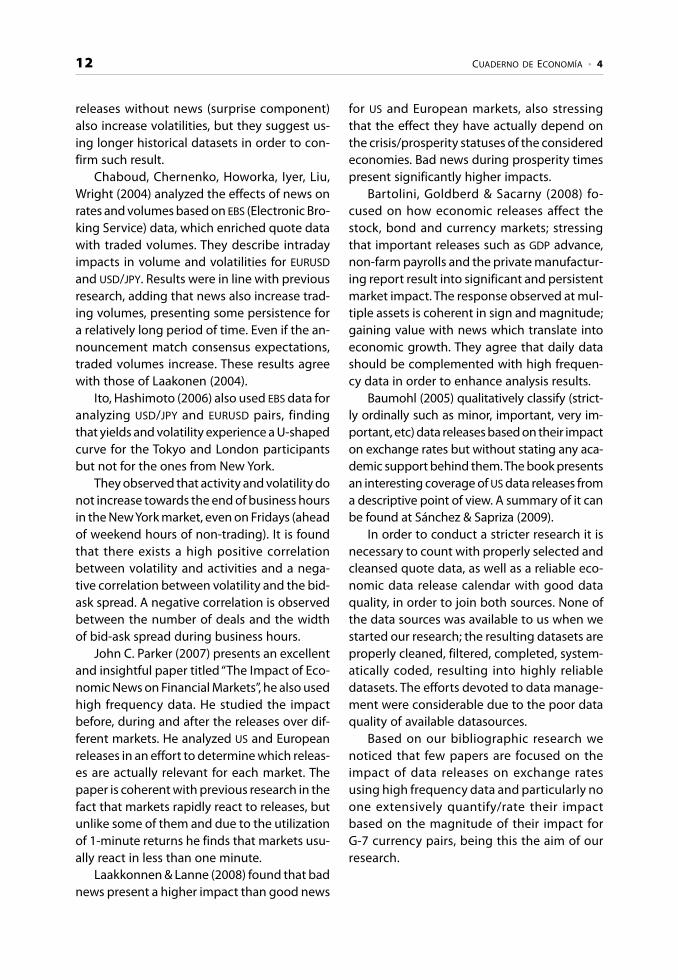
The following charts depict the amount ofeconomic data releases present in the used glo-bal calendar (source: ‹www.forexnews.com›) bycurrency/country and broken down by week-day. Reference number 1 stands for Sundays, 2for Mondays and so forth. Four variables wereanalyzed based on data from Gain Capital NY,the data processing details are described in themethodology section.
The number of quotation changes every15 minutes (tick frequency), as a volatility/ac-tivity indicator. As evidenced from the litera-ture reviewed, the presence of news typicallyincreases volatilities. It should be stressed thatthe absence of valleys during data releasesnot necessarily means that such data releaseis not important or that it has no significantimpact over exchange rates. A possible expla-nation could be that no news actually tookplace at such time (i.e. market expectationsclosely matched the actual figures released).
Chart 4Economic Announcements by Weekday
The opposite holds true if markets quantita-tively prove to be affected by data releases (inthe absence of external noise, other concur-rent announcements or other effects), thenthe data release can be deemed to be classi-fied as important or relevant. Of course cau-sality is much harder to test and we have noother choice than to rely on empirical resultsbased on samples.
As it can be appreciated in chart 4, Thurs-days and Fridays concentrate most of the US
data releases while for Europe, Canada andAustralia data is typically disclosed on Tuesdays.Japan’s announcements tend to cluster on
Thursdays. We used EST (Eastern Standard Time)or New York time throughout the entire paper.
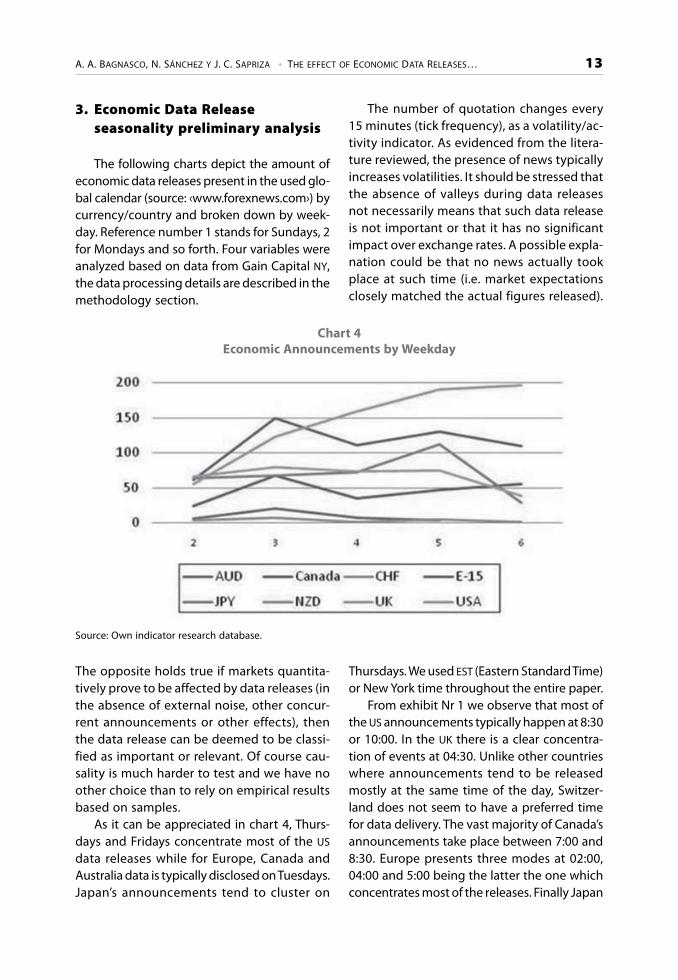
From exhibit Nr 1 we observe that most ofthe US announcements typically happen at 8:30or 10:00. In the UK there is a clear concentra-tion of events at 04:30. Unlike other countrieswhere announcements tend to be releasedmostly at the same time of the day, Switzer-land does not seem to have a preferred timefor data delivery. The vast majority of Canada’sannouncements take place between 7:00 and8:30. Europe presents three modes at 02:00,04:00 and 5:00 being the latter the one whichconcentrates most of the releases. Finally Japan
Source: Own indicator research database.
14 CUADERNO DE ECONOMÍA • 4
Exhibit 1Economic Announcements Hourly Concentratioin
presents three different ranges, one between00:00 and 01:00, another between 00:30 and18:50 and the last one between 19:30 and19:50.
3.1. Tick frequency
In exhibit Nr 2 we observe the averagenumber of ticks per weekday. The horizontalaxis indicates time while the vertical one dis-
plays tick frequency every 15-minute intervals.Reference number 1 stands for Sundays, 2 orMondays and so forth.
From exhibit Nr 2, an increase of the tickfrequency can be observed after 01:00, thismarket activity increment is aligned with theoccurrence of Japanese data releases at suchtime, increasing at 03:00, associated with theEuropean announcements. Between 08:30 and10:00 we can also observe the effect of US
Source: Own research database.

A. A. BAGNASCO, N. SÁNCHEZ Y J. C. SAPRIZA • THE EFFECT OF ECONOMIC DATA RELEASES… 15
Exhibit 2Tick Frequency Weekly Average
Source: Own research.
16 CUADERNO DE ECONOMÍA • 4
Exhibit 3High-low average – intraweek seasonality analysis
Source: Own research.
A. A. BAGNASCO, N. SÁNCHEZ Y J. C. SAPRIZA • THE EFFECT OF ECONOMIC DATA RELEASES… 17
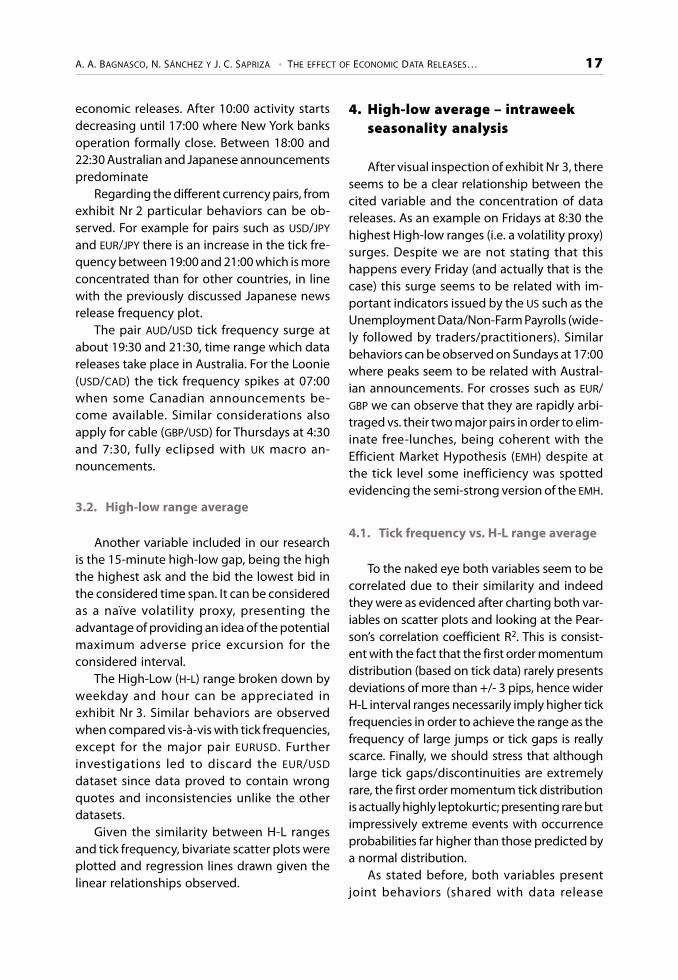
economic releases. After 10:00 activity startsdecreasing until 17:00 where New York banksoperation formally close. Between 18:00 and22:30 Australian and Japanese announcementspredominate
Regarding the different currency pairs, fromexhibit Nr 2 particular behaviors can be ob-served. For example for pairs such as USD/JPY
and EUR/JPY there is an increase in the tick fre-quency between 19:00 and 21:00 which is moreconcentrated than for other countries, in linewith the previously discussed Japanese newsrelease frequency plot.
The pair AUD/USD tick frequency surge atabout 19:30 and 21:30, time range which datareleases take place in Australia. For the Loonie(USD/CAD) the tick frequency spikes at 07:00when some Canadian announcements be-come available. Similar considerations alsoapply for cable (GBP/USD) for Thursdays at 4:30and 7:30, fully eclipsed with UK macro an-nouncements.
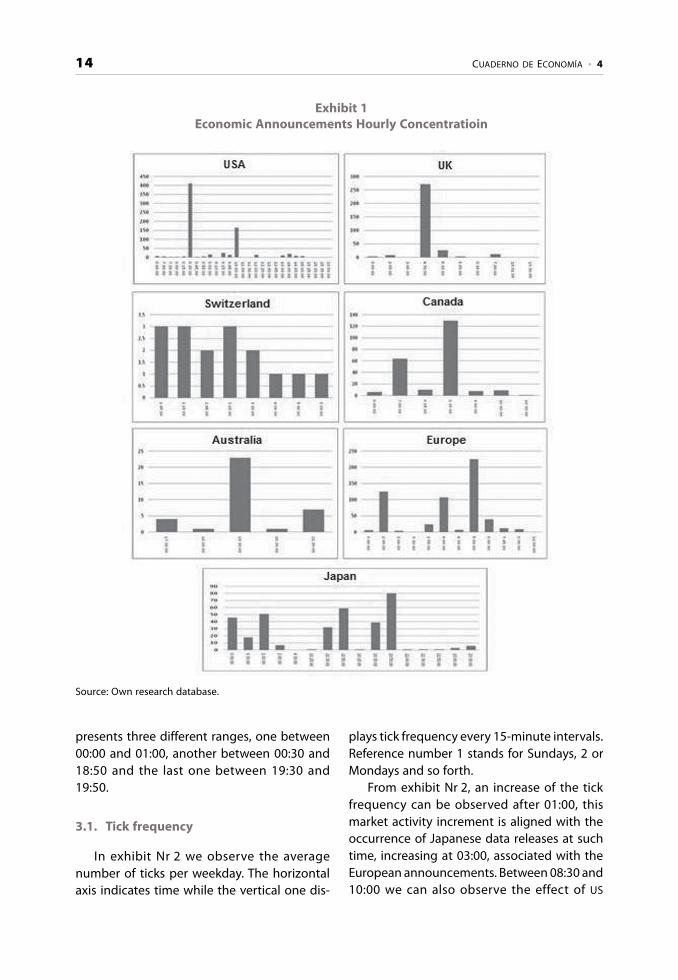
3.2. High-low range average
Another variable included in our researchis the 15-minute high-low gap, being the highthe highest ask and the bid the lowest bid inthe considered time span. It can be consideredas a naïve volatility proxy, presenting theadvantage of providing an idea of the potentialmaximum adverse price excursion for theconsidered interval.
The High-Low (H-L) range broken down byweekday and hour can be appreciated inexhibit Nr 3. Similar behaviors are observedwhen compared vis-à-vis with tick frequencies,except for the major pair EURUSD. Furtherinvestigations led to discard the EUR/USD
dataset since data proved to contain wrongquotes and inconsistencies unlike the otherdatasets.
Given the similarity between H-L rangesand tick frequency, bivariate scatter plots wereplotted and regression lines drawn given thelinear relationships observed.
4. High-low average – intraweekseasonality analysis
After visual inspection of exhibit Nr 3, thereseems to be a clear relationship between thecited variable and the concentration of datareleases. As an example on Fridays at 8:30 thehighest High-low ranges (i.e. a volatility proxy)surges. Despite we are not stating that thishappens every Friday (and actually that is thecase) this surge seems to be related with im-portant indicators issued by the US such as theUnemployment Data/Non-Farm Payrolls (wide-ly followed by traders/practitioners). Similarbehaviors can be observed on Sundays at 17:00where peaks seem to be related with Austral-ian announcements. For crosses such as EUR/GBP we can observe that they are rapidly arbi-traged vs. their two major pairs in order to elim-inate free-lunches, being coherent with theEfficient Market Hypothesis (EMH) despite atthe tick level some inefficiency was spottedevidencing the semi-strong version of the EMH.
4.1. Tick frequency vs. H-L range average
To the naked eye both variables seem to becorrelated due to their similarity and indeedthey were as evidenced after charting both var-iables on scatter plots and looking at the Pear-son’s correlation coefficient R2. This is consist-ent with the fact that the first order momentumdistribution (based on tick data) rarely presentsdeviations of more than +/- 3 pips, hence widerH-L interval ranges necessarily imply higher tickfrequencies in order to achieve the range as thefrequency of large jumps or tick gaps is reallyscarce. Finally, we should stress that althoughlarge tick gaps/discontinuities are extremelyrare, the first order momentum tick distributionis actually highly leptokurtic; presenting rare butimpressively extreme events with occurrenceprobabilities far higher than those predicted bya normal distribution.
As stated before, both variables presentjoint behaviors (shared with data release

18 CUADERNO DE ECONOMÍA • 4
Exhibit 4Tick frequency vs. H-L range average
Source: Own research.
A. A. BAGNASCO, N. SÁNCHEZ Y J. C. SAPRIZA • THE EFFECT OF ECONOMIC DATA RELEASES… 19
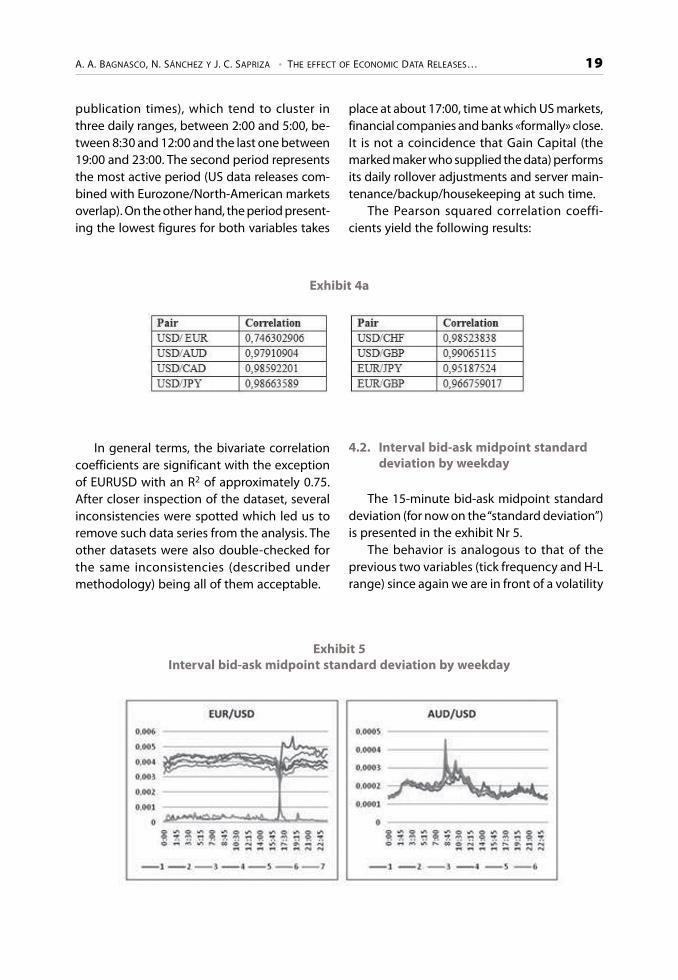
publication times), which tend to cluster inthree daily ranges, between 2:00 and 5:00, be-tween 8:30 and 12:00 and the last one between19:00 and 23:00. The second period representsthe most active period (US data releases com-bined with Eurozone/North-American marketsoverlap). On the other hand, the period present-ing the lowest figures for both variables takes
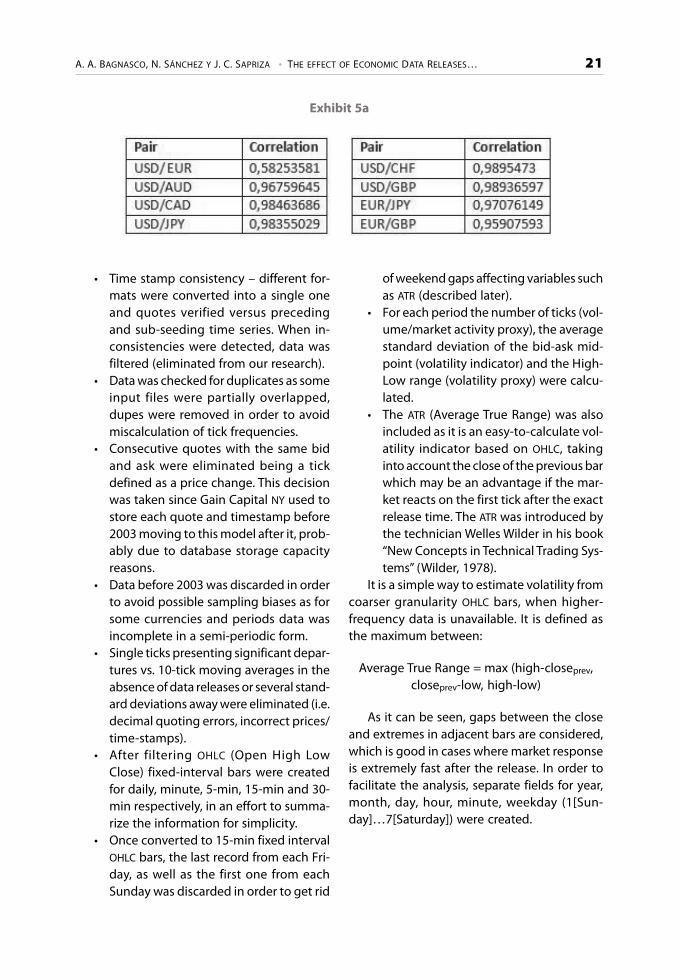
In general terms, the bivariate correlationcoefficients are significant with the exceptionof EURUSD with an R2 of approximately 0.75.After closer inspection of the dataset, severalinconsistencies were spotted which led us toremove such data series from the analysis. Theother datasets were also double-checked forthe same inconsistencies (described undermethodology) being all of them acceptable.
Exhibit 4a
place at about 17:00, time at which US markets,financial companies and banks «formally» close.It is not a coincidence that Gain Capital (themarked maker who supplied the data) performsits daily rollover adjustments and server main-tenance/backup/housekeeping at such time.
The Pearson squared correlation coeffi-cients yield the following results:
4.2. Interval bid-ask midpoint standarddeviation by weekday
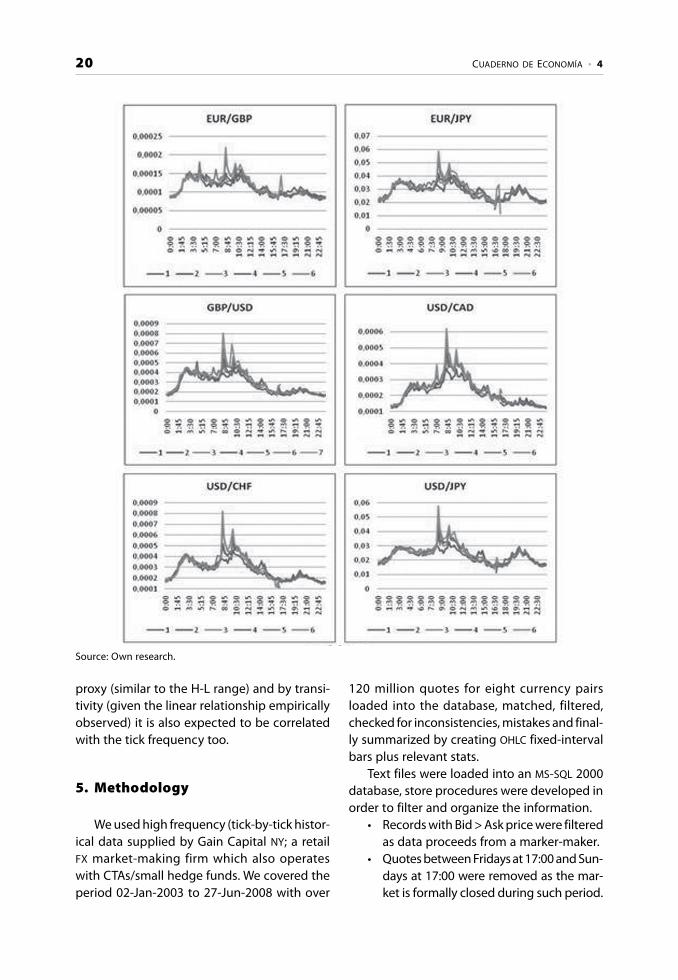
The 15-minute bid-ask midpoint standarddeviation (for now on the “standard deviation”)is presented in the exhibit Nr 5.
The behavior is analogous to that of theprevious two variables (tick frequency and H-Lrange) since again we are in front of a volatility
Exhibit 5Interval bid-ask midpoint standard deviation by weekday
20 CUADERNO DE ECONOMÍA • 4
proxy (similar to the H-L range) and by transi-tivity (given the linear relationship empiricallyobserved) it is also expected to be correlatedwith the tick frequency too.
5. Methodology
We used high frequency (tick-by-tick histor-ical data supplied by Gain Capital NY; a retailFX market-making firm which also operateswith CTAs/small hedge funds. We covered theperiod 02-Jan-2003 to 27-Jun-2008 with over
120 million quotes for eight currency pairsloaded into the database, matched, filtered,checked for inconsistencies, mistakes and final-ly summarized by creating OHLC fixed-intervalbars plus relevant stats.
Text files were loaded into an MS-SQL 2000database, store procedures were developed inorder to filter and organize the information.
• Records with Bid > Ask price were filteredas data proceeds from a marker-maker.
• Quotes between Fridays at 17:00 and Sun-days at 17:00 were removed as the mar-ket is formally closed during such period.
Source: Own research.
A. A. BAGNASCO, N. SÁNCHEZ Y J. C. SAPRIZA • THE EFFECT OF ECONOMIC DATA RELEASES… 21
Exhibit 5a
• Time stamp consistency – different for-mats were converted into a single oneand quotes verified versus precedingand sub-seeding time series. When in-consistencies were detected, data wasfiltered (eliminated from our research).
• Data was checked for duplicates as someinput files were partially overlapped,dupes were removed in order to avoidmiscalculation of tick frequencies.
• Consecutive quotes with the same bidand ask were eliminated being a tickdefined as a price change. This decisionwas taken since Gain Capital NY used tostore each quote and timestamp before2003 moving to this model after it, prob-ably due to database storage capacityreasons.
• Data before 2003 was discarded in orderto avoid possible sampling biases as forsome currencies and periods data wasincomplete in a semi-periodic form.
• Single ticks presenting significant depar-tures vs. 10-tick moving averages in theabsence of data releases or several stand-ard deviations away were eliminated (i.e.decimal quoting errors, incorrect prices/time-stamps).
• After filtering OHLC (Open High LowClose) fixed-interval bars were createdfor daily, minute, 5-min, 15-min and 30-min respectively, in an effort to summa-rize the information for simplicity.
• Once converted to 15-min fixed intervalOHLC bars, the last record from each Fri-day, as well as the first one from eachSunday was discarded in order to get rid
of weekend gaps affecting variables suchas ATR (described later).
• For each period the number of ticks (vol-ume/market activity proxy), the averagestandard deviation of the bid-ask mid-point (volatility indicator) and the High-Low range (volatility proxy) were calcu-lated.
• The ATR (Average True Range) was alsoincluded as it is an easy-to-calculate vol-atility indicator based on OHLC, takinginto account the close of the previous barwhich may be an advantage if the mar-ket reacts on the first tick after the exactrelease time. The ATR was introduced bythe technician Welles Wilder in his book“New Concepts in Technical Trading Sys-tems” (Wilder, 1978).
It is a simple way to estimate volatility fromcoarser granularity OHLC bars, when higher-frequency data is unavailable. It is defined asthe maximum between:
Average True Range = max (high-closeprev,closeprev-low, high-low)
As it can be seen, gaps between the closeand extremes in adjacent bars are considered,which is good in cases where market responseis extremely fast after the release. In order tofacilitate the analysis, separate fields for year,month, day, hour, minute, weekday (1[Sun-day]…7[Saturday]) were created.

22 CUADERNO DE ECONOMÍA • 4
5.1. Economic data release calendar
The data used to populate the calendar wasdownloaded from the website ‹www.forexnews.com›, as well as other sources (most-ly for validation purposes) such as Trader Fo-rex, ‹www.traderforex.eu/es› and the NationalBureau of Economic Research, ‹www.nber.org/releases›.
The calendar contains the following fields:date (dd/mm/yyyy), release time (hh/mm),country, currency or announcement zone, re-lease description field, previous release value,consensus expectation (forecast) and lastly theactual release figure (updated on an ex-postbasis of course).
Several data quality issues were faced dur-ing the preparation of this information.
Country names were not unique, there weresynonyms, capitalized or not or even mistyped(for example US, USA, USD, or Canada, CAD or E-15, Europe, EUR, Eurozone, eurozone, eurzne,etc) – manual as well as ordinary text-miningtechniques were used to improve the data-source quality, remove invalid characters, sep-arate tokens, etc. European countries were cod-ed as E-15, synonyms were also removed.
Calendar contents were validated with theaid of the Bernard Baumohl’s book “The Secretsof Economic Indicators, Hidden Clues to FutureEconomic Trends and Investments Opportuni-ties” (Baumohl, 2005), where a large table of USindicators was compiled including periodicity,release time, etc. Non-US data was similarlyvalidated with the aid of Picker, Anne Dolga-nos’s book “International Economic Indicatorsand Central Banks” (Picker, 2007). Missing cal-endar entries were inserted; data incorrectlycoded under a different country or data releaseindicator was updated, etc.
Each of the indicators was systematicallycoded with a four-digit number. Codes begin-ning with 1000 and 2000 were reserved for US
announcements, 4000 for Swiss, 9000 for theUK, 8000 European Union, 7000 Japan, 6000Canada and finally 5000 for Australia. For spe-cial cases such as market holidays, speeches or
those releases which presented difficultieswere isolated with the code 9999. Some an-nouncements were unable to be coded due tomultiple reasons, for example lack of reliable/consistent data, lack of frequency (e.g. report-ed just for a single time or few observations)
Indicator units were another of the difficul-ties encountered, being used to validate re-sults/spotting mistakes in data, when for ex-ample an unemployment rate was expressedin billion currency units.
Another verification included making surethat all the indicator series were complete (i.e.12 monthly indicator releases/year, etc). Theprocess was very tedious as some indicators arereleased on a given specific date while othershave certain rules (for example the US Non-Farm Payrolls (NFP) are released the first Fridayof every month at 8:30 EST as long as it is doesnot fall within the first 2 days of the monthsince previous-month data needs to be gath-ered/processed by the Bureau of Labor Statis-tics).
Once coded, the indicators needed to bechecked for interferences as some are typicallyreleased concurrently (e.g. US NFP and the Un-employment Rate) or lower-frequency indica-tors (such as the US GDP (quarterly released), ispublished exactly at the same time as the em-ployment data (e.g. Non-Farm Payrolls pub-lished on a monthly basis) thus overlapping inMarch, June, Sep & Dec. In order to determineinterferences, if two indicators overlap within a10-minute window they were specially labeledand interferences were tracked in order to beable to isolate the effect of individual indica-tors whenever possible. In some cases it provedto be impossible to analyze some indicatorsseparately as they always overlap, so they werestudied together, using a common code. Quar-terly indicators overlapping with higher fre-quency indicators (e.g. monthly) had to be un-fortunately removed from the analysis (e.g. US
GDP) and the overlapping months of the otherindicator were also discarded, keeping just thenon-end-of-quarter months for analysis pur-poses. A boolean field was created for the com-
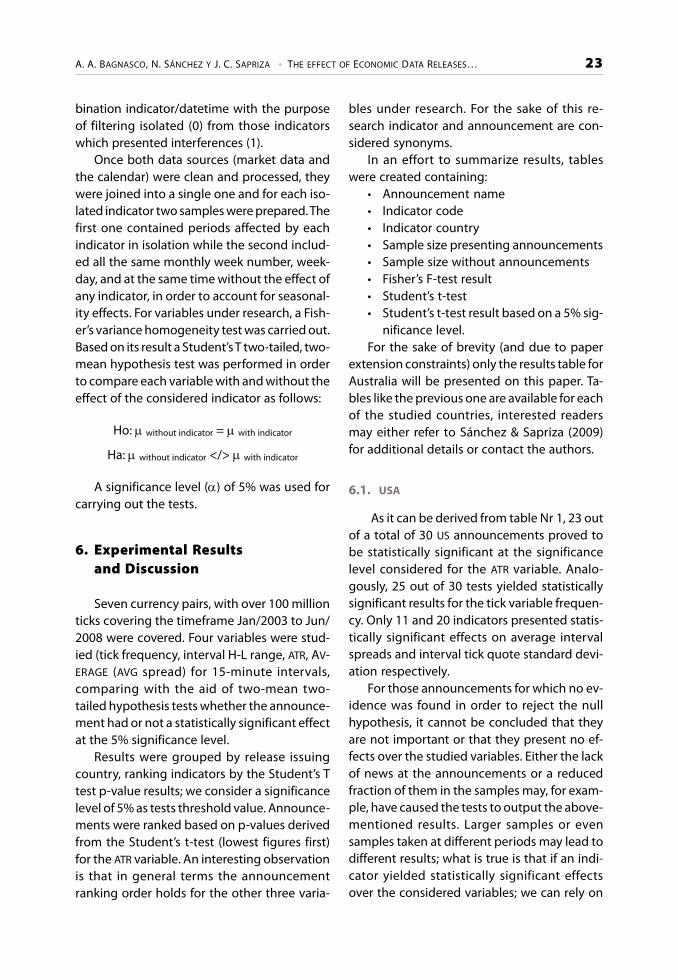
A. A. BAGNASCO, N. SÁNCHEZ Y J. C. SAPRIZA • THE EFFECT OF ECONOMIC DATA RELEASES… 23
bination indicator/datetime with the purposeof filtering isolated (0) from those indicatorswhich presented interferences (1).
Once both data sources (market data andthe calendar) were clean and processed, theywere joined into a single one and for each iso-lated indicator two samples were prepared. Thefirst one contained periods affected by eachindicator in isolation while the second includ-ed all the same monthly week number, week-day, and at the same time without the effect ofany indicator, in order to account for seasonal-ity effects. For variables under research, a Fish-er’s variance homogeneity test was carried out.Based on its result a Student’s T two-tailed, two-mean hypothesis test was performed in orderto compare each variable with and without theeffect of the considered indicator as follows:
Ho: without indicator = with indicator
Ha: without indicator </> with indicator
A significance level () of 5% was used forcarrying out the tests.
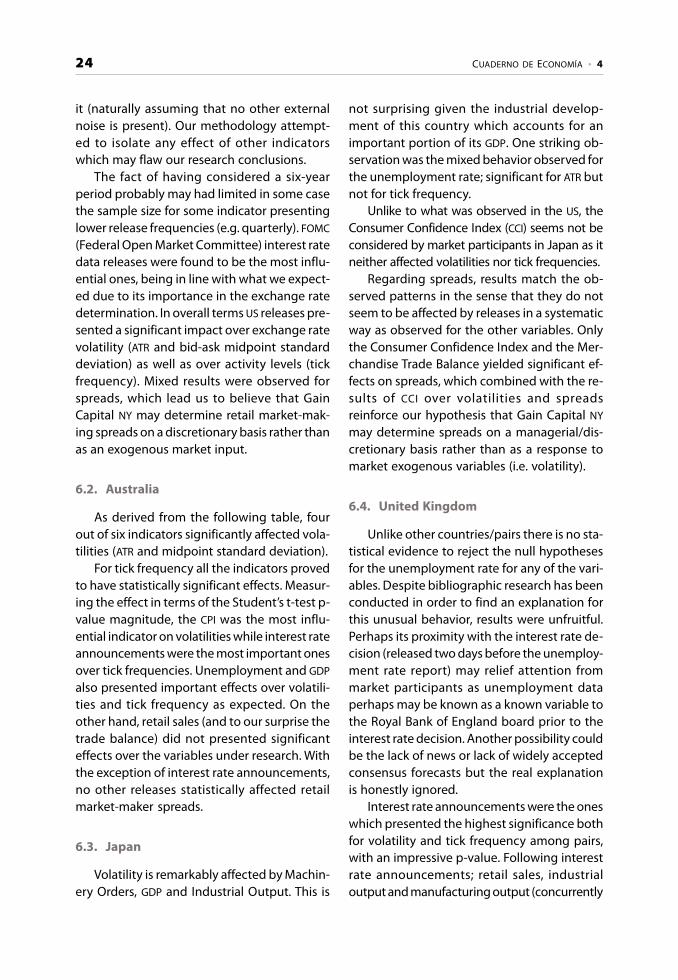
6. Experimental Resultsand Discussion
Seven currency pairs, with over 100 millionticks covering the timeframe Jan/2003 to Jun/2008 were covered. Four variables were stud-ied (tick frequency, interval H-L range, ATR, AV-ERAGE (AVG spread) for 15-minute intervals,comparing with the aid of two-mean two-tailed hypothesis tests whether the announce-ment had or not a statistically significant effectat the 5% significance level.
Results were grouped by release issuingcountry, ranking indicators by the Student’s Ttest p-value results; we consider a significancelevel of 5% as tests threshold value. Announce-ments were ranked based on p-values derivedfrom the Student’s t-test (lowest figures first)for the ATR variable. An interesting observationis that in general terms the announcementranking order holds for the other three varia-
bles under research. For the sake of this re-search indicator and announcement are con-sidered synonyms.
In an effort to summarize results, tableswere created containing:
• Announcement name• Indicator code• Indicator country• Sample size presenting announcements• Sample size without announcements• Fisher’s F-test result• Student’s t-test• Student’s t-test result based on a 5% sig-
nificance level.For the sake of brevity (and due to paper
extension constraints) only the results table forAustralia will be presented on this paper. Ta-bles like the previous one are available for eachof the studied countries, interested readersmay either refer to Sánchez & Sapriza (2009)for additional details or contact the authors.
6.1. USA
As it can be derived from table Nr 1, 23 outof a total of 30 US announcements proved tobe statistically significant at the significancelevel considered for the ATR variable. Analo-gously, 25 out of 30 tests yielded statisticallysignificant results for the tick variable frequen-cy. Only 11 and 20 indicators presented statis-tically significant effects on average intervalspreads and interval tick quote standard devi-ation respectively.
For those announcements for which no ev-idence was found in order to reject the nullhypothesis, it cannot be concluded that theyare not important or that they present no ef-fects over the studied variables. Either the lackof news at the announcements or a reducedfraction of them in the samples may, for exam-ple, have caused the tests to output the above-mentioned results. Larger samples or evensamples taken at different periods may lead todifferent results; what is true is that if an indi-cator yielded statistically significant effectsover the considered variables; we can rely on
24 CUADERNO DE ECONOMÍA • 4
it (naturally assuming that no other externalnoise is present). Our methodology attempt-ed to isolate any effect of other indicatorswhich may flaw our research conclusions.
The fact of having considered a six-yearperiod probably may had limited in some casethe sample size for some indicator presentinglower release frequencies (e.g. quarterly). FOMC
(Federal Open Market Committee) interest ratedata releases were found to be the most influ-ential ones, being in line with what we expect-ed due to its importance in the exchange ratedetermination. In overall terms US releases pre-sented a significant impact over exchange ratevolatility (ATR and bid-ask midpoint standarddeviation) as well as over activity levels (tickfrequency). Mixed results were observed forspreads, which lead us to believe that GainCapital NY may determine retail market-mak-ing spreads on a discretionary basis rather thanas an exogenous market input.
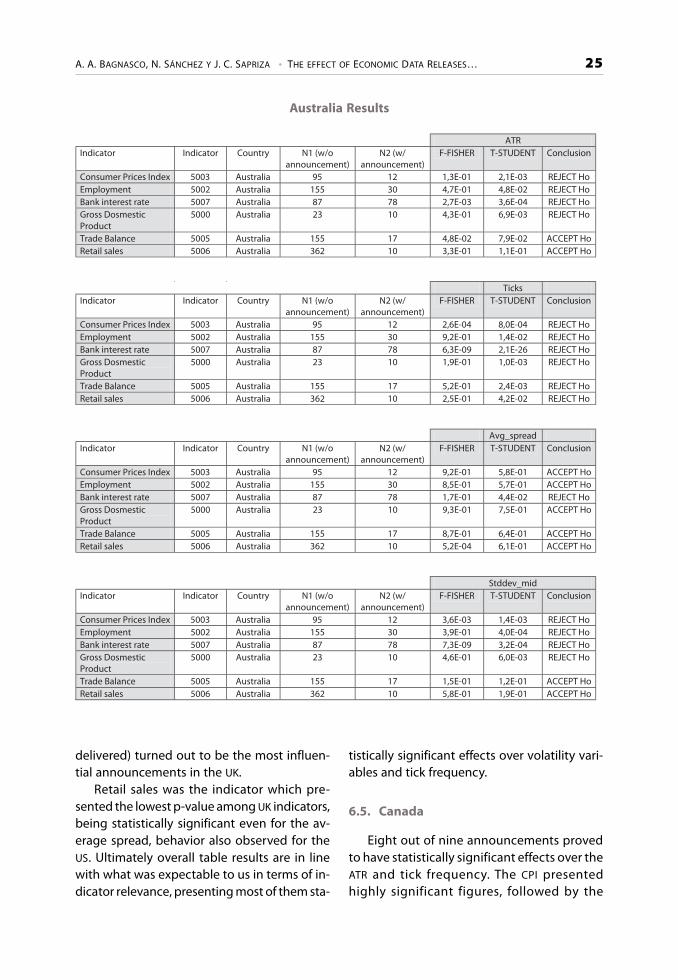
6.2. Australia
As derived from the following table, fourout of six indicators significantly affected vola-tilities (ATR and midpoint standard deviation).
For tick frequency all the indicators provedto have statistically significant effects. Measur-ing the effect in terms of the Student’s t-test p-value magnitude, the CPI was the most influ-ential indicator on volatilities while interest rateannouncements were the most important onesover tick frequencies. Unemployment and GDP
also presented important effects over volatili-ties and tick frequency as expected. On theother hand, retail sales (and to our surprise thetrade balance) did not presented significanteffects over the variables under research. Withthe exception of interest rate announcements,no other releases statistically affected retailmarket-maker spreads.
6.3. Japan
Volatility is remarkably affected by Machin-ery Orders, GDP and Industrial Output. This is
not surprising given the industrial develop-ment of this country which accounts for animportant portion of its GDP. One striking ob-servation was the mixed behavior observed forthe unemployment rate; significant for ATR butnot for tick frequency.
Unlike to what was observed in the US, theConsumer Confidence Index (CCI) seems not beconsidered by market participants in Japan as itneither affected volatilities nor tick frequencies.
Regarding spreads, results match the ob-served patterns in the sense that they do notseem to be affected by releases in a systematicway as observed for the other variables. Onlythe Consumer Confidence Index and the Mer-chandise Trade Balance yielded significant ef-fects on spreads, which combined with the re-sults of CCI over volatilities and spreadsreinforce our hypothesis that Gain Capital NY
may determine spreads on a managerial/dis-cretionary basis rather than as a response tomarket exogenous variables (i.e. volatility).
6.4. United Kingdom
Unlike other countries/pairs there is no sta-tistical evidence to reject the null hypothesesfor the unemployment rate for any of the vari-ables. Despite bibliographic research has beenconducted in order to find an explanation forthis unusual behavior, results were unfruitful.Perhaps its proximity with the interest rate de-cision (released two days before the unemploy-ment rate report) may relief attention frommarket participants as unemployment dataperhaps may be known as a known variable tothe Royal Bank of England board prior to theinterest rate decision. Another possibility couldbe the lack of news or lack of widely acceptedconsensus forecasts but the real explanationis honestly ignored.
Interest rate announcements were the oneswhich presented the highest significance bothfor volatility and tick frequency among pairs,with an impressive p-value. Following interestrate announcements; retail sales, industrialoutput and manufacturing output (concurrently
A. A. BAGNASCO, N. SÁNCHEZ Y J. C. SAPRIZA • THE EFFECT OF ECONOMIC DATA RELEASES… 25
Australia Results
delivered) turned out to be the most influen-tial announcements in the UK.
Retail sales was the indicator which pre-sented the lowest p-value among UK indicators,being statistically significant even for the av-erage spread, behavior also observed for theUS. Ultimately overall table results are in linewith what was expectable to us in terms of in-dicator relevance, presenting most of them sta-
tistically significant effects over volatility vari-ables and tick frequency.
6.5. Canada
Eight out of nine announcements provedto have statistically significant effects over theATR and tick frequency. The CPI presentedhighly significant figures, followed by the
ATR Indicator Indicator Country N1 (w/o
announcement) N2 (w/
announcement) F-FISHER T-STUDENT Conclusion
Consumer Prices Index 5003 Australia 95 12 1,3E-01 2,1E-03 REJECT Ho Employment 5002 Australia 155 30 4,7E-01 4,8E-02 REJECT Ho Bank interest rate 5007 Australia 87 78 2,7E-03 3,6E-04 REJECT Ho Gross Dosmestic Product
5000 Australia 23 10 4,3E-01 6,9E-03 REJECT Ho
Trade Balance 5005 Australia 155 17 4,8E-02 7,9E-02 ACCEPT HoRetail sales 5006 Australia 362 10 3,3E-01 1,1E-01 ACCEPT Ho Ticks Indicator Indicator Country N1 (w/o
announcement) N2 (w/
announcement) F-FISHER T-STUDENT Conclusion
Consumer Prices Index 5003 Australia 95 12 2,6E-04 8,0E-04 REJECT Ho Employment 5002 Australia 155 30 9,2E-01 1,4E-02 REJECT Ho Bank interest rate 5007 Australia 87 78 6,3E-09 2,1E-26 REJECT Ho Gross Dosmestic Product
5000 Australia 23 10 1,9E-01 1,0E-03 REJECT Ho
Trade Balance 5005 Australia 155 17 5,2E-01 2,4E-03 REJECT Ho Retail sales 5006 Australia 362 10 2,5E-01 4,2E-02 REJECT Ho Avg_spread Indicator Indicator Country N1 (w/o
announcement) N2 (w/
announcement) F-FISHER T-STUDENT Conclusion
Consumer Prices Index 5003 Australia 95 12 9,2E-01 5,8E-01 ACCEPT HoEmployment 5002 Australia 155 30 8,5E-01 5,7E-01 ACCEPT HoBank interest rate 5007 Australia 87 78 1,7E-01 4,4E-02 REJECT Ho Gross Dosmestic Product
5000 Australia 23 10 9,3E-01 7,5E-01 ACCEPT Ho
Trade Balance 5005 Australia 155 17 8,7E-01 6,4E-01 ACCEPT HoRetail sales 5006 Australia 362 10 5,2E-04 6,1E-01 ACCEPT Ho Stddev_mid Indicator Indicator Country N1 (w/o
announcement) N2 (w/
announcement) F-FISHER T-STUDENT Conclusion
Consumer Prices Index 5003 Australia 95 12 3,6E-03 1,4E-03 REJECT Ho Employment 5002 Australia 155 30 3,9E-01 4,0E-04 REJECT Ho Bank interest rate 5007 Australia 87 78 7,3E-09 3,2E-04 REJECT Ho Gross Dosmestic Product
5000 Australia 23 10 4,6E-01 6,0E-03 REJECT Ho
Trade Balance 5005 Australia 155 17 1,5E-01 1,2E-01 ACCEPT HoRetail sales 5006 Australia 362 10 5,8E-01 1,9E-01 ACCEPT Ho
26 CUADERNO DE ECONOMÍA • 4
Employment stats, interest rate decisions andretail sales. These indicators are typically an-nounced between 07:00 and 09:00, being sim-ilar to what was observed before the mostimportant time span for both Canadian newsas well as tick frequency for the CAD. Again theLoonie shares common behaviors with theother studied currencies, being interest ratesand unemployment data the most relevantones as expected. The average spread con-firms the observations outlined at other pairssuggesting that the market-maker seems todetermine spreads discretionally.
6.6. European Union
For the European Union the only data re-lease which presented statistically significanteffect over the ATR and tick frequency was theinterest rate monetary decision. Perhaps a pos-sible explanation could be that no single-coun-try indicator is as relevant as aggregate Euro-pean indicators/data (of course interest ratesare extremely important from an economicfundamental standpoint). Another possibleexplanation could be the lack of an exact andsustained publishing date and time.
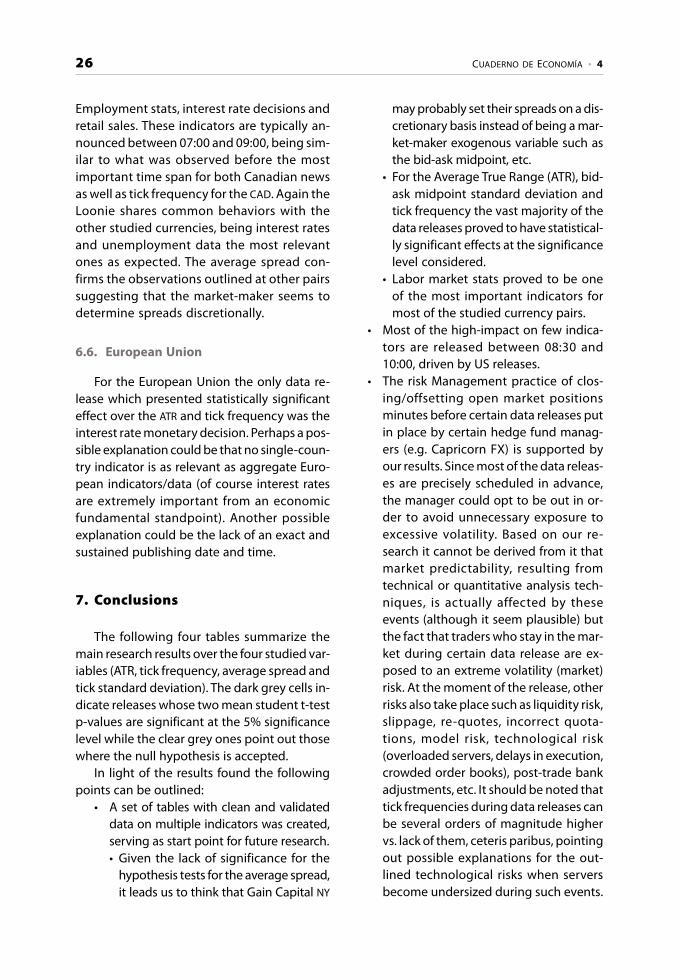
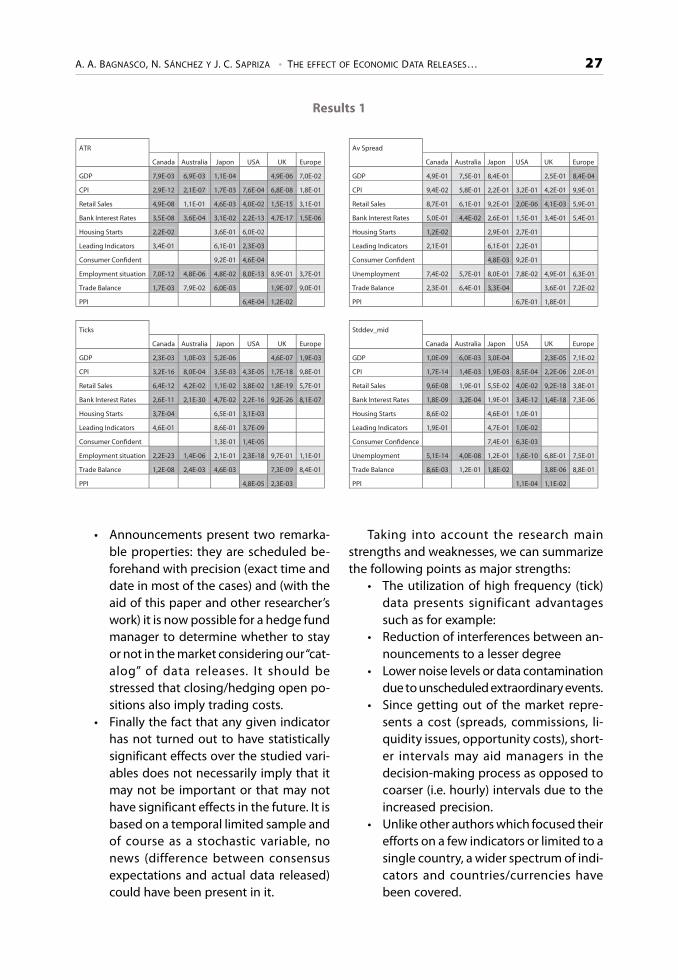
7. Conclusions
The following four tables summarize themain research results over the four studied var-iables (ATR, tick frequency, average spread andtick standard deviation). The dark grey cells in-dicate releases whose two mean student t-testp-values are significant at the 5% significancelevel while the clear grey ones point out thosewhere the null hypothesis is accepted.
In light of the results found the followingpoints can be outlined:
• A set of tables with clean and validateddata on multiple indicators was created,serving as start point for future research.• Given the lack of significance for the
hypothesis tests for the average spread,it leads us to think that Gain Capital NY
may probably set their spreads on a dis-cretionary basis instead of being a mar-ket-maker exogenous variable such asthe bid-ask midpoint, etc.
• For the Average True Range (ATR), bid-ask midpoint standard deviation andtick frequency the vast majority of thedata releases proved to have statistical-ly significant effects at the significancelevel considered.
• Labor market stats proved to be oneof the most important indicators formost of the studied currency pairs.
• Most of the high-impact on few indica-tors are released between 08:30 and10:00, driven by US releases.
• The risk Management practice of clos-ing/offsetting open market positionsminutes before certain data releases putin place by certain hedge fund manag-ers (e.g. Capricorn FX) is supported byour results. Since most of the data releas-es are precisely scheduled in advance,the manager could opt to be out in or-der to avoid unnecessary exposure toexcessive volatility. Based on our re-search it cannot be derived from it thatmarket predictability, resulting fromtechnical or quantitative analysis tech-niques, is actually affected by theseevents (although it seem plausible) butthe fact that traders who stay in the mar-ket during certain data release are ex-posed to an extreme volatility (market)risk. At the moment of the release, otherrisks also take place such as liquidity risk,slippage, re-quotes, incorrect quota-tions, model risk, technological risk(overloaded servers, delays in execution,crowded order books), post-trade bankadjustments, etc. It should be noted thattick frequencies during data releases canbe several orders of magnitude highervs. lack of them, ceteris paribus, pointingout possible explanations for the out-lined technological risks when serversbecome undersized during such events.
A. A. BAGNASCO, N. SÁNCHEZ Y J. C. SAPRIZA • THE EFFECT OF ECONOMIC DATA RELEASES… 27
Results 1
ATR
Canada Australia Japon USA UK Europe
GDP 7,9E-03 6,9E-03 1,1E-04 4,9E-06 7,0E-02
CPI 2,9E-12 2,1E-07 1,7E-03 7,6E-04 6,8E-08 1,8E-01
Retail Sales 4,9E-08 1,1E-01 4,6E-03 4,0E-02 1,5E-15 3,1E-01
Bank Interest Rates 3,5E-08 3,6E-04 3,1E-02 2,2E-13 4,7E-17 1,5E-06
Housing Starts 2,2E-02 3,6E-01 6,0E-02
Leading Indicators 3,4E-01 6,1E-01 2,3E-03
Consumer Confident 9,2E-01 4,6E-04
Employment situation 7,0E-12 4,8E-06 4,8E-02 8,0E-13 8,9E-01 3,7E-01
Trade Balance 1,7E-03 7,9E-02 6,0E-03 1,9E-07 9,0E-01
PPI 6,4E-04 1,2E-02
Ticks
Canada Australia Japon USA UK Europe
GDP 2,3E-03 1,0E-03 5,2E-06 4,6E-07 1,9E-03
CPI 3,2E-16 8,0E-04 3,5E-03 4,3E-05 1,7E-18 9,8E-01
Retail Sales 6,4E-12 4,2E-02 1,1E-02 3,8E-02 1,8E-19 5,7E-01
Bank Interest Rates 2,6E-11 2,1E-30 4,7E-02 2,2E-16 9,2E-26 8,1E-07
Housing Starts 3,7E-04 6,5E-01 3,1E-03
Leading Indicators 4,6E-01 8,6E-01 3,7E-09
Consumer Confident 1,3E-01 1,4E-05
Employment situation 2,2E-23 1,4E-06 2,1E-01 2,3E-18 9,7E-01 1,1E-01
Trade Balance 1,2E-08 2,4E-03 4,6E-03 7,3E-09 8,4E-01
PPI 4,8E-05 2,3E-03
Av Spread
Canada Australia Japon USA UK Europe
GDP 4,9E-01 7,5E-01 8,4E-01 2,5E-01 8,4E-04
CPI 9,4E-02 5,8E-01 2,2E-01 3,2E-01 4,2E-01 9,9E-01
Retail Sales 8,7E-01 6,1E-01 9,2E-01 2,0E-06 4,1E-03 5,9E-01
Bank Interest Rates 5,0E-01 4,4E-02 2,6E-01 1,5E-01 3,4E-01 5,4E-01
Housing Starts 1,2E-02 2,9E-01 2,7E-01
Leading Indicators 2,1E-01 6,1E-01 2,2E-01
Consumer Confident 4,8E-03 9,2E-01
Unemployment 7,4E-02 5,7E-01 8,0E-01 7,8E-02 4,9E-01 6,3E-01
Trade Balance 2,3E-01 6,4E-01 3,3E-04 3,6E-01 7,2E-02
PPI 6,7E-01 1,8E-01
Stddev_mid
Canada Australia Japon USA UK Europe
GDP 1,0E-09 6,0E-03 3,0E-04 2,3E-05 7,1E-02
CPI 1,7E-14 1,4E-03 1,9E-03 8,5E-04 2,2E-06 2,0E-01
Retail Sales 9,6E-08 1,9E-01 5,5E-02 4,0E-02 9,2E-18 3,8E-01
Bank Interest Rates 1,8E-09 3,2E-04 1,9E-01 3,4E-12 1,4E-18 7,3E-06
Housing Starts 8,6E-02 4,6E-01 1,0E-01
Leading Indicators 1,9E-01 4,7E-01 1,0E-02
Consumer Confidence 7,4E-01 6,3E-03
Unemployment 5,1E-14 4,0E-08 1,2E-01 1,6E-10 6,8E-01 7,5E-01
Trade Balance 8,6E-03 1,2E-01 1,8E-02 3,8E-06 8,8E-01
PPI 1,1E-04 1,1E-02
• Announcements present two remarka-ble properties: they are scheduled be-forehand with precision (exact time anddate in most of the cases) and (with theaid of this paper and other researcher’swork) it is now possible for a hedge fundmanager to determine whether to stayor not in the market considering our “cat-alog” of data releases. It should bestressed that closing/hedging open po-sitions also imply trading costs.
• Finally the fact that any given indicatorhas not turned out to have statisticallysignificant effects over the studied vari-ables does not necessarily imply that itmay not be important or that may nothave significant effects in the future. It isbased on a temporal limited sample andof course as a stochastic variable, nonews (difference between consensusexpectations and actual data released)could have been present in it.
Taking into account the research mainstrengths and weaknesses, we can summarizethe following points as major strengths:
• The utilization of high frequency (tick)data presents significant advantagessuch as for example:
• Reduction of interferences between an-nouncements to a lesser degree
• Lower noise levels or data contaminationdue to unscheduled extraordinary events.
• Since getting out of the market repre-sents a cost (spreads, commissions, li-quidity issues, opportunity costs), short-er intervals may aid managers in thedecision-making process as opposed tocoarser (i.e. hourly) intervals due to theincreased precision.
• Unlike other authors which focused theirefforts on a few indicators or limited to asingle country, a wider spectrum of indi-cators and countries/currencies havebeen covered.

28 CUADERNO DE ECONOMÍA • 4
• Most of the bibliography present quali-tative estimates for different indicators(i.e. Baumohl)(5) regarding their relativeimpact over exchange rates, this re-search shed light in quantifying such ef-fects for the period under research(Jan2003-Jun2008) as well as determin-ing the statistical significance of the im-pact of such indicators.
• Based on a strict methodology, a rawdirty data source has been turned into ahigh quality economic indicator andquotes database with data properly fil-tered, validated, codified, in a consistenttime zone and even containing indica-tor interferences among releases. Thisinformation may become extremely val-uable for both researchers and quantpractitioners.
• On top of indicator interferences, intra-day, weekly and monthly seasonality weretaken into account when sampling datain order to perform each hypothesis test-ing, with reasonably large sample sizes.
On the other hand, the following issueswere identified, reported and represent re-search topics to be addressed in future researchefforts:
• As we worked with samples covering acertain time frame, statistical absence ofevidence of the impact of a given indi-cator over exchange rates does not nec-essarily imply “evidence of no absence”of the abovementioned effects. Perhapsthere were no news within a given sam-ple, or the effect of an extreme event wasdiluted by a majority of releases lackingnews thus leading us to conclude thatthere is no statistical evidence in orderto reject the null hypothesis. We have notempirically analyzed this possibility be-ing a suggested further research topic.
• Relevant announcements such as the USGDP and Trade Balance unfortunatelyhave not been taken into account dueto the overlapping interference withhigher release frequency indicators.
• For indicators such as the US unemploy-ment /NFP/labor data releases we had noother choice than analyzing them to-gether as a single indicator as, althoughwe have not attempted to prove causal-ity in any of the cases, it is unlikely that itcould be quantitatively attributed. Pressand practitioners stress that NFP are themost significant one but quantitativelyfrom our research we unfortunately can-not provide any confirmation.
Taking into account the abovementionedframework, the following items naturallyemerge as suggestions for future research:
• Unlike other countries, the unemploy-ment rate in UK and Europe did notproved to be significantly affect over thetick frequency and volatility, strikingobservations given the importance ofsuch indicators over monetary policydecisions thus deserving further inves-tigation.
• Local pre and post-release behavior of thevariables under research on a high-fre-quency basis (temporal effects), volatilitydecay patterns relative to the type of in-dicator; speeches vs. data releases, etc.
• Determine relative country-weights forEuropean releases.
Bibliography
ANDERSEN, T., T. BOLLERSLEV, F. DIEBOLD & C. VEGA(2003): “Micro effects of macro announcements:Real-time price discovery in foreign exchange”,American Economic Review, 93: 38-62.
— (2007): “Real-Time Price Discovery in Stock, Bondand Foreign Exchange Markets”, Journal of Inter-national Economics, 73, 251-277.
BALDUZZI, P., E.J. ELTON & T.C. GREEN (1998): EconomicNews and the Yield Curve: Evidence from the U.S.Treasury Market, Salomon Center Working PaperS-98-5, Stern School of Business, New York Uni-versity.
BARTOLINI, L., L. GOLDBERG & A. SACARNY (2008): “HowEconomic News Moves Markets”, Federal ReserveBank of New York, Vol. 14, Nr 6.
A. A. BAGNASCO, N. SÁNCHEZ Y J. C. SAPRIZA • THE EFFECT OF ECONOMIC DATA RELEASES… 29
BAUMOHL, Bernard (2005): The Secrets of EconomicIndicators, Hidden Clues to Future EconomicTrends and Investments Opportunities, WhartonSchool Publishing.
BAUWENS, L., W. BEN OMRANE & P. GIOT (2005): “NewsAnnouncements, Market Activity and Volatilityin the Euro/Dollar Foreign Exchange Market”,Journal of International Money and Finance, 24,1108-1125.
BANK FOR INTERNATIONAL SETTLEMENTS (BIS) (2007):Foreign Exchange Triennial Bank Survey, ‹www.bis.org/statistics/index.htm›, data gatheredsince Jan, 2008.
CHABOUD, Alain P., Sergei V. CHERNENKO, EdwardHOWORKA, Raj S. KRISHNASAMI IYER, LIU David yJonathan H. WRIGHT (2004): “The High-FrequencyEffects of U.S. Macroeconomic Data Releases onPrices and Trading Activity in the Global InterdealerForeign Exchange Market, Board of Governors ofthe Federal Reserve System, International Fi-nance Discussion Papers, Nr 823, November.
EDDELBUTTEL, D., & T.H. MCCURDY (1998): The Impactof News on Foreign Exchange Rates: Evidence fromHigh Frequency Data, Manuscript, RotmanSchool of Management, University of Toronto.
Forex News, Global Calendar (Anuncios Económicos),‹www.forexnews.com›, data gathered since Sep,2008
GUENÇAY, Ramazan, Michel DACOROGNA, Ulrich A.MÜLLER, Olivier PICTET & Richard OLSEN (2001):An Introduction to High Frequency Finance, Aca-demic Press.
LAAKKONEN, H. (2004): “The Impact of macroeco-nomic news on exchange rate volatility”, Bankof Finland discussion paper Nr 24.
LAAKKONEN, H., & M. LANNE (2008): “Asymmetric NewsEffects on Volatility: Good vs. Bad News in Goodvs. Bad Times”, University of Helsinki, MPRA Pa-per Nr 8296, posted 17.
NATIONAL BUREAU OF ECONOMIC RESEARCH: EconomicIndicators and Releases, ‹www.nber.org/releases/›, data gathered since October, 2008.
PARKER, John C. (2007): The Impact of Economic Newson Financial Markets, Relevant Economics Con-sulting Ltd., Toronto.
PICKER, Anne Dolganos (2007): “International eco-nomic indicators and central banks”, John Wiley& Sons - New Jersey.
RENTA FOREX, ‹www.rentaforex.com›, data gatheredsince Jan 2008.
SÁNCHEZ, N., & J. SAPRIZA (2009): Influencia de losanuncios económicos en el mercado Forex dedivisas utilizando datos de alta frecuencia, Catho-lic University Thesis.
TALEB, Nassim N. (2007): The Black Swan. The impactof the highly improbable, Random House.
TAKATOSHI, I., & Y. HASHIMOTO (2006): “Intra-Day Sea-sonality in Activities of the Foreign ExchangeMarkets: Evidence from the Electronic BrokingSystem”, National Bureau of Economic Research,Working Paper 12413, July 2006.
TRADER FOREX, Anuncios Económicos, ‹www.traderforex.eu/es›, data gathered since October,2008.
WILDER, J. Welles (1978): New Concepts in TechnicalTrading Systems.
ZWICK, Steve (2007): Capricorn FX; Tested MethodsThat Work, Futures Magazine Group.
Economic Announcement Coding
Due to space constraints, tables, full data-sets and calendars were not included in thispaper; please contact the authors for datasetrequests, questions and feedback. Such infor-mation is also available at the Uruguayan Cath-olic University under Sánchez y Sapriza (2009).