Method for rapid high-frequency seismogram calculation
10
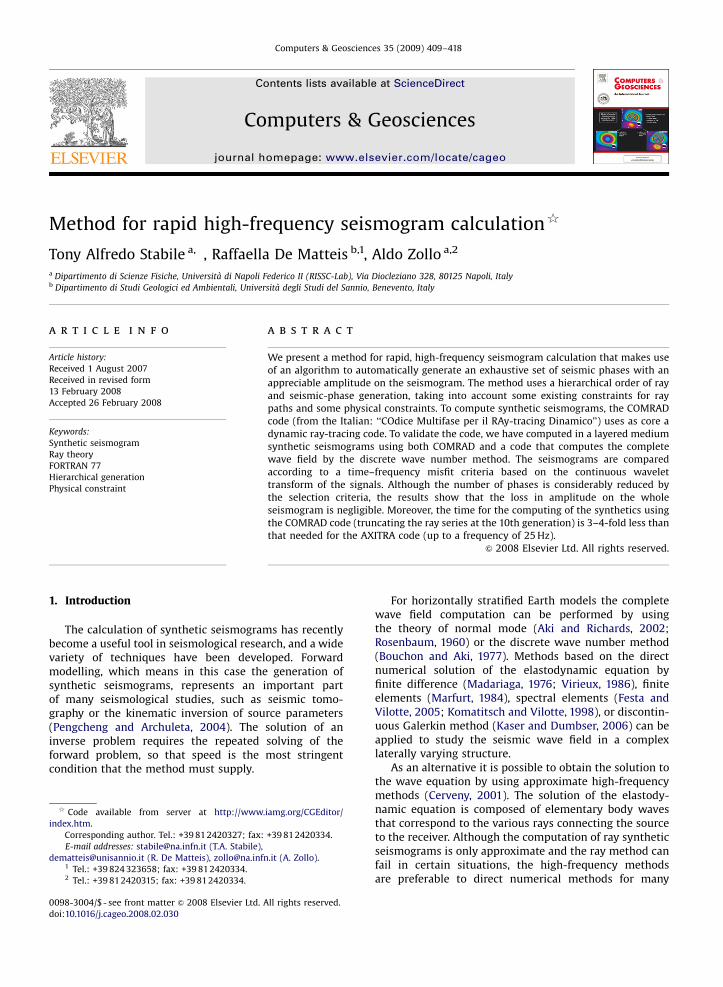
Method for rapid high-frequency seismogram calculation $ Tony Alfredo Stabile a, , Raffaella De Matteis b,1 , Aldo Zollo a,2 a Dipartimento di Scienze Fisiche, Universita ` di Napoli Federico II (RISSC-Lab), Via Diocleziano 328, 80125 Napoli, Italy b Dipartimento di Studi Geologici ed Ambientali, Universita ` degli Studi del Sannio, Benevento, Italy article info Article history: Received 1 August 2007 Received in revised form 13 February 2008 Accepted 26 February 2008 Keywords: Synthetic seismogram Ray theory FORTRAN 77 Hierarchical generation Physical constraint abstract We present a method for rapid, high-frequency seismogram calculation that makes use of an algorithm to automatically generate an exhaustive set of seismic phases with an appreciable amplitude on the seismogram. The method uses a hierarchical order of ray and seismic-phase generation, taking into account some existing constraints for ray paths and some physical constraints. To compute synthetic seismograms, the COMRAD code (from the Italian: ‘‘COdice Multifase per il RAy-tracing Dinamico’’) uses as core a dynamic ray-tracing code. To validate the code, we have computed in a layered medium synthetic seismograms using both COMRAD and a code that computes the complete wave field by the discrete wave number method. The seismograms are compared according to a time–frequency misfit criteria based on the continuous wavelet transform of the signals. Although the number of phases is considerably reduced by the selection criteria, the results show that the loss in amplitude on the whole seismogram is negligible. Moreover, the time for the computing of the synthetics using the COMRAD code (truncating the ray series at the 10th generation) is 3–4-fold less than that needed for the AXITRA code (up to a frequency of 25 Hz). & 2008 Elsevier Ltd. All rights reserved. 1. Introduction The calculation of synthetic seismograms has recently become a useful tool in seismological research, and a wide variety of techniques have been developed. Forward modelling, which means in this case the generation of synthetic seismograms, represents an important part of many seismological studies, such as seismic tomo- graphy or the kinematic inversion of source parameters (Pengcheng and Archuleta, 2004). The solution of an inverse problem requires the repeated solving of the forward problem, so that speed is the most stringent condition that the method must supply. For horizontally stratified Earth models the complete wave field computation can be performed by using the theory of normal mode (Aki and Richards, 2002; Rosenbaum, 1960) or the discrete wave number method (Bouchon and Aki, 1977). Methods based on the direct numerical solution of the elastodynamic equation by finite difference (Madariaga, 1976; Virieux, 1986), finite elements (Marfurt, 1984), spectral elements (Festa and Vilotte, 2005; Komatitsch and Vilotte, 1998), or discontin- uous Galerkin method (Kaser and Dumbser, 2006) can be applied to study the seismic wave field in a complex laterally varying structure. As an alternative it is possible to obtain the solution to the wave equation by using approximate high-frequency methods (Cerveny, 2001). The solution of the elastody- namic equation is composed of elementary body waves that correspond to the various rays connecting the source to the receiver. Although the computation of ray synthetic seismograms is only approximate and the ray method can fail in certain situations, the high-frequency methods are preferable to direct numerical methods for many Contents lists available at ScienceDirect journal homepage: www.elsevier.com/locate/cageo Computers & Geosciences ARTICLE IN PRESS 0098-3004/$ - see front matter & 2008 Elsevier Ltd. All rights reserved. doi:10.1016/j.cageo.2008.02.030 $ Code available from server at http://www.iamg.org/CGEditor/ index.htm. Corresponding author. Tel.: +39 812420327; fax: +39 812420334. E-mail addresses: [email protected] (T.A. Stabile), [email protected] (R. De Matteis), [email protected] (A. Zollo). 1 Tel.: +39 824 323658; fax: +39 812420334. 2 Tel.: +39 812420315; fax: +39 812420334. Computers & Geosciences 35 (2009) 409–418
Transcript of Method for rapid high-frequency seismogram calculation
ARTICLE IN PRESS
Contents lists available at ScienceDirect
Computers & Geosciences
Computers & Geosciences 35 (2009) 409–418
0098-30
doi:10.1
$ Cod
index.h� Cor
E-m
dematte1 Te2 Te
journal homepage: www.elsevier.com/locate/cageo
Method for rapid high-frequency seismogram calculation$
Tony Alfredo Stabile a,�, Raffaella De Matteis b,1, Aldo Zollo a,2
a Dipartimento di Scienze Fisiche, Universita di Napoli Federico II (RISSC-Lab), Via Diocleziano 328, 80125 Napoli, Italyb Dipartimento di Studi Geologici ed Ambientali, Universita degli Studi del Sannio, Benevento, Italy
a r t i c l e i n f o
Article history:
Received 1 August 2007
Received in revised form
13 February 2008
Accepted 26 February 2008
Keywords:
Synthetic seismogram
Ray theory
FORTRAN 77
Hierarchical generation
Physical constraint
04/$ - see front matter & 2008 Elsevier Ltd. A
016/j.cageo.2008.02.030
e available from server at http://www.
tm.
responding author. Tel.: +39 812420327; fax:
ail addresses: [email protected] (T.A. Stabile),
[email protected] (R. De Matteis), [email protected]
l.: +39 824 323658; fax: +39 812420334.
l.: +39 812420315; fax: +39 812420334.
a b s t r a c t
We present a method for rapid, high-frequency seismogram calculation that makes use
of an algorithm to automatically generate an exhaustive set of seismic phases with an
appreciable amplitude on the seismogram. The method uses a hierarchical order of ray
and seismic-phase generation, taking into account some existing constraints for ray
paths and some physical constraints. To compute synthetic seismograms, the COMRAD
code (from the Italian: ‘‘COdice Multifase per il RAy-tracing Dinamico’’) uses as core a
dynamic ray-tracing code. To validate the code, we have computed in a layered medium
synthetic seismograms using both COMRAD and a code that computes the complete
wave field by the discrete wave number method. The seismograms are compared
according to a time–frequency misfit criteria based on the continuous wavelet
transform of the signals. Although the number of phases is considerably reduced by
the selection criteria, the results show that the loss in amplitude on the whole
seismogram is negligible. Moreover, the time for the computing of the synthetics using
the COMRAD code (truncating the ray series at the 10th generation) is 3–4-fold less than
that needed for the AXITRA code (up to a frequency of 25 Hz).
& 2008 Elsevier Ltd. All rights reserved.
1. Introduction
The calculation of synthetic seismograms has recentlybecome a useful tool in seismological research, and a widevariety of techniques have been developed. Forwardmodelling, which means in this case the generation ofsynthetic seismograms, represents an important partof many seismological studies, such as seismic tomo-graphy or the kinematic inversion of source parameters(Pengcheng and Archuleta, 2004). The solution of aninverse problem requires the repeated solving of theforward problem, so that speed is the most stringentcondition that the method must supply.
ll rights reserved.
iamg.org/CGEditor/
+39 812420334.
.it (A. Zollo).
For horizontally stratified Earth models the completewave field computation can be performed by usingthe theory of normal mode (Aki and Richards, 2002;Rosenbaum, 1960) or the discrete wave number method(Bouchon and Aki, 1977). Methods based on the directnumerical solution of the elastodynamic equation byfinite difference (Madariaga, 1976; Virieux, 1986), finiteelements (Marfurt, 1984), spectral elements (Festa andVilotte, 2005; Komatitsch and Vilotte, 1998), or discontin-uous Galerkin method (Kaser and Dumbser, 2006) can beapplied to study the seismic wave field in a complexlaterally varying structure.
As an alternative it is possible to obtain the solution tothe wave equation by using approximate high-frequencymethods (Cerveny, 2001). The solution of the elastody-namic equation is composed of elementary body wavesthat correspond to the various rays connecting the sourceto the receiver. Although the computation of ray syntheticseismograms is only approximate and the ray method canfail in certain situations, the high-frequency methodsare preferable to direct numerical methods for many

ARTICLE IN PRESS
T.A. Stabile et al. / Computers & Geosciences 35 (2009) 409–418410
applications, both for the shorter computing times and forthe full interpretability of the seismograms. The problemsarise when we want to use a synthetic seismogram assimilar to the real one as possible in the high-frequencyapproximation, such that the seismogram should berelatively complete, although it is not necessary that itcontains every feature of the full elastic wave field. It isbecoming necessary to select from all of the raysconnecting the source to the receiver only those thatproduce an appreciable amplitude on the seismogram.The problem of generating a comprehensive set of rayswas approached for the first time by Hron (1971, 1972)and Hron et al. (1986) for layered media, by groupingindividual rays into families of kinematic equivalents.Afterwards, Clarke (1993a, b) developed a technique forcomputing synthetic seismograms based on a ray-genera-tion algorithm that involved the symbolic manipulation ofcomplete wave field expressions from the reflectivitytheory, which were truncated to produce a finite rayseries.
In this study, we propose a new technique for the rapiddefinition of an exhaustive set of rays that is based on thehierarchic generation of strings that describe the ray pathsand the phase types. The string generation is subjected tophysical constraints that are related to the propagationmedium and the source–receiver geometry. The ray setswill represent the input of a kinematic or dynamicray-tracing algorithm (i.e. Cerveny and Hron, 1980; Farraand Madariaga, 1987; Snieder and Spencer, 1993; Virieux,1991). In particular, the technique developed has beenimplemented in the multiphase dynamic ray-tracingCOMRAD code (from the Italian: ‘‘COdice Multifase per ilRAy-tracing Dinamico’’) that uses as its core the dynamicray-tracing code provided by Farra and Madariaga (1987).
2. Method
Our goal is to develop an algorithm that rapidlygenerates an exhaustive number of seismic phases tocalculate a high-frequency seismogram as complete aspossible. In particular, the computing time is a criticalparameter when the computation of synthetic seismo-grams has to be repeated many times in the inversionprocesses. The amplitudes, the ray paths and the traveltimes of the seismic phases are computed by the dynamicray-tracing code provided by Farra and Madariaga (1987).In this section we describe our method and the discretiza-tion of the propagation model.
2.1. General concepts
It is possible to use an arbitrary medium as long as it isdiscretized by M ordered elements between a free surfaceand a halfspace. The sequential elements are separated bya surface. Each element can have an arbitrary shape and ischaracterized by the following properties:
�
Vpi: compressive wave velocity (P-wave); � Vsi: shear wave velocity (S-wave); � ni: density;�
Qpi: P-wave quality factor (optional); � Qsi: S-wave quality factor (optional); � Ti: top surface of the element; � Bi: bottom surface of the element ( ¼ Ti+1: top surfaceof the next element);
� i ¼ 1,y, M: index of the element.where the elastic wave velocities, densities, and qualityfactors are functions of spatial coordinates.
Both the source and the receivers take the index i of theelement in which they are included. Each ray goes fromthe source to the receiver and is divided into L curves if itpasses through L elements. Each ray is described by anumerical string composed of L numbers, and each one isthe index of the element crossed by the ray. For a ray thereare also 2L phase numerical strings, because in eachelement crossed by the ray the wave can have twodifferent polarizations (P-wave or S-wave). A numericalstring for a phase is composed of L numbers and eachone can be 1 (to indicate a P-wave) or 2 (to indicate anS-wave).
As an example, we can consider a medium where theelements are three horizontal, parallel layers, with asource inside the third layer, and a receiver inside the firstlayer. In this case, the ray path of the direct wave isdescribed by the ray string 3–2–1 at which correspond 23
phase strings.Although the algorithm can generate only body waves,
it is possible to calculate headwaves’ travel times using anartefact. We can consider a tiny element between twoelements, with the same properties of the second one, andgenerate a ray string relative to a wave that propagatesinside the tiny element. The travel time obtained for thatwave is about equal to that for a headwave, but theamplitude is not correct.
2.2. Selection criteria
Once the length L of the numerical ray string is fixed,there are ML ray strings of the same length if the mediumis discretized by M elements. However, not all of the raystrings describe a real ray, because there are someexistence constraints for a ray path:
(a)
The ray starts at the source; (b) the ray arrives at the receiver; (c) the ray path is bordered by the free surface and thehalf space;
(d) if a ray points towards the top surface of the ithelement, it can remain in the same element(with opposite direction) or go to the (i�1)th element(with the same direction);
(e)
if a ray points towards the bottom surface of the ithelement, it can remain in the same element(with opposite direction) or go to the (i+1)th element(with the same direction);(f)
if the receiver is on the free surface, the ray must comefrom below;(g)
if the source is on the free surface, the startingdirection of each ray cannot be up.
ARTICLE IN PRESS
T.A. Stabile et al. / Computers & Geosciences 35 (2009) 409–418 411
To generate only the ray strings that describe real raypaths, we use a hierarchic order of ray generation, wherethe root (first generation) is the index of the element thatcontains the source, and the number of generations is thelength of the numerical strings of the rays. The hierarchicorder of ray generation satisfies itself for the (a), (b), and(c) constraints. Indicating with S the source index andwith R the receiver index, the generation that produce theray string of minimum length, that is the direct ray, isgiven by the number Lmin ¼ jS–Rj+1. An example ofhierarchic ray generation taken to the fourth generationfor a source in the third element (S ¼ 3) and a receiver inthe first element (R ¼ 1), where the medium is discretizedby M ¼ 5 elements, is shown in Fig. 1. In this case we have,on the whole, four ray strings (3–2–1, 3–2–1–1, 3–3–2–1,and 3–2–2–1) up to the fourth generation that satisfy the(a), (b), and (c) constraints.
Using the additional (d), (e), (f), and (g) constraints, wediscard some branches inside the numerical string tree. Inparticular, putting the receiver on the free surface the raystrings selected are shown in Fig. 2. Now we have only tworay strings (3–2–1 and 3–3–2–1) up to the fourthgeneration. If we put the receiver inside the first elementinstead of on the free surface, we will have the additionalray string 3-2-1-1 because there is no (f) constraint yet,and consequently the ray can arrive at the receiver alsofrom above.
Since the number of phase strings becomes greater andgreater if the number of generations increases, andconsequently the computing time rises, it is possible to
Fig. 1. Tree structure of ray strings stopped to fourth generation. Root,
that is source position, is number three. Grey circles identify, for each
generation, last component of strings that satisfy the (b) selection
criterion. We have four ray strings up to fourth generation.
Fig. 2. Tree structure of ray strings stopped to fourth generation as in
Fig. 1, but using all of (a)–(g) constraints. There are only two ray strings
up to fourth generation because the receiver is on free surface. If the
receiver is inside the first element, there will also be string 3-2-1-1. Ray
paths relative to two selected ray strings in a layered velocity model are
shown on right. White star is for source and white triangle is for receiver.
introduce some constraints on the propagation in order toreduce the number of phases. For this reason, we createdthe following additional constraints on ray paths andphases:
(I)
Maximum number of generations that means thetruncation of ray series;(II)
maximum number of reflections in each element; (III) phase selection based on their expected amplitudevalues.
In agreement with the ray theory there are infinite raysthat propagate form the source to the receiver, but there isalso a loss of the initial ray energy whenever it has areflection/transmission on a discontinuity, besides theenergy lost for geometric and anelastic attenuation. Aftera certain number of generations, the ray strings representthose rays that have encountered so many discontinuitiesas to have a negligible energy. For this reason it is possibleto truncate the ray series at a certain generation withoutsignificant loss in energy, this is the principle on which isfounded the (I) constraint. In particular, the defaultmaximum number of generation is fixed by the numberLmax ¼ Lmin+2M, which guarantees a complete investiga-tion of the propagation medium.
The (II) constraint assumes that a ray trapped inside anelement has a loss in energy bigger than the energy lost byuntrapped rays, especially for deeper elements. Using the(II) constraint, a ray string will be accepted only if itsatisfies the condition:
ðn� 1ÞipRIFM (1)
with n is the number of consecutive multiple reflectionsof the ray inside the ith element, i the element index, andRIFM a number that controls the multiple reflections (thedefault value is RIFM ¼ 8). Using the RIFM default valuewe can have maximum nine consecutive reflections in thefirst element (the shallowest), five consecutive reflectionsin the second, three in the third and the fourth, two fromthe fifth to the eighth, and only one for the others.
The (III) constraint is developed following this scheme:
�
For each kth component of the phase string a weightwk, from 0 to 1, is assigned; � once the weight is assigned, the phase string will beaccepted only if it satisfies the condition:
YL
k¼1
wkXPHS (2)
where L is the length of the phase string and PHS is anumber that represents a percentage of the weightsproduct assigned to the direct P-wave (the defaultpercentage is 1�10�4%).
Here we describe how the weights wk have beencalculated. For each incident phase (P or S) on theboundary between two elements, we have to calculateeach time the scattering coefficient relative to one of theeight phases that can be generated for reflection/trans-mission/conversion (PrP, PrS, PtP, PtS, SrP, SrS, StP, StS;

ARTICLE IN PRESS
1.2
1
0.8
0.6
0.4
0.2
00.4 0.6 0.8 1.0 1.2 1.4 1.6 1.8 2.0 2.2 2.4 2.6 2.8
Vp1/Vp2
Inte
gral
of
scat
teri
ng c
oeff
icie
nt
P wave coming from the top
I II III IV V a,bcde
ptpprpptsprs
Fig. 3. Integral of scattering coefficients for an incident P-wave, as a
function of Vp1/Vp2 ratio between P-wave velocity in medium 1 (that
contains incident wave) and P-wave velocity in medium 2 (that contains
transmitted wave). Colour of curves refers to different type of phases,
while style of curves is relative to different velocity models reported in
Table 1. Five regions I, II, III, IV, and V, separated by vertical lines, are
defined in Table 2.
1.2
1
0.8
0.6
0.4
0.2
00.4 0.6 0.8 1.0 1.2 1.4 1.6 1.8 2.0 2.2 2.4 2.6 2.8 3.0 3.2 3.4
Vs1/Vs2
Inte
gral
of
scat
teri
ng c
oeff
icie
nt
S wave coming from the top
I II III IV V a,bcde
stssrsstpsrp
Fig. 4. As for Fig. 3 but referring to an incident S-wave as a function of
Vs1/Vs2 ratio between S-wave velocity in medium 1 and S-wave velocity
in medium 2.
T.A. Stabile et al. / Computers & Geosciences 35 (2009) 409–418412
where r indicates the reflection and t the transmission).These coefficients are functions of the incidence angle andthe physical parameters (P-wave velocity, S-wave velocity,and density) of the elements crossed by the wave. Theircalculation requires both computing time and the valuesof the incidence angles, but the latter are known only afterray tracing. To overcome the problem, the weights wk aredefined for each type of interface and for each type ofphase independent of the incidence angle. Indeed, todefine the weights, we have calculated, for each one of theeight scattering coefficients, the integral on the wholeinterval of the incidence angle, dividing the result for thesame interval. The values obtained for the four phases thatan incident wave can generate (PrP, PrS, PtP, PtS for aP-wave; SrP, SrS, StP, StS for an S-wave) are normalizedsuch that their sum is equal to one. This computation iscarried out varying the interface parameters, that is thevalues of the P-wave velocities, S-wave velocities, anddensities of the elements separated by discontinuity(Table 1). Precisely, S-wave velocities have been deter-mined from P-wave velocities using different values of theVp/Vs ratio, while densities have been calculated using thefollowing empirical formula of Ludwig et al. (1970):
r ¼ 0:7þ 2:23v� 0:598v2 þ 0:0704v3 � 0:00283v4 (3)
with r the density in g/cm3 and v the P-wave velocity inkm/s. The results show that for an incident P-wavethe value of the integral, defined previously, dependsessentially on the Vp1/Vp2 ratio (indexes 1 and 2 indicatethe medium that contains the incident wave and themedium that contains the transmitted wave, respectively).Likewise for an incident S-wave the integral depends onthe Vs1/Vs2 ratio. In fact, as shown in Figs. 3 and 4,the curves relative to the different cases reported inTable 1 have a similar shape for each type of phase(i.e. PtP, PrP, etc.).
To avoid the construction of an indexed table for eachphase and for each value of Vp1/Vp2 and Vs1/Vs2 we haveselected only five intervals of these ratios. The weightassigned to each phase will correspond to the maximumof the corresponding integral curve inside each region.This allows the realization of a smaller indexed table(Table 2) that contains the weights to assign to thecomponents of the phase strings. Moreover, the weightassigned to a component of the phase string is equal tozero if in the ith element the component indicates anS-wave and Vsio0.1 m/s. From Eq. (2) this implies that thewhole phase string is rejected.
Table 1Different velocity models to study the effect of boundary between an
half-space that contains incident wave (labelled by number 1) and an
half-space that contains transmitted wave (labelled by number 2)
Velocity model Vp1 (km/s) Vp1/Vs1 Vp2 (km/s) Vp2/Vs2
A 2.50 1.73 1.8–7.0 1.73
B 7.00 1.73 1.8–7.0 1.73
C 3.40 1.73 1.8–7.0 3.50
D 4.00 3.50 1.8–7.0 1.73
E 4.00 2.00 1.8–7.0 2.00
3. Structure of the COMRAD code
The Comrad.f code is the Fortran77 version of multi-phase code that, based on selection criteria, generates anexhaustive set of ray and phase strings allowing thecomputation of a seismogram as complete as possible. Inorder to compute synthetic seismograms, that is traveltimes, amplitudes, and ray paths relative to the selectedphases, it uses as its core the dynamic ray-tracingcode developed by Farra and Madariaga (1987), whichneeds a medium discretized by flat tilted layers. However,the COMRAD code can be easily implemented withother dynamic ray-tracing programs that can work on3-D models with irregular discontinuities. The code is

ARTICLE IN PRESS
Fig. 5. Block scheme of the Comrad.f computer code.
Table 2Weights assigned for each region, defined by z parameter, and for each
type of phase
Type of
phase
Region I Region II Region III Region IV Region V
zo0.5 0.5ozo0.8 0.8ozo0.95 0.95ozo1.2 1.2oz
PtP 0.17 0.45 0.73 1.00 0.71
PrP 0.70 0.69 0.37 0.24 0.35
PtS 0.21 0.24 0.21 0.25 0.27
PrS 0.51 0.35 0.19 0.12 0.21
StS 0.50 0.92 0.98 1.00 0.96
SrS 0.90 0.66 0.19 0.10 0.16
StP 0.01 0.02 0.02 0.02 0.17
SrP 0.17 0.07 0.03 0.03 0.05
z parameter is equal to Vp1/Vp2 ratio for an incident P-wave or equal to
Vs1/Vs2 ratio for an incident S-wave.
T.A. Stabile et al. / Computers & Geosciences 35 (2009) 409–418 413
accompanied by the bash script multiphase.sh, whichoptimizes the whole calculation process and runs both theCOMRAD and core programs.
The structure of the code is shown in Fig. 5, where weoutline its most important features. The code requires thefollowing input data:
�
a file (creation.inp) that contains the medium informa-tion; � a file (xxxx.dis, where xxxx represents a four-characterword) that contains the source–receiver geometry;
� the maximum number of generations (Lmax), whichtruncates the ray series. The user can choose to use thedefault value (Lmax ¼ Lmin+2m);
� the multiple reflections parameter (RIFM), whichallows the ray to have a finite number of reflectionsin each element. The user can choose to use the defaultvalue (RIFM ¼ 8);
� the phase selection parameter (PHS), which discardsphases with negligible amplitudes. The user canchoose to use the default value (calculated on the
approximated amplitude value of the direct P-waveand fixed at 1�10�4% of this value);
� the initial polarization of the phases (P or S).Using the hierarchical generation method with theconstraints described previously, the code generatesthe ray and phase strings and creates the followingoutput data:
� a file (kernel.inp) that contains the input parametersfor the core;
� two files (xxx1.dis and xxx2.dis, where xxx representsa three character word) inside which the Comrad.fcode will write all of the ray and phase strings to beused by the core program for the computation of thesynthetics. The first file describes rays where theirstarting direction is up, and the second, where it isdown. These two files are very important also to searchthe type of phase identified on the output seismo-grams, since they contains the list of the ray and phasestrings.
The existence of the two xxx1.dis and xxx2.dis filesassures the calculations of both the P/P\ (where S/ or P/indicates an upcoming S- or P-wave and S\ or P\ adowngoing S- or P-wave, respectively) and P\P/ phases(and similar), although they are described by the same rayand phase strings if the source and the receiver are both inthe same element (i.e. the ray string is 1–1 both for P/P\
and P\P/ phases if the source and the receiver are in thefirst element of the medium). Moreover, if the source is onthe free surface, the xxx1.dis does not exist because of the(g) constraint.
In order to select the appropriate weight for each typeof phase we have transformed Table 2 in a 3D-matrix ofindexes Z, RT, and POL. The RT index indicates if there is areflection or a transmission; it is equal to 1 for atransmission and 2 for a reflection. The POL indexindicates the polarization of the phase before and after areflection/transmission; it is equal to 1 for PP, 2 for PS, 3for SP, and 4 for SS. Z indicates the number of the region(see Figs. 3 and 4) containing the Vp1/Vp2 ratio (for anincident P-wave) or Vs1/Vs2 ratio (for an incident S-wave)values. To avoid the introduction in the comrad.f programa great number of control instructions to verify the indexvalues, we have searched two relations (Eqs. (4) and (5))that directly determine the values of the RT and POL
indexes. The value of the RT index is obtained from Eq. (4):
RT ¼ ud1� ud2�� ��þ 1 (4)
with ud1 and ud2 are the directions (1 for up and 2 fordown) of the ith component and the i+1th component ofthe ray string, respectively. The value of the POL index isobtained instead from Eq.(5):
POL ¼ 2aþ b� 2 (5)
where a and b are the polarizations (1 for a P-wave and 2for an S-wave) of the ith component and the i+1thcomponent of the phase string, respectively.
After the COMRAD and core programs have finished,the output consists of files containing the Green functionand a list of ray paths, travel times and amplitudes for allthe phases. If more than one receiver is considered it is

ARTICLE IN PRESS
T.A. Stabile et al. / Computers & Geosciences 35 (2009) 409–418414
possible to produce a synthetic section for each compo-nent (X, Y, and Z).
4. Validation of the method
The higher the number of generations we consider, thehigher the number of phases the core must calculate. Tomake the best choice on the number of generations, wehave to compare the calculation time with the complexitywe need for the synthetics. We compute syntheticseismograms for two receivers (R1 and R2), respectively,at 1 and 30 km distance from the epicentre of an explosivesource. The source function is a triangle with a duration of0.1 s, but it is possible to choose other source functions(i.e. Sinusoidal, Gaussian, Ricker, etc.) and change theduration and the frequency. We use a crustal velocitymodel (Bernard and Zollo, 1989), where the elements areconsidered in this case as horizontal parallel layers. Themodel is described in Table 3, while the results of thesimulations are given in Table 4. Only the geometricalspreading is considered in the computation of syntheticsand no headwaves are considered since we can computeonly their travel times and not the amplitudes.
The source depth is 4 km, and both of the receivers areat 1 m in depth. For this source–receiver geometry, thesource is in the second layer, the receivers are in the firstlayer and the first real phases start at the secondgeneration. In Table 4, for each generation, the timeneeded by both the COMRAD and core programs for thecalculations can be seen, along with the total number ofphases and the RMS calculated for both of the receiversand for both of the X and Z components of theseismogram. The RMS is a measure of the similarity
Table 3Crustal velocity model used for simulations
Interfaces Depth (km) Vp (km/s) Vs (km/s) r(g/cm3)
1 0 2.30 1.33 2.2
2 3 5.30 3.06 2.3
3 7 6.00 3.46 2.4
4 10 6.28 3.63 2.6
5 20 6.54 3.78 2.8
Table 4Computing time of COMRAD and core codes, number of phases, and RMS com
distance from the source, respectively
N. GEN. Comrad time (s) Core time (s) N. phases
2 0 m 00.05 0 m 00.06 2
3 0 m 00.05 0 m 00.15 10
4 0 m 00.05 0 m 00.29 34
5 0 m 00.05 0 m 01.13 114
6 0 m 00.05 0 m 04.42 370
7 0 m 00.05 0 m 16.84 1266
8 0 m 00.05 1 m 07.45 4210
9 0 m 00.11 4 m 18.82 14,706
10 0 m 00.27 16 m 18.15 49,522
11 0 m 01.18 1 h 00 m 23.47 174,450
12 0 m 03.39 3 h 40 m 56.38 590,194
between two signals and in Table 4 it is calculatedbetween the synthetic seismogram obtained at eachgeneration (S(t)) and that obtained for the previousgeneration (SREF(t)). The RMS is defined as follows:
RMS ¼
ffiffiffiffiffiffiffiffiffiffiffiffiffiffiffiffiffiffiffiffiffiffiffiffiffiffiffiffiffiffiffiffiffiffiffiffiffiffiffiPtjSðtÞ � SREF ðtÞj
2PtjSREF ðtÞj
2
s(6)
where t is the time. The amplitudes of the seismogramsare normalized with respect to their maximum ampli-tudes. The calculations are carried out using a PC with anAMD-3 GHz processor and 2 Mb SD-RAM memory.
We show the results up to the 12th generation sincethe RMS becomes negligible at the expense of an excessivecomputing time. From Table 4, it is clear that the RMS islower and lower as a function of the number ofgenerations. Moreover, starting from the RMS calculatedbetween the 9th and 10th generations, the RMS decreaserate at 30 km distance becomes stable for both the X and Z
components. This means that if we truncate the ray seriesat the 10th generation we obtain little values both for theRMS and the computing time.
If we take into account also the propagation con-straints it is possible to reduce further the number ofphases created at each generation. The selection on thephase strings is controlled by the RIFM and the PHS
parameters discussed in the previous paragraph. In orderto evaluate the changes on the seismogram due to theapplication of these constraints, we calculate the RMS, thecomputing time, and the number of phases for differentvalues of RIFM and PHS parameters. In particular we usedRIFM ¼N, when the constraint is not used, and thedefault value RIFM ¼ 8. The test is performed on theseismogram obtained at the 10th generation for bothreceivers R1 and R2 of the previous model. The RMS iscomputed using as reference signal both the sameseismogram but complete with all phases and theseismogram computed at the 12th generation completewith all phases. As we can see in Table 5 the use ofthe RIFM parameter can reduce the number of phases(and then the computing time) from 2% to 20%, but thisreduction depends on the choice of the PHS value (it isbigger for lower PHS values). On the other hand, PHS is acrucial parameter able to reduce considerably the number
puted at each generation for both receivers R1 and R2, at 1 and 30 km
RMS RMS RMS RMS
R1-CompX R1-CompZ R2-CompX R2-CompZ
– – – –
1.037 0.992 4.628 4.789
0.108 0.104 0.980 0.932
0.107 0.103 0.262 0.340
0.027 0.144 0.440 0.494
0.026 0.028 0.398 0.399
0.008 0.010 0.186 0.252
0.008 0.010 0.131 0.220
0.002 0.004 0.087 0.109
0.002 0.004 0.077 0.092
0.001 0.002 0.037 0.058

ARTICLE IN PRESS
Table 5Horizontal (CompX) and vertical (CompZ) components of seismograms are considered.
Computing time of COMRAD (+core) code, number of phases, and RMS computed at each generation for both receivers R1 and R2, at 1 and 30 km
distance from the source, respectively
PHS (%) RIFM Comrad time (s) N. phases RMS-10th RMS-10th RMS-12th RMS-12th
R1-CompZ R2-CompZ R1-CompZ R2-CompZ
0 N 16 m18.42 49,522 0.000 0.000 0.005 0.109
1.4�10�4N 8 m 52.96 29,300 0.000 0.035 0.005 0.116
1.4�10�4 8 8 m 18.91 24,218 0.000 0.035 0.005 0.116
1.4�10�2N 1 m 25.20 4648 0.000 0.298 0.005 0.319
1.4�10�2 8 1 m 18.31 4195 0.000 0.298 0.005 0.319
1.4 N 0 m 01.99 137 0.015 0.694 0.017 0.703
1.4 8 0 m 01.77 134 0.015 0.694 0.017 0.703
Vertical component (CompZ) of seismograms is considered. RMS-10th is the RMS relative to seismogram computed at 10th generation without constraints.
RMS-12th is the RMS relative to seismogram computed at 12th generation without constraints.
T.A. Stabile et al. / Computers & Geosciences 35 (2009) 409–418 415
of phases without losing the phases with bigger ampli-tude. If we choose for PHS a value equal to 1.4% of therelative direct P-wave value, the computing time isdrastically reduced (from 16 m 18.15 s to 1.77 s), whereasthe RMS becomes significant for the more distant receiver(R2). The best values for RIFM and PHS parameter can bechosen on the basis of the required precision.
To better understand if our choice is appropriate, wecan calculate the complete wave field for the case understudy by the AXITRA program, which uses the discretewave number method developed by Bouchon (Bouchon,1981; Cotton and Coutant, 1997). Afterwards, we cancompare the AXITRA results with those obtained using theCOMRAD program stopped at the 10th generation, wherethe amplitudes of the synthetics are expressed in velocityand are normalized with respect to their maximumamplitude. The AXITRA computation time (up to thefrequency of 25 Hz) is 53 min and 41.6 s, 3–4-fold longerthan the COMRAD+core computation time obtained at the10th generation (see Table 5). For a quantitative compar-ison between the synthetics, we use the misfit criteria intime and frequency that was developed by Kristekovaet al. (2006). In fact, the standard RMS matches the single-valued envelope misfit only in the case of a pureamplitude modification of the signal, while in all othercases RMS considerably overestimates the misfits anddoes not recognize what causes the difference (Kristekovaet al., 2006). The time frequency envelope misfit (TFEM) iscalculated according to the following equation:
TFEMðt; f Þ ¼DEðt; f Þ
maxt;f ðjWREF ðt; f ÞjÞ(7)
while the time frequency phase misfit is calculatedaccording to Eq. (3):
TFPMðt; f Þ ¼DPðt; f Þ
maxt;f ðjWREF ðt; f ÞjÞ(8)
where t is the time, f is the frequency, DE(t,f) is thelocal time–frequency envelope difference, DP(t,f) is thelocal time–frequency phase difference, and WREF(t,f) isthe time–frequency representation of the reference signalSREF(t) based on the continuous wavelet transform. In thiscase the difference is computed between the COMRADand AXITRA seismograms.
In Figs. 6 and 7, the TFEM and the TFPM misfits for thevertical component of the seismograms computed atthe receivers at 1 and 30 km distance from the sourceare shown. Red colour in the TFEM and the TFPM imagesindicates a greater amplitude and a positive phaseshift in the COMRAD seismogram with respect to AXITRAseismogram. Blue colour represent the opposite case. Forthe receiver at 1 km distance the TFEM and the TFPM
values suggest a good agreement between the syntheticscomputed using the two methods. In fact the maximumTFEM value, observed at 1.5 s, is about 4%, while themaximum TFPM value is about 0.6%. This agreementslowly decreases with the source–receiver distance asshown in Fig. 7 for the receiver at 30 km distance fromthe source.
In Fig. 7 we can see that there is a maximum envelopemisfit, of about 20%, in correspondence of 7.5 and 11 s.These misfits are due to differences in amplitude betweenthe two seismograms, as evidenced in the plots of thesynthetics in Fig. 7. Over 16 s COMRAD seismogramamplitudes are generally underestimated probably forthe absence of the surface waves calculated by AXITRAand not by COMRAD code. Moreover, from the TFPM plotin Fig. 7, the phase misfit is less than 7%. In general, thedifferences in amplitude and phase between the syntheticseismograms computed by the two codes decrease athigher frequencies as expected by theory. The misfits areshown only for frequencies greater than 3 Hz because theCOMRAD code is valid only in the high-frequencyapproximation.
5. Conclusions and discussions
We have developed a method for rapid high-frequencyseismogram computation based on a hierarchical order ofray and phase strings generation subjected to physicalconstraints. The method is used in a code (Comrad.f) tocompute an exhaustive set of phases able to producea complete body waves seismogram. It uses as core thedynamic ray-tracing code developed by Farra and Madariaga(1987).
We have numerically tested the method in two stepsusing a PC with an AMD-3 GHz processor and 2 MbSD-RAM memory. First we evaluated, generation by

ARTICLE IN PRESS
Fig. 6. (Top) Time frequency envelope misfit TFEM(t,f) and (Middle) time frequency phase misfit TFPM(t,f) plots for vertical components of seismograms
computed for a receiver at 1 km distance from the source. (Bottom) Two synthetic seismograms computed by the AXITRA and COMRAD codes,
respectively. Amplitudes are normalized with respect to maximum amplitude of each seismogram.
T.A. Stabile et al. / Computers & Geosciences 35 (2009) 409–418416
generation, both the computing time and the RMS
between the COMRAD synthetics obtained in each gen-eration and those obtained in the previous generation.This allowed us to choose the number of generation atwhich we can truncate the ray series, that is the 10thgeneration.
After fixing the number of generations, we com-pared the COMRAD-derived synthetic seismograms withAXITRA-derived synthetic seismograms, the latter being aprogram that calculates the complete wave field. Thenumerical tests were carried out by the quantitative misfitcriteria developed by Kristekova et al. (2006).
The seismograms computed by the COMRAD andAXITRA programs are in good agreement at least up to30 km source–receiver distance. For a receiver 30 km away
from the source, where we have greater misfits, themaximum time frequency envelope misfit is about 20%only corresponding to 7.5 and 11 s on seismograms, due tothe differences in amplitudes.
Finally, we have compared the computation times forboth of the programs, and we can be sure that theCOMRAD code (with 10 generations without constraints)is 3–4-fold faster than the AXITRA code (up to a frequencyof 25 Hz). If we want to compute the synthetics at higherfrequencies, the AXITRA code needs more time, whilethe computation time of the COMRAD code remainsthe same or decreases if we take into account theadditional constraints on the phases. These constraintsare based on the maximum number of reflections ineach element of the model and on the expected amplitude

ARTICLE IN PRESS
Fig. 7. As in Fig. 6 but referring to a receiver at 30 km distance from source.
T.A. Stabile et al. / Computers & Geosciences 35 (2009) 409–418 417
value for each phase. We have evaluated the effectsof these constraints on the seismogram computed atthe 10th generation in terms of number of phases,computing time, and accuracy of the signal. The re-sults confirm that the constraints are effective, reduc-ing the number of phases to be computed withoutlosing the phases with appreciable amplitude on theseismogram.
Acknowledgements
The authors would like to thank Veronique Farra forproviding us with her dynamic ray-tracing code, used ascore of the COMRAD program. We are also grateful to Prof.Ray Durrheim for helpful suggestions and constructivecomments on the manuscript.
Appendix A. Supplementary material
Supplementary data associated with this article canbe found in the online version at doi:10.1016/j.cageo.2008.02.030.
References
Aki, K., Richards, P.G., 2002. Quantitative Seismology, second ed.University Science Books, Sausalito, California, 720pp.
Bernard, P., Zollo, A., 1989. The Irpinia (Italy) 1980 earthquake: detailedanalysis of a complex normal faulting. Journal of GeophysicalResearch 94 (B2), 1631–1647.
Bouchon, M., 1981. A simple method to calculate Green’s functions forelastic layered media. Bulletin of Seismological Society of America 71(4), 959–971.

ARTICLE IN PRESS
T.A. Stabile et al. / Computers & Geosciences 35 (2009) 409–418418
Bouchon, M., Aki, K., 1977. Discrete wave-number representation ofseismic-source wave fields. Bulletin of Seismological Society ofAmerica 67 (2), 259–277.
Cerveny, V., 2001. Seismic Ray Theory. Cambridge University Press,Cambridge, New York, 722pp.
Cerveny, V., Hron, F., 1980. The ray series method and dynamicray-tracing system for three-dimensional inhomogeneous media.Bulletin of Seismological Society of America 70, 47–77.
Clarke, T.J., 1993a. The complete ordered ray expansion—I. Calculation ofsynthetic seismograms. Geophysical Journal International 115,421–434.
Clarke, T.J., 1993b. The complete ordered ray expansion—II. Multiphasebody wave tomography. Geophysical Journal International 115,435–444.
Cotton, F., Coutant, O., 1997. Dynamic stress variations due to shear faultsin a plane-layered medium. Geophysical Journal International 128(3), 676–688.
Farra, V., Madariaga, R., 1987. Seismic waveform modeling in hetero-geneous media by ray perturbation theory. Journal of GeophysicalResearch 92 (B3), 2697–2712.
Festa, G., Vilotte, J.P., 2005. The Newmark scheme as a velocity–stresstime-staggering: an efficient perfectly matched layers implementa-tion for spectral element simulations of elastodynamics. GeophysicalJournal International 161 (3), 789–812.
Hron, F., 1971. Criteria for selection of phases in synthetic seismogramsfor layered media. Bulletin of Seismological Society of America 61(3), 765–779.
Hron, F., 1972. Numerical methods of ray generation in multilayeredmedia. In: Bolt, B.A. (Ed.), Methods in Computational Physics, vol. 12.Academic Press, New York, pp. 1–34.
Hron, F., May, B.T., Covey, J.D., Daley, P.F., 1986. Synthetic seismic sectionfor acoustic, elastic, anisotropic inhomogeneous layered media.Geophysics 51, 710–735.
Kaser, M., Dumbser, M., 2006. An arbitrary high order discontinuousGalerkin method for elastic waves on unstructured meshes I:the two-dimensional isotropic case with external source terms.Geophysical Journal International 166 (2), 855–877.
Komatitsch, D., Vilotte, J.P., 1998. The spectral element method: anefficient tool to simulate the seismic response of 2D and 3Dgeological structures. Bulletin of Seismological Society of America88 (2), 368–392.
Kristekova, M., Kristek, J., Moczo, P., Day, S.M., 2006. Misfit criteria forquantitative comparison of seismograms. Bulletin of SeismologicalSociety of America 96 (5), 1836–1850.
Ludwig, W.J.J., Nafe, E., Drake, C.L., 1970. Seismic refraction. In: Maxwell,A.E. (Ed.), The Sea. Wiley InterScience, Hoboken, New Jersey,pp. 53–84.
Madariaga, R., 1976. Dynamics of an expanding circular fault. Bulletin ofSeismological Society of America 66, 639–666.
Marfurt, K.J., 1984. Accuracy of finite-difference and finite-elementmodeling of the scalar and elastic wave equations. Geophysics 49,549–553.
Pengcheng, L., Archuleta, R.J., 2004. A new nonlinear finite fault inversionwith three-dimensional Green’s functions: application to the 1989Loma Prieta, California, earthquake. Journal of Geophysical Research109 (B02318), 1–15.
Rosenbaum, J.H., 1960. The long-time response of a layered elasticmedium to explosive sound. Journal of Geophysical Research 65,1577–1613.
Snieder, R., Spencer, C., 1993. A unified approach to ray bending, rayperturbation, paraxial ray theories. Geophysical Journal International115, 456–470.
Virieux, J., 1986. P-SV wave propagation in heterogeneous media:velocity–stress finite-difference method. Geophysics 51, 889–901.
Virieux, J., 1991. Fast and accurate ray tracing by Hamiltonian perturbation.Journal of Geophysical Research 96, 579–594.