Coordinating Capacity Calculation via Electricity Market ...
20
Citation: Andriopoulos, N.; Georgantas, I.; Makrygiorgou, D.I.; Skipis, D.; Dikaiakos, C.; Moraitis, I.; Botsis, A.; Papadaskalopoulos, D. Coordinating Capacity Calculation via Electricity Market Coupling: Insights from the H2020 CROSSBOW Project. Electricity 2022, 3, 182–201. https://doi.org/10.3390/ electricity3020011 Academic Editors: Andreas Sumper and Paula Varandas Ferreira Received: 14 March 2022 Accepted: 15 April 2022 Published: 19 April 2022 Publisher’s Note: MDPI stays neutral with regard to jurisdictional claims in published maps and institutional affil- iations. Copyright: © 2022 by the authors. Licensee MDPI, Basel, Switzerland. This article is an open access article distributed under the terms and conditions of the Creative Commons Attribution (CC BY) license (https:// creativecommons.org/licenses/by/ 4.0/). Article Coordinating Capacity Calculation via Electricity Market Coupling: Insights from the H2020 CROSSBOW Project Nikos Andriopoulos 1,2 , Ioannis Georgantas 1 , Despoina I. Makrygiorgou 1,2, * , Dimitris Skipis 1 , Christos Dikaiakos 1 , Ioannis Moraitis 1 , Athanasios Botsis 3 and Dimitrios Papadaskalopoulos 3 1 Research, Technology & Development Department, Independent Power Transmission Operator (IPTO) S.A., 89 Dyrrachiou & Kifisou Str., 10443 Athens, Greece; [email protected] (N.A.); [email protected] (I.G.); [email protected] (D.S.); [email protected] (C.D.); [email protected] (I.M.) 2 Department of Electrical and Computer Engineering, University of Patras, 26500 Patras, Greece 3 Institute-of-Communication-and-Computer-Systems (ICCS), School of Electrical and Computer Engineering, 9 Iroon Polytechniou Str., 15780 Athens, Greece; [email protected] (A.B.); [email protected] (D.P.) * Correspondence: [email protected] Abstract: CROSS BOrder management of variable renewable energies and storage units enabling a transnational Wholesale market (CROSSBOW) is an EC-funded project, whose aim is to facilitate the shared use of energy resources by fostering cross-border management of variable renewable energies and storage units, enabling higher penetration of renewable energy sources (RES) whilst reducing network operational costs and improving economic benefits of clean energies and storage units. Towards these goals, CROSSBOW boosts regional cooperation among the system operators in South- eastern Europe (SEE), by deploying nine different tools to support the security coordination center (SCC) of the region. More specifically, the main CROSSBOW product, namely CROSSBOW Regional Operation Centre (CROSSBOW ROC) has proposed and demonstrated a set of functionalities for regional management and operation that enhance the existing regional structures, extending the capa- bilities of the already established Regional Security Coordinator (RSC) initiatives. Beyond enhancing RSC mandatory functions (including adequacy forecasts, coordinated security analysis, capacity calculations, and outage planning coordination), the ROC-BC product has developed new functions, linking the security considerations of involved TSOs with the operation of the fast-developing and harmonized electricity markets. In this paper, we investigate approaches for coordinated capacity calculation and cross-border trading via market coupling, developed within the ROC-BC product of CROSSBOW. Moreover, we present the final demonstration results as a part of ROC fundamen- tal functionalities. Specifically, both net transfer capacity (NTC) and flow-based (FB) methods are examined and compared within a case study applying to the SEE region. The presented results demonstrate that the FB method exhibits better performance in all examined scenarios, considering three different key performance indicators (KPIs). Keywords: CROSSBOW; H2020; ROC; RSC; coordinated capacity calculation; market coupling; ATC method; FB method 1. Introduction The European electricity sector is undergoing significant changes, including the re- gionalization of electricity markets and the integration of intermittent renewable resources that have resulted in increased and more volatile cross-border power flows [1,2]. These challenges have led transmission system operators (TSOs) across Europe to increase their coordination. According to the network code on operational security of ENTSO-E, each TSO should coordinate with the interconnected TSOs and report the current limits in terms of thermal rating and transitory admissible overload and voltage ranges [3,4]. Additionally, each TSO should inform all neighboring TSOs about its own system state and provide them Electricity 2022, 3, 182–201. https://doi.org/10.3390/electricity3020011 https://www.mdpi.com/journal/electricity
-
Upload
khangminh22 -
Category
Documents
-
view
3 -
download
0
Transcript of Coordinating Capacity Calculation via Electricity Market ...

�����������������
Citation: Andriopoulos, N.;
Georgantas, I.; Makrygiorgou, D.I.;
Skipis, D.; Dikaiakos, C.; Moraitis, I.;
Botsis, A.; Papadaskalopoulos, D.
Coordinating Capacity Calculation
via Electricity Market Coupling:
Insights from the H2020 CROSSBOW
Project. Electricity 2022, 3, 182–201.
https://doi.org/10.3390/
electricity3020011
Academic Editors: Andreas Sumper
and Paula Varandas Ferreira
Received: 14 March 2022
Accepted: 15 April 2022
Published: 19 April 2022
Publisher’s Note: MDPI stays neutral
with regard to jurisdictional claims in
published maps and institutional affil-
iations.
Copyright: © 2022 by the authors.
Licensee MDPI, Basel, Switzerland.
This article is an open access article
distributed under the terms and
conditions of the Creative Commons
Attribution (CC BY) license (https://
creativecommons.org/licenses/by/
4.0/).
Article
Coordinating Capacity Calculation via Electricity MarketCoupling: Insights from the H2020 CROSSBOW ProjectNikos Andriopoulos 1,2, Ioannis Georgantas 1, Despoina I. Makrygiorgou 1,2,* , Dimitris Skipis 1,Christos Dikaiakos 1, Ioannis Moraitis 1, Athanasios Botsis 3 and Dimitrios Papadaskalopoulos 3
1 Research, Technology & Development Department, Independent Power Transmission Operator (IPTO) S.A.,89 Dyrrachiou & Kifisou Str., 10443 Athens, Greece; [email protected] (N.A.);[email protected] (I.G.); [email protected] (D.S.); [email protected] (C.D.); [email protected] (I.M.)
2 Department of Electrical and Computer Engineering, University of Patras, 26500 Patras, Greece3 Institute-of-Communication-and-Computer-Systems (ICCS), School of Electrical and Computer Engineering,
9 Iroon Polytechniou Str., 15780 Athens, Greece; [email protected] (A.B.);[email protected] (D.P.)
* Correspondence: [email protected]
Abstract: CROSS BOrder management of variable renewable energies and storage units enabling atransnational Wholesale market (CROSSBOW) is an EC-funded project, whose aim is to facilitate theshared use of energy resources by fostering cross-border management of variable renewable energiesand storage units, enabling higher penetration of renewable energy sources (RES) whilst reducingnetwork operational costs and improving economic benefits of clean energies and storage units.Towards these goals, CROSSBOW boosts regional cooperation among the system operators in South-eastern Europe (SEE), by deploying nine different tools to support the security coordination center(SCC) of the region. More specifically, the main CROSSBOW product, namely CROSSBOW RegionalOperation Centre (CROSSBOW ROC) has proposed and demonstrated a set of functionalities forregional management and operation that enhance the existing regional structures, extending the capa-bilities of the already established Regional Security Coordinator (RSC) initiatives. Beyond enhancingRSC mandatory functions (including adequacy forecasts, coordinated security analysis, capacitycalculations, and outage planning coordination), the ROC-BC product has developed new functions,linking the security considerations of involved TSOs with the operation of the fast-developing andharmonized electricity markets. In this paper, we investigate approaches for coordinated capacitycalculation and cross-border trading via market coupling, developed within the ROC-BC productof CROSSBOW. Moreover, we present the final demonstration results as a part of ROC fundamen-tal functionalities. Specifically, both net transfer capacity (NTC) and flow-based (FB) methods areexamined and compared within a case study applying to the SEE region. The presented resultsdemonstrate that the FB method exhibits better performance in all examined scenarios, consideringthree different key performance indicators (KPIs).
Keywords: CROSSBOW; H2020; ROC; RSC; coordinated capacity calculation; market coupling; ATCmethod; FB method
1. Introduction
The European electricity sector is undergoing significant changes, including the re-gionalization of electricity markets and the integration of intermittent renewable resourcesthat have resulted in increased and more volatile cross-border power flows [1,2]. Thesechallenges have led transmission system operators (TSOs) across Europe to increase theircoordination. According to the network code on operational security of ENTSO-E, eachTSO should coordinate with the interconnected TSOs and report the current limits in termsof thermal rating and transitory admissible overload and voltage ranges [3,4]. Additionally,each TSO should inform all neighboring TSOs about its own system state and provide them
Electricity 2022, 3, 182–201. https://doi.org/10.3390/electricity3020011 https://www.mdpi.com/journal/electricity

Electricity 2022, 3 183
with additional information on the elements of its transmission network that are parts ofthe observability area of the neighboring TSOs [5].
In that context, TSOs have been developing Regional Security Coordination Initia-tives (RSCIs) and have adopted a multilateral agreement in 2015 to make participation inRSCIs mandatory for TSOs [6]. The main objective of an RSCI is enhancing the regionalcoordination of system operation activities by providing services to TSOs. The EU networkcodes have institutionalized RSCIs in the legal framework through the creation of so-calledregional security coordinators (RSCs). Moreover, in its “Clean Energy for All Europeans(2016 Commission)” legislative package, the Commission has proposed to further increaseregional operations and cross-border cooperation within the internal electricity marketfor electricity (IEM) [7–10]. Specifically, the proposed electricity regulation introduces thecreation of regional operational centers (ROCs) that follow the framework establishedfor RSCs. ROCs should carry out defined tasks of regional relevance and should havethe power to adopt decisions and make recommendations to national TSOs. The conceptbehind ROCs was to enhance security of supply and drive cost reductions through moreefficient system operation, reduced need for investment, and the cost-effective integrationof renewables. Thus, the benefits of regional cooperation, particularly in a system witha significant share of variable renewables, are well documented in Europe and in otherjurisdictions. In addition, increased TSOs coordination can help to increase the overallreliability and reduce the costs of achieving that level of reliability and thus achieving theEnergy Union’s goals of reliable, affordable, and sustainable energy [11,12].
However, the establishment of centers for regional cooperation among different TSOsis not an entirely new concept. A number of RSCs have been developed in the past, includ-ing CORESO in Western Europe, TSCNET in Central Europe, SCC in the Balkan region,NORDIC in the Nordic region, and Baltic RSC in the Baltic region. The last paradigm of sucha coordination center is the establishment of SEleNE in Thessaloniki (Greece). The estab-lishment of regional cooperation through RSC is strongly supported by ENTSO-E [11,12].The role of these centers has mainly been acting as an advisory and supporting body for theindividual TSOs. RSCs are service providers and were not built with live system operationand control capabilities [13]. In other words, they make recommendations that individualTSOs in most cases follow but each TSO can deviate from if required for ensuring thesecurity of supply. This is an essential aspect because it allows RSCs to sustain light andefficient structures and it limits the need for regulatory oversight and harmonization.
As such, their services and functionalities are mainly associated with short- andmedium-term coordination of the transmission network in the respective region and notwith the long-term planning, which remains a responsibility of the individual TSOs’ controlcenters. In the multilateral agreement [13–15] that all ENTSO-E members have signed,RSCs must carry out the five following core services:
1. Improved individual grid model (IGM)/common grid model (CGM) delivery: vali-dating forecasts of the individual TSOs’ grid models, sharing them with each otherand merging them to a common grid model.
2. Coordinated security analysis: evaluating the consequences of contingencies in theinterconnected grid and simulating remedial actions including coordinated ones.
3. Coordinated capacity calculation: determining available capacity for cross-bordertrading while ensuring the security of the grid.
4. Outage planning coordination: coordinating planned outages on equipment withcross-border influence to avoid security issues.
5. Short-term adequacy forecasts: assessing the adequacy of the grid in the short term.
The way TSOs use the inputs from RSCs to operate their grid differs between thesefive core services. For example, for coordinated security analysis and outage planningcoordination, RSCs perform regional calculations that are important to the TSOs’ decision-making, but TSOs still need to consider several other national factors not captured byregional calculations. The final operational decision-making by the national TSO cannot bedelegated. On the other hand, for the other three core services (coordinated capacity calcula-

Electricity 2022, 3 184
tion, short-term adequacy forecasts, and individual and common grid model delivery), theresults stemming from the regional calculations constitute sound products on which manyTSOs and market parties can robustly base their decisions. The decision-making powerof the TSOs in such joint regional calculations consists largely of checking for errors andgiving authorization for the calculation results to be used (e.g., for the calculated capacitiesto become the basis for allocation of congested interfaces) [13,14].
The Commission’s proposal (2016 Clean Energy Package) places an obligation onENTSO-E to develop a methodology for identifying regional crisis scenarios and to under-take the analysis, with the option to delegate the entire analysis or individual tasks to theROCs [11–13]. ROCs have the regional knowledge, necessary expertise, and analytical ca-pability that allow them to identify regional crisis scenarios more effectively than ENTSO-Eor individual Member States. In undertaking this task, ROCs should coordinate closelywith ENTSO-E and other ROCs, as risks can be cross-regional (e.g., severe weather eventscan, in unusual cases, have similar adverse impacts on more than one region at the sametime, as happened in January 2017). ROCs could also play a key role in responding to actualcrisis events. Properly equipped ROCs have all the information available to understand thescope and scale of the crisis and be best placed to coordinate responses. This is evidencedby the events of November 2006, which nearly led to a total European blackout as manyindividual TSOs did not initially realize that Europe’s transmission grid had split into threeseparate synchronous areas [11,12].
Another example is the event that took place on 8 January 2021 at 14:05 CentralEuropean Time. During this event, the Continental Synchronous Area in Europe wasseparated into two areas (the northwest area and the southeast area) due to the trippingof several transmission network elements. The system separation resulted in a deficitof power in the northwest area and a surplus of power in the southeast area, leadingin turn to a frequency decrease in the northwest area and a frequency increase in thesoutheast area. Even though the communication, coordination, and resynchronizationwere successful and timely, this event can be used to identify further improvements incoordination and communication between TSOs for large-scale events. Procedures forthe management of balancing platforms during system events should also be developedto avoid any unintended consequences which could lead to a larger disturbance of thesystem. The European Awareness System was used successfully during the event, but morefunctionalities should be developed to further assist TSOs in the sharing of operational data(pre- and post-fault) and coordinated actions. Finally, coordination of regional restorationcould be enhanced if it is deemed necessary by TSOs [11,12].
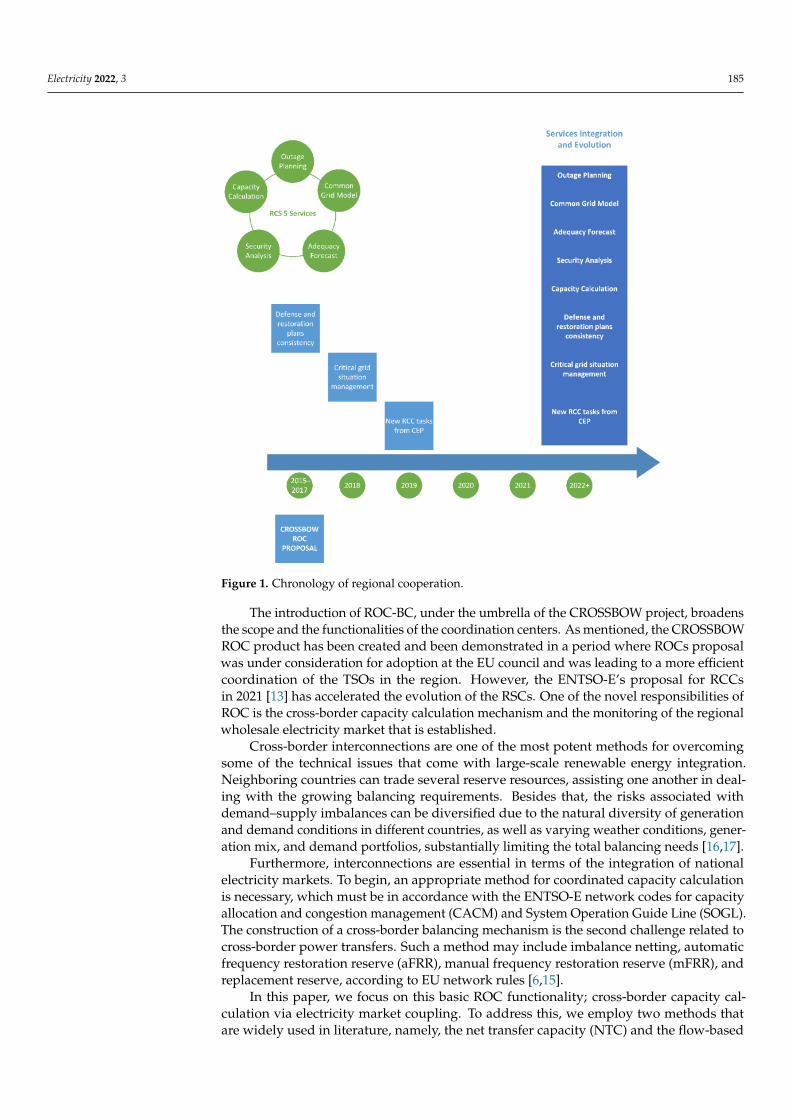
In Figure 1, a chronology on deploying of regional cooperation is given in an illustra-tive way. One can see that today’s RSCs certainly provide the five standard operationalservices—common grid model, coordinated operational planning, security analysis, outageplanning coordination, short- to medium-term adequacy forecast, and coordinated capacitycalculation. In the next decade, the consistency check of TSOs system defense and restora-tion plans will be transferred from RSCs to regional coordination centers (RCCs), and TSOswill identify the management of critical grid situations [6,11,12].
According to EU Regulation on the internal electricity market (2019/943), RCCs shouldbe established in the timeframe 2020–2024, evolving from RSCs experience as required.As we understand, RSCs are service providers to TSOs, with staff and budget comingfrom TSOs. RSCs can develop their services as much as is needed to make grids moreefficient. The evolution of regional coordination is moving from RSCs to ROCs and soon toRCCs with the key point being the more efficient and coordinated regional operation ofthe TSOs. In addition, the existence of regional operation centers (ROCs) is covered by theintroduction of RCCs, but all the knowledge and new elements of ROC will be delivered tothe new coordination centers.
Electricity 2022, 3 185
Electricity 2022, 3, FOR PEER REVIEW 4
soon to RCCs with the key point being the more efficient and coordinated regional oper-
ation of the TSOs. In addition, the existence of regional operation centers (ROCs) is cov-
ered by the introduction of RCCs, but all the knowledge and new elements of ROC will
be delivered to the new coordination centers.
Figure 1. Chronology of regional cooperation.
The introduction of ROC-BC, under the umbrella of the CROSSBOW project, broad-
ens the scope and the functionalities of the coordination centers. As mentioned, the
CROSSBOW ROC product has been created and been demonstrated in a period where
ROCs proposal was under consideration for adoption at the EU council and was leading
to a more efficient coordination of the TSOs in the region. However, the ENTSO-E’s pro-
posal for RCCs in 2021 [13] has accelerated the evolution of the RSCs. One of the novel
responsibilities of ROC is the cross-border capacity calculation mechanism and the mon-
itoring of the regional wholesale electricity market that is established.
Cross-border interconnections are one of the most potent methods for overcoming
some of the technical issues that come with large-scale renewable energy integration.
Neighboring countries can trade several reserve resources, assisting one another in deal-
ing with the growing balancing requirements. Besides that, the risks associated with de-
mand–supply imbalances can be diversified due to the natural diversity of generation and
demand conditions in different countries, as well as varying weather conditions, genera-
tion mix, and demand portfolios, substantially limiting the total balancing needs [16,17].
Furthermore, interconnections are essential in terms of the integration of national
electricity markets. To begin, an appropriate method for coordinated capacity calculation
Figure 1. Chronology of regional cooperation.
The introduction of ROC-BC, under the umbrella of the CROSSBOW project, broadensthe scope and the functionalities of the coordination centers. As mentioned, the CROSSBOWROC product has been created and been demonstrated in a period where ROCs proposalwas under consideration for adoption at the EU council and was leading to a more efficientcoordination of the TSOs in the region. However, the ENTSO-E’s proposal for RCCsin 2021 [13] has accelerated the evolution of the RSCs. One of the novel responsibilities ofROC is the cross-border capacity calculation mechanism and the monitoring of the regionalwholesale electricity market that is established.
Cross-border interconnections are one of the most potent methods for overcomingsome of the technical issues that come with large-scale renewable energy integration.Neighboring countries can trade several reserve resources, assisting one another in deal-ing with the growing balancing requirements. Besides that, the risks associated withdemand–supply imbalances can be diversified due to the natural diversity of generationand demand conditions in different countries, as well as varying weather conditions, gener-ation mix, and demand portfolios, substantially limiting the total balancing needs [16,17].
Furthermore, interconnections are essential in terms of the integration of nationalelectricity markets. To begin, an appropriate method for coordinated capacity calculationis necessary, which must be in accordance with the ENTSO-E network codes for capacityallocation and congestion management (CACM) and System Operation Guide Line (SOGL).The construction of a cross-border balancing mechanism is the second challenge related tocross-border power transfers. Such a method may include imbalance netting, automaticfrequency restoration reserve (aFRR), manual frequency restoration reserve (mFRR), andreplacement reserve, according to EU network rules [6,15].
In this paper, we focus on this basic ROC functionality; cross-border capacity cal-culation via electricity market coupling. To address this, we employ two methods thatare widely used in literature, namely, the net transfer capacity (NTC) and the flow-based
Electricity 2022, 3 186
(FB) ones [18]. Both methods are based on a wide-area optimization procedure, with acommon objective function and different constraints to be taken into consideration. Themathematical modeling of both methods has already been included in detail in our pre-vious work [19,20] and the first results have been presented there. The case study of theSEE region has been selected as a special one for the CROSSBOW project and for ourtests, where the market procedures and coupling is still at a preliminary phase. The novelcontribution of this paper is the scalability of both approaches, expanding them in timeand place, instead of the algorithms themselves. Those methods are applied in severalextended test case scenarios for three, four, and five countries’ market coupling and for atime period of a month. These new results of the CROSSBOW final demonstration phaseverify the preliminary ones [19,20], while a sensitivity analysis gives insights regarding theapplicability and efficiency of both cross-border trading methods. Finally, this new analysisconducted gives some metrics of comparison between two methods in order to derive asolid conclusion on which method is more beneficial for the examined region.
The rest of the paper is organized as follows: In Section 2, an overview of the CROSS-BOW ROC product and its functionalities are described, giving special attention to coordi-nated capacity calculation via NTC and FB methodologies. In Section 3, the methods andthe results of electricity market coupling, which are obtained by both approaches for theSEE region scenarios tested, are presented with a comparative approach, and in Section 4,the conclusions give us the opportunity to summarize the key points and benefits.
2. Methodological Framework
To realize ambitious targets of RES integration within a modern and unified Europeanmarket framework, an ROC is fundamental. Its scope includes all TSOs in the regionworking together to gain benefits from a more effective approach to the various challengesfacing system operators. The ability to handle challenges from a regional perspectiveenables the grid to operate more efficiently and reliably, taking advantage of economies ofscale for its generation assets, and coping more effectively with the various uncertainties(renewable energy stochasticity, load fluctuations, unpredictable incidents, etc.) [14,21,22].
In this frame, CROSSBOW proposes an integrated approach to manage and operatethe transmission network in SEE region. Toward that end, TSOs’ actions will be closelycoordinated. The project has two main directions in regional coordination. The first one;by advancing the supporting data collection, data exchange, calculation, and optimizationmethods, CROSSBOW is demonstrating how to enhance the five core services availablefrom RSCs today. The second one; by defining and incorporating new services (beyond thefive core services) associated with short-term operational tasks, CROSSBOW demonstrateshow RSCs can evolve. Among these services are imbalance management, congestion man-agement, and voltage management, all of which fall under the purview of individual TSOs.
To achieve this integrated approach, it is critical to establish an ROC that is responsiblefor coordinating the management of the entire transmission system in SEE efficientlyand securely as well as enabling the sharing of resources. As one of the main productsof the CROSSBOW project, this ROC is of primary importance. The CROSSBOW ROCproduct has been designed to be a very heterogeneous product, incorporating a variety offunctionalities that relate to the business processes of RSCs. ROC provides improvementsto some RSC functions, but also defines and incorporates new services associated withshort-term operations that RSCs cannot currently provide.
In order to ensure that the developed functionalities of this product are available toother RSCs in Europe, special attention was given at the development stage to the stake-holders of this product who are located in the European region. Additionally, it serves as acatalyst for the integration of regional balancing markets by providing the necessary toolkit.More specifically, CROSSBOW ROC incorporates the following operational functionalities:
1. Probabilistic approach for regional adequacy assessment in SEE region;2. Real time quality check of common grid models;3. Enhance method for PNP estimation;

Electricity 2022, 3 187
4. Dynamic line rating forecast for overhead lines;5. Determination of capacity calculation input data;6. Cross-border congestion FB algorithm;7. Cross-border congestion NTC-based algorithm;8. TSO FR reserve probabilistic sizing using reserves offered from another TSO
via interconnections;9. IGM quality assessment;10. Enhanced transmission system resilience during emergencies;11. Over and under-frequency real-time control scheme using PMUs [23].
2.1. Coordinated Capacity Calculation for Cross-Border Trading
The interconnection lines among national transmission systems were originally in-tended to assure steady operation and assist in the event of system failures within theinterconnected system. Cross-border trading places an enormous additional strain oninterconnection lines, causing network congestion and thereby restricting power trade [24].Congestion occurs when the demand for electrical energy transfer exceeds the transmis-sion system’s capacity, i.e., when uncontrolled usage of the network might jeopardize thesystem’s security [25,26].
According to the CACM, the term “congestion” can be classified into [6]:
(a) “Physical congestion”, which implies any network condition when forecasted orrealized power flows violate the thermal limits of the grid elements and the voltagestability or the angle stability limits of the power system.
(b) “Structural congestion”, which implies congestion in the transmission system that canbe unambiguously defined, is predictable, is geographically stable over time, and isfrequently reoccurring under normal power system conditions.
Congestion control measures have been established to avoid the transmission systemfrom being overloaded by cross-border energy flows and the resulting risk to the grid’ssecurity. Congestion management also includes the distribution of rights to transfer elec-tricity to other countries via a transmission network connecting them, which is vital tocross-border trade.
Electricity trading takes place in multiple sequential markets to ensure an exact balancebetween supply and demand. To that purpose, forward and future markets are followed bya day-ahead and intra-day market, which is then followed by a final real-time imbalancesettlement [27,28]. Traditionally, energy markets were regulated at a national level, witheach country focusing on electric power supply self-sufficiency. The target model forelectricity trading in the EU is based on these foundations and uses a zonal approach tobuild on several interconnected markets. Electricity can be freely exchanged inside eachzone, with little or no concern for network restrictions. In cross-border trade, though,the interconnection capacity with other bidding zones is considered during the tradingprocess [29].
A coordinated capacity calculation and allocation method are required for cross-border electricity trading. Because energy flows are not only constrained by financialcommitments, but also by physical laws, stronger cooperation among market areas is alsonecessary. The purpose of a coordinated capacity calculation process is to ensure that theavailable transmission capacity is allocated efficiently. Offering cross-border transmissioncapacity to the market must be balanced against ensuring the electricity system’s reliablefunctioning. The method for calculating available trading capacity has a significant impacton the market [6,30,31].
In general terms, the capacity calculation procedure takes place in two differenttime frames:
1. (TSOs) coordinate long-term capacity calculation for the year- and month-ahead mar-ket time frames to guarantee that capacity calculation is accurate, and that adequatecapacity is made available to trade. Coordinated long-term cross-region capacity

Electricity 2022, 3 188
allocation regulations necessitate the development of a common regional allocationscheme. RCCs are in charge of it, and it is necessary to predefine a mechanism for al-locating long-term capacity in a coordinated manner across several longer timeframeswithin the respective region.Mechanisms for operational security constraints and contingencies must be includedin the solution for a standard capacity calculation methodology. A common gridmodel methodology is agreed upon and established among involved TSOs, whilesecurity analysis based on multiple scenarios is applied. All involved TSOs in theregion capacity calculation jointly develop a common set of scenarios to be used inthe common grid model for each timeframe. TSOs agree on and develop a standardgrid model methodology, and security analysis based on various scenarios is used.For every time window, all relevant TSOs in the region capacity calculation produce acommon set of scenarios to be used in the common grid model.For the purpose of allocating forward capacity, the TSOs need to determine whatamount of capacity should be given on a long-term premise and what percentageshould then be allocated on a different long-term one. Following long-term allocations,the remaining available capacity is offered on a short-term basis.
2. The term “short-term capacity calculation” involves a combination of day-ahead, in-traday, and balancing timescales in which the relevant TSOs should estimate availablecapacity in a coordinated way. They should also utilize a single grid model for this,which includes forecasts on supply, demand, and network status for each hour.The method for providing generation and load data to TSOs defines which productionunits and loads are required to give data to their relevant TSOs for capacity calcula-tion. The available capacity is then calculated according to the algorithm considered.The available cross-border capacity is among the critical aspects of the subsequentcalculation process, whereby all regional bids and offers are collected and matched inan economically effective way, considering available cross-border capacity.Each of the TSOs in the area of consideration ensures that capacity is adjusted accord-ing to the last available data within each market time window. The frequency of thisadjustment is determined by operational efficiency and security.
Thus, the steps included in the capacity calculation procedure are as follows:
• The methodology for determining the interconnection lines’ reliability margin.• The methodology for calculating operational security bounds, contingencies relevant
to capacity calculation, and allocation constraints.• The methodology for determining remedial measures to be taken into account when
calculating capacity [14].
2.2. NTC Methodology on Cross-Border Electricity Trading
The capacity calculation methodology is either a coordinated NTC algorithm or theFB one. According to the network code on CACM, the future calculation and marketdesign for the European day-ahead and intraday markets may be either based on theFB or the NTC approach [30–32]. However, the CACM requires that “TSOs may jointlyrequest the competent regulatory authorities to apply the coordinated NTC approach ifthe TSOs concerned are able to demonstrate that the application of the capacity calculationmethodology using the FB approach would not yet be more efficient compared to the NTCapproach and assuming the same level of operational security in the concerned region”.It is not assumed whether either the FB or NTC method is efficient in the SEE regionsince this will be investigated. The better the representation of the grid is in the energymarket, the more accurately the TSO can feed physical constraints into the price calculationalgorithm. The motivation behind introducing FB is that it has the potential to betteraccount for the physical flow and constraints compared to the widely used NTC method.A better representation gives a better chance of optimizing the utilization of the scarcetransmission capacity, which should lead to more accurate price signals and increasedsocial economic welfare.

Electricity 2022, 3 189
On the one hand, the coordinated NTC method considers that electricity can flowthrough different interconnection lines based on various predetermined arrangements thatenable the safe and reliable operation of the interconnected electricity network, as definedby the relevant TSOs. The coordinated NTC method is a capacity calculation methodthat works on the premise of assessing and defining a maximum energy exchange acrossneighboring bidding zones in advance. The NTC approach should only be used in areaswhere capacity is less interdependent and where the FB one cannot contribute or enhancethe existing solution.
To proceed with the NTC calculation, the N-1 criterion is used to evaluate systemsecurity. It defines a level of security where the power system can handle the outage ofany one single individual component (i.e., a transformer, a line, a production unit). Thefollowing limiting considerations must be addressed when estimating transfer capacitieswith respect to the N-1 criterion: (a) thermal constraints, (b) voltage limitations, and(c) rotor angle stability limitations. The total transfer capacity (TTC) is defined as the“maximum between two areas compatible with operational security standards applicableat each system provided future network conditions, generation, and load patterns wereperfectly known in advance”. As a result, TTC is always linked to a specific power scenario,such as a generating schedule, consumption pattern, and available network, all of whichare used to construct a mathematical model of the power system (load flow equations). Thesolution to this model reveals the voltages at network nodes and power flows in networkelements, which are monitored by a TSO in order to determine the system security. Thismodel’s solution is known as the “base case”, and it serves as the starting point for TTCcomputation [18,30,31].
The forecast uncertainties of the power system state, for a given time period in thefuture, may decrease according to the selected time frame. The transmission reliabilitymargin (TRM) is “a security margin that copes with uncertainties on the computed TTCvalues arising from:
1. Unintended deviations of physical flows during operation due to the physical func-tioning of load-frequency regulation;
2. Emergency exchanges between TSOs to cope with unexpected, unbalanced situationsin real time;
3. Inaccuracies, e.g., data collection and measurements” [30,31].
On this basis, NTC is the maximum exchange between two areas compatible withsecurity standards applicable in both areas (N-1 criterion) and taking into account thetechnical uncertainties on the future network conditions. NTC may be allocated in differenttime frames to match the need for securing longer-term trading and to provide room forshorter-term trading after extensive load flow studies performed by the TSOs. Whendetermining the NTC on the interconnection between two countries, the involved TSOs oneach side calculate the capacity, using the lowest value of the two [30,32].
Considering energy trading, the TSOs will order the transactions according to thepriority rules of the allocation process until there is no more transfer capacity. In parallelnew information on weather, topology, etc., helps not only to distinguish the “alreadyallocated” from the “still available” capacities, but also allows simulation of the couplingeffects between NTCs across the ENTSO-E regions. That is, if all data has been exchangedbetween market participants and TSOs, the accuracy of the ex-ante calculations of transfercapacities becomes better as real-time operation is approached. On a strict confidentialitybasis, TSOs may require from market participants the planned generation schedules (e.g., ona day-ahead basis) which will result in load flows over the cross-border lines. These arecalled notified transmission flows (NTF) [31,33]. The NTF can be interpreted as the alreadynominated part of NTC by the already accepted contracts at the studied time frame.
As the booking/allocation process proceeds, the new information on generationschedules, which becomes available to the TSOs, will allow them to update their load flowcalculations in order to refine their assessment of security problems. As a result, TSOs willevaluate the remaining available transfer capacity (ATC) between systems. The ATC is
Electricity 2022, 3 190
“the transfer capacity remaining available between two interconnected areas for furthercommercial activity over and above already committed utilization of the transmissionnetworks” [30–33]. For the calculation of ATC daily, the TSOs ought to take into accountthe firm rights from previous time frame calculations.
In terms of an NTC market-clearing algorithm, the methodology finds the optimalsolution for power exchange based on given capacities and bids from market participants.The algorithm is a linear constrained optimization algorithm, with an objective functionof maximizing social welfare. The constraints are the NTCs between the bidding areassupplied by the TSOs. Nevertheless, only the commercial exchanges between bidding areasare considered in the market-clearing algorithm, and it is assumed that the power willtake the shortest path from production to consumption. In practice, the power distributesitself through the whole grid according to physical laws applied to the characteristics of thegrid and the situation in the entire power system at any time. When transferring powerbetween two nodes, flows occur on parallel paths also connecting the two nodes. The flowsinduced on the parallel paths are called loop flows. The loop flows, in addition to losses inthe lines, are not accounted for by the market algorithm, and are therefore left to the TSOsto manage [18,34].
2.3. FB Methodology on Cross-Border Electricity Trading
The better the representation of the power grid is in the energy market, the moreaccurately the TSO can channel physical constraints into the market-clearing algorithm.The motivation behind introducing FB is that FB has the potential to better account forthe physical flow and constraints compared to the widely used NTC method. A betterrepresentation offers a better chance of optimizing the utilization of the transmissioncapacity, which should lead to less deviations in market-clearing prices and increased socialeconomic welfare [14,20,35,36].
The FB calculation algorithm is a method for optimizing the available capacity inhighly interconnected networks by taking into account the fact that power might flowthrough multiple tie lines. Energy exchanges between market zones are restricted bypower transfer distribution factors (PTDFs) and availability margins on critical networkelements (CNEs) or critical branches (CBs). When capacity between market zones is highlyinterrelated, the FB approach should be used as the primary methodology for calculatingday-ahead, intraday, and balancing capacity [34,35].
In the FB approach, the physical network constraints are considered [37–39]. Thatmeans that the capacity allocation is realized partially, ex ante the market clearing andpartly at the same time with the market clearing [18]. All CBs of the electricity grid areconsidered in the N-state and in critical N-1 states. The flow via a CB is restricted by theremaining available margin (RAM), while the correlation between NPs and flows throughCBs is reflected in the sensitivity factors PTDFs. By incorporating the PTDFs, there arefewer limitations to the solution domain, and one obtains a better utilization of the system.The PTDFs are obtained from the AC power flow equations through a DC power flowrepresentation of the power electricity grid [35–37,40].
The RAM and PTDF values are defined, ex ante the market clearing, by the TSOs, andthen these values determine the flow domain. Each boundary of the FB flow domain refersto the limit of a CB. In the FB method, the transit flows are taken into account internally inthe market. Therefore, all commercial exchanges have to bid for the transmission capacity,including transit flows. This internalization considered in the FB approach gives a moreefficient transmission capacity management, at least from a theoretical point of view [34,36].
The RAM is essentially the available line capacity in the day-ahead market. There aretwo primary phases in the RAM technique. At first, the CBs and critical outages (COs)must be identified. In the second phase, the RAM is calculated for these CBs under theCOs. For each CB, the highest power flow that is permitted is determined based on thethermal limit of the line. After that, the RAM is calculated as the highest allowable powerflow, which is restricted by three factors [18,36,37]:

Electricity 2022, 3 191
1. The commercial trades outside of the day-ahead power exchange (i.e., bilateral trad-ing, forward markets, intra-day markets, and real-time balancing) produce the ref-erence flow: these trades can be internal or external (inside a market zone or acrossmarket zones).
2. The final adjustment value (FAV): the FAV allows TSOs to consider extra information,such as an additional margin owing to complicated remedial activities or activetopology control; the FAV can be positive or negative.
3. The flow reliability margin (FRM): the FRM is a safety margin that must be used toindemnify for the approximations made in the FB method such as the assumptionsfor PTDFs, accidental flow deviations owing to load frequency control, and the use ofa linear grid model with a simplified topology [20,36–38].
The FB market coupling process consists of three main parts, namely, pre-marketcoupling, market coupling, and post market coupling. The pre-market coupling processstarts on the evening two days before the physical delivery of the energy traded [36,38].As mentioned above, two fundamental parameters are deployed for the FB optimizationalgorithm: the PTDFs and the RAM. The FB parameter calculation started two days beforethe delivery day (D-2) and completed the day-ahead morning. However, the day-aheadmarket results must be known already for the calculation of the PTDFs and the RAM. Thesolution that is given in this problem is the following: the PTDFs and the RAM values aredefined on the basis of a forecast of the power system’s state, at the time of the delivery(i.e., the D-2 forecast). Therefore, the accuracy of the predicted values is not only crucialfor the maximization of the social welfare from an economic point of view, but also for thesecure operation of the transmission system. Afterwards, these FB parameters are deliveredto the algorithm for the day-ahead market clearing [18,20,36,37]. The market couplingphase is carried out by the power exchange. The results, such as net positions and prices,are provided to the market. During the post-market coupling process, the TSO verifies themarket results, analyzes the operational security, and deals with the congestion rent [36,40].
2.4. Basic Steps of Our Work
As mentioned, the NTC current market-clearing design only considers commercialexchange between the market bidding zones. Since NTC does not account for physicalconstraints, actual power flows may differ from market power flows. Opposite this, theFB methodology considers the physical laws of the network by integrating them as partof the optimization problem in the form of optimization constraints. This denotes themain difference between the NTC and FB approach. By implementing the flow-basedmethodology, one creates market solutions closer to physical reality as well as respectingthe operational security of the grid.
As mentioned in the introduction, the mathematical background for both the NTC andthe FB algorithm was presented in detail in [19,20]. Briefly, the problem is formulated undermathematical terms as an optimization problem, by a common objective function for boththe NTC and FB approaches. The main difference is found in the constraints established onthe problem formulation.
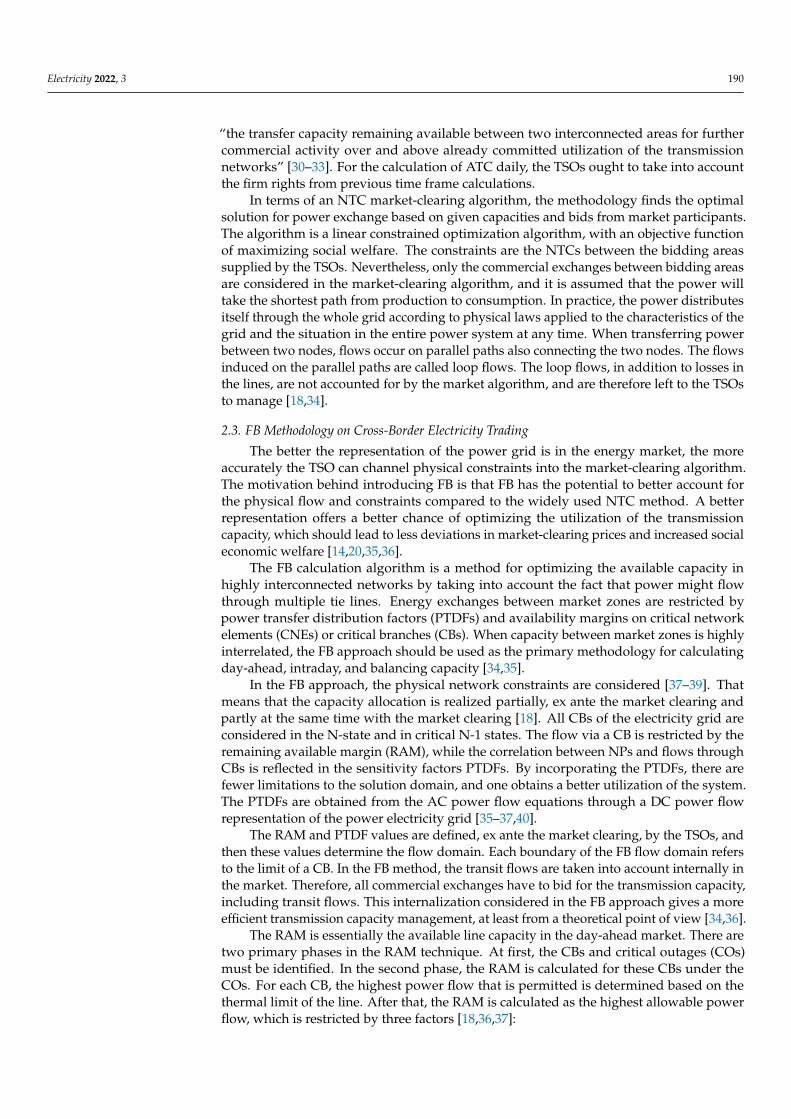
Both algorithmic approaches are investigated. The objective in both methods is tomaximize the social welfare of the electricity market. This differentiation is depicted inFigure 2 (where NP (net positions) = supply − demand). The FB algorithm, in most cases,leads to a better solution than the NTC, in terms of social welfare, price convergence, andtrading opportunities. The reason behind this is the difference in the constraints, whichlead to a wider solution space for the optimization problem. Thus, for a given level of safeoperation, the boundaries of FB domain will always be located on or outside the boundariesof NTC domain.
Electricity 2022, 3 192
Electricity 2022, 3, FOR PEER REVIEW 11
FB methodology considers the physical laws of the network by integrating them as part of the optimization problem in the form of optimization constraints. This denotes the main difference between the NTC and FB approach. By implementing the flow-based method-ology, one creates market solutions closer to physical reality as well as respecting the op-erational security of the grid.
As mentioned in the introduction, the mathematical background for both the NTC and the FB algorithm was presented in detail in [19,20]. Briefly, the problem is formulated under mathematical terms as an optimization problem, by a common objective function for both the NTC and FB approaches. The main difference is found in the constraints es-tablished on the problem formulation.
Both algorithmic approaches are investigated. The objective in both methods is to maximize the social welfare of the electricity market. This differentiation is depicted in Figure 2 (where NP (net positions) = supply − demand). The FB algorithm, in most cases, leads to a better solution than the NTC, in terms of social welfare, price convergence, and trading opportunities. The reason behind this is the difference in the constraints, which lead to a wider solution space for the optimization problem. Thus, for a given level of safe operation, the boundaries of FB domain will always be located on or outside the bounda-ries of NTC domain.
Figure 2. Formulation of the NTC and FB algorithm.
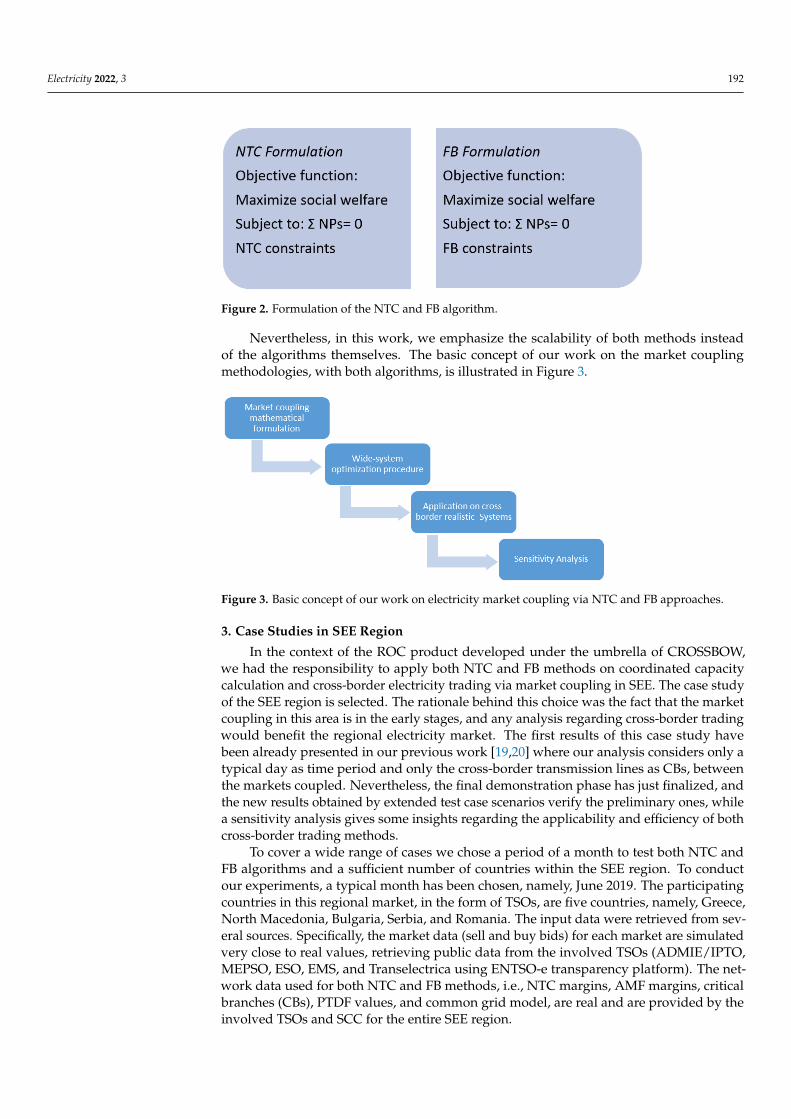
Nevertheless, in this work, we emphasize the scalability of both methods instead of the algorithms themselves. The basic concept of our work on the market coupling meth-odologies, with both algorithms, is illustrated in Figure 3.
Figure 3. Basic concept of our work on electricity market coupling via NTC and FB approaches.
Figure 2. Formulation of the NTC and FB algorithm.
Nevertheless, in this work, we emphasize the scalability of both methods insteadof the algorithms themselves. The basic concept of our work on the market couplingmethodologies, with both algorithms, is illustrated in Figure 3.
Electricity 2022, 3, FOR PEER REVIEW 11
FB methodology considers the physical laws of the network by integrating them as part
of the optimization problem in the form of optimization constraints. This denotes the main
difference between the NTC and FB approach. By implementing the flow-based method-
ology, one creates market solutions closer to physical reality as well as respecting the op-
erational security of the grid.
As mentioned in the introduction, the mathematical background for both the NTC
and the FB algorithm was presented in detail in [19,20]. Briefly, the problem is formulated
under mathematical terms as an optimization problem, by a common objective function
for both the NTC and FB approaches. The main difference is found in the constraints es-
tablished on the problem formulation.
Both algorithmic approaches are investigated. The objective in both methods is to
maximize the social welfare of the electricity market. This differentiation is depicted in
Figure 2 (where NP (net positions) = supply − demand). The FB algorithm, in most cases,
leads to a better solution than the NTC, in terms of social welfare, price convergence, and
trading opportunities. The reason behind this is the difference in the constraints, which
lead to a wider solution space for the optimization problem. Thus, for a given level of safe
operation, the boundaries of FB domain will always be located on or outside the bounda-
ries of NTC domain.
Figure 2. Formulation of the NTC and FB algorithm.
Nevertheless, in this work, we emphasize the scalability of both methods instead of
the algorithms themselves. The basic concept of our work on the market coupling meth-
odologies, with both algorithms, is illustrated in Figure 3.
Figure 3. Basic concept of our work on electricity market coupling via NTC and FB approaches.
Figure 3. Basic concept of our work on electricity market coupling via NTC and FB approaches.
3. Case Studies in SEE Region
In the context of the ROC product developed under the umbrella of CROSSBOW,we had the responsibility to apply both NTC and FB methods on coordinated capacitycalculation and cross-border electricity trading via market coupling in SEE. The case studyof the SEE region is selected. The rationale behind this choice was the fact that the marketcoupling in this area is in the early stages, and any analysis regarding cross-border tradingwould benefit the regional electricity market. The first results of this case study havebeen already presented in our previous work [19,20] where our analysis considers only atypical day as time period and only the cross-border transmission lines as CBs, betweenthe markets coupled. Nevertheless, the final demonstration phase has just finalized, andthe new results obtained by extended test case scenarios verify the preliminary ones, whilea sensitivity analysis gives some insights regarding the applicability and efficiency of bothcross-border trading methods.
To cover a wide range of cases we chose a period of a month to test both NTC andFB algorithms and a sufficient number of countries within the SEE region. To conductour experiments, a typical month has been chosen, namely, June 2019. The participatingcountries in this regional market, in the form of TSOs, are five countries, namely, Greece,North Macedonia, Bulgaria, Serbia, and Romania. The input data were retrieved from sev-eral sources. Specifically, the market data (sell and buy bids) for each market are simulatedvery close to real values, retrieving public data from the involved TSOs (ADMIE/IPTO,MEPSO, ESO, EMS, and Transelectrica using ENTSO-e transparency platform). The net-work data used for both NTC and FB methods, i.e., NTC margins, AMF margins, criticalbranches (CBs), PTDF values, and common grid model, are real and are provided by theinvolved TSOs and SCC for the entire SEE region.
Electricity 2022, 3 193
In these final demonstration tests, more CBs from the involved countries were included,and the extended time interval enhanced the quality of the experiments. Specifically, all thecross-border lines between the five countries, plus some internal lines of ESO (Bulgaria)and MEPSO (North Macedonia) after their suggestion, were considered as CBs. The typicaldays selected are all Wednesdays of June 2019, for procedural reasons, as suggested bySCC, the coordination center of the region.
After the deployment, testing, and demonstration of the NTC and FB algorithmsfor a three-country scenario (Greece, North Macedonia, and Bulgaria), four-country sce-nario (Greece, North Macedonia, Bulgaria, and Serbia) and five-country scenario (Greece,North Macedonia, Bulgaria, Serbia, and Romania) in SEE region, we obtain augmentedconclusions on:
(a) The maximization of the social welfare;(b) Better trading opportunities;(c) The price convergence.
Based on these benefits, a quantitative assessment of both NTC and FB results is givenvia three indexes, namely the social welfare (SW), market coupling capacities (MCC), andprice convergence (PC) index. The definitions of these three indexes, which practicallyare the key performance indicators (KPIs) of the capacity calculation via electricity marketcoupling, are calculated as follows:
• Social welfare index
SW =[Social Wel f are with market coupling− Social wel f are without crossborder trading]
Social wel f are without crossborder trading·100% (1)
• Market coupling capacities index
MCC = ∑k
c=1∑n
l=1Market Coupling Capacities (2)
where c represents the countries participating in the market coupling and l the cross-border interconnections or lines.
• Price converge index
PC = max(pi)−min(pi) (3)
where pi is the price vector of the countries involved in cross-border trading viamarket coupling.
• Total performance index
TP(%) = SW(%)·|PC(%)| (4)
where SW(%) is the SW index and the
PC(%) =[PC with market coupling − PC without crossborder trading]
PC without crossborder trading·100% (5)
The overall results and the KPIs values are recorded in Tables A1–A5 (Appendix A),for all test cases. In all examined scenarios, the comparison between the two methodsdemonstrates that the FB approach facilitates cross-border trading since it creates an ef-ficient cross-border electricity market that offers increased benefits for the participants.Particularly, the FB method offers enhanced utilization of the interconnection lines for allthe scenarios tested, since the calculated market coupling capacities are higher than therespective derived from the NTC algorithm. The total social welfare shows a significantincrease with the FB approach, which is an important economic benefit for all participantsinvolved in the market. Finally, it should be pointed out that the more the countries arecoupled, the more the overall welfare gain is, as expected, mainly via the FB method.

Electricity 2022, 3 194
Another benefit of this comparison is the enhanced price convergence. The prices convergeclearly better via the FB method for three, four, and five countries.
However, for reader convenience, the indexes obtained from the five-country scenarioby both the NTC and FB algorithm are presented in Figures 4–6, where one can observe thecomparison between the two methods that is mentioned above, in a more illustrated way.
Electricity 2022, 3, FOR PEER REVIEW 13
where c represents the countries participating in the market coupling and l the cross-bor-
der interconnections or lines.
• Price converge index
𝑃𝐶 = max(𝑝𝑖) − min(𝑝𝑖) (3)
where pi is the price vector of the countries involved in cross-border trading via market
coupling.
• Total performance index
𝑇𝑃 (%) = 𝑆𝑊(%) ∙ |𝑃𝐶(%)| (4)
where SW(%) is the SW index and the
𝑃𝐶(%) =[ 𝑃𝐶 𝑤𝑖𝑡ℎ 𝑚𝑎𝑟𝑘𝑒𝑡 𝑐𝑜𝑢𝑝𝑙𝑖𝑛𝑔 − 𝑃𝐶 𝑤𝑖𝑡ℎ𝑜𝑢𝑡 𝑐𝑟𝑜𝑠𝑠𝑏𝑜𝑟𝑑𝑒𝑟 𝑡𝑟𝑎𝑑𝑖𝑛𝑔]
𝑃𝐶 𝑤𝑖𝑡ℎ𝑜𝑢𝑡 𝑐𝑟𝑜𝑠𝑠𝑏𝑜𝑟𝑑𝑒𝑟 𝑡𝑟𝑎𝑑𝑖𝑛𝑔100% (5)
The overall results and the KPIs values are recorded in Tables A1–A5 (Appendix A),
for all test cases. In all examined scenarios, the comparison between the two methods
demonstrates that the FB approach facilitates cross-border trading since it creates an effi-
cient cross-border electricity market that offers increased benefits for the participants. Par-
ticularly, the FB method offers enhanced utilization of the interconnection lines for all the
scenarios tested, since the calculated market coupling capacities are higher than the re-
spective derived from the NTC algorithm. The total social welfare shows a significant in-
crease with the FB approach, which is an important economic benefit for all participants
involved in the market. Finally, it should be pointed out that the more the countries are
coupled, the more the overall welfare gain is, as expected, mainly via the FB method. An-
other benefit of this comparison is the enhanced price convergence. The prices converge
clearly better via the FB method for three, four, and five countries.
However, for reader convenience, the indexes obtained from the five-country sce-
nario by both the NTC and FB algorithm are presented in Figures 4–6, where one can
observe the comparison between the two methods that is mentioned above, in a more
illustrated way.
Figure 4. Social welfare index for the five-country scenario via both approaches. Figure 4. Social welfare index for the five-country scenario via both approaches.Electricity 2022, 3, FOR PEER REVIEW 14
Figure 5. Market coupling capacities index for the five-country scenario via both approaches.
Figure 6. Price convergence index for the five-country scenario via both approaches.
To further clarify the overall results obtained via both market coupling approaches
in SEE region during June 2019, an average range of each index is considered. Thus, in
Figures 6–8 the average score of SW, MCC, and PC indexes are depicted for the three-,
four-, and five-country scenarios, respectively. Specifically, in Figures 7 and 8, it is easily
observed that there is an important increase in the average SW and MCC index via the FB
approach compared with the ones obtained via the NTC method for different numbers of
countries.
Figure 5. Market coupling capacities index for the five-country scenario via both approaches.
Electricity 2022, 3, FOR PEER REVIEW 14
Figure 5. Market coupling capacities index for the five-country scenario via both approaches.
Figure 6. Price convergence index for the five-country scenario via both approaches.
To further clarify the overall results obtained via both market coupling approaches
in SEE region during June 2019, an average range of each index is considered. Thus, in
Figures 6–8 the average score of SW, MCC, and PC indexes are depicted for the three-,
four-, and five-country scenarios, respectively. Specifically, in Figures 7 and 8, it is easily
observed that there is an important increase in the average SW and MCC index via the FB
approach compared with the ones obtained via the NTC method for different numbers of
countries.
Figure 6. Price convergence index for the five-country scenario via both approaches.
To further clarify the overall results obtained via both market coupling approachesin SEE region during June 2019, an average range of each index is considered. Thus, inFigures 6–8 the average score of SW, MCC, and PC indexes are depicted for the three-, four-,

Electricity 2022, 3 195
and five-country scenarios, respectively. Specifically, in Figures 7 and 8, it is easily observedthat there is an important increase in the average SW and MCC index via the FB approachcompared with the ones obtained via the NTC method for different numbers of countries.
Electricity 2022, 3, FOR PEER REVIEW 15
Figure 7. Average social welfare index via both approaches.
Figure 8. Average market coupling capacities index via both approaches.
In addition, in Figure 9, one can observe that the prices converge clearly better via
the FB method for three, four, and five countries. The price convergence index is of great
significance since the optimization procedure is realized for both approaches in a wide-
region concept, resulting in similar final prices for all markets involved. As a general con-
clusion, in all the scenarios tested, the overall benefits resulted from the FB approach seem
to be greater than the NTC one.
At this point, it should be noted that as expected, the more the countries are coupled,
the more the total social welfare in euro is, even though the average SW index appears to
be higher for the three countries scenario via the FB method. This is illustrated in Figure
10. Furthermore, the average PC index is calculated as the lowest one in the three countries
scenario with the FB method, in all the time frames. The reason why is that for the exam-
ined three countries scenarios, all the cross-border lines, plus some internal lines of ESO
(Bulgaria) and MEPSO (North Macedonia) have been considered as CBs, given that they
are with ADMIE/IPTO (Greece) the three TSOs involved in these scenarios.
Figure 7. Average social welfare index via both approaches.
Electricity 2022, 3, FOR PEER REVIEW 15
Figure 7. Average social welfare index via both approaches.
Figure 8. Average market coupling capacities index via both approaches.
In addition, in Figure 9, one can observe that the prices converge clearly better via
the FB method for three, four, and five countries. The price convergence index is of great
significance since the optimization procedure is realized for both approaches in a wide-
region concept, resulting in similar final prices for all markets involved. As a general con-
clusion, in all the scenarios tested, the overall benefits resulted from the FB approach seem
to be greater than the NTC one.
At this point, it should be noted that as expected, the more the countries are coupled,
the more the total social welfare in euro is, even though the average SW index appears to
be higher for the three countries scenario via the FB method. This is illustrated in Figure
10. Furthermore, the average PC index is calculated as the lowest one in the three countries
scenario with the FB method, in all the time frames. The reason why is that for the exam-
ined three countries scenarios, all the cross-border lines, plus some internal lines of ESO
(Bulgaria) and MEPSO (North Macedonia) have been considered as CBs, given that they
are with ADMIE/IPTO (Greece) the three TSOs involved in these scenarios.
Figure 8. Average market coupling capacities index via both approaches.
In addition, in Figure 9, one can observe that the prices converge clearly better viathe FB method for three, four, and five countries. The price convergence index is of greatsignificance since the optimization procedure is realized for both approaches in a wide-region concept, resulting in similar final prices for all markets involved. As a generalconclusion, in all the scenarios tested, the overall benefits resulted from the FB approachseem to be greater than the NTC one.
Electricity 2022, 3, FOR PEER REVIEW 16
Figure 9. Average price converge index via both approaches.
Figure 10. Total social welfare in euro via both approaches.
Finally, to give an overall view of the coordinated capacity calculation on cross-bor-
ders via market coupling procedure in the SEE region, a total performance index is intro-
duced. The total performance index is defined in Equations (4) and (5) and gives a quick
assessment of the effectiveness and performance of the NTC and FB approach, as these
functionalities are tested in the frame of CROSSBOW ROC. This index is given in percent-
age (%) and is obtained by combining the two basic indexes of SW (%) and PC (%). The
concept for TP (%) is a simple and prompt total evaluation of the NTC or FB method in
every test case scenario. Thus, as the SW index increases and the PC index decreases, the
TP index has a significant increase and the method examined is presented to be more ef-
fective in general terms. In Figures 11 and 12, the TP index is depicted in a graphical way
for both NTC and FB approach, respectively.
Figure 9. Average price converge index via both approaches.

Electricity 2022, 3 196
At this point, it should be noted that as expected, the more the countries are coupled,the more the total social welfare in euro is, even though the average SW index appearsto be higher for the three countries scenario via the FB method. This is illustrated inFigure 10. Furthermore, the average PC index is calculated as the lowest one in the threecountries scenario with the FB method, in all the time frames. The reason why is that forthe examined three countries scenarios, all the cross-border lines, plus some internal linesof ESO (Bulgaria) and MEPSO (North Macedonia) have been considered as CBs, given thatthey are with ADMIE/IPTO (Greece) the three TSOs involved in these scenarios.
Electricity 2022, 3, FOR PEER REVIEW 16
Figure 9. Average price converge index via both approaches.
Figure 10. Total social welfare in euro via both approaches.
Finally, to give an overall view of the coordinated capacity calculation on cross-bor-
ders via market coupling procedure in the SEE region, a total performance index is intro-
duced. The total performance index is defined in Equations (4) and (5) and gives a quick
assessment of the effectiveness and performance of the NTC and FB approach, as these
functionalities are tested in the frame of CROSSBOW ROC. This index is given in percent-
age (%) and is obtained by combining the two basic indexes of SW (%) and PC (%). The
concept for TP (%) is a simple and prompt total evaluation of the NTC or FB method in
every test case scenario. Thus, as the SW index increases and the PC index decreases, the
TP index has a significant increase and the method examined is presented to be more ef-
fective in general terms. In Figures 11 and 12, the TP index is depicted in a graphical way
for both NTC and FB approach, respectively.
Figure 10. Total social welfare in euro via both approaches.
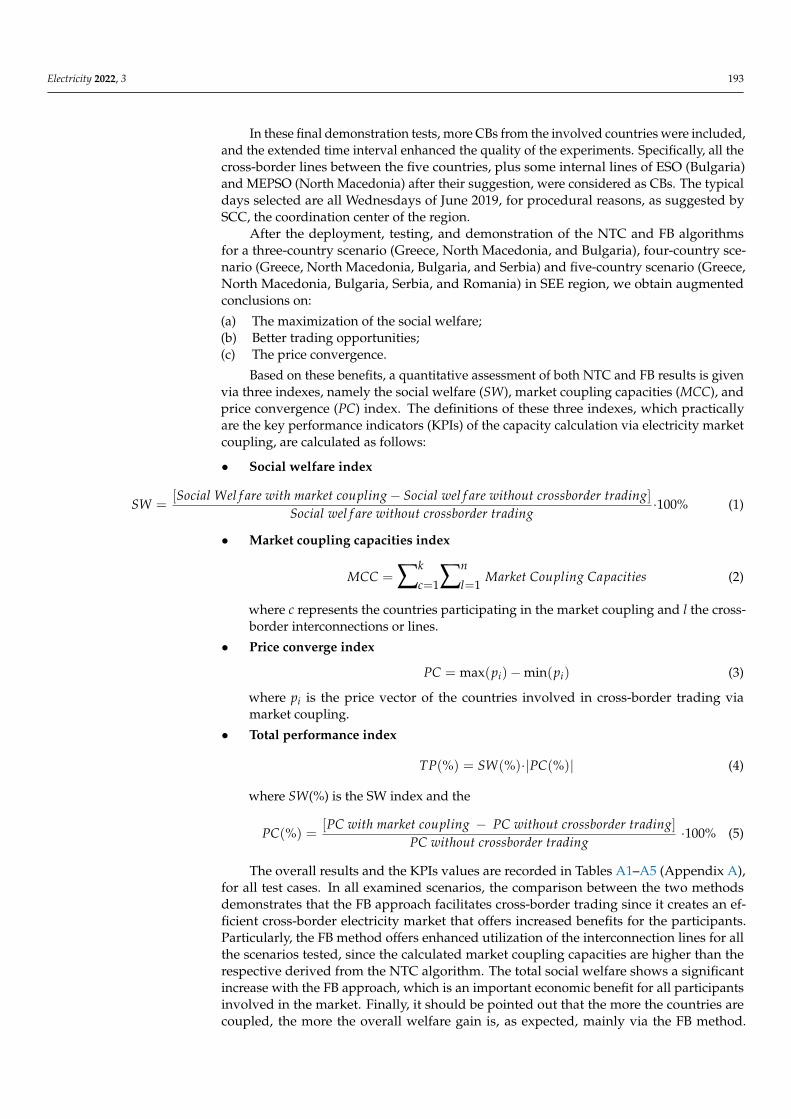
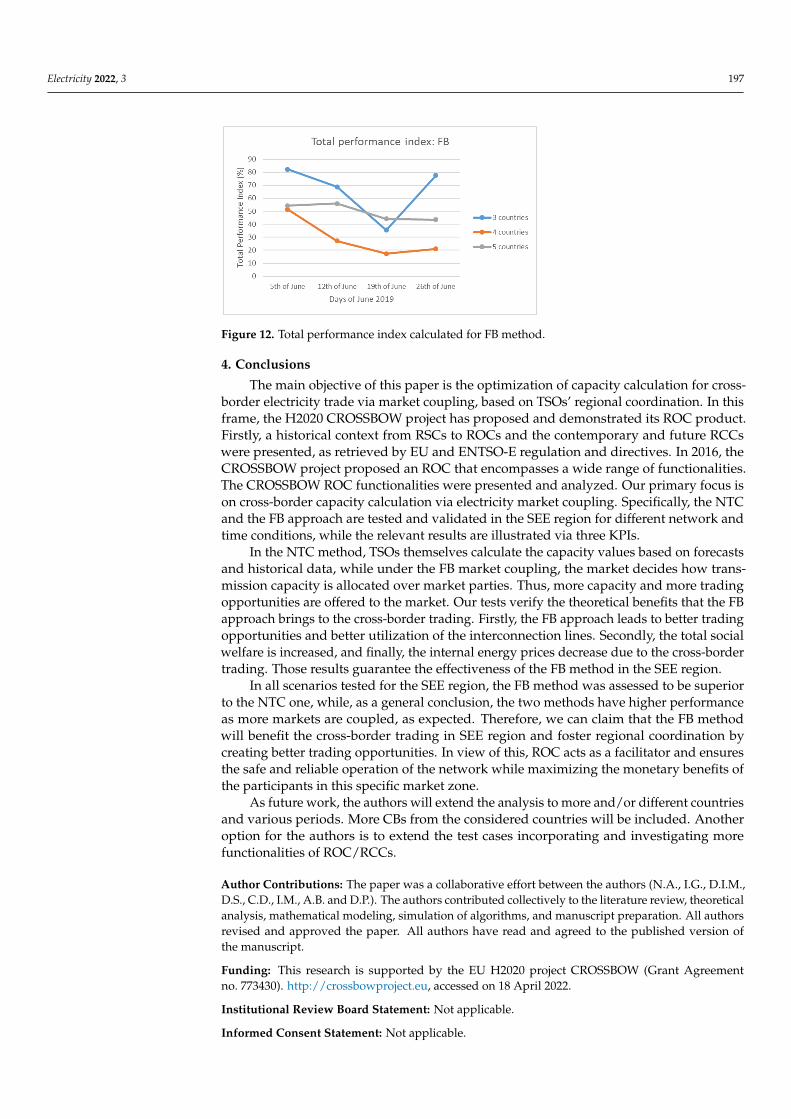
Finally, to give an overall view of the coordinated capacity calculation on cross-bordersvia market coupling procedure in the SEE region, a total performance index is introduced.The total performance index is defined in Equations (4) and (5) and gives a quick assessmentof the effectiveness and performance of the NTC and FB approach, as these functionalitiesare tested in the frame of CROSSBOW ROC. This index is given in percentage (%) and isobtained by combining the two basic indexes of SW (%) and PC (%). The concept for TP(%) is a simple and prompt total evaluation of the NTC or FB method in every test casescenario. Thus, as the SW index increases and the PC index decreases, the TP index has asignificant increase and the method examined is presented to be more effective in generalterms. In Figures 11 and 12, the TP index is depicted in a graphical way for both NTC andFB approach, respectively.
Electricity 2022, 3, FOR PEER REVIEW 17
Figure 11. Total performance index calculated for NTC method.
Figure 12. Total performance index calculated for FB method.
4. Conclusions
The main objective of this paper is the optimization of capacity calculation for cross-
border electricity trade via market coupling, based on TSOs’ regional coordination. In this
frame, the H2020 CROSSBOW project has proposed and demonstrated its ROC product.
Firstly, a historical context from RSCs to ROCs and the contemporary and future RCCs
were presented, as retrieved by EU and ENTSO-E regulation and directives. In 2016, the
CROSSBOW project proposed an ROC that encompasses a wide range of functionalities.
The CROSSBOW ROC functionalities were presented and analyzed. Our primary focus is
on cross-border capacity calculation via electricity market coupling. Specifically, the NTC
and the FB approach are tested and validated in the SEE region for different network and
time conditions, while the relevant results are illustrated via three KPIs.
Figure 11. Total performance index calculated for NTC method.
Electricity 2022, 3 197
Electricity 2022, 3, FOR PEER REVIEW 17
Figure 11. Total performance index calculated for NTC method.
Figure 12. Total performance index calculated for FB method.
4. Conclusions
The main objective of this paper is the optimization of capacity calculation for cross-
border electricity trade via market coupling, based on TSOs’ regional coordination. In this
frame, the H2020 CROSSBOW project has proposed and demonstrated its ROC product.
Firstly, a historical context from RSCs to ROCs and the contemporary and future RCCs
were presented, as retrieved by EU and ENTSO-E regulation and directives. In 2016, the
CROSSBOW project proposed an ROC that encompasses a wide range of functionalities.
The CROSSBOW ROC functionalities were presented and analyzed. Our primary focus is
on cross-border capacity calculation via electricity market coupling. Specifically, the NTC
and the FB approach are tested and validated in the SEE region for different network and
time conditions, while the relevant results are illustrated via three KPIs.
Figure 12. Total performance index calculated for FB method.
4. Conclusions
The main objective of this paper is the optimization of capacity calculation for cross-border electricity trade via market coupling, based on TSOs’ regional coordination. In thisframe, the H2020 CROSSBOW project has proposed and demonstrated its ROC product.Firstly, a historical context from RSCs to ROCs and the contemporary and future RCCswere presented, as retrieved by EU and ENTSO-E regulation and directives. In 2016, theCROSSBOW project proposed an ROC that encompasses a wide range of functionalities.The CROSSBOW ROC functionalities were presented and analyzed. Our primary focus ison cross-border capacity calculation via electricity market coupling. Specifically, the NTCand the FB approach are tested and validated in the SEE region for different network andtime conditions, while the relevant results are illustrated via three KPIs.
In the NTC method, TSOs themselves calculate the capacity values based on forecastsand historical data, while under the FB market coupling, the market decides how trans-mission capacity is allocated over market parties. Thus, more capacity and more tradingopportunities are offered to the market. Our tests verify the theoretical benefits that the FBapproach brings to the cross-border trading. Firstly, the FB approach leads to better tradingopportunities and better utilization of the interconnection lines. Secondly, the total socialwelfare is increased, and finally, the internal energy prices decrease due to the cross-bordertrading. Those results guarantee the effectiveness of the FB method in the SEE region.
In all scenarios tested for the SEE region, the FB method was assessed to be superiorto the NTC one, while, as a general conclusion, the two methods have higher performanceas more markets are coupled, as expected. Therefore, we can claim that the FB methodwill benefit the cross-border trading in SEE region and foster regional coordination bycreating better trading opportunities. In view of this, ROC acts as a facilitator and ensuresthe safe and reliable operation of the network while maximizing the monetary benefits ofthe participants in this specific market zone.
As future work, the authors will extend the analysis to more and/or different countriesand various periods. More CBs from the considered countries will be included. Anotheroption for the authors is to extend the test cases incorporating and investigating morefunctionalities of ROC/RCCs.
Author Contributions: The paper was a collaborative effort between the authors (N.A., I.G., D.I.M.,D.S., C.D., I.M., A.B. and D.P.). The authors contributed collectively to the literature review, theoreticalanalysis, mathematical modeling, simulation of algorithms, and manuscript preparation. All authorsrevised and approved the paper. All authors have read and agreed to the published version ofthe manuscript.
Funding: This research is supported by the EU H2020 project CROSSBOW (Grant Agreementno. 773430). http://crossbowproject.eu, accessed on 18 April 2022.
Institutional Review Board Statement: Not applicable.
Informed Consent Statement: Not applicable.

Electricity 2022, 3 198
Data Availability Statement: Some of the data used is public and uploaded on https://transparency.entsoe.eu/ (accessed on 12 April 2022). However, the most of data used are confidential.
Acknowledgments: Authors would like to thank all the involved TSOs, namely, ADMIE/IPTO,MEPSO, EMS, ESO, and TRANSELECTRICA for providing all the necessary data to conduct ourexperiments. Moreover, authors would like to thank SCC for their help throughout the experimentsand the data provision.
Conflicts of Interest: The authors declare no conflict of interest.
Abbreviations
CROSSBOWCROSS BOrder management of variable renewable energies and storage unitsenabling a transnational Wholesale market
RES Renewable energy resourcesSEE Southeastern EuropeROC Regional operation centerATC Available transfer capacityFB Flow-basedKPI Key performance indicatorRSC Regional security coordinatorRSCI Regional Security Coordination InitiativeTSO Transmission system operatorENTSO-E European Network of Transmission System Operators for ElectricityEU European UnionIEM Internal electricity marketCEP Clean energy packageCACM Congestion allocation congestion managementSOGL System operation guidelineaFRR Automatic frequency reserve replacementmFRRRAM Manual frequency reserve replacementRemaining available marginRCC Regional coordination centerSW Social welfareMCC Market coupling capacityPC Price convergenceCB Critical branchCNE Critical element networkCO Critical outagePTDF Power transmission distribution factorSCC Security coordination center
Appendix A
Table A1. Total social welfare for a typical hour of a typical day.
ScenarioSocial Welfare (EUR)
5 June 12 June 19 June 26 June
Uncoupled markets (3 countries) 69,262 74,690 96,735 71,523
NTC (3 countries) 85,581 84,277 104,851 82,792
Flow-based (3 countries) 144,395 133,706 139,063 132,044
Uncoupled markets (4 countries) 125,302 132,998 146,817 118,020
NTC (4 countries) 151,449 150,408 162,944 162,944
Flow-based (4 countries) 207,145 196,706 200,410 184,493
Uncoupled markets (5 countries) 169,622 160,994 179,568 150,005
NTC (5 countries) 212,820 192,114 212,268 183,383
Flow-based (5 countries) 316,188 271,282 296,293 246,063

Electricity 2022, 3 199
Table A2. Indexes for 5th of June.
Scenario Social Welfare Index (%) Market CouplingCapacities Index (MW)
Price ConvergenceIndex (EUR/MWh)
NTC(3 countries) 23.6 1600.0 28
FB (3 countries) 108.5 7508.7 8
NTC(4 countries) 20.9 3048.0 28
FB (4 countries) 65.3 14,104.1 7
NTC(5 countries) 25.5 4064.0 28
FB (5 countries) 86.4 21,422.8 13
Table A3. Indexes for 12th of June.
Scenario Social Welfare Index (%) Market CouplingCapacities Index (MW)
Price ConvergenceIndex (EUR/MWh)
NTC(3 countries) 12.8 1584.0 23
FB (3 countries) 79.0 6163.2 3
NTC(4 countries) 13.1 2960.0 18
FB (4 countries) 47.9 12,996.2 10
NTC(5 countries) 19.3 3754.0 18
FB (5 countries) 68.5 21,039.0 5
Table A4. Indexes for 19th of June.
Scenario Social Welfare Index (%) Market CouplingCapacities Index (MW)
Price ConvergenceIndex (EUR/MWh)
NTC(3 countries) 8.4 1668.0 21
FB (3 countries) 43.8 7778.3 4
NTC(4 countries) 11.0 3090.0 21
FB (4 countries) 36.5 14,563.3 11
NTC(5 countries) 18.2 3927.0 21
FB (5 countries) 65.0 22,086.1 9
Table A5. Indexes for 26th of June.
Scenario Social Welfare Index (%) Market CouplingCapacities Index (MW)
Price ConvergenceIndex (EUR/MWh)
NTC(3 countries) 15.8 1660.0 24
FB (3 countries) 84.6 7751.4 2
NTC(4 countries) 21.0 3324.0 21
FB (4 countries) 56.3 14,531.9 15
NTC(5 countries) 22.3 4664.0 21
FB (5 countries) 64.1 22,076.1 9
References1. Newbery, D.; Strbac, G.; Viehoff, I. The benefits of integrating European electricity markets. Energy Policy 2016, 94, 253–263.
[CrossRef]2. Lam, L.H.; Ilea, V.; Bovo, C. European day-ahead electricity market coupling: Discussion, modeling, and case study. Electr. Power
Syst. Res. 2018, 155, 80–92. [CrossRef]

Electricity 2022, 3 200
3. Meeus, L. The Evolution of Electricity Markets in Europe; Edward Elgar Publishing: Cheltenham, UK, 2020.4. Abrell, J.; Rausch, S. Cross-country electricity trade, renewable energy and European transmission infrastructure policy. J. Environ.
Econ. Manag. 2016, 79, 87–113. [CrossRef]5. ACER/CEER. Annual Report on the Results of Monitoring the Internal Electricity Markets in 2015; Agency for the Cooperation of
Energy Regulators (ACER) and Council of European Energy Regulators (CEER): Ljubljana, Slovenia, 2016.6. The European Commission. Commission Regulation (EU) 2015/1222 of 24 July 2015, establishing a guideline on capacity
allocation and congestion management. Off. J. Eur. Union 2015, L197, 24–72.7. Kannavou, M.; Zampara, M.; Capros, P. Modelling the EU internal electricity market: The PRIMES-IEM Model. Energies 2019,
12, 2887. [CrossRef]8. Jacottet, A. Cross-Border Electricity Interconnections for a Well-Functioning EU Internal Market; Oxford Institute for Energy Studies:
Oxford, UK, 2012.9. Gunst, A.; Luther-Jones, N.; Cieslarczyk, M. The Energy Regulation and Markets Review: European Union, 2020. Available online:
https://thelawreviews.co.uk/title/the-energy-regulation-and-markets-review/european-union (accessed on 12 April 2022).10. Pollitt, M.G. The European Single Market in Electricity: An Economic Assessment. Rev. Ind. Organ. 2019, 55, 63–87. [CrossRef]11. ENTSO-E. Enhanced TSO Regional Coordination for Europe: Act Locally, Coordinate Regionally, Think European; ENTSOE: Brussels,
Belgium, 2019.12. ENTSO-E. Interconnected Europe. Available online: www.entsoe.eu/regions (accessed on 14 April 2022).13. ENTSO-E. Proposal for the Regional Coordination Centres’ Task ‘Regional Sizing of Reserve Capacity’ in Accordance with Article 37(j) of
the Regulation (EU) 2019/943 of the European Parliament and of the Council of 5 June 2019 on the Internal Market for Electricity; ENTSOE:Brussels, Belgium, 2021.
14. CROSSBOW D4.1. Analysis of the Regional Security Coordination Initiatives and RES Control Centres, 2019. Available online:https://ec.europa.eu/research/participants/documents/downloadPublic/clhTdGV4UmFibDlhS3c1dDNsUGU2TzlIZ1o0ZXc3MlMrWmZ4SGF0djN6OFZBME1aWkVGZkh3PT0=/attachment/VFEyQTQ4M3ptUWN3ek00MTcrNEVjMDVBYzl4S3JWd2c= (accessed on 12 April 2022).
15. ENTSOE. An Overview of the European Balancing Market and the Electricity Balancing Guideline; ENTSOE: Brussels, Belgium, 2018.16. Steinbacher, K.; Schult, H.; Jörling, K.; Fichter, T.; Staschus, K.; Schröder, J.; Lenkowski, A. Cross-Border Cooperation for Interconnections
and Electricity Trade Experiences and Outlook from the European Union and the GCC; Navigant Energy Germany: Berlin, Germany, 2019.17. Wittenstein, M.; Scott, J.; Razali, N.M.M. International Energy Agency. Electricity Security Across Borders Case Studies on Cross-Border
Electricity Security in Europe; Insights Series; International Energy Agency: Paris, France, 2016.18. Leuven, K. Cross-border electricity trading: Towards flow-based market coupling. Ei Fact Sheet 2015, 2, 1–5.19. Makrygiorgou, D.I.; Andriopoulos, N.; Georgantas, I.; Dikaiakos, C.; Papaioannou, G.P. Cross-Border Electricity Trading in
Southeast Europe Towards an Internal European Market. Energies 2020, 13, 6653. [CrossRef]20. Makrygiorgou, D.I.; Andriopoulos, N.; Dikaiakos, C.; Papaioannou, G.P. Cross-border trading via market coupling in South-East
Europe region. In Proceedings of the 17th International Conference on the European Energy Market (EEM), Stockholm, Sweden,16–18 September 2020.
21. Roldan-Fernandez, J.M.; Gómez-Quiles, C.; Merre, A.; Burgos-Payán, M.; Riquelme-Santos, J.M. Cross-Border Energy Exchangeand Renewable Premiums: The Case of the Iberian System. Energies 2018, 11, 3277. [CrossRef]
22. Bahar, H.; Sauvage, J. Cross-Border Trade in Electricity and the Development of Renewables-Based Electric Power: Lessons from Europe;OECD Trade and Environment Working Papers 2013/02; OECD Publishing: Paris, France, 2013.
23. CROSSBOW D2.2. Use Cases, Scenarios and KPIs Identification. Available online: http://crossbowproject.eu/deliverables(accessed on 14 April 2022).
24. Puka, L.; Szulecki, K. The politics and economics of cross-border electricity infrastructure: A framework for analysis. Energy Res.Soc. Sci. 2014, 4, 124–134. [CrossRef]
25. Javidsharifi, M.; Pourroshanfekr Arabani, H.; Kerekes, T.; Sera, D.; Spataru, S.; Guerrero, J.M. Effect of Battery Degradation on theProbabilistic Optimal Operation of Renewable-Based Microgrids. Electricity 2022, 3, 53–74. [CrossRef]
26. Liang, X.; Chai, H.; Ravishankar, J. Analytical Methods of Voltage Stability in Renewable Dominated Power Systems: A Review.Electricity 2022, 3, 75–107. [CrossRef]
27. Biskas, P.N.; Chatzigiannis, D.I.; Bakirtzis, A.G. European electricity market integration with mixed market designs—Part I:Formulation. IEEE Trans. Power Syst. 2013, 29, 458–465. [CrossRef]
28. Biskas, P.N.; Chatzigiannis, D.I.; Bakirtzis, A.G. European electricity market integration with mixed market designs—Part II:Solution algorithm and case studies. IEEE Trans. Power Syst. 2013, 29, 466–475. [CrossRef]
29. Pu, Y.; Li, Y.; Wang, Y. Structure Characteristics and Influencing Factors of Cross-Border Electricity Trade: A Complex NetworkPerspective. Sustainability 2021, 13, 5797. [CrossRef]
30. The European Network of Transmission System Operators for Electricity (ENTSOE). Definitions of Transfer Capacities in LiberalizedElectricity Markets; ENTSOE: Brussels, Belgium, 2001.
31. The European Network of Transmission System Operators for Electricity (ENTSOE). Procedures for Cross-Border Capacity Assess-ments; ENTSOE: Brussels, Belgium, 2001.
32. The European Network of Transmission System Operators for Electricity (ENTSOE). Net Transfer Capacities (NTC) and AvailableTransfer Capacities (ATC) in the Internal Market of Electricity in Europe (IEM); ENTSOE: Brussels, Belgium, 2000.

Electricity 2022, 3 201
33. Energy Community, EKC; DMS Group. Market Coupling Simulator for South-East Europe Final Report; Energy Community:Vienna, Austria, 2014.
34. Mohammed, O.O.; Mustafa, M.W.; Mohammed, D.S.S.; Otuoze, A.O. Available transfer capability calculation methods: A com-prehensive review. Int. Trans. Electr. Energy Syst. 2019, 29, e2846. [CrossRef]
35. Amprion Gmbh. Flow Based Market Coupling—Development of the Market and Grid Situation; Technical Report; Amprion GmbH:Dortmund, Germany, 2018.
36. Energinet.dk; Svenska Kraftnät; Fingrid; Statnett, S.F. Methodology and Concepts for the Nordic Flow-Based Market Coupling Approach;Technical Report; Energinet.dk: Fredericia, Denmark; Svenska Kraftnät: Sundbyberg, Sweden; Fingrid: Helsinki, Finland;Statnett SF.: Oslo, Norway, 2014.
37. The European Network of Transmission System Operators for Electricity (ENTSOE). Methodology: Flow-Based Market Coupling,Brussels; ENTSOE: Brussels, Belgium, 2018.
38. Felten, B.; Osinski, P.; Felling, T.; Weber, C. The flow-based market coupling domain—Why we can’t get it right. Util. Policy 2021,70, 101136. [CrossRef]
39. Finck, R. Impact of Flow Based Market Coupling on the European Electricity Markets. In Sustainability Management Forum|NachhaltigkeitsManagement Forum; Springer: Berlin/Heidelberg, Germany, 2021; Volume 29, pp. 173–186.
40. Schönheit, D.; Kenis, M.; Lorenz, L.; Möst, D.; Delarue, E.; Bruninx, K. Towards a fundamental understanding of flow-basedmarket coupling for cross-border electricity trading. Adv. Appl. Energy 2021, 2, 100027. [CrossRef]