2017 arkansas higher education coordinating board - ERIC
187
-
Upload
khangminh22 -
Category
Documents
-
view
1 -
download
0
Transcript of 2017 arkansas higher education coordinating board - ERIC


i
2017 ARKANSAS HIGHER EDUCATION COORDINATING BOARD
MRS. SHERREL JOHNSON, CHAIR El Dorado, AR Term Expires: 2018 DR. JIM CARR ,VICE CHAIR Searcy, AR Term Expires: 2021 DR. MICHAEL STANTON, SECRETARY Wooster, AR Term Expires: 2021 DR. CHARLES ALLEN Little Rock, AR Term Expires: 2019 MR. KEVEN ANDERSON Rogers, AR Term Expires: 2023 MR. AL BRODELL Jonesboro, AR Term Expires: 2023
DR. OLIN COOK Russellville, AR Term Expires: 2020
MR. CHRIS GILLIAM Magnolia, AR Term Expires: 2020
MRS. LORI GRIFFIN Van Buren, AR Term Expires: 2022
MR. GREG REVELS DeQueen, AR Term Expires 2018
MR. SAM SICARD Fort Smith, AR Term Expires: 2019

ii
Fact Book:
Arkansas Public Higher Education
August 2017

iii
TABLE OF CONTENTS
OVERVIEW .............................................................................................................. 1
ARKANSAS HIGHER EDUCATION COORDINATING BOARD (AHECB) RECOMMENDATIONS FOR THE 2017-19 BIENNIUM ............................................... 2
TABLE 1.1A. SUMMARY OF OPERATING NEEDS & RECOMMENDATIONS FOR THE 2017-19 BIENNIUM ...................... 3 TABLE 1.1B. TWO-YEAR COLLEGES: OPERATING NEEDS & RECOMMENDATIONS FOR 2017-19 BIENNIUM ............ 4 TABLE 1.1C. FOUR-YEAR UNIVERSITIES: OPERATING NEEDS & RECOMMENDATIONS FOR THE 2017-19 BIENNIUM ........................................................................................................................................................................................ 5 TABLE 1.1D. NON-FORMULA ENTITIES: OPERATING NEEDS & RECOMMENDATIONS FOR 2017-19 BIENNIUM ..... 6 TABLE 1.1E. TECHNICAL CENTERS: OPERATING NEEDS & RECOMMENDATIONS FOR 2017-19 BIENNIUM ............. 7 TABLE 1.2: CAPITAL REQUESTS/RECOMMENDATIONS FOR THE 2017-19 BIENNIUM ...................................................... 8 TABLE 1.3A: MAXIMUM LINE ITEM COMPARISONS FOR SELECTED KEY POSITIONS - AHECB RECOMMENDATIONS FOR UNIVERSITIES: FY2017-18 .......................................................................................................... 23 TABLE 1.3B: MAXIMUM LINE ITEM COMPARISONS FOR SELECTED KEY POSITIONS - AHECB RECOMMENDATIONS FOR COLLEGES: FY2017-18 ................................................................................................................ 24
LEGISLATIVE APPROPRIATIONS FOR THE 2017-19 BIENNIUM .............................. 25
TABLE 2.1A – 2016-17 REVENUE STABILIZATION ACT ALLOCATIONS: HIGHER EDUCATION AND OTHER STATE FUNDS. ........................................................................................................................................................................................... 26 TABLE 2.1B – 2017-18 REVENUE STABILIZATION ACT ALLOCATIONS: HIGHER EDUCATION AND OTHER STATE FUNDS. ........................................................................................................................................................................................... 26 TABLE 2.2A – OFFICIAL REVENUE FORECAST FY2017 ....................................................................................................... 27 TABLE 2.2B – OFFICIAL REVENUE FORECAST FY2018 ........................................................................................................ 28 TABLE 2.3 – INSTITUTIONS OF HIGHER EDUCATION GENERAL IMPROVEMENT APPROPRIATIONS FUNDED WITH RAINY DAY FUNDS PURSUANT TO ACT 1123 & ACT 1084 OF 2017 2017-19 BIENNIUM ............................................... 29 TABLE 2.4A – MAXIMUM LINE ITEM COMPARISONS FOR SELECTED KEY POSITIONS APPROPRIATED FOR FOUR-YEAR INSTITUTIONS: FY 2016-17 ............................................................................................................................................. 38 TABLE 2.4B – MAXIMUM LINE ITEM COMPARISONS FOR SELECTED KEY POSITIONS APPROPRIATED FOR TWO-YEAR INSTITUTIONS: FY 2016-2017 ......................................................................................................................................... 38 TABLE 2.5A – MAXIMUM LINE ITEM COMPARISONS FOR SELECTED KEY POSITIONS APPROPRIATED FOR FOUR-YEAR INSTITUTIONS: FY 2017-18 ............................................................................................................................................. 39 TABLE 2.5B – MAXIMUM LINE ITEM COMPARISONS FOR SELECTED KEY POSITIONS APPROPRIATED FOR TWO-YEAR INSTITUTIONS: FY 2017-18 ............................................................................................................................................. 39
HISTORICAL FUNDING OF ARKANSAS HIGHER EDUCATION ................................ 40
TABLE 3.1 COMPARISON OF ARKANSAS HIGHER EDUCATION COORDINATING BOARD FUNDING RECOMMENDATIONS AND GENERAL REVENUE FUNDING: 1987-88 THROUGH 2017-18 ............................................. 41 TABLE 3.2 – NET STATE GENERAL REVENUE DISTRIBUTED TO ALL AGENCIES UNDER THE PROVISIONS OF THE RSA: 1998-99 THROUGH 2016-17 ............................................................................................................................................. 42 CHART 1. ARKANSAS PUBLIC HIGHER EDUCATION INSTITUTIONS’ PERCENTAGE OF RSA GENERAL REVENUES . 43 CHART 2. ARKANSAS TOTAL RSA GENERAL REVENUE....................................................................................................... 43

iv
TABLE 3.3 – COMPARISON OF STATE FUNDING FOR GENERAL OPERATIONS, FTE STUDENTS AND HEPI*: FY1999 TO 2017 ........................................................................................................................................................................... 44 CHART 3. COMPARISON OF FTE STUDENTS AND STATE FUNDING FOR GENERAL OPERATIONS ADJUSTED FOR HEPI .............................................................................................................................................................................................. 45 CHART 4. COMPARISON OF ARKANSAS PUBLIC HIGHER EDUCATION CURRENT AND REAL DOLLARS* ................... 46 TABLE 3.4A – SUMMARY OF ALL STATE REVENUES RECEIVED UNIVERSITIES 2006-07 TO 2016-17 .......................... 47 TABLE 3.4B – SUMMARY OF ALL STATE REVENUES RECEIVED COLLEGES 2006-07 TO 2016-17 ................................ 48 TABLE 3.5 – DISTRIBUTION OF WORKFORCE 2000 FUNDS PURSUANT TO A.C.A § 26-51-205: 2004-05 TO 2016-17 ......................................................................................................................................................................................................... 49 TABLE 3.6 – STATE FUNDS AVAILABLE TO HIGHER EDUCATION FOR CAPITAL EXPENDITURES BY BIENNIUM: 1991-93 THROUGH 2015-17 ........................................................................................................................................................ 50 TABLE 3.7 – GENERAL REVENUE RECEIVED AS A PERCENTAGE OF TOTAL CURRENT FUND REVENUE: 2003-2016 ......................................................................................................................................................................................................... 51
CURRENT FUND REVENUES AND EXPENDITURES BY INSTITUTION: .................. 52
2007-08 THROUGH 2015-16 .................................................................................... 52
TABLE 4.1 – TOTAL CURRENT FUND REVENUES AND EXPENDITURES FISCAL YEAR 2007 ......................................... 53 TABLE 4.2 – TOTAL CURRENT FUND REVENUES AND EXPENDITURES FISCAL YEAR 2008 ......................................... 54 TABLE 4.3 – TOTAL CURRENT FUND REVENUES AND EXPENDITURES FISCAL YEAR 2009 ......................................... 55 TABLE 4.4 – TOTAL CURRENT FUND REVENUES AND EXPENDITURES FISCAL YEAR 2010 ......................................... 56 TABLE 4.5 – TOTAL CURRENT FUND REVENUES AND EXPENDITURES FISCAL YEAR 2011 ......................................... 57 TABLE 4.6 – TOTAL CURRENT FUND REVENUES AND EXPENDITURES FISCAL YEAR 2012 ......................................... 58 TABLE 4.7 – TOTAL CURRENT FUND REVENUES AND EXPENDITURES FISCAL YEAR 2013 ......................................... 59 TABLE 4.8 – TOTAL CURRENT FUND REVENUES AND EXPENDITURES FISCAL YEAR 2014 ......................................... 60 TABLE 4.9 – TOTAL CURRENT FUND REVENUES AND EXPENDITURES FISCAL YEAR 2015 ......................................... 61 TABLE 4.10 – TOTAL CURRENT FUND REVENUES AND EXPENDITURES FISCAL YEAR 2016 ....................................... 62 TABLE 4.11 – TOTAL CURRENT FUND REVENUES AND EXPENDITURES SUMMARY: 2007 THROUGH 2016 ............... 63
INSTITUTIONAL FINANCE PROFILES .................................................................... 64
FOUR – YEAR INSTITUTIONS ................................................................................................... 65
TABLE 5.1A – ARKANSAS STATE UNIVERSITY – JONESBORO UNRESTRICTED EDUCATIONAL & GENERAL ........... 66 TABLE 5.1B – ARKANSAS TECH UNIVERSITY UNRESTRICTED EDUCATIONAL & GENERAL ........................................ 68 TABLE 5.1C – HENDERSON STATE UNIVERSITY UNRESTRICTED EDUCATIONAL & GENERAL ................................. 70 TABLE 5.1D – SOUTHERN ARKANSAS UNIVERSITY – MAGNOLIA UNRESTRICTED EDUCATIONAL & GENERAL ... 72 TABLE 5.1E – UNIVERSITY OF ARKANSAS – FAYETTEVILLE UNRESTRICTED EDUCATIONAL & GENERAL ........ 74 TABLE 5.1F – UNIVERSITY OF ARKANSAS – FORT SMITH UNRESTRICTED EDUCATIONAL & GENERAL .................. 76 TABLE 5.1G – UNIVERSITY OF ARKANSAS – LITTLE ROCK UNRESTRICTED EDUCATIONAL & GENERAL ................ 78 TABLE 5.1H – UNIVERSITY OF ARKANSAS – MONTICELLO UNRESTRICTED EDUCATIONAL & GENERAL................ 80 TABLE 5.1I – UNIVERSITY OF ARKANSAS – PINE BLUFF UNRESTRICTED EDUCATIONAL & GENERAL ..................... 82 TABLE 5.1J – UNIVERSITY OF CENTRAL ARKANSAS UNRESTRICTED EDUCATIONAL & GENERAL ........................... 84

v
TABLE 5.1K – FOUR-YEAR SUMMARY UNRESTRICTED EDUCATIONAL & GENERAL.................................................... 86 CHART 5. UNRESTRICTED E&G AND AUXILIARY REVENUES AND EXPENDITURES FOUR-YEAR INSTITUTIONS: 2010-11 THROUGH 2015-16 ........................................................................................................................................................ 88
TWO – YEAR INSTITUTIONS ..................................................................................................... 89
TABLE 5.2A – ARKANSAS NORTHEASTERN COLLEGE UNRESTRICTED EDUCATIONAL & GENERAL ........................ 90 TABLE 5.2B – ARKANSAS STATE UNIVERSITY – BEEBE UNRESTRICTED EDUCATIONAL & GENERAL ..................... 92 TABLE 5.2C – ARKANSAS STATE UNIVERSITY – MOUNTAIN HOME UNRESTRICTED EDUCATIONAL & GENERAL 94 TABLE 5.2D – ARKANSAS STATE UNIVERSITY – MID-SOUTH UNRESTRICTED EDUCATIONAL & GENERAL ............ 96 TABLE 5.2E – ARKANSAS STATE UNIVERSITY– NEWPORT UNRESTRICTED EDUCATIONAL & GENERAL ................ 98 TABLE 5.2F – BLACK RIVER TECHNICAL COLLEGE UNRESTRICTED EDUCATIONAL & GENERAL .......................... 100 TABLE 5.2G – COSSATOT COMMUNITY COLLEGE OF THE UNIVERSITY OF ARKANSAS UNRESTRICTED EDUCATIONAL & GENERAL .................................................................................................................................................... 102 TABLE 5.2H – COLLEGE OF THE OUACHITAS UNRESTRICTED EDUCATIONAL & GENERAL ..................................... 104 TABLE 5.2I – EAST ARKANSAS COMMUNITY COLLEGE UNRESTRICTED EDUCATIONAL & GENERAL .................... 106 TABLE 5.2J – NORTH ARKANSAS COLLEGE UNRESTRICTED EDUCATIONAL & GENERAL ......................................... 108 TABLE 5.2K – NATIONAL PARK COLLEGE UNRESTRICTED EDUCATIONAL & GENERAL .......................................... 110 TABLE 5.2L – NORTHWEST ARKANSAS COMMUNITY COLLEGE UNRESTRICTED EDUCATIONAL & GENERAL ..... 112 TABLE 5.2M – OZARKA COLLEGE UNRESTRICTED EDUCATIONAL & GENERAL......................................................... 114 TABLE 5.2N – PHILLIPS COMMUNITY COLLEGE OF THE UNIVERSITY OF ARKANSAS UNRESTRICTED EDUCATIONAL & GENERAL .................................................................................................................................................... 116 TABLE 5.2O – SOUTH ARKANSAS COMMUNITY COLLEGE UNRESTRICTED EDUCATIONAL & GENERAL ............... 118 TABLE 5.2P – SOUTHERN ARKANSAS UNIVERSITY – TECH UNRESTRICTED EDUCATIONAL & GENERAL ............. 120 TABLE 5.2Q – SOUTHEAST ARKANSAS COLLEGE ................................................................................................................ 122 TABLE 5.2R – UNIVERSITY OF ARKANSAS COMMUNITY COLLEGE – BATESVILLE UNRESTRICTED EDUCATIONAL & GENERAL ................................................................................................................................................................................ 124 TABLE 5.2S – UNIVERSITY OF ARKANSAS COMMUNITY COLLEGE – HOPE UNRESTRICTED EDUCATIONAL & GENERAL ..................................................................................................................................................................................... 126 TABLE 5.2T – UNIVERSITY OF ARKANSAS COMMUNITY COLLEGE – MORRILTON UNRESTRICTED EDUCATIONAL & GENERAL ................................................................................................................................................................................ 128 TABLE 5.2U – UNIVERSITY OF ARKANSAS COMMUNITY COLLEGE – RICH MOUNTAIN UNRESTRICTED EDUCATIONAL & GENERAL .................................................................................................................................................... 130 TABLE 5.2V – UNIVERSITY OF ARKANSAS – PULASKI TECHNICAL COLLEGE UNRESTRICTED EDUCATIONAL & GENERAL ..................................................................................................................................................................................... 132 TABLE 5.2W – TWO-YEAR SUMMARY UNRESTRICTED EDUCATIONAL & GENERAL ................................................... 134 CHART 6. UNRESTRICTED E&G AND AUXILIARY REVENUES AND EXPENDITURES TWO-YEAR INSTITUTIONS: 2010-11 THROUGH 2015-16 ...................................................................................................................................................... 136 TABLE 5.2X – FOUR-YEAR AND TWO-YEAR SUMMARY UNRESTRICTED EDUCATIONAL & GENERAL .................... 137 CHART 7. UNRESTRICTED E&G AND AUXILIARY REVENUES AND EXPENDITURES FOUR-YEAR AND TWO-YEAR INSTITUTIONS: 2010-11 THROUGH 2015-16 .......................................................................................................................... 139

vi
INTERCOLLEGIATE ATHLETIC REVENUES AND EXPENDITURES: 2006-07 THROUGH 2015-16 ............................................................................................... 140
TABLE 6.1A – SUMMARY OF INTERCOLLEGIATE ATHLETIC REVENUES AND EXPENDITURES FOR UNIVERSITIES: 2006-07 ......................................................................................................................................................................................... 141 TABLE 6.1B – SUMMARY OF INTERCOLLEGIATE ATHLETIC REVENUES AND EXPENDITURES FOR COLLEGES: 2006-07 ................................................................................................................................................................................................... 142 TABLE 6.2A – SUMMARY OF INTERCOLLEGIATE ATHLETIC REVENUES AND EXPENDITURES FOR UNIVERSITIES: 2007-08 ......................................................................................................................................................................................... 143 TABLE 6.2B – SUMMARY OF INTERCOLLEGIATE ATHLETIC REVENUES AND EXPENDITURES FOR COLLEGES: 2007-08 ................................................................................................................................................................................................... 144 TABLE 6.3A – SUMMARY OF INTERCOLLEGIATE ATHLETIC REVENUES AND EXPENDITURES FOR UNIVERSITIES: 2008-09 ......................................................................................................................................................................................... 145 TABLE 6.3B – SUMMARY OF INTERCOLLEGIATE ATHLETIC REVENUES AND EXPENDITURES FOR COLLEGES: 2008-09 ................................................................................................................................................................................................... 146 TABLE 6.4A – SUMMARY OF INTERCOLLEGIATE ATHLETIC REVENUES AND EXPENDITURES FOR UNIVERSITIES: 2009-10 ......................................................................................................................................................................................... 147 TABLE 6.4B – SUMMARY OF INTERCOLLEGIATE ATHLETIC REVENUES AND EXPENDITURES FOR COLLEGES: 2009-10 ................................................................................................................................................................................................... 148 TABLE 6.5A – SUMMARY OF INTERCOLLEGIATE ATHLETIC REVENUES AND EXPENDITURES FOR UNIVERSITIES: 2010-11 ......................................................................................................................................................................................... 149 TABLE 6.5B – SUMMARY OF INTERCOLLEGIATE ATHLETIC REVENUES AND EXPENDITURES FOR COLLEGES: 2010-11 ................................................................................................................................................................................................... 150 TABLE 6.6A – SUMMARY OF INTERCOLLEGIATE ATHLETIC REVENUES AND EXPENDITURES FOR UNIVERSITIES: 2011-2012 .................................................................................................................................................................................... 151 TABLE 6.6B – SUMMARY OF INTERCOLLEGIATE ATHLETIC REVENUES AND EXPENDITURES FOR COLLEGES: 2011-12 ................................................................................................................................................................................................... 152 TABLE 6.7A – SUMMARY OF INTERCOLLEGIATE ATHLETIC REVENUES AND EXPENDITURES FOR UNIVERSITIES: 2012-13 ......................................................................................................................................................................................... 153 TABLE 6.7B – SUMMARY OF INTERCOLLEGIATE ATHLETIC REVENUES AND EXPENDITURES FOR COLLEGES: 2012-13 ................................................................................................................................................................................................... 154 TABLE 6.8A – SUMMARY OF INTERCOLLEGIATE ATHLETIC REVENUES AND EXPENDITURES FOR UNIVERSITIES: 2013-14 ......................................................................................................................................................................................... 155 TABLE 6.8B – SUMMARY OF INTERCOLLEGIATE ATHLETIC REVENUES AND EXPENDITURES FOR COLLEGES: 2013-14 ................................................................................................................................................................................................... 156 TABLE 6.9A – SUMMARY OF INTERCOLLEGIATE ATHLETIC REVENUES AND EXPENDITURES FOR UNIVERSITIES: 2014-15 ......................................................................................................................................................................................... 157 TABLE 6.9B – SUMMARY OF INTERCOLLEGIATE ATHLETIC REVENUES AND EXPENDITURES FOR COLLEGES: 2014-15 ................................................................................................................................................................................................... 158 TABLE 6.10A – SUMMARY OF INTERCOLLEGIATE ATHLETIC REVENUES AND EXPENDITURES FOR UNIVERSITIES: 2015-16 ......................................................................................................................................................................................... 159 TABLE 6.10B – SUMMARY OF INTERCOLLEGIATE ATHLETIC REVENUES AND EXPENDITURES FOR COLLEGES: 2015-16 ......................................................................................................................................................................................... 160
SUPPLEMENTAL INFORMATION ......................................................................... 161

vii
TABLE 7.1 – FACILITIES AUDIT DATA 2016 .......................................................................................................................... 162 TABLE 7.2 – EQUIPMENT RECOMMENDATIONS: 2017-19 BIENNIUM .............................................................................. 163 TABLE 7.3 – ARKANSAS PUBLIC INSTITUTIONS’ AVERAGE FACULTY SALARIES IN COMPARISON TO SREB AVERAGE FACULTY SALARIES BY TYPE OF INSTITUTION AND RANK 2015-16 ............................................................. 164 TABLE 7.4A - TOTAL SSCH / FTE ENROLLMENTS AT PUBLIC FOUR-YEAR INSTITUTIONS, 2009-10 THROUGH 2015-16 ......................................................................................................................................................................................... 166 TABLE 7.4B - TOTAL SSCH / FTE ENROLLMENTS AT PUBLIC TWO-YEAR INSTITUTIONS, 2009-10 THROUGH 2015-16 ......................................................................................................................................................................................... 167 TABLE 7.5 – STUDENT HEADCOUNT BY INSTITUTION, 2011-2016 .................................................................................. 168 TABLE 7.6A – ANNUAL FULL-TIME UNDERGRADUATE TUITION AND MANDATORY FEES FOR FOUR-YEAR INSTITUTIONS: 2008-09 THROUGH 2017-18 .......................................................................................................................... 169 TABLE 7.6B – ANNUAL FULL-TIME UNDERGRADUATE TUITION AND MANDATORY FEES FOR TWO-YEAR INSTITUTIONS: 2008-09 THROUGH 2017-18 .......................................................................................................................... 170 TABLE 7.6C – 2017-18 FULL TIME ANNUALIZED FALL TUITION AND MANDATORY FEES COMPARED TO THE ESTIMATED SREB MEDIAN ..................................................................................................................................................... 171 TABLE 7.7 – UNRESTRICTED TUITION AND FEES AS A PERCENT OF TOTAL UNRESTRICTED EDUCATIONAL AND GENERAL EXPENDITURES: 2006-07 THROUGH 2015-16 .................................................................................................... 172
APPENDICES ....................................................................................................... 173
APPENDIX 1 – INSTITUTIONAL ABBREVIATIONS ................................................................................................................. 174 APPENDIX 2 – GLOSSARY OF COMMONLY USED TERMS AND ACRONYMS .................................................................... 176 APPENDIX 3 – ARKANSAS PUBLIC HIGHER EDUCATION INSTITUTIONS ........................................................................ 177 APPENDIX 4 – ARKANSAS HIGHER EDUCATION INSTITUTIONS BY COUNTY ................................................................ 178
CHARTS
CHART 1. ARKANSAS PUBLIC HIGHER EDUCATION INSTITUTIONS’ PERCENTAGE OF RSA GENERAL REVENUES .......................................................................................................................... 43
CHART 2. ARKANSAS TOTAL RSA GENERAL REVENUE ........................................................................................................ 43
CHART 3. COMPARISON OF FTE STUDENTS AND STATE FUNDING FOR GENERAL OPERATIONS ADJUSTED FOR HEPI ....................................................................................................................... 45
CHART 4. COMPARISON OF ARKANSAS PUBLIC HIGHER EDUCATION CURRENT AND REAL DOLLARS* .................... 46
CHART 5. UNRESTRICTED E&G AND AUXILIARY REVENUES AND EXPENDITURES | FOUR-YEAR INSTITUTIONS: 2007-08 THROUGH 2011-12 ...................................................................................................... 88
CHART 6. UNRESTRICTED E&G AND AUXILIARY REVENUES AND EXPENDITURES TWO-YEAR INSTITUTIONS: 2007-08 THROUGH 2011-12 ..................................................................................................... 136
CHART 7. UNRESTRICTED E&G AND AUXILIARY REVENUES AND EXPENDITURES FOUR-YEAR AND TWO-YEAR INSTITUTIONS: 2007-08 THROUGH 2011-12 ..................................................................... 139

1 Back to Table of Contents
Overview
This publication provides governmental and higher education decision-makers a statewide perspective of Arkansas public higher education finance for the 2017-19 biennium, as well as trends for the past several years. It also contains a detailed financial profile of each institution and presents a basis for comparative assessments of revenue sources and expenditure patterns.
The Fact Book contains seven sections: (1) the Arkansas Higher Education Coordinating Board recommendations for appropriations for the 2017-19 biennium; (2) 2017-19 legislative appropriations; (3) funding history of Arkansas higher education; (4) history of current fund revenues and expenditures; (5) history of unrestricted educational and general and auxiliary revenues and expenditures; (6) history of athletic revenues and expenditures; and (7) miscellaneous supplemental information.
The Financial Profiles section of the 2017 Fact Book relies on Series 17 information submitted by institutions of higher education for revenue and expenditure breakouts. Also, in an effort to assist the reader in analyzing specific trends, Section 5 focuses on individual institutions with profile sections that contain five years of data.

2 Back to Table of Contents
SECTION 1.
ARKANSAS HIGHER EDUCATION COORDINATING BOARD (AHECB) RECOMMENDATIONS FOR THE 2017-19 BIENNIUM

3 Back to Table of Contents
TABLE 1.1A. SUMMARY OF OPERATING NEEDS & RECOMMENDATIONS FOR THE 2017-19 BIENNIUM
Institution Type
90% Current
RSA Base
10% Performance
Funding
Total Current RSA Base
(5/4/2016)EETF
(5/11/2016) WF2000
(5/4/2016)Total Fiscal Year Base
Total Recommendation New Funds % Inc
Total Recommendation New Funds % Inc
Colleges 127,731,761 14,192,418 141,924,179 7,719,788 22,589,450 172,233,417 214,574,766 180,217,045 7,983,628 4.6% 184,001,603 3,784,558 2.1%Universities 363,000,266 40,333,363 403,333,629 39,300,206 0 442,633,835 748,841,595 568,917,891 126,284,056 28.5% 580,865,167 11,947,276 2.1%
Subtotal 490,732,027 54,525,781 545,257,808 47,019,994 22,589,450 614,867,252 963,416,361 749,134,937 134,267,685 21.8% 764,866,770 15,731,834 2.1%Technical Centers 5,272,810 0 2,157,610 7,430,420 12,006,056 10,064,877 2,634,457 35.5% 10,276,239 211,362 2.1% Grand Total 550,530,618 47,019,994 24,747,060 622,297,672 975,422,417 759,199,813 136,902,141 22.0% 775,143,009 15,943,196 2.1%
.
Non-Formula Entity Type
Total Current
RSA Base (5/4/2016)
EETF (5/11/16)
Total Fiscal Year Base
Total Recommendation New Funds % Inc
Total Recommendation New Funds % Inc
Non-Formula Entities 87,827,357 14,302,917 102,130,274 119,335,524 17,205,249 16.8% $122,233,783 $2,898,260 16.8%Health Care-Related UAMS 95,204,430 10,147,619 105,352,049 120,214,064 14,862,015 14.1% $123,918,186 $3,704,122 24.9% Grand Total 183,031,787 24,450,536 207,482,323 239,549,587 32,067,264 15.5% $246,151,969 $6,602,382 20.6%
All Institution Types
90% Current
RSA Base
10% Performance
Funding
Total Current RSA Base
(5/4/2016)EETF
(5/11/2016) WF2000
(5/4/2016)Total Fiscal Year Base
Total Recommendation New Funds % Inc
Total Recommendation New Funds % Inc
Total 490,732,027 54,525,781 733,562,405 71,470,530 24,747,060 829,779,995 998,749,400 168,969,406 20.4% 1,021,294,979 22,545,578 2.3%
NOTE: FY2016-17 Base - DFA Forecast as of 5/4/2016
Fiscal Year 2016-17 Base FY2017-18 AHECB Recommendation FY2018-19 AHECB Recommendation
FY2018-19
Fiscal Year 2016-17 Base
AHECB RecommendationsFY2017-18
AHECB Recommendations
Fiscal Year 2016-17 Base100% Model
Calculated Need
FY2017-18 FY2018-19AHECB Recommendations AHECB Recommendations

4 Back to Table of Contents
TABLE 1.1B. TWO-YEAR COLLEGES: OPERATING NEEDS & RECOMMENDATIONS FOR 2017-19 BIENNIUM
Inst90% Needs-
based RSA Base
10% Outcomes-based RSA
BaseTotal RSA
Base EETF WF2000
Total Base (RSA, EETF & WF2000) Total Need
% of Need Met
Adjustment to Reach 75% of
NeedTotal
Recommendation
% of Need Met
2.1% Continuing
Level Total
RecommendationANC 7,719,347 857,705 8,577,052 781,029 730,954 10,089,035 10,089,035 100.0% 0 10,089,035 100.0% 211,870 10,300,904ASUB 10,652,154 1,183,573 11,835,727 1,558,008 801,945 14,195,680 17,291,657 82.1% 0 14,195,680 82.1% 298,109 14,493,789ASUMH 3,283,299 364,811 3,648,110 0 823,929 4,472,039 6,897,913 64.8% 701,396 5,173,435 75.0% 108,642 5,282,077ASUMS 3,472,206 385,801 3,858,007 0 2,190,914 6,048,921 7,687,536 78.7% 0 6,048,921 78.7% 127,027 6,175,948ASUN 5,393,064 599,229 5,992,293 0 1,417,628 7,409,921 11,857,653 62.5% 1,483,319 8,893,240 75.0% 186,758 9,079,998BRTC 5,502,164 611,352 6,113,516 0 2,245,209 8,358,725 9,340,575 89.5% 0 8,358,725 89.5% 175,533 8,534,258CCCUA 3,056,222 339,580 3,395,802 0 1,350,337 4,746,139 7,193,341 66.0% 648,867 5,395,006 75.0% 113,295 5,508,301CotO 3,174,535 352,726 3,527,261 0 1,156,386 4,683,647 6,021,115 77.8% 0 4,683,647 77.8% 98,357 4,782,004EACC 5,209,252 578,806 5,788,058 815,344 0 6,603,402 6,603,402 100.0% 0 6,603,402 100.0% 138,671 6,742,074NAC 7,170,268 796,696 7,966,964 481,533 575,177 9,023,674 9,101,850 99.1% 0 9,023,674 99.1% 189,497 9,213,171NPC 8,141,840 904,649 9,046,489 1,219,462 668,021 10,933,972 11,656,798 93.8% 0 10,933,972 93.8% 229,613 11,163,586NWACC 9,557,282 1,061,920 10,619,202 1,077,690 0 11,696,892 20,455,496 57.2% 3,644,730 15,341,622 75.0% 322,174 15,663,796OZC 2,813,828 312,648 3,126,475 0 1,271,841 4,398,316 6,339,756 69.4% 356,501 4,754,817 75.0% 99,851 4,854,668PCCUA 8,156,779 906,309 9,063,088 794,035 529,856 10,386,979 10,386,979 100.0% 0 10,386,979 100.0% 218,127 10,605,105SACC 5,430,876 603,431 6,034,307 557,637 461,389 7,053,333 8,383,651 84.1% 0 7,053,333 84.1% 148,120 7,201,453SAUT 5,134,960 570,551 5,705,511 219,829 0 5,925,340 8,661,876 68.4% 571,067 6,496,407 75.0% 136,425 6,632,832SEAC 5,073,118 563,680 5,636,798 0 1,975,199 7,611,997 7,611,997 100.0% 0 7,611,997 100.0% 159,852 7,771,849UACCB 3,717,955 413,106 4,131,061 0 866,760 4,997,821 6,388,006 78.2% 0 4,997,821 78.2% 104,954 5,102,775UACCM 4,519,940 502,216 5,022,155 0 1,291,186 6,313,341 9,188,120 68.7% 577,749 6,891,090 75.0% 144,713 7,035,803UACCH 4,042,797 449,200 4,491,997 0 1,958,947 6,450,944 6,743,317 95.7% 0 6,450,944 95.7% 135,470 6,586,414UACCRM 2,886,182 320,687 3,206,869 215,221 0 3,422,090 4,202,784 81.4% 0 3,422,090 81.4% 71,864 3,493,954UAPTC 13,623,693 1,513,744 15,137,437 0 2,273,772 17,411,209 22,471,909 77.5% 0 17,411,209 77.5% 365,635 17,776,844Total 127,731,761 14,192,418 141,924,179 7,719,788 22,589,450 172,233,417 214,574,766 80.3% 7,983,628 180,217,045 84.0% 3,784,558 184,001,603
FY2016-17 FY2017-18 FY2018-19

5 Back to Table of Contents
TABLE 1.1C. FOUR-YEAR UNIVERSITIES: OPERATING NEEDS & RECOMMENDATIONS FOR THE 2017-19 BIENNIUM
Inst90% Needs-based
RSA Base10% Outcomes-based RSA Base Total RSA EETF
Total Base (RSA & EETF) Total Need
% of Need
Adjustment to Reach 75% of
NeedTotal
Recommendation % of Need2.1% Continuing
Level Total
RecommendationASUJ 50,740,480 5,637,831 56,378,311 6,377,540 62,755,851 114,678,309 54.7% 23,252,881 86,008,732 75.0% 1,806,183 87,814,915ATU 26,839,746 2,982,194 29,821,940 2,189,000 32,010,940 58,456,725 54.8% 11,831,604 43,842,544 75.0% 920,693 44,763,238HSU 16,916,592 1,879,621 18,796,213 2,264,417 21,060,630 23,300,799 90.4% 0 21,060,630 90.4% 442,273 21,502,903SAUM 14,026,479 1,558,498 15,584,976 1,338,773 16,923,749 31,627,908 53.5% 6,797,182 23,720,931 75.0% 498,140 24,219,071UAF 105,782,841 11,753,649 117,536,490 9,917,233 127,453,723 253,357,244 50.3% 62,564,210 190,017,933 75.0% 3,990,377 194,008,309UAFS 18,535,154 2,059,462 20,594,615 3,318,007 23,912,623 34,961,233 68.4% 2,308,302 26,220,925 75.0% 550,639 26,771,564UALR 51,000,535 5,666,726 56,667,261 5,750,502 62,417,763 90,231,974 69.2% 5,256,218 67,673,981 75.0% 1,421,154 69,095,134UAM 11,761,041 1,306,782 13,067,823 1,155,403 14,223,227 18,672,216 76.2% 0 14,223,227 76.2% 298,688 14,521,915UAPB 19,594,164 2,177,129 21,771,294 2,005,756 23,777,049 27,059,267 87.9% 0 23,777,049 87.9% 499,318 24,276,367UCA 47,803,235 5,311,471 53,114,705 4,983,575 58,098,280 96,495,920 60.2% 14,273,660 72,371,940 75.0% 1,519,811 73,891,751Total 363,000,266 40,333,363 403,333,629 39,300,206 442,633,835 748,841,595 59.1% 126,284,056 568,917,891 76.0% 11,947,276 580,865,167
2016-17 FY2017-18 FY2018-19

6 Back to Table of Contents
TABLE 1.1D. NON-FORMULA ENTITIES: OPERATING NEEDS & RECOMMENDATIONS FOR 2017-19 BIENNIUM
Base
RSA EETF Total Base
2.1% Continuing
Level
Base Operations & Program
EnhancementsTotal New
FundsTotal
Recommendation
2.1% Continuing
Level
Base Operations & Program
EnhancementsTotal New
FundsTotal
RecommendationADTEC 1,500,000 0 1,500,000 31,500 0 31,500 1,531,500 32,162 0 32,162 1,563,662AREON 0 0 0 0 1,200,000 1,200,000 1,200,000 0 0 0 1,200,000ASU-System Office 2,362,680 152,757 2,515,437 49,616 0 49,616 2,565,053 50,658 0 50,658 2,615,712ASU-Heritage 350,000 0 350,000 7,350 2,079,580 2,086,930 2,436,930 7,504 43,671 51,175 2,488,105HSU-CEC 79,798 0 79,798 1,676 0 1,676 81,474 1,711 0 1,711 83,185NWACC-CPTC 0 0 0 0 120,800 120,800 120,800 0 2,537 2,537 123,337SACC-Arboretum 0 0 0 0 75,000 75,000 75,000 0 0 0 75,000SAUT-ETA 368,404 36,735 405,139 7,736 100,000 107,736 512,876 7,899 0 7,899 520,775SAUT-FTA 1,651,221 92,976 1,744,197 34,676 685,156 719,832 2,464,029 35,404 374,351 409,754 2,873,783UA-SYS 3,417,950 285,199 3,703,149 71,777 260,647 332,424 4,035,573 73,284 5,473 78,757 4,114,330UA-AS 2,327,380 140,980 2,468,360 48,875 82,706 131,581 2,599,941 49,901 1,654 51,556 2,651,496UA-DivAgri 62,800,138 5,861,216 68,661,354 1,318,803 2,500,000 3,818,803 72,480,157 1,346,498 500,000 1,846,498 74,326,655UA-ASMSA 1,113,015 7,733,055 8,846,070 23,373 565,840 589,213 9,435,283 23,864 0 23,864 9,459,147UA-CS 2,295,575 0 2,295,575 48,207 105,000 153,207 2,448,782 49,219 2,205 51,424 2,500,206UA-CJI 1,825,769 0 1,825,769 38,341 988,380 1,026,721 2,852,490 39,146 20,755 59,901 2,912,391UAF-ARTP 0 0 0 0 250,000 250,000 250,000 0 0 0 250,000UAF-Autism 0 0 0 0 2,500,000 2,500,000 2,500,000 0 0 0 2,500,000UAF-GWG 0 0 0 0 1,200,000 1,200,000 1,200,000 0 0 0 1,200,000UAF-Pryor Center 0 0 0 0 173,087 173,087 173,087 0 0 0 173,087UAF-WTC AR 0 0 0 0 250,000 250,000 250,000 0 2,588 2,588 252,588UALR-RAPS 4,087,836 0 4,087,836 85,845 1,689,000 1,774,845 5,862,681 87,647 50,670 138,317 6,000,998UAPB-Nonformula* 3,647,591 0 3,647,591 612,278 0 612,278 4,259,869 89,457 0 89,457 4,349,326Total 87,827,357 14,302,917 102,130,274 2,380,053 14,825,196 17,205,249 119,335,524 1,894,356 1,003,904 2,898,260 122,233,783*Increase for RSA is greater than 2.1% for federal matching purposes.
Health-Related Non-Formula Entity - UAMS
RSA EETF Total Base
2.1% Continuing
Level
Base Operations & Program
EnhancementsTotal New
FundsTotal
Recommendation
2.1% Continuing
Level
Base Operations & Program
EnhancementsTotal New
FundsTotal
RecommendationUAMS 86,456,661 9,901,237 96,357,898 1,815,590 12,862,722 14,678,312 111,036,210 1,853,717 1,662,844 3,516,561 114,552,772UAMS-ABUSE/RAPE/DV 735,000 735,000 15,435 0 15,435 750,435 15,759 0 15,759 766,194UAMS-Child Safety 720,588 720,588 15,132 0 15,132 735,720 15,450 0 15,450 751,170UAMS-Ped/Pysch/Res. 1,950,000 1,950,000 40,950 0 40,950 1,990,950 41,810 0 41,810 2,032,760UAMS-IC 5,342,181 246,381 5,588,562 112,186 0 112,186 5,700,748 114,542 0 114,542 5,815,290Total 95,204,430 10,147,619 105,352,049 1,999,293 12,862,722 14,862,015 120,214,064 2,041,278 1,662,844 3,704,122 123,918,186
Institution/Entity
FY2016-17 FY2017-18AHECB Recommendations AHECB Recommendations
FY2018-19
FY2018-19AHECB RecommendationsBase
FY2017-18AHECB Recommendations
FY2016-17

7 Back to Table of Contents
TABLE 1.1E. TECHNICAL CENTERS: OPERATING NEEDS & RECOMMENDATIONS FOR 2017-19 BIENNIUM
RSA Workforce
2000 Total Base Total Need
% of Need Met
Adjustment to 75% of
NeedTotal
Recommendation% of Need
2.1% Continuing Level
Total Recommendation
ATU-Ozark 2,394,591 794,490 3,189,081 7,764,717 41.1% 2,634,457 5,823,538 75.0% 122,294 5,945,832UAM-Crossett 1,154,300 657,024 1,811,324 1,811,324 100.0% 0 1,811,324 100.0% 38,038 1,849,362UAM-McGehee 1,723,919 706,096 2,430,015 2,430,015 100.0% 0 2,430,015 100.0% 51,030 2,481,045Total 5,272,810 2,157,610 7,430,420 12,006,056 61.9% 2,634,457 10,064,877 83.8% 211,362 10,276,239
Institution
FY2016-17 FY2017-18 FY2018-19

8 Back to Table of Contents
TABLE 1.2: CAPITAL REQUESTS/RECOMMENDATIONS FOR THE 2017-19 BIENNIUM
INSTITUTION/ PROJECT REQUESTED ADHE Priority PROJECT NAME TYPE AMOUNT RECOMM. A ASUJ Projects:
New College of Engineering Building New Construction $15,161,925 4,000,000 4,000,000 College of Ed/Com Restrooms Renovation Renovation/ADA $908,500 908,500 908,500 Library HVAC System Modernization Renovation $2,351,090 2,000,000 2,000,000 Lab Sciences Lab & HVAC System Modernization Renovation $5,485,133 1,291,500 1,291,500 College of Math HVAC Modernization Renovation $747,263 College of Fine Arts Studio Addition / Annex
Removal New Construction / ADA $6,654,963
Project Total 31,308,873 8,200,000 8,200,000 Critical Maintenance 18,353,149 1,840,000 1,840,000 Deferred Maintenance 246,840,637 4,940,000 4,940,000 Replacement Equipment & Library 2,342,774 2,342,774 Total 296,502,658 17,322,774 17,322,774 ATU Projects:
Technology Infrastructure Improvements 5,832,533 5,832,533 5,832,533 Academic Classroom Building New Construction 29,057,675 2,367,467 2,367,467 Hull Building Renovation 5,281,787
Project Total 40,171,995 8,200,000 8,200,000 Critical Maintenance 2,984,742 300,000 300,000 Deferred Maintenance 122,897,259 2,460,000 2,460,000 Replacement Equipment & Library 1,361,321 1,361,321 Total 166,053,995 12,321,321 12,321,321 HSU Projects:
HPER Building New Construction 18,000,000 3,000,000 3,000,000 Russell Fine Arts Building Renovation/Remodeling 6,000,000 3,000,000 3,000,000 School of Business Building Renovation/Remodeling 14,139,400 1,200,000 1,200,000 Land Acquisition Construction: Other 600,000
Project Total 38,739,400 7,200,000 7,200,000 Critical Maintenance 8,027,364 800,000 800,000 Deferred Maintenance 91,198,570 1,820,000 1,820,000 Replacement Equipment & Library 541,895 541,895 Total 137,965,334 10,361,895 10,361,895

9 Back to Table of Contents
INSTITUTION/ PROJECT REQUESTED ADHE Priority PROJECT NAME TYPE AMOUNT RECOMM. A SAUM Projects:
Educational Building New Construction 1,350,000 1,350,000 1,350,000 Technology Upgrades Technology Infrastructure 3,465,750 3,465,750 3,465,750 STEM Training Center Renovation 3,889,902 2,384,250 2,384,250 Livestock Feed Barn New Construction 80,000 Bridge to Pump Station New Construction 75,000
Project Total 8,860,652 7,200,000 7,200,000 Critical Maintenance 4,219,081 420,000 420,000 Deferred Maintenance 88,897,799 1,780,000 1,780,000 Replacement Equipment & Library 618,586 618,586 Total 101,977,532 10,018,586 10,018,586 UAF Projects:
Center for Learning and Student Support New Construction 11,536,746 5,000,000 5,000,000 Research Laboratory and Office Building New Construction 45,433,550 3,000,000 3,000,000 Fine Arts Center Restoration / Renovation 32,415,426 1,200,000 1,200,000 Business Building Renovation 21,501,000 Human Environmental Sciences Building Restoration / Renovation 10,577,800 John A. White Jr. Engineering Hall Restoration / Addition 20,980,300 Memorial Hall Restoration / Renovation 19,030,935 Mullins Library / Stacks Restoration / Renovation 16,475,500 Agriculture Building Restoration / Renovation 20,000,400 General Access Classroom and Office Building New Construction 37,000,000 Research Center at ARTP New Construction 30,334,000 Nanoscale Mat, Sci and Eng - North and South Wings New Construction 57,785,000 West Avenue Annex Restoration / Renovation 6,288,229 Kimple Hall / Office Tower Renovation 9,393,000
Project Total 338,751,886 9,200,000 9,200,000 Critical Maintenance 33,940,925 3,390,000 3,390,000 Deferred Maintenance 454,268,430 9,090,000 9,090,000 Replacement Equipment & Library 4,555,200 4,555,200 Total 826,961,241 26,235,200 26,235,200 UAFS Projects:
Math-Science Building Upgrade and Lab Modernization Renovation 14,500,000 3,000,000 3,000,000 Math-Science Building Expansion New Construction 18,000,000 2,000,000 2,000,000 College of Business Building New Construction 15,000,000 1,700,000 1,700,000
Project Total 47,500,000 6,700,000 6,700,000 Critical Maintenance 2,916,322 290,000 290,000 Deferred Maintenance 73,041,151 1,460,000 1,460,000 Replacement Equipment & Library 829,488 829,488 Total 123,457,472 9,279,488 9,279,488

10 Back to Table of Contents
INSTITUTION/ PROJECT REQUESTED ADHE Priority PROJECT NAME TYPE AMOUNT RECOMM. A UALR Projects:
Technology Infrastructure Improvements Technology Infrastructure 9,802,121 4,000,000 4,000,000 Nanotechnology Center (CINS) New Construction 4,118,514 3,000,000 3,000,000 Bldg. Infrastructure / Critical Maint. Critical Maintenance 26,417,723 1,700,000 1,700,000 Ross Hall Renovations Renovation 11,776,591 Innovation Center New Construction 9,891,889 Science Classroom / Laboratory New Construction 23,931,101 Classroom Technology Improvements Tech. Infrastructure 2,337,446 Communication Classroom / Lab New Construction 21,111,504 Library Learning Commons Renovation 5,596,881 IT Services Renovation 2,882,453
Project Total 117,866,222 8,700,000 8,700,000 Critical Maintenance 66,237,148 6,620,000 6,620,000 Deferred Maintenance 264,884,133 5,300,000 5,300,000 Replacement Equipment & Library 1,802,560 1,802,560 Total 448,987,503 22,422,560 22,422,560 UAM Projects:
Construction of New Math and Science Center New Construction 20,000,000 3,500,000 3,500,000 Renovation of Old Student Union Renovation 2,000,000 2,000,000 2,000,000 Renovation of Library and Technology Center Renovation 325,000 325,000 325,000 Renovation of Fine Arts Center Renovation 500,000 375,000 375,000 Renovation of Music Building Renovation 750,000
Project Total 23,575,000 6,200,000 6,200,000 Critical Maintenance 13,425,605 1,340,000 1,340,000 Deferred Maintenance 85,619,525 1,710,000 1,710,000 Replacement Equipment & Library 387,969 387,969 Total 122,620,129 9,637,969 9,637,969 UAPB Projects:
Campus Renovations & Repair Renovation 12,359,000 3,000,000 3,000,000 Nanotechnology/Biotechnology Center New Construction 15,576,800 2,000,000 2,000,000 Life Sciences New Construction 10,940,900 1,200,000 1,200,000 Biomedical/Health Science Facility New Construction 17,403,000 Technology Infrastructure Upgrades Technology 550,000 Library Expansion New Construction/Renovation 14,500,000 Campus Safety and Security New Construction 3,527,000
Project Total 74,856,700 6,200,000 6,200,000 Critical Maintenance 1,510,729 150,000 150,000 Deferred Maintenance 75,181,873 1,500,000 1,500,000 Replacement Equipment & Library 387,294 387,294 Total 151,549,302 8,237,294 8,237,294

11 Back to Table of Contents
INSTITUTION/ PROJECT REQUESTED ADHE Priority PROJECT NAME TYPE AMOUNT RECOMM. A UCA Projects:
Lewis Science Center Replacement Renovation 14,000,000 4,000,000 4,000,000
Institute for Wellness & Restorative Health New Construction 43,000,000 2,100,000 2,100,000
Fine Arts Building New Construction 38,450,000 2,100,000 2,100,000
Fiber Replacement & Internet Backbone Augmentation Technology 2,500,000
Old Main Renovation 18,635,000 Project Total 116,585,000 8,200,000 8,200,000 Critical Maintenance 13,365,000 1,340,000 1,340,000 Deferred Maintenance 182,678,520 3,650,000 3,650,000 Replacement Equipment & Library 2,041,509 2,041,509 Total 312,628,520 15,231,509 15,231,509 Subtotal Four Year
Projects $ 838,215,728 $
76,000,000 $ 76,000,000
Critical Maintenance $ 164,980,063 $
16,490,000 $ 16,490,000
Deferred Maintenance $ 1,685,507,896 $
33,710,000 $ 33,710,000
Equipment & Library $ - $ 14,868,595
$ 14,868,595
Total $ 2,688,703,687 $
141,068,595 $ 141,068,595
ATU - Ozark Projects:
Allied Health Building Re-Roof Renovation 107,731 107,731 107,731 Instructional Technology Other 244,213 244,213 244,213 Technology Building Restroom Renovation Renovation 120,589 120,589 120,589
Project Total 472,533 472,533 472,533 Critical Maintenance 251,000 30,000 30,000 Deferred Maintenance 9,663,496 190,000 190,000 Replacement Equipment & Library 149,510 149,510 Total 10,387,029 842,043 842,043 UAM-Crossett Projects:
Workforce/Collegiate Center UAM CTC New Construction 2,150,000 1,050,000 1,050,000
Project Total 2,150,000 1,050,000 1,050,000 Critical Maintenance 426,403 40,000 40,000 Deferred Maintenance 5,340,843 110,000 110,000 Replacement Equipment & Library 27,895 27,895 Total 7,917,246 1,227,895 1,227,895

12 Back to Table of Contents
INSTITUTION/ PROJECT REQUESTED ADHE Priority PROJECT NAME TYPE AMOUNT RECOMM. A UAM-McGehee Projects:
General Education Building UAM CTM New Construction 4,250,000 1,050,000 1,050,000 Project Total 4,250,000 1,050,000 1,050,000 Critical Maintenance 738,484 70,000 70,000 Deferred Maintenance 6,833,905 140,000 140,000 Replacement Equipment & Library 28,830 28,830 Total 11,822,389 1,288,830 1,288,830 Subtotal Technical Institutes Projects $ 6,872,533 $ 2,572,533 $ 2,572,533 Critical Maintenance $ 1,415,887 $ 140,000 $ 140,000 Deferred Maintenance $ 21,838,245 $ 440,000 $ 440,000 Replacement Equipment & Library $ - $ 206,235 $ 206,235 Total $ 30,126,665 $ 3,358,768 $ 3,358,768 ASU-SYS Projects:
NO REQUESTS 0 0 0 Project Total 0 0 0 Critical Maintenance 0 0 0 Deferred Maintenance 0 0 0 Replacement Equipment & Library 0 0 Total 0 0 0 SAUT - Environmental Training Academy Projects:
NO REQUESTS 0 0 0 Project Total 0 0 0 Critical Maintenance 6,902 0 0 Deferred Maintenance 750,359 20,000 20,000 Replacement Equipment & Library 0 0 Total 757,262 20,000 20,000 SAUT - Fire Training Academy Projects:
Dormitory New Construction 4,335,708 1,050,000 1,050,000 Confined Space/Rescue Tech New Construction 500,000 500,000 500,000 Driving Course New Construction 3,000,000 0
Project Total 7,835,708 1,550,000 1,550,000 Critical Maintenance 34,512 0 0 Deferred Maintenance 2,726,340 50,000 50,000 Replacement Equipment & Library 0 0 Total 10,596,561 1,600,000 1,600,000

13 Back to Table of Contents
INSTITUTION/ PROJECT REQUESTED ADHE Priority PROJECT NAME TYPE AMOUNT RECOMM. A UA - Div. Of Agriculture Projects:
Arkansas Agricultural Research & Extension Centers and Stations
Renovation, Restoration, Remodel and New Construction 13,454,000 2,900,000 2,900,000
Coleman Creek Bank Stabilization Other 200,000 200,000 200,000 Rice Innovation Center New Construction 1,000,000 1,000,000 1,000,000
Project Total 14,654,000 4,100,000 4,100,000 Critical Maintenance 713,864 70,000 70,000 Deferred Maintenance 79,875,564 1,600,000 1,600,000 Replacement Equipment & Library 0 0 Total 95,243,427 5,770,000 5,770,000 UA - Clinton School Projects:
Servers/Technology Upgrades Technology 75,000 75,000 75,000 Project Total 75,000 75,000 75,000 Critical Maintenance 0 0 0 Deferred Maintenance 0 0 0 Replacement Equipment & Library 0 0 Total 75,000 75,000 75,000 UA - Criminal Justice Institute Projects:
CJI Forensic Lab and Classroom Equipment Equipment 103,700 103,700 103,700 CJI Equipment Upgrades Equipment 240,000 240,000 240,000
Project Total 343,700 343,700 343,700 Critical Maintenance 0 0 0 Deferred Maintenance 0 0 0 Replacement Equipment & Library 0 0 Total 343,700 343,700 343,700 UA-AAS Projects:
ADA Accessible Doors Other 43,500 43,500 43,500 Project Total 43,500 43,500 43,500 Critical Maintenance 43,500 0 0 Deferred Maintenance 3,802,627 80,000 80,000 Replacement Equipment & Library 0 0 Total 3,889,627 123,500 123,500

14 Back to Table of Contents
INSTITUTION/ PROJECT REQUESTED ADHE Priority PROJECT NAME TYPE AMOUNT RECOMM. A UA-AREON Projects:
Technology Infrastructure Improvements - Arkansas Cloud Equipment Upgrades
Technology Infrastructure Improvements 3,000,000 525,000 525,000
Technology Infrastructure Improvements Fiber Renewal/Acquisition - Mena, De Queen, West Helena Technology Infrastructure 2,375,000 500,000 500,000
Technology Infrastructure Improvements Fiber Renewal/Acquisition - Research Stations, NCTR, Branch Campuses Locations, ACH Technology Infrastructure 4,000,000 Project Total 9,375,000 1,025,000 1,025,000 Critical Maintenance 0 0 0 Deferred Maintenance 0 0 0 Replacement Equipment & Library 0 0 Total 9,375,000 1,025,000 1,025,000 UA-ASMSA Projects:
Multi-purpose Building (Community Hall) New Construction 5,250,000 525,000 525,000 Learning Courtyard New Construction 1,500,000 500,000 500,000 STEM Center New Construction 8,500,000
Project Total 15,250,000 1,025,000 1,025,000 Critical Maintenance 0 0 0 Deferred Maintenance 0 0 0 Replacement Equipment & Library 0 0 Total 15,250,000 1,025,000 1,025,000 UA-SYS Projects:
Technology Upgrades Technology 250,000 250,000 250,000 System Office Expansion New Construction 1,726,500 775,000 775,000
Project Total 1,976,500 1,025,000 1,025,000 Critical Maintenance 114,500 10,000 10,000 Deferred Maintenance 2,060,156 40,000 40,000 Replacement Equipment & Library 0 0 Total 4,151,156 1,075,000 1,075,000 UAMS Projects:
Central Building Code Upgrade Renovation 20,000,000 4,200,000 4,200,000 EPIC Expansion/Implementation to UAMS Regional
Programs Primary Care & Northwest Clinics Infrastructure/Information System 16,555,000 2,000,000 2,000,000
Hospital Clinical Equipment Capital Equipment 16,020,034 1,000,000 1,000,000 North East Central Energy Station New Construction 30,000,000 1,000,000 1,000,000
Project Total 82,575,034 8,200,000 8,200,000 Critical Maintenance 20,295,000 2,030,000 2,030,000 Deferred Maintenance 536,287,804 10,730,000 10,730,000 Replacement Equipment & Library 1,927,257 1,927,257 Total 639,157,838 22,887,257 22,887,257

15 Back to Table of Contents
INSTITUTION/ PROJECT REQUESTED ADHE Priority PROJECT NAME TYPE AMOUNT RECOMM. A Subtotal Non-Formula Projects $ 132,128,442 $ 17,387,200 $ 17,387,200 Critical Maintenance $ 21,208,278 $ 2,110,000 $ 2,110,000 Deferred Maintenance $ 625,502,850 $ 12,520,000 $ 12,520,000 Equipment & Library $ - $ 1,927,257 $ 1,927,257 Total $ 778,839,570 $ 33,944,457 $ 33,944,457 ANC Projects:
Workforce Training Building New Construction 3,991,000 1,850,000 1,850,000 Nursing & Allied Health Building
(Paragould) New Construction 3,415,000
1,000,000 1,000,000 Center for Science and Technology New Construction 11,000,000
Project Total 18,406,000 2,850,000 2,850,000 Critical Maintenance 3,469,198 350,000 350,000 Deferred Maintenance 17,783,280 360,000 360,000 Replacement Equipment & Library 138,225 138,225 Total 39,658,478 3,698,225 3,698,225 ASUB Projects:
IT Services Data Center New Construction 2,508,500 2,000,000 2,000,000 State Hall Renovation 2,865,000 1,375,000 1,375,000
Project Total 5,373,500 3,375,000 3,375,000 Critical Maintenance 1,067,000 110,000 110,000 Deferred Maintenance 53,665,711 1,070,000 1,070,000 Replacement Equipment & Library 445,250 445,250 Total 60,106,211 5,000,250 5,000,250 ASUMH Projects:
Occupational Technical Center Renovation 2,000,000 1,850,000 1,850,000 Health and Wellness Center New Construction 4,500,000 1,000,000 1,000,000
Security System Upgrades Technology Infrastructure 200,000
Vada Shield Community Center Renovation 1,000,000 Project Total 7,700,000 2,850,000 2,850,000 Critical Maintenance 915,834 90,000 90,000 Deferred Maintenance 11,042,520 220,000 220,000 Replacement Equipment & Library 162,705 162,705 Total 19,658,355 3,322,705 3,322,705

16 Back to Table of Contents
INSTITUTION/ PROJECT REQUESTED ADHE Priority PROJECT NAME TYPE AMOUNT RECOMM. A ASUMS Projects:
Classroom Instructional Technology Equipment Replacement New Construction 102,000 102,000 102,000 Project Total 102,000 102,000 102,000 Critical Maintenance 200,000 20,000 20,000 Deferred Maintenance 22,901,060 460,000 460,000 Replacement Equipment & Library 159,060 159,060 Total 23,203,060 741,060 741,060 ASUN Projects:
STEM Classroom/Lab Building ASUN Jonesboro Campus New Construction 3,000,000 1,000,000 1,000,000 Administration Building ASUN Newport Campus New Construction 750,000 750,000 750,000 Building and Transportation Tech Building ASUN Newport Renovation 547,500 547,500 547,500 Main Building Remodel ASUN Jonesboro Campus Renovation 1,950,000 552,500 552,500 Nursing and Allied Health Building ASUN Newport Campus New Construction 5,500,000 Main Building Addition/Remodeling ASUN Marked Tree
Campus Renovation 900,000 Project Total 12,647,500 2,850,000 2,850,000 Critical Maintenance 225,000 20,000 20,000 Deferred Maintenance 16,960,060 340,000 340,000 Replacement Equipment & Library 264,730 264,730 Total 29,832,560 3,474,730 3,474,730
BRTC Projects:
Student Information System Upgrade Technology Infrastructure Improvements 1,062,000 1,062,000 1,062,000
"A" & "B" Bldg. Renovation Renovation 157,500 157,500 157,500
Fire Science Equipment Storage New Construction of Facilities 157,500 157,500 157,500
AC/Library Equipment Replacement Equipment Replacement 54,000 54,000 54,000
Grounds Maintenance Equipment Storage New Construction of Facilities 90,000 90,000 90,000
Technical Education Building New Construction of Facilities 2,700,000 1,167,000 1,167,000
RCDC Renovation Renovation 162,000 162,000 162,000
Law Enforcement Training Academy Barracks New Construction of Facilities 4,500,000
Project Total 8,883,000 2,850,000 2,850,000 Critical Maintenance 145,000 10,000 10,000 Deferred Maintenance 19,254,235 390,000 390,000 Replacement Equipment & Library 201,595 201,595 Total 28,282,235 3,451,595 3,451,595

17 Back to Table of Contents
INSTITUTION/ PROJECT REQUESTED ADHE Priority PROJECT NAME TYPE AMOUNT RECOMM. A CCCUA Projects:
Technology Upgrades Technology Upgrades 600,000 600,000 600,000 HVAC Replacement Critical Maintenance 58,000 58,000 58,000 Student Commons New Construction 1,000,000 1,000,000 1,000,000 Convocation/Education Center New Construction 3,000,000 1,192,000 1,192,000
Project Total 4,658,000 2,850,000 2,850,000 Critical Maintenance 516,119 50,000 50,000 Deferred Maintenance 14,809,423 300,000 300,000 Replacement Equipment & Library 144,070 144,070 Total 19,983,542 3,344,070 3,344,070 COTO ` Projects:
Health/Science Technology Building New Construction 6,834,000 1,600,000 1,600,000 Technology Infrastructure Improvements Other 250,000 250,000 250,000 Conference and Student Center New Construction 9,030,000 1,000,000 1,000,000
Project Total 16,114,000 2,850,000 2,850,000 Critical Maintenance 464,644 50,000 50,000 Deferred Maintenance 10,129,385 200,000 200,000 Replacement Equipment & Library 129,325 129,325 Total 26,708,029 3,229,325 3,229,325 EACC Projects:
Technology Infrastructure & Systems Renovation 363,500 363,500 363,500
Maintenance Building New Construction / Renovation 280,950 280,950 280,950
Student Center New Construction 1,845,200 1,250,000 1,250,000 Renovation of Classroom Bld. 3 Renovation 1,130,750 455,550 455,550
Project Total 3,620,400 2,350,000 2,350,000 Critical Maintenance 323,471 30,000 30,000 Deferred Maintenance 14,491,732 290,000 290,000 Replacement Equipment & Library 116,675 116,675 Total 18,435,603 2,786,675 2,786,675 NAC Projects:
Admin. ERP & SIS Software System Technology 1,300,000 1,300,000 1,300,000 Roof Renovations Renovation 5,400,000 1,000,000 1,000,000 N. Campus Student Resource Area Renovation 100,000 100,000 100,000 S. Campus Library Renovation Renovation 1,603,000 450,000 450,000 S. Campus Student Resource Area Renovation 750,000 S. Campus East Ent. & Student Area Renovation 800,000 N. Campus Main Ent. & Student Area Renovation 100,000
Project Total 10,053,000 2,850,000 2,850,000 Critical Maintenance 5,155,368 520,000 520,000 Deferred Maintenance 23,310,320 470,000 470,000 Replacement Equipment & Library 204,955 204,955 Total 38,518,687 4,044,955 4,044,955

18 Back to Table of Contents
INSTITUTION/ PROJECT REQUESTED ADHE Priority PROJECT NAME TYPE AMOUNT RECOMM. A NPC Projects:
Classroom Technology Technology Infrastructure 720,000 720,000 720,000
Infrastructure Improvements Technology Infrastructure 1,605,000 1,605,000 1,605,000
Construction of Learning Commons New Construction 6,833,500 775,000 775,000 Project Total 9,158,500 3,100,000 3,100,000 Critical Maintenance 1,051,127 110,000 110,000 Deferred Maintenance 23,489,753 470,000 470,000 Replacement Equipment & Library 166,755 166,755 Total 33,699,380 3,846,755 3,846,755 NWACC Projects:
Washington County Center New Construction 961,325 961,325 961,325 Burns Hall Bathroom Renovation Renovation/Remodeling 160,000 160,000 160,000 Library Remodel Renovation/Remodeling 111,300 111,300 111,300 Storm Drainage, Leveling, & Replanting (after removal of
railroad spur) Other 190,000 190,000 190,000 Burns Hall East Wing Renovation Renovation/Remodeling 151,900 151,900 151,900 Parking Garage Renovation/Remodeling 1,500,000 1,500,000 1,500,000 NCPTC Generator Other 40,000 40,000 40,000 New Physical Plant Facility New Construction 400,000 400,000 400,000 Emergency Notification Enhancements Other 43,000 43,000 43,000
Project Total 3,557,525 3,557,525 3,557,525 Critical Maintenance 0 0 0 Deferred Maintenance 24,373,135 490,000 490,000 Replacement Equipment & Library 742,865 742,865 Total 27,930,660 4,790,390 4,790,390 OZC Projects:
Information Technology Center New Construction 1,500,000 1,500,000 1,500,000 Fulton County Education Center New Construction 2,000,000 1,000,000 1,000,000 Health & Fitness Center New Construction 750,000 350,000 350,000
Project Total 4,250,000 2,850,000 2,850,000 Critical Maintenance 21,802 0 0 Deferred Maintenance 11,810,421 240,000 240,000 Replacement Equipment & Library 128,510 128,510 Total 16,082,223 3,218,510 3,218,510

19 Back to Table of Contents
INSTITUTION/ PROJECT REQUESTED ADHE Priority PROJECT NAME TYPE AMOUNT RECOMM. A PCCUA Projects:
Roof Repair & Replacement Renovation 1,100,000 1,100,000 1,100,000 Renovation of Gymnasium Renovation 220,000 220,000 220,000
ADA Improvements ADA (Handicapped Accessibility) 280,000 280,000 280,000
Campus Security Upgrades Renovation 100,000 100,000 100,000 Small Business Incubator Elevator Renovation 120,000 120,000 120,000
Project Total 1,820,000 1,820,000 1,820,000 Critical Maintenance 1,578,500 160,000 160,000 Deferred Maintenance 45,649,445 910,000 910,000 Replacement Equipment & Library 142,145 142,145 Total 49,047,945 3,032,145 3,032,145 PTC Projects:
Science Building Remodel Renovation 200,000 200,000 200,000 Project Total 200,000 200,000 200,000 Critical Maintenance 2,144,273 210,000 210,000 Deferred Maintenance 27,878,886 560,000 560,000 Replacement Equipment & Library 850,945 850,945 Total 30,223,160 1,820,945 1,820,945 RMCC Projects:
Technology Upgrade of Science Labs Technology Infrastructure/Renovation 620,500 620,500 620,500
Technology Upgrade of Lecture Hall Technology Infrastructure/Renovation 590,500 590,500 590,500
Allied Health Equipment Clinical/Instructional Equipment 200,500 200,500 200,500
Fine Arts Performance Center New Construction 9,215,000 438,500 438,500 Project Total 10,626,500 1,850,000 1,850,000 Critical Maintenance 434,297 40,000 40,000 Deferred Maintenance 4,431,788 90,000 90,000 Replacement Equipment & Library 82,065 82,065 Total 15,492,585 2,062,065 2,062,065

20 Back to Table of Contents
INSTITUTION/ PROJECT REQUESTED ADHE Priority PROJECT NAME TYPE AMOUNT RECOMM. A SACC Projects:
Advanced Manufacturing Center New Construction 844,643 844,643 844,643 Health Science Center Addition New Construction 2,986,250 1,250,000 1,250,000 Library/Learning Center Expansion New Construction 2,951,000 755,357 755,357 Renovation of Career Technical Education Center (formerly Industrial
Tech Bldg) Renovation 298,960 East Campus Lighting & Signage Other 250,000 Technology Infrastructure Other 267,635
Project Total 7,598,488 2,850,000 2,850,000 Critical Maintenance 690,483 70,000 70,000 Deferred Maintenance 21,617,187 430,000 430,000 Replacement Equipment & Library 166,910 166,910 Total 29,906,158 3,516,910 3,516,910 SAUT Projects:
Career and Workforce Development Center New Construction 7,872,500 1,850,000 1,850,000 Administration/Business Bldg. Renovation Renovation 1,605,000 1,000,000 1,000,000
Project Total 9,477,500 2,850,000 2,850,000 Critical Maintenance 648,831 60,000 60,000 Deferred Maintenance 37,507,702 750,000 750,000 Replacement Equipment & Library 169,540 169,540 Total 47,634,033 3,829,540 3,829,540 SEAC Projects:
General Studies North-South Sewer Renovation 790,000 790,000 790,000 General Studies South - Transformer Safety Hazard 25,000 25,000 25,000 McGeorge Hall - Boiler Renovation 25,000 25,000 25,000 Founders Hall - Boiler Renovation 25,000 25,000 25,000 Core Server Switch Other 82,169 82,169 82,169 Library - Brick Failure Renovation 25,000 25,000 25,000 Projectors for Classrooms Other 105,000 105,000 105,000 Wellness Center/Classrooms New Construction 3,200,000 1,772,831 1,772,831
Project Total 4,277,169 2,850,000 2,850,000 Critical Maintenance 895,346 90,000 90,000 Deferred Maintenance 16,338,991 330,000 330,000 Replacement Equipment & Library 156,625 156,625 Total 21,511,506 3,426,625 3,426,625

21 Back to Table of Contents
INSTITUTION/ PROJECT REQUESTED ADHE Priority PROJECT NAME TYPE AMOUNT RECOMM. A UACCB Projects:
Workforce Training Center Construction 2,082,000 1,250,000 1,250,000 Instructional Equipment Technology 600,000 600,000 600,000 Stabilization for vehicular bridge Critical 250,000 250,000 250,000 Land Acquisition Other 1,205,000 750,000 750,000 General Instruction Classroom
Building Construction 2,513,700 Business and Industry Building Construction 2,195,100 Underground Utility Renovation Renovation 200,000 Student Services/Admin./Classroom Construction 4,080,000
Project Total 13,125,800 2,850,000 2,850,000 Critical Maintenance 3,285,334 330,000 330,000 Deferred Maintenance 8,483,132 170,000 170,000 Replacement Equipment & Library 143,800 143,800 Total 24,894,266 3,493,800 3,493,800 UACCH Projects:
Instructional Technology Technology Infrastructure 420,000 420,000 420,000 Testing Center Renovation 685,000 685,000 685,000 Texarkana Student & Career Services
Center New Construction 10,418,000 1,745,000 1,745,000 Project Total 11,523,000 2,850,000 2,850,000 Critical Maintenance 580,120 60,000 60,000 Deferred Maintenance 11,638,166 230,000 230,000 Replacement Equipment & Library 136,535 136,535 Total 23,741,286 3,276,535 3,276,535 UACCM Projects:
Workforce Training Center New Construction 600,000 600,000 600,000 Technology III Renovation/Construction 1,000,000 1,000,000 1,000,000
Project Total 1,600,000 1,600,000 1,600,000 Critical Maintenance 449,689 40,000 40,000 Deferred Maintenance 20,150,974 400,000 400,000 Replacement Equipment & Library 231,395 231,395 Total 22,200,663 2,271,395 2,271,395

22 Back to Table of Contents
INSTITUTION/ PROJECT REQUESTED ADHE Priority PROJECT NAME TYPE AMOUNT RECOMM. A Subtotal Two-Year Projects $ 164,771,882 $ 55,004,525 $ 55,004,525 Critical Maintenance $ 24,261,436 $ 2,420,000 $ 2,420,000 Deferred Maintenance $ 457,717,306 $ 9,170,000 $ 9,170,000 Equipment & Library $ - $ 5,084,680 $ 5,084,680 Total $ 646,750,625 $ 71,679,205 $ 71,679,205 Grand Total Projects $ 1,141,988,585 $ 150,964,258 $ 150,964,258 Critical Maintenance $ 211,865,665 $ 21,160,000 $ 21,160,000 Deferred Maintenance $ 2,790,566,297 $ 55,840,000 $ 55,840,000 Equipment & Library $ - $ 22,086,768 $ 22,086,768 Total $ 4,144,420,547 $ 250,051,026 $ 250,051,026

23 Back to Table of Contents
TABLE 1.3A: MAXIMUM LINE ITEM COMPARISONS FOR SELECTED KEY POSITIONS - AHECB RECOMMENDATIONS FOR UNIVERSITIES: FY2017-18
CHIEF CHIEF CHIEF CHIEFEXECUTIVE ACADEMIC FISCAL STUDENT DEPT ASSOC ASSIST
INSTITUTION OFFICER OFFICER OFFICER OFFICER DEAN CHAIR PROFESSOR PROFESSOR PROFESSOR INSTRUCTORUAF** 325,000 227,494 203,932 182,569 195,964 249,418 187,064 146,619 142,127 94,479
UALR 300,000 208,264 174,726 151,222 166,765 156,143 150,834 132,244 110,701 86,378
ASUJ 275,000 208,264 174,726 172,072 166,765 156,143 150,834 132,244 110,701 86,378
ATU 275,000 208,265 174,726 172,072 166,766 156,143 150,834 132,244 110,701 86,378
UCA 275,000 208,265 174,726 172,072 166,765 156,143 150,834 132,244 110,701 86,378
HSU 250,000 167,426 167,426 164,882 159,792 149,614 144,526 126,705 106,077 82,762
SAUM 250,000 156,141 150,726 146,200 134,899 124,209 116,106 102,590 94,484 78,270
UAM 225,000 156,141 150,726 146,200 134,899 124,209 116,106 102,590 94,484 78,270
UAPB 225,908 156,141 150,726 146,200 134,899 124,209 116,106 102,590 94,484 78,270
UAFS 225,000 180,034 167,426 164,882 134,899 149,614 144,526 126,705 106,076 82,762
UAMS* 375,000 361,990 305,927 N/A 299,302 436,020 188,888 278,850 263,640 209,000
ASU/SYS 338,075 196,489 211,897 N/A N/A N/A N/A N/A N/A N/A
UA/SYS 436,482 227,493 215,000 N/A N/A N/A N/A N/A N/A N/A*UAMS faculty salaries are for 12-month positions.**UAF Chief Student Officer is listed as a Vice Provost
9-MONTH

24 Back to Table of Contents
TABLE 1.3B: MAXIMUM LINE ITEM COMPARISONS FOR SELECTED KEY POSITIONS - AHECB RECOMMENDATIONS FOR COLLEGES: FY2017-18
CHIEF CHIEF CHIEF CHIEFEXECUTIVE ACADEMIC FISCAL STUDENT DIVISION ASSOC ASSIST
INST OFFICER OFFICER OFFICER OFFICER CHAIR FACULTY PROFESSOR PROFESSOR PROFESSOR INSTRUCTORANC 161,444 129,580 121,513 121,513 113,403 86,379ASUB 161,444 129,580 121,513 121,513 113,403 92,685 87,385 77,321 67,366ASUMH 161,444 129,580 121,513 121,513 113,402 86,379ASUMS 161,444 129,580 121,513 121,513 113,403 86,379ASUN 161,444 129,580 121,513 121,513 113,403 92,685 87,385 77,321 67,366BRTC 161,444 129,580 121,513 121,513 113,403 86,379CCCUA 161,444 129,580 121,513 121,513 113,403 86,379CotO 161,444 129,580 121,513 121,513 113,403 86,379EACC 161,444 129,580 121,513 121,513 113,403 86,379NAC 161,444 129,580 121,513 121,513 113,403 86,379NPC 161,444 129,580 121,513 121,513 113,403 86,379NWACC 161,444 129,580 121,513 121,513 113,403 86,379OZC 161,444 129,580 121,513 121,513 113,403 86,379PCCUA 161,444 129,580 145,523 121,513 113,403 86,379PTC 161,444 129,580 121,513 121,513 113,403 86,379RMCC 161,444 129,580 121,513 121,513 113,403 86,379SACC 161,444 129,580 129,580 121,513 113,403 86,379SAUT 161,444 129,580 121,513 121,513 113,403 86,379SEARC 161,444 129,580 121,513 121,513 113,403 86,379UACCB 161,444 129,580 121,513 121,513 113,403 86,379UACCH 161,444 129,580 129,580 121,513 N/A 86,379UACCM 161,444 129,580 121,513 121,513 113,403 86,379
9-MONTH

25 Back to Table of Contents
SECTION 2.
LEGISLATIVE APPROPRIATIONS FOR THE 2017-19 BIENNIUM

26 Back to Table of Contents
TABLE 2.1A – 2016-17 REVENUE STABILIZATION ACT ALLOCATIONS: HIGHER EDUCATION AND OTHER STATE FUNDS.
TABLE 2.1B – 2017-18 REVENUE STABILIZATION ACT ALLOCATIONS: HIGHER EDUCATION AND OTHER STATE FUNDS.
ACTUAL FY16 FY 2016-17 RSA100% of "A" AND
"B" TOTAL ALLOCATION ALLOCATION ALLOCATION ALLOCATION
FUND GROUP ALLOCATION A B B1 C
PUBLIC SCHOOL FUND $2,164,410,154 $2,188,136,184 $2,164,410,154 $23,726,030 $0 $0 % OF TOTAL 41.73% 41.14% 41.69% 18.54% 0.00% 0.00%GENERAL EDUCATION FUND $112,482,952 $112,482,952 $112,482,952 $0 $0 $0 % OF TOTAL 2.17% 2.11% 2.17% 0.00% 0.00% 0.00%HUMAN SERVICES FUND 1,333,248,875 $1,445,193,167 $1,353,693,167 $91,500,000 $0 $0 % OF TOTAL 25.71% 27.17% 26.08% 71.49% 0.00% 0.00%GENERAL GOVERNMENT FUND 597,854,887 $601,590,113 $594,029,583 $7,560,530 $0 $0 % OF TOTAL 11.53% 11.31% 11.44% 5.91% 0.00% 0.00%INSTITUTIONS OF HIGHER EDUCATION FUND 733,562,405 $733,562,405 $733,562,405 $0 $0 $0 % OF TOTAL 14.14% 13.79% 14.13% 0.00% 0.00% 0.00%OTHER FUNDS 244,535,180 $238,335,179 $233,135,179 $5,200,000 $0 $0 % OF TOTAL 4.72% 4.48% 4.49% 4.06% 0.00% 0.00%
TOTAL $5,186,094,452 $5,319,300,000 $5,191,313,440 $127,986,560 $0 $0 % OF TOTAL ALLOCATION 100.00% 100.00% 97.59% 2.41% 0.00% 0.00%
2016-17 FISCAL YEAR
FY 2017-18 RSATOTAL ALLOCATION ALLOCATION ALLOCATION ALLOCATION
FUND GROUP ALLOCATION A B B1 CPUBLIC SCHOOL FUND $2,194,540,549 $2,190,540,549 $4,000,000 $0 $0 % OF TOTAL 40.06% 40.98% 3.04% 0.00% 0.00%GENERAL EDUCATION FUND $112,144,849 101,644,849 10,500,000 0 0 % OF TOTAL 2.05% 1.90% 7.98% 0.00% 0.00%HUMAN SERVICES FUND $1,558,009,769 1,460,447,825 97,561,944 0 0 % OF TOTAL 28.44% 27.32% 74.19% 0.00% 0.00%GENERAL GOVERNMENT FUND $628,969,773 611,525,243 17,444,530 0 0 % OF TOTAL 11.48% 11.44% 13.27% 0.00% 0.00%INSTITUTIONS OF HIGHER EDUCATION FUND $733,562,405 733,562,405 0 0 0 % OF TOTAL 13.39% 13.72% 0.00% 0.00% 0.00%OTHER FUNDS $250,488,900 248,195,179 2,000,000 293,721 0 % OF TOTAL 4.57% 4.64% 1.52% 100.00% 0.00%
TOTAL $5,477,716,246 $5,345,916,050 $131,506,474 $293,721 $0 % OF TOTAL ALLOCATION 100.00% 97.59% 2.40% 0.01% 0.00%
2017-18 FISCAL YEAR

27 Back to Table of Contents
TABLE 2.2A – OFFICIAL REVENUE FORECAST FY2017
"A" "B" Total
Allocation
FY17FORECAST
EETF(7/18/2016)
FY17FORECAST
WF2000 (7/18/2016)
FY17 Forecast
Total % Inc.ASUJ $62,457,227 $56,378,311 $0 $56,378,311 $56,378,311 $6,333,854 $0 $62,712,165 0.41%ATU $31,908,441 $29,821,940 $0 $29,821,940 $29,821,940 $2,174,005 $0 $31,995,946 0.27%HSU $20,954,600 $18,796,213 $0 $18,796,213 $18,796,213 $2,248,906 $0 $21,045,119 0.43%SAUM $16,861,062 $15,584,976 $0 $15,584,976 $15,584,976 $1,329,602 $0 $16,914,579 0.32%UAF $126,989,355 $117,536,490 $0 $117,536,490 $117,536,490 $9,849,300 $0 $127,385,790 0.31%UAFS $23,757,259 $20,594,615 $0 $20,594,615 $20,594,615 $3,295,279 $0 $23,889,894 0.56%UALR $62,148,500 $56,667,261 $0 $56,667,261 $56,667,261 $5,711,111 $0 $62,378,372 0.37%UAM $14,169,125 $13,067,823 $0 $13,067,823 $13,067,823 $1,147,489 $0 $14,215,312 0.33%UAPB $23,683,131 $21,771,294 $0 $21,771,294 $21,771,294 $1,992,016 $0 $23,763,310 0.34%UCA $57,864,927 $53,114,705 $0 $53,114,705 $53,114,705 $4,949,437 $0 $58,064,142 0.34%4-YR SUBTOTAL $440,793,627 $403,333,629 $0 $403,333,629 $403,333,629 $39,031,000 $0 $442,364,629 0.36%ANC $10,052,464 $8,577,052 $0 $8,577,052 $8,577,052 $775,679 $730,954 $10,083,685 0.31%ASUB $14,122,727 $11,835,727 $0 $11,835,727 $11,835,727 $1,547,335 $801,945 $14,185,007 0.44%ASUMH $4,472,039 $3,648,110 $0 $3,648,110 $3,648,110 $0 $823,929 $4,472,039 0.00%ASUMS $6,048,921 $3,858,007 $0 $3,858,007 $3,858,007 $0 $2,190,914 $6,048,921 0.00%ASUN $7,409,921 $5,992,293 $0 $5,992,293 $5,992,293 $0 $1,417,628 $7,409,921 0.00%BRTC $8,358,725 $6,113,516 $0 $6,113,516 $6,113,516 $0 $2,245,209 $8,358,725 0.00%CCCUA $4,746,139 $3,395,802 $0 $3,395,802 $3,395,802 $0 $1,350,337 $4,746,139 0.00%CotO $4,683,647 $3,527,261 $0 $3,527,261 $3,527,261 $0 $1,156,386 $4,683,647 0.00%EACC $6,565,224 $5,788,058 $0 $5,788,058 $5,788,058 $809,759 $0 $6,597,817 0.50%NAC $9,001,126 $7,966,964 $0 $7,966,964 $7,966,964 $478,234 $575,177 $9,020,375 0.21%NPC $10,876,872 $9,046,489 $0 $9,046,489 $9,046,489 $1,211,109 $668,021 $10,925,619 0.45%NWACC $11,646,430 $10,619,202 $0 $10,619,202 $10,619,202 $1,070,308 $0 $11,689,510 0.37%OZC $4,398,316 $3,126,475 $0 $3,126,475 $3,126,475 $0 $1,271,841 $4,398,316 0.00%PCCUA $10,349,799 $9,063,088 $0 $9,063,088 $9,063,088 $788,596 $529,856 $10,381,540 0.31%PTC $17,411,209 $15,137,437 $0 $15,137,437 $15,137,437 $0 $2,273,772 $17,411,209 0.00%RMCC $3,412,013 $3,206,869 $0 $3,206,869 $3,206,869 $213,747 $0 $3,420,616 0.25%SACC $7,027,222 $6,034,307 $0 $6,034,307 $6,034,307 $553,817 $461,389 $7,049,513 0.32%SAUT $5,915,047 $5,705,511 $0 $5,705,511 $5,705,511 $218,323 $0 $5,923,834 0.15%SEAC $7,611,997 $5,636,798 $0 $5,636,798 $5,636,798 $0 $1,975,199 $7,611,997 0.00%UACCB $4,997,821 $4,131,061 $0 $4,131,061 $4,131,061 $0 $866,760 $4,997,821 0.00%UACCH $6,450,944 $4,491,997 $0 $4,491,997 $4,491,997 $0 $1,958,947 $6,450,944 0.00%UACCM $6,313,341 $5,022,155 $0 $5,022,155 $5,022,155 $0 $1,291,186 $6,313,341 0.00%2-YR SUBTOTAL $171,871,944 $141,924,179 $0 $141,924,179 $141,924,179 $7,666,908 $22,589,450 $172,180,536 0.18%ADTEC $1,500,000 $1,500,000 $0 $1,500,000 $1,500,000 $0 $0 $1,500,000 0.00%ARE-ON $0 $0 $0 $0 $0 $0 $0 $0 N/AASU-System $2,508,285 $2,362,680 $0 $2,362,680 $2,362,680 $151,711 $0 $2,514,391 0.24%ASU-Heritage $350,000 $350,000 $0 $350,000 $350,000 $0 $0 $350,000 0.00%HSU-CEC $79,798 $79,798 $0 $79,798 $79,798 $0 $0 $79,798 0.00%NWACC-CPTC $0 $0 $0 $0 $0 $0 $0 $0 N/ASACC-Arboretum $0 $0 $0 $0 $0 $0 $0 $0 N/ASAUT-ETA $403,419 $368,404 $0 $368,404 $368,404 $36,483 $0 $404,887 0.36%SAUT-FTA $1,739,843 $1,651,221 $0 $1,651,221 $1,651,221 $92,339 $0 $1,743,560 0.21%UA-SYS $3,689,795 $3,417,950 $0 $3,417,950 $3,417,950 $283,245 $0 $3,701,195 0.31%UA-AS $2,461,758 $2,327,380 $0 $2,327,380 $2,327,380 $140,014 $0 $2,467,394 0.23%UA-DivAgri $68,386,906 $62,800,138 $0 $62,800,138 $62,800,138 $5,821,067 $0 $68,621,205 0.34%UA-ASMSA $8,483,975 $1,113,015 $0 $1,113,015 $1,113,015 $7,680,084 $0 $8,793,099 3.64%UA-CS $2,295,575 $2,295,575 $0 $2,295,575 $2,295,575 $0 $0 $2,295,575 0.00%UA-CJI $1,825,769 $1,825,769 $0 $1,825,769 $1,825,769 $0 $0 $1,825,769 0.00%UAF-ARTP $0 $0 $0 $0 $0 $0 $0 $0 N/AUAF-Autism $0 $0 $0 $0 $0 $0 $0 $0 N/AUAF-GWG $0 $0 $0 $0 $0 $0 $0 $0 N/AUAF-Pryor Center $0 $0 $0 $0 $0 $0 $0 $0 N/AUAF-WTC AR $0 $0 $0 $0 $0 $0 $0 $0 N/AUALR-RAPS $4,087,836 $4,087,836 $0 $4,087,836 $4,087,836 $0 $0 $4,087,836 0.00%UAMS $95,894,280 $86,456,661 $0 $86,456,661 $86,456,661 $9,833,414 $0 $96,290,075 0.41%UAMS-ABUSE/RAPE/DV $735,000 $735,000 $0 $735,000 $735,000 $0 $0 $735,000 0.00%UAMS-Child Safety $720,588 $720,588 $0 $720,588 $720,588 $0 $0 $720,588 0.00%UAMS-Ped/Pysch/Res. $1,950,000 $1,950,000 $0 $1,950,000 $1,950,000 $0 $0 $1,950,000 0.00%UAMS-IC $5,577,025 $5,342,181 $0 $5,342,181 $5,342,181 $244,693 $0 $5,586,874 0.18%UAPB-Nonformula $3,647,591 $3,647,591 $0 $3,647,591 $3,647,591 $0 $0 $3,647,591 0.00%ENTITY SUBTOTAL $206,337,443 $183,031,787 $0 $183,031,787 $183,031,787 $24,283,050 $0 $207,314,837 0.47%ATU-Ozark $3,189,081 $2,394,591 $0 $2,394,591 $2,394,591 $0 $794,490 $3,189,081 0.00%UAM-Crossett $1,811,324 $1,154,300 $0 $1,154,300 $1,154,300 $0 $657,024 $1,811,324 0.00%UAM-McGehee $2,430,015 $1,723,919 $0 $1,723,919 $1,723,919 $0 $706,096 $2,430,015 0.00%TECH CENTER SUBTOTAL $7,430,420 $5,272,810 $0 $5,272,810 $5,272,810 $0 $2,157,610 $7,430,420 0.00%TOTAL $826,433,434 $733,562,405 $0 $733,562,405 $733,562,405 $70,980,958 $24,747,060 $829,290,422 0.35%Revenue Stablilization Bills - Acts 242 and 270 of Fiscal Session, 2016
INSTITUTIONFY2016
Distribution
2017 FISCAL YEAR RSA FY17
Forecast 100% of "A"+"B"
(5/4/2016)

28 Back to Table of Contents
TABLE 2.2B – OFFICIAL REVENUE FORECAST FY2018
"A" "B" Total
Allocation
FY18FORECAST
EETF(05/02/2017)
FY18FORECAST
WF2000 (05/02/2017)
FY18 Forecast
Total % Inc.ASUJ $62,712,165 $56,378,311 $0 $56,378,311 $56,378,311 $6,444,226 $0 $62,822,537 0.18%ATU $31,995,946 $29,821,940 $0 $29,821,940 $29,821,940 $2,211,889 $0 $32,033,829 0.12%HSU $21,045,119 $18,796,213 $0 $18,796,213 $18,796,213 $2,288,095 $0 $21,084,308 0.19%SAUM $16,914,579 $15,584,976 $0 $15,584,976 $15,584,976 $1,352,771 $0 $16,937,748 0.14%UAF $127,385,790 $117,536,490 $0 $117,536,490 $117,536,490 $10,020,930 $0 $127,557,420 0.13%UAFS $23,889,894 $20,594,615 $0 $20,594,615 $20,594,615 $3,352,701 $0 $23,947,317 0.24%UALR $62,378,372 $56,667,261 $0 $56,667,261 $56,667,261 $5,810,631 $0 $62,477,892 0.16%UAM $14,215,312 $13,067,823 $0 $13,067,823 $13,067,823 $1,167,485 $0 $14,235,308 0.14%UAPB $23,763,310 $21,771,294 $0 $21,771,294 $21,771,294 $2,026,728 $0 $23,798,022 0.15%UCA $58,064,142 $53,114,705 $0 $53,114,705 $53,114,705 $5,035,684 $0 $58,150,389 0.15%4-YR SUBTOTAL $442,364,629 $403,333,629 $0 $403,333,629 $403,333,629 $39,711,139 $0 $443,044,770 0.15%ANC $10,083,685 $8,577,052 $0 $8,577,052 $8,577,052 $789,195 $727,814 $10,094,061 0.10%ASUB $14,185,007 $11,835,727 $0 $11,835,727 $11,835,727 $1,574,299 $798,500 $14,208,526 0.17%ASUMH $4,472,039 $3,648,110 $0 $3,648,110 $3,648,110 $0 $820,388 $4,468,498 -0.08%ASUMS $6,048,921 $3,858,007 $0 $3,858,007 $3,858,007 $0 $2,181,501 $6,039,508 -0.16%ASUN $7,409,921 $5,992,293 $0 $5,992,293 $5,992,293 $0 $1,411,537 $7,403,830 -0.08%BRTC $8,358,725 $6,113,516 $0 $6,113,516 $6,113,516 $0 $2,235,562 $8,349,078 -0.12%CCCUA $4,746,139 $3,395,802 $0 $3,395,802 $3,395,802 $0 $1,344,535 $4,740,337 -0.12%CotO $4,683,647 $3,527,261 $0 $3,527,261 $3,527,261 $0 $1,151,418 $4,678,679 -0.11%EACC $6,597,817 $5,788,058 $0 $5,788,058 $5,788,058 $823,870 $0 $6,611,928 0.21%NAC $9,020,375 $7,966,964 $0 $7,966,964 $7,966,964 $486,568 $572,706 $9,026,238 0.06%NPC $10,925,619 $9,046,489 $0 $9,046,489 $9,046,489 $1,232,213 $665,151 $10,943,853 0.17%NWACC $11,689,510 $10,619,202 $0 $10,619,202 $10,619,202 $1,088,959 $0 $11,708,161 0.16%OZC $4,398,316 $3,126,475 $0 $3,126,475 $3,126,475 $0 $1,266,376 $4,392,851 -0.12%PCCUA $10,381,540 $9,063,088 $0 $9,063,088 $9,063,088 $802,338 $527,579 $10,393,005 0.11%PTC $17,411,209 $15,137,437 $0 $15,137,437 $15,137,437 $0 $2,264,003 $17,401,440 -0.06%RMCC $3,420,616 $3,206,869 $0 $3,206,869 $3,206,869 $217,472 $0 $3,424,341 0.11%SACC $7,049,513 $6,034,307 $0 $6,034,307 $6,034,307 $563,468 $459,407 $7,057,182 0.11%SAUT $5,923,834 $5,705,511 $0 $5,705,511 $5,705,511 $222,128 $0 $5,927,639 0.06%SEAC $7,611,997 $5,636,798 $0 $5,636,798 $5,636,798 $0 $1,966,712 $7,603,510 -0.11%UACCB $4,997,821 $4,131,061 $0 $4,131,061 $4,131,061 $0 $863,036 $4,994,097 -0.07%UACCH $6,450,944 $4,491,997 $0 $4,491,997 $4,491,997 $0 $1,950,530 $6,442,527 -0.13%UACCM $6,313,341 $5,022,155 $0 $5,022,155 $5,022,155 $0 $1,285,639 $6,307,794 -0.09%2-YR SUBTOTAL $172,180,536 $141,924,179 $0 $141,924,179 $141,924,179 $7,800,508 $22,492,394 $172,217,083 0.02%ADTEC $1,500,000 $1,500,000 $0 $1,500,000 $1,500,000 $0 $0 $1,500,000 0.00%ARE-ON $0 $0 $0 $0 $0 $0 $0 $0 N/AASU-System $2,514,391 $2,362,680 $0 $2,362,680 $2,362,680 $154,354 $0 $2,517,034 0.11%ASU-Heritage $350,000 $350,000 $0 $350,000 $350,000 $0 $0 $350,000 0.00%HSU-CEC $79,798 $79,798 $0 $79,798 $79,798 $0 $0 $79,798 0.00%NWACC-CPTC $0 $0 $0 $0 $0 $0 $0 $0 N/ASACC-Arboretum $0 $0 $0 $0 $0 $0 $0 $0 N/ASAUT-ETA $404,887 $368,404 $0 $368,404 $368,404 $37,119 $0 $405,523 0.16%SAUT-FTA $1,743,560 $1,651,221 $0 $1,651,221 $1,651,221 $93,948 $0 $1,745,169 0.09%UA-SYS $3,701,195 $3,417,950 $0 $3,417,950 $3,417,950 $288,181 $0 $3,706,131 0.13%UA-AS $2,467,394 $2,327,380 $0 $2,327,380 $2,327,380 $142,454 $0 $2,469,834 0.10%UA-DivAgri $68,621,205 $62,800,138 $0 $62,800,138 $62,800,138 $5,922,502 $0 $68,722,640 0.15%UA-ASMSA $8,793,099 $1,113,015 $0 $1,113,015 $1,113,015 $7,813,914 $0 $8,926,929 1.52%UA-CS $2,295,575 $2,295,575 $0 $2,295,575 $2,295,575 $0 $0 $2,295,575 0.00%UA-CJI $1,825,769 $1,825,769 $0 $1,825,769 $1,825,769 $0 $0 $1,825,769 0.00%UAF-ARTP $0 $0 $0 $0 $0 $0 $0 $0 N/AUAF-Autism $0 $0 $0 $0 $0 $0 $0 $0 N/AUAF-GWG $0 $0 $0 $0 $0 $0 $0 $0 N/AUAF-Pryor Center $0 $0 $0 $0 $0 $0 $0 $0 N/AUAF-WTC AR $0 $0 $0 $0 $0 $0 $0 $0 N/AUALR-RAPS $4,087,836 $4,087,836 $0 $4,087,836 $4,087,836 $0 $0 $4,087,836 0.00%UAMS $96,290,075 $86,456,661 $0 $86,456,661 $86,456,661 $10,004,767 $0 $96,461,428 0.18%UAMS-ABUSE/RAPE/DV $735,000 $735,000 $0 $735,000 $735,000 $0 $0 $735,000 0.00%UAMS-Child Safety $720,588 $720,588 $0 $720,588 $720,588 $0 $0 $720,588 0.00%UAMS-Ped/Pysch/Res. $1,950,000 $1,950,000 $0 $1,950,000 $1,950,000 $0 $0 $1,950,000 0.00%UAMS-IC $5,586,874 $5,342,181 $0 $5,342,181 $5,342,181 $248,957 $0 $5,591,138 0.08%UAPB-Nonformula $3,647,591 $3,647,591 $0 $3,647,591 $3,647,591 $0 $0 $3,647,591 0.00%ENTITY SUBTOTAL $207,314,837 $183,031,787 $0 $183,031,787 $183,031,787 $24,706,197 $0 $207,737,983 0.20%ATU-Ozark $3,189,081 $2,394,591 $0 $2,394,591 $2,394,591 $0 $791,078 $3,185,669 -0.11%UAM-Crossett $1,811,324 $1,154,300 $0 $1,154,300 $1,154,300 $0 $654,200 $1,808,500 -0.16%UAM-McGehee $2,430,015 $1,723,919 $0 $1,723,919 $1,723,919 $0 $703,061 $2,426,980 -0.12%TECH CENTER SUBTOTAL $7,430,420 $5,272,810 $0 $5,272,810 $5,272,810 $0 $2,148,339 $7,421,149 -0.12%TOTAL $829,290,422 $733,562,405 $0 $733,562,405 $733,562,405 $72,217,845 $24,640,733 $830,420,985 0.14%
INSTITUTIONFY2017
Distribution
2018 FISCAL YEAR RSA FY18
Forecast 100% of "A" + 67.26% of "B"(05/02/2017)

29 Back to Table of Contents
TABLE 2.3 – INSTITUTIONS OF HIGHER EDUCATION GENERAL IMPROVEMENT APPROPRIATIONS FUNDED WITH RAINY DAY FUNDS PURSUANT TO ACT 1123 & ACT 1084 OF 2017 2017-19 BIENNIUM
ACT SECTION INSTITUTION PURPOSE APPROPRIATION FUNDED
WITH RAINY DAY
842 1(A) Arkansas State University - Jonesboro
For construction, renovation, maintenance, equipment, personal services and operational expenses of the various institutions and entities of the Arkansas State University System
15,000,000 0
842 1(B) Arkansas State University - Jonesboro For construction of a College of Engineering Building 4,000,000 0
842 1(C) Arkansas State University - Jonesboro
For College of Education and Communications restrooms renovation 908,500 0
842 1(D) Arkansas State University - Jonesboro For Library HVAC system renovation and modernization 2,000,000 0
842 1(E) Arkansas State University - Jonesboro
For Lab Sciences Lab and HVAC System renovation and modernization 1,291,500 0
842 1(F) Arkansas State University - Jonesboro For critical maintenance 1,840,000 0
842 1(G) Arkansas State University - Jonesboro For deferred maintenance 4,940,000
842 1(H) Arkansas State University - Jonesboro
For the purchase, replacement, and renewal of equipment and library holdings 2,342,774 0
Arkansas State University - Jonesboro Total 32,322,774 0
842 2(A) Arkansas Tech University For reroofing the Allied Health Building on the Ozark Campus 107,731 0
842 2(B) Arkansas Tech University For technology upgrades, including partial renovation of Corley Hall and connecting the Ozark Campus to the AREON
5,832,533 0
842 2(C) Arkansas Tech University For instructional technology labs for the Ozark Campus 244,213 0 842 2(D) Arkansas Tech University For construction of an academic classroom facility 2,367,467 0
842 2(E) Arkansas Tech University For renovation of restrooms in the Technology and Academic Support building on the Ozark Campus 120,589 0
842 2(F) Arkansas Tech University For critical maintenance 300,000 0 842 2(G) Arkansas Tech University For critical maintenance for the Ozark Campus 30,000 0 842 2(H) Arkansas Tech University For deferred maintenance 2,460,000 0
842 2(I) Arkansas Tech University For purchased, replacement, and renewal of equipment and library holdings 1,361,321 0
842 2(J) Arkansas Tech University For deferred maintenance for the Ozark Campus 190,000 0
842 2(K) Arkansas Tech University For purchased, replacement, and renewal of equipment and library holdings at the Ozark Campus 149,510 0
Arkansas Tech University Total 13,163,364 0
842 3(A) Henderson State University For construction of a HPER building and renovation of the Wells Building 3,000,000 0
842 3(B) Henderson State University For renovation of the Russell Fine Arts Building 3,000,000 0
842 3(C) Henderson State University For construction of a School of Business Building and renovation of Mooney Hall 1,200,000 0
842 3(D) Henderson State University For critical maintenance 800,000 0 842 3(E) Henderson State University For deferred maintenance 1,820,000 0
842 3(F) Henderson State University For purchased, replacement, and renewal of equipment and library holdings 541,895 0
Henderson State University Total 10,361,895 0
842 4(A) Southern Arkansas University For construction of an Educational building 1,350,000 0 842 4(B) Southern Arkansas University For technology infrastructure improvements and upgrades 3,465,750 0
842 4(C) Southern Arkansas University For renovation of Childs Hall and ADA upgrades to create the Science, Technology, Engineering and Mathematics training center
2,384,250 0
842 4(D) Southern Arkansas University For critical maintenance 420,000 0 842 4(E) Southern Arkansas University For deferred maintenance 1,780,000 0
842 4(F) Southern Arkansas University For the purchase, replacement, and renewal of equipment and library holdings 618,586 0
Southern Arkansas University Total 10,018,586 0

30 Back to Table of Contents
ACT SECTION INSTITUTION PURPOSE APPROPRIATION FUNDED
WITH RAINY DAY
842 6(G) University of Arkansas For the costs of construction of the Center for Learning and Student Support 5,000,000 0
842 6(J) University of Arkansas For costs of construction of the Research Laboratory and Office Building demolition of the Agriculture Annex 3,000,000 0
842 6(T) University of Arkansas For costs of renovation of the Fine Arts Center 1,200,000 0 842 6(U) University of Arkansas For critical maintenance for the U of A - Fayetteville 3,390,000 0 842 6(X) University of Arkansas For deferred maintenance for the U of A - Fayetteville 9,090,000 0
842 6(Y) University of Arkansas For the purchase, replacement, and renewal of equipment and library holdings 4,555,200 0
842 6(B) University of Arkansas- Archeological Survey
For costs for making the Arkansas Archeological Survey facility ADA accessible 43,500 0
842 6(P) University of Arkansas- Archeological Survey
For deferred maintenance of the Arkansas Archeological Survey 80,000 0
842 6(H) University of Arkansas - AREON For technology infrastructure improvements and Arkansas Cloud equipment upgrades for the AREON 525,000 0
842 6(I) University of Arkansas - AREON
For technology infrastructure improvements for the AREON for fiber renewal leases and fiber acquisition for community college members currently accessing the network through leased circuits
500,000 0
842 6(K) University of Arkansas - ASMSA For costs for constructing a Learning Courtyard for the Arkansas School for Mathematics, Sciences, and the Arts (ASMSA)
500,000 0
842 6(N) University of Arkansas - ASMSA For costs of constructing a Multi-Purpose Building & Community Hall for ASMSA 525,000 0
842 6(C) University of Arkansas - Clinton School
For technology and equipment upgrades at the Clinton School 75,000 0
842 6(D) University of Arkansas - Criminal Justice Institute
For forensic lab and classroom equipment upgrades at the Criminal Justice Institute 103,700 0
842 6(O) University of Arkansas - Criminal Justice Institute
For technology and equipment upgrades at the Criminal Justice Institute 240,000 0
842 6(E) University of Arkansas - Division of Agriculture
For upgrades and renovations to the Agricultural Research and Extension Centers and Stations of the Division of Agriculture
2,900,000 0
842 6(M) University of Arkansas - Division of Agriculture
For costs of bank stabilization of Coleman Creek for the Division of Agriculture - Cooperative Extension Service headquarters
200,000 0
842 6(R) University of Arkansas - Division of Agriculture
For costs of constructing and equipping a Rice Innovation Center of the Division of Agriculture 1,000,000 0
842 6(S) University of Arkansas - Division of Agriculture
For critical maintenance of the U of A - Division of Agriculture 70,000 0
842 6(V) University of Arkansas - Division of Agriculture
For deferred maintenance of the U of A - Division of Agriculture 1,600,000 0
842 6(A) University of Arkansas - System Office
For construction, renovation, maintenance, equipment, personal services and operational expenses of the various institutions and entities of the University of Arkansas System
15,000,000 0
842 6(F) University of Arkansas - System Office For technology upgrades for the System Office 250,000 0
842 6(L) University of Arkansas - System Office
For construction costs for the expansion of office and storage space at the U of A - System Office 775,000 0
842 6(Q) University of Arkansas - System Office For critical maintenance of the U of A -System 10,000 0
842 6(W) University of Arkansas - System Office For deferred maintenance of the U of A -System 40,000 0
University of Arkansas and Divisions Total 50,672,400 0
842 10(A) University of Arkansas - Fort Smith
For costs of designing, renovating, and equipping the Math-Science building 3,000,000 0
842 10(B) University of Arkansas - Fort Smith
For costs of constructing an expanded Math-Science building 2,000,000 0
842 10(C) University of Arkansas - Fort Smith For costs of construction of a College of Business building 1,700,000 0
842 10(D) University of Arkansas - Fort Smith For critical maintenance 290,000 0
842 10(E) University of Arkansas - Fort Smith For deferred maintenance 1,460,000 0
842 10(F) University of Arkansas - Fort Smith
For the purchase, replacement, and renewal of equipment and library holdings 829,488 0
University of Arkansas - Fort Smith Total 9,279,488 0

31 Back to Table of Contents
ACT SECTION INSTITUTION PURPOSE APPROPRIATION FUNDED
WITH RAINY DAY
842 7(A) University of Arkansas at Little Rock For improvements in technology infrastructure 4,000,000 0
842 7(B) University of Arkansas at Little Rock
For construction costs to complete the Nanotechnology Center 3,000,000 0
842 7(C) University of Arkansas at Little Rock
For costs of improving and replacing building infrastructure and performing critical maintenance 1,700,000 0
842 7(D) University of Arkansas at Little Rock For critical maintenance 6,620,000 0
842 7(E) University of Arkansas at Little Rock For deferred maintenance 5,300,000 0
842 7(F) University of Arkansas at Little Rock
For the purchase, replacement, and renewal of equipment and library holdings 1,802,560 0
University of Arkansas at Little Rock Total 22,422,560 0
842 8(A) University of Arkansas at Monticello
For costs of construction of the Workforce/Collegiate Center on the Crossett campus 1,050,000 0
842 8(B) University of Arkansas at Monticello
For construction of a General Education Building on the McGehee campus 1,050,000 0
842 8(C) University of Arkansas at Monticello For construction of a Math and Science Center 3,500,000 0
842 8(D) University of Arkansas at Monticello For critical maintenance on the Crossett campus 40,000 0
842 8(E) University of Arkansas at Monticello For costs of renovation of the Old Student Union 2,000,000 0
842 8(F) University of Arkansas at Monticello
For costs of renovation of the Library and Technology Center 325,000 0
842 8(G) University of Arkansas at Monticello For critical maintenance on the McGehee campus 70,000 0
842 8(H) University of Arkansas at Monticello For deferred maintenance on the McGehee campus 140,000 0
842 8(I) University of Arkansas at Monticello For deferred maintenance on the Crossett campus 110,000 0
842 8(J) University of Arkansas at Monticello
For the purchase, replacement, and renewal of equipment and library holdings at the Crossett campus 27,895 0
842 8(K) University of Arkansas at Monticello
For the purchase, replacement, and renewal of equipment and library holdings at the McGehee campus 28,830 0
842 8(L) University of Arkansas at Monticello For costs of renovation of the Fine Arts Center 375,000 0
842 8(M) University of Arkansas at Monticello For critical maintenance 1,340,000 0
842 8(N) University of Arkansas at Monticello For deferred maintenance 1,710,000 0
842 8(O) University of Arkansas at Monticello
For the purchase, replacement, and renewal of equipment and library holdings 387,969 0
University of Arkansas at Monticello Total 12,154,694 0
842 9(A) University of Arkansas at Pine Bluff For costs of campus renovations and repair 3,000,000 0
842 9(B) University of Arkansas at Pine Bluff
For costs of construction of a Nanotechnology/Biotechnology Center 2,000,000 0
842 9(C) University of Arkansas at Pine Bluff For costs of construction of a Life Sciences facility 1,200,000 0
842 9(D) University of Arkansas at Pine Bluff For critical maintenance 150,000 0
842 9(E) University of Arkansas at Pine Bluff For deferred maintenance 1,500,000 0
842 9(F) University of Arkansas at Pine Bluff
For the purchase, replacement, and renewal of equipment and library holdings 387,294 0
University of Arkansas at Pine Bluff Total 8,237,294 0
842 5(A) University of Arkansas for Medical Sciences
For upgrades to the Central Building to meet code requirements 4,200,000 0
842 5(B) University of Arkansas for Medical Sciences
For expansion of the Electronic Health System to Primary Care Clinics managed by UAMS Regional Programs and Specialty Clinics operating at the UAMS Northwest Campus
2,000,000 0
842 5(C) University of Arkansas for Medical Sciences
For the purchase of new and replacement hospital clinical equipment 1,000,000 0
842 5(D) University of Arkansas for Medical Sciences
For the construction of an energy plant on the Little Rock campus 1,000,000 0
842 5(E) University of Arkansas for Medical Sciences For critical maintenance 2,030,000 50,000

32 Back to Table of Contents
ACT SECTION INSTITUTION PURPOSE APPROPRIATION FUNDED
WITH RAINY DAY
842 5(F) University of Arkansas for Medical Sciences For deferred maintenance 10,730,000 35,000
842 5(G) University of Arkansas for Medical Sciences For repair or replacement of equipment and library holdings 1,927,257 300,000
University of Arkansas For Medical Sciences Total 22,887,257 385,000
842 11(A) University of Central Arkansas For critical maintenance 1,340,000 0
842 11(B) University of Central Arkansas For costs of construction for an addition to, renovation of, and equipment for the Lewis Science Center 4,000,000 0
842 11(C) University of Central Arkansas For costs of construction of the Institute for Wellness and Restorative Health facility 2,100,000 0
842 11(D) University of Central Arkansas For costs of construction of a College of Fine Arts and Communication building 2,100,000 0
842 11(E) University of Central Arkansas For deferred maintenance 3,650,000 0
842 11(F) University of Central Arkansas For the purchase, replacement, and renewal of equipment and library holdings 2,041,509 0
University of Central Arkansas Total 15,231,509 0
904 1(A) Arkansas Northeastern College
For construction, renovation, maintenance, critical maintenance, equipment, security enhancements, technology upgrades/equipment and library resources of a Workforce Training Building
1,850,000 0
904 1(B) Arkansas Northeastern College
For construction, renovation, maintenance, critical maintenance, equipment, security enhancements, technology upgrades/equipment and library resources of a Nursing and Allied Health Building in Paragould
1,000,000 0
904 1(C) Arkansas Northeastern College For critical maintenance 350,000 0 904 1(D) Arkansas Northeastern College For deferred maintenance 360,000 0 904 1(E) Arkansas Northeastern College For repair or replacement of equipment and library holdings 138,225 0
Arkansas Northeastern College Total 3,698,225 0
904 2(A) Arkansas State University - Beebe
For construction, renovation, equipment, maintenance, equipment, security enhancements, technology upgrades/equipment and library resources of an IT Services Data Center
2,000,000 0
904 2(B) Arkansas State University - Beebe For renovations of State Hall 1,375,000 0 904 2(C) Arkansas State University - Beebe For critical maintenance 110,000 0 904 2(D) Arkansas State University - Beebe For deferred maintenance 1,070,000 0 904 2(E) Arkansas State University - Beebe For repair or replacement of equipment and library holdings 445,250 0
Arkansas State University - Beebe Total 5,000,250 0
904 5(A) Arkansas State University Mid-South
For upgrade and replacement of Classroom Instructional Technology Equipment 102,000 0
904 5(B) Arkansas State University Mid-South For critical maintenance 20,000 0
904 5(C) Arkansas State University Mid-South For deferred maintenance 460,000 0
904 5(D) Arkansas State University Mid-South For repair or replacement of equipment and library holdings 159,060 0
Arkansas State University Mid-South 741,060 0
904 3(A) Arkansas State University - Mountain Home
For acquisition and renovation of an Occupational Technical Center 1,850,000 0
904 3(B) Arkansas State University - Mountain Home
For construction, renovation, maintenance, critical maintenance, equipment, security enhancements, technology upgrades/equipment and library resources of a Health and Wellness Center
1,000,000 0
904 3(C) Arkansas State University - Mountain Home For critical maintenance 90,000 0
904 3(D) Arkansas State University - Mountain Home For deferred maintenance 220,000 0
904 3(E) Arkansas State University - Mountain Home For repair or replacement of equipment and library holdings 162,705 0
Arkansas State University - Mountain Home Total 3,322,705 0
904 4(A) Arkansas State University - Newport
For construction, renovation, maintenance, critical maintenance, equipment, security enhancements, technology upgrades/equipment and library resources of STEM Classroom/Lab Building on the Jonesboro Campus
1,000,000 0

33 Back to Table of Contents
ACT SECTION INSTITUTION PURPOSE APPROPRIATION FUNDED
WITH RAINY DAY
904 4(B) Arkansas State University - Newport
For construction, renovation, maintenance, critical maintenance, equipment, security enhancements, technology upgrades/equipment and library resources of an Administration Building on the Newport Campus
750,000 0
904 4(C) Arkansas State University - Newport
For renovation of a classroom building to provide a Transportation Tech Building on the Newport Campus 547,500 0
904 4(D) Arkansas State University - Newport For remodel of the Main Building on the Jonesboro Campus 552,500 0
904 1(E) Arkansas State University - Newport For critical maintenance 20,000 0
904 4(F) Arkansas State University - Newport For deferred maintenance 340,000 0
904 1(G) Arkansas State University - Newport For repair or replacement of equipment and library holdings 264,730 0
Arkansas State University - Newport Total 3,474,730 0
904 6A) Black River Technical College For Student Information System upgrades 1,062,000 0 904 6(B) Black River Technical College For the renovation of the "A" and "B" Buildings 157,500 0
904 6(C) Black River Technical College For the construction of a storage building for Fire Science Program truck and equipment 157,500 0
904 6(D) Black River Technical College For equipment replacement in the Academic Complex/Library 54,000 0
904 6(E) Black River Technical College For construction of a storage building for Grounds Maintenance tractors and equipment 90,000 0
904 6(F) Black River Technical College
For construction, renovation, maintenance, critical maintenance, equipment, security enhancements, technology upgrades/equipment and library resources for a Technical Education Building
1,167,000 0
904 6(G) Black River Technical College For renovation of the Randolph County Developmental Center 162,000 0
904 6(H) Black River Technical College For critical maintenance 10,000 0 904 6(I) Black River Technical College For deferred maintenance 390,000 0 904 6(J) Black River Technical College For repair or replacement of equipment and library holdings 201,595 0
Black River Technical College Total 3,451,595 0
904 7(A) College of the Ouachitas
For construction, renovation, maintenance, critical maintenance, equipment, security enhancements, technology upgrades/equipment and library resources of the Health/Science Technology Building
1,600,000 0
904 7(B) College of the Ouachitas For improvements in technology infrastructure 250,000 0
904 7C) College of the Ouachitas
For construction, renovation, maintenance, critical maintenance, equipment, security enhancements, technology upgrades/equipment and library resources of the Conference and Student Center
1,000,000 0
904 7D) College of the Ouachitas For critical maintenance 50,000 0 904 7(E) College of the Ouachitas For deferred maintenance 200,000 0 904 7(F) College of the Ouachitas For repair or replacement of equipment and library holdings 129,325 0 College of the Ouachitas Total 3,229,325 0
904 8(A) Cossatot Community College of the University of Arkansas For technology upgrades 600,000 0
904 8(B) Cossatot Community College of the University of Arkansas
For Heating, Ventilation, and Air Conditioning replacement for the Leeper Building 58,000 0
904 8(C) Cossatot Community College of the University of Arkansas
For construction, renovation, maintenance, critical maintenance, equipment, security enhancements, technology upgrades/equipment and library resources of the Student Commons
1,000,000 0
904 8(D) Cossatot Community College of the University of Arkansas
For construction, renovation, maintenance, critical maintenance, equipment, security enhancements, technology upgrades/equipment and library resources of the Convocation/Education Center
1,192,000 0
904 8(E) Cossatot Community College of the University of Arkansas For critical maintenance 50,000 0
904 8(F) Cossatot Community College of the University of Arkansas For deferred maintenance 300,000 0
904 8(G) Cossatot Community College of the University of Arkansas For repair or replacement of equipment and library holdings 144,070 0
Cossatot Community College of the University of Arkansas Total
3,344,070 0
904 9(A) East Arkansas Community College For renovation of technology infrastructure and systems 363,500 0

34 Back to Table of Contents
ACT SECTION INSTITUTION PURPOSE APPROPRIATION FUNDED
WITH RAINY DAY
904 9(B) East Arkansas Community College For renovation and expansion of the Maintenance Building 280,950 0
904 9(C) East Arkansas Community College
For construction, renovation, maintenance, critical maintenance, equipment, security enhancements, technology upgrades/equipment and library resources of the Student Center
1,250,000 0
904 9(D) East Arkansas Community College For renovation of Classroom Building 3 455,550 0
904 9(E) East Arkansas Community College For critical maintenance 30,000 0
904 9(F) East Arkansas Community College For deferred maintenance 290,000 0
904 9(G) East Arkansas Community College For repair or replacement of equipment and library holdings 116,675 0
232 1(A) Crowley's Ridge Technical Institute (merged with EACC)
For cosmetology classroom and laboratory facility’s construction and equipment costs 894,375 0
232 1(B) Crowley's Ridge Technical Institute (merged with EACC) For major maintenance and repair of facilities 957,000 0
232 1(C) Crowley's Ridge Technical Institute (merged with EACC)
For transfers of or refund to expenditures for capital balances for construction, renovation, major maintenance, and purchase of equipment for various capital projects or facility improvements
1,000,000 0
East Arkansas Community College Total 5,638,050 0
904 10(A) National Park Community College
For construction, renovation, maintenance, critical maintenance, equipment, security enhancements, technology upgrades/equipment and library resources of Learning Commons
775,000 0
904 10(B) National Park Community College For technology infrastructure improvements 1,605,000 0 904 10(C) National Park Community College For classroom technology 720,000 0 904 10(D) National Park Community College For critical maintenance 110,000 0 904 10(E) National Park Community College For deferred maintenance 470,000 0 904 10(F) National Park Community College For repair or replacement of equipment and library holdings 166,755 0
National Park Community College Total 3,846,755 0
904 11(A) North Arkansas College For an upgrade and replacement of the Administrative ERP and SIS Software System 1,300,000 0
904 11(B) North Arkansas College For roof renovations for Durand Center and Library 1,000,000 0
904 11(C) North Arkansas College For renovation of the North Campus Student Resource Area 100,000 0
904 11(D) North Arkansas College For renovation of the South Campus Library 450,000 0 904 11(E) North Arkansas College For critical maintenance 520,000 0 904 11(F) North Arkansas College For deferred maintenance 470,000 0 904 11(G) North Arkansas College For repair or replacement of equipment and library holdings 204,955 0 North Arkansas College Total 4,044,955 0
904 12(A) Northwest Arkansas Community College For construction of a Washington County Center 961,325 0
904 12(B) Northwest Arkansas Community College For renovation of the Burns Hall bathroom 160,000 0
904 12(C) Northwest Arkansas Community College For remodeling of the library 111,300 0
904 12(D) Northwest Arkansas Community College
For the construction of storm drainage, leveling and replanting for the grounds covered by the railroad spur after removal
190,000 0
904 12(E) Northwest Arkansas Community College For renovation of the Burns Hall East Wing 151,900 0
904 12(F) Northwest Arkansas Community College For renovation of the parking garage 1,500,000 0
904 12(G) Northwest Arkansas Community College
For construction, renovation, maintenance, critical maintenance, equipment, security enhancements, technology upgrades/equipment and library resources of the NCPTC Generator
40,000 0
904 12(H) Northwest Arkansas Community College
For construction, renovation, maintenance, critical maintenance, equipment, security enhancements, technology upgrades/equipment and library resources of the new Physical Plant facility
400,000 0
904 12(I) Northwest Arkansas Community College For Emergency Notification enhancements 43,000 0
904 12(J) Northwest Arkansas Community College For deferred maintenance 490,000 0
904 12(K) Northwest Arkansas Community College For repair or replacement of equipment and library holdings 742,865 0

35 Back to Table of Contents
ACT SECTION INSTITUTION PURPOSE APPROPRIATION FUNDED
WITH RAINY DAY
Northwest Arkansas Community College Total 4,790,390 0
904 13(A) Ozarka College
For construction, renovation, maintenance, critical maintenance, equipment, security enhancements, technology upgrades/equipment and library resources of an Information Technology Center and Student Center
1,500,000 0
904 13(B) Ozarka College
For construction, renovation, maintenance, critical maintenance, equipment, security enhancements, technology upgrades/equipment and library resources of a Fulton County Education Center
1,000,000 0
904 13(C) Ozarka College
For construction, renovation, maintenance, critical maintenance, equipment, security enhancements, technology upgrades/equipment and library resources of a Health and Fitness Center
350,000 0
904 13(D) Ozarka College For deferred maintenance 240,000 0 904 13(E) Ozarka College For repair or replacement of equipment and library holdings 128,510 0 Ozarka College Total 3,218,510 0
904 14(A) Phillips Community College of the University of Arkansas
For roof repair or roof replacement for four (4) buildings on the Helena-West Helena Campus and the Training Center - Dewitt Campus
1,100,000 0
904 14(B) Phillips Community College of the University of Arkansas
For renovation of the gymnasium on the Helena-West Helena Campus 220,000 0
904 14(C) Phillips Community College of the University of Arkansas
For Americans with Disabilities Act improvements to various buildings on the Helena-West Helena Campus 280,000 0
904 14(D) Phillips Community College of the University of Arkansas For campus security upgrades 100,000 0
904 14(E) Phillips Community College of the University of Arkansas
For installation of an elevator in the building housing the Small Business Incubator Project 120,000 0
904 14(F) Phillips Community College of the University of Arkansas For critical maintenance 160,000 0
904 14(G) Phillips Community College of the University of Arkansas For deferred maintenance 910,000 0
904 14(H) Phillips Community College of the University of Arkansas For repair or replacement of equipment and library holdings 142,145 0
Phillips Community College of the University of Arkansas Total
3,032,145 0
904 17(A) South Arkansas Community College
For construction, renovation, maintenance, critical maintenance, equipment, security enhancements, technology upgrades/equipment and library resources of an Advancing Manufacturing Center
844,643 0
904 17(B) South Arkansas Community College
For construction, renovation, maintenance, critical maintenance, equipment, security enhancements, technology upgrades/equipment and library resources for the Library/Learning Center expansion
1,250,000 0
904 17(C) 755,357 0
904 17(D) South Arkansas Community College For critical maintenance 70,000 0
904 17(E) South Arkansas Community College For deferred maintenance 430,000 0
904 17(F) South Arkansas Community College For repair or replacement of equipment and library holdings 166910 0
South Arkansas Community College Total 3,516,910 0
904 18(A) Southeast Arkansas College For replacement of the General Studies North-South Sewer 790,000 0 904 18(B) Southeast Arkansas College For replacement of transformers at General Studies South 25,000 0 904 18(C) Southeast Arkansas College For replacement of the McGeorge Hall boiler 25,000 0 904 18(D) Southeast Arkansas College For replacement of the Founders Hall boiler 25,000 0
904 18(E) Southeast Arkansas College For replacement of the Core Server Switch for the entire campus 82,169 0
904 18(F) Southeast Arkansas College For replacement of damaged brick on the Library 25,000 0
904 18(G) Southeast Arkansas College For upgrades, repair and replacement of classroom projectors 105,000 0
904 18(H) Southeast Arkansas College
For construction, renovation, maintenance, critical maintenance, equipment, security enhancements, technology upgrades/equipment and library resources for the Wellness Center and classroom
1,772,831 0
904 18(I) Southeast Arkansas College For critical maintenance 90,000 0 904 18(J) Southeast Arkansas College For deferred maintenance 330,000 0 904 18(K) Southeast Arkansas College For repair or replacement of equipment and library holdings 156,625 0

36 Back to Table of Contents
ACT SECTION INSTITUTION PURPOSE APPROPRIATION FUNDED
WITH RAINY DAY
Southeast Arkansas College Total 3,426,625 0
904 19(A) Southern Arkansas University - Tech
For construction, renovation, maintenance, critical maintenance, equipment, security enhancements, technology upgrades/equipment and library resources of a Career and Workforce Development Center
1,850,000 0
904 19(B) Southern Arkansas University - Tech For renovation of the Administration/Business Building 1,000,000 0
904 19(C) Southern Arkansas University - Tech For critical maintenance 60,000 0
904 19(D) Southern Arkansas University - Tech For deferred maintenance 750,000 0
904 19(E) Southern Arkansas University - Tech For repair or replacement of equipment and library holdings 169,540 0
904 20(A) Southern Arkansas University - Tech (FTA)
For construction, renovation, maintenance, critical maintenance, equipment, security enhancements, technology upgrades/equipment and library resources of a dormitory at the Camden site
1,050,000 0
904 20(B) Southern Arkansas University - Tech (FTA)
For construction of confined space and rescue technique simulators 500,000 0
904 20(C) Southern Arkansas University - Tech (FTA) For deferred maintenance 50,000 0
904 21(A) Southern Arkansas University - Tech (ETA) For deferred maintenance 20,000 0
Southern Arkansas University - Tech Total 5,449,540 0
904 22(A) University of Arkansas Community College at Batesville
For construction, renovation, maintenance, critical maintenance, equipment, security enhancements, technology upgrades/equipment and library resources of a Workforce Training Center
1,250,000 0
904 22(B) University of Arkansas Community College at Batesville
For upgrades, repair and replacement of instructional equipment 600,000 0
904 22(C) University of Arkansas Community College at Batesville
For maintenance and stabilization of the vehicular bridge near the center of campus 250,000 0
904 22(D) University of Arkansas Community College at Batesville For land acquisition 750,000 0
904 22(E) University of Arkansas Community College at Batesville For critical maintenance 330,000 0
904 22(F) University of Arkansas Community College at Batesville For deferred maintenance 170,000 0
904 22(G) University of Arkansas Community College at Batesville For repair or replacement of equipment and library holdings 143,800 0
University of Arkansas Community College at Batesville Total
3,493,800 0
904 23(A) University of Arkansas Community College at Hope For upgrades and replacement of instructional technology 420,000 0
904 23(B) University of Arkansas Community College at Hope
For construction, renovation, maintenance, critical maintenance, equipment, security enhancements, technology upgrades/equipment and library resources of a Testing Center
685,000 0
904 23(C) University of Arkansas Community College at Hope
For construction, renovation, maintenance, critical maintenance, equipment, security enhancements, technology upgrades/equipment and library resources of a Texarkana Student and Career Services Center
1,745,000 0
904 23(D) University of Arkansas Community College at Hope For critical maintenance 60,000 0
904 23(E) University of Arkansas Community College at Hope For deferred maintenance 230,000 0
904 23(F) University of Arkansas Community College at Hope For repair or replacement of equipment and library holdings 136,535 0
University of Arkansas Community College at Hope Total
3,276,535 0
904 24(A) University of Arkansas Community College at Morrilton
For construction, renovation, maintenance, critical maintenance, equipment, security enhancements, technology upgrades/equipment and library resources of a Workforce Training Center
600,000 0
904 24(B) University of Arkansas Community College at Morrilton
For construction, renovation, maintenance, critical maintenance, equipment, security enhancements, technology upgrades/equipment and library resources to expand Technology Building III
1,000,000 0
904 24(C) University of Arkansas Community College at Morrilton For critical maintenance 40,000 0

37 Back to Table of Contents
ACT SECTION INSTITUTION PURPOSE APPROPRIATION FUNDED
WITH RAINY DAY
904 24(D) University of Arkansas Community College at Morrilton For deferred maintenance 400,000 0
904 24(E) University of Arkansas Community College at Morrilton For repair or replacement of equipment and library holdings 231,395 0
University of Arkansas Community College at Morrilton Total
2,271,395 0
904 16(A) University of Arkansas Community College at Rich Mountain
For the technology upgrades of science labs 620,500 0
904 16(B) University of Arkansas Community College at Rich Mountain
For the technology upgrades of the lecture hall 590,500 0
904 16(C) University of Arkansas Community College at Rich Mountain
For equipment for the Allied Health Programs 200,500 0
904 16(D) University of Arkansas Community College at Rich Mountain
For construction, renovation, maintenance, critical maintenance, equipment, security enhancements, technology upgrades/equipment and library resources for the Fine Arts Performance Center
438,500 0
904 16(E) University of Arkansas Community College at Rich Mountain
For critical maintenance 40,000 0
904 16(F) University of Arkansas Community College at Rich Mountain
For deferred maintenance 90,000 0
904 16(G) University of Arkansas Community College at Rich Mountain
For repair or replacement of equipment and library holdings 82,065 0
Rich Mountain Community College Total 2,062,065 0
904 15(A) University of Arkansas - Pulaski Technical College For renovation of the Science Building 200,000 0
904 15(B) University of Arkansas - Pulaski Technical College For critical maintenance 210,000 0
904 15(C) University of Arkansas - Pulaski Technical College For deferred maintenance 560,000 0
904 15(D) University of Arkansas - Pulaski Technical College For repair or replacement of equipment and library holdings 850,945 0
Pulaski Technical College Total 1,820,945 0 Grand Total 282,902,401 385,000

38 Back to Table of Contents
TABLE 2.4A – MAXIMUM LINE ITEM COMPARISONS FOR SELECTED KEY POSITIONS APPROPRIATED FOR FOUR-YEAR INSTITUTIONS: FY 2016-17
TABLE 2.4B – MAXIMUM LINE ITEM COMPARISONS FOR SELECTED KEY POSITIONS APPROPRIATED FOR TWO-YEAR INSTITUTIONS: FY 2016-2017
CHIEF CHIEF CHIEF CHIEFEXECUTIVE ACADEMIC FISCAL STUDENT DIVISION ASSOC ASSIST
INST OFFICER OFFICER OFFICER OFFICER CHAIR FACULTY PROFESSOR PROFESSOR PROFESSOR INSTRUCTOR
ANC 159,215 127,790 119,835 119,835 111,837 85,186ASUB 159,215 127,790 119,835 119,835 111,837 N/A 91,405 86,178 76,253 66,436ASUMH 159,215 127,790 119,835 119,835 111,836 85,186ASUMS 159,215 127,790 119,835 119,835 111,837 85,186ASUN 159,215 127,790 119,835 119,835 111,837 N/A 91,405 86,178 76,253 66,436BRTC 159,215 127,790 119,835 119,835 111,837 85,186CCCUA 159,215 127,791 119,835 119,835 111,837 85,186CotO 159,215 127,790 119,835 119,835 111,837 85,186EACC 159,215 127,790 119,835 119,835 111,837 85,186NAC 159,215 127,790 119,835 119,835 111,837 85,186NPC 159,215 127,790 119,835 119,835 111,837 85,186NWACC 159,215 127,790 119,835 119,835 111,837 85,186OZC 159,215 127,790 119,835 119,835 111,837 85,186PCCUA 159,215 127,790 119,835 119,835 111,837 85,186PTC 159,215 127,790 119,835 119,835 111,837 85,186RMCC 159,215 127,790 119,835 119,835 111,837 85,186SACC 159,215 127,790 119,835 119,835 111,837 85,186SAUT 159,215 127,790 119,835 119,835 111,837 85,186SEAC 159,215 127,790 119,835 119,835 111,837 85,186UACCB 159,215 127,790 119,835 119,835 111,837 85,186UACCH 159,215 127,790 127,790 119,835 N/A 85,186UACCM 159,215 127,790 119,835 119,835 111,837 85,186
9-MONTH
CHIEF CHIEF CHIEF CHIEFEXECUTIVE ACADEMIC FISCAL STUDENT DEPT ASSOC ASSIST
INSTITUTION OFFICER OFFICER OFFICER OFFICER DEAN CHAIR PROFESSOR PROFESSOR PROFESSOR INSTRUCTOR
UAF** 300,500 224,353 201,116 180,049 193,258 245,975 184,481 144,594 140,164 93,175
ASUJ 245,864 205,389 172,314 169,697 164,462 153,987 148,752 130,418 109,173 85,185
UALR 245,864 205,389 172,314 149,134 164,462 153,987 148,752 130,418 109,173 85,185
UCA 245,864 205,389 172,314 169,697 164,462 153,987 148,752 130,418 109,173 85,185
ATU 245,864 205,389 172,314 169,697 164,463 153,987 148,752 130,418 109,173 85,185
HSU 218,545 165,115 165,115 162,605 157,586 147,548 142,531 124,955 104,612 81,619
SAUM 208,970 153,985 148,645 144,181 133,036 122,494 114,503 101,173 93,180 77,189
UAM 208,970 153,985 148,645 144,181 133,036 122,494 114,503 101,173 93,180 77,189
UAPB 222,789 153,985 148,645 144,181 133,036 122,494 114,503 101,173 93,180 77,189
UAFS 208,970 177,548 165,114 162,605 133,036 147,548 142,530 124,955 104,612 81,619
UAMS* 346,958 356,992 301,703 N/A 295,170 195,880 186,280 171,899 162,304 130,418
UA/SYS 430,456 224,352 203,733 N/A N/A N/A N/A N/A N/A N/A
ASU/SYS 333,407 N/A 208,971 N/A N/A N/A N/A N/A N/A N/A
*UAMS faculty salaries are for 12-month positions.**UAF Chief Student Officer is listed as a Vice Provost
9-MONTH

39 Back to Table of Contents
TABLE 2.5A – MAXIMUM LINE ITEM COMPARISONS FOR SELECTED KEY POSITIONS APPROPRIATED FOR FOUR-YEAR INSTITUTIONS: FY 2017-18
TABLE 2.5B – MAXIMUM LINE ITEM COMPARISONS FOR SELECTED KEY POSITIONS APPROPRIATED FOR TWO-YEAR INSTITUTIONS: FY 2017-18
CHIEF CHIEF CHIEF CHIEFEXECUTIVE ACADEMIC FISCAL STUDENT DIVISION ASSOC ASSIST
INST OFFICER OFFICER OFFICER OFFICER CHAIR FACULTY PROFESSOR PROFESSOR PROFESSOR INSTRUCTORANC 161,444 129,580 121,513 121,513 113,403 86,379ASUB 161,444 129,580 121,513 121,513 113,403 92,685 87,385 77,321 67,366ASUMH 161,444 129,580 121,513 121,513 113,402 86,379ASUMS 161,444 129,580 121,513 121,513 113,403 86,379ASUN 161,444 129,580 121,513 121,513 113,403 92,685 87,385 77,321 67,366BRTC 161,444 129,580 121,513 121,513 113,403 86,379CCCUA 161,444 129,580 121,513 121,513 113,403 86,379CotO 161,444 129,580 121,513 121,513 113,403 86,379EACC 161,444 129,580 121,513 121,513 113,403 86,379NAC 161,444 129,580 121,513 121,513 113,403 86,379NPC 161,444 129,580 121,513 121,513 113,403 86,379NWACC 161,444 129,580 121,513 121,513 113,403 86,379OZC 161,444 129,580 121,513 121,513 113,403 86,379PCCUA 161,444 129,580 145,523 121,513 113,403 86,379PTC 161,444 129,580 121,513 121,513 113,403 86,379RMCC 161,444 129,580 121,513 121,513 113,403 86,379SACC 161,444 129,580 129,580 121,513 113,403 86,379SAUT 161,444 129,580 121,513 121,513 113,403 86,379SEAC 161,444 129,580 121,513 121,513 113,403 86,379UACCB 161,444 129,580 121,513 121,513 113,403 86,379UACCH 161,444 129,580 129,580 121,513 N/A 86,379UACCM 161,444 129,580 121,513 121,513 113,403 86,379
9-MONTH
CHIEF CHIEF CHIEF CHIEFEXECUTIVE ACADEMIC FISCAL STUDENT DEPT ASSOC ASSIST
INSTITUTION OFFICER OFFICER OFFICER OFFICER DEAN CHAIR PROFESSOR PROFESSOR PROFESSOR INSTRUCTORUAF** 325,000 227,494 203,932 182,569 195,964 249,418 187,064 146,619 142,127 94,479
UALR 300,000 208,264 174,726 151,222 166,765 156,143 150,834 132,244 110,701 86,378
ASUJ 275,000 208,264 174,726 172,072 166,765 156,143 150,834 132,244 110,701 86,378
ATU 275,000 208,265 174,726 172,072 166,766 156,143 150,834 132,244 110,701 86,378
UCA 275,000 208,265 174,726 172,072 166,765 156,143 150,834 132,244 110,701 86,378
HSU 250,000 167,426 167,426 164,882 159,792 149,614 144,526 126,705 106,077 82,762
SAUM 250,000 156,141 150,726 146,200 134,899 124,209 116,106 102,590 94,484 78,270
UAM 225,000 156,141 150,726 146,200 134,899 124,209 116,106 102,590 94,484 78,270
UAPB 225,908 156,141 150,726 146,200 134,899 124,209 116,106 102,590 94,484 78,270
UAFS 225,000 180,034 167,426 164,882 134,899 149,614 144,526 126,705 106,076 82,762
UAMS* 375,000 361,990 305,927 N/A 299,302 436,020 188,888 278,850 263,640 209,000
ASU/SYS 338,075 196,489 211,897 N/A N/A N/A N/A N/A N/A N/A
UA/SYS 436,482 227,493 215,000 N/A N/A N/A N/A N/A N/A N/A*UAMS faculty salaries are for 12-month positions.**UAF Chief Student Officer is listed as a Vice Provost
9-MONTH

40 Back to Table of Contents
SECTION 3.
HISTORICAL FUNDING OF ARKANSAS HIGHER EDUCATION

41 Back to Table of Contents
TABLE 3.1 COMPARISON OF ARKANSAS HIGHER EDUCATION COORDINATING BOARD FUNDING RECOMMENDATIONS AND GENERAL REVENUE FUNDING: 1987-88 THROUGH 2017-18
GENERAL % % INCREASE INFISCAL SBHE/AHECB REVENUE SBHE/AHECB GENERAL REVENUEYEAR RECOMMENDATION FUNDED RECOMMENDATION OVER PREVIOUS
AMOUNT FUNDED YEAR
1987-88 $319,146,152 $279,001,098 87.421%
1988-89 $355,970,900 $300,752,440 84.488% 7.796%
1989-90 $356,752,736 $310,748,214 87.105% 3.324%
1990-91 $389,261,795 $318,456,897 81.810% 2.481%
1991-92 $408,441,179 $369,117,878 90.372% 15.908%
1992-93 $462,294,181 $394,804,320 85.401% 6.959%
1993-94 $510,374,696 $403,931,409 79.144% 2.312%
1994-95 $545,398,589 $415,162,713 76.121% 2.780%
1995-96 $457,204,088 $444,785,449 97.284% 7.135%
1996-97 $493,356,088 $472,725,600 95.818% 6.282%
1997-98 $516,475,024 $494,063,445 95.661% 4.514%
1998-99 $540,923,337 $529,061,174 97.807% 7.084%
1999-00 $574,807,751 $556,920,303 96.888% 5.266%
2000-01 $591,792,482 $571,476,626 96.567% 2.614%
2001-02 $662,933,108 $585,688,406 88.348% 2.487%
2002-03 $682,458,804 $568,465,211 83.297% -2.941%
2003-04 $623,556,435 $620,570,284 99.521% 9.166%
2004-05 $642,119,656 $639,020,802 99.517% 2.973%
2005-06 $692,131,166 $683,776,409 98.793% 7.004%
2006-07 $747,980,288 $731,308,063 97.771% 6.951%
2007-08 $839,294,245 $799,817,111 95.296% 9.368%
2008-09 $967,535,702 $797,345,973 82.410% -0.309%
2009-10 $867,684,126 $786,262,589 90.616% -1.390%
2010-11 $892,276,697 $810,068,388 90.787% 3.028%
2011-12 $841,176,817 $820,061,351 97.490% 1.234%
2012-13 $876,051,260 $820,980,592 93.714% 0.112%
2013-14 $952,871,866 $826,503,300 86.738% 0.673%
2014-15 $960,728,765 $825,425,876 85.917% -0.130%
2015-16 $962,209,140 $826,433,434 85.889% 0.122%
2016-17 $996,483,927 $829,290,422 83.222% 0.346%
2017-18 $998,749,400 $830,420,985 83.146% 0.136%The SBHE/AHECB Recommendation and General Revenue Funded amounts do not include CSB Debt Service.The SBHE/AHECB Recommendation and General Revenue Funded Amount columns include funding from: RSA, Merit Adjustment Fund, EETF, WF2000 (base and non-base), and ADHE transfers (except for Promotional Grants funds).The GENERAL REVENUE FUNDED AMOUNT for 2017-18 is based on the off icial DF&A forecast.

42 Back to Table of Contents
TABLE 3.2 – NET STATE GENERAL REVENUE DISTRIBUTED TO ALL AGENCIES UNDER THE PROVISIONS OF THE RSA: 1998-99 THROUGH 2016-17
PUBLIC SCHOOLTOTAL & GENERAL ED. HUMAN UNIVERSITIES ALL
FISCAL GENERAL FUNDS PURPOSES/ SERVICES/ & COLLEGES/ OTHERS/YEAR DISTRIBUTED % OF TOTAL % OF TOTAL % OF TOTAL % OF TOTAL
1998-99 3,103,711,268 1,493,036,447 566,209,956 477,036,561 567,428,30448.10% 18.24% 15.37% 18.28%
1999-00 3,176,581,515 1,544,485,147 619,642,172 503,557,476 508,896,72048.62% 19.51% 15.85% 16.02%
2000-01 3,253,298,944 1,578,313,296 636,726,390 514,841,708 523,417,55048.51% 19.57% 15.83% 16.09%
2001-02 3,238,373,306 1,528,528,685 626,263,518 529,315,057 554,266,04647.20% 19.34% 16.35% 17.12%
2002-03 3,250,825,632 1,556,935,491 622,510,454 513,189,179 558,190,50847.89% 19.15% 15.79% 17.17%
2003-04 3,525,966,225 1,612,085,672 733,611,281 554,270,924 625,998,348 45.72% 20.81% 15.72% 17.75%
2004-05 3,629,925,804 1,668,558,895 868,628,621 568,558,555 524,179,73343.62% 22.71% 14.86% 13.70%
2005-06 3,825,053,006 1,742,205,715 907,330,469 606,647,542 568,869,280 45.55% 23.72% 15.86% 14.87%
2006-07 4,058,615,931 1,812,781,340 1,026,516,540 644,122,455 575,195,596 44.67% 25.29% 15.87% 14.17%
2007-08 4,352,672,063 1,956,097,483 1,043,091,140 709,869,701 643,613,739 44.94% 23.96% 16.31% 14.79%
2008-09 4,411,009,647 1,994,337,568 1,077,281,608 703,710,769 635,679,702 45.21% 24.42% 15.95% 14.41%
2009-10 4,323,207,922 1,922,488,132 979,888,870 $700,611,380 720,219,540 44.47% 22.67% 16.21% 16.66%
2010-11 4,478,900,000 1,988,822,555 1,014,693,386 725,496,283 749,887,776 44.40% 22.65% 16.20% 16.74%
2011-12 4,595,925,000 2,046,713,071 1,029,501,812 733,501,247 786,208,870 44.53% 22.40% 15.96% 17.11%
2012-13 4,727,500,000 2,101,243,071 1,131,626,691 729,571,707 765,058,531 44.45% 23.94% 15.43% 16.18%
2013-14 4,924,888,078 2,143,662,684 1,226,206,316 736,971,706 818,047,372 45.34% 25.94% 15.59% 17.30%
2014-15 5,058,907,249 2,221,109,239 1,253,022,610 733,562,405 851,212,995 46.98% 26.50% 15.52% 18.01%
2015-16 5,190,400,000 2,276,893,106 1,333,248,875 733,562,405 846,695,61448.16% 28.20% 15.52% 17.91%
2016-17 5,263,099,031 2,287,642,421 1,395,148,157 733,562,405 846,746,04848.39% 29.51% 15.52% 17.91%
FOOTNOTES IMPACTING UNIVERSITIES & COLLEGES COLUMN:1998-99 Does not include $38,373,198 from Educational Excellence Trust Fund, $12,284,256 from Workforce 2000 Fund and $1,367,159 from Merit Adjustment Fund.1999-00 Does not include $42,140,909 from Educational Excellence Trust Fund, $11,221,915 from Workforce 2000 Fund, $7,000,000 from General Revenue Allotment Reserve F and $2,831,996 from General Improvement Fund.2000-01 Does not include $45,032,256 from Educational Excellence Trust Fund, $11,602,654 from Workforce 2000 Fund, $3,581,996 from General Improvement Fund.2001-02 Does not include $46,102,057 from Educational Excellence Trust Fund, $10,271,292 from Workforce 2000 Fund, $7,705,300 from General Improvement Fund.2002-03 Does not include $46,333,501 from Educational Excellence Trust Fund, $8,942,531 from Workforce 2000 Fund, $6,785,765 from General Improvement Fund.2003-04 Does not include $52,976,326 from Educational Excellence Trust Fund and $11,248,634 from Workforce 2000 Fund2004-05 Does not include $55,686,466 from Educational Excellence Trust Fund and $11,968,736 from Workforce 2000 Fund2005-06 Does not include $60,094,626 from Educational Excellence Trust Fund and $17,034,241 from Workforce 2000 Fund2006-07 Does not include $64,478,405.52 from Educational Excellence Trust Fund and $22,707,214 from Workforce 2000 Fund2007-08 Does not include $65,581,579 from Educational Excellence Trust Fund and $22,365,830.28 from Workforce 2000 Fund2008-09 Does not include $65,276,677 from Educational Excellence Trust Fund and $21,105,544 from Workforce 2000 Fund2009-10 Does not include $64,332,298 from Educational Excellence Trust Fund, $21,332,646 from Workforce 2000 Fund, $6,644,646 from General Improvement Fund.2010-11 Does not include $60,827,167 from Educational Excellence Trust Fund, $23,744,939 from Workforce 2000 Fund .2011-12 Does not include $63,410,128 from Educational Excellence Trust Fund, $23,149,976 from Workforce 2000 Fund.2012-13 Does not include $65,087,561 from Educational Excellence Trust Fund, $24,821,326 from Workforce 2000 Fund .2013-14 Does not include $65,784,534 from Educational Excellence Trust Fund, $24,747,060 from Workforce 2000 Fund .2014-15 Does not include $67,360,228 from Educational Excellence Trust Fund, $24,503,241 from Workforce 2000 Fund .2015-16 Does not include $68,123,970 from Educational Excellence Trust Fund, $24,747,060 from Workforce 2000 Fund .2016-17 Does not include $70,980,958 from Educational Excellence Trust Fund, $24,747,060 from Workforce 2000 Fund .
SOURCE: Selected Statistical Financial Data For Arkansas: Budget & Fiscal Review Section, Arkansas Legislative Council and DFA Official Forecast of General Revenue Available for Distribution

43 Back to Table of Contents
CHART 1. ARKANSAS PUBLIC HIGHER EDUCATION INSTITUTIONS’ PERCENTAGE OF RSA GENERAL REVENUES
CHART 2. ARKANSAS TOTAL RSA GENERAL REVENUE

44 Back to Table of Contents
TABLE 3.3 – COMPARISON OF STATE FUNDING FOR GENERAL OPERATIONS, FTE STUDENTS AND HEPI*: FY1999 TO 2017
GeneralRevenue % Increase FTE % Increase HEPI*
1999 529,061,174 7.08% 81,026 2.64% 2.4%
2000 566,752,299 7.12% 83,474 3.02% 4.1%
2001 585,897,622 3.38% 84,796 1.58% 4.9%
2002 593,320,170 1.27% 89,402 5.43% 4.1%
2003 575,250,976 -3.05% 93,823 4.95% 2.9%
2004 621,532,929 8.05% 98,374 4.85% 4.6%
2005 638,288,157 2.70% 101,198 2.87% 3.6%
2006 683,776,409 7.13% 103,323 2.10% 5.0%
2007 731,308,075 6.95% 103,657 0.32% 3.4%
2008 799,817,111 9.37% 107,400 3.61% 3.6%
2009 797,345,973 -0.31% 112,112 4.39% 2.3%2010 786,262,589 -1.39% 121,347 8.24% 0.9%2011 810,068,388 3.03% 126,545 4.28% 2.3%2012 820,061,351 1.23% 126,731 0.15% 1.7%2013 819,480,592 -0.07% 126,731 0.00% 1.7%2014 827,503,300 0.98% 126,731 0.00% 1.7%2015 825,425,876 -0.25% 126,731 0.00% 1.7%2016 826,433,434 0.12% 126,731 0.00% 1.7%2017 829,290,422 0.35% 126,731 0.00% 1.7%2010 General Revenue does not include $6.6 million funding from the General Improvement Fund
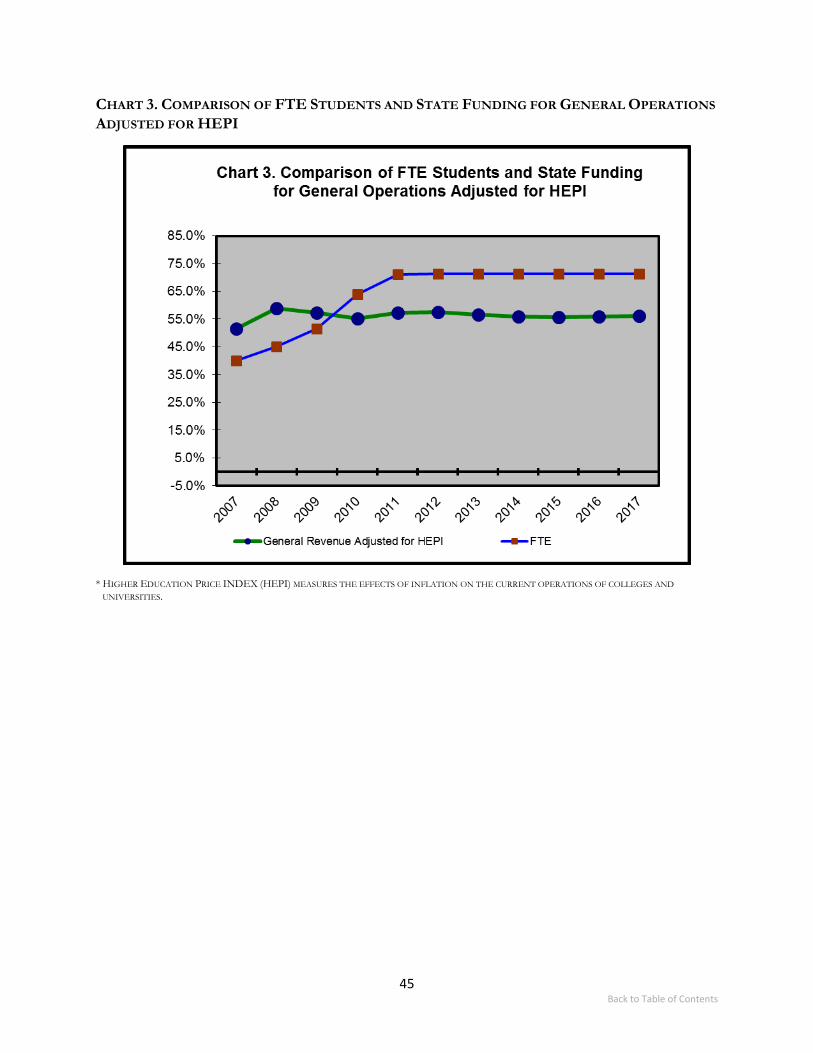
45 Back to Table of Contents
CHART 3. COMPARISON OF FTE STUDENTS AND STATE FUNDING FOR GENERAL OPERATIONS ADJUSTED FOR HEPI
* HIGHER EDUCATION PRICE INDEX (HEPI) MEASURES THE EFFECTS OF INFLATION ON THE CURRENT OPERATIONS OF COLLEGES AND UNIVERSITIES.

46 Back to Table of Contents
CHART 4. COMPARISON OF ARKANSAS PUBLIC HIGHER EDUCATION CURRENT AND REAL DOLLARS*
* REAL DOLLARS ARE CURRENT DOLLARS ADJUSTED FOR INFLATION BY THE HIGHER EDUCATION PRICE INDEX (HEPI); 1993 WAS USED AS THE BENCHMARK FOR THIS CHART.

47 Back to Table of Contents
TABLE 3.4A – SUMMARY OF ALL STATE REVENUES RECEIVED UNIVERSITIES 2006-07 TO 2016-17
$ % CHG $ % CHG $ % CHG $ % CHG $ % CHG $ % CHG $ % CHG $ % CHG $ % CHG $ % CHG $ % CHG
ASUJ 55,418,904 5.57% 59,052,443 6.56% 59,228,731 0.30% 58,028,329 -2.03% 59,054,066 1.77% 60,148,141 1.85% 60,141,168 -0.01% 61,907,972 2.94% 62,389,076 0.78% 62,457,227 0.11% 62,712,165 0.41%
ASU - Heritage 658,211 n/a 300,000 -54.42% 300,000 0.00% 350,000 16.67% 350,000 0.00% 350,000 0.00%
ASU - MT 2,887,940 9.36% 2,976,970 3.08% 2,957,097 -0.67% -100.00%
ASU-System 1,501,972 2.24% 2,399,160 59.73% 2,351,386 -1.99% 2,303,233 -2.05% 2,362,680 2.58% 2,369,571 0.29% 2,362,680 -0.29% 2,362,680 0.00% 2,506,652 6.09% 2,508,285 0.07% 2,514,391 0.24%
ATU 28,317,976 6.54% 30,756,346 8.61% 30,797,954 0.14% 30,208,099 -1.92% 30,829,562 2.06% 31,224,930 1.28% 31,134,133 -0.29% 31,560,998 1.37% 31,885,050 1.03% 31,908,441 0.07% 31,995,946 0.27%
ATU-OZARK 2,978,771 10.21% 3,064,737 2.89% 3,059,746 -0.16% 3,019,214 -1.32% 3,156,908 4.56% 3,250,602 2.97% 3,191,465 -1.82% 3,189,081 -0.07% 3,181,253 -0.25% 3,189,081 0.25% 3,189,081 0.00%
HSU 19,214,005 4.93% 20,382,324 6.08% 20,529,379 0.72% 20,075,962 -2.21% 20,430,463 1.77% 20,542,610 0.55% 20,565,446 0.11% 20,587,528 0.11% 20,799,616 1.03% 20,954,600 0.75% 21,045,119 0.43%
HSU- CEC* 356,536 1.02% 212,732 -40.33% 210,968 -0.83% 205,287 -2.69% 210,585 2.58% 210,759 0.08% 210,585 -0.08% 210,585 0.00% 210,585 0.00% 79,798 -62.11% 79,798 0.00%
SAUM 15,473,956 4.99% 16,542,084 6.90% 16,612,843 0.43% 16,265,914 -2.09% 16,588,978 1.99% 16,753,831 0.99% 16,668,783 -0.51% 16,681,839 0.08% 16,846,756 0.99% 16,861,062 0.08% 16,914,579 0.32%
UA - SYS 3,557,546 2.65% 3,734,941 4.99% 3,648,406 -2.32% 3,588,666 -1.64% 3,660,678 2.01% 3,677,162 0.45% 3,677,678 0.01% 3,680,459 0.08% 3,686,747 0.17% 3,689,795 0.08% 3,701,195 0.31%
UA - AERON 16,537 n/a n/a n/a
UA - AS 2,091,435 6.19% 2,498,409 19.46% 2,429,398 -2.76% 2,395,720 -1.39% 2,447,364 2.16% 2,457,816 0.43% 2,455,769 -0.08% 2,457,145 0.06% 2,460,252 0.13% 2,461,758 0.06% 2,467,394 0.23%
UA-ASMSA 7,473,890 9.31% 8,206,855 9.81% 8,081,366 -1.53% 8,045,714 -0.44% 7,694,467 -4.37% 7,987,379 3.81% 8,155,438 2.10% 8,230,850 0.92% 8,401,339 2.07% 8,483,975 0.98% 8,793,099 3.64%
UA - AGRI 62,264,844 6.43% 67,703,013 8.73% 67,826,330 0.18% 66,495,861 -1.96% 67,788,504 1.94% 68,108,224 0.47% 68,137,894 0.04% 68,195,051 0.08% 68,324,273 0.19% 68,386,906 0.09% 68,621,205 0.34%
UA - CS 2,172,933 9.81% 2,263,898 4.19% 2,279,055 0.67% 2,237,817 -1.81% 2,295,575 2.58% 2,301,202 0.25% 2,295,575 -0.24% 2,295,575 0.00% 2,295,575 0.00% 2,295,575 0.00% 2,295,575 0.00%
UA - CJI 1,698,112 3.68% 1,813,498 6.79% 1,816,263 0.15% 1,779,832 -2.01% 1,825,769 2.58% 1,830,383 0.25% 1,825,769 -0.25% 1,825,769 0.00% 1,825,769 0.00% 1,825,769 0.00% 1,825,769 0.00%
UA - WRI 25,517 n/a -100.00% n/a n/a n/a n/a
UAF** 110,788,365 6.34% 120,756,585 9.00% 120,879,912 0.10% 118,602,540 -1.88% 120,946,912 1.98% 122,756,644 1.50% 122,375,196 -0.31% 125,527,147 2.58% 126,883,378 1.08% 126,989,355 0.08% 127,385,790 0.31%
UAFS 21,085,637 7.24% 23,045,827 9.30% 23,019,404 -0.11% 22,596,446 -1.84% 22,939,853 1.52% 23,283,421 1.50% 23,266,845 -0.07% 23,469,127 0.87% 23,721,803 1.08% 23,757,259 0.15% 23,889,894 0.56%
UALR*** 59,402,604 6.48% 64,554,319 8.67% 64,672,280 0.18% 63,431,037 -1.92% 64,652,579 1.93% 65,535,955 1.37% 65,078,845 -0.70% 65,549,185 0.72% 66,174,885 0.95% 62,148,500 -6.08% 62,378,372 0.37%
UAM 13,087,701 6.41% 13,887,867 6.11% 13,982,164 0.68% 13,668,359 -2.24% 13,937,633 1.97% 14,057,968 0.86% 14,006,506 -0.37% 14,017,774 0.08% 14,156,779 0.99% 14,169,125 0.09% 14,215,312 0.33%
UAM-Crossett 1,683,741 13.39% 1,725,194 2.46% 1,701,453 -1.38% 1,691,382 -0.59% 1,784,442 5.50% 1,784,167 -0.02% 1,813,008 1.62% 1,811,324 -0.09% 1,804,851 -0.36% 1,811,324 0.36% 1,811,324 0.00%
UAM-McGehee 2,017,624 13.37% 2,226,621 10.36% 2,285,995 2.67% 2,289,466 0.15% 2,401,697 4.90% 2,396,182 -0.23% 2,432,423 1.51% 2,430,016 -0.10% 2,423,058 -0.29% 2,430,015 0.29% 2,430,015 0.00%
UAMS 88,681,335 7.23% 97,124,586 9.52% 96,984,225 -0.14% 104,023,740 7.26% 105,992,988 1.89% 107,103,048 1.05% 104,673,628 -2.27% 103,170,184 -1.44% 95,788,474 -7.15% 95,894,280 0.11% 96,290,075 0.41%
UAMS - ABUSE/RAPE/DV 735,000 n/a 735,000 735,000 n/a 735,000 n/a 735,000 n/a
UAMS-Child Safety 1,250,000 795,067 702,456 -11.65% 720,586 2.58% 721,180 0.08% 720,588 -0.08% 720,588 0.00% 720,588 0.00% 720,588 0.00% 720,588 0.00%
UAMS - Ped/Psych/Res. 1,950,000 n/a 1,950,000 1,950,000 n/a 1,950,000 n/a 1,950,000 n/a
UAMS - IC 5,457,507 3.17% 5,631,930 3.20% 5,577,372 -0.97% 5,429,541 -2.65% 5,551,871 2.25% 5,565,139 0.24% 5,566,558 0.03% 5,568,961 0.04% 5,574,393 0.10% 5,577,025 0.05% 5,586,874 0.18%
UAPB**** 25,778,987 3.75% 26,772,148 3.85% 27,079,212 1.15% 26,400,367 -2.51% 26,936,796 2.03% 27,105,842 0.63% 27,056,360 -0.18% 27,075,920 0.07% 27,309,288 0.86% 23,683,131 -13.28% 23,763,310 0.34%
UCA 48,170,875 6.56% 57,139,765 18.62% 55,668,195 -2.58% 55,150,546 -0.93% 56,213,798 1.93% 56,983,091 1.37% 56,822,517 -0.28% 57,234,273 0.72% 57,811,672 1.01% 57,864,927 0.09% 58,064,142 0.34%
TOTAL 581,563,196 6.34% 635,722,251 9.31% 634,474,201 -0.20% 628,635,528 -0.92% 640,424,755 1.88% 648,855,513 1.32% 647,619,857 -0.19% 652,745,031 0.79% 650,217,112 -0.39% 643,182,801 -1.08% 645,726,012 0.40%
2015-16 2016-172008-09 2009-102006-07 2007-08 2013-14 2014-15
****UAPB includes1890 Land Grant Universities MatchASU - MT merged w ith ASUN in 2009-10; funding is reflected in the ASUN figure
***UALR includes Research and Public Service (RAPS)
2009-10 revenue includes $6,644,646 in General Improvement Funds used to backfill a cut in General Revenues on May 4, 2010.
2010-11 2011-12 2012-13
*HSU - Southw est Arkansas Technology Learning Center (HSU-SWATLC) is now HSU - Community Education Center (CEC)**UAF included Garvan Woodland Gardens (GWG)

48 Back to Table of Contents
TABLE 3.4B – SUMMARY OF ALL STATE REVENUES RECEIVED COLLEGES 2006-07 TO 2016-17
$ % CHG $ % CHG $ % CHG $ % CHG $ % CHG $ % CHG $ % CHG $ % CHG $ % CHG $ % CHG $ % CHG
ANC 9,503,616 4.44% 9,917,736 4.36% 9,907,435 -0.10% 9,694,372 -2.15% 9,943,125 2.57% 9,954,024 0.11% 10,021,476 0.68% 10,026,898 0.05% 10,036,916 0.10% 10,052,464 0.15% 10,083,685 0.31%
ADTEC* 90,716 n/a 1,500,000 1553.51% 1,000,000 -33.33% 1,500,000 50.00% 1,500,000 0.00% 1,500,000 0.00%
ASUB 13,405,859 4.98% 13,889,307 3.61% 14,120,217 1.66% 13,835,556 -2.02% 14,140,377 2.20% 14,222,974 0.58% 14,268,131 0.32% 14,071,729 -1.38% 14,098,177 0.19% 14,122,727 0.17% 14,185,007 0.44%
ASUMS 5,385,574 13.76% 5,667,937 5.24% 5,573,276 -1.67% 5,584,991 0.21% 5,893,961 5.53% 5,918,898 0.42% 6,015,606 1.63% 6,048,921 0.55% 6,027,335 -0.36% 6,048,921 0.36% 6,048,921 0.00%
ASUMH 3,905,912 14.81% 4,195,729 7.42% 4,203,473 0.18% 4,176,380 -0.64% 4,346,156 4.07% 4,397,699 1.19% 4,408,624 0.25% 4,472,039 1.44% 4,463,921 -0.18% 4,472,039 0.18% 4,472,039 0.00%
ASUN 3,531,445 12.39% 4,244,026 20.18% 4,126,309 -2.77% 7,063,557 71.18% 7,352,514 4.09% 7,364,179 0.16% 7,414,175 0.68% 7,409,921 -0.06% 7,395,954 -0.19% 7,409,921 0.19% 7,409,921 0.00%
BRTC 7,520,664 12.15% 7,826,267 4.06% 7,833,021 0.09% 7,795,314 -0.48% 8,165,416 4.75% 8,184,711 0.24% 8,301,351 1.43% 8,358,725 0.69% 8,336,604 -0.26% 8,358,725 0.27% 8,358,725 0.00%
CCCUA 4,140,023 14.28% 4,426,991 6.93% 4,408,015 -0.43% 4,407,874 0.00% 4,623,226 4.89% 4,647,603 0.53% 4,706,016 1.26% 4,746,139 0.85% 4,732,835 -0.28% 4,746,139 0.28% 4,746,139 0.00%
CotO** 4,157,076 11.12% 4,444,264 6.91% 4,428,706 -0.35% 4,414,729 -0.32% 4,615,668 4.55% 4,636,950 0.46% 4,687,118 1.08% 4,683,647 -0.07% 4,672,254 -0.24% 4,683,647 0.24% 4,683,647 0.00%
EACC 6,177,162 2.92% 6,553,009 6.08% 6,534,071 -0.29% 6,376,338 -2.41% 6,481,981 1.66% 6,511,448 0.45% 6,530,585 0.29% 6,538,536 0.12% 6,556,512 0.27% 6,565,224 0.13% 6,597,817 0.50%
NAC 8,391,338 4.64% 8,779,078 4.62% 8,871,129 1.05% 8,694,915 -1.99% 8,927,798 2.68% 8,986,735 0.66% 8,981,519 -0.06% 8,985,364 0.04% 8,990,314 0.06% 9,001,126 0.12% 9,020,375 0.21%
NPC 10,054,324 5.18% 10,498,107 4.41% 10,567,861 0.66% 10,349,878 -2.06% 10,579,127 2.21% 10,732,212 1.45% 10,724,382 -0.07% 10,836,955 1.05% 10,857,258 0.19% 10,876,872 0.18% 10,925,619 0.45%
NWACC 8,885,893 13.52% 10,752,568 21.01% 10,558,069 -1.81% 10,507,932 -0.47% 10,701,252 1.84% 11,035,376 3.12% 11,066,006 0.28% 11,611,154 4.93% 11,634,914 0.20% 11,646,430 0.10% 11,689,510 0.37%
OZC 3,759,527 13.11% 4,041,862 7.51% 3,981,256 -1.50% 3,981,489 0.01% 4,179,930 4.98% 4,206,530 0.64% 4,264,352 1.37% 4,398,316 3.14% 4,385,785 -0.28% 4,398,316 0.29% 4,398,316 0.00%
PCCUA 9,579,940 3.71% 10,244,587 6.94% 10,202,308 -0.41% 10,006,534 -1.92% 10,247,276 2.41% 10,263,233 0.16% 10,317,654 0.53% 10,323,808 0.06% 10,336,094 0.12% 10,349,799 0.13% 10,381,540 0.31%
PTC 12,207,890 23.53% 16,622,008 36.16% 15,632,763 -5.95% 15,908,696 1.77% 16,490,356 3.66% 16,792,755 1.83% 16,737,684 -0.33% 17,411,209 4.02% 17,388,807 -0.13% 17,411,209 0.13% 17,411,209 0.00%
RMCC 3,098,370 3.73% 3,403,996 9.86% 3,379,458 -0.72% 3,314,431 -1.92% 3,384,422 2.11% 3,419,757 1.04% 3,397,250 -0.66% 3,404,968 0.23% 3,409,713 0.14% 3,412,013 0.07% 3,420,616 0.25%
SACC 6,498,304 4.22% 6,861,583 5.59% 6,875,773 0.21% 6,743,167 -1.93% 6,911,616 2.50% 6,969,347 0.84% 6,964,925 -0.06% 7,008,969 0.63% 7,016,717 0.11% 7,027,222 0.15% 7,049,513 0.32%
SAUT 5,300,867 5.93% 5,660,828 6.79% 5,777,238 2.06% 5,668,295 -1.89% 5,798,707 2.30% 5,876,733 1.35% 5,839,365 -0.64% 5,907,851 1.17% 5,912,697 0.08% 5,915,047 0.04% 5,923,834 0.15%
SAUT - ECA 363,340 4.23% 401,560 10.52% 400,027 -0.38% 392,201 -1.96% 399,668 1.90% 402,839 0.79% 401,858 -0.24% 402,217 0.09% 403,026 0.20% 403,419 0.10% 404,887 0.36%
SAUT - FTA 1,300,456 3.54% 1,860,189 43.04% 1,692,268 -9.03% 1,693,365 0.06% 1,730,350 2.18% 1,740,607 0.59% 1,735,893 -0.27% 1,736,800 0.05% 1,738,850 0.12% 1,739,843 0.06% 1,743,560 0.21%
SEAC 6,899,792 14.50% 7,225,060 4.71% 7,239,149 0.20% 7,197,648 -0.57% 7,532,013 4.65% 7,526,695 -0.07% 7,617,924 1.21% 7,611,997 -0.08% 7,592,536 -0.26% 7,611,997 0.26% 7,611,997 0.00%
UACCB 4,386,948 13.99% 4,677,973 6.63% 4,702,727 0.53% 4,666,655 -0.77% 4,852,307 3.98% 4,915,422 1.30% 4,919,947 0.09% 4,997,821 1.58% 4,989,281 -0.17% 4,997,821 0.17% 4,997,821 0.00%
UACCH 5,895,639 10.23% 6,199,311 5.15% 6,093,993 -1.70% 6,067,641 -0.43% 6,371,618 5.01% 6,340,228 -0.49% 6,456,823 1.84% 6,450,944 -0.09% 6,450,944 0.00% 6,431,644 -0.30% 6,450,944 0.30%
UACCM 5,394,908 13.89% 5,700,883 5.67% 5,763,229 1.09% 5,729,750 -0.58% 5,974,770 4.28% 6,068,166 1.56% 6,082,071 0.23% 6,313,341 3.80% 6,313,341 0.00% 6,300,620 -0.20% 6,313,341 0.20%
TOTAL 149,744,867 9.41% 164,094,859 9.58% 162,871,771 -0.75% 164,271,707 0.86% 169,643,633 3.27% 171,205,838 0.92% 173,360,735 1.26% 174,758,269 0.81% 175,240,785 0.28% 175,483,185 0.14% 175,828,983 0.20%
FOUR-YEAR INSTITUTIONS, TWO-YEAR INSTITUTIONS & NON-FORMULA ENTITIES
TOTAL 731,308,063 6.95% 799,817,111 9.37% 797,345,973 -0.31% 792,907,235 -0.56% 810,068,388 2.16% 820,061,351 1.23% 820,980,592 0.11% 827,503,300 0.79% 825,457,897 -0.25% 818,665,986 -0.82% 821,554,995 0.35%
2012-132007-08 2008-09 2009-10
ASU - MT merged with ASUN in 2009-10; funding is reflected in the ASUN figure2009-10 revenue includes $6,644,646 in General Improvement Funds used to backfill a cut in General Revenues on May 4, 2010.
NOTE: If large discrepancies exist between general revenues actually received and Series 17-1 information, the difference could be caused by merit adjustment fund remittances after the end of the fiscal year.
2013-14 2014-152010-11 2011-12
*ADTEC is a coalition of five community colleges located in the Delta of Arkansas. These community colleges are working together to develop programs in several areas, including Advanced Manufacturing, Transportation, and Renewable Energy Technology
2015-16 2016-17
**Ouachita Technical College (OTC) changed names in July 2011 and is now the College of the Ouachitas (COTO)
2006-07

49 Back to Table of Contents
TABLE 3.5 – DISTRIBUTION OF WORKFORCE 2000 FUNDS PURSUANT TO A.C.A § 26-51-205: 2004-05 TO 2016-17
Institution FY 2004-05 FY 2005-06 FY 2006-07 FY 2007-08 FY 2008-09 FY 2009-10 FY 2010-11 FY 2011-12 FY 2012-13 FY 2013-14 FY 2014-15 FY 2015-16 FY 2016-17
ASUJ-MT 349,860$ 497,940$ 663,768$ 653,789$ -$ -$ -$ -$ -$ -$ -$ -$ -$
ATU-OZARK 384,252$ 546,876$ 729,000$ 718,042$ 677,581$ 684,872$ 762,317$ 743,216$ 796,874$ 794,490$ 786,662$ 847,515$ 794,490$
UAM-CROSSETT 317,628$ 452,053$ 602,602$ 593,543$ 560,098$ 566,125$ 630,142$ 614,354$ 658,708$ 657,024$ 650,551$ 700,874$ 657,024$
UAM-MCGEHEE 341,640$ 486,227$ 648,158$ 638,415$ 602,440$ 608,923$ 677,779$ 660,798$ 708,504$ 706,097$ 699,139$ 753,222$ 706,096$
ANC 353,520$ 503,139$ 670,704$ 660,620$ 623,395$ 630,103$ 701,355$ 683,781$ 733,148$ 730,954$ 723,753$ 779,739$ 730,954$
ASUB 387,852$ 552,006$ 735,840$ 724,780$ 683,939$ 691,299$ 769,471$ 750,191$ 804,352$ 801,945$ 794,044$ 855,468$ 801,945$
ASUN 335,760$ 477,864$ 637,008$ 627,430$ 1,209,025$ 1,222,034$ 1,360,221$ 770,755$ 826,401$ 823,929$ 815,811$ 1,512,242$ 1,417,628$
ASUMS 1,059,624$ 1,508,077$ 2,010,324$ 1,980,098$ 1,868,522$ 1,888,628$ 2,102,194$ 2,049,520$ 2,197,489$ 2,190,914$ 2,169,328$ 2,337,138$ 2,190,914$
ASUMH 398,484$ 567,141$ 756,012$ 744,648$ 702,689$ 710,249$ 790,564$ 1,326,139$ 1,421,882$ 1,417,628$ 1,403,661$ 878,919$ 823,929$
BRTC 1,085,880$ 1,545,456$ 2,060,136$ 2,029,169$ 1,914,827$ 1,935,432$ 2,154,290$ 2,100,311$ 2,251,947$ 2,245,209$ 2,223,088$ 2,395,057$ 2,245,209$
CCCUA 653,076$ 929,484$ 1,239,036$ 1,220,404$ 1,151,636$ 1,164,028$ 1,295,656$ 1,263,191$ 1,354,390$ 1,350,337$ 1,337,033$ 1,440,460$ 1,350,337$
CotO* 559,272$ 795,978$ 1,061,064$ 1,045,116$ 986,225$ 996,837$ 1,109,559$ 1,081,757$ 1,159,857$ 1,156,386$ 1,144,993$ 1,233,565$ 1,156,386$
NAC 278,184$ 395,916$ 527,772$ 519,832$ 490,540$ 495,818$ 551,885$ 538,057$ 576,900$ 575,177$ 569,510$ 613,565$ 575,177$
NPCC 323,088$ 459,822$ 612,960$ 603,742$ 569,722$ 575,852$ 640,970$ 624,909$ 670,026$ 668,021$ 661,439$ 712,606$ 668,021$
OZC 615,120$ 875,454$ 1,167,000$ 1,149,461$ 1,084,690$ 1,096,362$ 1,220,338$ 1,189,761$ 1,275,658$ 1,271,841$ 1,259,310$ 1,356,725$ 1,271,841$
PCCUA 256,260$ 364,719$ 486,180$ 478,872$ 451,888$ 456,750$ 508,400$ 495,661$ 531,446$ 529,856$ 524,636$ 565,219$ 529,856$
PTC 1,099,692$ 1,565,112$ 2,086,344$ 2,054,983$ 1,939,188$ 1,960,054$ 2,181,697$ 2,127,031$ 2,280,596$ 2,273,772$ 2,251,370$ 2,425,526$ 2,273,772$
SACC 223,152$ 317,586$ 423,360$ 416,993$ 393,496$ 397,730$ 442,705$ 431,613$ 462,774$ 461,389$ 456,843$ 492,183$ 461,389$
SEAC 955,292$ 1,359,597$ 1,812,384$ 1,785,140$ 1,684,549$ 1,702,676$ 1,895,214$ 1,847,727$ 1,981,126$ 1,975,199$ 1,955,738$ 2,107,026$ 1,975,199$
UACCB 419,196$ 596,622$ 795,312$ 783,358$ 739,216$ 747,171$ 831,661$ 810,822$ 869,361$ 866,760$ 858,220$ 924,608$ 866,760$
UACCH 947,436$ 1,348,407$ 1,797,480$ 1,770,452$ 1,670,689$ 1,688,666$ 1,879,621$ 1,832,524$ 1,964,826$ 1,958,947$ 1,939,647$ 2,089,690$ 1,958,947$
UACCM 624,468$ 888,765$ 1,184,760$ 1,166,945$ 1,101,189$ 1,113,038$ 1,238,900$ 1,207,858$ 1,295,061$ 1,291,186$ 1,278,465$ 1,377,362$ 1,291,186$
TOTAL 11,968,736$ 17,034,241$ 22,707,204$ 22,365,832$ 21,105,544$ 21,332,646$ 23,744,939$ 23,149,976$ 24,821,326$ 24,747,060$ 24,503,241$ 26,398,709$ 24,747,060$ FY1997-98 through FY2002-03 Workforce 2000 distribution is based on the FY1996-97 percentage of institutional base to Total Base.FY 2008-09 ASUJ-MT merged with ASUN.*Ouachita Technical College (OTC) changed names in July 2011 and is now the College of the Ouachitas (COTO)

50 Back to Table of Contents
TABLE 3.6 – STATE FUNDS AVAILABLE TO HIGHER EDUCATION FOR CAPITAL EXPENDITURES BY BIENNIUM: 1991-93 THROUGH 2015-17
BIENNIUM 1991-93 1993-95 1995-97 1997-99 1999-01 2001-03 2003-05 2005-07 2007-09 2009-11 2011-13 2013-2015 2015-2017ASUJ 30,000$ 295,076$ 1,500,000$ 2,335,000$ 10,000,000$ 5,016,372$ 545,591$ 1,016,093$ 7,313,672$ 5,375,000$ 6,052,857$ 11,416,542$ 680,000$ ATU 300,000$ 124,307$ 1,750,000$ 1,000,000$ 1,900,000$ 1,246,150$ 245,044$ 693,262$ 1,527,071$ 200,000$ 110,000$ 4,500,000$ 642,500$ HSU -$ 906,940$ 462,692$ 1,000,000$ 5,000,000$ 745,388$ 105,019$ 268,262$ 177,071$ 450,000$ 40,000$ 3,100,000$ 312,500$ SAUM 25,000$ 109,749$ -$ 400,000$ 1,450,000$ 796,578$ 343,062$ 781,963$ 1,127,071$ 1,225,000$ -$ 1,655,000$ 500,000$ UAF -$ 482,312$ 2,000,000$ 1,250,000$ 11,305,000$ 2,500,995$ 315,056$ 1,860,778$ 5,998,340$ 2,950,000$ 95,000$ 1,455,000$ 217,000$ UAFS 800,000$ -$ -$ 2,000,000$ -$ 228,076$ -$ 768,262$ 698,500$ 860,000$ 42,857$ 5,350,000$ 500,000$ UA/ENTITIES -$ 60,154$ 2,650,000$ 1,550,000$ 685,000$ 250,547$ -$ 1,196,251$ 7,358,500$ 2,230,000$ 2,060,714$ 10,470,000$ 1,823,000$ UALR 25,000$ 772,417$ 650,000$ 500,000$ -$ 303,550$ 210,038$ 542,093$ 6,438,672$ 410,000$ 15,522,000$ 4,900,000$ 550,000$ UAM -$ 222,538$ -$ 400,000$ 1,000,000$ 1,267,718$ -$ 656,963$ 3,832,928$ 1,430,000$ 70,000$ 1,455,000$ 300,000$ UAMS 400,000$ 1,119,204$ 256,875$ 850,000$ -$ 689,854$ 70,013$ 1,732,523$ 1,684,806$ 2,032,000$ 270,714$ 6,465,000$ 70,000$ UAPB -$ 1,353,650$ -$ 3,200,000$ 100,000$ 629,360$ -$ 993,262$ 777,071$ 632,000$ 22,500$ 2,750,000$ -$ UCA -$ 197,934$ 1,500,000$ 1,000,000$ 8,000,000$ 880,234$ 494,023$ 1,157,093$ 638,672$ 300,000$ 140,000$ 5,200,000$ 1,100,000$ Subtotal Universities 780,000$ 5,644,281$ 10,769,567$ 13,485,000$ 39,440,000$ 14,554,822$ 2,327,846$ 11,666,804$ 37,572,372$ 18,094,000$ 24,426,642$ 58,716,542$ 6,695,000$ ANC (MCCC) -$ -$ -$ 500,000$ 500,000$ 654,623$ -$ 479,065$ 284,668$ 600,000$ 50,000$ 425,000$ 100,000$ ASUB -$ 18,878$ 400,000$ 1,000,000$ 1,350,000$ 907,154$ 377,368$ 1,595,658$ 613,535$ 300,000$ 75,000$ 400,000$ 20,000$ ASUMS (MSCC) -$ -$ 2,000,000$ 718,354$ 1,500,000$ 716,730$ 367,566$ 282,065$ 2,229,668$ 315,000$ 7,000$ 550,000$ -$ ASUMH -$ -$ -$ 1,044,513$ 1,050,000$ 299,401$ -$ 448,115$ 860,382$ 529,000$ 61,428$ 600,000$ 50,000$ ASUN -$ -$ 800,000$ 537,504$ -$ 173,707$ 122,522$ 212,065$ 352,668$ 392,000$ -$ 450,000$ 80,000$ BRTC -$ 264,149$ 2,750,000$ 1,721,290$ 600,000$ 495,682$ 192,535$ 266,766$ 284,668$ 100,000$ 41,429$ 395,000$ 20,000$ CCCUA -$ 14,565$ -$ 422,949$ 1,139,000$ 341,787$ 84,509$ 517,065$ 159,668$ 348,000$ 25,000$ 4,040,834$ 42,500$ CotO (OTC) -$ 24,681$ -$ 62,468$ 600,000$ 87,307$ 30,738$ 142,065$ 234,668$ 100,000$ -$ 250,000$ -$ EACC -$ -$ -$ -$ 350,000$ 547,063$ 157,529$ 271,065$ 159,668$ 400,000$ 35,000$ 600,000$ 200,000$ NAC -$ -$ -$ 531,073$ -$ 136,544$ 87,516$ 447,115$ 895,382$ 1,029,000$ 111,428$ 600,000$ 50,000$ NPC (GCCC) -$ -$ -$ -$ -$ 16,491$ 87,516$ 266,565$ 109,668$ 957,000$ -$ 250,000$ -$ NWACC 250,000$ -$ -$ -$ 1,000,000$ 735,601$ 375,605$ 355,832$ 1,090,469$ 605,000$ 22,000$ 850,000$ 10,000$ OZC -$ 5,816$ 500,000$ 568,708$ 500,000$ 435,156$ 280,861$ 194,065$ 309,668$ 600,000$ 41,429$ 350,000$ 20,000$ PCCUA -$ -$ 250,000$ 428,621$ -$ 202,365$ 87,516$ 143,892$ 209,668$ 240,000$ 7,000$ 250,000$ -$ PTC -$ 13,506$ -$ 622,834$ 2,000,000$ 312,555$ 483,088$ 778,262$ 1,047,071$ 755,000$ 45,000$ 850,000$ -$ RMCC -$ -$ -$ -$ -$ 206,945$ -$ 366,391$ 159,668$ 496,000$ 25,000$ 365,833$ 62,500$ SACC -$ -$ -$ 24,924$ 2,000,000$ 59,983$ 87,516$ 557,065$ 159,668$ 300,000$ -$ 322,500$ 40,000$ SAUT -$ 355,912$ 50,000$ 800,000$ 350,000$ 179,325$ 87,516$ 312,065$ 188,535$ 1,130,000$ 70,000$ 482,500$ 25,000$ SEAC -$ 9,289$ -$ 606,701$ 1,286,000$ 140,961$ 87,516$ 287,065$ 109,668$ 100,000$ 25,000$ 250,000$ -$ UACCB -$ 23,981$ 1,500,000$ 546,825$ 100,000$ 213,394$ 281,420$ 117,065$ 444,668$ 300,000$ -$ 250,000$ -$ UACCH -$ 14,094$ -$ 705,825$ 2,000,000$ 235,269$ -$ 267,440$ 409,668$ 296,000$ 97,857$ 4,040,833$ 42,500$ UACCM -$ 46,038$ -$ 664,752$ 500,000$ 115,940$ 87,516$ 67,065$ 109,668$ 100,000$ 35,000$ 350,000$ -$ Subtotal Colleges 250,000$ 790,909$ 8,250,000$ 11,507,341$ 16,825,000$ 7,213,983$ 3,366,353$ 8,373,822$ 10,423,063$ 9,992,000$ 774,571$ 16,922,500$ 762,500$ TOTAL 1,030,000$ 6,435,190$ 19,019,567$ 24,992,341$ 56,265,000$ 21,768,805$ 5,694,199$ 20,040,626$ 47,995,435$ 28,086,000$ 25,201,213$ 75,639,042$ 7,457,500$ Source: DFA Capital Improvement Release Files. Note: Totals include General Improvement Fund and Mineral Lease Fund.For 1999-01 totals do not include $5,663,992 in GIF released for general operation projects.For 2001-03 totals do not include $9,290,085 in GIF released for general operation projects.For 2005-07 totals do not include $198,000 in GIF released for general operation projects.For 2007-09 totals do not include $8,338,371 in GIF released for general operation projects. For 2009-11 totals do not include $6,106,000 in GIF released for general operation projects. For 2011-13 totals do not include $2,117,914 in GIF released for general operation projects.For 2013-15 totals do not include $695,000 in GIF released for general operation projects.For 2015-17 totals do not include $854,000 in GIF released for general operation projects.In September of 2006, the threshold for the Higher Education Building Maintenance Fund was reached at $13,200,000. These Mineral Lease Funds will now be allocated to the Higher Education Research Development Fund to be distributed to the universities for research related expenses.

51 Back to Table of Contents
TABLE 3.7 – GENERAL REVENUE RECEIVED AS A PERCENTAGE OF TOTAL CURRENT FUND REVENUE: 2003-2016
10 yr.2003 2004 2005 2006 2007 2008 2009 2010 2011 2012 2013 2014 2015 2016 Avg.
UniversitiesASUJ 38.1% 37.5% 36.3% 35.1% 34.9% 34.5% 30.0% 27.3% 24.4% 25.0% 24.9% 26.2% 25.9% 25.4% 27.9%ATU 33.6% 33.5% 32.3% 33.4% 33.2% 32.2% 31.9% 27.5% 23.8% 23.3% 22.3% 22.1% 19.9% 19.7% 25.6%HSU 38.7% 38.7% 38.3% 38.0% 36.6% 35.1% 33.6% 31.0% 27.0% 26.8% 27.1% 27.0% 27.0% 26.4% 29.8%SAUM 36.1% 37.0% 36.0% 35.2% 34.2% 34.0% 33.1% 29.1% 26.7% 26.7% 26.1% 25.3% 24.1% 20.9% 28.0%UAF 27.8% 26.9% 26.1% 24.7% 24.2% 25.4% 24.9% 23.1% 21.0% 19.3% 18.2% 18.6% 17.5% 16.7% 20.9%UAFS 37.8% 36.8% 34.0% 33.6% 32.9% 32.2% 30.2% 26.5% 22.9% 22.9% 22.3% 22.9% 23.4% 23.4% 26.0%UALR 37.2% 36.0% 37.9% 37.5% 37.3% 37.4% 37.2% 32.7% 30.7% 30.4% 29.4% 30.5% 30.7% 30.7% 32.7%UAM 36.5% 38.9% 38.0% 39.8% 39.7% 39.4% 38.1% 33.5% 31.7% 30.5% 31.6% 32.2% 27.5% 28.5% 33.2%UAPB 32.3% 33.7% 33.2% 34.6% 35.4% 34.0% 31.3% 28.1% 30.3% 28.6% 30.0% 27.4% 29.5% 28.0% 30.3%UCA 38.2% 34.9% 33.0% 30.3% 29.2% 32.2% 28.9% 28.4% 26.9% 27.1% 26.5% 27.9% 25.9% 25.4% 27.8%
35.6% 35.4% 34.5% 34.2% 33.7% 33.7% 31.9% 28.7% 26.5% 26.1% 25.8% 26.0% 25.1% 24.5% 28.2%Colleges
ANC 41.6% 45.7% 48.3% 49.0% 50.1% 47.5% 46.1% 40.5% 40.0% 40.6% 46.6% 52.3% 53.7% 52.0% 46.9%ASUB 42.3% 41.0% 41.7% 42.6% 41.2% 39.2% 37.3% 34.5% 32.9% 33.3% 33.5% 34.3% 34.4% 35.9% 35.6%ASUMS 39.0% 38.9% 38.0% 42.2% 42.1% 42.3% 35.4% 27.2% 23.2% 29.0% 25.1% 22.7% 30.9% 30.7% 30.9%ASUMH 43.0% 43.0% 43.1% 44.5% 47.5% 46.3% 43.3% 39.1% 38.9% 36.5% 37.1% 38.5% 38.0% 37.5% 40.3%ASUN 35.4% 36.0% 35.0% 35.7% 37.0% 38.7% 42.0% 38.5% 36.6% 35.9% 36.1% 37.7% 36.0% 33.7% 37.2%BRTC 44.3% 44.0% 43.0% 45.7% 45.7% 42.3% 41.2% 33.1% 29.0% 28.6% 31.9% 33.0% 36.4% 40.7% 36.2%CCCUA 35.4% 34.8% 33.8% 35.5% 38.2% 38.1% 35.5% 32.3% 29.7% 33.1% 33.2% 32.8% 33.4% 33.1% 33.9%CotO 38.4% 38.5% 36.8% 36.8% 37.7% 37.1% 35.9% 33.5% 30.8% 31.1% 32.3% 29.9% 27.7% 27.9% 32.4%EACC 48.3% 47.7% 46.1% 47.4% 44.1% 44.2% 43.6% 38.6% 39.1% 42.1% 41.9% 44.3% 42.6% 45.2% 42.6%NAC 43.6% 42.1% 41.0% 41.1% 43.1% 42.4% 39.1% 33.1% 26.7% 27.8% 28.9% 30.1% 33.1% 34.9% 33.9%NPCC 42.4% 42.8% 43.7% 49.3% 43.4% 40.7% 40.2% 32.2% 28.7% 20.7% 24.8% 26.1% 27.3% 31.0% 31.5%NWACC 34.9% 33.5% 31.7% 27.0% 27.1% 28.3% 24.8% 20.1% 17.4% 18.1% 17.4% 18.5% 19.1% 20.3% 21.1%OZC 34.1% 35.5% 36.0% 36.4% 40.5% 35.9% 32.2% 28.9% 24.4% 24.0% 25.1% 27.3% 29.5% 32.1% 30.0%PCCUA 46.4% 45.8% 48.4% 49.2% 47.8% 43.3% 41.4% 36.9% 37.9% 43.5% 43.5% 43.6% 43.5% 44.9% 42.6%PTC 30.0% 27.0% 24.8% 23.7% 26.0% 29.8% 26.4% 21.1% 18.5% 18.2% 18.7% 20.9% 22.2% 25.2% 22.7%RMCC 33.7% 36.5% 37.4% 36.9% 36.8% 37.6% 37.5% 33.7% 30.8% 31.8% 32.8% 31.9% 32.3% 32.3% 33.7%SACC 51.4% 49.6% 47.0% 47.2% 46.4% 44.7% 41.8% 34.8% 31.5% 30.3% 31.4% 32.5% 32.8% 34.9% 36.1%SAUT 52.6% 51.0% 49.2% 48.3% 48.1% 48.5% 45.4% 41.3% 38.0% 35.3% 37.3% 35.4% 34.3% 35.6% 39.9%SEAC 38.3% 39.7% 41.1% 43.7% 45.9% 46.1% 46.5% 41.6% 34.9% 36.9% 41.5% 41.9% 41.8% 41.8% 41.9%UACCB 34.1% 35.3% 32.4% 34.4% 37.9% 35.4% 32.7% 25.8% 25.5% 27.5% 29.1% 31.2% 31.6% 0.0% 27.7%UACCH 48.5% 48.6% 48.4% 51.2% 54.5% 49.1% 46.1% 40.5% 39.5% 41.0% 40.4% 40.9% 41.8% 38.9% 43.3%UACCM 36.0% 35.8% 34.8% 36.7% 38.6% 37.0% 33.8% 27.2% 24.9% 25.8% 28.5% 29.3% 29.9% 29.2% 30.4%
40.6% 40.6% 40.1% 41.1% 41.8% 40.7% 38.6% 33.4% 30.9% 31.4% 32.6% 33.4% 34.2% 33.5% 35.0%
Source: ADHE Series 17-1.Note: Calculation now takes unrestricted and restricted state appropriation divided by total current fund revenue.

52 Back to Table of Contents
SECTION 4.
CURRENT FUND REVENUES AND EXPENDITURES BY INSTITUTION: 2007-08 THROUGH 2015-16

53 Back to Table of Contents
TABLE 4.1 – TOTAL CURRENT FUND REVENUES AND EXPENDITURES FISCAL YEAR 2007
Notes: 1. Includes ASU Heritage Sites 2. Includes Ozark Campus 3. Includes Community Education Center (CEC) 4. Fayetteville Campus Only 5. Includes Research and Public Service (RAPS). 6. Includes Crossett and McGehee Campuses 7. Includes 1890 Land Grant Universities Match 8. Includes AR Fire Training Academy and AR Environmental Training Academy
Unrestr. Restricted Unrestr. Restricted Educ. and Educ. and Educ. and Educ. and
Institution General Auxiliary General Total General Auxiliary General TotalUniversitiesASUJ1 114,608,260 21,320,831 40,262,796 176,191,887 114,773,311 21,602,772 40,658,781 177,034,864 ATU2 60,766,812 13,457,943 15,328,743 89,553,498 59,765,898 12,657,368 15,305,819 87,729,085 HSU3 37,530,396 6,967,879 8,964,534 53,462,809 37,401,580 6,967,879 9,006,338 53,375,797 SAUM 30,850,381 6,457,328 7,976,266 45,283,975 29,442,238 6,385,667 8,000,671 43,828,576 UAF4 242,171,765 107,117,728 117,756,212 467,045,705 241,293,295 107,062,327 120,060,422 468,416,044 UAFS 44,175,652 8,744,967 11,940,640 64,861,259 43,758,868 8,693,309 11,891,069 64,343,246 UALR5 117,428,031 9,773,640 37,609,486 164,811,157 117,375,526 9,750,631 38,224,258 165,350,415 UAM6 23,185,797 4,872,988 8,094,990 36,153,775 23,373,092 4,740,039 8,087,844 36,200,975 UAPB7 39,838,927 9,789,752 23,734,930 73,363,609 39,388,729 9,739,429 24,644,099 73,772,257 UCA 113,568,742 31,816,219 22,338,554 167,723,515 119,228,912 29,711,632 22,500,517 171,441,061 Subtotal 824,124,763 220,319,275 294,007,151 1,338,451,188 825,801,449 217,311,052 298,379,819 1,341,492,320
CollegesANC (MCCC) 12,998,647 72,708 5,911,615 18,982,970 11,730,708 (11,318) 5,825,094 17,544,484 ASUB 22,733,772 2,672,169 7,160,894 32,566,835 22,666,733 2,540,658 7,182,944 32,390,335 ASUMH 7,358,351 357,398 509,045 8,224,794 7,224,986 322,893 592,815 8,140,694 ASUN 6,979,742 388,422 2,187,817 9,555,981 6,743,701 392,994 2,171,442 9,308,137 BRTC 11,366,773 852,235 4,220,270 16,439,278 11,186,602 716,666 4,246,516 16,149,784 CCCUA 6,814,943 144,282 3,878,701 10,837,926 6,179,110 144,282 3,852,153 10,175,545 OTC 6,340,930 499,386 4,181,906 11,022,221 6,270,741 420,145 4,091,794 10,782,680 EACC 8,729,286 684,112 4,600,173 14,013,571 7,943,987 661,635 4,622,000 13,227,622 MSCC8 8,001,951 77,807 4,922,654 13,002,412 7,127,304 110,762 5,121,754 12,359,821 NAC 11,822,086 1,141,139 6,518,171 19,481,396 11,667,037 1,210,309 6,469,002 19,346,348 NPCC (GCCC) 13,959,729 1,432,549 7,821,108 23,213,386 13,781,386 1,411,062 7,799,418 22,991,866 NWACC 26,442,730 - 6,311,087 32,753,817 27,216,295 - 6,312,167 33,528,462 OZC 5,643,323 587,217 3,052,008 9,282,548 5,452,895 646,771 3,039,496 9,139,162 PCCUA 14,848,634 142,287 5,900,045 20,890,966 14,704,771 173,251 5,668,252 20,546,274 PTC 28,892,238 790,075 18,349,058 48,031,371 28,120,076 779,842 17,914,421 46,814,339 RMCC 5,016,839 186,972 3,530,692 8,734,503 4,428,602 328,066 3,526,868 8,283,536 SACC 9,612,867 839,997 3,551,015 14,003,879 9,259,286 730,192 3,513,379 13,502,857 SAUT9 8,802,320 457,406 3,114,997 12,374,723 8,539,849 460,531 3,140,659 12,141,039 SEAC 9,972,030 - 5,044,225 15,016,255 14,827,647 - 4,992,329 19,819,976 UACCB 7,924,014 727,349 2,914,893 11,566,256 7,282,668 669,075 2,918,213 10,869,956 UACCH 7,902,869 37,278 2,883,266 10,823,413 7,858,767 380 2,893,852 10,752,999 UACCM 9,890,545 1,099,499 3,039,816 14,029,860 9,184,516 993,487 3,017,775 13,195,778 Subtotal 252,054,619 13,190,287 109,603,456 374,848,361 249,397,668 12,701,684 108,912,343 371,011,694
Total 1,076,179,382 233,509,561 403,610,607 1,713,299,550 1,075,199,117 230,012,736 407,292,162 1,712,504,014
Source: ADHE Series 17-1 and 17-2.
Revenue Expenditures

54 Back to Table of Contents
TABLE 4.2 – TOTAL CURRENT FUND REVENUES AND EXPENDITURES FISCAL YEAR 2008
Notes: 1. Includes ASU Heritage Sites 2. Includes Ozark Campus 3. Includes Community Education Center (CEC) 4. Fayetteville Campus Only 5. Includes Research and Public Service (RAPS). 6. Includes Crossett and McGehee Campuses 7. Includes 1890 Land Grant Universities Match 8. Includes Arkansas Delta Training and Education Consortium (ADTEC) 9. Includes AR Fire Training Academy and AR Environmental Training Academy
Unrestr. Restricted Unrestr. Restricted Educ. and Educ. and Educ. and Educ. and
Institution General Auxiliary General Total General Auxiliary General TotalUniversitiesASUJ1 122,913,822 23,002,586 45,948,868 191,865,277 121,812,532 23,092,756 42,788,774 187,694,062 ATU2 66,929,302 13,457,943 16,740,120 97,127,365 72,599,813 15,230,369 16,707,292 104,537,474 HSU3 40,441,558 9,297,492 9,172,911 58,911,961 40,392,167 9,297,492 7,859,770 57,549,429 SAUM 33,212,447 7,165,666 8,254,249 48,632,362 32,897,296 6,451,492 8,186,847 47,535,635 UAF4 259,910,183 114,707,937 109,418,358 484,036,478 260,162,623 110,617,271 108,231,320 479,011,214 UAFS 49,933,504 9,470,617 12,850,282 72,254,403 49,665,435 9,396,020 12,558,533 71,619,988 UALR5 126,029,906 10,354,462 41,820,767 178,205,135 126,196,710 10,338,121 40,418,879 176,953,710 UAM6 24,268,199 4,934,403 8,911,806 38,114,408 24,790,194 4,904,076 8,906,942 38,601,212 UAPB7 42,149,763 10,711,661 26,558,275 79,419,699 41,257,985 10,272,800 24,359,316 75,890,101 UCA 124,863,254 31,820,181 23,117,988 179,801,423 119,425,150 32,405,438 22,598,942 174,429,530 Subtotal 890,651,938 234,922,948 302,793,625 1,428,368,511 889,199,905 232,005,834 292,616,615 1,413,822,354
CollegesANC (MCCC) 15,088,728 80,406 6,614,737 21,783,871 15,669,624 19,065 6,804,767 22,493,456 ASUB 24,802,455 2,800,092 7,847,825 35,450,372 24,777,338 2,684,955 7,804,707 35,267,000 ASUMH 8,048,602 345,522 1,223,386 9,617,510 7,986,100 307,619 1,036,096 9,329,815 ASUN 8,007,245 417,647 2,555,404 10,980,296 7,386,857 370,513 2,375,855 10,133,225 BRTC 12,501,158 1,034,352 4,954,801 18,490,311 18,301,574 1,364,294 4,860,739 24,526,607 CCCUA 7,758,704 - 4,222,160 11,980,864 9,116,647 - 4,128,581 13,245,228 OTC 7,094,130 544,214 4,702,687 12,341,031 6,452,447 550,246 4,695,272 11,697,965 EACC 9,319,488 715,388 4,801,002 14,835,878 11,153,804 1,111,381 4,598,774 16,863,959 MSCC8 8,937,743 83,811 5,638,854 14,660,408 10,007,526 83,811 5,541,892 15,633,229 NAC 12,447,996 1,234,955 7,516,732 21,199,683 12,115,034 1,295,587 7,345,456 20,756,077 NPCC (GCCC 15,520,145 1,590,652 10,591,740 27,702,537 15,227,603 1,467,105 10,592,158 27,286,866 NWACC 29,726,904 563,222 7,685,957 37,976,083 28,062,941 98,767 7,646,535 35,808,243 OZC 6,763,061 825,808 4,066,191 11,655,060 6,746,440 846,495 3,943,163 11,536,098 PCCUA 16,165,043 132,927 7,365,425 23,663,395 15,752,703 121,656 7,231,349 23,105,708 PTC 34,596,685 951,755 20,766,061 56,314,501 31,931,849 857,152 20,648,961 53,437,962 RMCC 4,924,344 242,835 3,887,475 9,054,654 6,115,757 151,032 3,796,283 10,063,072 SACC 10,057,069 851,211 4,460,945 15,369,225 10,758,957 749,640 4,458,403 15,967,000 SAUT9 9,303,012 510,208 3,710,266 13,523,486 8,974,237 486,552 3,548,064 13,008,853 SEAC 10,357,678 - 5,599,692 15,957,370 11,366,968 - 5,448,380 16,815,348 UACCB 8,765,094 931,025 3,921,875 13,617,994 8,941,077 839,981 3,819,819 13,600,877 UACCH 9,005,594 - 3,611,322 12,616,916 8,674,031 419 3,599,565 12,274,015 UACCM 10,549,331 1,226,728 3,889,349 15,665,408 10,080,625 1,235,086 3,604,719 14,920,430 Subtotal 279,740,209 15,082,758 129,633,886 424,456,852 285,600,138 14,641,356 127,529,539 427,771,033
Total 1,170,392,147 250,005,706 432,427,511 1,852,825,364 1,174,800,043 246,647,190 420,146,154 1,841,593,387
Source: ADHE Series 17-1 and 17-2.
Revenue Expenditures

55 Back to Table of Contents
TABLE 4.3 – TOTAL CURRENT FUND REVENUES AND EXPENDITURES FISCAL YEAR 2009
Notes: 1. Includes ASU Heritage Sites 2. Includes Ozark Campus 3. Includes Community Education Center (CEC) 4. Fayetteville Campus Only 5. Includes Research and Public Service (RAPS). 6. Includes Crossett and McGehee Campuses 7. Includes 1890 Land Grant Universities Match 8. Includes Arkansas Delta Training and Education Consortium (ADTEC) 9. Includes AR Fire Training Academy and AR Environmental Training Academy
Unrestr. Restricted Unrestr. Restricted Educ. and Educ. and Educ. and Educ. and
Institution General Auxiliary General Total General Auxiliary General TotalUniversitiesASUJ1 130,764,503 24,206,832 54,073,100 209,044,435 130,385,209 23,990,903 51,261,855 205,637,967 ATU2 67,297,202 13,457,943 17,096,307 97,851,452 65,941,871 14,756,879 17,101,440 97,800,190 HSU3 42,154,735 9,545,331 10,230,317 61,930,383 41,166,496 9,120,647 11,464,183 61,751,326 SAUM 34,022,483 7,442,689 8,796,185 50,261,357 34,775,747 7,758,527 8,814,458 51,348,732 UAF4 272,853,446 112,740,525 110,251,436 495,845,407 268,665,465 113,943,606 112,734,487 495,343,558 UAFS 52,512,310 8,856,306 15,698,132 77,066,748 52,779,409 8,192,136 15,998,956 76,970,501 UALR5 130,583,464 10,983,846 38,259,288 179,826,598 129,661,715 10,935,707 42,511,610 183,109,032 UAM6 24,835,764 5,384,258 9,643,608 39,863,630 25,855,253 5,357,036 9,643,635 40,855,924 UAPB7 45,385,088 12,710,448 28,540,209 86,635,745 42,371,584 12,715,689 28,309,020 83,396,293 UCA 132,850,087 33,467,590 26,612,490 192,930,167 138,565,514 41,217,911 25,909,714 205,693,139 Subtotal 933,259,082 238,795,768 319,201,072 1,491,255,922 930,168,263 247,989,040 323,749,359 1,501,906,662
CollegesANC (MCCC) 14,745,234 87,397 6,944,816 21,777,447 15,013,458 44,765 6,697,586 21,755,809 ASUB 26,334,210 2,995,757 8,531,435 37,861,402 26,336,594 2,860,190 8,519,026 37,715,810 ASUMH 8,803,238 421,675 1,056,996 10,281,909 8,768,090 379,426 1,155,600 10,303,116 ASUN 11,925,722 620,709 4,328,472 16,874,903 10,717,575 548,979 4,315,404 15,581,958 BRTC 12,360,923 1,045,995 5,625,755 19,032,673 11,270,211 874,507 5,679,147 17,823,865 CCCUA 8,190,251 - 4,235,262 12,425,513 8,105,875 - 4,288,126 12,394,001 OTC 6,813,328 626,677 4,910,810 12,350,815 7,259,046 532,959 4,864,968 12,656,973 EACC 9,192,398 658,570 5,153,260 15,004,228 8,813,816 627,665 5,267,541 14,709,022 MSCC8 9,022,986 201,323 8,422,703 17,647,012 9,267,948 201,323 8,074,077 17,543,348 NAC 12,936,685 1,417,116 8,339,704 22,693,505 13,199,870 1,426,549 8,496,608 23,123,027 NPCC (GCCC) 16,613,085 1,927,101 8,914,923 27,455,109 16,181,936 1,725,824 8,966,700 26,874,460 NWACC 32,980,292 317,484 9,217,828 42,515,603 30,945,519 74,333 9,218,846 40,238,698 OZC 7,132,718 837,270 4,408,096 12,378,085 6,912,149 830,639 4,299,529 12,042,317 PCCUA 16,610,716 139,167 7,880,350 24,630,233 15,828,648 134,662 7,871,125 23,834,435 PTC 35,866,560 863,872 22,515,547 59,245,979 33,886,246 802,149 22,624,424 57,312,819 RMCC 4,849,865 251,604 3,898,481 8,999,950 4,751,796 313,178 4,099,132 9,164,106 SACC 10,425,762 901,952 5,122,624 16,450,338 10,357,999 867,094 5,457,193 16,682,286 SAUT9 10,272,886 555,167 3,985,366 14,813,419 9,740,418 529,659 4,214,930 14,485,007 SEAC 11,170,961 - 7,998,780 19,169,741 11,166,328 - 8,086,801 19,253,129 UACCB 9,048,620 1,025,988 4,314,256 14,388,864 8,935,199 992,159 4,251,930 14,179,288 UACCH 8,769,091 46,109 4,400,070 13,215,270 8,695,105 210 4,415,144 13,110,459 UACCM 11,180,774 1,365,692 4,505,156 17,051,622 11,748,617 1,316,234 4,418,328 17,483,179 Subtotal 295,246,305 16,306,625 144,710,690 456,263,620 287,902,442 15,082,504 145,282,165 448,267,111
Total 1,228,505,387 255,102,393 463,911,762 1,947,519,542 1,218,070,705 263,071,545 469,031,524 1,950,173,773
Source: ADHE Series 17-1 and 17-2.
Revenue Expenditures

56 Back to Table of Contents
TABLE 4.4 – TOTAL CURRENT FUND REVENUES AND EXPENDITURES FISCAL YEAR 2010
Notes: 1. Includes ASU Heritage Sites 2. Includes Ozark Campus 3. Includes Community Education Center (CEC) 4. Fayetteville Campus Only 5. Includes Research and Public Service (RAPS). 6. Includes Crossett and McGehee Campuses 7. Includes 1890 Land Grant Universities Match 8. Includes Arkansas Delta Training and Education Consortium (ADTEC) 9. Includes AR Fire Training Academy and AR Environmental Training Academy
Unrestr. Restricted Unrestr. Restricted Educ. and Educ. and Educ. and Educ. and
Institution General Auxiliary General Total General Auxiliary General TotalUniversitiesASUJ1 141,075,967 25,869,907 63,211,328 230,157,202 136,052,598 26,060,340 64,157,452 226,270,390 ATU2 71,269,659 17,533,095 24,820,571 113,623,325 68,876,612 16,657,598 24,797,724 110,331,934 HSU3 42,735,883 10,094,056 13,116,271 65,946,210 40,920,368 9,894,650 13,036,704 63,851,722 SAUM 35,954,084 8,348,129 11,687,666 55,989,879 35,667,878 7,876,911 11,657,003 55,201,792 UAF4 282,592,084 122,259,266 124,058,607 528,909,957 261,654,828 120,938,121 122,455,091 505,048,040 UAFS 55,028,478 8,025,121 23,136,340 86,189,939 54,876,559 7,714,214 23,047,126 85,637,898 UALR5 136,833,862 10,757,716 53,262,369 200,853,947 136,730,688 10,643,129 52,694,266 200,068,083 UAM6 26,186,805 5,747,939 12,839,829 44,774,573 25,729,554 5,667,846 12,864,896 44,262,296 UAPB7 46,969,299 13,412,734 35,760,615 96,142,648 44,239,565 13,593,193 36,189,585 94,022,343 UCA 127,398,848 31,423,706 38,080,780 196,903,334 120,894,286 29,530,117 38,382,154 188,806,557 Subtotal 966,044,968 253,471,669 399,974,376 1,619,491,013 925,642,936 248,576,118 399,282,001 1,573,501,056
CollegesANC (MCCC) 14,972,546 110,180 8,907,064 23,989,790 12,916,459 38,279 8,920,068 21,874,806 ASUB 26,031,197 2,996,367 11,081,388 40,108,952 25,596,310 2,761,487 10,862,219 39,220,016 ASUMH 9,631,195 642,771 1,655,171 11,929,137 9,778,617 590,402 1,567,845 11,936,864 ASUN 12,131,350 692,872 6,383,061 19,207,283 10,687,569 644,290 5,791,270 17,123,129 BRTC 12,806,173 1,483,725 9,265,260 23,555,158 15,261,199 1,786,468 9,189,783 26,237,450 CCCUA 8,432,408 - 5,234,106 13,666,514 7,800,017 - 5,301,383 13,101,400 OTC 7,147,349 689,066 6,477,607 14,314,022 7,505,813 563,845 6,160,750 14,230,408 EACC 9,634,104 764,314 6,137,374 16,535,792 10,154,492 698,955 6,266,323 17,119,771 MSCC8 10,392,919 268,367 13,367,286 24,028,572 10,135,184 274,920 13,162,781 23,572,885 NAC 13,300,508 1,756,729 11,740,738 26,797,975 13,434,612 1,641,850 11,552,790 26,629,252 NPCC (GCCC 18,320,533 2,404,798 13,631,357 34,356,688 18,417,642 2,659,680 13,506,438 34,583,760 NWACC 37,326,153 377,705 14,545,615 52,249,473 34,737,506 83,500 14,510,377 49,331,383 OZC 7,482,464 911,789 5,876,727 14,270,980 6,939,179 950,580 5,919,556 13,809,315 PCCUA 16,037,730 156,354 10,949,647 27,143,731 15,211,965 155,410 10,542,424 25,909,799 PTC 41,313,893 485,648 34,738,114 76,537,655 38,242,705 195,509 33,709,424 72,147,638 RMCC 5,147,462 293,946 4,792,588 10,233,996 5,243,134 361,055 4,871,254 10,475,444 SACC 11,015,279 1,182,681 7,163,867 19,361,827 10,967,986 1,042,722 7,077,373 19,088,081 SAUT9 10,578,617 626,489 5,385,845 16,590,951 10,252,463 634,994 5,379,990 16,267,447 SEAC 11,419,433 - 8,252,407 19,671,840 11,693,538 - 8,198,931 19,892,469 UACCB 9,719,030 1,233,945 7,151,003 18,103,978 9,442,418 1,154,578 7,023,073 17,620,069 UACCH 8,965,797 53,391 5,958,159 14,977,347 8,879,517 500 5,961,443 14,841,460 UACCM 12,360,362 1,732,107 7,265,991 21,358,460 13,050,254 1,749,342 7,139,248 21,938,843 Subtotal 314,166,501 18,863,245 205,960,375 538,990,121 306,348,579 17,988,365 202,614,744 526,951,688
Total 1,280,211,470 272,334,914 605,934,751 2,158,481,134 1,231,991,515 266,564,484 601,896,745 2,100,452,744
Source: ADHE Series 17-1 and 17-2.
Revenue Expenditures

57 Back to Table of Contents
TABLE 4.5 – TOTAL CURRENT FUND REVENUES AND EXPENDITURES FISCAL YEAR 2011
Notes: 1. Includes ASU Heritage Sites 2. Includes Ozark Campus 3. Includes Community Education Center (CEC) 4. Fayetteville Campus Only 5. Includes Research and Public Service (RAPS). 6. Includes Crossett and McGehee Campuses 7. Includes 1890 Land Grant Universities Match 8. Includes Arkansas Delta Training and Education Consortium (ADTEC) 9. Includes AR Fire Training Academy and AR Environmental Training Academy
Unrestr. Restricted Unrestr. Restricted Educ. and Educ. and Educ. and Educ. and
Institution General Auxiliary General Total General Auxiliary General TotalUniversitiesASUJ1 148,916,052 26,322,509 82,296,391 257,534,952 141,011,347 26,579,963 84,249,307 251,840,617 ATU2 82,828,490 19,103,395 40,906,315 142,838,200 76,067,460 18,168,739 40,925,641 135,161,840 HSU3 46,065,422 11,062,637 20,651,766 77,779,825 43,570,581 10,925,058 18,513,910 73,009,549 SAUM 38,175,175 9,245,902 14,641,936 62,063,013 38,703,980 8,460,896 14,613,684 61,778,560 UAF4 299,742,998 135,753,092 153,357,378 588,853,468 294,326,927 126,920,415 152,076,158 573,323,500 UAFS 58,824,693 10,439,818 32,159,301 101,423,812 58,461,396 12,229,984 31,965,805 102,657,185 UALR5 142,197,060 11,506,314 64,134,845 217,838,219 140,781,513 11,465,570 63,979,237 216,226,320 UAM6 33,352,110 6,600,594 17,220,457 57,173,161 33,082,224 6,507,405 17,090,755 56,680,384 UAPB7 50,117,701 13,149,229 37,550,716 100,817,646 45,158,022 11,973,562 37,219,502 94,351,086 UCA 128,698,289 32,749,148 48,884,696 210,332,133 125,887,141 30,028,411 48,467,934 204,383,486 Subtotal 1,028,917,990 275,932,638 511,803,801 1,816,654,429 997,050,591 263,260,003 509,101,933 1,769,412,527
CollegesANC (MCCC) 14,669,394 111,195 10,122,645 24,903,234 16,487,202 46,472 10,133,051 26,666,725 ASUB 27,224,274 2,865,231 12,857,662 42,947,167 27,005,939 2,653,326 13,074,424 42,733,689 ASUMH 10,368,423 640,764 1,844,412 12,853,599 10,325,005 587,563 1,833,030 12,745,598 ASUN 12,825,228 641,543 6,604,121 20,070,892 14,713,396 581,214 6,789,606 22,084,216 BRTC 15,313,634 1,771,714 11,046,845 28,132,193 15,416,073 1,403,138 11,089,579 27,908,790 CCCUA 8,936,116 - 6,652,886 15,589,002 8,406,596 - 6,670,435 15,077,031 OTC 7,476,993 687,683 7,189,411 15,354,087 7,510,577 563,848 7,547,566 15,621,991 EACC 9,547,192 624,393 6,418,301 16,589,886 8,591,850 608,747 6,537,647 15,738,244 MSCC8 11,218,959 302,137 14,012,997 25,534,093 11,609,254 302,137 15,294,720 27,206,111 NAC 13,731,573 1,912,491 18,031,235 33,675,299 13,256,518 1,805,298 18,083,511 33,145,327 NPCC (GCCC) 17,862,471 2,647,053 16,299,245 36,808,769 18,042,694 2,383,166 16,777,746 37,203,606 NWACC 39,401,442 480,883 21,692,349 61,574,674 39,753,660 201,678 21,426,603 61,381,941 OZC 8,353,532 1,063,694 7,721,166 17,138,392 7,852,907 1,078,466 7,192,972 16,124,345 PCCUA 16,176,798 184,105 10,705,050 27,065,953 15,458,427 152,817 10,819,846 26,431,090 PTC 45,478,110 501,045 43,573,613 89,552,768 41,873,066 161,444 42,610,023 84,644,533 RMCC 5,356,730 384,818 5,236,724 10,978,272 5,223,011 436,634 5,284,941 10,944,586 SACC 11,683,457 1,271,549 9,012,329 21,967,335 11,722,624 1,267,958 8,826,084 21,816,666 SAUT9 13,740,396 752,052 8,751,511 23,243,959 13,388,754 748,734 8,689,809 22,827,297 SEAC 12,281,138 - 9,310,021 21,591,159 9,832,880 - 9,287,838 19,120,718 UACCB 9,863,536 1,152,682 8,003,908 19,020,126 9,971,952 1,143,880 8,137,283 19,253,115 UACCH 9,176,784 57,507 6,878,556 16,112,847 9,150,399 66 6,878,556 16,029,021 UACCM 13,206,198 1,860,571 9,066,654 24,133,423 12,986,615 1,600,991 9,107,660 23,695,266 Subtotal 333,892,378 19,913,110 251,031,641 604,837,129 328,579,399 17,727,577 252,092,930 598,399,906
Total 1,362,810,368 295,845,748 762,835,442 2,421,491,558 1,325,629,990 280,987,580 761,194,863 2,367,812,433
Source: ADHE Series 17-1 and 17-2.
Revenue Expenditures

58 Back to Table of Contents
TABLE 4.6 – TOTAL CURRENT FUND REVENUES AND EXPENDITURES FISCAL YEAR 2012
Notes: 1. Includes ASU Heritage Sites 2. Includes Ozark Campus 3. Includes Community Education Center (CEC) 4. Fayetteville Campus Only 5. Includes Research and Public Service (RAPS). 6. Includes Crossett and McGehee Campuses 7. Includes 1890 Land Grant Universities Match 8. Includes Arkansas Delta Training and Education Consortium (ADTEC) 9. Includes AR Fire Training Academy and AR Environmental Training Academy
Unrestr. Restricted Unrestr. Restricted Educ. and Educ. and Educ. and Educ. and
Institution General Auxiliary General Total General Auxiliary General TotalUniversitiesASUJ1 155,718,254 28,574,270 74,799,897 259,092,421 150,038,293 28,441,194 76,100,175 254,579,662 ATU2 89,978,182 20,821,266 40,556,519 151,355,967 86,499,818 20,691,171 40,566,727 147,757,716 HSU3 46,284,129 11,400,542 19,643,325 77,327,996 45,049,687 11,391,157 21,539,267 77,980,111 SAUM 39,281,194 9,893,067 13,864,129 63,038,390 39,060,623 9,143,823 13,951,545 62,155,991 UAF4 335,978,787 144,785,165 167,067,524 647,831,476 319,249,360 145,283,758 167,828,595 632,361,713 UAFS 60,341,804 11,082,078 31,411,911 102,835,793 61,248,360 10,434,364 31,537,718 103,220,442 UALR5 147,861,184 15,967,411 60,720,682 224,549,277 146,870,330 15,967,411 61,831,985 224,669,726 UAM6 34,728,113 7,395,460 17,766,688 59,890,261 34,503,268 7,252,093 18,042,827 59,798,188 UAPB7 47,041,430 12,522,768 35,179,088 94,743,286 43,952,992 12,247,463 35,646,901 91,847,356 UCA 129,666,483 35,188,371 45,662,504 210,517,358 124,364,369 34,086,084 45,850,271 204,300,724 Subtotal 1,086,879,560 297,630,398 506,672,267 1,891,182,225 1,050,837,100 294,938,518 512,896,011 1,858,671,629
CollegesANC (MCCC) 14,260,706 119,812 10,206,732 24,587,250 13,599,753 113,839 10,201,994 23,915,586 ASUB 27,133,381 3,314,032 12,305,475 42,752,888 26,646,644 3,394,838 12,125,838 42,167,320 ASUMH 10,377,535 863,885 1,506,192 12,747,612 10,292,759 775,463 1,441,439 12,509,661 ASUN 13,176,563 611,668 7,302,836 21,091,067 15,063,549 554,917 7,246,630 22,865,096 BRTC 16,424,239 1,892,769 10,292,993 28,610,001 14,842,792 2,403,262 10,344,674 27,590,728 CCCUA 8,710,422 18,368 5,291,528 14,020,318 8,726,972 18,368 5,258,713 14,004,053 CotO (OTC)8 7,349,187 690,591 6,918,553 14,958,331 7,919,917 723,167 7,321,517 15,964,601 EACC 9,405,591 593,459 5,966,230 15,965,280 9,223,911 570,515 5,620,026 15,414,452 MSCC9 11,488,876 272,899 11,823,730 23,585,505 10,847,799 267,381 11,708,576 22,823,756 NAC 13,642,702 1,847,353 16,986,856 32,476,911 13,905,324 1,723,163 16,986,086 32,614,573 NPC (GCCC) 18,667,623 2,701,629 30,359,565 51,728,817 19,095,401 2,309,653 30,338,446 51,743,500 NWACC 39,004,521 563,050 21,280,144 60,847,715 40,230,071 346,142 21,113,791 61,690,004 OZC 8,573,572 1,243,164 7,760,365 17,577,101 8,642,006 1,224,554 7,733,516 17,600,076 PCCUA 16,281,192 206,815 7,684,703 24,172,710 15,999,839 150,258 7,468,821 23,618,918 PTC 47,348,156 736,313 44,465,293 92,549,762 46,900,275 - 44,520,480 91,420,755 RMCC 5,338,974 376,398 5,027,918 10,743,290 5,298,195 359,319 4,940,487 10,598,001 SACC 11,864,387 1,820,873 9,316,293 23,001,553 11,590,810 1,557,752 9,077,739 22,226,301 SAUT10 14,196,352 709,494 7,842,460 22,748,306 15,375,260 703,533 7,890,992 23,969,785 SEAC 12,426,752 - 7,989,548 20,416,300 13,190,676 - 8,036,153 21,226,829 UACCB 9,793,381 1,027,941 7,021,809 17,843,131 9,402,838 960,052 7,069,221 17,432,111 UACCH 9,087,040 44,860 6,327,046 15,458,946 9,100,339 211 6,327,046 15,427,596 UACCM 13,683,178 1,738,168 8,194,882 23,616,228 12,576,897 1,516,387 8,063,099 22,156,383 Subtotal 338,234,330 21,393,541 251,871,151 611,499,022 338,472,027 19,672,774 250,835,284 608,980,085
Total 1,425,113,890 319,023,939 758,543,418 2,502,681,247 1,389,309,127 314,611,292 763,731,295 2,467,651,714
Source: ADHE Series 17-1 and 17-2.
Revenue Expenditures

59 Back to Table of Contents
TABLE 4.7 – TOTAL CURRENT FUND REVENUES AND EXPENDITURES FISCAL YEAR 2013
Notes: 1. Includes ASU Heritage Sites 2. Includes Ozark Campus 3. Includes Community Education Center (CEC) 4. Fayetteville Campus Only 5. Includes Research and Public Service (RAPS). 6. Includes Crossett and McGehee Campuses 7. Includes 1890 Land Grant Universities Match 8. Includes Arkansas Delta Training and Education Consortium (ADTEC) 9. Includes AR Fire Training Academy and AR Environmental Training Academy
Unrestr. Restricted Unrestr. Restricted Educ. and Educ. and Educ. and Educ. and
Institution General Auxiliary General Total General Auxiliary General TotalUniversitiesASUJ1 155,260,429 30,604,487 70,667,328 256,532,244 162,470,572 31,030,119 71,776,827 265,277,518 ATU2 93,500,373 22,046,774 41,588,915 157,136,062 88,674,656 21,756,124 41,560,324 151,991,104 HSU3 46,854,084 11,679,015 18,254,750 76,787,849 44,625,556 11,679,015 18,601,806 74,906,377 SAUM 39,833,548 9,562,633 14,844,287 64,240,468 40,350,981 9,451,542 14,951,545 64,754,068 UAF4 340,430,954 158,219,320 183,656,971 682,307,245 332,349,189 146,147,395 182,642,926 661,139,510 UAFS 60,581,287 11,878,168 32,645,724 105,105,179 60,529,008 11,733,073 32,994,126 105,256,207 UALR5 148,623,595 16,538,955 58,832,075 223,994,625 148,623,595 16,538,955 59,856,868 225,019,418 UAM6 35,006,560 5,726,342 17,078,337 57,811,239 35,780,719 6,500,964 16,936,774 59,218,457 UAPB7 45,344,722 11,985,485 32,723,940 90,054,147 38,981,421 11,470,864 31,615,686 82,067,971 UCA 130,372,148 38,137,981 45,760,360 214,270,488 126,626,704 38,132,664 46,480,772 211,240,140 Subtotal 1,095,807,700 316,379,159 516,052,687 1,928,239,546 1,079,012,400 304,440,715 517,417,654 1,900,870,770
CollegesANC (MCCC) 13,713,572 91,975 8,059,292 21,864,838 15,240,674 94,118 7,979,429 23,314,221 ASUB 27,202,654 3,421,453 12,014,148 42,638,255 27,081,516 4,316,684 12,077,057 43,475,257 ASUMH 10,401,255 838,269 1,332,389 12,571,913 10,282,608 791,194 1,173,825 12,247,627 ASUN 13,420,920 122,943 7,435,737 20,979,600 12,777,005 59,869 7,211,215 20,048,089 BRTC 14,960,183 1,784,510 9,271,605 26,016,298 14,526,202 1,910,637 9,268,576 25,705,415 CCCUA 8,888,081 10,858 5,295,311 14,194,250 9,015,295 10,858 5,366,874 14,393,027 CotO (OTC)8 7,105,578 699,477 6,779,416 14,584,471 7,565,580 653,697 6,463,176 14,682,453 EACC 9,941,860 646,343 5,484,431 16,072,634 9,667,572 588,320 5,563,911 15,819,803 MSCC9 13,144,639 213,226 12,339,715 25,697,579 13,123,753 218,157 11,598,910 24,940,819 NAC 13,938,519 1,815,885 15,319,694 31,074,098 13,784,407 1,946,671 15,363,395 31,094,473 NPC (GCCC) 18,182,112 2,107,966 22,943,654 43,233,732 18,040,888 2,400,170 22,751,656 43,192,714 NWACC 40,718,166 637,541 22,331,115 63,686,822 39,750,256 755,249 22,315,422 62,820,927 OZC 8,880,593 1,131,052 7,525,219 17,536,865 8,694,152 1,175,185 7,376,342 17,245,679 PCCUA 16,619,481 222,378 7,274,222 24,116,081 15,668,253 166,256 7,654,461 23,488,970 PTC 48,033,162 714,429 40,961,074 89,708,665 47,582,449 - 40,435,988 88,018,437 RMCC 5,383,454 315,659 4,667,321 10,366,434 5,307,394 257,141 4,701,321 10,265,856 SACC 11,640,405 1,978,114 8,560,144 22,178,663 11,541,390 1,798,993 8,538,197 21,878,580 SAUT10 13,820,347 766,274 6,776,210 21,362,831 14,424,534 787,537 6,844,799 22,056,870 SEAC 11,816,415 - 6,544,717 18,361,132 11,315,785 - 6,605,895 17,921,680 UACCB 9,568,737 917,742 6,428,522 16,915,001 9,324,507 901,378 6,424,655 16,650,540 UACCH 9,759,572 49,424 6,190,147 15,999,143 9,678,359 119 6,190,147 15,868,625 UACCM 12,844,655 1,627,660 6,862,412 21,334,727 13,323,891 1,546,395 6,939,153 21,809,439 Subtotal 339,984,360 20,113,177 230,396,495 590,494,032 337,716,468 20,378,629 228,844,404 586,939,501
Total 1,435,792,060 336,492,337 746,449,182 2,518,733,578 1,416,728,868 324,819,344 746,262,058 2,487,810,270
Source: ADHE Series 17-1 and 17-2.
Revenue Expenditures

60 Back to Table of Contents
TABLE 4.8 – TOTAL CURRENT FUND REVENUES AND EXPENDITURES FISCAL YEAR 2014
Notes: 1. Includes ASU Heritage Sites 2. Includes Ozark Campus 3. Includes Community Education Center (CEC) 4. Fayetteville Campus Only 5. Includes Research and Public Service (RAPS). 6. Includes Crossett and McGehee Campuses 7. Includes 1890 Land Grant Universities Match 8. Ouachita Technical College became College of the Ouachitas in 2012. 9. Includes Arkansas Delta Training and Education Consortium (ADTEC) 10. Includes AR Fire Training Academy and AR Environmental Training Academy
Unrestr. Restricted Unrestr. Restricted Educ. and Educ. and Educ. and Educ. and
Institution General Auxiliary General Total General Auxiliary General TotalUniversitiesASUJ1 157,180,550 31,591,420 63,821,521 252,593,492 156,359,312 31,570,816 64,472,430 252,402,558 ATU2 97,973,621 23,101,440 39,716,997 160,792,058 93,543,626 22,758,544 39,738,182 156,040,352 HSU3 47,508,140 12,150,475 17,462,467 77,121,082 46,617,486 12,150,475 17,520,679 76,288,640 SAUM 41,619,497 10,163,039 28,727,140 80,509,676 40,739,765 10,138,939 28,690,071 79,568,775 UAF4 374,074,965 148,013,066 167,322,441 689,410,472 367,287,507 146,248,728 165,652,997 679,189,232 UAFS 60,685,825 12,119,034 30,176,807 102,981,666 60,668,007 12,110,101 30,458,598 103,236,706 UALR5 149,343,897 17,338,948 53,238,127 219,920,972 149,343,897 17,338,948 50,954,197 217,637,042 UAM6 35,493,869 5,756,455 15,471,916 56,722,240 35,361,347 5,738,147 15,599,553 56,699,047 UAPB7 44,227,265 10,853,437 34,145,197 89,225,899 40,222,302 11,802,615 34,658,585 86,683,502 UCA 139,687,250 38,365,467 44,222,095 222,274,812 139,454,240 37,595,457 43,669,283 220,718,980 Subtotal 1,147,794,879 309,452,781 494,304,709 1,951,552,368 1,129,597,489 307,452,770 491,414,575 1,928,464,834
CollegesANC (MCCC) 13,424,202 77,764 5,870,827 19,372,793 13,375,588 140,502 6,128,047 19,644,138 ASUB 26,562,033 3,214,081 11,208,662 40,984,776 26,389,424 3,104,290 11,118,477 40,612,191 ASUMH 10,661,289 793,742 808,392 12,263,423 10,501,864 845,562 798,979 12,146,405 ASUN 13,710,396 63,257 6,110,848 19,884,501 15,271,382 75,121 6,350,864 21,697,367 BRTC 15,252,620 1,651,904 8,414,767 25,319,291 14,952,092 1,465,356 8,413,213 24,830,661 CCCUA 9,294,986 22,422 5,144,402 14,461,810 9,595,788 22,422 5,121,207 14,739,417 CotO (OTC)8 7,977,479 764,505 7,781,149 16,523,133 7,534,638 661,659 7,488,096 15,684,394 EACC 9,477,243 574,604 5,020,889 15,072,737 9,350,908 543,278 4,996,121 14,890,307 MSCC9 21,901,923 226,277 9,229,126 31,357,327 19,754,195 146,749 8,989,901 28,890,845 NAC 13,863,100 1,885,117 14,060,100 29,808,317 13,738,329 1,798,350 13,902,240 29,438,919 NPC (GCCC) 18,497,417 1,803,045 21,236,270 41,536,732 18,585,719 1,730,662 21,142,171 41,458,552 NWACC 41,921,660 612,154 19,326,532 61,860,346 40,503,128 605,205 19,466,770 60,575,103 OZC 8,749,909 1,077,183 6,312,948 16,140,040 8,824,404 1,145,336 6,238,300 16,208,039 PCCUA 16,872,085 275,108 6,783,787 23,930,980 16,220,085 110,415 6,853,010 23,183,510 PTC 47,833,527 578,933 35,061,632 83,474,092 48,010,015 402,445 35,110,883 83,523,343 RMCC 5,689,076 361,186 4,628,198 10,678,460 5,599,907 428,149 4,665,033 10,693,089 SACC 11,937,286 1,945,936 7,702,722 21,585,944 11,933,909 1,768,701 7,828,705 21,531,315 SAUT10 14,311,503 286,422 6,363,362 20,961,287 14,627,562 466,020 6,227,175 21,320,757 SEAC 11,732,953 73,598 6,938,148 18,744,699 13,338,396 131,141 6,775,609 20,245,146 UACCB 9,673,735 798,076 5,536,123 16,007,934 9,499,728 786,009 5,539,006 15,824,743 UACCH 10,514,863 45,372 5,193,030 15,753,265 10,532,573 12 5,193,030 15,725,615 UACCM 13,685,875 1,576,102 7,473,186 22,735,163 13,653,095 1,626,784 7,432,349 22,712,228 Subtotal 353,545,161 18,706,788 206,205,100 578,457,050 351,792,728 18,004,169 205,779,185 575,576,083
Total 1,501,340,040 328,159,569 700,509,809 2,530,009,418 1,481,390,217 325,456,939 697,193,761 2,504,040,917
Source: ADHE Series 17-1 and 17-2.
Revenue Expenditures

61 Back to Table of Contents
TABLE 4.9 – TOTAL CURRENT FUND REVENUES AND EXPENDITURES FISCAL YEAR 2015
Notes: 1. Includes ASU Heritage Sites 2. Includes Ozark Campus 3. Includes Community Education Center (CEC) 4. Fayetteville Campus Only 5. Includes Research and Public Service (RAPS). 6. Includes Crossett and McGehee Campuses 7. Includes 1890 Land Grant Universities Match 8. Ouachita Technical College became College of the Ouachitas in 2012. 9. Includes Arkansas Delta Training and Education Consortium (ADTEC) 10. Includes AR Fire Training Academy and AR Environmental Training Academy
Unrestr. Restricted Unrestr. Restricted Educ. and Educ. and Educ. and Educ. and
Institution General Auxiliary General Total General Auxiliary General TotalUniversitiesASUJ1 159,772,104 32,758,349 61,520,385 254,050,838 159,121,669 32,758,348 61,541,443 253,421,460 ATU2 104,142,684 25,003,249 42,000,911 171,146,844 98,545,622 23,160,935 42,003,896 163,710,453 HSU3 47,427,461 12,965,663 16,545,615 76,938,739 47,049,444 12,999,478 16,853,404 76,902,326 SAUM 44,237,218 11,342,270 14,699,026 70,278,513 43,547,100 11,056,359 14,658,608 69,262,067 UAF4 397,354,226 172,684,321 168,101,770 738,140,317 388,767,774 172,171,531 163,587,334 724,526,639 UAFS 61,790,417 11,907,477 28,223,136 101,921,030 59,845,056 11,905,088 28,304,179 100,054,323 UALR5 144,740,722 17,544,703 50,501,334 212,786,759 144,345,135 17,544,703 47,055,433 208,945,271 UAM6 31,821,954 5,879,203 13,825,050 51,526,207 29,838,536 5,826,642 13,723,389 49,388,567 UAPB7 41,270,396 10,806,658 28,160,420 80,237,474 42,064,089 11,595,499 28,363,242 82,022,830 UCA 141,226,102 39,961,631 43,842,896 225,030,629 133,168,113 37,505,792 43,900,028 214,573,933 Subtotal 1,173,783,284 340,853,524 467,420,543 1,982,057,350 1,146,292,538 336,524,375 459,990,956 1,942,807,869
CollegesANC (MCCC) 13,031,628 112,805 5,858,525 19,002,959 12,509,808 664,050 5,983,822 19,157,680 ASUB 26,696,068 3,130,628 11,101,056 40,927,752 25,655,110 2,825,772 10,809,142 39,290,024 ASUMH 10,500,027 742,579 1,154,397 12,397,003 10,408,921 652,038 1,100,946 12,161,905 ASUMS9 13,838,061 248,639 10,573,885 24,660,585 13,631,127 173,168 11,446,355 25,250,650 ASUN 14,660,171 197,283 6,142,216 20,999,670 14,449,610 202,550 6,002,301 20,654,461 BRTC 14,374,269 1,334,749 7,178,965 22,887,983 14,644,357 1,314,422 7,413,745 23,372,524 CCCUA 9,339,987 89,673 4,728,923 14,158,583 8,740,973 89,673 4,790,999 13,621,645 CotO (OTC)8 7,933,267 732,685 8,194,031 16,859,983 7,498,204 691,079 7,377,711 15,566,994 EACC 9,326,123 507,348 5,567,234 15,400,705 9,074,397 501,302 5,154,189 14,729,888 NAC 13,541,995 1,544,876 12,171,113 27,257,984 13,236,213 1,613,990 12,305,778 27,155,981 NPC (GCCC) 19,065,071 1,574,461 19,184,174 39,823,706 16,497,196 1,458,498 18,973,363 36,929,057 NWACC 42,446,274 468,656 17,980,434 60,895,364 40,158,994 472,564 17,947,227 58,578,786 OZC 8,493,462 856,923 5,533,580 14,883,965 9,637,753 831,503 5,549,064 16,018,320 PCCUA 16,467,838 163,020 7,142,634 23,773,492 15,855,909 111,515 7,164,975 23,132,399 SACC 12,209,120 1,839,012 7,330,532 21,378,664 12,203,316 1,731,382 7,530,244 21,464,942 SAUT10 13,711,012 167,418 5,997,931 19,876,361 13,751,904 155,716 6,069,790 19,977,410 SEAC 11,354,940 83,931 6,736,139 18,175,010 10,966,682 146,682 6,803,312 17,916,676 UACCB 9,685,701 792,520 5,304,757 15,782,978 9,842,814 804,910 5,303,863 15,951,587 UACCH 10,282,049 46,490 5,054,617 15,383,156 10,405,991 5,632 5,054,617 15,466,240 UACCM 13,312,361 1,383,548 6,341,458 21,037,367 12,835,782 1,922,687 6,370,042 21,128,511 UACCRM 5,636,893 452,034 4,479,986 10,568,913 5,737,113 513,875 4,494,470 10,745,458 UAPTC 47,110,464 502,491 30,886,830 78,499,785 42,068,396 3,230,000 31,242,870 76,541,266 Subtotal 343,016,782 16,971,769 194,643,417 554,631,967 329,810,571 20,113,009 194,888,825 544,812,404
Total 1,516,800,066 357,825,293 662,063,960 2,536,689,318 1,476,103,109 356,637,383 654,879,781 2,487,620,273
Source: ADHE Series 17-1 and 17-2.
Revenue Expenditures

62 Back to Table of Contents
TABLE 4.10 – TOTAL CURRENT FUND REVENUES AND EXPENDITURES FISCAL YEAR 2016
Notes: 1. Includes ASU Heritage Sites 2. Includes Ozark Campus 3. Includes Community Education Center (CEC) 4. Fayetteville Campus Only 5. Includes Research and Public Service (RAPS). 6. Includes Crossett and McGehee Campuses 7. Includes 1890 Land Grant Universities Match 8. Ouachita Technical College became College of the Ouachitas in 2012. 9. Includes Arkansas Delta Training and Education Consortium (ADTEC) 10. Includes AR Fire Training Academy and AR Environmental Training Academy
Unrestr. Restricted Unrestr. Restricted Educ. and Educ. and Educ. and Educ. and
Institution General Auxiliary General Total General Auxiliary General TotalUniversitiesASUJ1 167,120,834 34,662,933 63,231,008 265,014,775 165,677,597 34,650,604 63,023,415 263,351,616 ATU2 106,539,808 25,619,499 41,464,217 173,623,524 106,201,581 24,377,971 41,454,477 172,034,029 HSU3 48,332,265 14,288,662 16,681,559 79,302,486 50,062,623 14,702,246 16,557,404 81,322,273 SAUM 52,486,675 12,641,760 16,066,766 81,195,200 51,669,131 11,197,087 16,028,138 78,894,356 UAF4 417,905,414 186,353,446 175,049,395 779,308,255 403,271,461 181,269,891 173,335,905 757,877,257 UAFS 63,596,836 11,201,154 27,320,763 102,118,753 62,176,539 11,195,827 27,231,991 100,604,357 UALR5 143,664,511 19,506,355 48,307,099 211,477,965 144,332,269 19,506,355 46,859,943 210,698,567 UAM6 31,382,320 5,837,994 12,527,222 49,747,536 31,172,390 5,836,179 12,535,910 49,544,479 UAPB7 42,277,713 12,572,876 29,719,217 84,569,806 45,042,924 11,941,067 29,251,737 86,235,728 UCA 143,221,269 41,354,829 45,416,154 229,992,252 153,086,649 41,151,915 45,387,766 239,626,330 Subtotal 1,216,527,644 364,039,508 475,783,400 2,056,350,552 1,212,693,163 355,829,142 471,666,687 2,040,188,992
CollegesANC (MCCC) 13,502,460 91,960 6,042,540 19,636,960 13,290,446 92,981 6,038,940 19,422,367 ASUB 26,443,012 2,646,060 10,242,234 39,331,306 26,668,240 2,501,528 10,265,408 39,435,176 ASUMH 10,756,095 904,248 939,198 12,599,541 10,565,591 815,035 815,532 12,196,158 ASUMS9 13,797,657 223,285 10,700,464 24,721,406 12,675,161 169,494 10,539,497 23,384,152 ASUN 15,671,706 334,394 6,400,446 22,406,546 17,500,408 287,996 6,397,164 24,185,568 BRTC 13,698,421 1,056,048 5,766,174 20,520,643 14,104,806 1,085,788 6,292,462 21,483,056 CCCUA 9,789,801 268,565 4,295,651 14,354,017 9,570,044 268,565 4,403,235 14,241,844 CotO (OTC)8 8,086,711 647,814 8,025,385 16,759,910 7,816,115 629,410 8,242,092 16,687,617 EACC 9,488,009 522,458 4,504,126 14,514,593 9,036,488 575,756 4,546,771 14,159,015 NAC 13,740,324 1,221,513 10,841,061 25,802,898 13,280,251 1,225,570 10,928,052 25,433,873 NPC (GCCC) 41,478,184 487,828 15,499,604 57,465,617 16,792,936 1,258,255 15,856,997 33,908,188 NWACC 41,921,660 612,154 19,326,532 61,860,346 39,313,255 607,159 15,510,217 55,430,631 OZC 8,507,698 711,954 4,490,552 13,710,204 8,708,835 826,531 4,480,371 14,015,737 PCCUA 16,308,388 159,456 6,577,518 23,045,362 15,802,178 100,116 6,581,022 22,483,316 SACC 11,887,207 1,547,939 6,705,983 20,141,129 11,711,648 1,472,180 6,772,504 19,956,332 SAUT10 13,771,909 204,172 5,448,991 19,425,072 13,470,655 197,770 5,387,239 19,055,664 SEAC 11,519,231 79,549 6,613,692 18,212,472 11,513,495 139,524 6,567,057 18,220,076 UACCB 9,836,514 816,558 4,790,859 15,443,931 9,303,392 792,886 4,794,152 14,890,430 UACCH 10,332,542 422,960 5,819,097 16,574,599 10,299,611 2,107 5,754,766 16,056,484 UACCM 13,693,976 1,158,534 6,782,975 21,635,485 14,564,110 1,438,791 6,707,306 22,710,207 UACCRM 5,644,659 410,507 4,518,724 10,573,890 5,598,973 464,917 4,501,472 10,565,362 UAPTC 44,146,097 394,636 24,516,535 69,057,268 41,497,477 198,184 24,828,665 66,524,326 Subtotal 364,022,261 14,922,592 178,848,342 557,793,195 333,084,116 15,150,543 176,210,920 524,445,579
Total 1,580,549,905 378,962,101 654,631,742 2,614,143,747 1,545,777,279 370,979,686 647,877,607 2,564,634,571
Source: ADHE Series 17-1 and 17-2.
Revenue Expenditures

63 Back to Table of Contents
TABLE 4.11 – TOTAL CURRENT FUND REVENUES AND EXPENDITURES SUMMARY: 2007 THROUGH 2016
Notes: 1. Includes ASU Heritage Sites 2. Includes Ozark Campus 3. Includes Community Education Center (CEC) 4. Fayetteville Campus Only 5. Includes Research and Public Service (RAPS). 6. Includes Crossett and McGehee Campuses 7. Includes 1890 Land Grant Universities Match 8. Ouachita Technical College became College of the Ouachitas in 2012. 9. Includes Arkansas Delta Training and Education Consortium (ADTEC) 10. Includes AR Fire Training Academy and AR Environmental Training Academy
Unrestr. Restricted Unrestr. Restricted Educ. and Educ. and Educ. and Educ. and
Institution General Auxiliary General Total General Auxiliary General TotalUniversitiesASUJ1 1,453,330,776 278,914,124 619,832,623 2,352,077,522 1,437,702,440 279,777,815 620,030,460 2,337,510,714 ATU2 841,226,133 193,602,547 320,219,615 1,355,048,295 816,716,957 190,215,698 320,161,522 1,327,094,177 HSU3 445,334,073 109,451,752 150,723,515 705,509,340 436,855,988 109,128,097 150,953,465 696,937,550 SAUM 389,672,700 92,262,483 139,557,650 621,492,834 386,854,739 87,921,243 139,552,571 614,328,553 UAF4 3,223,014,822 1,402,633,866 1,476,040,092 6,101,688,780 3,137,028,428 1,370,603,043 1,468,605,235 5,976,236,706 UAFS 567,470,806 103,724,740 245,563,036 916,758,582 564,008,637 103,604,115 245,988,102 913,600,853 UALR5 1,387,306,232 140,272,350 506,686,072 2,034,264,654 1,384,261,378 140,029,529 504,386,677 2,028,677,584 UAM6 300,261,491 58,135,636 133,379,903 491,777,030 299,486,577 58,330,427 133,432,525 491,249,529 UAPB7 444,622,304 118,515,048 312,072,607 875,209,959 422,679,613 117,352,181 310,257,673 850,289,467 UCA 1,311,552,472 354,285,123 383,938,516 2,049,776,111 1,300,701,078 351,365,421 383,147,381 2,035,213,880 Subtotal 10,363,791,808 2,851,797,669 4,288,013,629 17,503,603,106 10,186,295,834 2,808,327,568 4,276,515,610 17,271,139,012
CollegesANC (MCCC) 140,407,117 956,203 74,538,793 215,902,112 139,833,720 1,242,754 74,712,798 215,789,272 ASUB 261,163,056 30,055,870 104,350,779 395,569,705 258,823,848 29,643,728 103,839,242 392,306,818 ASUMH 96,906,010 6,550,853 12,029,578 115,486,441 96,134,541 6,067,195 11,516,107 113,717,843 ASUMS9 121,745,714 2,117,770 101,031,414 224,894,899 118,179,251 1,947,903 101,478,462 221,605,616 ASUN 122,509,043 4,090,738 55,450,958 182,050,739 125,311,052 3,718,443 54,651,751 183,681,246 BRTC 139,058,393 13,908,001 76,037,435 229,003,829 144,505,908 14,324,538 76,798,434 235,628,880 CCCUA 86,155,699 554,168 48,978,930 135,688,797 85,257,317 554,168 49,181,706 134,993,191 CotO (OTC)8 73,324,952 6,582,097 65,160,955 145,068,004 73,333,078 5,990,055 64,252,942 306,122,732 EACC 94,061,293 6,290,989 53,653,020 154,005,303 93,011,224 6,487,554 53,173,304 121,380,145 NAC 132,965,488 15,777,174 121,525,404 270,268,066 131,617,595 15,687,337 121,432,918 184,541,730 NPC (GCCC) 198,166,370 18,677,082 166,481,640 383,325,093 170,663,401 18,804,075 166,705,093 247,938,530 NWACC 371,889,803 4,632,848 159,697,593 536,220,244 360,671,625 3,244,598 155,467,955 287,511,707 OZC 78,580,333 9,246,054 56,746,853 144,573,240 78,410,720 9,556,059 55,772,309 143,739,088 PCCUA 162,387,905 1,781,617 78,263,381 242,432,903 156,502,778 1,376,356 77,855,285 235,734,419 SACC 88,236,512 10,792,313 54,889,939 153,918,764 88,132,961 9,783,052 54,777,073 152,693,086 SAUT10 122,508,354 5,035,102 57,376,939 184,920,395 122,545,636 5,171,046 57,393,447 185,110,129 SEAC 114,051,531 237,078 71,027,369 185,315,978 119,212,395 417,347 70,802,305 190,432,047 UACCB 93,878,362 9,423,826 55,388,005 158,690,193 91,946,593 9,044,908 55,281,215 156,272,716 UACCH 93,796,201 803,391 52,315,310 146,914,902 93,274,692 9,656 52,268,166 145,552,514 UACCM 124,407,255 14,768,609 63,421,879 202,597,743 124,004,401 14,946,184 62,799,679 201,750,264 UACCRM 52,988,296 3,275,959 44,668,107 100,932,362 53,303,882 3,613,366 44,881,261 101,798,509 UAPTC 420,618,892 6,519,197 315,833,757 742,971,846 400,112,554 6,626,725 313,646,139 720,385,418 Subtotal 3,189,806,579 172,076,940 1,888,868,038 5,250,751,557 3,124,789,172 168,257,048 1,878,687,591 4,878,685,900
Total 13,553,598,387 3,023,874,609 6,176,881,667 22,754,354,663 13,311,085,006 2,976,584,616 6,155,203,201 22,149,824,913
Source: ADHE Series 17-1 and 17-2.
ExpendituresRevenue

64 Back to Table of Contents
SECTION 5.
INSTITUTIONAL FINANCE PROFILES
UNRESTRICTED E&G AND AUXILIARY REVENUES AND EXPENDITURES: 2010-11 THROUGH 2015-16 This section shows unrestricted current fund financial information from the ADHE Series 17 reports, which are reflective of institutional financial statements. Some differences in the state appropriation revenue line and general revenue tables in this publication may exist due to remittance of Merit Adjustment Funds, special state funding receipts, timing of receipts and/or institutional classifications of funds

65 Back to Table of Contents
FOUR – YEAR INSTITUTIONS

66 Back to Table of Contents
TABLE 5.1A – ARKANSAS STATE UNIVERSITY – JONESBORO UNRESTRICTED EDUCATIONAL & GENERAL
Note: ASU data includes ASU Heritage Sites
5 yr2010-11 2011-12 2012-13 2013-14 2014-15 2015-16 % Incr
Unrestricted E&G RevenuesTuition & Fees 83,317,001$ 88,566,132$ 88,772,741$ 89,527,334$ 91,475,108$ 94,776,124$ 13.8%Gov. Appropriations NA Federal -$ -$ -$ -$ NA State 59,350,027$ 61,134,067$ 60,630,797$ 62,279,029$ 62,825,495$ 62,881,380$ 6.0% Local -$ -$ -$ -$ NAGrants & Contracts NA Federal 1,575,943$ 1,998,303$ 1,603,307$ 1,050,002$ 1,122,196$ 1,243,308$ -21.1% State 576,596$ 531,627$ 430,558$ 421,965$ 466,091$ 458,712$ -20.4% Local 209,189$ 228,863$ 209,189$ 7,256$ 5,713$ 12,696$ -93.9%Private Gifts, Grants and Contracts 1,063,994$ 993,814$ 710,342$ 800,128$ 896,528$ 937,673$ -11.9%Endow ment Income -$ -$ -$ -$ NASales and Services NA Educational Actvities 850,987$ 948,543$ 1,555,451$ 1,604,125$ 1,744,268$ 1,906,100$ -100.0%
Hospitals -$ -$ -$ -$ NAOther Investments 412,148$ 673,233$ 174,158$ 212,344$ 392,039$ 476,242$ 15.6%Other * 1,560,168$ 643,672$ 1,173,887$ 1,278,367$ 844,666$ 4,428,599$ 183.9% Total 148,916,053$ 155,718,254$ 155,260,429$ 157,180,550$ 159,772,104$ 167,120,834$ 12.2%
Unrestricted E&G ExpendituresTeaching Salaries 27,321,261$ 27,868,764$ 29,179,234$ 31,865,706$ 31,336,898$ 32,683,169$ 19.6%Dept. Oper. Expense 19,562,209$ 22,109,167$ 23,741,138$ 23,663,037$ 24,066,862$ 25,670,628$ 31.2%Off-Campus Credit 1,961,865$ 1,901,677$ 1,720,538$ 1,707,193$ 1,870,091$ 1,687,112$ -14.0%Non-Credit Instruction 2,353,821$ 1,944,705$ 1,549,467$ 821,423$ 701,849$ 767,247$ -67.4%Research 3,250,950$ 3,521,519$ 3,621,082$ 3,576,187$ 2,551,498$ 2,770,247$ -14.8%Public Service 2,103,538$ 3,101,406$ 3,500,355$ 3,234,064$ 2,851,926$ 2,958,993$ 40.7%Libraries 4,204,427$ 4,223,620$ 4,724,541$ 4,987,424$ 4,706,308$ 4,960,993$ 18.0%Museums & Galleries 274,000$ 267,298$ 359,647$ 347,925$ 294,663$ 297,001$ 8.4%Organized Activities 1,207,449$ 1,202,522$ 1,209,879$ 1,126,221$ 1,228,429$ 1,226,183$ 1.6%Other Academic Support 10,186,460$ 9,203,688$ 9,799,406$ 10,439,800$ 11,548,429$ 10,131,416$ -0.5%Student Services 9,283,103$ 10,060,752$ 9,422,287$ 10,364,215$ 10,074,130$ 10,052,990$ 8.3%Institutional Support 16,099,218$ 14,232,192$ 16,018,094$ 12,554,229$ 13,532,224$ 13,850,191$ -14.0%Utilities 2,894,260$ 2,389,928$ 2,535,597$ 2,962,877$ 3,077,420$ 3,112,706$ 7.5%Other Plant Maintenance 10,028,895$ 12,260,293$ 12,480,138$ 12,303,906$ 11,633,822$ 10,830,217$ 8.0%Scholarships & Fellow ships 18,461,261$ 19,247,402$ 18,986,290$ 19,432,526$ 20,004,641$ 21,095,488$ 14.3%Other * 1,111,694$ 1,345,117$ 1,273,627$ 1,481,675$ 1,436,500$ 914,832$ -17.7%Transfers - Auxiliary 1,142,715$ 1,154,142$ 1,180,687$ 1,214,927$ 1,235,581$ 1,255,350$ 9.9%Transfers - Mandatory 2,419,056$ 2,457,214$ 2,431,035$ 2,646,000$ 3,580,062$ 3,582,092$ 48.1%Transfers -Non Mandatory 7,145,164$ 11,546,887$ 18,519,065$ 11,629,978$ 13,390,336$ 17,830,742$ 149.5% Total 141,011,347$ 150,038,293$ 162,252,107$ 156,359,312$ 159,121,669$ 165,677,597$ 17.5%* Other w as reduced to remove self insurance from both expenditures and revenues.Source: Revenues from ADHE Series 17-1; Expenditures from ADHE Series 17-7a.

67 Back to Table of Contents
TABLE 5.1A – ARKANSAS STATE UNIVERSITY – JONESBORO (CONT.) AUXILIARY ENTERPRISES
5 yr2010-11 2011-12 2012-13 2013-14 2014-15 2015-16 % Incr
RevenuesIntercollegiate Athletics 8,026,819$ 9,127,335$ 10,415,433$ 10,670,335$ 10,762,742$ 11,787,125$ 46.8%Resident Halls 9,786,998$ 10,373,423$ 11,036,026$ 11,986,311$ 12,751,931$ 13,701,052$ 40.0%Married Student Housing 1,434,974$ 1,480,747$ 1,539,786$ 1,500,248$ 1,539,146$ 1,419,828$ -1.1%Faculty Housing 142,253$ 122,394$ 93,011$ 88,499$ 83,330$ 55,240$ -61.2%Food Service 1,125,980$ 1,193,364$ 1,219,301$ 1,269,654$ 1,643,837$ 1,657,279$ 47.2%College Union 2,444,051$ 2,432,988$ 2,696,725$ 2,798,899$ 2,701,548$ 2,696,363$ 10.3%Bookstore 222,143$ 227,143$ 222,142$ 367,633$ 317,926$ 307,615$ 38.5%Student Org. and Publications 182,873$ 164,398$ 159,611$ 142,520$ 144,193$ 142,484$ -22.1%Student Health Service -$ -$ -$ -$ -$ -$ NAOther Auxiliary 2,956,419$ 3,452,479$ 3,222,452$ 2,767,322$ 2,813,696$ 2,895,948$ -2.0% Total 26,322,509$ 28,574,270$ 30,604,487$ 31,591,420$ 32,758,349$ 34,662,933$ 31.7%
ExpendituresIntercollegiate Athletics 11,466,456$ 13,098,114$ 14,766,924$ 15,690,189$ 17,291,048$ 18,521,157$ 61.5%Resident Halls 4,449,224$ 4,786,898$ 5,334,173$ 5,298,056$ 5,195,614$ 5,376,840$ 20.8%Married Student Housing 483,267$ 564,858$ 664,322$ 527,457$ 461,051$ 508,372$ 5.2%Faculty Housing 42,439$ 49,053$ 49,590$ 77,424$ 73,882$ 41,311$ -2.7%Food Service 239,327$ 163,001$ 217,035$ 288,560$ 162,362$ 468,303$ 95.7%College Union 1,247,104$ 1,251,895$ 1,155,553$ 1,430,131$ 1,282,217$ 1,396,648$ 12.0%Bookstore 71,913$ 61,778$ 61,246$ 60,952$ (96,499)$ (15,246)$ -121.2%Student Org. and Publications 213,972$ 197,747$ 230,499$ 139,450$ 137,860$ 141,321$ -34.0%Student Health Service -$ -$ -$ -$ -$ -$ NAOther Auxiliary 2,784,815$ 3,002,507$ 3,047,794$ 2,287,036$ 2,328,956$ 2,399,775$ -13.8% Total 20,998,516$ 23,175,851$ 25,527,137$ 25,799,255$ 26,836,491$ 28,838,480$ 37.3%
Transfers/Debt ServiceIntercollegiate Athletics -$ -$ -$ -$ -$ -$ NAResident Halls 4,606,441$ 4,712,832$ 4,936,718$ 5,701,161$ 6,023,188$ 6,022,770$ 30.7%Married Student Housing 905,081$ 914,675$ 915,770$ 858,936$ 872,625$ 872,542$ -3.6%Faculty Housing -$ -$ -$ -$ -$ -$ NAFood Service -$ -$ -$ -$ -$ -$ NACollege Union 1,197,646$ 1,200,297$ 1,201,602$ 1,197,892$ 1,200,745$ 1,197,948$ 0.0%Bookstore -$ -$ -$ -$ -$ -$ NAStudent Org. and Publications -$ -$ -$ -$ -$ -$ NAStudent Health Service -$ -$ -$ -$ -$ -$ NAOther Auxiliary 408,104$ 409,003$ 409,448$ 408,183$ 409,155$ 408,202$ 0.0% Total 7,117,271$ 7,236,806$ 7,463,538$ 8,166,172$ 8,505,712$ 8,501,462$ 19.4%
Excess of Revenues (1,793,279)$ (1,838,388)$ (2,386,188)$ (2,374,007)$ (2,583,854)$ (2,677,009)$ NA
Special TransfersAuxiliary Transfer Policy 393,110$ 1,154,142$ 1,180,687$ 1,214,927$ 1,235,581$ 2,875,350$ 631.4%Other Auxilary Transfer 1,142,715$ 817,321$ 779,869$ 1,179,684$ 1,348,274$ -$ -100.0% Total 1,535,825$ 1,971,463$ 1,960,556$ 2,394,611$ 2,583,855$ 2,875,350$ 87.2%
Total Excess of Revenues (257,454)$ 133,076$ (425,632)$ 20,604$ 1$ 198,341$

68 Back to Table of Contents
TABLE 5.1B – ARKANSAS TECH UNIVERSITY UNRESTRICTED EDUCATIONAL & GENERAL
Note: ATU data only includes Russellville campus.
5 yr2010-11 2011-12 2012-13 2013-14 2014-15 2015-16 % Incr
Unrestricted E&G RevenuesTuition & Fees 43,321,699$ 47,858,735$ 50,527,536$ 57,502,312$ 58,501,871$ 60,980,667$ 40.8%Gov. Appropriations Federal -$ -$ -$ -$ -$ -$ NA State 30,829,562$ 31,224,930$ 31,134,133$ 31,560,998$ 31,885,049$ 31,908,441$ 3.5% Local -$ -$ -$ -$ -$ -$ NAGrants & Contracts Federal -$ -$ -$ -$ -$ -$ NA State -$ -$ -$ -$ -$ -$ NA Local -$ -$ -$ -$ -$ -$ NAPrivate Gifts, Grants and Contracts -$ -$ -$ -$ -$ NAEndow ment Income 121,482$ 133,234$ 75,080$ 121,603$ 230,933$ 266,677$ 119.5%Sales and Services Educational Actvities 747,465$ 873,381$ 908,630$ 982,270$ 1,029,662$ 1,229,135$ 64.4%
Hospitals -$ -$ -$ -$ -$ -$ NAOther Investments 380,795$ 280,336$ 287,338$ 277,065$ 285,270$ 228,462$ -40.0%Other 1,763,516$ 1,992,860$ 2,488,393$ 2,118,382$ 3,104,178$ 2,287,863$ 29.7% Total 77,164,519$ 82,363,476$ 85,421,110$ 92,562,630$ 95,036,963$ 96,901,245$ 25.6%
Unrestricted E&G ExpendituresTeaching Salaries 15,595,195$ 20,867,898$ 17,638,847$ 18,061,742$ 18,740,496$ 21,090,553$ 35.2%Dept. Oper. Expense 11,663,722$ 8,318,398$ 13,233,316$ 11,955,511$ 12,790,002$ 10,128,806$ -13.2%Off-Campus Credit 203,456$ 254,425$ 368,280$ 2,352,544$ 3,397,120$ 2,878,689$ 1314.9%Non-Credit Instruction 355,953$ 340,559$ 341,415$ 640,147$ 749,848$ 997,105$ 180.1%Research 670,286$ 785,444$ 855,845$ 880,278$ 1,243,395$ 1,144,191$ 70.7%Public Service 5,663$ 6,171$ 6,426$ 6,076$ 5,961$ 186,016$ 3184.8%Libraries 1,580,960$ 1,740,408$ 1,905,336$ 1,892,198$ 2,080,528$ 2,201,381$ 39.2%Museums & Galleries 124,058$ 124,094$ 135,589$ 140,251$ 152,619$ 126,355$ 1.9%Organized Activities 362,302$ 541,715$ 486,099$ 386,153$ 371,753$ 420,004$ 15.9%Other Academic Support 3,964,483$ 4,307,871$ 4,333,295$ 4,606,396$ 4,841,828$ 6,243,365$ 57.5%Student Services 4,048,616$ 4,468,756$ 5,074,096$ 5,300,512$ 5,828,273$ 6,969,601$ 72.1%Institutional Support 11,524,308$ 12,519,613$ 12,364,974$ 14,885,563$ 14,479,134$ 15,606,476$ 35.4%Utilities 1,765,033$ 1,881,578$ 1,933,346$ 1,652,193$ 2,199,039$ 2,045,124$ 15.9%Other Plant Maintenance 3,259,493$ 3,538,710$ 4,104,567$ 4,260,968$ 4,368,349$ 5,487,093$ 68.3%Scholarships & Fellow ships 9,945,481$ 9,535,014$ 8,642,160$ 9,077,081$ 11,147,442$ 10,722,906$ 7.8%Other 256,536$ 310,255$ 287,394$ 181,711$ 1,301,703$ 711,691$ 177.4%Transfers - Auxiliary 1,426,530$ 1,398,249$ 1,448,315$ 1,651,530$ 1,770,432$ 1,913,472$ 34.1%Transfers - Mandatory 2,105,900$ 1,601,661$ 1,698,441$ 1,823,174$ 1,941,289$ 1,918,481$ -8.9%Transfers -Non Mandatory 2,260,719$ 6,316,620$ 6,127,424$ 5,890,591$ 3,001,049$ 5,898,395$ 160.9% Total 71,118,694$ 78,857,439$ 80,985,165$ 85,644,619$ 90,410,260$ 96,689,704$ 36.0%
Source: Revenues from ADHE Series 17-1; Expenditures from ADHE Series 17-7a.

69 Back to Table of Contents
TABLE 5.1B – ARKANSAS TECH UNIVERSITY (CONT.) AUXILIARY ENTERPRISES
5 yr2010-11 2011-12 2012-13 2013-14 2014-15 2015-16 % Incr
RevenuesIntercollegiate Athletics 3,010,808$ 3,222,092$ 3,573,461$ 3,463,550$ 3,730,128$ 3,912,036$ 29.9%Resident Halls 6,647,672$ 7,431,374$ 7,994,238$ 8,784,836$ 9,831,402$ 10,365,080$ 55.9%Married Student Housing -$ -$ -$ -$ -$ -$ NAFaculty Housing -$ -$ -$ -$ -$ -$ NAFood Service 4,859,732$ 5,562,720$ 6,117,727$ 6,181,526$ 6,709,610$ 6,961,794$ 43.3%College Union -$ -$ -$ -$ -$ -$ NABookstore 2,951,394$ 2,997,419$ 2,656,433$ 2,630,793$ 2,507,904$ 2,218,399$ -24.8%Student Org. and Publications 471,536$ 432,992$ 456,991$ 456,367$ 474,010$ 480,902$ 2.0%Student Health Service 5,744$ 17,244$ 250,299$ 471,976$ 726,028$ 741,726$ 12813.1%Other Auxiliary 310,992$ 242,607$ -$ -$ 90,494$ 191,100$ -38.6% Total 18,257,878$ 19,906,448$ 21,049,149$ 21,989,048$ 24,069,576$ 24,871,037$ 36.2%
ExpendituresIntercollegiate Athletics 3,675,330$ 3,943,999$ 3,943,807$ 4,292,917$ 4,581,192$ 4,880,684$ 32.8%Resident Halls 3,557,733$ 4,711,207$ 5,319,017$ 5,169,682$ 5,558,583$ 6,217,797$ 74.8%Married Student Housing -$ -$ -$ -$ -$ -$ NAFaculty Housing -$ -$ -$ -$ -$ -$ NAFood Service 3,899,433$ 4,465,968$ 4,932,572$ 4,947,599$ 5,340,433$ 4,963,241$ 27.3%College Union -$ -$ -$ -$ -$ -$ NABookstore 2,664,299$ 2,689,171$ 2,403,656$ 2,461,589$ 2,382,245$ 2,204,045$ -17.3%Student Org. and Publications 477,735$ 534,389$ 590,613$ 579,700$ 515,687$ 532,010$ 11.4%Student Health Service 186,989$ 190,896$ 318,355$ 544,322$ 801,602$ 823,670$ 340.5%Other Auxiliary 634,110$ 239,312$ 4,719$ -$ 56,672$ 157,156$ -75.2% Total 15,095,629$ 16,774,942$ 17,512,739$ 17,995,809$ 19,236,414$ 19,778,603$ 31.0%
Transfers/Debt ServiceIntercollegiate Athletics 269,861$ 195,649$ 253,156$ 254,748$ 251,488$ 258,427$ -4.2%Resident Halls 1,872,888$ 2,297,623$ 2,473,950$ 2,774,180$ 2,757,021$ 2,705,892$ 44.5%Married Student Housing -$ -$ -$ -$ -$ -$ NAFaculty Housing -$ -$ -$ -$ -$ -$ NAFood Service 618,168$ -$ 428,198$ 427,942$ 425,859$ -31.1%College Union -$ -$ -$ -$ -$ -$ NABookstore -$ -$ -$ -$ -$ -$ NAStudent Org. and Publications -$ -$ -$ -$ -$ -$ NAStudent Health Service -$ -$ -$ -$ -$ -$ NAOther Auxiliary -$ -$ -$ -$ -$ -$ NA Total 2,760,917$ 2,493,272$ 2,727,106$ 3,457,126$ 3,436,451$ 3,390,178$ 22.8%
Excess of Revenues 401,332$ 638,234$ 809,304$ 536,113$ 1,396,711$ 1,702,256$ 324.2%
Special TransfersAuxiliary Transfer Policy 1,426,530$ 1,398,249$ 1,448,315$ 1,651,530$ 1,770,432$ 1,913,472$ 34.1%Other Auxilary Transfer (1,064,264)$ (1,995,315)$ (2,071,629)$ (1,938,036)$ (1,403,003)$ (2,411,422)$ NA Total 362,266$ (597,066)$ (623,314)$ (286,506)$ 367,429$ (497,950)$ -237.5%
Total Excess of Revenues 763,598$ 41,168$ 185,990$ 249,607$ 1,764,140$ 1,204,306$

70 Back to Table of Contents
TABLE 5.1C – HENDERSON STATE UNIVERSITY UNRESTRICTED EDUCATIONAL & GENERAL
Note: HSU data includes Community Education Center (CEC)
5 yr2010-11 2011-12 2012-13 2013-14 2014-15 2015-16 % Incr
Unrestricted E&G RevenuesTuition & Fees 23,785,076$ 24,859,557$ 25,137,681 25,714,854$ 25,733,640$ 26,279,333$ 10.5%Gov. Appropriations Federal -$ -$ -$ -$ -$ -$ NA State 20,991,048$ 20,753,369$ 20,565,446$ 20,595,470$ 20,810,277$ 20,954,600$ -0.2% Local -$ -$ -$ -$ -$ -$ NAGrants & Contracts Federal 134,124$ -$ -$ 21,877$ 17,852$ -$ -100.0% State -$ -$ -$ -$ -$ -$ NA Local -$ -$ -$ -$ -$ -$ NAPrivate Gifts, Grants and Contracts 283,434$ 69,651$ 63,457$ 51,203$ 198,658$ 519,817$ 83.4%Endow ment Income -$ -$ -$ -$ -$ -$ NASales and Services Educational Actvities 9,258$ 14,260$ 12,700$ 9,600$ 13,200$ -$ -100.0%
Hospitals -$ -$ -$ -$ -$ -$ NAOther Investments 119,986$ 51,384$ 80,996$ 36,405$ 55,217$ 19,802$ -83.5%Other 742,496$ 535,908$ 783,219$ 868,146$ 598,617$ 558,713$ -24.8% Total 46,065,422$ 46,284,129$ 46,643,499$ 47,297,555$ 47,427,461$ 48,332,265$ 4.9%
Unrestricted E&G ExpendituresTeaching Salaries 10,789,733$ 10,978,139$ 10,841,759$ 11,067,560$ 11,580,153$ 12,147,408$ 12.6%Dept. Oper. Expense 6,163,188$ 6,434,951$ 6,522,562$ 7,080,917$ 7,079,452$ 7,191,103$ 16.7%Off-Campus Credit -$ -$ -$ -$ -$ -$ NANon-Credit Instruction -$ -$ -$ -$ -$ -$ NAResearch 361,582$ 320,159$ 275,649$ 78,698$ 88,004$ 23,764$ -93.4%Public Service 99,820$ 96,470$ 102,902$ 201,619$ 231,685$ 215,487$ 115.9%Libraries 881,568$ 921,412$ 918,754$ 1,008,171$ 948,261$ 982,322$ 11.4%Museums & Galleries 837$ -$ -$ -$ -$ -$ -100.0%Organized Activities 19,564$ 22,083$ -$ -$ -$ -$ -100.0%Other Academic Support 1,088,909$ 1,124,415$ 1,042,160$ 1,065,098$ 1,416,574$ 1,911,525$ 75.5%Student Services 2,323,011$ 2,388,936$ 2,443,848$ 2,661,962$ 2,791,261$ 3,076,082$ 32.4%Institutional Support 6,236,417$ 6,725,403$ 6,528,227$ 7,762,866$ 7,795,721$ 8,118,440$ 30.2%Utilities 1,347,784$ 1,522,824$ 1,464,170$ 1,341,492$ 1,354,256$ 1,310,745$ -2.7%Other Plant Maintenance 2,725,873$ 2,804,792$ 3,434,866$ 2,986,355$ 2,594,508$ 3,392,214$ 24.4%Scholarships & Fellow ships 7,532,709$ 7,370,096$ 7,052,125$ 7,055,256$ 8,021,577$ 9,186,323$ 22.0%Other -$ -$ -$ -$ -$ -$ NATransfers - Auxiliary 1,301,367$ 1,336,817$ 1,407,170$ 1,214,927$ 1,235,581$ 1,255,350$ -3.5%Transfers - Mandatory 1,076,350$ 1,368,113$ 1,501,506$ 1,266,149$ 1,317,091$ 445,205$ -58.6%Transfers -Non Mandatory 1,621,869$ 1,635,077$ 1,089,858$ 1,826,416$ 595,320$ 806,655$ -50.3% Total 43,570,581$ 45,049,687$ 44,625,556$ 46,617,486$ 47,049,444$ 50,062,623$ 14.9%
Source: Revenues from ADHE Series 17-1; Expenditures from ADHE Series 17-7a.

71 Back to Table of Contents
TABLE 5.1C – HENDERSON STATE UNIVERSITY (CONT.) AUXILIARY ENTERPRISES
5 yr2010-11 2011-12 2012-13 2013-14 2014-15 2015-16 % Incr
RevenuesIntercollegiate Athletics 1,418,348$ 1,385,311$ 1,471,987$ 1,795,891$ 1,854,480$ 1,773,125$ 25.0%Resident Halls 3,923,636$ 4,181,831$ 4,326,220$ 4,124,535$ 5,035,741$ 6,428,858$ 63.8%Married Student Housing -$ -$ -$ -$ -$ -$ NAFaculty Housing -$ -$ -$ -$ -$ -$ NAFood Service 3,082,053$ 3,314,433$ 3,309,311$ 3,885,978$ 4,101,453$ 4,189,836$ 35.9%College Union 239,422$ 191,407$ 182,347$ 164,404$ 161,741$ 155,810$ -34.9%Bookstore 112,083$ 123,376$ 129,861$ 114,049$ 109,385$ 99,572$ -11.2%Student Org. and Publications 114,049$ 110,809$ 106,137$ 98,455$ 97,233$ 94,417$ -17.2%Student Health Service 382,822$ 367,862$ 355,208$ 375,461$ 322,079$ 310,358$ -18.9%Other Auxiliary 1,790,224$ 1,725,513$ 1,797,944$ 1,591,702$ 1,283,551$ 1,236,686$ -30.9% Total 11,062,637$ 11,400,542$ 11,679,015$ 12,150,475$ 12,965,663$ 14,288,662$ 29.2%
ExpendituresIntercollegiate Athletics 3,497,678$ 3,537,599$ 3,508,805$ 3,778,038$ 4,182,090$ 4,511,070$ 29.0%Resident Halls 1,808,967$ 2,274,415$ 2,538,688$ 2,290,872$ 2,378,204$ 2,513,033$ 38.9%Married Student Housing -$ -$ -$ -$ -$ -$ NAFaculty Housing -$ -$ -$ -$ -$ -$ NAFood Service 2,705,062$ 2,881,399$ 2,844,007$ 3,262,042$ 3,411,183$ 3,480,569$ 28.7%College Union 321,317$ 349,882$ 360,621$ 314,492$ 299,451$ 260,795$ -18.8%Bookstore -$ -$ -$ -$ -$ -$ NAStudent Org. and Publications 269,314$ 145,939$ 137,101$ 123,569$ 140,762$ 108,902$ -59.6%Student Health Service 331,843$ 279,582$ 354,707$ 290,596$ 290,626$ 278,759$ -16.0%Other Auxiliary 1,488,984$ 1,391,438$ 1,518,379$ 1,260,762$ 1,099,449$ 1,051,480$ -29.4% Total 10,423,165$ 10,860,254$ 11,262,308$ 11,320,371$ 11,801,765$ 12,204,608$ 17.1%
Transfers/Debt ServiceIntercollegiate Athletics -$ -$ -$ -$ -$ -$ NAResident Halls 1,299,404$ 1,033,293$ 955,769$ 1,232,816$ 1,452,350$ 2,546,001$ 95.9%Married Student Housing -$ -$ -$ -$ -$ -$ NAFaculty Housing -$ -$ -$ -$ -$ -$ NAFood Service -$ 119,703$ -$ 334,976$ 214,326$ 214,419$ NACollege Union -$ -$ -$ -$ 98,775$ 99,819$ NABookstore -$ -$ -$ -$ -$ -$ NAStudent Org. and Publications -$ -$ -$ -$ -$ -$ NAStudent Health Service -$ -$ -$ -$ -$ -$ NAOther Auxiliary 503,856$ 581,644$ 601,378$ 606,131$ 580,356$ 513,965$ 2.0% Total 1,803,260$ 1,734,640$ 1,557,147$ 2,173,923$ 2,345,807$ 3,374,204$ 87.1%
Excess of Revenues (1,163,788)$ (1,194,352)$ (1,140,440)$ (1,343,819)$ (1,181,909)$ (1,290,150)$ NA
Special TransfersAuxiliary Transfer Policy 1,142,715$ 1,336,817$ 1,180,687$ 1,214,927$ 1,235,581$ 1,255,350$ 9.9%Other Auxilary Transfer 158,652$ (133,080)$ (40,247)$ 128,892$ (87,487)$ (378,784)$ -338.8% Total 1,301,367$ 1,203,737$ 1,140,440$ 1,343,819$ 1,148,094$ 876,566$ -32.6%
Total Excess of Revenues 137,579$ 9,385$ -$ -$ (33,815)$ (413,584)$

72 Back to Table of Contents
TABLE 5.1D – SOUTHERN ARKANSAS UNIVERSITY – MAGNOLIA UNRESTRICTED EDUCATIONAL & GENERAL
5 yr2010-11 2011-12 2012-13 2013-14 2014-15 2015-16 % Incr
Unrestricted E&G RevenuesTuition & Fees 20,015,740$ 21,357,293$ 21,501,956$ 23,393,761$ 25,468,570$ 33,189,267$ 65.8%Gov. Appropriations Federal -$ -$ -$ -$ -$ -$ NA State 16,593,714$ 16,806,440$ 16,768,783$ 16,825,687$ 16,946,755$ 16,983,378$ 2.3% Local -$ -$ -$ -$ NAGrants & Contracts Federal 185,968$ 165,245$ 170,015$ 172,778$ 175,004$ 212,897$ 14.5% State 222,602$ -$ 61,648$ 50,176$ 61,889$ 81,271$ -63.5% Local 60,030$ 32,783$ 58,587$ 116,181$ 88,325$ 64,300$ 7.1%Private Gifts, Grants and Contracts -$ -$ -$ -$ -$ -$ NAEndow ment Income 508,859$ 397,361$ 662,424$ 552,795$ 767,797$ 790,274$ 55.3%Sales and Services NA Educational Actvities 200,025$ 181,449$ 80,292$ 96,233$ 131,042$ 91,805$ -54.1%
Hospitals -$ -$ -$ -$ -$ -$ NAOther Investments 63$ 41$ 45$ 2,180$ 1,787$ 18,348$ 29023.5%Other 388,174$ 340,581$ 529,796$ 409,704$ 596,048$ 1,055,136$ 171.8% Total 38,175,175$ 39,281,194$ 39,833,546$ 41,619,495$ 44,237,218$ 52,486,675$ 37.5%
Unrestricted E&G ExpendituresTeaching Salaries 8,447,792$ 6,471,553$ 7,037,262$ 6,579,637$ 6,881,797$ 7,871,721$ -6.8%Dept. Oper. Expense 5,509,511$ 5,172,044$ 5,217,856$ 5,174,144$ 5,773,068$ 6,457,648$ 17.2%Off-Campus Credit 254,247$ 2,532,427$ 2,550,991$ 2,499,685$ 2,921,861$ 2,488,932$ 878.9%Non-Credit Instruction -$ -$ -$ -$ -$ -$ NAResearch 278,251$ 331,784$ 329,058$ 278,785$ 280,381$ 314,641$ 13.1%Public Service 226,891$ 223,590$ 220,064$ 234,785$ 263,563$ 215,511$ -5.0%Libraries 1,053,559$ 1,104,609$ 974,494$ 876,313$ 995,860$ 702,897$ -33.3%Museums & Galleries -$ 284,455$ -$ -$ -$ -$ NAOrganized Activities 628,796$ 389,492$ 539,176$ 433,364$ 578,301$ 534,977$ -14.9%Other Academic Support 1,254,602$ 1,193,371$ 1,413,565$ 1,733,685$ 1,735,178$ 2,472,563$ 97.1%Student Services 2,645,055$ 2,939,603$ 3,141,930$ 2,838,351$ 3,078,422$ 3,716,188$ 40.5%Institutional Support 4,156,772$ 4,308,139$ 4,422,445$ 4,235,644$ 4,540,197$ 5,516,771$ 32.7%Utilities 795,822$ 2,055,587$ 2,702,021$ 2,781,787$ 2,912,129$ 3,175,430$ 299.0%Other Plant Maintenance 2,833,294$ 1,613,250$ 1,552,474$ 4,143,651$ 3,812,268$ 4,027,852$ 42.2%Scholarships & Fellow ships 6,331,579$ 6,767,989$ 6,557,865$ 7,254,295$ 8,119,945$ 8,998,896$ 42.1%Other -$ 10,492$ 19,235$ 315,785$ 40,634$ 163,453$ NATransfers - Auxiliary 1,142,715$ 1,154,142$ 1,183,487$ 1,214,927$ 1,235,581$ 1,255,350$ 9.9%Transfers - Mandatory 2,030,384$ 2,348,805$ 2,382,335$ 127,855$ 128,998$ 138,230$ -93.2%Transfers -Non Mandatory 1,114,710$ 159,293$ 106,723$ 17,072$ 248,916$ 3,618,072$ 224.6% Total 38,703,980$ 39,060,623$ 40,350,981$ 40,739,765$ 43,547,100$ 51,669,131$ 33.5%
Source: Revenues from ADHE Series 17-1; Expenditures from ADHE Series 17-7a.

73 Back to Table of Contents
TABLE 5.1D – SOUTHERN ARKANSAS UNIVERSITY – MAGNOLIA (CONT.) AUXILIARY ENTERPRISES
5 yr2010-11 2011-12 2012-13 2013-14 2014-15 2015-16 % Incr
RevenuesIntercollegiate Athletics 1,195,319$ 1,223,878$ 1,200,237$ 1,225,933$ 1,563,198$ 1,806,051$ 51.1%Resident Halls 4,226,163$ 4,594,373$ 4,439,410$ 4,765,896$ 5,116,141$ 5,554,477$ 31.4%Married Student Housing -$ -$ -$ -$ -$ -$ NAFaculty Housing 20,308$ 21,336$ 16,920$ 22,545$ 15,880$ 14,579$ -28.2%Food Service 2,710,302$ 2,996,553$ 2,928,714$ 3,185,088$ 3,569,436$ 3,860,182$ 42.4%College Union 46,575$ 66,408$ 23,709$ 19,081$ 48,396$ 34,629$ -25.6%Bookstore 268,754$ 227,418$ 207,345$ 201,397$ 209,290$ 194,741$ -27.5%Student Org. and Publications 506,277$ 478,555$ 474,612$ 477,243$ 536,159$ 625,184$ 23.5%Student Health Service 188,156$ 188,329$ 182,406$ 184,598$ 191,246$ 223,069$ 18.6%Other Auxiliary 84,048$ 96,217$ 89,280$ 81,257$ 92,526$ 328,847$ 291.3% Total 9,245,902$ 9,893,067$ 9,562,633$ 10,163,039$ 11,342,270$ 12,641,760$ 36.7%
ExpendituresIntercollegiate Athletics 2,791,677$ 3,312,620$ 2,999,005$ 3,151,817$ 3,654,568$ 3,780,781$ 35.4%Resident Halls 3,039,609$ 2,968,458$ 3,355,626$ 3,340,326$ 2,418,558$ 2,624,843$ -13.6%Married Student Housing -$ -$ -$ -$ -$ -$ NAFaculty Housing 5,433$ 8,102$ 7,700$ 10,023$ 15,716$ 8,831$ 62.5%Food Service 2,054,867$ 2,260,946$ 2,281,469$ 2,521,701$ 2,771,623$ 3,042,773$ 48.1%College Union 204,533$ 195,189$ 185,304$ 176,882$ 247,523$ 256,377$ 25.3%Bookstore 6,676$ 8,311$ 9,212$ 9,480$ 10,570$ 10,808$ 61.9%Student Org. and Publications 428,259$ 323,408$ 475,765$ 396,383$ 416,722$ 458,383$ 7.0%Student Health Service 193,101$ 203,368$ 205,118$ 191,614$ 199,969$ 200,919$ 4.0%Other Auxiliary 135,707$ 139,595$ 146,078$ 153,618$ 165,500$ 237,746$ 75.2% Total 8,859,862$ 9,419,996$ 9,665,277$ 9,951,843$ 9,900,749$ 10,621,461$ 19.9%
Transfers/Debt ServiceIntercollegiate Athletics 84,676$ 90,016$ 88,564$ 116,669$ 1,808,849$ 88,631$ 4.7%Resident Halls 611,652$ 640,961$ 809,773$ 1,063,540$ -$ 1,665,024$ 172.2%Married Student Housing -$ -$ -$ -$ -$ -$ NAFaculty Housing -$ -$ -$ -$ -$ -$ NAFood Service -$ -$ -$ -$ -$ -$ NACollege Union 29,466$ 29,453$ 29,439$ 29,425$ -$ 29,518$ 0.2%Bookstore -$ -$ -$ -$ -$ -$ NAStudent Org. and Publications -$ -$ -$ -$ -$ -$ NAStudent Health Service -$ -$ -$ -$ -$ -$ NAOther Auxiliary -$ -$ -$ -$ -$ -$ NA Total 725,794$ 760,430$ 927,776$ 1,209,633$ 1,808,849$ 1,783,172$ 145.7%
Excess of Revenues (339,754)$ (287,360)$ (1,030,420)$ (998,438)$ (367,328)$ 237,127$ NA
Special TransfersAuxiliary Transfer Policy 1,142,715$ 1,154,142$ 1,183,487$ 1,214,927$ 1,235,581$ 1,255,350$ 9.9%Other Auxilary Transfer (17,955)$ (117,538)$ 3,024$ (192,389)$ (582,342)$ (47,803)$ NA Total 1,124,760$ 1,036,604$ 1,186,511$ 1,022,538$ 653,239$ 1,207,547$ 7.4%
Total Excess of Revenues 785,006$ 749,244$ 156,091$ 24,100$ 285,911$ 1,444,674$

74 Back to Table of Contents
TABLE 5.1E – UNIVERSITY OF ARKANSAS – FAYETTEVILLE UNRESTRICTED EDUCATIONAL & GENERAL
Note: UAF data includes Fayetteville Campus only
5 yr2010-11 2011-12 2012-13 2013-14 2014-15 2015-16 % Incr
Unrestricted E&G RevenuesTuition & Fees 149,585,188$ 180,261,378$ 193,794,040$ 220,938,774$ 247,779,330$ 265,662,890$ 77.6%Gov. Appropriations Federal -$ -$ -$ -$ -$ -$ NA State 121,756,787$ 123,326,980$ 122,833,189$ 126,748$ 127,319,008$ 127,579,023$ 4.8% Local -$ -$ -$ -$ -$ -$ NAGrants & Contracts Federal -$ -$ -$ -$ -$ -$ NA State -$ -$ -$ -$ -$ -$ NA Local -$ -$ -$ -$ -$ -$ NAPrivate Gifts, Grants and Contracts 4,124,878$ 5,282,076$ 5,250,893$ 4,805,717$ 4,761,721$ 4,418,466$ 7.1%Endow ment Income 389,093$ 613,510$ 1,271,547$ 852,136$ 897,953$ 939,020$ 141.3%Sales and Services Educational Actvities 13,929,509$ 15,121,313$ 7,625,219$ 8,834,317$ 8,777,174$ 8,666,183$ -37.8%
Hospitals -$ -$ -$ -$ -$ -$ NAOther Investments 3,522,758$ 4,071,850$ 1,344,656$ 4,079,364$ -$ -$ -100.0%Other 6,434,785$ 7,301,680$ 8,311,410$ 7,815,954$ 7,819,040$ 10,639,832$ 65.3% Total 299,742,998$ 335,978,787$ 340,430,954$ 247,453,010$ 397,354,226$ 417,905,414$ 39.4%
Unrestricted E&G ExpendituresTeaching Salaries 65,033,318$ 85,950,495$ 76,759,666$ 84,281,551$ 86,496,327$ 86,922,832$ 33.7%Dept. Oper. Expense 50,594,311$ 33,740,115$ 50,152,291$ 58,015,843$ 66,573,249$ 75,776,047$ 49.8%Off-Campus Credit 1,836,901$ 2,108,839$ 1,140,680$ 1,672,010$ 1,647,791$ 1,834,880$ -0.1%Non-Credit Instruction 1,466,693$ 1,370,114$ 1,740,074$ 1,945,063$ 2,010,923$ 1,912,456$ 30.4%Research 13,461,989$ 14,194,388$ 16,615,244$ 16,389,336$ 18,736,099$ 24,640,236$ 83.0%Public Service 9,270,283$ 10,070,709$ 10,656,261$ 11,057,804$ 13,347,733$ 9,755,558$ 5.2%Libraries 10,672,972$ 12,174,200$ 12,307,292$ 12,954,526$ 13,195,562$ 13,570,734$ 27.2%Museums & Galleries 85,355$ 95,897$ 102,190$ 101,752$ 125,878$ 140,866$ 65.0%Organized Activities 353,547$ 343,991$ 323,099$ 331,766$ 316,574$ 383,432$ 8.5%Other Academic Support 19,104,715$ 20,904,976$ 24,198,083$ 23,726,043$ 25,170,579$ 25,989,724$ 36.0%Student Services 18,524,794$ 22,018,462$ 24,415,959$ 23,593,255$ 24,924,886$ 26,116,788$ 41.0%Institutional Support 31,558,507$ 39,129,735$ 40,781,661$ 42,033,897$ 40,106,131$ 41,180,124$ 30.5%Utilities 12,875,957$ 12,841,471$ 14,447,668$ 16,188,519$ 16,371,243$ 13,776,937$ 7.0%Other Plant Maintenance 15,551,292$ 14,145,222$ 4,120,941$ 3,695,916$ 6,308,206$ 10,267,225$ -34.0%Scholarships & Fellow ships 13,843,726$ 14,486,976$ 15,647,597$ 16,391,032$ 16,709,667$ 16,952,988$ 22.5%Other 5,566,113$ 6,250,608$ -$ 7,582,190$ 8,548,489$ 7,594,186$ 36.4%Transfers - Auxiliary 156,340$ 156,487$ 6,504,701$ 327,973$ -$ -$ -100.0%Transfers - Mandatory 12,651,930$ 19,836,977$ 319,465$ 25,970,696$ 27,617,251$ 27,605,180$ 118.2%Transfers -Non Mandatory 11,718,184$ 9,429,698$ 21,056,583$ 21,028,335$ 20,561,186$ 18,851,268$ 60.9% Total 294,326,927$ 319,249,360$ 321,289,455$ 367,287,507$ 388,767,774$ 403,271,461$ 37.0%
Source: Revenues from ADHE Series 17-1; Expenditures from ADHE Series 17-7a.

75 Back to Table of Contents
TABLE 5.1E – UNIVERSITY OF ARKANSAS – FAYETTEVILLE (CONT.) AUXILIARY ENTERPRISES
5 yr2010-11 2011-12 2012-13 2013-14 2014-15 2015-16 % Incr
RevenuesIntercollegiate Athletics 68,414,864$ 74,022,230$ 78,546,872$ 74,443,128$ 91,533,243$ 103,331,477$ 51.0%Resident Halls 31,026,439$ 33,881,602$ 35,008,912$ 37,268,634$ 37,157,368$ 43,524,469$ 40.3%Married Student Housing -$ -$ -$ -$ -$ -$ NAFaculty Housing -$ -$ -$ -$ -$ -$ NAFood Service -$ -$ -$ -$ -$ -$ NACollege Union 3,194,606$ 850,915$ 7,851$ 12,201$ -$ 25,651$ -99.2%Bookstore 16,705,062$ 18,487,696$ 18,252,681$ 17,697,741$ 17,685,978$ 16,155,924$ -3.3%Student Org. and Publications 1,466,403$ 2,117,080$ 4,147,392$ 2,094,463$ 6,417,730$ 2,327,582$ 58.7%Student Health Service 5,786,634$ 5,660,313$ 11,872,263$ 6,840,040$ 9,797,078$ 9,572,405$ 65.4%Other Auxiliary 9,159,084$ 9,765,329$ 10,383,349$ 9,656,859$ 10,092,925$ 11,415,938$ 24.6% Total 135,753,092$ 144,785,165$ 158,219,320$ 148,013,066$ 172,684,322$ 186,353,446$ 37.3%
ExpendituresIntercollegiate Athletics 53,873,378$ 57,067,821$ 59,087,800$ 63,435,004$ 67,994,139$ 76,774,773$ 42.5%Resident Halls 15,567,173$ 17,507,321$ 16,550,274$ 15,984,289$ 16,400,165$ 17,300,065$ 11.1%Married Student Housing -$ -$ -$ -$ -$ -$ NAFaculty Housing -$ -$ -$ -$ -$ -$ NAFood Service -$ -$ -$ -$ -$ -$ NACollege Union 2,161,732$ 1,165,546$ 511,018$ 485,078$ 5,062$ 573,509$ -73.5%Bookstore 16,608,134$ 17,938,775$ 17,988,848$ 17,178,978$ 16,569,879$ 15,465,010$ -6.9%Student Org. and Publications 1,425,213$ 1,615,334$ 1,593,636$ 1,720,877$ 3,443,844$ 1,762,023$ 23.6%Student Health Service 5,017,731$ 5,579,495$ 6,452,663$ 6,815,019$ 7,411,272$ 7,959,435$ 58.6%Other Auxiliary 4,849,322$ 5,273,858$ 4,488,109$ 5,167,232$ 4,610,312$ 5,685,363$ 17.2% Total 99,502,683$ 106,148,150$ 106,672,348$ 110,786,477$ 116,434,673$ 125,520,178$ 26.1%
NATransfers/Debt ServiceIntercollegiate Athletics 7,466,434$ 6,711,354$ 9,806,660$ 9,406,393$ 9,921,783$ 9,931,162$ 33.0%Resident Halls 8,391,351$ 9,450,744$ 10,547,796$ 12,803,952$ 13,336,331$ 12,562,881$ 49.7%Married Student Housing -$ -$ -$ -$ -$ -$ NAFaculty Housing -$ -$ -$ -$ -$ -$ NAFood Service -$ -$ -$ -$ -$ -$ NACollege Union 1,045,049$ 29,492$ -$ -$ -$ -$ -100.0%Bookstore 847,359$ 880,194$ 908,751$ 940,870$ 1,191,042$ 977,933$ 15.4%Student Org. and Publications 216,042$ 158,962$ 159,017$ 158,931$ 349,152$ -$ -100.0%Student Health Service 283,422$ -$ -$ -$ -$ -$ -100.0%Other Auxiliary 3,186,281$ 3,505,035$ 3,996,463$ 4,074,628$ 4,017,441$ 3,725,110$ 16.9% Total 21,435,938$ 20,735,781$ 25,418,687$ 27,384,774$ 28,815,749$ 27,197,086$ 26.9%
Excess of Revenues 14,814,471$ 17,901,234$ 26,128,285$ 9,841,815$ 27,433,900$ 33,636,182$ 127.0%
Special TransfersAuxiliary Transfer Policy -$ -$ -$ -$ -$ -$ NAOther Auxilary Transfer (5,981,794)$ (18,399,827)$ (14,056,360)$ (8,077,477)$ (26,921,109)$ (28,552,627)$ NA Total (5,981,794)$ (18,399,827)$ (14,056,360)$ (8,077,477)$ (26,921,109)$ (28,552,627)$ NA
Total Excess of Revenues 8,832,677$ (498,593)$ 12,071,925$ 1,764,338$ 512,791$ 5,083,555$

76 Back to Table of Contents
TABLE 5.1F – UNIVERSITY OF ARKANSAS – FORT SMITH UNRESTRICTED EDUCATIONAL & GENERAL
5 yr2010-11 2011-12 2012-13 2013-14 2014-15 2015-16 % Incr
Unrestricted E&G RevenuesTuition & Fees 28,927,962$ 30,392,284$ 30,711,408$ 30,637,282$ 30,930,319$ 32,108,775$ 11.0%Gov. Appropriations Federal -$ -$ -$ -$ -$ -$ NA State 23,180,319$ 23,409,945$ 23,457,702$ 23,606,939$ 23,869,198$ 23,895,393$ 3.1% Local 5,396,507$ 5,658,795$ 5,508,890$ 5,654,987$ 5,839,679$ 5,926,910$ 9.8%Grants & Contracts Federal 639,658$ 122,700$ -$ -$ -$ -$ -100.0% State 14,115$ 41,893$ 14,525$ 7,237$ 3,285$ -100.0% Local -$ -$ -$ -$ -$ -$ NAPrivate Gifts, Grants and Contracts 32,524$ 37,383$ 99,839$ 127,922$ 440,530$ 418,472$ 1186.7%Endow ment Income 6,844$ 2,405$ -$ 9,239$ 25,893$ 15,076$ 120.3%Sales and Services Educational Actvities 266,485$ 291,218$ 327,460$ 285,282$ 329,856$ 426,961$ 60.2%
Hospitals -$ -$ -$ -$ -$ -$ NAOther Investments 6,594$ 6,979$ -$ 3,237$ 4,463$ 8,911$ 35.1%Other 353,685$ 378,202$ 461,463$ 353,700$ 347,194$ 796,338$ 125.2% Total 58,824,693$ 60,341,804$ 60,581,287$ 60,685,825$ 61,790,417$ 63,596,836$ 8.1%
Unrestricted E&G ExpendituresTeaching Salaries 13,976,489$ 15,058,106$ 15,236,073$ 15,136,986$ 15,743,041$ 14,482,269$ 3.6%Dept. Oper. Expense 6,180,808$ 6,851,631$ 6,521,138$ 7,018,600$ 5,997,498$ 6,697,809$ 8.4%Off-Campus Credit 45,625$ 71,829$ 87,758$ 70,550$ 117,036$ 74,604$ 63.5%Non-Credit Instruction 730,758$ 600,279$ 618,559$ 695,357$ 819,706$ 594,199$ -18.7%Research -$ -$ -$ -$ -$ -$ NAPublic Service 395,750$ 580,338$ 650,206$ 825,688$ 658,992$ 326,094$ -17.6%Libraries 1,144,356$ 1,109,254$ 1,227,030$ 1,162,423$ 1,056,952$ 1,159,668$ 1.3%Museums & Galleries 52,233$ 104,287$ 90,466$ 77,395$ 90,349$ 124,874$ 139.1%Organized Activities 21,079$ 33,489$ 51,935$ 54,409$ 57,452$ 16,686$ -20.8%Other Academic Support 7,150,352$ 6,918,028$ 7,209,111$ 6,531,547$ 5,718,619$ 5,602,943$ -21.6%Student Services 4,084,254$ 4,169,924$ 4,700,784$ 4,779,010$ 4,621,598$ 4,555,993$ 11.6%Institutional Support 8,665,073$ 8,983,596$ 9,919,399$ 10,067,625$ 9,637,273$ 9,764,882$ 12.7%Utilities 1,738,153$ -$ 1,527,649$ 1,539,114$ 1,483,142$ 1,597,027$ -8.1%Other Plant Maintenance 4,195,912$ 6,633,076$ 3,863,041$ 3,877,037$ 3,823,134$ 3,987,342$ -5.0%Scholarships & Fellow ships 3,646,079$ 3,901,532$ 4,460,697$ 5,049,592$ 5,212,711$ 5,265,979$ 44.4%Other -$ -$ -$ -$ -$ -$ NATransfers - Auxiliary -$ -$ -$ -$ -$ -$ NATransfers - Mandatory 3,176,001$ 4,489,240$ 4,271,186$ 4,692,676$ 5,403,506$ 5,402,421$ 70.1%Transfers -Non Mandatory 3,258,473$ 1,743,751$ 93,976$ (910,002)$ (595,953)$ 2,523,749$ -22.5% Total 58,461,395$ 61,248,360$ 60,529,008$ 60,668,007$ 59,845,056$ 62,176,539$ 6.4%
Source: Revenues from ADHE Series 17-1; Expenditures from ADHE Series 17-7a.

77 Back to Table of Contents
TABLE 5.1F – UNIVERSITY OF ARKANSAS – FORT SMITH (CONT.) AUXILIARY ENTERPRISES
5 yr2010-11 2011-12 2012-13 2013-14 2014-15 2015-16 % Incr
RevenuesIntercollegiate Athletics 2,736,136$ 2,826,112$ 2,943,586$ 3,037,910$ 2,936,457$ 2,740,167$ 0.1%Resident Halls 3,566,889$ 3,993,363$ 4,409,460$ 4,470,278$ 4,590,046$ 4,455,838$ 24.9%Married Student Housing -$ -$ -$ -$ -$ -$ NAFaculty Housing -$ -$ -$ -$ -$ -$ NAFood Service 863,817$ 1,022,953$ 1,277,124$ 1,561,922$ 1,445,346$ 1,368,626$ 58.4%College Union -$ -$ -$ -$ -$ -$ NABookstore 494,513$ 501,273$ 480,496$ 436,870$ 455,857$ 397,848$ -19.5%Student Org. and Publications 2,731,567$ 2,485,462$ 2,427,864$ 2,347,625$ 2,228,091$ 2,018,923$ -26.1%Student Health Service -$ -$ -$ -$ -$ -$ NAOther Auxiliary 46,896$ 252,915$ 339,638$ 264,429$ 251,680$ 219,752$ 368.6% Total 10,439,818$ 11,082,078$ 11,878,168$ 12,119,034$ 11,907,477$ 11,201,154$ 7.3%
ExpendituresIntercollegiate Athletics 2,935,395$ 3,124,143$ 3,473,567$ 3,579,338$ 3,504,171$ 3,522,973$ 20.0%Resident Halls 2,598,472$ 1,659,216$ 1,578,943$ 1,605,606$ 1,602,817$ 1,668,551$ -35.8%Married Student Housing -$ -$ -$ -$ -$ -$ NAFaculty Housing -$ -$ -$ -$ -$ -$ NAFood Service 815,366$ 1,004,680$ 1,122,551$ 1,395,908$ 1,306,659$ 1,230,700$ 50.9%College Union 45,405$ 43,349$ 47,640$ -$ -100.0%Bookstore -$ -$ 1,090$ 19,336$ 22,727$ 23,657$ NAStudent Org. and Publications 1,270,608$ 906,753$ 734,825$ 750,461$ 691,314$ 737,197$ -42.0%Student Health Service -$ -$ -$ -$ NAOther Auxiliary 123,414$ 541,857$ 545,428$ 553,280$ 507,722$ 494,014$ 300.3% Total 7,788,660$ 7,279,998$ 7,504,044$ 7,903,929$ 7,635,410$ 7,677,092$ -1.4%
Transfers/Debt ServiceIntercollegiate Athletics -$ -$ -$ -$ -$ -$ NAResident Halls 2,305,599$ 2,947,945$ 2,729,029$ 3,174,455$ 3,090,269$ 3,134,819$ 36.0%Married Student Housing -$ -$ -$ -$ -$ -$ NAFaculty Housing -$ -$ -$ -$ -$ -$ NAFood Service -$ -$ -$ -$ -$ -$ NACollege Union -$ -$ -$ -$ -$ -$ NABookstore -$ -$ -$ -$ -$ -$ NAStudent Org. and Publications -$ -$ -$ -$ -$ -$ NAStudent Health Service -$ -$ -$ -$ -$ -$ NAOther Auxiliary -$ -$ -$ -$ -$ -$ NA Total 2,305,599$ 2,947,945$ 2,729,029$ 3,174,455$ 3,090,269$ 3,134,819$ 36.0%
Excess of Revenues 345,559$ 854,135$ 1,645,095$ 1,040,650$ 1,181,798$ 389,243$ 12.6%
Special TransfersAuxiliary Transfer Policy -$ -$ -$ 538,330$ 548,126$ 774,936$ NAOther Auxilary Transfer (2,135,725)$ (206,421)$ (1,500,000)$ (1,570,047)$ (1,727,535)$ (1,158,852)$ NA Total (2,135,725)$ (206,421)$ (1,500,000)$ (1,031,717)$ (1,179,409)$ (383,916)$ NA
Total Excess of Revenues (1,790,166)$ 647,714$ 145,095$ 8,933$ 2,389$ 5,327$

78 Back to Table of Contents
TABLE 5.1G – UNIVERSITY OF ARKANSAS – LITTLE ROCK UNRESTRICTED EDUCATIONAL & GENERAL
Note: UALR data includes Research and Public Service (RAPS)
5 yr2010-11 2011-12 2012-13 2013-14 2014-15 2015-16 % Incr
Unrestricted E&G RevenuesTuition & Fees 69,689,299$ 73,272,098$ 75,016,539$ 75,294,685$ 76,282,140$ 74,498,288$ 6.9%Gov. Appropriations Federal -$ -$ -$ -$ -$ -$ NA State 65,172,451$ 66,302,633$ 61,947,921$ 62,376,826$ 62,522,680$ 62,628,168$ -3.9% Local -$ -$ -$ -$ -$ -$ NAGrants & Contracts Federal 2,216,880$ 2,063,459$ 1,818,262$ 1,552,622$ 1,025,481$ 1,260,936$ -43.1% State 246,658$ 777,374$ 751,990$ 336,307$ 746,634$ 770,498$ 212.4% Local -$ -$ -$ -$ -$ -$ NAPrivate Gifts, Grants and Contracts 676,408$ 1,164,067$ 1,127,487$ 1,037,456$ 1,030,970$ 918,205$ 35.7%Endow ment Income -$ -$ -$ -$ -$ -$ NASales and Services Educational Actvities 1,560,949$ 1,602,028$ 1,090,804$ 934,404$ 943,400$ 1,143,569$ -26.7%
Hospitals -$ -$ -$ -$ -$ -$ NAOther Investments 375,963$ 469,990$ 137,288$ 417,948$ 110,622$ 330,043$ -12.2%Other 2,258,452$ 2,209,535$ 2,466,539$ 3,522,535$ 2,078,795$ 2,114,804$ -6.4% Total 142,197,060$ 147,861,184$ 144,356,830$ 145,472,783$ 144,740,722$ 143,664,511$ 1.0%
Unrestricted E&G ExpendituresTeaching Salaries 31,299,485$ 32,536,297$ 33,053,894$ 31,873,615$ 31,441,053$ 30,629,572$ -2.1%Dept. Oper. Expense 20,881,444$ 20,781,516$ 21,115,230$ 20,396,564$ 19,617,055$ 19,215,867$ -8.0%Off-Campus Credit 1,081,399$ 1,096,958$ 1,582,995$ 1,380,757$ 1,233,539$ 1,269,733$ 17.4%Non-Credit Instruction 485,771$ 524,112$ 354,017$ 369,144$ 401,379$ 563,717$ 16.0%Research 4,767,950$ 4,925,782$ 3,913,854$ 3,897,441$ 3,566,047$ 3,352,722$ -29.7%Public Service 3,185,453$ 3,319,978$ 1,191,853$ 1,288,973$ 1,292,697$ 1,043,076$ -67.3%Libraries 4,709,252$ 4,953,163$ 5,142,755$ 4,516,168$ 4,634,792$ 4,589,383$ -2.5%Museums & Galleries 64,774$ 65,782$ 66,926$ 66,856$ 68,033$ 68,778$ 6.2%Organized Activities 792,118$ 773,951$ 883,372$ 761,633$ 656,260$ 716,101$ -9.6%Other Academic Support 15,113,885$ 15,678,795$ 16,978,769$ 15,176,375$ 15,886,977$ 14,848,257$ -1.8%Student Services 7,315,208$ 8,067,728$ 8,613,004$ 8,688,023$ 8,059,803$ 7,991,230$ 9.2%Institutional Support 12,680,851$ 13,201,189$ 13,311,077$ 14,388,911$ 14,126,588$ 13,823,421$ 9.0%Utilities 3,192,690$ 3,611,148$ 3,618,366$ 3,483,865$ 3,487,523$ 2,680,787$ -16.0%Other Plant Maintenance 7,163,189$ 7,254,365$ 7,510,489$ 7,298,729$ 7,721,151$ 8,175,158$ 14.1%Scholarships & Fellow ships 13,401,721$ 14,272,031$ 16,358,513$ 17,575,594$ 19,071,861$ 18,914,406$ 41.1%Other 3,427,661$ 3,941,510$ 4,208,572$ 3,160,585$ 2,624,713$ 2,363,279$ -31.1%Transfers - Auxiliary 2,311,089$ -$ 3,931,756$ 3,055,097$ 3,814,725$ 4,002,369$ 73.2%Transfers - Mandatory 5,203,439$ 4,405,057$ 4,253,858$ 4,483,221$ 5,607,948$ 6,263,815$ 20.4%Transfers -Non Mandatory 3,704,134$ 7,460,968$ (1,732,470)$ 3,611,232$ 1,032,991$ 3,820,598$ 3.1% Total 140,781,513$ 146,870,330$ 144,356,830$ 145,472,783$ 144,345,135$ 144,332,269$ 2.5%
Source: Revenues from ADHE Series 17-1; Expenditures from ADHE Series 17-7a.

79 Back to Table of Contents
TABLE 5.1G – UNIVERSITY OF ARKANSAS – LITTLE ROCK (CONT.) AUXILIARY ENTERPRISES
5 yr2010-11 2011-12 2012-13 2013-14 2014-15 2015-16 % Incr
RevenuesIntercollegiate Athletics 5,434,140$ 5,960,569$ 6,162,837$ 6,277,717$ 6,146,270$ 6,461,495$ 18.9%Resident Halls 2,791,902$ 4,153,207$ 5,132,478$ 5,942,118$ 6,089,974$ 6,876,580$ 146.3%Married Student Housing -$ -$ -$ -$ -$ -$ NAFaculty Housing -$ -$ -$ -$ -$ -$ NAFood Service -$ 1,873,858$ 2,318,585$ 2,518,485$ 2,627,624$ 3,136,726$ NACollege Union 537,711$ 1,060,953$ 610,801$ 584,458$ 566,734$ 576,179$ 7.2%Bookstore 648,521$ 859,155$ 505,143$ 479,770$ 440,309$ 414,498$ -36.1%Student Org. and Publications 689,397$ 710,050$ 704,722$ 624,262$ 707,400$ 990,954$ 43.7%Student Health Service -$ -$ -$ -$ -$ -$ NAOther Auxiliary 1,404,643$ 1,349,619$ 1,104,389$ 912,138$ 966,392$ 1,049,923$ -25.3% Total 11,506,314$ 15,967,411$ 16,538,955$ 17,338,948$ 17,544,703$ 19,506,355$ 69.5%
ExpendituresIntercollegiate Athletics 6,373,999$ 7,003,160$ 7,110,202$ 7,302,377$ 8,142,568$ 9,104,001$ 42.8%Resident Halls 1,052,179$ 1,645,977$ 2,427,273$ 2,271,712$ 2,133,410$ 2,538,136$ 141.2%Married Student Housing -$ -$ -$ -$ -$ -$ NAFaculty Housing -$ -$ -$ -$ -$ -$ NAFood Service 15,125$ 1,884,280$ 2,365,722$ 2,544,042$ 2,616,748$ 3,058,105$ 20118.9%College Union 1,803,881$ 1,889,399$ 1,818,619$ 1,764,368$ 1,719,878$ 1,714,778$ -4.9%Bookstore -$ -$ -$ -$ -$ -$ NAStudent Org. and Publications 669,085$ 728,697$ 810,684$ 617,595$ 634,528$ 572,634$ -14.4%Student Health Service -$ -$ -$ -$ -$ -$ NAOther Auxiliary 1,125,968$ 1,243,572$ 1,137,394$ 937,699$ 1,096,685$ 963,263$ -14.5% Total 11,040,237$ 14,395,085$ 15,669,894$ 15,437,793$ 16,343,817$ 17,950,917$ 62.6%
Transfers/Debt ServiceIntercollegiate Athletics -$ 76,034$ -$ -$ -$ -$ NAResident Halls -$ 2,953,103$ -$ -$ -$ -$ NAMarried Student Housing -$ -$ -$ -$ -$ -$ NAFaculty Housing -$ -$ -$ -$ -$ -$ NAFood Service -$ -$ -$ -$ -$ -$ NACollege Union -$ 464,071$ -$ -$ -$ -$ NABookstore -$ -$ -$ -$ -$ -$ NAStudent Org. and Publications -$ -$ -$ -$ -$ -$ NAStudent Health Service -$ -$ -$ -$ -$ -$ NAOther Auxiliary 172,191$ 17,744$ 12,808$ 172,191$ 2,458$ 13,516$ -92.2% Total 172,191$ 3,510,952$ 12,808$ 172,191$ 2,458$ 13,516$ -92.2%
Excess of Revenues 293,886$ (1,938,626)$ 856,253$ 1,728,964$ 1,198,428$ 1,541,922$ 424.7%
Special TransfersAuxiliary Transfer Policy 1,885,656$ 2,013,169$ 2,095,368$ 2,732,549$ 3,507,555$ 3,913,484$ 107.5%Other Auxilary Transfer (2,138,798)$ (74,543)$ (2,951,621)$ (4,461,513)$ (4,705,983)$ (5,455,406)$ NA Total (253,142)$ 1,938,626$ (856,253)$ (1,728,964)$ (1,198,428)$ (1,541,922)$ NA
Total Excess of Revenues 40,744$ -$ -$ -$ -$ -$

80 Back to Table of Contents
TABLE 5.1H – UNIVERSITY OF ARKANSAS – MONTICELLO UNRESTRICTED EDUCATIONAL & GENERAL
Note: UAM data only includes Monticello campus.
5 yr2010-11 2011-12 2012-13 2013-14 2014-15 2015-16 % Incr
Unrestricted E&G RevenuesTuition & Fees 12,586,857$ 13,650,730$ 14,055,761$ 14,461,103$ 15,848,763$ 16,265,576$ 29.2%Gov. Appropriations Federal -$ -$ -$ -$ -$ -$ NA State 13,937,501$ 14,057,968$ 14,006,507$ 14,017,775$ 14,156,780$ 14,169,126$ 1.7% Local -$ -$ -$ -$ -$ -$ NAGrants & Contracts Federal -$ -$ -$ -$ -$ -$ NA State -$ -$ -$ -$ -$ -$ NA Local -$ -$ -$ -$ -$ -$ NAPrivate Gifts, Grants and Contracts -$ -$ -$ -$ -$ -$ NAEndow ment Income -$ 40,147$ -$ -$ -$ -$ NASales and Services Educational Actvities 182,519$ 105,007$ 133,875$ 153,307$ 475,820$ 213,297$ 16.9%
Hospitals -$ -$ -$ -$ -$ -$ NAOther Investments 130,712$ 115,275$ 28,068$ 110,813$ 44,109$ 243,611$ 86.4%Other 561,553$ 605,223$ 436,711$ 460,867$ 1,296,482$ 490,710$ -12.6% Total 27,399,142$ 28,574,350$ 28,660,922$ 29,203,865$ 31,821,954$ 31,382,320$ 14.5%
Unrestricted E&G ExpendituresTeaching Salaries 7,119,189$ 9,318,133$ 7,309,458$ 7,135,026$ 7,440,079$ 7,807,246$ 9.7%Dept. Oper. Expense 4,430,402$ 2,491,102$ 4,837,927$ 4,721,174$ 4,522,404$ 4,901,474$ 10.6%Off-Campus Credit -$ -$ -$ -$ -$ -$ NANon-Credit Instruction -$ -$ 53,767$ 47,800$ 34,727$ 42,728$ NAResearch 37,029$ 20,150$ 14,424$ 44,371$ 45,010$ 36,215$ -2.2%Public Service 174,657$ 256,507$ 294,566$ 252,022$ 291,112$ 339,153$ 94.2%Libraries 846,334$ 848,474$ 842,384$ 801,356$ 768,879$ 823,760$ -2.7%Museums & Galleries 67,103$ 122,164$ 95,542$ 82,354$ 122,044$ 66,581$ -0.8%Organized Activities 92,266$ 93,799$ 91,162$ 90,741$ 89,633$ 92,548$ 0.3%Other Academic Support 681,398$ 660,246$ 763,707$ 704,068$ 713,952$ 846,411$ 24.2%Student Services 1,607,492$ 1,650,606$ 1,693,516$ 1,622,367$ 1,712,955$ 1,789,416$ 11.3%Institutional Support 3,428,452$ 4,097,435$ 4,369,330$ 3,921,080$ 4,062,134$ 4,059,878$ 18.4%Utilities 1,056,688$ 1,023,571$ 1,013,994$ 975,019$ 1,025,982$ 969,906$ -8.2%Other Plant Maintenance 2,167,373$ 2,101,335$ 2,213,657$ 2,246,333$ 2,320,888$ 2,341,692$ 8.0%Scholarships & Fellow ships 3,821,758$ 4,319,677$ 4,636,707$ 4,673,347$ 5,138,633$ 5,434,442$ 42.2%Other -$ -$ -$ -$ -$ -$ NATransfers - Auxiliary 857,400$ 600,000$ 750,000$ 1,075,000$ 1,075,000$ 1,162,000$ 35.5%Transfers - Mandatory 234,267$ 377,984$ 444,989$ 418,266$ 418,001$ 417,685$ 78.3%Transfers -Non Mandatory 745,313$ 805,109$ 63,446$ 478,780$ 57,103$ 41,255$ -94.5% Total 27,367,121$ 28,786,292$ 29,488,576$ 29,289,104$ 29,838,536$ 31,172,390$ 13.9%
Source: Revenues from ADHE Series 17-1; Expenditures from ADHE Series 17-7a.

81 Back to Table of Contents
TABLE 5.1H – UNIVERSITY OF ARKANSAS – MONTICELLO (CONT.) AUXILIARY ENTERPRISES
5 yr2010-11 2011-12 2012-13 2013-14 2014-15 2015-16 % Incr
RevenuesIntercollegiate Athletics 912,293$ 916,319$ 838,973$ 770,231$ 789,402$ 719,981$ -21.1%Resident Halls 1,291,105$ 1,085,495$ 1,118,028$ 1,843,314$ 2,231,097$ 2,225,594$ 72.4%Married Student Housing 42,588$ 457,582$ 461,252$ 67,464$ 42,502$ 42,003$ -1.4%Faculty Housing 9,180$ 3,614$ 11,818$ 18,633$ 19,008$ 19,387$ 111.2%Food Service 1,378,859$ 1,623,229$ 1,625,049$ 1,558,560$ 1,846,882$ 1,838,213$ 33.3%College Union -$ -$ -$ -$ -$ -$ NABookstore 1,695,600$ 1,867,616$ 220,885$ 173,185$ 171,978$ 157,376$ -90.7%Student Org. and Publications -$ -$ -$ -$ -$ -$ NAStudent Health Service -$ -$ -$ -$ -$ -$ NAOther Auxiliary 686,459$ 769,332$ 724,200$ 666,523$ 778,334$ 835,440$ 21.7% Total 6,016,084$ 6,723,187$ 5,000,205$ 5,097,910$ 5,879,203$ 5,837,994$ -3.0%
ExpendituresIntercollegiate Athletics 2,850,602$ 3,137,829$ 3,343,430$ 3,114,492$ 3,543,512$ 3,618,777$ 26.9%Resident Halls 558,888$ 487,670$ 545,724$ 689,396$ 676,659$ 674,382$ 20.7%Married Student Housing 3,147$ 13,796$ 14,762$ 3,419$ 4,015$ 4,580$ 45.6%Faculty Housing 9,094$ 3,025$ 4,568$ 3,950$ 1,830$ 3,053$ -66.4%Food Service 1,121,735$ 1,296,873$ 1,302,000$ 1,205,308$ 1,486,868$ 1,479,518$ 31.9%College Union -$ -$ -$ -$ -$ -$ NABookstore 1,526,699$ 1,569,868$ 176,636$ 3,464$ 3,440$ 3,147$ -99.8%Student Org. and Publications -$ -$ -$ -$ -$ -$ NAStudent Health Service -$ -$ -$ -$ -$ -$ NAOther Auxiliary 291,339$ 178,988$ 136,047$ 126,749$ 159,784$ 191,510$ -34.3% Total 6,361,504$ 6,688,049$ 5,523,167$ 5,146,778$ 5,876,108$ 5,974,967$ -6.1%
Transfers/Debt ServiceIntercollegiate Athletics 127,427$ 105,308$ 130,328$ 120,129$ 120,050$ 119,928$ -5.9%Resident Halls 380,111$ 228,013$ 320,565$ 904,040$ 905,484$ 903,284$ 137.6%Married Student Housing -$ 158,450$ 160,196$ -$ -$ -$ NAFaculty Housing -$ -$ -$ -$ -$ -$ NAFood Service -$ -$ -$ -$ -$ -$ NACollege Union -$ -$ -$ -$ -$ -$ NABookstore -$ -$ -$ -$ -$ -$ NAStudent Org. and Publications -$ -$ -$ -$ -$ -$ NAStudent Health Service -$ -$ -$ -$ -$ -$ NAOther Auxiliary -$ -$ -$ -$ -$ -$ NA Total 507,538$ 491,771$ 611,089$ 1,024,169$ 1,025,534$ 1,023,212$ 101.6%
Excess of Revenues (852,957)$ (456,633)$ (1,134,051)$ (1,073,037)$ (1,022,439)$ (1,160,185)$ NA
Special TransfersAuxiliary Transfer Policy 857,400$ 600,000$ 750,000$ 1,075,000 1,075,000 1,162,000 35.5%Other Auxilary Transfer -$ -$ (390,571)$ -$ -$ -$ NA Total 857,400$ 600,000$ 359,429$ 1,075,000$ 1,075,000$ 1,162,000$ 35.5%
Total Excess of Revenues 4,443$ 143,367$ (774,622)$ 1,963$ 52,561$ 1,815$

82 Back to Table of Contents
TABLE 5.1I – UNIVERSITY OF ARKANSAS – PINE BLUFF UNRESTRICTED EDUCATIONAL & GENERAL
Note: UAPB data includes 1890 Land Grant Universities Match
5 yr2010-11 2011-12 2012-13 2013-14 2014-15 2015-16 % Incr
Unrestricted E&G RevenuesTuition & Fees 18,584,185$ 18,913,371$ 17,410,400$ 16,299,058$ 16,844,477$ 17,837,577$ -4.0%Gov. Appropriations Federal -$ -$ -$ -$ -$ -$ NA State 23,289,204$ 23,432,535$ 23,408,769$ 23,428,329$ 23,661,698$ 23,683,131$ 1.7% Local -$ -$ -$ -$ -$ -$ NAGrants & Contracts Federal -$ -$ -$ -$ -$ -$ NA State -$ -$ -$ -$ -$ -$ NA Local -$ -$ -$ -$ -$ -$ NAPrivate Gifts, Grants and Contracts -$ -$ -$ -$ -$ -$ NAEndow ment Income -$ -$ -$ -$ -$ -$ NASales and Services Educational Actvities 78,510$ 79,958$ 106,280$ 72,680$ 53,616$ 55,790$ -28.9%
Hospitals -$ -$ -$ -$ -$ -$ NAOther Investments -$ 40,554$ 46,822$ 55,897$ 47,595$ 49,223$ NAOther 870,618$ 901,610$ 724,860$ 723,710$ 663,010$ 651,992$ -25.1% Total 42,822,517$ 43,368,028$ 41,697,131$ 40,579,674$ 41,270,396$ 42,277,713$ -1.3%
Unrestricted E&G ExpendituresTeaching Salaries 6,831,933$ 7,058,297$ 6,882,427$ 6,665,254$ 6,826,339$ 7,459,039$ 9.2%Dept. Oper. Expense 4,379,383$ 4,884,126$ 4,462,418$ 4,431,291$ 4,721,481$ 5,426,112$ 23.9%Off-Campus Credit 113,342$ 117,793$ 112,728$ 111,436$ 118,061$ 112,094$ -1.1%Non-Credit Instruction 31,981$ 19,655$ 14,679$ 15,965$ 17,932$ 8,063$ -74.8%Research 213,326$ 278,778$ 238,478$ 322,138$ 569,953$ 752,593$ 252.8%Public Service 204,122$ 210,701$ 250,832$ 212,673$ 315,293$ 349,812$ 71.4%Libraries 1,072,084$ 1,114,159$ 1,104,304$ 1,111,404$ 1,123,576$ 1,154,946$ 7.7%Museums & Galleries -$ 801$ 3,617$ 1,500$ 778$ 470$ NAOrganized Activities 690,009$ 2,028,035$ 1,225,640$ 1,600,264$ 1,207,493$ 1,728,068$ 150.4%Other Academic Support 1,693,971$ 1,307,905$ 1,311,449$ 1,231,711$ 1,217,386$ 1,664,797$ -1.7%Student Services 2,982,234$ 3,000,842$ 2,862,465$ 2,847,707$ 3,751,213$ 3,644,184$ 22.2%Institutional Support 5,960,237$ 5,270,588$ 5,378,183$ 6,292,673$ 8,201,263$ 6,862,923$ 15.1%Utilities 1,919,580$ 1,958,680$ 1,658,630$ 1,813,627$ 1,776,359$ 2,010,697$ 4.7%Other Plant Maintenance 3,562,681$ 3,813,945$ 3,870,371$ 4,038,687$ 3,863,592$ 4,282,508$ 20.2%Scholarships & Fellow ships 3,771,935$ 3,908,394$ 3,648,816$ 3,721,224$ 6,022,429$ 7,254,206$ 92.3%Other -$ -$ -$ -$ -$ -$ NATransfers - Auxiliary 1,262,446$ -$ 1,322,446$ 1,322,446$ 1,419,793$ 1,322,446$ 4.8%Transfers - Mandatory 760,359$ -$ 991,172$ 1,203,734$ 961,362$ 1,062,280$ 39.7%Transfers -Non Mandatory 6,060,807$ -$ (4,825)$ (369,023)$ (50,214)$ (52,314)$ -100.9% Total 41,510,430$ 34,972,699$ 35,333,830$ 36,574,711$ 42,064,089$ 45,042,924$ 8.5%
Source: Revenues from ADHE Series 17-1; Expenditures from ADHE Series 17-7a.

83 Back to Table of Contents
TABLE 5.1I – UNIVERSITY OF ARKANSAS – PINE BLUFF (CONT.) AUXILIARY ENTERPRISES
5 yr2010-11 2011-12 2012-13 2013-14 2014-15 2015-16 % Incr
RevenuesIntercollegiate Athletics 3,415,536$ 2,933,756$ 2,485,884$ 2,485,685$ 2,486,258$ 2,329,076$ -31.8%Resident Halls 5,010,713$ 4,955,320$ 5,194,233$ 4,546,723$ 4,504,904$ 5,542,260$ 10.6%Married Student Housing -$ -$ -$ -$ -$ -$ NAFaculty Housing -$ -$ -$ -$ -$ -$ NAFood Service 4,258,672$ 4,161,816$ 3,809,442$ 3,395,693$ 3,409,905$ 4,231,311$ -0.6%College Union 1,434$ 501$ 618$ -$ 321$ 66$ -95.4%Bookstore 162,504$ 156,374$ 151,738$ 140,819$ 151,680$ 151,443$ -6.8%Student Org. and Publications -$ -$ -$ -$ -$ -$ NAStudent Health Service -$ -$ -$ -$ -$ -$ NAOther Auxiliary 300,370$ 315,001$ 343,570$ 284,517$ 253,590$ 318,720$ 6.1% Total 13,149,229$ 12,522,768$ 11,985,485$ 10,853,437$ 10,806,658$ 12,572,876$ -4.4%
ExpendituresIntercollegiate Athletics 5,344,415$ 5,706,075$ 5,699,206$ 5,644,168$ 5,855,348$ 5,934,415$ 11.0%Resident Halls 2,594,606$ 2,472,795$ 2,237,303$ 2,315,410$ 2,423,085$ 2,379,307$ -8.3%Married Student Housing -$ -$ -$ -$ -$ -$ NAFaculty Housing -$ -$ -$ -$ -$ -$ NAFood Service 2,784,305$ 2,960,608$ 2,653,131$ 2,346,940$ 2,630,196$ 2,873,494$ 3.2%College Union 283,676$ 286,608$ 192,115$ 234,490$ 206,971$ 263,113$ -7.2%Bookstore 1,966$ 1,730$ 1,738$ 1,943$ 3,058$ 2,819$ 43.4%Student Org. and Publications -$ -$ -$ -$ -$ -$ NAStudent Health Service -$ -$ -$ -$ -$ -$ NAOther Auxiliary 810,713$ 676,992$ 608,299$ 542,887$ 969,331$ 788,489$ -2.7% Total 11,819,681$ 12,104,808$ 11,391,792$ 11,085,838$ 12,087,989$ 12,241,637$ 3.6%
Transfers/Debt ServiceIntercollegiate Athletics -$ -$ -$ 1,210,920$ 246,167$ 248,108$ NAResident Halls -$ -$ -$ 828,305$ 681,136$ 773,768$ NAMarried Student Housing -$ -$ -$ -$ -$ -$ NAFaculty Housing -$ -$ -$ -$ -$ -$ NAFood Service -$ -$ -$ -$ -$ -$ NACollege Union -$ -$ -$ -$ -$ -$ NABookstore -$ -$ -$ -$ -$ -$ NAStudent Org. and Publications -$ -$ -$ -$ -$ -$ NAStudent Health Service -$ -$ -$ -$ -$ -$ NAOther Auxiliary -$ -$ -$ -$ -$ -$ NA Total -$ -$ -$ 2,039,225$ 927,303$ 1,021,876$ NA
Excess of Revenues 1,329,548$ 417,960$ 593,693$ (2,271,626)$ (2,208,634)$ (690,637)$ -151.9%
Special TransfersAuxiliary Transfer Policy 1,078,234$ 1,078,234$ 1,138,234$ 1,138,234$ 1,235,581$ 1,138,234$ 5.6%Other Auxilary Transfer (1,232,115)$ (1,220,889)$ (1,217,306)$ 184,212$ 184,212$ 184,212$ NA Total (153,881)$ (142,655)$ (79,072)$ 1,322,446$ 1,419,793$ 1,322,446$ NA
Total Excess of Revenues 1,175,667$ 275,305$ 514,621$ (949,180)$ (788,841)$ 631,809$

84 Back to Table of Contents
TABLE 5.1J – UNIVERSITY OF CENTRAL ARKANSAS UNRESTRICTED EDUCATIONAL & GENERAL
5 yr2010-11 2011-12 2012-13 2013-14 2014-15 2015-16 % Incr
Unrestricted E&G RevenuesTuition & Fees 68,951,666$ 69,777,090$ 70,905,385$ 74,907,396$ 80,038,287$ 81,892,796$ 18.8%Gov. Appropriations Federal -$ -$ -$ -$ -$ -$ NA State 56,494,605$ 57,148,643$ 56,831,814$ 61,934,274$ 58,319,734$ 58,475,054$ 3.5% Local -$ -$ -$ -$ -$ -$ NAGrants & Contracts Federal -$ -$ -$ -$ -$ -$ NA State -$ -$ -$ -$ -$ -$ NA Local -$ -$ -$ -$ -$ -$ NAPrivate Gifts, Grants and Contracts -$ -$ -$ -$ -$ -$ NAEndow ment Income -$ -$ -$ -$ -$ -$ NASales and Services Educational Actvities 2,832,601$ 2,383,172$ 2,298,188$ 2,455,336$ 2,396,396$ 2,269,772$ -19.9%
Hospitals -$ -$ -$ -$ -$ -$ NAOther Investments 295,766$ 347,587$ 329,749$ 388,220$ 470,896$ 582,648$ 97.0%Other 123,652$ 9,991$ 7,012$ 2,024$ 789$ 999$ -99.2% Total 128,698,289$ 129,666,483$ 130,372,148$ 139,687,250$ 141,226,102$ 143,221,269$ 11.3%
Unrestricted E&G ExpendituresTeaching Salaries 31,015,150$ 32,833,436$ 32,912,144$ 33,889,922$ 35,392,570$ 36,560,927$ 17.9%Dept. Oper. Expense 21,382,096$ 20,778,375$ 21,820,600$ 21,220,813$ 22,125,046$ 22,727,228$ 6.3%Off-Campus Credit 302,433$ 234,646$ 208,049$ 122,970$ 58,562$ -$ -100.0%Non-Credit Instruction 591,728$ 394,781$ 470,207$ 384,478$ 441,852$ 374,549$ -36.7%Research 973,363$ 1,163,275$ 1,317,509$ 1,080,117$ 1,249,610$ 1,103,089$ 13.3%Public Service 2,519,627$ 2,725,590$ 2,410,500$ 2,188,577$ 2,605,832$ 2,731,028$ 8.4%Libraries 2,674,160$ 3,130,713$ 3,147,314$ 3,506,172$ 3,547,621$ 3,313,472$ 23.9%Museums & Galleries 114,376$ 108,925$ 111,969$ 111,586$ 106,763$ 115,558$ 1.0%Organized Activities 455,112$ 460,928$ 479,667$ 509,603$ 415,804$ 453,279$ -0.4%Other Academic Support 7,182,572$ 7,606,154$ 7,468,616$ 7,440,205$ 8,516,384$ 9,420,747$ 31.2%Student Services 6,193,494$ 6,108,363$ 6,527,359$ 6,888,701$ 6,704,160$ 6,813,301$ 10.0%Institutional Support 10,329,116$ 10,657,435$ 10,116,257$ 10,668,137$ 12,685,431$ 13,349,383$ 29.2%Utilities 2,316,111$ 2,214,736$ 2,084,301$ 2,151,226$ 2,072,839$ 1,852,657$ -20.0%Other Plant Maintenance 9,775,936$ 10,206,630$ 10,616,866$ 11,130,206$ 11,659,321$ 12,050,178$ 23.3%Scholarships & Fellow ships 18,698,237$ 17,632,401$ 16,970,190$ 17,978,841$ 18,588,058$ 20,685,146$ 10.6%Other 50,377$ 915$ 2,575$ -$ -$ -$ -100.0%Transfers - Auxiliary 797,715$ 683,315$ 397,281$ 1,444,228$ 1,483,867$ 1,825,356$ 128.8%Transfers - Mandatory 2,262,055$ 3,156,918$ 3,372,865$ 3,154,131$ 3,461,546$ 3,442,936$ 52.2%Transfers -Non Mandatory 8,253,482$ 4,266,834$ 6,192,435$ 15,584,327$ 2,052,847$ 16,267,815$ 97.1% Total 125,887,141$ 124,364,369$ 126,626,704$ 139,454,240$ 133,168,113$ 153,086,649$ 21.6%
Source: Revenues from ADHE Series 17-1; Expenditures from ADHE Series 17-7a.

85 Back to Table of Contents
TABLE 5.1J – UNIVERSITY OF CENTRAL ARKANSAS (CONT.) AUXILIARY ENTERPRISES
5 yr2010-11 2011-12 2012-13 2013-14 2014-15 2015-16 % Incr
RevenuesIntercollegiate Athletics 6,212,841$ 6,709,934$ 7,492,275$ 7,333,166$ 7,634,435$ 7,629,923$ 22.8%Resident Halls 13,889,538$ 14,156,146$ 14,507,714$ 15,488,163$ 16,274,060$ 16,930,645$ 21.9%Married Student Housing -$ -$ -$ -$ -$ -$ NAFaculty Housing -$ -$ -$ -$ -$ -$ NAFood Service 7,038,882$ 7,875,535$ 8,279,346$ 8,759,297$ 9,103,480$ 9,666,144$ 37.3%College Union 1,334,428$ 1,350,035$ 1,339,860$ 1,315,007$ 1,332,128$ 1,340,662$ 0.5%Bookstore 350,144$ 350,000$ 365,000$ 455,948$ 434,227$ 421,653$ 20.4%Student Org. and Publications -$ -$ -$ -$ -$ -$ NAStudent Health Service 1,720,215$ 1,716,300$ 1,653,065$ 1,605,291$ 1,648,466$ 1,661,742$ -3.4%Other Auxiliary 2,203,100$ 3,030,422$ 4,500,720$ 3,408,595$ 3,534,835$ 3,704,060$ 68.1% Total 32,749,148$ 35,188,371$ 38,137,981$ 38,365,467$ 39,961,631$ 41,354,829$ 26.3%
ExpendituresIntercollegiate Athletics 8,404,075$ 8,826,933$ 9,655,847$ 10,456,715$ 11,323,807$ 11,379,069$ 35.4%Resident Halls 8,549,654$ 8,623,707$ 8,483,351$ 7,817,247$ 8,140,307$ 8,414,853$ -1.6%Married Student Housing -$ -$ -$ -$ -$ -$ NAFaculty Housing -$ -$ -$ -$ -$ -$ NAFood Service 5,475,566$ 5,932,784$ 6,186,231$ 6,529,150$ 6,646,114$ 6,944,556$ 26.8%College Union 692,307$ 818,831$ 840,172$ 896,925$ 976,344$ 990,529$ 43.1%Bookstore 68,039$ 69,257$ 69,278$ 75,258$ 71,714$ 69,317$ 1.9%Student Org. and Publications -$ -$ -$ -$ -$ -$ NAStudent Health Service 1,081,481$ 1,292,331$ 1,274,501$ 1,337,488$ 1,415,365$ 1,478,211$ 36.7%Other Auxiliary 870,677$ 1,369,067$ 1,365,367$ 1,409,861$ 1,667,957$ 1,986,620$ 128.2% Total 25,141,798$ 26,932,910$ 27,874,747$ 28,522,644$ 30,241,608$ 31,263,155$ 24.3%
Transfers/Debt ServiceIntercollegiate Athletics 420,826$ 374,455$ 406,235$ 628,604$ 615,919$ 547,265$ 30.0%Resident Halls 3,458,604$ 3,527,584$ 3,809,966$ 4,513,311$ 5,203,353$ 5,187,125$ 50.0%Married Student Housing -$ -$ -$ -$ -$ -$ NAFaculty Housing -$ -$ -$ -$ -$ -$ NAFood Service -$ -$ -$ -$ -$ -$ NACollege Union 48,138$ 224,723$ 226,273$ 225,920$ 228,477$ 227,942$ 373.5%Bookstore -$ -$ -$ -$ -$ -$ NAStudent Org. and Publications -$ -$ -$ -$ -$ -$ NAStudent Health Service 407,365$ 376,201$ 375,068$ 376,998$ 359,533$ 133,960$ -67.1%Other Auxiliary 64,158$ 252,235$ 791,579$ 1,126,319$ 1,129,274$ 784,521$ 1122.8% Total 4,399,090$ 4,755,198$ 5,609,121$ 6,871,152$ 7,536,556$ 6,880,813$ 56.4%
Excess of Revenues 3,208,260$ 3,500,263$ 4,654,113$ 2,971,671$ 2,183,467$ 3,210,861$ 0.1%
Special TransfersAuxiliary Transfer Policy 1,142,715$ 1,154,142$ 1,069,387$ 1,000,000$ 1,000,000$ 1,000,000$ -12.5%Other Auxilary Transfer (1,630,239)$ (3,552,118)$ (5,718,183)$ (3,201,661)$ (727,628)$ (4,007,947)$ NA Total (487,524)$ (2,397,976)$ (4,648,796)$ (2,201,661)$ 272,372$ (3,007,947)$ NA
Total Excess of Revenues 2,720,736$ 1,102,288$ 5,317$ 770,010$ 2,455,839$ 202,914$

86 Back to Table of Contents
TABLE 5.1K – FOUR-YEAR SUMMARY UNRESTRICTED EDUCATIONAL & GENERAL
5 yr2010-11 2011-12 2012-13 2013-14 2014-15 2015-16 % Incr
Unrestricted E&G RevenuesTuition & Fees 518,764,673$ 568,908,667$ 587,833,447$ 628,676,559$ 668,902,504$ 703,491,292$ 35.6%Gov. Appropriations Federal -$ -$ -$ -$ -$ -$ NA State 431,595,218$ 437,597,510$ 431,585,061$ 316,752,075$ 442,316,675$ 443,157,693$ 2.7% Local 5,396,507$ 5,658,795$ 5,508,890$ 5,654,987$ 5,839,679$ 5,926,910$ 9.8%Grants & Contracts Federal 4,752,573$ 4,349,707$ 3,591,584$ 2,797,279$ 2,340,532$ 2,717,141$ -42.8% State 1,059,971$ 1,350,894$ 1,258,721$ 815,685$ 1,277,899$ 1,310,481$ 23.6% Local 269,219$ 261,647$ 267,776$ 123,437$ 94,038$ 76,996$ -71.4%Private Gifts, Grants and Contracts 6,181,238$ 7,546,991$ 7,252,018$ 6,822,426$ 7,328,407$ 7,212,633$ 16.7%Endow ment Income 1,026,278$ 1,186,657$ 2,009,051$ 1,535,773$ 1,922,576$ 2,011,047$ 96.0%Sales and Services NA Educational Actvities 20,658,308$ 21,600,329$ 14,138,899$ 15,427,554$ 15,894,435$ 16,002,613$ -22.5%
Hospitals -$ -$ -$ -$ -$ -$ NAOther Investments 5,244,785$ 6,057,229$ 2,429,120$ 5,583,473$ 1,411,998$ 1,957,290$ -62.7%Other 15,057,099$ 14,919,262$ 17,383,290$ 17,553,389$ 17,348,820$ 23,024,986$ 52.9% Total 1,010,005,868$ 1,069,437,688$ 1,073,257,856$ 1,001,742,637$ 1,164,677,563$ 1,206,889,082$ 19.5%
Teaching Salaries 217,429,545$ 248,941,118$ 236,850,764$ 246,556,999$ 251,878,753$ 257,654,736$ 18.5%Dept. Oper. Expense 150,747,074$ 131,561,425$ 157,624,477$ 163,677,894$ 173,266,118$ 184,192,721$ 22.2%Off-Campus Credit 5,799,268$ 8,318,594$ 7,772,019$ 9,917,145$ 11,364,061$ 10,346,044$ 78.4%Non-Credit Instruction 6,016,705$ 5,194,204$ 5,142,186$ 4,919,377$ 5,178,216$ 5,260,064$ -12.6%Research 24,014,726$ 25,541,279$ 27,181,143$ 26,547,351$ 28,329,997$ 34,137,698$ 42.2%Public Service 18,185,804$ 20,591,459$ 19,283,964$ 19,502,281$ 21,864,795$ 18,120,728$ -0.4%Libraries 28,839,672$ 31,320,011$ 32,294,204$ 32,816,155$ 33,058,339$ 33,459,556$ 16.0%Museums & Galleries 782,736$ 1,173,702$ 965,946$ 929,619$ 961,127$ 940,483$ 20.2%Organized Activities 4,622,242$ 5,890,005$ 5,290,029$ 5,294,155$ 4,921,699$ 5,571,278$ 20.5%Other Academic Support 67,421,346$ 68,905,449$ 74,518,161$ 72,654,927$ 76,765,906$ 79,131,748$ 17.4%Student Services 59,007,261$ 64,873,972$ 68,895,247$ 69,584,103$ 71,546,701$ 74,725,773$ 26.6%Institutional Support 110,638,951$ 119,125,325$ 123,209,646$ 126,810,626$ 129,166,095$ 132,132,488$ 19.4%Utilities 29,902,078$ 29,499,523$ 32,985,742$ 34,889,719$ 35,759,932$ 32,532,016$ 8.8%Other Plant Maintenance 61,263,939$ 64,371,619$ 53,767,410$ 55,981,788$ 58,105,239$ 64,841,478$ 5.8%Scholarships & Fellow ships 99,454,486$ 101,441,512$ 102,960,960$ 108,208,788$ 118,036,964$ 124,510,780$ 25.2%Other 10,412,381$ 11,858,897$ 5,791,403$ 12,721,946$ 13,952,039$ 11,747,441$ 12.8%Transfers - Auxiliary 10,398,317$ 6,483,152$ 18,125,843$ 12,521,055$ 13,270,560$ 13,991,693$ 34.6%Transfers - Mandatory 31,919,741$ 40,041,969$ 21,666,853$ 45,785,902$ 50,437,054$ 50,278,325$ 57.5%Transfers -Non Mandatory 45,882,855$ 43,364,237$ 51,512,215$ 58,787,706$ 40,293,581$ 69,606,234$ 51.7% Total 982,739,129$ 1,028,497,452$ 1,045,838,212$ 1,108,107,535$ 1,138,157,176$ 1,203,181,286$ 22.4%
Source: Revenues from ADHE Series 17-1; Expenditures from ADHE Series 17-7a.
Unrestricted E&G Expenditures

87 Back to Table of Contents
TABLE 5.1K – FOUR-YEAR SUMMARY (CONT.) AUXILIARY ENTERPRISES
5 yr2010-11 2011-12 2012-13 2013-14 2014-15 2015-16 % Incr
RevenuesIntercollegiate Athletics 100,777,104$ 108,327,536$ 115,131,545$ 111,503,547$ 129,436,613$ 142,490,456$ 41.4%Resident Halls 82,161,054$ 88,806,134$ 93,166,718$ 99,220,809$ 103,582,664$ 115,604,853$ 40.7%Married Student Housing 1,477,562$ 1,938,329$ 2,001,038$ 1,567,712$ 1,581,648$ 1,461,831$ -1.1%Faculty Housing 171,741$ 147,345$ 121,749$ 129,677$ 118,218$ 89,206$ -48.1%Food Service 25,318,297$ 29,624,461$ 30,884,599$ 32,316,202$ 34,457,573$ 36,910,111$ 45.8%College Union 7,798,227$ 5,953,206$ 4,861,912$ 4,894,050$ 4,810,868$ 4,829,361$ -38.1%Bookstore 23,610,718$ 25,797,470$ 23,191,724$ 22,698,205$ 22,484,534$ 20,519,069$ -13.1%Student Org. and Publications 6,162,102$ 6,499,346$ 8,477,329$ 6,240,935$ 10,604,815$ 6,680,446$ 8.4%Student Health Service 8,083,571$ 7,950,047$ 14,313,241$ 9,477,366$ 12,684,897$ 12,509,300$ 54.7%Other Auxiliary 18,942,234$ 20,999,434$ 22,505,543$ 19,633,342$ 20,158,023$ 22,196,413$ 17.2% Total 274,502,611$ 296,043,306$ 314,655,398$ 307,681,844$ 339,919,852$ 363,291,046$ 32.3%
ExpendituresIntercollegiate Athletics 101,213,006$ 108,758,293$ 113,588,593$ 120,445,055$ 130,072,443$ 142,027,700$ 40.3%Resident Halls 43,776,505$ 47,137,665$ 48,370,372$ 46,782,597$ 46,927,402$ 49,707,807$ 13.5%Married Student Housing 486,413$ 578,654$ 679,084$ 530,876$ 465,066$ 512,952$ 5.5%Faculty Housing 56,966$ 60,179$ 61,858$ 91,396$ 91,428$ 53,195$ -6.6%Food Service 19,110,786$ 22,850,539$ 23,904,718$ 25,041,250$ 26,372,186$ 27,541,259$ 44.1%College Union 6,759,955$ 6,000,699$ 5,111,042$ 5,302,365$ 4,737,445$ 5,455,749$ -19.3%Bookstore 20,947,726$ 22,338,889$ 20,711,704$ 19,811,001$ 18,967,133$ 17,763,557$ -15.2%Student Org. and Publications 4,754,186$ 4,452,267$ 4,573,123$ 4,328,035$ 5,980,718$ 4,312,470$ -9.3%Student Health Service 6,811,145$ 7,545,672$ 8,605,344$ 9,179,039$ 10,118,834$ 10,740,994$ 57.7%Other Auxiliary 13,115,049$ 14,057,186$ 12,997,614$ 12,439,124$ 12,662,368$ 13,955,416$ 6.4% Total 217,031,735$ 233,780,043$ 238,603,453$ 243,950,737$ 256,395,023$ 272,071,099$ 25.4%
Transfers/Debt ServiceIntercollegiate Athletics 8,369,224$ 7,552,816$ 10,684,943$ 11,737,463$ 12,964,256$ 11,193,521$ 33.7%Resident Halls 22,926,050$ 27,792,098$ 26,583,566$ 32,995,760$ 33,449,132$ 35,501,564$ 54.9%Married Student Housing 905,081$ 1,073,125$ 1,075,966$ 858,936$ 872,625$ 872,542$ -3.6%Faculty Housing -$ -$ -$ -$ -$ -$ NAFood Service 618,168$ 119,703$ -$ 763,174$ 642,268$ 640,278$ 3.6%College Union 2,320,299$ 1,948,036$ 1,457,314$ 1,453,236$ 1,527,997$ 1,555,227$ -33.0%Bookstore 847,359$ 880,194$ 908,751$ 940,870$ 1,191,042$ 977,933$ 15.4%Student Org. and Publications 216,042$ 158,962$ 159,017$ 158,931$ 349,152$ -$ -100.0%Student Health Service 690,787$ 376,201$ 375,068$ 376,998$ 359,533$ 133,960$ -80.6%Other Auxiliary 4,334,590$ 4,765,661$ 5,811,677$ 6,387,452$ 6,138,684$ 5,445,314$ 25.6% Total 41,227,598$ 44,666,795$ 47,056,300$ 55,672,820$ 57,494,688$ 56,320,338$ 36.6%
Excess of Revenues 16,243,278$ 17,596,468$ 28,995,645$ 8,058,286$ 26,030,141$ 34,899,610$ 114.9%
Special TransfersAuxiliary Transfer Policy 9,069,075$ 9,888,895$ 10,046,165$ 11,780,424$ 12,843,437$ 15,288,176$ 68.6%Other Auxilary Transfer (12,899,523)$ (24,882,409)$ (27,163,024)$ (17,948,335)$ (34,622,601)$ (41,828,629)$ NA Total (3,830,448)$ (14,993,514)$ (17,116,859)$ (6,167,911)$ (21,779,164)$ (26,540,453)$ NA
Total Excess of Revenues 12,412,830$ 2,602,954$ 11,878,786$ 1,890,375$ 4,250,977$ 8,359,157$

88 Back to Table of Contents
CHART 5. UNRESTRICTED E&G AND AUXILIARY REVENUES AND EXPENDITURES FOUR-YEAR INSTITUTIONS: 2010-11 THROUGH 2015-16

89 Back to Table of Contents
TWO – YEAR INSTITUTIONS

90 Back to Table of Contents
TABLE 5.2A – ARKANSAS NORTHEASTERN COLLEGE UNRESTRICTED EDUCATIONAL & GENERAL
5 yr2010-11 2011-12 2012-13 2013-14 2014-15 2015-16 % Incr
Unrestricted E&G RevenuesTuition & Fees 3,105,840$ 2,940,564$ 2,703,220$ 2,320,751$ 2,300,672$ 2,543,129$ -18.1%Gov. Appropriations Federal -$ -$ 35,442$ 4,558$ -$ -$ NA State 9,956,804$ 9,978,517$ 10,185,137$ 10,137,481$ 10,200,353$ 10,216,031$ 2.6% Local -$ -$ -$ -$ -$ -$ NAGrants & Contracts -$ Federal -$ -$ -$ -$ -$ -$ NA State -$ -$ -$ -$ -$ -$ NA Local -$ -$ -$ -$ -$ -$ NAPrivate Gifts, Grants and Contracts -$ -$ 35,000$ 35,000$ 41,730$ 35,000$ NAEndow ment Income -$ -$ -$ -$ -$ -$ NASales and Services Educational Actvities -$ -$ -$ -$ -$ NA
Hospitals -$ -$ -$ -$ -$ -$ NAOther Investments 134,418$ 85,343$ 40,447$ 29,316$ 27,552$ 24,273$ -81.9%Other 1,472,332$ 1,256,282$ 714,326$ 897,095$ 461,321$ 684,027$ -53.5% Total 14,669,394$ 14,260,706$ 13,713,572$ 13,424,201$ 13,031,628$ 13,502,460$ -8.0%
Teaching Salaries 3,847,079$ 3,404,598$ 3,333,628$ 3,158,026$ 2,950,581$ 3,147,894$ -18.2%Dept. Oper. Expense 3,378,836$ 3,909,251$ 3,987,408$ 3,803,885$ 3,538,549$ 3,590,667$ 6.3%Off-Campus Credit 109,327$ 108,895$ 113,205$ 100,521$ 109,538$ 105,452$ -3.5%Non-Credit Instruction 184,128$ 183,047$ 168,368$ 145,798$ 144,000$ 231,635$ 25.8%Research -$ -$ -$ -$ -$ -$ NAPublic Service 774,202$ 734,048$ 608,883$ 526,722$ 671,308$ 762,254$ -1.5%Libraries 378,918$ 379,757$ 382,339$ 390,546$ 275,705$ 295,689$ -22.0%Museums & Galleries -$ -$ -$ -$ -$ -$ NAOrganized Activities -$ -$ -$ -$ -$ -$ NAOther Academic Support -$ -$ -$ -$ -$ -$ NAStudent Services 782,474$ 715,034$ 793,591$ 784,485$ 824,632$ 812,567$ 3.8%Institutional Support 1,896,418$ 1,981,364$ 1,996,134$ 2,227,042$ 1,860,804$ 967,439$ -49.0%Utilities 430,216$ 418,981$ 439,779$ 405,574$ 559,822$ 373,620$ -13.2%Other Plant Maintenance 1,852,991$ 1,618,953$ 1,238,943$ 1,350,574$ 1,185,063$ 1,298,742$ -29.9%Scholarships & Fellow ships 143,913$ 145,826$ 171,596$ 214,914$ 314,806$ 354,487$ 146.3%Other -$ -$ -$ -$ -$ -$ NATransfers - Auxiliary 50,698$ -$ -$ 17,500$ 75,000$ 100,000$ 97.2%Transfers - Mandatory -$ -$ -$ -$ -$ -$ NATransfers -Non Mandatory 2,658,000$ -$ 2,006,800$ 250,000$ -$ 1,250,000$ -53.0% Total 16,487,202$ 13,599,753$ 15,240,674$ 13,375,589$ 12,509,808$ 13,290,446$ -19.4%
Unrestricted E&G Expenditures
Source: Revenues from ADHE Series 17-1; Expenditures from ADHE Series 17-7a.

91 Back to Table of Contents
TABLE 5.2A – ARKANSAS NORTHEASTERN COLLEGE (CONT.) AUXILIARY ENTERPRISES
5 yr2010-11 2011-12 2012-13 2013-14 2014-15 2015-16 % Incr
RevenuesIntercollegiate Athletics -$ -$ -$ -$ -$ -$ NAResident Halls -$ -$ -$ -$ -$ -$ NAMarried Student Housing -$ -$ -$ -$ -$ -$ NAFaculty Housing -$ -$ -$ -$ -$ -$ NAFood Service 40,345$ 47,247$ 46,028$ 46,188$ 45,680$ 49,051$ 21.6%College Union -$ -$ -$ -$ -$ -$ NABookstore 61,303$ 59,298$ 42,516$ 27,907$ 30,151$ 28,053$ -54.2%Student Org. and Publications 9,547$ 13,268$ 3,431$ 3,669$ 36,974$ 14,856$ 55.6%Student Health Service -$ -$ -$ -$ -$ -$ NAOther Auxiliary -$ -$ -$ -$ -$ -$ NA Total 111,195$ 119,812$ 91,975$ 77,764$ 112,805$ 91,960$ -17.3%
ExpendituresIntercollegiate Athletics -$ -$ -$ -$ -$ -$ NAResident Halls -$ -$ -$ -$ -$ -$ NAMarried Student Housing -$ -$ -$ -$ -$ -$ NAFaculty Housing -$ -$ -$ -$ -$ -$ NAFood Service 59,275$ 66,541$ 69,023$ 70,249$ 73,899$ 81,973$ 38.3%College Union -$ -$ -$ -$ -$ -$ NABookstore -$ -$ -$ -$ -$ -$ NAStudent Org. and Publications 37,895$ 47,298$ 31,896$ 87,753$ 665,150$ 111,008$ 192.9%Student Health Service -$ -$ -$ -$ -$ -$ NAOther Auxiliary -$ -$ -$ -$ -$ -$ NA Total 97,170$ 113,839$ 100,918$ 158,002$ 739,049$ 192,981$ 98.6%
Transfers/Debt ServiceIntercollegiate Athletics -$ -$ -$ -$ -$ -$ NAResident Halls -$ -$ -$ -$ -$ -$ NAMarried Student Housing -$ -$ -$ -$ -$ -$ NAFaculty Housing -$ -$ -$ -$ -$ -$ NAFood Service -$ -$ -$ -$ -$ -$ NACollege Union -$ -$ -$ -$ -$ -$ NABookstore -$ -$ -$ -$ -$ -$ NAStudent Org. and Publications -$ -$ -$ -$ -$ -$ NAStudent Health Service -$ -$ -$ -$ -$ -$ NAOther Auxiliary -$ -$ -$ -$ -$ -$ NA Total -$ -$ -$ -$ -$ -$ NA
Excess of Revenues 14,025$ 5,973$ (8,944)$ (80,238)$ (626,244)$ (101,021)$ -820.3%
Special TransfersAuxiliary Transfer Policy 50,698$ -$ 6,800$ 17,500$ 75,000$ 100,000$ 97.2%Other Auxilary Transfer -$ -$ -$ -$ -$ -$ NA Total 50,698$ -$ 6,800$ 17,500$ 75,000$ 100,000$ 97.2%
Total Excess of Revenues 64,723$ 5,973$ (2,144)$ (62,738)$ (551,244)$ (1,021)$

92 Back to Table of Contents
TABLE 5.2B – ARKANSAS STATE UNIVERSITY – BEEBE UNRESTRICTED EDUCATIONAL & GENERAL
5 yr2010-11 2011-12 2012-13 2013-14 2014-15 2015-16 % Incr
Unrestricted E&G RevenuesTuition & Fees 10,757,627$ 10,567,525$ 10,616,228$ 10,223,764$ 10,320,436$ 10,298,303$ -4.3%Gov. Appropriations Federal -$ -$ -$ -$ -$ NA State 14,140,378$ 14,222,974$ 14,268,131$ 14,071,729$ 14,098,177$ 14,122,727$ -0.1% Local 1,788,065$ 1,835,847$ 1,832,878$ 1,779,744$ 1,754,306$ 1,575,991$ -11.9%Grants & Contracts Federal 67,931$ 84,303$ 76,612$ 81,859$ 81,487$ 82,017$ 20.7% State -$ -$ -$ -$ -$ -$ NA Local -$ -$ -$ -$ -$ -$ NAPrivate Gifts, Grants and Contracts -$ -$ -$ -$ -$ -$ NAEndow ment Income -$ -$ -$ -$ -$ -$ NASales and Services Educational Actvities 65,359$ 64,978$ 112,503$ 125,205$ 130,846$ 110,183$ 68.6%
Hospitals -$ -$ -$ -$ -$ -$ NAOther Investments 119,104$ 84,641$ 62,357$ 45,116$ 48,068$ 54,445$ -54.3%Other 285,810$ 273,113$ 233,945$ 234,616$ 260,748$ 199,346$ -30.3% Total 27,224,274$ 27,133,381$ 27,202,654$ 26,562,033$ 26,694,068$ 26,443,012$ -2.9%
Teaching Salaries 8,088,614$ 7,989,458$ 6,630,380$ 6,634,060$ 6,375,269$ 6,661,040$ -17.6%Dept. Oper. Expense 2,295,626$ 2,257,861$ 4,046,568$ 3,876,013$ 3,680,488$ 4,130,854$ 79.9%Off-Campus Credit 50,450$ 52,949$ 53,427$ 30,146$ 108,023$ 122,037$ 141.9%Non-Credit Instruction 500,383$ 344,587$ 263,494$ 212,080$ 174,544$ 147,595$ -70.5%Research -$ -$ -$ -$ -$ -$ NAPublic Service -$ -$ -$ -$ -$ -$ NALibraries 694,533$ 709,529$ 717,334$ 713,712$ 707,727$ 689,875$ -0.7%Museums & Galleries -$ -$ -$ -$ -$ -$ NAOrganized Activities 101,822$ 97,183$ 105,309$ 95,323$ 102,394$ 78,508$ -22.9%Other Academic Support 636,001$ 634,498$ 589,728$ 656,835$ 577,821$ 732,356$ 15.2%Student Services 2,088,395$ 2,060,191$ 2,085,159$ 2,017,740$ 1,993,620$ 2,238,688$ 7.2%Institutional Support 4,597,201$ 4,813,654$ 4,953,774$ 5,060,220$ 4,884,583$ 5,272,533$ 14.7%Utilities 888,289$ 914,996$ 925,418$ 945,492$ 918,056$ 884,931$ -0.4%Other Plant Maintenance 2,037,076$ 2,144,373$ 2,039,173$ 1,933,006$ 1,877,707$ 2,116,641$ 3.9%Scholarships & Fellow ships 1,067,843$ 1,313,022$ 1,411,988$ 1,583,815$ 1,356,688$ 1,199,360$ 12.3%Other 246,433$ 449,135$ 501,290$ 152,320$ 1,525$ 108,877$ -55.8%Transfers - Auxiliary -$ -$ -$ -$ -$ -$ NATransfers - Mandatory 2,047,380$ 1,948,237$ 1,781,194$ 1,901,384$ 1,490,719$ 1,858,200$ -9.2%Transfers -Non Mandatory 1,665,893$ 916,971$ 977,280$ 577,278$ 1,405,946$ 426,745$ -74.4% Total 27,005,939$ 26,646,644$ 27,081,516$ 26,389,424$ 25,655,110$ 26,668,240$ -1.3%
Unrestricted E&G Expenditures
Source: Revenues from ADHE Series 17-1; Expenditures from ADHE Series 17-7a.

93 Back to Table of Contents
TABLE 5.2B – ARKANSAS STATE UNIVERSITY – BEEBE (CONT.) AUXILIARY ENTERPRISES
5 yr2010-11 2011-12 2012-13 2013-14 2014-15 2015-16 % Incr
RevenuesIntercollegiate Athletics -$ -$ -$ -$ -$ -$ NAResident Halls 279,882$ 727,543$ 809,350$ 803,419$ 855,161$ 841,081$ 200.5%Married Student Housing -$ -$ -$ -$ -$ NAFaculty Housing 31,837$ 38,079$ 43,943$ 47,748$ 47,200$ 51,697$ 62.4%Food Service 507,477$ 625,155$ 672,510$ 673,872$ 698,483$ 451,418$ -11.0%College Union 213,781$ 213,941$ 205,626$ 193,795$ 182,352$ 171,667$ -19.7%Bookstore 1,793,485$ 1,670,524$ 1,651,384$ 1,457,264$ 1,309,315$ 1,100,207$ -38.7%Student Org. and Publications -$ -$ -$ -$ -$ -$ NAStudent Health Service -$ -$ -$ -$ -$ -$ NAOther Auxiliary 38,769$ 38,790$ 38,640$ 37,983$ 38,117$ 29,990$ -22.6% Total 2,865,231$ 3,314,032$ 3,421,453$ 3,214,081$ 3,130,628$ 2,646,060$ -7.6%
ExpendituresIntercollegiate Athletics -$ -$ -$ -$ -$ -$ NAResident Halls 238,347$ 367,123$ 370,394$ 348,054$ 322,350$ 350,104$ 46.9%Married Student Housing -$ -$ -$ -$ -$ -$ NAFaculty Housing 16,830$ 26,114$ 18,010$ 21,371$ 18,182$ 6,944$ -58.7%Food Service 642,194$ 716,520$ 724,124$ 705,096$ 671,626$ 475,192$ -26.0%College Union 72,397$ 74,887$ 87,601$ 77,077$ 83,013$ 88,056$ 21.6%Bookstore 1,576,022$ 1,521,574$ 1,445,669$ 1,317,514$ 1,129,914$ 980,643$ -37.8%Student Org. and Publications -$ -$ -$ -$ -$ -$ NAStudent Health Service -$ -$ -$ -$ -$ -$ NAOther Auxiliary -$ -$ -$ -$ -$ -$ NA Total 2,545,790$ 2,706,218$ 2,645,798$ 2,469,112$ 2,225,085$ 1,900,939$ -25.3%
Transfers/Debt ServiceIntercollegiate Athletics -$ -$ -$ -$ -$ -$ NAResident Halls -$ -$ -$ -$ -$ -$ NAMarried Student Housing -$ -$ -$ -$ -$ -$ NAFaculty Housing -$ -$ -$ -$ -$ -$ NAFood Service -$ -$ -$ -$ -$ -$ NACollege Union -$ -$ -$ -$ -$ -$ NABookstore -$ -$ -$ -$ -$ -$ NAStudent Org. and Publications -$ -$ -$ -$ -$ -$ NAStudent Health Service -$ -$ -$ -$ -$ -$ NAOther Auxiliary -$ -$ -$ -$ -$ -$ NA Total -$ -$ -$ -$ -$ -$ NA
Excess of Revenues 319,441$ 607,814$ 775,655$ 744,969$ 905,543$ 745,121$ 133.3%
Special TransfersAuxiliary Transfer Policy -$ -$ -$ -$ -$ -$ NAOther Auxilary Transfer (107,536)$ (688,620)$ (1,670,886)$ (635,178)$ (600,687)$ (600,589)$ NA Total (107,536)$ (688,620)$ (1,670,886)$ (635,178)$ (600,687)$ (600,589)$ NA
Total Excess of Revenues 211,905$ (80,806)$ (895,231)$ 109,791$ 304,856$ 144,532$

94 Back to Table of Contents
TABLE 5.2C – ARKANSAS STATE UNIVERSITY – MOUNTAIN HOME UNRESTRICTED EDUCATIONAL & GENERAL
5 yr2010-11 2011-12 2012-13 2013-14 2014-15 2015-16 % Incr
Unrestricted E&G RevenuesTuition & Fees 4,128,543$ 4,084,776$ 4,212,013$ 4,372,239$ 4,260,792$ 4,413,118$ 6.9%Gov. Appropriations Federal -$ -$ -$ -$ -$ -$ NA State 4,666,965$ 4,647,700$ 4,658,624$ 4,722,039$ 4,713,921$ 4,722,039$ 1.2% Local 1,260,788$ 1,338,678$ 1,285,901$ 1,333,345$ 1,316,279$ 1,410,272$ 11.9%Grants & Contracts Federal -$ -$ -$ -$ -$ -$ NA State -$ -$ -$ -$ -$ -$ NA Local -$ -$ -$ -$ -$ -$ NAPrivate Gifts, Grants and Contracts 5,640$ 1,688$ -$ -$ -$ -$ -100.0%Endow ment Income -$ -$ -$ -$ -$ -$ NASales and Services Educational Actvities 31,150$ 36,009$ 22,700$ 51,462$ 32,215$ 35,151$ 12.8%
Hospitals -$ -$ -$ -$ -$ -$ NAOther Investments 25,587$ 10,758$ 6,050$ 3,515$ 1,366$ 696$ -97.3%Other 249,750$ 257,925$ 215,967$ 178,689$ 175,454$ 174,819$ -30.0% Total 10,368,423$ 10,377,535$ 10,401,255$ 10,661,289$ 10,500,027$ 10,756,095$ 3.7%
Teaching Salaries 2,472,251$ 2,460,307$ 2,482,495$ 2,602,126$ 2,635,420$ 2,606,498$ 5.4%Dept. Oper. Expense 1,146,270$ 1,395,204$ 1,357,464$ 1,564,687$ 1,497,105$ 1,585,365$ 38.3%Off-Campus Credit -$ -$ -$ -$ -$ -$ NANon-Credit Instruction 184,408$ 130,210$ 132,036$ 157,881$ 145,776$ 18,664$ -89.9%Research -$ -$ -$ -$ -$ 46,410$ NAPublic Service 241,695$ 218,473$ 187,568$ 119,996$ 102,227$ 104,102$ -56.9%Libraries 333,248$ 337,911$ 339,131$ 319,479$ 276,850$ -$ -100.0%Museums & Galleries -$ -$ -$ -$ -$ -$ NAOrganized Activities -$ -$ -$ -$ -$ -$ NAOther Academic Support 80,880$ 69,253$ 67,597$ 86,907$ 120,774$ 352,752$ 336.1%Student Services 730,639$ 791,346$ 817,224$ 822,469$ 694,687$ 717,890$ -1.7%Institutional Support 1,909,518$ 1,864,519$ 1,868,116$ 1,790,042$ 1,908,680$ 2,025,046$ 6.1%Utilities 455,812$ 475,951$ 457,238$ 449,014$ 476,046$ 459,418$ 0.8%Other Plant Maintenance 782,283$ 811,199$ 810,795$ 872,209$ 991,863$ 1,035,536$ 32.4%Scholarships & Fellow ships 177,271$ 168,167$ 214,061$ 215,627$ 238,659$ 269,454$ 52.0%Other -$ -$ -$ -$ -$ -$ NATransfers - Auxiliary -$ -$ -$ -$ -$ -$ NATransfers - Mandatory 1,068,980$ 1,070,220$ 948,883$ 1,051,427$ 1,045,834$ 1,044,455$ -2.3%Transfers -Non Mandatory 741,749$ 500,000$ 600,000$ 450,000$ 275,000$ 300,000$ -59.6% Total 10,325,005$ 10,292,759$ 10,282,608$ 10,501,864$ 10,408,921$ 10,565,590$ 2.3%
Unrestricted E&G Expenditures
Source: Revenues from ADHE Series 17-1; Expenditures from ADHE Series 17-7a.

95 Back to Table of Contents
TABLE 5.2C – ARKANSAS STATE UNIVERSITY – MOUNTAIN HOME (CONT.) AUXILIARY ENTERPRISES
5 yr2010-11 2011-12 2012-13 2013-14 2014-15 2015-16 % Incr
RevenuesIntercollegiate Athletics -$ -$ -$ -$ -$ -$ NAResident Halls -$ -$ -$ -$ -$ -$ NAMarried Student Housing -$ -$ -$ -$ -$ -$ NAFaculty Housing -$ -$ -$ -$ -$ -$ NAFood Service -$ -$ -$ -$ -$ -$ NACollege Union -$ -$ -$ -$ -$ -$ NABookstore 634,511$ 635,730$ 774,557$ 782,812$ 738,343$ 843,982$ 33.0%Student Org. and Publications -$ -$ -$ 10,930$ 4,236$ 60,266$ NAStudent Health Service -$ -$ -$ -$ -$ -$ NAOther Auxiliary 6,253$ 228,154$ 63,711$ -$ -$ -$ -100.0% Total 640,764$ 863,885$ 838,268$ 793,742$ 742,579$ 904,248$ 41.1%
ExpendituresIntercollegiate Athletics -$ -$ -$ -$ -$ -$ NAResident Halls -$ -$ -$ -$ -$ -$ NAMarried Student Housing -$ -$ -$ -$ -$ -$ NAFaculty Housing -$ -$ -$ -$ -$ -$ NAFood Service -$ -$ -$ -$ -$ -$ NACollege Union -$ -$ -$ -$ -$ -$ NABookstore 585,126$ 588,743$ 723,650$ 765,917$ 633,343$ 690,074$ 17.9%Student Org. and Publications -$ -$ -$ 45,645$ 18,695$ 74,961$ NAStudent Health Service -$ -$ -$ -$ -$ -$ NAOther Auxiliary 2,437$ 186,720$ 67,544$ -$ -$ -$ -100.0% Total 587,563$ 775,463$ 791,194$ 811,562$ 652,038$ 765,035$ 30.2%
Transfers/Debt ServiceIntercollegiate Athletics -$ -$ -$ -$ -$ -$ NAResident Halls -$ -$ -$ -$ -$ -$ NAMarried Student Housing -$ -$ -$ -$ -$ -$ NAFaculty Housing -$ -$ -$ -$ -$ -$ NAFood Service -$ -$ -$ -$ -$ -$ NACollege Union -$ -$ -$ -$ -$ -$ NABookstore -$ -$ -$ -$ -$ -$ NAStudent Org. and Publications -$ -$ -$ -$ -$ -$ NAStudent Health Service -$ -$ -$ -$ -$ -$ NAOther Auxiliary -$ -$ -$ -$ -$ -$ NA Total -$ -$ -$ -$ -$ -$ NA
Excess of Revenues 53,201$ 88,422$ 47,074$ (17,820)$ 90,541$ 139,213$ 161.7%
Special TransfersAuxiliary Transfer Policy -$ -$ -$ -$ -$ -$ NAOther Auxilary Transfer -$ -$ -$ (34,000)$ -$ (50,000)$ NA Total -$ -$ -$ (34,000)$ -$ (50,000)$ NA
Total Excess of Revenues 53,201$ 88,422$ 47,074$ (51,820)$ 90,541$ 89,213$

96 Back to Table of Contents
TABLE 5.2D – ARKANSAS STATE UNIVERSITY – MID-SOUTH UNRESTRICTED EDUCATIONAL & GENERAL
Note: ASUMS data includes Arkansas Delta Training & Education Consortium
5 yr2010-11 2011-12 2012-13 2013-14 2014-15 2015-16 % Incr
Unrestricted E&G RevenuesTuition & Fees 4,423,627$ 4,215,332$ 4,952,909$ 13,755,765$ 5,000,464$ 4,275,451$ -3.3%Gov. Appropriations Federal -$ -$ -$ -$ -$ -$ NA State 5,927,012$ 6,323,542$ 6,448,841$ 7,128,651$ 7,554,867$ 7,576,777$ 27.8% Local 81,190$ 88,124$ 78,406$ 87,461$ 70,377$ 71,314$ -12.2%Grants & Contracts Federal -$ -$ -$ -$ -$ -$ NA State -$ 407,095$ 396,595$ 377,872$ 663,526$ 757,350$ NA Local -$ -$ -$ -$ -$ -$ NAPrivate Gifts, Grants and Contracts -$ 6,461$ 625,078$ 12,398$ 949$ 20,553$ NAEndow ment Income -$ -$ -$ -$ -$ -$ NASales and Services Educational Actvities -$ -$ -$ -$ -$ -$ NA
Hospitals -$ -$ -$ -$ -$ -$ NAOther Investments 21,103$ 10,972$ 9,793$ 12,978$ 7,629$ 6,530$ -69.1%Other 766,027$ 437,350$ 633,016$ 526,798$ 540,249$ 1,089,682$ 42.3% Total 11,218,959$ 11,488,876$ 13,144,638$ 21,901,923$ 13,838,061$ 13,797,657$ 23.0%
Teaching Salaries 2,093,628$ 2,247,113$ 2,218,792$ 2,329,312$ 2,202,483$ 2,510,941$ 19.9%Dept. Oper. Expense 1,343,585$ 929,081$ 2,371,897$ 8,218,335$ 1,657,330$ 1,214,843$ -9.6%Off-Campus Credit -$ -$ -$ -$ -$ -$ NANon-Credit Instruction -$ 26,768$ -$ -$ -$ -$ NAResearch -$ -$ -$ -$ -$ -$ NAPublic Service 100,265$ 89,619$ 534,418$ 1,275,153$ 1,810,832$ 1,126,528$ 1023.6%Libraries 150,198$ 147,889$ 150,261$ 153,753$ 151,194$ 146,140$ -2.7%Museums & Galleries -$ -$ -$ -$ -$ -$ NAOrganized Activities -$ -$ -$ -$ -$ -$ NAOther Academic Support 1,271,659$ 1,008,322$ 1,388,152$ 912,607$ 935,596$ 1,487,583$ 17.0%Student Services 821,203$ 877,455$ 1,245,789$ 1,048,939$ 936,708$ 835,225$ 1.7%Institutional Support 3,667,287$ 3,874,836$ 3,511,452$ 3,601,359$ 3,671,620$ 3,129,167$ -14.7%Utilities 485,020$ 455,761$ 465,344$ 516,243$ 501,902$ 455,033$ -6.2%Other Plant Maintenance 1,385,740$ 1,350,647$ 1,229,519$ 1,203,258$ 1,435,520$ 1,529,786$ 10.4%Scholarships & Fellow ships 261,814$ 349,329$ 355,727$ 515,479$ 345,165$ 338,356$ 29.2%Other -$ -$ -$ -$ -$ -$ NATransfers - Auxiliary 76,942$ -$ (105,599)$ -$ -$ -$ -100.0%Transfers - Mandatory -$ -$ -$ -$ -$ NATransfers -Non Mandatory (48,088)$ (509,021)$ (23,843)$ (20,244)$ (17,223)$ (98,440)$ NA Total 11,609,253$ 10,847,799$ 13,341,909$ 19,754,195$ 13,631,127$ 12,675,161$ 9.2%
Unrestricted E&G Expenditures
Source: Revenues from ADHE Series 17-1; Expenditures from ADHE Series 17-7a.

97 Back to Table of Contents
TABLE 5.2D – ARKANSAS STATE UNIVERSITY – MID-SOUTH (CONT.) AUXILIARY ENTERPRISES
5 yr2010-11 2011-12 2012-13 2013-14 2014-15 2015-16 % Incr
RevenuesIntercollegiate Athletics 28,745$ 26,979$ 25,000$ 25,000$ 32,897$ 30,301$ 5.4%Resident Halls -$ -$ -$ -$ -$ -$ NAMarried Student Housing -$ -$ -$ -$ -$ -$ NAFaculty Housing -$ -$ -$ -$ -$ -$ NAFood Service 207,678$ 198,685$ 147,827$ 114,924$ 130,742$ 131,747$ -36.6%College Union -$ -$ -$ -$ -$ -$ NABookstore 48,887$ 47,235$ 40,399$ 86,353$ 85,000$ 61,237$ 25.3%Student Org. and Publications -$ -$ -$ -$ -$ -$ NAStudent Health Service -$ -$ -$ -$ -$ -$ NAOther Auxiliary 16,827$ -$ -$ -$ -$ -$ -100.0% Total 302,137$ 272,899$ 213,226$ 226,277$ 248,639$ 223,285$ -26.1%
ExpendituresIntercollegiate Athletics 125,369$ 120,985$ 130,599$ 155,773$ 127,067$ 144,141$ 15.0%Resident Halls -$ -$ -$ -$ -$ -$ NAMarried Student Housing -$ -$ -$ -$ -$ -$ NAFaculty Housing -$ -$ -$ -$ -$ -$ NAFood Service 253,534$ 240,235$ 193,029$ 121,749$ 140,271$ 139,193$ -45.1%College Union -$ -$ -$ -$ -$ -$ NABookstore 176$ 167$ 128$ -$ -$ -$ -100.0%Student Org. and Publications -$ -$ -$ -$ -$ -$ NAStudent Health Service -$ -$ -$ -$ -$ -$ NAOther Auxiliary -$ -$ -$ -$ -$ -$ NA Total 379,079$ 361,387$ 323,756$ 277,522$ 267,338$ 283,334$ -25.3%
Transfers/Debt ServiceIntercollegiate Athletics -$ -$ -$ -$ -$ -$ NAResident Halls -$ -$ -$ -$ -$ -$ NAMarried Student Housing -$ -$ -$ -$ -$ -$ NAFaculty Housing -$ -$ -$ -$ -$ -$ NAFood Service -$ -$ -$ -$ -$ -$ NACollege Union -$ -$ -$ -$ -$ -$ NABookstore -$ -$ -$ -$ -$ -$ NAStudent Org. and Publications -$ -$ -$ -$ -$ -$ NAStudent Health Service -$ -$ -$ -$ -$ -$ NAOther Auxiliary -$ -$ -$ -$ -$ -$ NA Total -$ -$ -$ -$ -$ -$ NA
Excess of Revenues (76,942)$ (88,488)$ (110,530)$ (51,245)$ (18,699)$ (60,049)$ NA
Special TransfersAuxiliary Transfer Policy 76,942$ 94,006$ 105,599$ 130,773$ 94,170$ 113,840$ 48.0%Other Auxilary Transfer -$ -$ -$ -$ -$ -$ NA Total 76,942$ 94,006$ 105,599$ 130,773$ 94,170$ 113,840$ 48.0%
Total Excess of Revenues -$ 5,518$ (4,931)$ 79,528$ 75,471$ 53,791$

98 Back to Table of Contents
TABLE 5.2E – ARKANSAS STATE UNIVERSITY– NEWPORT UNRESTRICTED EDUCATIONAL & GENERAL
5 yr2010-11 2011-12 2012-13 2013-14 2014-15 2015-16 % Incr
Unrestricted E&G RevenuesTuition & Fees 4,350,180$ 4,597,038$ 4,925,264$ 5,146,875$ 6,175,804$ 7,054,757$ 62.2%Gov. Appropriations Federal -$ -$ -$ -$ -$ -$ NA State 7,352,515$ 7,364,179$ 7,414,175$ 7,409,921$ 7,395,954$ 7,409,921$ 0.8% Local 922,152$ 962,617$ 988,628$ 975,001$ 996,809$ 1,114,636$ 20.9%Grants & Contracts Federal -$ -$ -$ -$ -$ -$ NA State -$ -$ -$ -$ -$ -$ NA Local -$ -$ -$ -$ -$ -$ NAPrivate Gifts, Grants and Contracts -$ 25,789$ 20,300$ -$ -$ -$ NAEndow ment Income -$ -$ -$ -$ -$ -$ NASales and Services Educational Actvities -$ -$ -$ -$ -$ -$ NA
Hospitals -$ -$ -$ -$ -$ -$ NAOther Investments 73,662$ 29,101$ 11,631$ 4,131$ 3,177$ 2,589$ -96.5%Other 126,719$ 197,839$ 60,922$ 174,468$ 88,427$ 89,803$ -29.1% Total 12,825,228$ 13,176,563$ 13,420,920$ 13,710,396$ 14,660,171$ 15,671,706$ 22.2%
Teaching Salaries 2,801,503$ 2,956,731$ 2,992,492$ 3,548,542$ 3,858,209$ 4,299,285$ 53.5%Dept. Oper. Expense 2,125,941$ 1,772,496$ 2,416,856$ 2,413,284$ 2,258,689$ 2,566,784$ 20.7%Off-Campus Credit 47,344$ 375,410$ 471,295$ 203,371$ 281,144$ 291,838$ 516.4%Non-Credit Instruction 2,955$ 116,549$ 7,004$ 6,956$ 3,468$ 465$ -84.3%Research -$ -$ -$ -$ -$ -$ NAPublic Service -$ -$ -$ -$ -$ -$ NALibraries 174,380$ 187,640$ 198,242$ 168,845$ 137,871$ 117,323$ -32.7%Museums & Galleries -$ -$ -$ -$ -$ -$ NAOrganized Activities -$ -$ -$ -$ -$ -$ NAOther Academic Support 724,941$ 626,337$ 578,143$ 408,220$ 705,946$ 758,161$ 4.6%Student Services 880,544$ 909,874$ 1,246,182$ 1,082,350$ 1,303,120$ 1,326,564$ 50.7%Institutional Support 2,441,652$ 2,804,636$ 2,569,809$ 3,186,974$ 3,391,069$ 3,439,147$ 40.9%Utilities 409,451$ 359,632$ 337,000$ 463,701$ 393,007$ 362,185$ -11.5%Other Plant Maintenance 848,369$ 849,265$ 1,180,137$ 875,871$ 840,973$ 910,520$ 7.3%Scholarships & Fellow ships 57,591$ 86,795$ 116,661$ 95,962$ 212,248$ 320,375$ 456.3%Other -$ -$ -$ -$ -$ -$ NATransfers - Auxiliary -$ -$ 56,752$ 1,331,141$ -$ -$ NATransfers - Mandatory -$ -$ 521,849$ -$ 563,866$ 560,660$ NATransfers -Non Mandatory 4,198,725$ 4,018,184$ 70,383$ 678,593$ 500,000$ 2,547,102$ -39.3% Total 14,713,396$ 15,063,549$ 12,762,805$ 14,463,810$ 14,449,610$ 17,500,409$ 18.9%
Unrestricted E&G Expenditures
Source: Revenues from ADHE Series 17-1; Expenditures from ADHE Series 17-7a.

99 Back to Table of Contents
TABLE 5.2E – ARKANSAS STATE UNIVERSITY– NEWPORT (CONT.) AUXILIARY ENTERPRISES
5 yr2010-11 2011-12 2012-13 2013-14 2014-15 2015-16 % Incr
RevenuesIntercollegiate Athletics -$ -$ -$ -$ -$ -$ NAResident Halls -$ -$ -$ -$ -$ -$ NAMarried Student Housing -$ -$ -$ -$ -$ -$ NAFaculty Housing -$ -$ -$ -$ -$ -$ NAFood Service -$ -$ -$ -$ 125,924$ 178,618$ NACollege Union -$ -$ -$ -$ -$ -$ NABookstore 630,881$ 604,702$ 113,592$ 51,130$ 59,093$ 47,501$ -92.5%Student Org. and Publications -$ -$ -$ -$ -$ 97,021$ NAStudent Health Service -$ -$ -$ -$ -$ -$ NAOther Auxiliary 10,662$ 6,966$ 9,351$ 12,127$ 12,266$ 11,254$ 5.6% Total 641,543$ 611,668$ 122,943$ 63,257$ 197,283$ 334,394$ -47.9%
ExpendituresIntercollegiate Athletics -$ -$ -$ -$ -$ -$ NAResident Halls -$ -$ -$ -$ -$ -$ NAMarried Student Housing -$ -$ -$ -$ -$ -$ NAFaculty Housing -$ -$ -$ -$ -$ -$ NAFood Service 24,383$ 24,133$ 24,133$ 31,193$ 159,956$ 233,445$ 857.4%College Union -$ -$ -$ -$ -$ -$ NABookstore 554,377$ 527,227$ 89,353$ -$ -$ -$ -100.0%Student Org. and Publications 2,454$ 3,557$ 3,135$ 34,836$ 42,594$ 54,551$ 2122.9%Student Health Service -$ -$ -$ -$ -$ -$ NAOther Auxiliary -$ -$ -$ -$ -$ -$ NA Total 581,214$ 554,917$ 116,621$ 66,029$ 202,550$ 287,996$ -50.4%
Transfers/Debt ServiceIntercollegiate Athletics -$ -$ -$ -$ -$ -$ NAResident Halls -$ -$ -$ -$ -$ -$ NAMarried Student Housing -$ -$ -$ -$ -$ -$ NAFaculty Housing -$ -$ -$ -$ -$ -$ NAFood Service -$ -$ -$ -$ -$ -$ NACollege Union -$ -$ -$ -$ -$ -$ NABookstore -$ -$ -$ -$ -$ -$ NAStudent Org. and Publications -$ -$ -$ -$ -$ -$ NAStudent Health Service -$ -$ -$ -$ -$ -$ NAOther Auxiliary -$ -$ -$ -$ -$ -$ NA Total -$ -$ -$ -$ -$ -$ NA
Excess of Revenues 60,329$ 56,751$ 6,322$ (2,772)$ (5,267)$ 46,398$ -23.1%
Special TransfersAuxiliary Transfer Policy -$ -$ -$ -$ -$ -$ NAOther Auxilary Transfer -$ -$ (56,752)$ (9,092)$ -$ -$ NA Total -$ -$ (56,752)$ (9,092)$ -$ -$ NA
Total Excess of Revenues 60,329$ 56,751$ (50,430)$ (11,864)$ (5,267)$ 46,398$

100 Back to Table of Contents
TABLE 5.2F – BLACK RIVER TECHNICAL COLLEGE UNRESTRICTED EDUCATIONAL & GENERAL
5 yr2010-11 2011-12 2012-13 2013-14 2014-15 2015-16 % Incr
Unrestricted E&G RevenuesTuition & Fees 6,169,956$ 5,719,392$ 6,421,256$ 6,076,546$ 5,900,337$ 5,181,804$ -16.0%Gov. Appropriations Federal -$ -$ -$ -$ -$ -$ NA State 8,165,416$ 8,184,711$ 8,301,351$ 8,358,725$ 8,336,564$ 8,358,725$ 2.4% Local -$ -$ -$ -$ -$ -$ NAGrants & Contracts Federal -$ -$ -$ -$ -$ -$ NA State 41,865$ 36,352$ 33,434$ 28,889$ 37,869$ 39,949$ -4.6% Local -$ -$ -$ -$ NAPrivate Gifts, Grants and Contracts 95,530$ -$ 10,189$ 542,000$ 19,522$ 41,748$ -56.3%Endow ment Income -$ -$ -$ -$ -$ -$ NASales and Services Educational Actvities -$ -$ -$ -$ -$ -$ NA
Hospitals -$ -$ -$ -$ -$ -$ NAOther Investments 233,451$ 163,617$ 112,697$ 64,368$ 55,184$ 49,426$ -78.8%Other 607,416$ 2,320,167$ 81,256$ 182,092$ 24,793$ 26,769$ -95.6% Total 15,313,634$ 16,424,239$ 14,960,183$ 15,252,620$ 14,374,269$ 13,698,421$ -10.5%
Teaching Salaries 2,802,069$ 2,787,118$ 2,898,824$ 3,122,589$ 3,454,047$ 3,563,268$ 27.2%Dept. Oper. Expense 2,082,585$ 2,329,727$ 2,208,216$ 2,396,980$ 2,792,509$ 2,598,735$ 24.8%Off-Campus Credit 964,843$ 1,119,517$ 1,141,785$ 1,237,532$ 178,235$ 178,968$ -81.5%Non-Credit Instruction 645,966$ 430,467$ 297,597$ 390,808$ 540,812$ 624,700$ -3.3%Research -$ -$ -$ -$ -$ -$ NAPublic Service 517,432$ 583,935$ 537,715$ 632,136$ 560,112$ 492,703$ -4.8%Libraries 232,550$ 246,898$ 212,078$ 214,316$ 186,075$ 199,083$ -14.4%Museums & Galleries -$ -$ -$ -$ -$ -$ NAOrganized Activities -$ -$ -$ -$ -$ -$ NAOther Academic Support 332,428$ 350,535$ 515,046$ 566,674$ 391,126$ 454,452$ 36.7%Student Services 1,255,372$ 1,336,569$ 1,053,612$ 1,220,662$ 1,133,964$ 1,273,349$ 1.4%Institutional Support 1,755,457$ 1,817,073$ 2,324,102$ 2,101,436$ 2,504,756$ 2,027,038$ 15.5%Utilities 469,964$ 447,746$ 468,235$ 479,845$ 467,917$ 494,217$ 5.2%Other Plant Maintenance 2,406,952$ 2,486,501$ 1,225,603$ 1,345,848$ 1,400,606$ 1,447,303$ -39.9%Scholarships & Fellow ships 713,152$ 686,388$ 775,541$ 701,266$ 812,542$ 692,040$ -3.0%Other -$ -$ -$ 542,000$ -$ -$ NATransfers - Auxiliary -$ -$ -$ (125,000)$ (50,000)$ -$ NATransfers - Mandatory 203,667$ 192,983$ -$ 199,152$ 202,487$ 198,187$ -2.7%Transfers -Non Mandatory 1,033,636$ 27,335$ -$ 1,127,771$ 69,169$ (139,237)$ -113.5% Total 15,416,073$ 14,842,792$ 13,658,354$ 16,154,015$ 14,644,357$ 14,104,806$ -8.5%
Unrestricted E&G Expenditures
Source: Revenues from ADHE Series 17-1; Expenditures from ADHE Series 17-7a.
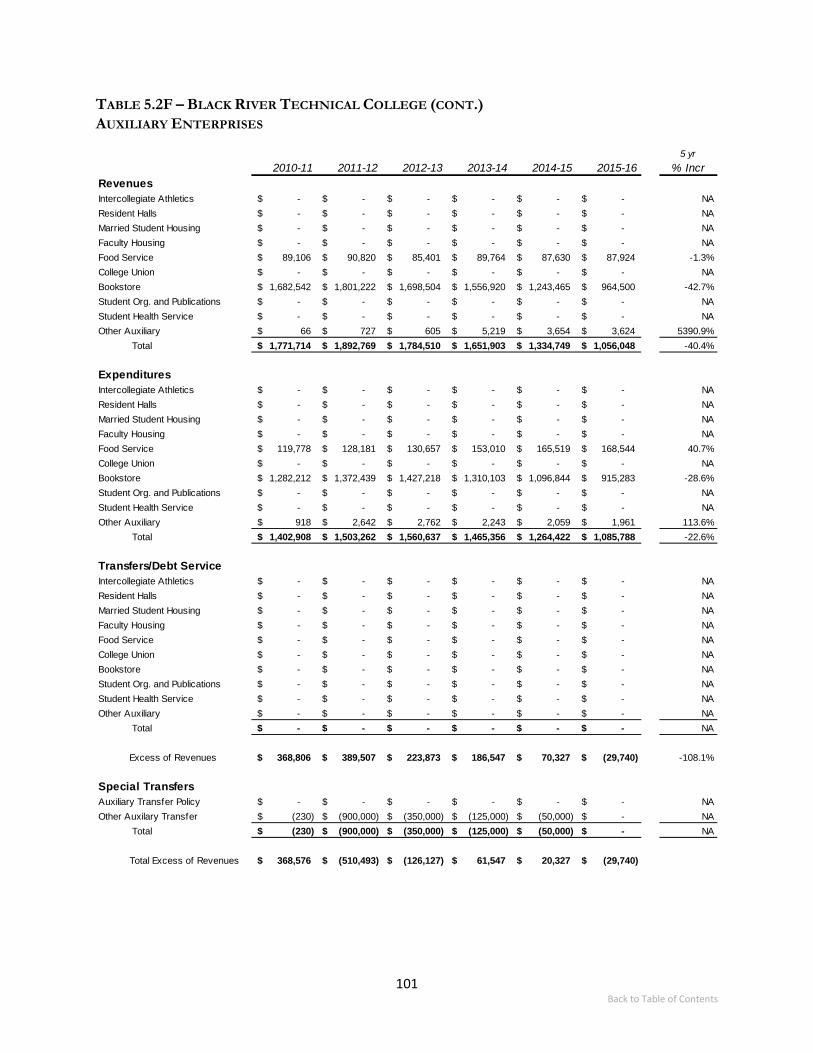
101 Back to Table of Contents
TABLE 5.2F – BLACK RIVER TECHNICAL COLLEGE (CONT.) AUXILIARY ENTERPRISES
5 yr2010-11 2011-12 2012-13 2013-14 2014-15 2015-16 % Incr
RevenuesIntercollegiate Athletics -$ -$ -$ -$ -$ -$ NAResident Halls -$ -$ -$ -$ -$ -$ NAMarried Student Housing -$ -$ -$ -$ -$ -$ NAFaculty Housing -$ -$ -$ -$ -$ -$ NAFood Service 89,106$ 90,820$ 85,401$ 89,764$ 87,630$ 87,924$ -1.3%College Union -$ -$ -$ -$ -$ -$ NABookstore 1,682,542$ 1,801,222$ 1,698,504$ 1,556,920$ 1,243,465$ 964,500$ -42.7%Student Org. and Publications -$ -$ -$ -$ -$ -$ NAStudent Health Service -$ -$ -$ -$ -$ -$ NAOther Auxiliary 66$ 727$ 605$ 5,219$ 3,654$ 3,624$ 5390.9% Total 1,771,714$ 1,892,769$ 1,784,510$ 1,651,903$ 1,334,749$ 1,056,048$ -40.4%
ExpendituresIntercollegiate Athletics -$ -$ -$ -$ -$ -$ NAResident Halls -$ -$ -$ -$ -$ -$ NAMarried Student Housing -$ -$ -$ -$ -$ -$ NAFaculty Housing -$ -$ -$ -$ -$ -$ NAFood Service 119,778$ 128,181$ 130,657$ 153,010$ 165,519$ 168,544$ 40.7%College Union -$ -$ -$ -$ -$ -$ NABookstore 1,282,212$ 1,372,439$ 1,427,218$ 1,310,103$ 1,096,844$ 915,283$ -28.6%Student Org. and Publications -$ -$ -$ -$ -$ -$ NAStudent Health Service -$ -$ -$ -$ -$ -$ NAOther Auxiliary 918$ 2,642$ 2,762$ 2,243$ 2,059$ 1,961$ 113.6% Total 1,402,908$ 1,503,262$ 1,560,637$ 1,465,356$ 1,264,422$ 1,085,788$ -22.6%
Transfers/Debt ServiceIntercollegiate Athletics -$ -$ -$ -$ -$ -$ NAResident Halls -$ -$ -$ -$ -$ -$ NAMarried Student Housing -$ -$ -$ -$ -$ -$ NAFaculty Housing -$ -$ -$ -$ -$ -$ NAFood Service -$ -$ -$ -$ -$ -$ NACollege Union -$ -$ -$ -$ -$ -$ NABookstore -$ -$ -$ -$ -$ -$ NAStudent Org. and Publications -$ -$ -$ -$ -$ -$ NAStudent Health Service -$ -$ -$ -$ -$ -$ NAOther Auxiliary -$ -$ -$ -$ -$ -$ NA Total -$ -$ -$ -$ -$ -$ NA
Excess of Revenues 368,806$ 389,507$ 223,873$ 186,547$ 70,327$ (29,740)$ -108.1%
Special TransfersAuxiliary Transfer Policy -$ -$ -$ -$ -$ -$ NAOther Auxilary Transfer (230)$ (900,000)$ (350,000)$ (125,000)$ (50,000)$ -$ NA Total (230)$ (900,000)$ (350,000)$ (125,000)$ (50,000)$ -$ NA
Total Excess of Revenues 368,576$ (510,493)$ (126,127)$ 61,547$ 20,327$ (29,740)$

102 Back to Table of Contents
TABLE 5.2G – COSSATOT COMMUNITY COLLEGE OF THE UNIVERSITY OF ARKANSAS UNRESTRICTED EDUCATIONAL & GENERAL
5 yr2010-11 2011-12 2012-13 2013-14 2014-15 2015-16 % Incr
Unrestricted E&G RevenuesTuition & Fees 2,743,718$ 2,595,916$ 2,915,387$ 3,265,170$ 3,278,508$ 3,640,662$ 32.7%Gov. Appropriations Federal -$ -$ -$ -$ -$ -$ NA State 4,625,521$ 4,647,603$ 4,706,016$ 4,746,139$ 4,732,835$ 4,746,139$ 2.6% Local 1,205,211$ 1,219,654$ 1,088,211$ 1,153,584$ 1,158,417$ 1,250,152$ 3.7%Grants & Contracts Federal 85,611$ 52,834$ 12,268$ 7,399$ 13,240$ 9,786$ -88.6% State 24,374$ 3,060$ 5,312$ 3,810$ 2,152$ 6,506$ -73.3% Local -$ -$ -$ -$ -$ -$ NAPrivate Gifts, Grants and Contracts 31,645$ 80$ 25,000$ -$ 1,000$ 2,250$ -92.9%Endow ment Income -$ -$ -$ -$ -$ -$ NASales and Services Educational Actvities 26,637$ 25,334$ 46,672$ 38,808$ 44,883$ 66,431$ 149.4%
Hospitals -$ -$ -$ -$ -$ -$ NAOther Investments 15,393$ 16,845$ 9,991$ 13,502$ 12,178$ 9,975$ -35.2%Other 178,006$ 149,096$ 79,224$ 66,574$ 96,774$ 57,900$ -67.5% Total 8,936,116$ 8,710,422$ 8,888,081$ 9,294,986$ 9,339,987$ 9,789,801$ 9.6%
Teaching Salaries 1,664,499$ 1,688,383$ 1,743,001$ 1,953,547$ 1,921,018$ 1,874,626$ 12.6%Dept. Oper. Expense 1,501,336$ 1,577,449$ 1,597,196$ 1,839,759$ 1,820,559$ 2,013,576$ 34.1%Off-Campus Credit -$ -$ -$ -$ -$ -$ NANon-Credit Instruction 67,778$ 58,153$ 62,441$ 90,388$ 102,724$ 82,886$ 22.3%Research -$ -$ -$ -$ -$ -$ NAPublic Service 2,701$ 2,869$ 2,325$ 2,381$ -$ -$ -100.0%Libraries 127,181$ 115,135$ 112,829$ 96,446$ 101,605$ 88,083$ -30.7%Museums & Galleries -$ -$ -$ -$ -$ -$ NAOrganized Activities -$ -$ -$ -$ -$ -$ NAOther Academic Support 1,353,330$ 1,318,991$ 1,161,335$ 1,113,125$ 1,128,977$ 1,029,289$ -23.9%Student Services 899,408$ 980,398$ 1,042,941$ 1,046,937$ 1,065,726$ 1,131,913$ 25.9%Institutional Support 1,234,136$ 1,146,687$ 1,250,764$ 1,445,316$ 1,464,135$ 1,486,560$ 20.5%Utilities 289,918$ 258,948$ 307,125$ 322,674$ 323,927$ 326,761$ 12.7%Other Plant Maintenance 737,763$ 1,013,556$ 957,931$ 922,648$ 855,904$ 852,433$ 15.5%Scholarships & Fellow ships 29,855$ 20,674$ 55,711$ 84,204$ 65,936$ 67,152$ 124.9%Other 263,575$ 272,758$ 260,590$ 193,008$ 188,016$ 169,462$ -35.7%Transfers - Auxiliary -$ 22,652$ 30,642$ 44,515$ 117,897$ (865)$ NATransfers - Mandatory -$ -$ 183,760$ 183,760$ 183,760$ 183,760$ NATransfers -Non Mandatory 235,116$ 250,319$ 246,704$ 257,080$ (599,211)$ 264,408$ 12.5% Total 8,406,596$ 8,726,972$ 9,015,295$ 9,595,788$ 8,740,973$ 9,570,044$ 13.8%
Unrestricted E&G Expenditures
Source: Revenues from ADHE Series 17-1; Expenditures from ADHE Series 17-7a.

103 Back to Table of Contents
TABLE 5.2G – COSSATOT COMMUNITY COLLEGE OF THE UNIVERSITY OF ARKANSAS (CONT.) AUXILIARY ENTERPRISES
5 yr2010-11 2011-12 2012-13 2013-14 2014-15 2015-16 % Incr
RevenuesIntercollegiate Athletics -$ 18,368$ 10,858$ 22,422$ 23,979$ 20,143$ NAResident Halls -$ -$ -$ -$ -$ -$ NAMarried Student Housing -$ -$ -$ -$ -$ -$ NAFaculty Housing -$ -$ -$ -$ -$ -$ NAFood Service -$ -$ -$ -$ 65,694$ 72,354$ NACollege Union -$ -$ -$ -$ -$ -$ NABookstore -$ -$ -$ -$ -$ 176,068$ NAStudent Org. and Publications -$ -$ -$ -$ -$ -$ NAStudent Health Service -$ -$ -$ -$ -$ -$ NAOther Auxiliary -$ -$ -$ -$ -$ -$ NA Total -$ 18,368$ 10,858$ 22,422$ 89,673$ 268,565$ NA
ExpendituresIntercollegiate Athletics -$ 41,022$ 46,163$ 75,497$ 83,188$ 85,122$ NAResident Halls -$ -$ -$ -$ -$ -$ NAMarried Student Housing -$ -$ -$ -$ -$ -$ NAFaculty Housing -$ -$ -$ -$ -$ -$ NAFood Service -$ -$ -$ -$ 131,313$ 98,628$ NACollege Union -$ -$ -$ -$ -$ -$ NABookstore -$ -$ -$ -$ -$ 95,635$ NAStudent Org. and Publications -$ -$ -$ -$ -$ -$ NAStudent Health Service -$ -$ -$ -$ -$ -$ NAOther Auxiliary -$ -$ -$ -$ -$ -$ NA Total -$ 41,022$ 46,163$ 75,497$ 214,501$ 279,385$ NA
Transfers/Debt ServiceIntercollegiate Athletics -$ -$ -$ -$ -$ -$ NAResident Halls -$ -$ -$ -$ -$ -$ NAMarried Student Housing -$ -$ -$ -$ -$ -$ NAFaculty Housing -$ -$ -$ -$ -$ -$ NAFood Service -$ -$ -$ -$ -$ -$ NACollege Union -$ -$ -$ -$ -$ -$ NABookstore -$ -$ -$ -$ -$ -$ NAStudent Org. and Publications -$ -$ -$ -$ -$ -$ NAStudent Health Service -$ -$ -$ -$ -$ -$ NAOther Auxiliary -$ -$ -$ -$ -$ -$ NA Total -$ -$ -$ -$ -$ -$ NA
Excess of Revenues -$ (22,654)$ (35,305)$ (53,075)$ (124,828)$ (10,820)$ NA
Special TransfersAuxiliary Transfer Policy -$ 22,654$ 35,305$ -$ 124,828$ 64,979$ NAOther Auxilary Transfer -$ -$ -$ -$ -$ (54,159)$ NA Total -$ 22,654$ 35,305$ -$ 124,828$ 10,820$ NA
Total Excess of Revenues -$ -$ -$ (53,075)$ -$ -$
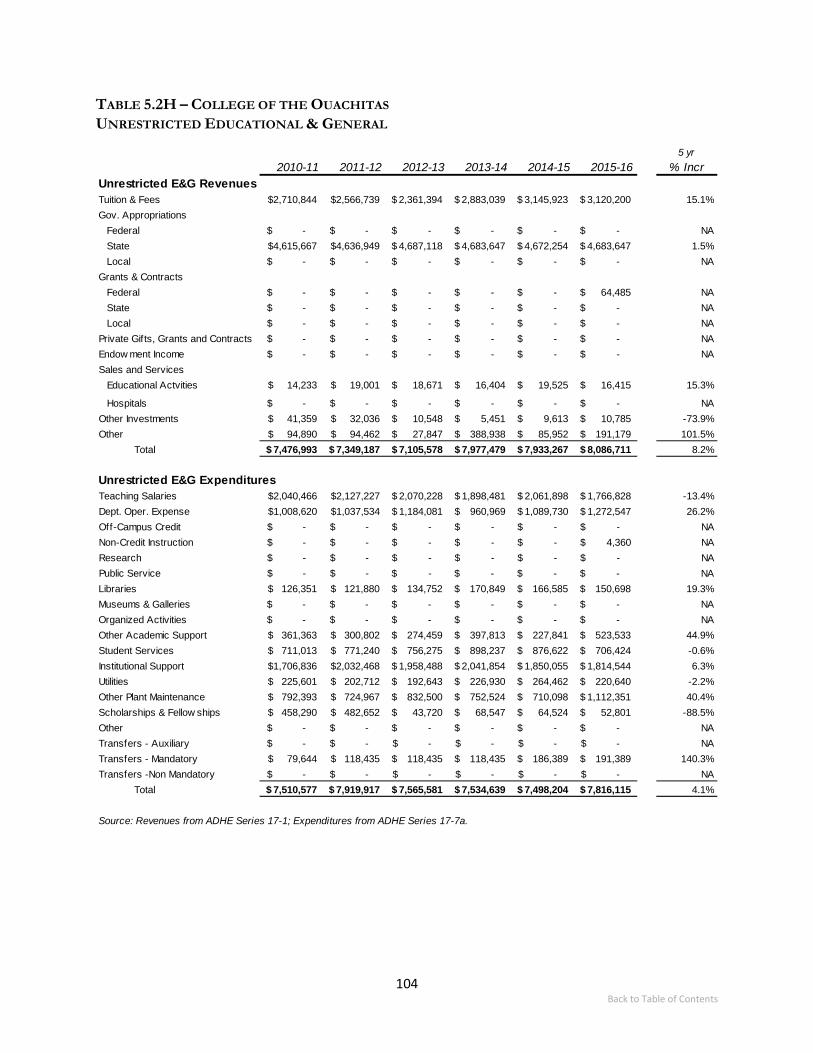
104 Back to Table of Contents
TABLE 5.2H – COLLEGE OF THE OUACHITAS UNRESTRICTED EDUCATIONAL & GENERAL
5 yr2010-11 2011-12 2012-13 2013-14 2014-15 2015-16 % Incr
Unrestricted E&G RevenuesTuition & Fees 2,710,844$ 2,566,739$ 2,361,394$ 2,883,039$ 3,145,923$ 3,120,200$ 15.1%Gov. Appropriations Federal -$ -$ -$ -$ -$ -$ NA State 4,615,667$ 4,636,949$ 4,687,118$ 4,683,647$ 4,672,254$ 4,683,647$ 1.5% Local -$ -$ -$ -$ -$ -$ NAGrants & Contracts Federal -$ -$ -$ -$ -$ 64,485$ NA State -$ -$ -$ -$ -$ -$ NA Local -$ -$ -$ -$ -$ -$ NAPrivate Gifts, Grants and Contracts -$ -$ -$ -$ -$ -$ NAEndow ment Income -$ -$ -$ -$ -$ -$ NASales and Services Educational Actvities 14,233$ 19,001$ 18,671$ 16,404$ 19,525$ 16,415$ 15.3%
Hospitals -$ -$ -$ -$ -$ -$ NAOther Investments 41,359$ 32,036$ 10,548$ 5,451$ 9,613$ 10,785$ -73.9%Other 94,890$ 94,462$ 27,847$ 388,938$ 85,952$ 191,179$ 101.5% Total 7,476,993$ 7,349,187$ 7,105,578$ 7,977,479$ 7,933,267$ 8,086,711$ 8.2%
Teaching Salaries 2,040,466$ 2,127,227$ 2,070,228$ 1,898,481$ 2,061,898$ 1,766,828$ -13.4%Dept. Oper. Expense 1,008,620$ 1,037,534$ 1,184,081$ 960,969$ 1,089,730$ 1,272,547$ 26.2%Off-Campus Credit -$ -$ -$ -$ -$ -$ NANon-Credit Instruction -$ -$ -$ -$ -$ 4,360$ NAResearch -$ -$ -$ -$ -$ -$ NAPublic Service -$ -$ -$ -$ -$ -$ NALibraries 126,351$ 121,880$ 134,752$ 170,849$ 166,585$ 150,698$ 19.3%Museums & Galleries -$ -$ -$ -$ -$ -$ NAOrganized Activities -$ -$ -$ -$ -$ -$ NAOther Academic Support 361,363$ 300,802$ 274,459$ 397,813$ 227,841$ 523,533$ 44.9%Student Services 711,013$ 771,240$ 756,275$ 898,237$ 876,622$ 706,424$ -0.6%Institutional Support 1,706,836$ 2,032,468$ 1,958,488$ 2,041,854$ 1,850,055$ 1,814,544$ 6.3%Utilities 225,601$ 202,712$ 192,643$ 226,930$ 264,462$ 220,640$ -2.2%Other Plant Maintenance 792,393$ 724,967$ 832,500$ 752,524$ 710,098$ 1,112,351$ 40.4%Scholarships & Fellow ships 458,290$ 482,652$ 43,720$ 68,547$ 64,524$ 52,801$ -88.5%Other -$ -$ -$ -$ -$ -$ NATransfers - Auxiliary -$ -$ -$ -$ -$ -$ NATransfers - Mandatory 79,644$ 118,435$ 118,435$ 118,435$ 186,389$ 191,389$ 140.3%Transfers -Non Mandatory -$ -$ -$ -$ -$ -$ NA Total 7,510,577$ 7,919,917$ 7,565,581$ 7,534,639$ 7,498,204$ 7,816,115$ 4.1%
Unrestricted E&G Expenditures
Source: Revenues from ADHE Series 17-1; Expenditures from ADHE Series 17-7a.

105 Back to Table of Contents
TABLE 5.2H – COLLEGE OF THE OUACHITAS (CONT.) AUXILIARY ENTERPRISES
5 yr2010-11 2011-12 2012-13 2013-14 2014-15 2015-16 % Incr
RevenuesIntercollegiate Athletics -$ -$ -$ -$ -$ -$ NAResident Halls -$ -$ -$ -$ -$ -$ NAMarried Student Housing -$ -$ -$ -$ -$ -$ NAFaculty Housing -$ -$ -$ -$ -$ -$ NAFood Service -$ -$ 9,627$ 46,061$ 48,120$ 64,445$ NACollege Union -$ -$ -$ -$ -$ -$ NABookstore 687,683$ 690,591$ 645,528$ 661,626$ 629,646$ 537,559$ -21.8%Student Org. and Publications -$ -$ 44,323$ 56,817$ 54,919$ 45,810$ NAStudent Health Service -$ -$ -$ -$ -$ -$ NAOther Auxiliary -$ -$ -$ -$ -$ -$ NA Total 687,683$ 690,591$ 699,477$ 764,505$ 732,685$ 647,814$ -5.8%
ExpendituresIntercollegiate Athletics -$ -$ -$ -$ -$ -$ NAResident Halls -$ -$ -$ -$ -$ -$ NAMarried Student Housing -$ -$ -$ -$ -$ -$ NAFaculty Housing -$ -$ -$ -$ -$ -$ NAFood Service -$ -$ 18,599$ 84,036$ 112,087$ 109,002$ NACollege Union -$ -$ -$ -$ -$ -$ NABookstore 563,848$ 723,167$ 635,098$ 577,623$ 578,992$ 520,408$ -7.7%Student Org. and Publications -$ -$ -$ -$ -$ -$ NAStudent Health Service -$ -$ -$ -$ -$ -$ NAOther Auxiliary -$ -$ -$ -$ -$ -$ NA Total 563,848$ 723,167$ 653,697$ 661,659$ 691,079$ 629,410$ 11.6%
Transfers/Debt ServiceIntercollegiate Athletics -$ -$ -$ -$ -$ -$ NAResident Halls -$ -$ -$ -$ -$ -$ NAMarried Student Housing -$ -$ -$ -$ -$ -$ NAFaculty Housing -$ -$ -$ -$ -$ -$ NAFood Service -$ -$ -$ -$ -$ -$ NACollege Union -$ -$ -$ -$ -$ -$ NABookstore -$ -$ -$ -$ -$ -$ NAStudent Org. and Publications -$ -$ -$ -$ -$ -$ NAStudent Health Service -$ -$ -$ -$ -$ -$ NAOther Auxiliary -$ -$ -$ -$ -$ -$ NA Total -$ -$ -$ -$ -$ -$ NA
Excess of Revenues 123,835$ (32,576)$ 45,780$ 102,845$ 41,606$ 18,404$ -85.1%
Special TransfersAuxiliary Transfer Policy -$ -$ -$ -$ -$ -$ NAOther Auxilary Transfer -$ -$ -$ -$ -$ -$ NA Total -$ -$ -$ -$ -$ -$ NA
Total Excess of Revenues 123,835$ (32,576)$ 45,780$ 102,845$ 41,606$ 18,404$

106 Back to Table of Contents
TABLE 5.2I – EAST ARKANSAS COMMUNITY COLLEGE UNRESTRICTED EDUCATIONAL & GENERAL
5 yr2010-11 2011-12 2012-13 2013-14 2014-15 2015-16 % Incr
Unrestricted E&G RevenuesTuition & Fees 2,745,377$ 2,682,304$ 2,952,355$ 2,760,293$ 2,576,262$ 2,717,009$ -1.0%Gov. Appropriations Federal -$ -$ -$ -$ -$ NA State 6,481,982$ 6,511,448$ 6,740,849$ 6,538,536$ 6,556,511$ 6,565,224$ 1.3% Local -$ -$ -$ -$ -$ NAGrants & Contracts Federal 61,494$ 64,531$ 62,268$ 32,423$ 22,724$ 20,810$ -66.2% State 53,667$ 60,833$ 56,265$ 67,197$ 67,505$ 45,021$ -16.1% Local -$ -$ 82,582$ -$ -$ NAPrivate Gifts, Grants and Contracts 111,764$ 7,968$ 712$ 121$ 726$ 57$ -99.9%Endow ment Income -$ -$ -$ -$ -$ NASales and Services -$ Educational Actvities -$ -$ -$ -$ -$ NA
Hospitals -$ -$ -$ -$ -$ NAOther Investments 13,010$ 6,534$ 8,863$ 10,174$ 10,198$ 18,098$ 39.1%Other 79,898$ 71,973$ 22,306$ 68,499$ 92,467$ 121,790$ 52.4% Total 9,547,192$ 9,405,591$ 9,926,200$ 9,477,243$ 9,326,393$ 9,488,009$ -0.6%
Teaching Salaries 2,007,569$ 1,895,666$ 2,078,560$ 1,880,708$ 1,861,578$ 1,854,254$ -7.6%Dept. Oper. Expense 1,249,009$ 1,123,588$ 1,114,077$ 894,272$ 912,196$ 733,348$ -41.3%Off-Campus Credit 263,606$ 377,754$ 381,623$ 454,423$ 429,375$ 232,965$ -11.6%Non-Credit Instruction 240,835$ 272,845$ 284,796$ 63,165$ 50,395$ 49,965$ -79.3%Research -$ -$ -$ -$ -$ -$ NAPublic Service 165,701$ 148,455$ 230,811$ 572,600$ 721,536$ 765,311$ 361.9%Libraries 288,123$ 287,165$ 296,620$ 299,456$ 310,988$ 305,462$ 6.0%Museums & Galleries -$ -$ -$ -$ -$ -$ NAOrganized Activities -$ -$ -$ -$ -$ -$ NAOther Academic Support 548,898$ 735,721$ 716,087$ 822,457$ 703,417$ 1,080,095$ 96.8%Student Services 1,133,274$ 1,249,606$ 1,143,876$ 1,155,284$ 1,188,829$ 1,177,969$ 3.9%Institutional Support 1,604,283$ 1,264,845$ 1,694,019$ 1,731,199$ 1,509,218$ 1,611,935$ 0.5%Utilities 186,526$ 311,574$ 300,505$ 307,431$ 327,017$ 284,320$ 52.4%Other Plant Maintenance 713,906$ 615,781$ 599,159$ 627,059$ 661,258$ 573,195$ -19.7%Scholarships & Fellow ships 243,546$ 208,155$ 230,330$ 244,890$ 253,128$ 267,219$ 9.7%Other 29,428$ -$ 44,075$ -$ -$ 103,413$ 251.4%Transfers - Auxiliary (20,355)$ (45,000)$ (1,082)$ (16,366)$ (16,366)$ (56,366)$ NATransfers - Mandatory -$ -$ 49,775$ 83,383$ 83,403$ 83,403$ NATransfers -Non Mandatory (62,500)$ 777,755$ 504,341$ 230,948$ 78,425$ (30,000)$ NA Total 8,591,850$ 9,223,911$ 9,667,572$ 9,350,908$ 9,074,397$ 9,036,488$ 5.2%
Unrestricted E&G Expenditures
Source: Revenues from ADHE Series 17-1; Expenditures from ADHE Series 17-7a.

107 Back to Table of Contents
TABLE 5.2I – EAST ARKANSAS COMMUNITY COLLEGE (CONT.) AUXILIARY ENTERPRISES
5 yr2010-11 2011-12 2012-13 2013-14 2014-15 2015-16 % Incr
RevenuesIntercollegiate Athletics -$ -$ -$ -$ -$ -$ NAResident Halls -$ -$ -$ -$ -$ -$ NAMarried Student Housing -$ -$ -$ -$ -$ -$ NAFaculty Housing -$ -$ -$ -$ -$ -$ NAFood Service 3,255$ 2,624$ 2,843$ 1,975$ 1,786$ 1,800$ -44.7%College Union -$ -$ -$ -$ -$ -$ NABookstore 621,138$ 590,835$ 643,500$ 572,629$ 572,629$ 520,658$ -16.2%Student Org. and Publications -$ -$ -$ -$ -$ -$ NAStudent Health Service -$ -$ -$ -$ -$ -$ NAOther Auxiliary -$ -$ -$ -$ -$ -$ NA Total 624,393$ 593,459$ 646,343$ 574,604$ 574,415$ 522,458$ -16.3%
ExpendituresIntercollegiate Athletics -$ -$ -$ -$ -$ -$ NAResident Halls -$ -$ -$ -$ -$ -$ NAMarried Student Housing -$ -$ -$ -$ -$ -$ NAFaculty Housing -$ -$ -$ -$ -$ -$ NAFood Service -$ -$ -$ -$ -$ -$ NACollege Union -$ -$ -$ -$ -$ -$ NABookstore 588,392$ 548,380$ 587,238$ 526,912$ 484,936$ 519,390$ -11.7%Student Org. and Publications -$ -$ -$ -$ -$ -$ NAStudent Health Service -$ -$ -$ -$ -$ -$ NAOther Auxiliary -$ -$ -$ -$ -$ -$ NA Total 588,392$ 548,380$ 587,238$ 526,912$ 484,936$ 519,390$ -11.7%
Transfers/Debt ServiceIntercollegiate Athletics -$ -$ -$ -$ -$ -$ NAResident Halls -$ -$ -$ -$ -$ -$ NAMarried Student Housing -$ -$ -$ -$ -$ -$ NAFaculty Housing -$ -$ -$ -$ -$ -$ NAFood Service -$ -$ -$ -$ -$ -$ NACollege Union -$ -$ -$ -$ -$ -$ NABookstore -$ -$ -$ -$ -$ -$ NAStudent Org. and Publications -$ -$ -$ -$ -$ -$ NAStudent Health Service -$ -$ -$ -$ -$ -$ NAOther Auxiliary -$ -$ -$ -$ -$ -$ NA Total -$ -$ -$ -$ -$ -$ NA
Excess of Revenues 36,001$ 45,078$ 59,105$ 47,692$ 89,479$ 3,068$ -91.5%
Special TransfersAuxiliary Transfer Policy 24,645$ 22,865$ 21,501$ 23,634$ 23,634$ 23,634$ -4.1%Other Auxilary Transfer (45,000)$ (45,000)$ (22,583)$ (40,000)$ (40,000)$ (80,000)$ NA Total (20,355)$ (22,135)$ (1,082)$ (16,366)$ (16,366)$ (56,366)$ NA
Total Excess of Revenues 15,646$ 22,943$ 58,023$ 31,326$ 73,113$ (53,298)$

108 Back to Table of Contents
TABLE 5.2J – NORTH ARKANSAS COLLEGE UNRESTRICTED EDUCATIONAL & GENERAL
5 yr2010-11 2011-12 2012-13 2013-14 2014-15 2015-16 % Incr
Unrestricted E&G RevenuesTuition & Fees 4,532,076$ 4,404,155$ 4,700,911$ 4,531,546$ 4,265,276$ 4,287,268$ -5.4%Gov. Appropriations Federal -$ -$ -$ -$ -$ -$ NA State 8,927,799$ 8,986,735$ 8,981,521$ 8,985,364$ 8,990,314$ 9,001,126$ 0.8% Local -$ -$ -$ -$ -$ -$ NAGrants & Contracts Federal 106,406$ 106,111$ 103,378$ 98,884$ 97,009$ 90,652$ -14.8% State -$ 805$ 240$ 327$ 435$ 350$ NA Local -$ -$ -$ -$ -$ -$ NAPrivate Gifts, Grants and Contracts 44,419$ 31,506$ 42,065$ 136,580$ 57,668$ 244,628$ 450.7%Endow ment Income -$ -$ -$ -$ -$ -$ NASales and Services -$ -$ -$ -$ Educational Actvities -$ -$ -$ -$ -$ -$ NA
Hospitals -$ -$ -$ -$ -$ -$ NAOther Investments 24,371$ 28,505$ 25,544$ 18,989$ 18,699$ 21,335$ -12.5%Other 96,502$ 84,885$ 84,860$ 91,410$ 112,594$ 94,965$ -1.6% Total 13,731,573$ 13,642,702$ 13,938,519$ 13,863,100$ 13,541,995$ 13,740,324$ 0.1%
Teaching Salaries 4,177,273$ 4,172,562$ 4,031,283$ 3,899,418$ 3,846,460$ 3,792,532$ -9.2%Dept. Oper. Expense 2,108,301$ 2,275,385$ 2,017,327$ 1,932,302$ 1,812,780$ 1,812,425$ -14.0%Off-Campus Credit -$ -$ 11,523$ 25,189$ 31,111$ 28,314$ NANon-Credit Instruction 156,693$ 165,996$ 162,560$ 124,717$ 115,811$ 123,758$ -21.0%Research -$ -$ -$ -$ -$ -$ NAPublic Service -$ -$ -$ -$ -$ -$ NALibraries 434,900$ 450,773$ 372,580$ 385,344$ 283,818$ 234,785$ -46.0%Museums & Galleries -$ -$ -$ -$ -$ -$ NAOrganized Activities -$ -$ -$ -$ -$ -$ NAOther Academic Support 1,441,471$ 2,004,557$ 1,872,518$ 2,016,673$ 1,645,854$ 1,619,973$ 12.4%Student Services 842,052$ 917,367$ 1,000,867$ 1,044,838$ 863,509$ 800,598$ -4.9%Institutional Support 2,063,038$ 2,161,779$ 2,164,210$ 2,355,823$ 2,889,839$ 2,804,880$ 36.0%Utilities 426,825$ 479,316$ 484,161$ 439,512$ 461,508$ 497,289$ 16.5%Other Plant Maintenance 1,284,359$ 1,341,047$ 1,257,029$ 1,501,690$ 1,147,917$ 1,053,417$ -18.0%Scholarships & Fellow ships 379,252$ 361,259$ 410,218$ 402,141$ 340,092$ 430,047$ 13.4%Other -$ -$ -$ -$ -$ -$ NATransfers - Auxiliary 168,831$ 157,027$ 150,335$ 140,680$ 128,119$ 143,513$ -15.0%Transfers - Mandatory 7,840$ 335$ -$ 44,441$ 37,846$ 35,963$ 358.7%Transfers -Non Mandatory (234,317)$ (582,078)$ (150,204)$ (574,439)$ (368,451)$ (97,243)$ NA Total 13,256,518$ 13,905,325$ 13,784,407$ 13,738,329$ 13,236,213$ 13,280,251$ 0.2%
Unrestricted E&G Expenditures
Source: Revenues from ADHE Series 17-1; Expenditures from ADHE Series 17-7a.

109 Back to Table of Contents
TABLE 5.2J – NORTH ARKANSAS COLLEGE (CONT.) AUXILIARY ENTERPRISES
5 yr2010-11 2011-12 2012-13 2013-14 2014-15 2015-16 % Incr
RevenuesIntercollegiate Athletics 7,195$ 10,750$ 11,373$ 11,531$ 13,387$ 16,784$ 133.3%Resident Halls -$ -$ -$ -$ -$ -$ NAMarried Student Housing -$ -$ -$ -$ -$ -$ NAFaculty Housing -$ -$ -$ -$ -$ -$ NAFood Service -$ -$ -$ 20,400$ 1,508$ 6,982$ NACollege Union -$ -$ -$ -$ -$ -$ NABookstore 1,867,120$ 1,798,835$ 1,763,512$ 1,830,047$ 1,502,478$ 1,181,269$ -36.7%Student Org. and Publications -$ -$ -$ -$ -$ -$ NAStudent Health Service -$ -$ -$ -$ -$ -$ NAOther Auxiliary 38,176$ 37,768$ 41,000$ 23,139$ 27,503$ 16,478$ -56.8% Total 1,912,491$ 1,847,353$ 1,815,885$ 1,885,117$ 1,544,876$ 1,221,513$ -36.1%
ExpendituresIntercollegiate Athletics 305,479$ 316,271$ 280,721$ 260,633$ 283,634$ 291,003$ -4.7%Resident Halls -$ -$ -$ -$ -$ NAMarried Student Housing -$ -$ -$ -$ -$ NAFaculty Housing -$ -$ -$ -$ -$ NAFood Service -$ -$ -$ -$ -$ NACollege Union -$ -$ -$ -$ -$ NABookstore 1,594,873$ 1,522,405$ 1,571,427$ 1,634,601$ 1,432,429$ 1,029,602$ -35.4%Student Org. and Publications 5,158$ 7,971$ 8,646$ 10,999$ 12,718$ 16,705$ 223.9%Student Health Service -$ -$ -$ -$ -$ NAOther Auxiliary 28,619$ 33,543$ 36,212$ 32,797$ 13,328$ 18,873$ -34.1% Total 1,934,129$ 1,880,190$ 1,897,006$ 1,939,030$ 1,742,109$ 1,356,183$ -29.9%
Transfers/Debt ServiceIntercollegiate Athletics -$ -$ -$ -$ -$ -$ NAResident Halls -$ -$ -$ -$ -$ -$ NAMarried Student Housing -$ -$ -$ -$ -$ -$ NAFaculty Housing -$ -$ -$ -$ -$ -$ NAFood Service -$ -$ -$ -$ -$ -$ NACollege Union -$ -$ -$ -$ -$ -$ NABookstore -$ -$ -$ -$ -$ -$ NAStudent Org. and Publications -$ -$ -$ -$ -$ -$ NAStudent Health Service -$ -$ -$ -$ -$ -$ NAOther Auxiliary -$ -$ -$ -$ NA Total -$ -$ -$ -$ -$ -$ NA
Excess of Revenues (21,638)$ (32,837)$ (81,121)$ (53,913)$ (197,233)$ (134,670)$ NA
Special TransfersAuxiliary Transfer Policy 168,831$ 157,027$ 150,335$ 140,680$ 128,119$ 130,613$ -22.6%Other Auxilary Transfer (40,000)$ -$ (200,000)$ -$ -$ NA Total 128,831$ 157,027$ (49,665)$ 140,680$ 128,119$ 130,613$ 1.4%
Total Excess of Revenues 107,193$ 124,190$ (130,786)$ 86,767$ (69,114)$ (4,057)$

110 Back to Table of Contents
TABLE 5.2K – NATIONAL PARK COLLEGE UNRESTRICTED EDUCATIONAL & GENERAL
5 yr2010-11 2011-12 2012-13 2013-14 2014-15 2015-16 % Incr
Unrestricted E&G RevenuesTuition & Fees 7,114,956$ 7,775,995$ 7,339,026$ 7,311,154$ 6,298,690$ 6,903,185$ -3.0%Gov. Appropriations Federal -$ -$ -$ -$ -$ -$ NA State 10,579,128$ 10,732,212$ 10,724,382$ 10,836,955$ 10,857,258$ 10,876,872$ 2.8% Local -$ -$ -$ -$ -$ -$ NAGrants & Contracts Federal -$ -$ -$ -$ -$ -$ NA State -$ -$ -$ -$ -$ -$ NA Local -$ -$ -$ -$ -$ -$ NAPrivate Gifts, Grants and Contracts -$ -$ -$ -$ -$ -$ NAEndow ment Income -$ -$ -$ -$ -$ -$ NASales and Services Educational Actvities -$ -$ -$ -$ -$ -$ NA
Hospitals -$ -$ -$ -$ -$ -$ NAOther Investments 4,844$ 16,284$ 12,490$ 15,592$ 8,017$ 6,598$ 36.2%Other 163,543$ 143,132$ 106,214$ 333,716$ 1,901,106$ 47,604$ -70.9% Total 17,862,471$ 18,667,623$ 18,182,112$ 18,497,417$ 19,065,071$ 17,834,259$ -0.2%
Teaching Salaries 4,961,118$ 6,213,252$ 4,558,746$ 4,525,699$ 4,608,895$ 4,224,192$ -14.9%Dept. Oper. Expense 3,023,832$ 2,012,179$ 3,318,611$ 3,317,459$ 1,921,666$ 2,915,748$ -3.6%Off-Campus Credit -$ -$ -$ -$ -$ -$ NANon-Credit Instruction 498,614$ 364,791$ 449,948$ 410,237$ 307,796$ 332,004$ -33.4%Research -$ -$ -$ -$ -$ -$ NAPublic Service 94,852$ 100,535$ 91,569$ 130,653$ 96,939$ -$ -100.0%Libraries 445,579$ 456,159$ 381,234$ 376,060$ 421,720$ 351,097$ -21.2%Museums & Galleries -$ -$ -$ -$ -$ -$ NAOrganized Activities -$ -$ -$ -$ -$ -$ NAOther Academic Support 487,845$ 416,006$ 460,006$ 564,856$ 506,495$ 686,548$ 40.7%Student Services 2,004,897$ 2,036,994$ 2,082,547$ 2,174,033$ 1,824,022$ 1,963,963$ -2.0%Institutional Support 3,759,943$ 4,178,549$ 3,442,639$ 3,960,679$ 3,484,764$ 3,058,345$ -18.7%Utilities 545,443$ 572,369$ 568,913$ 502,761$ 527,624$ 550,533$ 0.9%Other Plant Maintenance 1,230,270$ 1,319,352$ 1,180,593$ 1,192,178$ 1,352,321$ 1,051,201$ -14.6%Scholarships & Fellow ships 797,808$ 1,112,722$ 1,192,989$ 1,117,611$ 1,123,261$ 1,325,412$ 66.1%Other -$ -$ -$ -$ -$ -$ NATransfers - Auxiliary 31,400$ 41,400$ 41,400$ 41,400$ 49,400$ 61,600$ 96.2%Transfers - Mandatory 161,093$ 271,093$ 271,693$ 272,093$ 272,293$ 272,293$ 69.0%Transfers -Non Mandatory -$ -$ -$ -$ -$ -$ NA Total 18,042,694$ 19,095,401$ 18,040,888$ 18,585,719$ 16,497,196$ 16,792,936$ -6.9%
Unrestricted E&G Expenditures
Source: Revenues from ADHE Series 17-1; Expenditures from ADHE Series 17-7a.

111 Back to Table of Contents
TABLE 5.2K – NATIONAL PARK COLLEGE (CONT.) AUXILIARY ENTERPRISES
5 yr2010-11 2011-12 2012-13 2013-14 2014-15 2015-16 % Incr
RevenuesIntercollegiate Athletics -$ -$ -$ -$ -$ -$ NAResident Halls -$ -$ -$ -$ -$ -$ NAMarried Student Housing -$ -$ -$ -$ -$ -$ NAFaculty Housing -$ -$ -$ -$ -$ -$ NAFood Service -$ -$ -$ -$ -$ -$ NACollege Union 16,080$ 14,767$ 10,786$ 7,296$ 8,752$ 6,707$ -58.3%Bookstore 2,599,573$ 2,686,862$ 2,097,180$ 1,790,364$ 1,516,309$ 1,370,736$ -47.3%Student Org. and Publications -$ 41,400$ -$ 5,385$ 49,400$ -$ NAStudent Health Service -$ -$ -$ -$ -$ -$ NAOther Auxiliary -$ -$ -$ -$ -$ -$ NA Total 2,615,653$ 2,743,029$ 2,107,966$ 1,803,045$ 1,574,461$ 1,377,443$ -47.3%
ExpendituresIntercollegiate Athletics -$ -$ -$ -$ -$ -$ NAResident Halls -$ -$ -$ -$ -$ -$ NAMarried Student Housing -$ -$ -$ -$ -$ -$ NAFaculty Housing -$ -$ -$ -$ -$ -$ NAFood Service -$ -$ -$ -$ -$ -$ NACollege Union 7,145$ 7,515$ 2,722$ 12,298$ 7,341$ 7,057$ -1.2%Bookstore 2,340,973$ 2,257,700$ 2,394,847$ 1,672,752$ 1,450,193$ 1,264,170$ -46.0%Student Org. and Publications 35,048$ 44,438$ 44,001$ 87,012$ 50,364$ 48,628$ 38.7%Student Health Service -$ -$ -$ -$ -$ -$ NAOther Auxiliary -$ -$ -$ -$ -$ -$ NA Total 2,383,166$ 2,309,653$ 2,441,570$ 1,772,062$ 1,507,898$ 1,319,855$ -44.6%
Transfers/Debt ServiceIntercollegiate Athletics -$ -$ -$ -$ -$ -$ NAResident Halls -$ -$ -$ -$ -$ -$ NAMarried Student Housing -$ -$ -$ -$ -$ -$ NAFaculty Housing -$ -$ -$ -$ -$ -$ NAFood Service -$ -$ -$ -$ -$ -$ NACollege Union -$ -$ -$ -$ -$ -$ NABookstore -$ -$ -$ -$ -$ -$ NAStudent Org. and Publications -$ -$ -$ -$ -$ -$ NAStudent Health Service -$ -$ -$ -$ -$ -$ NAOther Auxiliary -$ -$ -$ -$ -$ -$ NA Total -$ -$ -$ -$ -$ -$ NA
Excess of Revenues 232,487$ 433,376$ (333,604)$ 30,983$ 66,563$ 57,588$ -75.2%
Special TransfersAuxiliary Transfer Policy 31,400$ (41,400)$ 41,400$ 41,400$ 49,400$ 61,600$ 96.2%Other Auxilary Transfer -$ -$ -$ -$ -$ -$ NA Total 31,400$ (41,400)$ 41,400$ 41,400$ 49,400$ 61,600$ 96.2%
Total Excess of Revenues 263,887$ 391,976$ (292,204)$ 72,383$ 115,963$ 119,188$
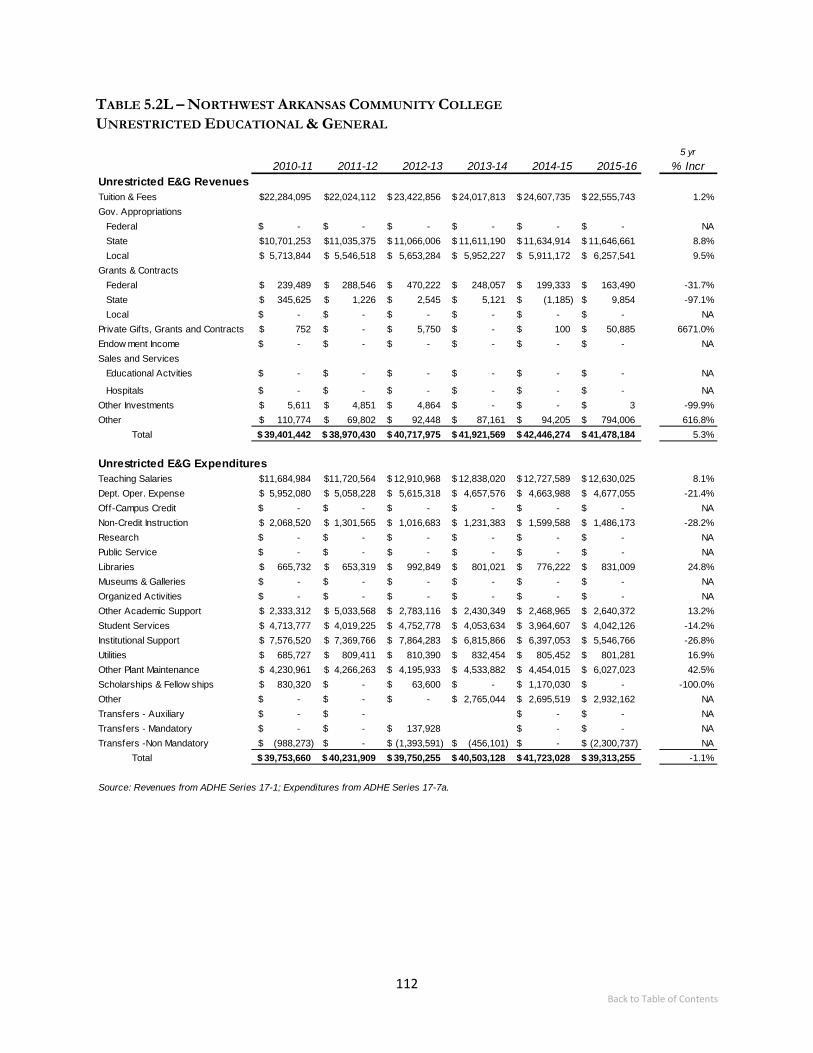
112 Back to Table of Contents
TABLE 5.2L – NORTHWEST ARKANSAS COMMUNITY COLLEGE UNRESTRICTED EDUCATIONAL & GENERAL
5 yr2010-11 2011-12 2012-13 2013-14 2014-15 2015-16 % Incr
Unrestricted E&G RevenuesTuition & Fees 22,284,095$ 22,024,112$ 23,422,856$ 24,017,813$ 24,607,735$ 22,555,743$ 1.2%Gov. Appropriations Federal -$ -$ -$ -$ -$ -$ NA State 10,701,253$ 11,035,375$ 11,066,006$ 11,611,190$ 11,634,914$ 11,646,661$ 8.8% Local 5,713,844$ 5,546,518$ 5,653,284$ 5,952,227$ 5,911,172$ 6,257,541$ 9.5%Grants & Contracts Federal 239,489$ 288,546$ 470,222$ 248,057$ 199,333$ 163,490$ -31.7% State 345,625$ 1,226$ 2,545$ 5,121$ (1,185)$ 9,854$ -97.1% Local -$ -$ -$ -$ -$ -$ NAPrivate Gifts, Grants and Contracts 752$ -$ 5,750$ -$ 100$ 50,885$ 6671.0%Endow ment Income -$ -$ -$ -$ -$ -$ NASales and Services Educational Actvities -$ -$ -$ -$ -$ -$ NA
Hospitals -$ -$ -$ -$ -$ -$ NAOther Investments 5,611$ 4,851$ 4,864$ -$ -$ 3$ -99.9%Other 110,774$ 69,802$ 92,448$ 87,161$ 94,205$ 794,006$ 616.8% Total 39,401,442$ 38,970,430$ 40,717,975$ 41,921,569$ 42,446,274$ 41,478,184$ 5.3%
Teaching Salaries 11,684,984$ 11,720,564$ 12,910,968$ 12,838,020$ 12,727,589$ 12,630,025$ 8.1%Dept. Oper. Expense 5,952,080$ 5,058,228$ 5,615,318$ 4,657,576$ 4,663,988$ 4,677,055$ -21.4%Off-Campus Credit -$ -$ -$ -$ -$ -$ NANon-Credit Instruction 2,068,520$ 1,301,565$ 1,016,683$ 1,231,383$ 1,599,588$ 1,486,173$ -28.2%Research -$ -$ -$ -$ -$ -$ NAPublic Service -$ -$ -$ -$ -$ -$ NALibraries 665,732$ 653,319$ 992,849$ 801,021$ 776,222$ 831,009$ 24.8%Museums & Galleries -$ -$ -$ -$ -$ -$ NAOrganized Activities -$ -$ -$ -$ -$ -$ NAOther Academic Support 2,333,312$ 5,033,568$ 2,783,116$ 2,430,349$ 2,468,965$ 2,640,372$ 13.2%Student Services 4,713,777$ 4,019,225$ 4,752,778$ 4,053,634$ 3,964,607$ 4,042,126$ -14.2%Institutional Support 7,576,520$ 7,369,766$ 7,864,283$ 6,815,866$ 6,397,053$ 5,546,766$ -26.8%Utilities 685,727$ 809,411$ 810,390$ 832,454$ 805,452$ 801,281$ 16.9%Other Plant Maintenance 4,230,961$ 4,266,263$ 4,195,933$ 4,533,882$ 4,454,015$ 6,027,023$ 42.5%Scholarships & Fellow ships 830,320$ -$ 63,600$ -$ 1,170,030$ -$ -100.0%Other -$ -$ -$ 2,765,044$ 2,695,519$ 2,932,162$ NATransfers - Auxiliary -$ -$ -$ -$ NATransfers - Mandatory -$ -$ 137,928$ -$ -$ NATransfers -Non Mandatory (988,273)$ -$ (1,393,591)$ (456,101)$ -$ (2,300,737)$ NA Total 39,753,660$ 40,231,909$ 39,750,255$ 40,503,128$ 41,723,028$ 39,313,255$ -1.1%
Unrestricted E&G Expenditures
Source: Revenues from ADHE Series 17-1; Expenditures from ADHE Series 17-7a.

113 Back to Table of Contents
TABLE 5.2L – NORTHWEST ARKANSAS COMMUNITY COLLEGE (CONT.) AUXILIARY ENTERPRISES
5 yr2010-11 2011-12 2012-13 2013-14 2014-15 2015-16 % Incr
Revenues Intercollegiate Athletics -$ -$ -$ -$ -$ -$ NAResident Halls -$ -$ -$ -$ -$ -$ NAMarried Student Housing -$ -$ -$ -$ -$ -$ NAFaculty Housing -$ -$ -$ -$ -$ -$ NAFood Service 48,107$ 93,802$ 195,981$ 68,817$ 10,368$ 6,662$ -86.2%College Union -$ -$ -$ -$ -$ -$ NABookstore 340,139$ 354,469$ 297,817$ 305,655$ 230,458$ 248,576$ -26.9%Student Org. and Publications -$ -$ -$ -$ -$ -$ NAStudent Health Service -$ -$ -$ -$ -$ -$ NAOther Auxiliary 92,637$ 114,779$ 143,743$ 237,681$ 227,830$ 232,590$ 151.1% Total 480,883$ 563,050$ 637,541$ 612,154$ 468,656$ 487,828$ 1.4%
ExpendituresIntercollegiate Athletics -$ -$ -$ -$ -$ -$ NAResident Halls -$ -$ -$ -$ -$ -$ NAMarried Student Housing -$ -$ -$ -$ -$ -$ NAFaculty Housing -$ -$ -$ -$ -$ -$ NAFood Service 185,339$ 293,746$ 341,671$ 115,401$ 13,128$ 7,577$ -95.9%College Union -$ -$ -$ -$ -$ -$ NABookstore 279$ 49,354$ 373,131$ 14,132$ 141$ 88$ -68.6%Student Org. and Publications -$ -$ -$ -$ -$ -$ NAStudent Health Service -$ -$ -$ -$ -$ -$ NAOther Auxiliary 16,060$ 1,204$ 40,447$ 230,542$ 408,439$ 397,147$ 2372.9% Total 201,678$ 344,304$ 755,249$ 360,075$ 421,708$ 404,811$ 100.7%
Transfers/Debt ServiceIntercollegiate Athletics -$ -$ -$ -$ -$ -$ NAResident Halls -$ -$ -$ -$ -$ -$ NAMarried Student Housing -$ -$ -$ -$ -$ -$ NAFaculty Housing -$ -$ -$ -$ -$ -$ NAFood Service -$ -$ -$ -$ -$ -$ NACollege Union -$ -$ -$ -$ -$ -$ NABookstore -$ -$ -$ -$ -$ -$ NAStudent Org. and Publications -$ -$ -$ -$ -$ -$ NAStudent Health Service -$ -$ -$ -$ -$ -$ NAOther Auxiliary -$ -$ -$ -$ -$ -$ NA Total -$ -$ -$ -$ -$ -$ NA
Excess of Revenues 279,205$ 218,746$ (117,708)$ 252,079$ 46,947$ 83,017$ -70.3%
Special TransfersAuxiliary Transfer Policy -$ -$ -$ -$ -$ -$ NAOther Auxilary Transfer -$ (1,838)$ -$ (245,130)$ (50,856)$ (202,349)$ NA Total -$ (1,838)$ -$ (245,130)$ (50,856)$ (202,349)$ NA
Total Excess of Revenues 279,205$ 216,907$ (117,708)$ 6,949$ (3,909)$ (119,332)$

114 Back to Table of Contents
TABLE 5.2M – OZARKA COLLEGE UNRESTRICTED EDUCATIONAL & GENERAL
5 yr2010-11 2011-12 2012-13 2013-14 2014-15 2015-16 % Incr
Unrestricted E&G RevenuesTuition & Fees 3,723,770$ 3,892,672$ 3,855,843$ 3,853,957$ 3,792,629$ 3,385,560$ -9.1%Gov. Appropriations Federal -$ -$ -$ -$ -$ -$ NA State 4,179,930$ 4,206,530$ 4,264,352$ 4,398,316$ 4,385,785$ 4,398,316$ 5.2% Local 248,595$ 253,820$ 361,713$ 416,382$ 426,625$ 445,295$ 79.1%Grants & Contracts Federal 58,162$ -$ -$ -$ -$ -$ -100.0% State -$ -$ -$ -$ -$ -$ NA Local -$ -$ -$ -$ -$ -$ NAPrivate Gifts, Grants and Contracts -$ 85,500$ -$ -$ 166,823$ 35,928$ NAEndow ment Income -$ -$ -$ -$ -$ -$ NASales and Services Educational Actvities -$ -$ -$ -$ -$ -$ NA
Hospitals -$ -$ -$ -$ -$ -$ NAOther Investments 42,451$ 14,262$ 13,918$ 9,727$ 6,941$ 5,030$ -88.2%Other 100,625$ 120,788$ 384,768$ 71,527$ (285,341)$ 237,570$ 136.1% Total 8,353,532$ 8,573,572$ 8,880,594$ 8,749,909$ 8,493,462$ 8,507,698$ 1.8%
Teaching Salaries 2,162,252$ 2,271,565$ 2,175,521$ 2,218,003$ 2,263,890$ 2,122,071$ -1.9%Dept. Oper. Expense 1,028,098$ 1,079,218$ 1,181,274$ 1,215,114$ 1,404,883$ 1,159,019$ 12.7%Off-Campus Credit -$ -$ -$ -$ -$ -$ NANon-Credit Instruction -$ -$ -$ -$ -$ -$ NAResearch -$ -$ -$ -$ -$ -$ NAPublic Service 239,759$ 269,122$ 201,343$ 236,025$ 195,295$ 177,392$ -26.0%Libraries 188,996$ 183,629$ 179,439$ 217,091$ 196,259$ 184,771$ -2.2%Museums & Galleries -$ -$ -$ -$ -$ -$ NAOrganized Activities -$ -$ -$ -$ -$ -$ NAOther Academic Support -$ -$ -$ -$ -$ -$ NAStudent Services 584,718$ 683,400$ 730,697$ 691,762$ 824,842$ 616,554$ 5.4%Institutional Support 2,142,061$ 2,372,148$ 2,380,656$ 2,460,335$ 2,666,768$ 2,367,438$ 10.5%Utilities 217,063$ 360,332$ 309,539$ 332,521$ 355,340$ 366,469$ 68.8%Other Plant Maintenance 998,199$ 1,128,225$ 1,149,016$ 933,511$ 1,114,951$ 1,111,512$ 11.4%Scholarships & Fellow ships 291,761$ 294,367$ 386,666$ 493,334$ 542,418$ 530,501$ 81.8%Other -$ -$ -$ -$ -$ -$ NATransfers - Auxiliary -$ -$ -$ -$ -$ -$ NATransfers - Mandatory -$ -$ -$ 26,708$ 73,108$ 73,108$ NATransfers -Non Mandatory -$ -$ -$ -$ -$ -$ NA Total 7,852,907$ 8,642,006$ 8,694,152$ 8,824,404$ 9,637,753$ 8,708,835$ 10.9%
Unrestricted E&G Expenditures
Source: Revenues from ADHE Series 17-1; Expenditures from ADHE Series 17-7a.

115 Back to Table of Contents
TABLE 5.2M – OZARKA COLLEGE (CONT.) AUXILIARY ENTERPRISES
5 yr2010-11 2011-12 2012-13 2013-14 2014-15 2015-16 % Incr
RevenuesIntercollegiate Athletics -$ -$ -$ -$ -$ -$ NAResident Halls -$ -$ -$ -$ -$ -$ NAMarried Student Housing -$ -$ -$ -$ -$ -$ NAFaculty Housing -$ -$ -$ -$ -$ -$ NAFood Service 85,395$ 71,723$ 85,707$ 76,546$ 25,072$ 35,824$ -58.0%College Union -$ -$ -$ -$ -$ -$ NABookstore 854,496$ 1,006,963$ 848,688$ 825,122$ 676,450$ 534,249$ -37.5%Student Org. and Publications -$ -$ -$ -$ -$ -$ NAStudent Health Service -$ -$ -$ -$ -$ -$ NAOther Auxiliary 123,803$ 164,478$ 196,658$ 175,515$ 155,401$ 141,882$ 14.6% Total 1,063,694$ 1,243,164$ 1,131,052$ 1,077,183$ 856,923$ 711,954$ -33.1%
ExpendituresIntercollegiate Athletics -$ -$ -$ -$ -$ -$ NAResident Halls -$ -$ -$ -$ -$ -$ NAMarried Student Housing -$ -$ -$ -$ -$ -$ NAFaculty Housing -$ -$ -$ -$ -$ -$ NAFood Service 146,499$ 147,078$ 151,113$ 159,573$ 25,226$ 111,009$ -24.2%College Union -$ -$ -$ -$ -$ -$ NABookstore 740,383$ 849,642$ 736,051$ 708,407$ 557,125$ 514,757$ -30.5%Student Org. and Publications -$ -$ -$ -$ -$ -$ NAStudent Health Service -$ -$ -$ -$ -$ -$ NAOther Auxiliary 191,585$ 227,834$ 288,021$ 277,356$ 249,152$ 200,764$ 4.8% Total 1,078,466$ 1,224,554$ 1,175,185$ 1,145,336$ 831,503$ 826,531$ -23.4%
Transfers/Debt ServiceIntercollegiate Athletics -$ -$ -$ -$ -$ -$ NAResident Halls -$ -$ -$ -$ -$ -$ NAMarried Student Housing -$ -$ -$ -$ -$ -$ NAFaculty Housing -$ -$ -$ -$ -$ -$ NAFood Service -$ -$ -$ -$ -$ -$ NACollege Union -$ -$ -$ -$ -$ -$ NABookstore -$ -$ -$ -$ -$ -$ NAStudent Org. and Publications -$ -$ -$ -$ -$ -$ NAStudent Health Service -$ -$ -$ -$ -$ -$ NAOther Auxiliary -$ -$ -$ -$ -$ -$ NA Total -$ -$ -$ -$ -$ -$ NA
Excess of Revenues (14,772)$ 18,610$ (44,133)$ (68,153)$ 25,420$ (114,576)$ NA
Special TransfersAuxiliary Transfer Policy -$ -$ -$ -$ -$ -$ NAOther Auxilary Transfer -$ -$ -$ -$ -$ -$ NA Total -$ -$ -$ -$ -$ -$ NA
Total Excess of Revenues (14,772)$ 18,610$ (44,133)$ (68,153)$ 25,420$ (114,576)$

116 Back to Table of Contents
TABLE 5.2N – PHILLIPS COMMUNITY COLLEGE OF THE UNIVERSITY OF ARKANSAS UNRESTRICTED EDUCATIONAL & GENERAL
5 yr2010-11 2011-12 2012-13 2013-14 2014-15 2015-16 % Incr
Unrestricted E&G RevenuesTuition & Fees 3,168,939$ 3,825,570$ 3,096,106$ 3,209,837$ 2,837,099$ 2,696,184$ -14.9%Gov. Appropriations Federal -$ -$ -$ -$ -$ -$ NA State 10,247,275$ 10,270,233$ 10,499,364$ 10,323,808$ 10,336,094$ 10,349,799$ 1.0% Local -$ 2,023,942$ 1,944,250$ 2,153,019$ 2,134,666$ 2,071,753$ NAGrants & Contracts Federal -$ -$ -$ -$ -$ -$ NA State 595,067$ -$ 425,995$ 497,518$ 447,664$ 479,526$ -19.4% Local 1,975,950$ -$ 384,549$ 493,631$ 407,180$ 491,591$ -75.1%Private Gifts, Grants and Contracts -$ -$ -$ -$ -$ -$ NAEndow ment Income -$ -$ -$ -$ -$ -$ NASales and Services Educational Actvities 25,379$ 22,954$ 23,270$ 22,012$ 19,325$ 30,062$ 18.5%
Hospitals -$ -$ -$ -$ -$ -$ NAOther Investments 11,278$ 11,088$ 11,939$ 13,819$ 17,646$ 17,290$ 53.3%Other 152,910$ 127,405$ 234,008$ 158,441$ 268,164$ 172,183$ 12.6% Total 16,176,798$ 16,281,192$ 16,619,481$ 16,872,085$ 16,467,838$ 16,308,388$ 0.8%
Teaching Salaries 2,989,446$ 2,939,224$ 3,010,827$ 3,190,079$ 3,094,263$ 2,995,866$ 0.2%Dept. Oper. Expense 2,196,443$ 2,550,433$ 2,528,985$ 2,705,027$ 2,856,921$ 2,558,017$ 16.5%Off-Campus Credit -$ -$ -$ -$ -$ -$ NANon-Credit Instruction 321,253$ 311,963$ 121,705$ 130,612$ 129,790$ 107,037$ -66.7%Research -$ -$ -$ -$ -$ -$ NAPublic Service 563,379$ 761,279$ 721,794$ 651,331$ 681,296$ 610,024$ 8.3%Libraries 358,167$ 333,518$ 377,988$ 374,466$ 422,142$ 369,867$ 3.3%Museums & Galleries -$ -$ -$ -$ -$ -$ NAOrganized Activities -$ -$ -$ -$ -$ -$ NAOther Academic Support 1,449,126$ 1,549,556$ 1,388,627$ 1,383,423$ 1,435,856$ 1,315,620$ -9.2%Student Services 1,157,146$ 1,233,060$ 1,385,748$ 1,275,250$ 1,339,908$ 1,238,128$ 7.0%Institutional Support 3,308,712$ 3,029,986$ 2,815,332$ 3,055,462$ 2,783,245$ 2,625,213$ -20.7%Utilities 639,798$ 694,406$ 693,706$ 764,298$ 659,329$ 659,670$ 3.1%Other Plant Maintenance 1,245,302$ 1,153,474$ 1,198,814$ 1,214,917$ 1,207,378$ 1,040,482$ -16.4%Scholarships & Fellow ships 278,738$ 315,948$ 328,502$ 340,151$ 313,209$ 309,235$ 10.9%Other -$ -$ -$ -$ -$ -$ NATransfers - Auxiliary 67,536$ 63,644$ 50,000$ 87,174$ (60,000)$ (55,000)$ -181.4%Transfers - Mandatory 588,243$ -$ 771,225$ 427,389$ 734,660$ 633,019$ 7.6%Transfers -Non Mandatory 295,138$ 1,063,348$ 275,000$ 620,506$ 257,912$ 1,395,000$ 372.7% Total 15,458,427$ 15,999,839$ 15,668,253$ 16,220,085$ 15,855,909$ 15,802,178$ 2.2%
Unrestricted E&G Expenditures
Source: Revenues from ADHE Series 17-1; Expenditures from ADHE Series 17-7a.

117 Back to Table of Contents
TABLE 5.2N – PHILLIPS COMMUNITY COLLEGE OF THE UNIVERSITY OF ARKANSAS (CONT.) AUXILIARY ENTERPRISES
5 yr2010-11 2011-12 2012-13 2013-14 2014-15 2015-16 % Incr
RevenuesIntercollegiate Athletics -$ -$ -$ -$ -$ -$ NAResident Halls -$ -$ -$ -$ -$ -$ NAMarried Student Housing -$ -$ -$ -$ -$ -$ NAFaculty Housing -$ -$ -$ -$ -$ -$ NAFood Service 87,844$ 76,453$ 84,235$ 96,654$ -100.0%College Union -$ -$ -$ -$ -$ -$ NABookstore 48,917$ 43,918$ 43,026$ 90,276$ 73,750$ 60,353$ 23.4%Student Org. and Publications -$ -$ -$ -$ -$ -$ NAStudent Health Service -$ -$ -$ -$ -$ -$ NAOther Auxiliary 47,344$ 86,444$ 95,117$ 88,178$ 89,270$ 99,103$ 109.3% Total 184,105$ 206,815$ 222,378$ 275,108$ 163,020$ 159,456$ -13.4%
ExpendituresIntercollegiate Athletics -$ -$ -$ -$ -$ -$ NAResident Halls -$ -$ -$ -$ -$ -$ NAMarried Student Housing -$ -$ -$ -$ -$ -$ NAFaculty Housing -$ -$ -$ -$ -$ -$ NAFood Service 153,820$ 160,145$ 170,932$ 144,093$ 140$ -100.0%College Union -$ -$ -$ -$ -$ -$ NABookstore -$ -$ -$ -$ -$ -$ NAStudent Org. and Publications 31,214$ 32,791$ 27,460$ 25,738$ 35,592$ 26,624$ -14.7%Student Health Service -$ -$ -$ -$ -$ -$ NAOther Auxiliary 35,319$ 20,966$ 17,864$ 27,758$ 15,783$ 18,492$ -47.6% Total 220,353$ 213,902$ 216,256$ 197,589$ 51,515$ 45,116$ -79.5%
Transfers/Debt ServiceIntercollegiate Athletics -$ -$ -$ -$ -$ -$ NAResident Halls -$ -$ -$ -$ -$ -$ NAMarried Student Housing -$ -$ -$ -$ -$ -$ NAFaculty Housing -$ -$ -$ -$ -$ -$ NAFood Service -$ -$ -$ -$ -$ -$ NACollege Union -$ -$ -$ -$ -$ -$ NABookstore -$ -$ -$ -$ -$ -$ NAStudent Org. and Publications -$ -$ -$ -$ -$ -$ NAStudent Health Service -$ -$ -$ -$ -$ -$ NAOther Auxiliary -$ -$ -$ -$ -$ -$ NA Total -$ -$ -$ -$ -$ -$ NA
Excess of Revenues (36,248)$ (7,087)$ 6,122$ 77,519$ 111,505$ 114,340$ NA
Special TransfersAuxiliary Transfer Policy -$ 63,644$ 27,460$ 25,738$ -$ -$ NAOther Auxilary Transfer 67,536$ -$ 22,540$ 61,436$ (60,000)$ (55,000)$ -181.4% Total 67,536$ 63,644$ 50,000$ 87,174$ (60,000)$ (55,000)$ -181.4%
Total Excess of Revenues 31,288$ 56,557$ 56,122$ 164,693$ 51,505$ 59,340$

118 Back to Table of Contents
TABLE 5.2O – SOUTH ARKANSAS COMMUNITY COLLEGE UNRESTRICTED EDUCATIONAL & GENERAL
5 yr2010-11 2011-12 2012-13 2013-14 2014-15 2015-16 % Incr
Unrestricted E&G RevenuesTuition & Fees 4,515,680$ 4,595,575$ 4,449,490$ 4,720,741$ 4,871,858$ 4,542,271$ 0.6%Gov. Appropriations Federal -$ -$ -$ -$ -$ NA State 6,913,577$ 6,971,882$ 6,967,269$ 7,012,864$ 7,018,635$ 7,029,201$ 1.7% Local -$ -$ -$ -$ -$ NAGrants & Contracts Federal 94,946$ 142,142$ 84,339$ 80,509$ 170,654$ 172,374$ 81.5% State -$ -$ -$ -$ -$ 4,000$ NA Local -$ -$ -$ -$ -$ NAPrivate Gifts, Grants and Contracts 6,055$ 5,437$ -$ -$ -$ 4,669$ -22.9%Endow ment Income -$ -$ -$ -$ -$ NASales and Services Educational Actvities 59,082$ 78,850$ 90,207$ 90,540$ 117,116$ 113,906$ 92.8%
Hospitals -$ -$ -$ -$ -$ NAOther Investments 63,654$ 45,875$ 11,537$ 627$ 1,193$ 1,621$ -97.5%Other 30,463$ 24,626$ 37,563$ 32,005$ 29,664$ 19,164$ -37.1% Total 11,683,457$ 11,864,387$ 11,640,405$ 11,937,286$ 12,209,120$ 11,887,207$ 1.7%
Unrestricted E&G ExpendituresTeaching Salaries 2,891,952$ 2,615,294$ 2,520,683$ 2,813,252$ 2,773,469$ 2,690,981$ -6.9%Dept. Oper. Expense 1,894,457$ 1,855,683$ 1,998,963$ 2,028,097$ 2,110,510$ 1,295,383$ -31.6%Off-Campus Credit 131,518$ 140,150$ 146,146$ 145,328$ 147,153$ 142,058$ 8.0%Non-Credit Instruction 352,443$ 154,880$ 153,799$ 388,873$ 263,337$ 317,147$ -10.0%Research -$ -$ -$ -$ -$ -$ NAPublic Service 263,232$ 260,032$ 255,398$ 228,608$ 215,462$ 50,823$ -80.7%Libraries 238,914$ 247,429$ 261,859$ 248,697$ 280,267$ 248,366$ 4.0%Museums & Galleries -$ -$ -$ -$ -$ -$ NAOrganized Activities -$ -$ -$ -$ -$ -$ NAOther Academic Support 8,003$ -$ -$ 381,172$ 531,589$ 1,467,585$ 18237.9%Student Services 789,367$ 788,983$ 830,363$ 872,543$ 912,081$ 608,377$ -22.9%Institutional Support 2,705,704$ 2,575,220$ 2,614,152$ 2,300,019$ 2,304,840$ 2,555,558$ -5.5%Utilities 374,465$ 421,896$ 383,302$ 408,438$ 380,017$ 459,822$ 22.8%Other Plant Maintenance 1,005,814$ 1,234,601$ 1,077,440$ 1,148,909$ 1,090,108$ 934,754$ -7.1%Scholarships & Fellow ships 260,020$ 249,350$ 296,919$ 261,359$ 370,270$ 297,214$ 14.3%Other -$ -$ -$ -$ -$ -$ NATransfers - Auxiliary (32,522)$ 93,236$ 185,816$ 266,713$ 269,624$ 281,330$ NATransfers - Mandatory 56,275$ 58,588$ 154,533$ 154,533$ 154,533$ 125,239$ 122.5%Transfers -Non Mandatory 782,982$ 895,469$ 662,017$ 287,368$ 400,055$ 237,011$ -69.7% Total 11,722,624$ 11,590,810$ 11,541,390$ 11,933,909$ 12,203,316$ 11,711,648$ -0.1%
Source: Revenues from ADHE Series 17-1; Expenditures from ADHE Series 17-7a.

119 Back to Table of Contents
TABLE 5.2O – SOUTH ARKANSAS COMMUNITY COLLEGE (CONT.) AUXILIARY ENTERPRISES
5 yr2010-11 2011-12 2012-13 2013-14 2014-15 2015-16 % Incr
RevenuesIntercollegiate Athletics -$ -$ -$ -$ -$ -$ NAResident Halls -$ -$ -$ -$ -$ -$ NAMarried Student Housing -$ -$ -$ -$ -$ -$ NAFaculty Housing -$ -$ -$ -$ -$ -$ NAFood Service 82,233$ 83,093$ 109,466$ 104,561$ 94,641$ 67,847$ -17.5%College Union -$ -$ -$ -$ -$ -$ NABookstore 1,141,283$ 1,389,742$ 1,465,411$ 1,432,737$ 1,387,410$ 1,114,070$ -2.4%Student Org. and Publications -$ -$ -$ -$ -$ -$ NAStudent Health Service -$ -$ -$ -$ -$ -$ NAOther Auxiliary 48,033$ 348,038$ 403,237$ 408,638$ 356,963$ 366,022$ 662.0% Total 1,271,549$ 1,820,873$ 1,978,114$ 1,945,936$ 1,839,014$ 1,547,939$ 21.7%
ExpendituresIntercollegiate Athletics -$ -$ -$ -$ -$ -$ NAResident Halls -$ -$ -$ -$ -$ -$ NAMarried Student Housing -$ -$ -$ -$ -$ -$ NAFaculty Housing -$ -$ -$ -$ -$ -$ NAFood Service 148,156$ 125,881$ 110,445$ 114,464$ 95,464$ 70,651$ -52.3%College Union -$ -$ -$ -$ -$ -$ NABookstore 1,021,215$ 1,155,963$ 1,241,407$ 1,254,617$ 1,235,771$ 1,011,147$ -1.0%Student Org. and Publications -$ -$ -$ -$ -$ -$ NAStudent Health Service -$ -$ -$ -$ -$ -$ NAOther Auxiliary 101,011$ 369,144$ 632,957$ 666,333$ 669,771$ 676,382$ 569.6% Total 1,270,382$ 1,650,988$ 1,984,809$ 2,035,414$ 2,001,006$ 1,758,180$ 38.4%
Transfers/Debt ServiceIntercollegiate Athletics -$ -$ -$ -$ -$ -$ NAResident Halls -$ -$ -$ -$ -$ -$ NAMarried Student Housing -$ -$ -$ -$ -$ -$ NAFaculty Housing -$ -$ -$ -$ -$ -$ NAFood Service -$ -$ -$ -$ -$ -$ NACollege Union -$ -$ -$ -$ -$ -$ NABookstore -$ -$ -$ -$ -$ -$ NAStudent Org. and Publications -$ -$ -$ -$ -$ -$ NAStudent Health Service -$ -$ -$ -$ -$ -$ NAOther Auxiliary -$ -$ -$ -$ -$ -$ NA Total -$ -$ -$ -$ -$ -$ NA
Excess of Revenues 1,167$ 169,885$ (6,695)$ (89,478)$ (161,992)$ (210,241)$ -18115.5%
Special TransfersAuxiliary Transfer Policy 34,946$ -$ -$ -$ -$ -$ -100.0%Other Auxilary Transfer (32,522)$ 93,236$ 185,816$ 266,713$ 269,624$ 286,000$ NA Total 2,424$ 93,236$ 185,816$ 266,713$ 269,624$ 286,000$ 11698.7%
Total Excess of Revenues 3,591$ 263,121$ 179,121$ 177,235$ 107,632$ 75,759$

120 Back to Table of Contents
TABLE 5.2P – SOUTHERN ARKANSAS UNIVERSITY – TECH UNRESTRICTED EDUCATIONAL & GENERAL
5 yr2010-11 2011-12 2012-13 2013-14 2014-15 2015-16 % Incr
Unrestricted E&G RevenuesTuition & Fees 4,365,266$ 4,620,703$ 4,566,899$ 4,896,954$ 4,601,127$ 4,457,094$ 2.1%Gov. Appropriations Federal -$ -$ -$ -$ -$ -$ NA State 5,815,541$ 5,876,733$ 5,839,365$ 5,907,851$ 5,912,697$ 5,915,047$ 1.7% Local -$ -$ -$ -$ -$ -$ NAGrants & Contracts Federal -$ -$ -$ -$ -$ -$ NA State -$ -$ -$ -$ -$ -$ NA Local -$ 3,500$ -$ -$ -$ -$ NAPrivate Gifts, Grants and Contracts 7,275$ -$ -$ -$ -$ -$ -100.0%Endow ment Income -$ -$ -$ -$ -$ -$ NASales and Services Educational Actvities 49,097$ 55,635$ 45,621$ 94,840$ 104,511$ 111,528$ 127.2%
Hospitals -$ -$ -$ -$ -$ -$ NAOther Investments 16,603$ 11,379$ 10,159$ 1,221$ 475$ 4,229$ -74.5%Other 709,365$ 761,297$ 573,683$ 598,620$ 449,793$ 471,347$ -33.6% Total 10,963,147$ 11,329,247$ 11,035,727$ 11,499,486$ 11,068,603$ 10,959,245$ 0.0%
Unrestricted E&G ExpendituresTeaching Salaries 1,803,817$ 1,860,364$ 2,006,235$ 2,001,895$ 1,778,763$ 1,621,842$ -10.1%Dept. Oper. Expense 1,744,075$ 2,050,168$ 1,646,176$ 1,709,980$ 1,682,223$ 1,748,467$ 0.3%Off-Campus Credit -$ -$ -$ -$ -$ -$ NANon-Credit Instruction -$ -$ -$ -$ -$ -$ NAResearch -$ -$ -$ -$ -$ -$ NAPublic Service 244,060$ 229,466$ 216,211$ 209,598$ 152,712$ 90,769$ -62.8%Libraries 183,597$ 185,475$ 186,519$ 187,330$ 178,299$ 169,349$ -7.8%Museums & Galleries -$ -$ -$ -$ -$ -$ NAOrganized Activities -$ -$ -$ -$ -$ -$ NAOther Academic Support 722,099$ 779,175$ 663,972$ 630,661$ 539,531$ 503,911$ -30.2%Student Services 978,780$ 996,835$ 1,017,694$ 995,333$ 971,886$ 962,523$ -1.7%Institutional Support 2,750,660$ 2,826,608$ 2,947,586$ 2,874,321$ 2,547,680$ 2,612,135$ -5.0%Utilities 314,599$ 354,570$ 302,446$ 370,112$ 405,881$ 377,190$ 19.9%Other Plant Maintenance 960,702$ 1,033,149$ 1,043,910$ 989,659$ 962,038$ 966,591$ 0.6%Scholarships & Fellow ships 654,567$ 740,718$ 1,115,817$ 1,371,938$ 1,475,057$ 1,239,735$ 89.4%Other -$ -$ -$ -$ -$ -$ NATransfers - Auxiliary (80,967)$ (77,777)$ (70,529)$ (125,716)$ -$ -$ NATransfers - Mandatory 188,146$ 181,634$ 192,236$ 519,907$ 407,678$ 421,219$ 123.9%Transfers -Non Mandatory 134,094$ 801,740$ 294,088$ 52,785$ -$ 67,999$ -49.3% Total 10,598,229$ 11,962,125$ 11,562,361$ 11,787,803$ 11,101,748$ 10,781,730$ 1.7%
Source: Revenues from ADHE Series 17-1; Expenditures from ADHE Series 17-7a.

121 Back to Table of Contents
TABLE 5.2P – SOUTHERN ARKANSAS UNIVERSITY – TECH (CONT.) AUXILIARY ENTERPRISES
5 yr2010-11 2011-12 2012-13 2013-14 2014-15 2015-16 % Incr
RevenuesIntercollegiate Athletics -$ -$ -$ -$ -$ -$ NAResident Halls 148,432$ 159,112$ 189,935$ 188,348$ 167,418$ 204,172$ 37.6%Married Student Housing -$ -$ -$ -$ -$ -$ NAFaculty Housing -$ -$ -$ -$ -$ -$ NAFood Service -$ -$ -$ -$ -$ -$ NACollege Union -$ -$ -$ -$ -$ -$ NABookstore 603,620$ 550,382$ 576,339$ 98,074$ -100.0%Student Org. and Publications -$ -$ -$ -$ -$ -$ NAStudent Health Service -$ -$ -$ -$ -$ -$ NAOther Auxiliary -$ -$ -$ -$ -$ -$ NA Total 752,052$ 709,494$ 766,274$ 286,422$ 167,418$ 204,172$ -72.9%
ExpendituresIntercollegiate Athletics -$ -$ -$ -$ -$ -$ NAResident Halls 115,189$ 137,151$ 131,885$ 126,763$ 155,716$ 197,770$ 71.7%Married Student Housing -$ -$ -$ -$ -$ -$ NAFaculty Housing -$ -$ -$ -$ -$ -$ NAFood Service -$ -$ -$ -$ -$ -$ NACollege Union -$ -$ -$ -$ -$ -$ NABookstore 519,209$ 466,644$ 527,071$ 151,956$ -100.0%Student Org. and Publications -$ -$ -$ -$ -$ -$ NAStudent Health Service -$ -$ -$ -$ -$ -$ NAOther Auxiliary 126$ -$ 3$ -$ -$ -$ -100.0% Total 634,524$ 603,795$ 658,959$ 278,719$ 155,716$ 197,770$ -68.8%
Transfers/Debt ServiceIntercollegiate Athletics -$ -$ -$ -$ -$ -$ NAResident Halls -$ -$ -$ -$ -$ -$ NAMarried Student Housing -$ -$ -$ -$ -$ -$ NAFaculty Housing -$ -$ -$ -$ -$ -$ NAFood Service -$ -$ -$ -$ -$ -$ NACollege Union -$ -$ -$ -$ -$ -$ NABookstore -$ -$ -$ -$ -$ -$ NAStudent Org. and Publications -$ -$ -$ -$ -$ -$ NAStudent Health Service -$ -$ -$ -$ -$ -$ NAOther Auxiliary -$ -$ -$ -$ -$ -$ NA Total -$ -$ -$ -$ -$ -$ NA
Excess of Revenues 117,528$ 105,699$ 107,315$ 7,703$ 11,702$ 6,402$ -94.6%
Special TransfersAuxiliary Transfer Policy -$ -$ -$ -$ -$ -$ NAOther Auxilary Transfer (114,210)$ (99,738)$ (128,578)$ (187,301)$ -$ -$ NA Total (114,210)$ (99,738)$ (128,578)$ (187,301)$ -$ -$ NA
Total Excess of Revenues 3,318$ 5,961$ (21,263)$ (179,598)$ 11,702$ 6,402$

122 Back to Table of Contents
TABLE 5.2Q – SOUTHEAST ARKANSAS COLLEGE UNRESTRICTED EDUCATIONAL & GENERAL
5 yr2010-11 2011-12 2012-13 2013-14 2014-15 2015-16 % Incr
Unrestricted E&G RevenuesTuition & Fees 4,630,879$ 4,656,006$ 4,012,649$ 3,852,944$ 3,543,554$ 3,610,512$ -22.0%Gov. Appropriations Federal -$ -$ -$ -$ -$ -$ NA State 7,532,012$ 7,526,695$ 7,617,924$ 7,611,997$ 7,592,536$ 7,611,997$ 1.1% Local -$ -$ -$ -$ -$ -$ NAGrants & Contracts Federal -$ -$ -$ -$ -$ 16,364$ NA State -$ -$ -$ -$ -$ -$ NA Local -$ -$ -$ -$ -$ -$ NAPrivate Gifts, Grants and Contracts -$ -$ -$ -$ 7,621$ 10,000$ NAEndow ment Income -$ -$ -$ -$ -$ -$ NASales and Services Educational Actvities -$ -$ -$ -$ -$ -$ NA
Hospitals -$ -$ -$ -$ -$ -$ NAOther Investments 1,962$ 11,789$ 7,618$ 5,517$ 5,849$ 6,247$ 218.4%Other 116,285$ 232,262$ 178,224$ 262,495$ 205,380$ 264,111$ 127.1% Total 12,281,138$ 12,426,752$ 11,816,415$ 11,732,953$ 11,354,940$ 11,519,231$ -6.2%
Unrestricted E&G ExpendituresTeaching Salaries 3,254,050$ 3,054,711$ 2,726,978$ 2,922,035$ 2,954,355$ 2,933,572$ -9.8%Dept. Oper. Expense 1,108,041$ 1,340,271$ 1,190,180$ 1,057,633$ 1,131,541$ 1,193,293$ 7.7%Off-Campus Credit -$ -$ -$ -$ -$ -$ NANon-Credit Instruction 239,635$ 148,646$ 215,012$ 200,635$ 196,646$ 250,569$ 4.6%Research -$ -$ -$ -$ -$ -$ NAPublic Service -$ -$ -$ -$ -$ -$ NALibraries 243,990$ 199,152$ 179,832$ 183,332$ 175,043$ 184,842$ -24.2%Museums & Galleries -$ -$ -$ -$ -$ -$ NAOrganized Activities -$ -$ -$ -$ -$ -$ NAOther Academic Support 572,562$ 582,219$ 370,115$ 274,490$ 337,286$ 402,935$ -29.6%Student Services 798,478$ 923,694$ 871,539$ 890,699$ 950,721$ 861,464$ 7.9%Institutional Support 3,801,724$ 3,683,898$ 3,806,729$ 4,157,494$ 3,547,455$ 3,594,576$ -5.4%Utilities 371,048$ 468,709$ 462,554$ 443,377$ 471,064$ 599,578$ 61.6%Other Plant Maintenance 927,538$ 827,664$ 857,796$ 905,962$ 962,516$ 947,398$ 2.1%Scholarships & Fellow ships 185,724$ 335,342$ 181,813$ 170,518$ 128,075$ 245,198$ 32.0%Other -$ -$ -$ -$ -$ -$ NATransfers - Auxiliary -$ -$ -$ -$ -$ -$ NATransfers - Mandatory -$ -$ -$ -$ -$ -$ NATransfers -Non Mandatory (1,669,910)$ 1,626,370$ -$ 2,132,221$ 111,980$ 300,070$ NA Total 9,832,880$ 13,190,676$ 10,862,548$ 13,338,396$ 10,966,682$ 11,513,495$ 17.1%
Source: Revenues from ADHE Series 17-1; Expenditures from ADHE Series 17-7a.

123 Back to Table of Contents
TABLE 5.2Q – SOUTHEAST ARKANSAS COLLEGE (CONT.) AUXILIARY ENTERPRISES
5 yr2010-11 2011-12 2012-13 2013-14 2014-15 2015-16 % Incr
RevenuesIntercollegiate Athletics -$ -$ -$ -$ -$ -$ NAResident Halls -$ -$ -$ -$ -$ -$ NAMarried Student Housing -$ -$ -$ -$ -$ -$ NAFaculty Housing -$ -$ -$ -$ -$ -$ NAFood Service -$ -$ -$ -$ 83,931$ 79,549$ NACollege Union -$ -$ -$ -$ -$ -$ NABookstore -$ -$ -$ -$ -$ -$ NAStudent Org. and Publications -$ -$ -$ -$ -$ -$ NAStudent Health Service -$ -$ -$ -$ -$ -$ NAOther Auxiliary -$ -$ -$ -$ -$ -$ NA Total -$ -$ -$ -$ 83,931$ 79,549$ NA
ExpendituresIntercollegiate Athletics -$ -$ -$ -$ -$ -$ NAResident Halls -$ -$ -$ -$ -$ -$ NAMarried Student Housing -$ -$ -$ -$ -$ -$ NAFaculty Housing -$ -$ -$ -$ -$ -$ NAFood Service -$ -$ -$ 73,598$ 146,682$ 139,524$ NACollege Union -$ -$ -$ -$ -$ -$ NABookstore -$ -$ -$ -$ -$ -$ NAStudent Org. and Publications -$ -$ -$ -$ -$ -$ NAStudent Health Service -$ -$ -$ -$ -$ -$ NAOther Auxiliary -$ -$ -$ -$ -$ -$ NA Total -$ -$ -$ 73,598$ 146,682$ 139,524$ NA
Transfers/Debt ServiceIntercollegiate Athletics -$ -$ -$ -$ -$ -$ NAResident Halls -$ -$ -$ -$ -$ -$ NAMarried Student Housing -$ -$ -$ -$ -$ -$ NAFaculty Housing -$ -$ -$ -$ -$ -$ NAFood Service -$ -$ -$ 131,141$ -$ -$ NACollege Union -$ -$ -$ -$ -$ -$ NABookstore -$ -$ -$ -$ -$ -$ NAStudent Org. and Publications -$ -$ -$ -$ -$ -$ NAStudent Health Service -$ -$ -$ -$ -$ -$ NAOther Auxiliary -$ -$ -$ -$ -$ -$ NA Total -$ -$ -$ 131,141$ -$ -$ NA
Excess of Revenues -$ -$ -$ (204,739)$ (62,751)$ (59,975)$ NA
Special TransfersAuxiliary Transfer Policy -$ -$ -$ -$ -$ -$ NAOther Auxilary Transfer -$ -$ -$ -$ -$ -$ NA Total -$ -$ -$ -$ -$ -$ NA
Total Excess of Revenues -$ -$ -$ (204,739)$ (62,751)$ (59,975)$

124 Back to Table of Contents
TABLE 5.2R – UNIVERSITY OF ARKANSAS COMMUNITY COLLEGE – BATESVILLE UNRESTRICTED EDUCATIONAL & GENERAL
5 yr2010-11 2011-12 2012-13 2013-14 2014-15 2015-16 % Incr
Unrestricted E&G RevenuesTuition & Fees 3,521,138$ 3,462,025$ 3,313,275$ 3,168,356$ 3,320,029$ 3,320,452$ -5.7%Gov. Appropriations Federal -$ -$ -$ -$ -$ -$ NA State 4,852,307$ 4,915,422$ 4,920,469$ 4,997,821$ 4,989,281$ 4,997,821$ 3.0% Local 1,251,458$ 1,271,172$ 1,237,699$ 1,240,673$ 1,278,331$ 1,385,837$ 10.7%Grants & Contracts Federal -$ -$ -$ -$ -$ -$ NA State -$ -$ -$ -$ -$ -$ NA Local -$ -$ -$ -$ -$ -$ NAPrivate Gifts, Grants and Contracts -$ -$ -$ -$ -$ -$ NAEndow ment Income -$ -$ -$ -$ -$ -$ NASales and Services Educational Actvities -$ -$ -$ -$ 11,649$ -$ NA
Hospitals -$ -$ -$ -$ -$ -$ NAOther Investments 23,747$ 18,695$ 21,093$ 26,504$ 25,650$ 27,594$ 16.2%Other 214,886$ 126,067$ 76,201$ 240,381$ 60,761$ 104,810$ -51.2% Total 9,863,536$ 9,793,381$ 9,568,737$ 9,673,735$ 9,685,701$ 9,836,514$ -0.3%
Unrestricted E&G ExpendituresTeaching Salaries 2,635,333$ 2,415,429$ 2,384,398$ 2,397,496$ 2,316,402$ 2,225,730$ -15.5%Dept. Oper. Expense 1,216,704$ 1,080,396$ 1,133,978$ 1,181,876$ 1,308,412$ 1,145,771$ -5.8%Off-Campus Credit -$ -$ -$ -$ -$ -$ NANon-Credit Instruction 183,135$ 369,734$ 326,239$ 179,396$ 149,757$ 139,050$ -24.1%Research -$ -$ -$ -$ -$ -$ NAPublic Service -$ -$ -$ -$ -$ -$ NALibraries 132,103$ 136,176$ 139,209$ 121,641$ 112,120$ 164,588$ 24.6%Museums & Galleries -$ -$ -$ -$ -$ -$ NAOrganized Activities -$ -$ -$ -$ -$ -$ NAOther Academic Support 1,024,372$ 978,515$ 979,487$ 1,084,706$ 1,062,502$ 1,166,686$ 13.9%Student Services 855,216$ 874,746$ 903,538$ 916,532$ 910,859$ 928,130$ 8.5%Institutional Support 1,580,044$ 1,678,398$ 1,448,318$ 1,550,399$ 1,556,873$ 1,562,649$ -1.1%Utilities 258,631$ 272,285$ 278,028$ 276,091$ 266,076$ 274,131$ 6.0%Other Plant Maintenance 976,008$ 710,067$ 736,618$ 822,075$ 663,563$ 738,144$ -24.4%Scholarships & Fellow ships 300,568$ 294,482$ 289,126$ 273,783$ 300,567$ 395,152$ 31.5%Other -$ -$ 9,885$ -$ -$ -$ NATransfers - Auxiliary -$ -$ -$ -$ -$ -$ NATransfers - Mandatory 572,522$ 592,110$ 695,683$ 695,733$ 695,683$ 563,361$ -1.6%Transfers -Non Mandatory 237,316$ 500$ -$ -$ 500,000$ -$ -100.0% Total 9,971,952$ 9,402,838$ 9,324,507$ 9,499,728$ 9,842,814$ 9,303,392$ -6.7%
Source: Revenues from ADHE Series 17-1; Expenditures from ADHE Series 17-7a.

125 Back to Table of Contents
TABLE 5.2R – UNIVERSITY OF ARKANSAS COMMUNITY COLLEGE – BATESVILLE (CONT.) AUXILIARY ENTERPRISES
5 yr2010-11 2011-12 2012-13 2013-14 2014-15 2015-16 % Incr
Unrestricted E&G RevenuesTuition & Fees 3,521,138$ 3,462,025$ 3,313,275$ 3,168,356$ 3,320,029$ 3,320,452$ -5.7%Gov. Appropriations Federal -$ -$ -$ -$ -$ -$ NA State 4,852,307$ 4,915,422$ 4,920,469$ 4,997,821$ 4,989,281$ 4,997,821$ 3.0% Local 1,251,458$ 1,271,172$ 1,237,699$ 1,240,673$ 1,278,331$ 1,385,837$ 10.7%Grants & Contracts Federal -$ -$ -$ -$ -$ -$ NA State -$ -$ -$ -$ -$ -$ NA Local -$ -$ -$ -$ -$ -$ NAPrivate Gifts, Grants and Contracts -$ -$ -$ -$ -$ -$ NAEndow ment Income -$ -$ -$ -$ -$ -$ NASales and Services Educational Actvities -$ -$ -$ -$ 11,649$ -$ NA
Hospitals -$ -$ -$ -$ -$ -$ NAOther Investments 23,747$ 18,695$ 21,093$ 26,504$ 25,650$ 27,594$ 16.2%Other 214,886$ 126,067$ 76,201$ 240,381$ 60,761$ 104,810$ -51.2% Total 9,863,536$ 9,793,381$ 9,568,737$ 9,673,735$ 9,685,701$ 9,836,514$ -0.3%
Unrestricted E&G ExpendituresTeaching Salaries 2,635,333$ 2,415,429$ 2,384,398$ 2,397,496$ 2,316,402$ 2,225,730$ -15.5%Dept. Oper. Expense 1,216,704$ 1,080,396$ 1,133,978$ 1,181,876$ 1,308,412$ 1,145,771$ -5.8%Off-Campus Credit -$ -$ -$ -$ -$ -$ NANon-Credit Instruction 183,135$ 369,734$ 326,239$ 179,396$ 149,757$ 139,050$ -24.1%Research -$ -$ -$ -$ -$ -$ NAPublic Service -$ -$ -$ -$ -$ -$ NALibraries 132,103$ 136,176$ 139,209$ 121,641$ 112,120$ 164,588$ 24.6%Museums & Galleries -$ -$ -$ -$ -$ -$ NAOrganized Activities -$ -$ -$ -$ -$ -$ NAOther Academic Support 1,024,372$ 978,515$ 979,487$ 1,084,706$ 1,062,502$ 1,166,686$ 13.9%Student Services 855,216$ 874,746$ 903,538$ 916,532$ 910,859$ 928,130$ 8.5%Institutional Support 1,580,044$ 1,678,398$ 1,448,318$ 1,550,399$ 1,556,873$ 1,562,649$ -1.1%Utilities 258,631$ 272,285$ 278,028$ 276,091$ 266,076$ 274,131$ 6.0%Other Plant Maintenance 976,008$ 710,067$ 736,618$ 822,075$ 663,563$ 738,144$ -24.4%Scholarships & Fellow ships 300,568$ 294,482$ 289,126$ 273,783$ 300,567$ 395,152$ 31.5%Other -$ -$ 9,885$ -$ -$ -$ NATransfers - Auxiliary -$ -$ -$ -$ -$ -$ NATransfers - Mandatory 572,522$ 592,110$ 695,683$ 695,733$ 695,683$ 563,361$ -1.6%Transfers -Non Mandatory 237,316$ 500$ -$ -$ 500,000$ -$ -100.0% Total 9,971,952$ 9,402,838$ 9,324,507$ 9,499,728$ 9,842,814$ 9,303,392$ -6.7%
Source: Revenues from ADHE Series 17-1; Expenditures from ADHE Series 17-7a.

126 Back to Table of Contents
TABLE 5.2S – UNIVERSITY OF ARKANSAS COMMUNITY COLLEGE – HOPE UNRESTRICTED EDUCATIONAL & GENERAL
5 yr2010-11 2011-12 2012-13 2013-14 2014-15 2015-16 % Incr
Unrestricted E&G RevenuesTuition & Fees 2,448,183$ 2,294,716$ 2,571,362$ 2,471,235$ 2,456,601$ 2,658,467$ 8.6%Gov. Appropriations Federal -$ -$ -$ -$ NA State 6,371,618$ 6,340,228$ 6,456,823$ 6,450,944$ 6,431,644$ 6,450,944$ 1.2% Local 187,054$ 325,000$ 550,000$ 1,250,000$ 1,100,000$ 950,000$ 407.9%Grants & Contracts Federal 79,814$ 15,750$ 33,495$ 33,797$ 61,857$ 56,882$ -28.7% State -$ -$ -$ -$ -$ -$ NA Local -$ -$ -$ -$ -$ -$ NAPrivate Gifts, Grants and Contracts -$ -$ 33,000$ 72,572$ -$ -$ NAEndow ment Income -$ -$ -$ -$ -$ -$ NASales and Services Educational Actvities 10,496$ 10,314$ -$ -$ 30,023$ 55,202$ 425.9%
Hospitals -$ -$ -$ -$ -$ -$ NAOther Investments 580$ 471$ 528$ 571$ 363$ 375$ -35.3%Other 79,039$ 100,561$ 114,364$ -$ 201,561$ 160,672$ 103.3% Total 9,176,784$ 9,087,040$ 9,759,572$ 10,279,119$ 10,282,049$ 10,332,542$ 12.6%
Unrestricted E&G ExpendituresTeaching Salaries 2,198,554$ 2,155,235$ 2,338,090$ 2,458,365$ 2,399,598$ 2,283,632$ 3.9%Dept. Oper. Expense 1,360,948$ 1,419,086$ 1,516,945$ 1,618,913$ 1,372,142$ 1,287,045$ -5.4%Off-Campus Credit -$ -$ -$ -$ -$ -$ NANon-Credit Instruction -$ -$ -$ -$ -$ -$ NAResearch -$ -$ -$ -$ -$ -$ NAPublic Service 213,452$ 242,754$ 306,810$ 602,293$ 591,700$ 523,881$ 145.4%Libraries -$ -$ -$ -$ -$ -$ NAMuseums & Galleries -$ -$ -$ -$ -$ -$ NAOrganized Activities -$ -$ -$ -$ -$ -$ NAOther Academic Support 496,582$ 525,210$ 529,562$ 568,518$ 557,822$ 660,205$ 32.9%Student Services 779,133$ 822,480$ 843,061$ 888,338$ 855,760$ 906,489$ 16.3%Institutional Support 2,074,826$ 1,956,529$ 1,890,731$ 2,069,280$ 2,303,896$ 2,321,197$ 11.9%Utilities 280,935$ 287,407$ 321,491$ 367,158$ 424,348$ 439,917$ 56.6%Other Plant Maintenance 850,320$ 811,288$ 925,438$ 981,264$ 893,312$ 770,448$ -9.4%Scholarships & Fellow ships 158,788$ 174,157$ 200,293$ 222,366$ 242,184$ 326,698$ 105.7%Other 736,861$ 706,193$ 780,938$ 781,078$ 790,229$ 805,099$ 9.3%Transfers - Auxiliary -$ -$ -$ -$ -$ -$ NATransfers - Mandatory -$ -$ 25,000$ (25,000)$ (25,000)$ (25,000)$ NATransfers -Non Mandatory -$ -$ -$ -$ -$ -$ NA Total 9,150,399$ 9,100,339$ 9,678,359$ 10,532,573$ 10,405,991$ 10,299,611$ 12.6%
Source: Revenues from ADHE Series 17-1; Expenditures from ADHE Series 17-7a.

127 Back to Table of Contents
TABLE 5.2S – UNIVERSITY OF ARKANSAS COMMUNITY COLLEGE – HOPE (CONT.) AUXILIARY ENTERPRISES
5 yr2010-11 2011-12 2012-13 2013-14 2014-15 2015-16 % Incr
RevenuesIntercollegiate Athletics -$ -$ -$ -$ -$ -$ NAResident Halls -$ -$ -$ -$ -$ -$ NAMarried Student Housing -$ -$ -$ -$ -$ -$ NAFaculty Housing -$ -$ -$ -$ -$ -$ NAFood Service -$ -$ -$ -$ -$ -$ NACollege Union -$ -$ -$ -$ -$ -$ NABookstore 57,507$ 44,860$ 49,424$ 45,372$ 46,490$ 422,960$ 635.5%Student Org. and Publications -$ -$ -$ -$ -$ -$ NAStudent Health Service -$ -$ -$ -$ -$ -$ NAOther Auxiliary -$ -$ -$ -$ -$ -$ NA Total 57,507$ 44,860$ 49,424$ 45,372$ 46,490$ 422,960$ 635.5%
ExpendituresIntercollegiate Athletics -$ -$ -$ -$ -$ -$ NAResident Halls -$ -$ -$ -$ -$ -$ NAMarried Student Housing -$ -$ -$ -$ -$ -$ NAFaculty Housing -$ -$ -$ -$ -$ -$ NAFood Service -$ -$ -$ -$ -$ -$ NACollege Union -$ -$ -$ -$ -$ -$ NABookstore 66$ 211$ 19$ 12$ 5,632$ 2,107$ 3092.4%Student Org. and Publications -$ -$ -$ -$ -$ -$ NAStudent Health Service -$ -$ -$ -$ -$ -$ NAOther Auxiliary -$ -$ -$ -$ -$ -$ NA Total 66$ 211$ 19$ 12$ 5,632$ 2,107$ 3092.4%
Transfers/Debt ServiceIntercollegiate Athletics -$ -$ -$ -$ -$ -$ NAResident Halls -$ -$ -$ -$ -$ -$ NAMarried Student Housing -$ -$ -$ -$ -$ -$ NAFaculty Housing -$ -$ -$ -$ -$ -$ NAFood Service -$ -$ -$ -$ -$ -$ NACollege Union -$ -$ -$ -$ -$ -$ NABookstore -$ -$ -$ -$ -$ -$ NAStudent Org. and Publications -$ -$ -$ -$ -$ -$ NAStudent Health Service -$ -$ -$ -$ -$ -$ NAOther Auxiliary -$ -$ -$ -$ -$ -$ NA Total -$ -$ -$ -$ -$ -$ NA
Excess of Revenues 57,441$ 44,649$ 49,405$ 45,360$ 40,858$ 420,853$ 632.7%
Special TransfersAuxiliary Transfer Policy -$ -$ -$ -$ -$ -$ NAOther Auxilary Transfer -$ -$ -$ -$ -$ -$ NA Total -$ -$ -$ -$ -$ -$ NA
Total Excess of Revenues 57,441$ 44,649$ 49,405$ 45,360$ 40,858$ 420,853$

128 Back to Table of Contents
TABLE 5.2T – UNIVERSITY OF ARKANSAS COMMUNITY COLLEGE – MORRILTON UNRESTRICTED EDUCATIONAL & GENERAL
5 yr2010-11 2011-12 2012-13 2013-14 2014-15 2015-16 % Incr
Unrestricted E&G RevenuesTuition & Fees 6,249,309$ 6,463,759$ 5,871,745$ 6,204,034$ 5,969,541$ 6,247,346$ 0.0%Gov. Appropriations Federal -$ -$ -$ -$ -$ -$ NA State 5,974,769$ 6,068,166$ 6,082,071$ 6,313,341$ 6,300,620$ 6,313,341$ 5.7% Local -$ 873,634$ 733,004$ 810,926$ 731,238$ 758,957$ NAGrants & Contracts Federal 116,134$ 16,492$ 11,608$ 14,928$ 16,178$ 11,014$ -90.5% State -$ 225$ -$ -$ -$ -$ NA Local -$ -$ -$ -$ -$ -$ NAPrivate Gifts, Grants and Contracts -$ 20,680$ 10,538$ 8,624$ 8,834$ 8,966$ NAEndow ment Income -$ -$ -$ -$ -$ NASales and Services Educational Actvities 51,586$ 64,441$ 75,247$ 120,971$ 108,642$ 84,829$ 64.4%
Hospitals -$ -$ -$ -$ -$ -$ NAOther Investments 75,148$ 137,012$ 15,506$ 159,933$ 45,204$ 189,625$ 152.3%Other 739,252$ 38,769$ 44,937$ 53,117$ 132,104$ 79,898$ -89.2% Total 13,206,198$ 13,683,178$ 12,844,656$ 13,685,874$ 13,312,361$ 13,693,976$ 3.7%
Unrestricted E&G ExpendituresTeaching Salaries 3,583,820$ 3,621,379$ 3,487,538$ 3,430,691$ 3,293,775$ 3,034,862$ -15.3%Dept. Oper. Expense 2,260,176$ 2,177,316$ 2,089,605$ 2,227,349$ 2,482,461$ 2,118,265$ -6.3%Off-Campus Credit -$ -$ -$ -$ -$ -$ NANon-Credit Instruction 4,216$ 241$ 3,996$ -$ -$ -$ -100.0%Research -$ -$ -$ -$ -$ -$ NAPublic Service 10,496$ 7,611$ 6,647$ 18,270$ 10,753$ 8,320$ -20.7%Libraries 209,543$ 210,835$ 149,453$ 247,300$ 300,606$ 293,925$ 40.3%Museums & Galleries -$ -$ -$ -$ -$ -$ NAOrganized Activities 96,935$ 129,482$ 138,938$ 131,395$ 140,889$ 133,611$ 37.8%Other Academic Support 1,008,172$ 1,078,173$ 1,221,943$ 1,123,546$ 1,016,127$ 1,335,863$ 32.5%Student Services 1,389,818$ 1,402,698$ 1,388,653$ 1,274,577$ 1,296,533$ 1,299,248$ -6.5%Institutional Support 1,548,304$ 1,720,994$ 1,793,331$ 1,996,895$ 2,097,304$ 2,164,077$ 39.8%Utilities 457,115$ 454,270$ 447,388$ 445,696$ 472,025$ 442,969$ -3.1%Other Plant Maintenance 1,145,773$ 1,168,198$ 1,046,058$ 1,061,929$ 1,058,404$ 860,254$ -24.9%Scholarships & Fellow ships 583,361$ 423,500$ 361,676$ 350,412$ 381,479$ 402,926$ -30.9%Other 214,601$ 189,955$ 672,547$ 645,023$ 316,166$ -$ -100.0%Transfers - Auxiliary -$ -$ -$ -$ -$ -$ NATransfers - Mandatory 407,751$ 340,206$ 460,000$ 563,000$ 469,260$ 488,237$ 19.7%Transfers -Non Mandatory 66,533$ 77,367$ 56,118$ 137,012$ (500,000)$ 1,981,554$ 2878.3% Total 12,986,615$ 13,002,225$ 13,323,891$ 13,653,094$ 12,835,782$ 14,564,110$ 12.1%
Source: Revenues from ADHE Series 17-1; Expenditures from ADHE Series 17-7a.

129 Back to Table of Contents
TABLE 5.2T – UNIVERSITY OF ARKANSAS COMMUNITY COLLEGE – MORRILTON (CONT.) AUXILIARY ENTERPRISES
5 yr2010-11 2011-12 2012-13 2013-14 2014-15 2015-16 % Incr
RevenuesIntercollegiate Athletics -$ -$ -$ -$ -$ -$ NAResident Halls -$ -$ -$ -$ -$ -$ NAMarried Student Housing -$ -$ -$ -$ -$ -$ NAFaculty Housing -$ -$ -$ -$ -$ -$ NAFood Service 145,020$ 187,831$ 201,412$ 192,406$ 180,588$ 77,815$ -46.3%College Union -$ -$ -$ -$ -$ -$ NABookstore 1,652,147$ 1,512,149$ 1,393,162$ 1,347,593$ 1,174,979$ 1,073,202$ -35.0%Student Org. and Publications -$ -$ -$ -$ -$ -$ NAStudent Health Service -$ -$ -$ -$ -$ -$ NAOther Auxiliary 63,404$ 38,188$ 33,085$ 36,104$ 27,981$ 7,517$ -88.1% Total 1,860,571$ 1,738,168$ 1,627,660$ 1,576,102$ 1,383,548$ 1,158,534$ -37.7%
ExpendituresIntercollegiate Athletics -$ -$ -$ -$ -$ -$ NAResident Halls -$ -$ -$ -$ -$ -$ NAMarried Student Housing -$ -$ -$ -$ -$ -$ NAFaculty Housing -$ -$ -$ -$ -$ -$ NAFood Service 231,777$ 285,245$ 294,895$ 279,648$ 258,180$ 97,110$ -58.1%College Union -$ -$ -$ -$ -$ -$ NABookstore 1,321,584$ 1,207,594$ 1,230,088$ 1,300,297$ 1,121,618$ 996,711$ -24.6%Student Org. and Publications -$ -$ -$ -$ -$ -$ NAStudent Health Service -$ -$ -$ -$ -$ -$ NAOther Auxiliary 47,630$ 23,548$ 21,413$ 46,839$ 42,889$ 995$ -97.9% Total 1,600,991$ 1,516,387$ 1,546,395$ 1,626,784$ 1,422,687$ 1,094,816$ -31.6%
Transfers/Debt ServiceIntercollegiate Athletics -$ -$ -$ -$ -$ -$ NAResident Halls -$ -$ -$ -$ -$ -$ NAMarried Student Housing -$ -$ -$ -$ -$ -$ NAFaculty Housing -$ -$ -$ -$ -$ -$ NAFood Service -$ -$ -$ -$ -$ -$ NACollege Union -$ -$ -$ -$ -$ -$ NABookstore -$ -$ -$ -$ -$ -$ NAStudent Org. and Publications -$ -$ -$ -$ -$ -$ NAStudent Health Service -$ -$ -$ -$ -$ -$ NAOther Auxiliary -$ -$ -$ -$ -$ -$ NA Total -$ -$ -$ -$ -$ -$ NA
Excess of Revenues 259,580$ 221,781$ 81,264$ (50,682)$ (39,139)$ 63,718$ -75.5%
Special TransfersAuxiliary Transfer Policy -$ -$ -$ -$ -$ NAOther Auxilary Transfer -$ -$ -$ -$ (500,000)$ (343,975)$ NA Total -$ -$ -$ -$ (500,000)$ (343,975)$ NA
Total Excess of Revenues 259,580$ 221,781$ 81,264$ (50,682)$ (539,139)$ (280,257)$

130 Back to Table of Contents
TABLE 5.2U – UNIVERSITY OF ARKANSAS COMMUNITY COLLEGE – RICH MOUNTAIN UNRESTRICTED EDUCATIONAL & GENERAL
5 yr2010-11 2011-12 2012-13 2013-14 2014-15 2015-16 % Incr
Unrestricted E&G RevenuesTuition & Fees 1,796,133$ 1,861,211$ 1,904,418$ 2,131,112$ 2,118,176$ 2,132,131$ 18.7%Gov. Appropriations Federal -$ -$ -$ -$ -$ -$ NA State 3,384,422$ 3,419,756$ 3,397,250$ 3,404,968$ 3,409,713$ 3,412,013$ 0.8% Local -$ -$ -$ -$ -$ -$ NAGrants & Contracts Federal -$ -$ -$ -$ -$ -$ NA State -$ -$ -$ -$ -$ -$ NA Local -$ -$ -$ -$ -$ -$ NAPrivate Gifts, Grants and Contracts 6,638$ 5,150$ -$ -$ 1,865$ 1,937$ -70.8%Endow ment Income -$ -$ -$ -$ -$ -$ NASales and Services Educational Actvities 12,931$ 13,952$ 4,516$ 76,911$ 47,899$ 41,493$ 220.9%
Hospitals -$ -$ -$ -$ -$ -$ NAOther Investments 3,875$ 2,320$ 3,384$ 5,792$ 5,273$ 4,363$ 12.6%Other 152,731$ 36,585$ 73,886$ 70,293$ 53,967$ 52,722$ -65.5% Total 5,356,730$ 5,338,974$ 5,383,454$ 5,689,076$ 5,636,893$ 5,644,659$ 5.4%
Teaching Salaries 1,376,897$ 1,358,449$ 1,337,621$ 1,360,239$ 1,414,009$ 1,306,596$ -5.1%Dept. Oper. Expense 551,499$ 572,499$ 622,392$ 809,296$ 719,344$ 706,223$ 28.1%Off-Campus Credit -$ -$ -$ -$ -$ -$ NANon-Credit Instruction 67,446$ 97,459$ 125,645$ 45,120$ 31,969$ 36,568$ -45.8%Research -$ -$ -$ -$ -$ -$ NAPublic Service 116,731$ 38,318$ 79,112$ 83,068$ 94,260$ 72,397$ -38.0%Libraries 117,249$ 168,392$ 154,270$ 131,706$ 138,443$ 134,795$ 15.0%Museums & Galleries -$ -$ -$ -$ -$ -$ NAOrganized Activities -$ -$ -$ -$ -$ -$ NAOther Academic Support 381,706$ 357,831$ 329,387$ 285,678$ 221,451$ 272,581$ -28.6%Student Services 539,070$ 487,804$ 490,798$ 549,398$ 629,903$ 615,218$ 14.1%Institutional Support 1,259,528$ 1,351,962$ 1,549,777$ 1,499,539$ 1,559,741$ 1,487,307$ 18.1%Utilities 133,734$ 123,202$ 128,724$ 157,291$ 166,536$ 173,424$ 29.7%Other Plant Maintenance 442,527$ 384,009$ 381,265$ 495,279$ 527,890$ 566,275$ 28.0%Scholarships & Fellow ships 203,606$ 277,846$ 261,801$ 292,886$ 370,109$ 383,006$ 88.1%Other -$ -$ -$ -$ -$ -$ NATransfers - Auxiliary -$ -$ -$ -$ -$ -$ NATransfers - Mandatory -$ -$ -$ -$ 34,000$ 34,000$ NATransfers -Non Mandatory 33,018$ 80,424$ (153,398)$ (109,593)$ (170,542)$ (189,417)$ -673.7% Total 5,223,011$ 5,298,195$ 5,307,394$ 5,599,907$ 5,737,113$ 5,598,973$ 7.2%
Unrestricted E&G Expenditures
Source: Revenues from ADHE Series 17-1; Expenditures from ADHE Series 17-7a.

131 Back to Table of Contents
TABLE 5.2U – UNIVERSITY OF ARKANSAS COMMUNITY COLLEGE – RICH MOUNTAIN (CONT.) AUXILIARY ENTERPRISES
5 yr2010-11 2011-12 2012-13 2013-14 2014-15 2015-16 % Incr
RevenuesIntercollegiate Athletics -$ -$ -$ -$ -$ -$ NAResident Halls -$ -$ -$ -$ -$ -$ NAMarried Student Housing -$ -$ -$ -$ -$ -$ NAFaculty Housing -$ -$ -$ -$ -$ -$ NAFood Service -$ -$ -$ 58,928$ -$ 48,939$ NACollege Union -$ -$ -$ -$ -$ -$ NABookstore 384,818$ 376,398$ 315,659$ 302,258$ 452,034$ 361,568$ -6.0%Student Org. and Publications -$ -$ -$ -$ -$ -$ NAStudent Health Service -$ -$ -$ -$ -$ -$ NAOther Auxiliary -$ -$ -$ -$ -$ -$ NA Total 384,818$ 376,398$ 315,659$ 361,186$ 452,034$ 410,507$ 6.7%
ExpendituresIntercollegiate Athletics -$ -$ -$ -$ -$ -$ NAResident Halls -$ -$ -$ -$ -$ -$ NAMarried Student Housing -$ -$ -$ -$ -$ -$ NAFaculty Housing -$ -$ -$ -$ -$ -$ NAFood Service -$ -$ -$ 91,395$ -$ 87,136$ NACollege Union -$ -$ -$ -$ -$ -$ NABookstore 436,634$ 359,319$ 257,141$ 336,754$ 513,875$ 377,781$ -13.5%Student Org. and Publications -$ -$ -$ -$ -$ -$ NAStudent Health Service -$ -$ -$ -$ -$ -$ NAOther Auxiliary -$ -$ -$ -$ -$ -$ NA Total 436,634$ 359,319$ 257,141$ 428,149$ 513,875$ 464,917$ 6.5%
Transfers/Debt ServiceIntercollegiate Athletics -$ -$ -$ -$ -$ -$ NAResident Halls -$ -$ -$ -$ -$ -$ NAMarried Student Housing -$ -$ -$ -$ -$ -$ NAFaculty Housing -$ -$ -$ -$ -$ -$ NAFood Service -$ -$ -$ -$ -$ -$ NACollege Union -$ -$ -$ -$ -$ -$ NABookstore -$ -$ -$ -$ -$ -$ NAStudent Org. and Publications -$ -$ -$ -$ -$ -$ NAStudent Health Service -$ -$ -$ -$ -$ -$ NAOther Auxiliary -$ -$ -$ -$ -$ -$ NA Total -$ -$ -$ -$ -$ -$ NA
Excess of Revenues (51,816)$ 17,079$ 58,518$ (66,963)$ (61,841)$ (54,410)$ NA
Special TransfersAuxiliary Transfer Policy -$ -$ -$ -$ -$ -$ NAOther Auxilary Transfer -$ -$ -$ -$ -$ -$ NA Total -$ -$ -$ -$ -$ -$ NA
Total Excess of Revenues (51,816)$ 17,079$ 58,518$ (66,963)$ (61,841)$ (54,410)$

132 Back to Table of Contents
TABLE 5.2V – UNIVERSITY OF ARKANSAS – PULASKI TECHNICAL COLLEGE UNRESTRICTED EDUCATIONAL & GENERAL
5 yr2010-11 2011-12 2012-13 2013-14 2014-15 2015-16 % Incr
Unrestricted E&G RevenuesTuition & Fees 27,554,605$ 28,854,453$ 29,787,525$ 29,982,515$ 28,310,660$ 25,985,310$ -5.7%Gov. Appropriations Federal -$ -$ -$ -$ -$ -$ NA State 16,490,355$ 16,792,755$ 16,737,684$ 17,411,209$ 17,388,807$ 17,411,209$ 5.6% Local -$ -$ -$ -$ -$ -$ NAGrants & Contracts Federal 197,522$ 247,161$ 188,149$ 124,524$ 149,720$ 136,394$ -30.9% State -$ -$ -$ 1,748$ 140,184$ 101,734$ NA Local -$ -$ -$ -$ -$ NAPrivate Gifts, Grants and Contracts 83,196$ 75,946$ -$ -$ 6,831$ 16,625$ -80.0%Endow ment Income -$ -$ -$ -$ -$ -$ NASales and Services Educational Actvities 1,032,053$ 1,239,310$ 1,198,253$ 1,084,225$ 948,773$ 277,622$ -73.1%
Hospitals -$ -$ -$ -$ -$ -$ NAOther Investments -$ 56,281$ 68,482$ 64,783$ 63,794$ 81,189$ NAOther 120,379$ 82,250$ 53,069$ 164,523$ 101,695$ 136,014$ 13.0% Total 45,478,110$ 47,348,156$ 48,033,162$ 48,833,527$ 47,110,464$ 44,146,097$ -2.9%
Teaching Salaries 13,550,307$ 14,163,864$ 14,023,573$ 13,313,799$ 12,249,683$ 10,693,757$ -21.1%Dept. Oper. Expense 4,464,398$ 5,167,296$ 5,098,559$ 4,951,380$ 4,561,963$ 4,314,878$ -3.3%Off-Campus Credit -$ -$ -$ -$ -$ -$ NANon-Credit Instruction 484,784$ 498,587$ 222,855$ 340,489$ 341,319$ 435,478$ -10.2%Research -$ -$ -$ -$ -$ -$ NAPublic Service -$ -$ -$ -$ -$ -$ NALibraries 656,884$ 674,931$ 719,985$ 808,418$ 784,475$ 736,897$ 12.2%Museums & Galleries -$ -$ -$ -$ -$ -$ NAOrganized Activities 1,764,388$ 1,786,134$ 1,534,553$ 1,592,289$ 1,484,171$ 564,648$ -68.0%Other Academic Support 3,344,168$ 3,403,325$ 3,425,511$ 3,301,921$ 3,001,461$ 2,789,963$ -16.6%Student Services 3,621,420$ 3,797,196$ 3,808,070$ 3,517,525$ 3,403,466$ 3,041,493$ -16.0%Institutional Support 5,875,688$ 6,787,164$ 7,076,628$ 7,634,969$ 7,530,095$ 6,756,161$ 15.0%Utilities 1,322,147$ 1,329,211$ 1,294,950$ 1,498,722$ 1,480,498$ 1,520,315$ 15.0%Other Plant Maintenance 1,692,308$ 1,646,120$ 1,739,439$ 1,983,492$ 1,959,827$ 1,896,390$ 12.1%Scholarships & Fellow ships 1,452,288$ 1,442,561$ 1,458,550$ 1,941,223$ 1,760,011$ 1,645,095$ 13.3%Other -$ 210,375$ 80,971$ 177,792$ 159,536$ 497,334$ NATransfers - Auxiliary -$ -$ -$ -$ (3,230,000)$ NATransfers - Mandatory 3,476,002$ 5,993,511$ 5,919,657$ 6,327,073$ 6,327,780$ 6,212,857$ 78.7%Transfers -Non Mandatory 168,284$ -$ 1,179,148$ 620,923$ 254,111$ 392,211$ 133.1% Total 41,873,066$ 46,900,275$ 47,582,449$ 48,010,015$ 42,068,396$ 41,497,477$ -0.9%
Unrestricted E&G Expenditures
Source: Revenues from ADHE Series 17-1; Expenditures from ADHE Series 17-7a.

133 Back to Table of Contents
TABLE 5.2V – UNIVERSITY OF ARKANSAS – PULASKI TECHNICAL COLLEGE (CONT.) AUXILIARY ENTERPRISES
5 yr2010-11 2011-12 2012-13 2013-14 2014-15 2015-16 % Incr
RevenuesIntercollegiate Athletics -$ -$ -$ -$ -$ -$ NAResident Halls -$ -$ -$ -$ -$ -$ NAMarried Student Housing -$ -$ -$ -$ -$ -$ NAFaculty Housing -$ -$ -$ -$ -$ -$ NAFood Service -$ -$ -$ -$ -$ -$ NACollege Union -$ -$ -$ -$ -$ -$ NABookstore 449,210$ 680,972$ 676,654$ 531,236$ 460,540$ 358,006$ -20.3%Student Org. and Publications -$ -$ -$ -$ -$ -$ NAStudent Health Service -$ -$ -$ -$ -$ -$ NAOther Auxiliary 51,835$ 55,341$ 37,775$ 47,697$ 41,951$ 36,630$ -29.3% Total 501,045$ 736,313$ 714,429$ 578,933$ 502,491$ 394,636$ -21.2%
ExpendituresIntercollegiate Athletics -$ -$ -$ -$ -$ -$ NAResident Halls -$ -$ -$ -$ -$ -$ NAMarried Student Housing -$ -$ -$ -$ -$ -$ NAFaculty Housing -$ -$ -$ -$ -$ -$ NAFood Service -$ -$ -$ -$ -$ 198,184$ NACollege Union -$ -$ -$ -$ -$ -$ NABookstore -$ -$ -$ -$ -$ -$ NAStudent Org. and Publications -$ -$ -$ -$ -$ -$ NAStudent Health Service -$ -$ -$ -$ -$ -$ NAOther Auxiliary 31,296$ -$ -$ -$ -$ -$ -100.0% Total 31,296$ -$ -$ -$ -$ 198,184$ 533.3%
Transfers/Debt ServiceIntercollegiate Athletics -$ -$ -$ -$ -$ -$ NAResident Halls -$ -$ -$ -$ -$ -$ NAMarried Student Housing -$ -$ -$ -$ -$ -$ NAFaculty Housing -$ -$ -$ -$ -$ -$ NAFood Service -$ -$ -$ -$ -$ -$ NACollege Union -$ -$ -$ -$ -$ -$ NABookstore -$ -$ -$ -$ -$ -$ NAStudent Org. and Publications -$ -$ -$ -$ -$ -$ NAStudent Health Service -$ -$ -$ -$ -$ -$ NAOther Auxiliary -$ -$ -$ -$ -$ -$ NA Total -$ -$ -$ -$ -$ -$ NA
Excess of Revenues 469,749$ 736,313$ 714,429$ 578,933$ 502,491$ 196,452$ -58.2%
Special TransfersAuxiliary Transfer Policy -$ -$ -$ -$ -$ -$ NAOther Auxilary Transfer (130,148)$ -$ -$ (402,445)$ (3,230,000)$ -$ NA Total (130,148)$ -$ -$ (402,445)$ (3,230,000)$ -$ NA
Total Excess of Revenues 339,601$ 736,313$ 714,429$ 176,488$ (2,727,509)$ 196,452$

134 Back to Table of Contents
TABLE 5.2W – TWO-YEAR SUMMARY UNRESTRICTED EDUCATIONAL & GENERAL
5 yr2010-11 2011-12 2012-13 2013-14 2014-15 2015-16 % Incr
Unrestricted E&G RevenuesTuition & Fees 137,040,740$ 138,700,539$ 140,952,131$ 151,156,640$ 139,952,174$ 136,025,956$ 2.1%Gov. Appropriations Federal -$ -$ 35,442$ 4,558$ -$ -$ NA State 167,902,246$ 169,660,345$ 170,964,722$ 173,063,496$ 173,509,734$ 173,815,577$ 3.3% Local 12,658,357$ 15,739,007$ 15,753,974$ 17,152,362$ 16,878,220$ 17,291,747$ 33.3%Grants & Contracts Federal 1,107,509$ 1,017,870$ 1,042,339$ 722,380$ 812,202$ 824,268$ -26.7% State 1,060,598$ 509,596$ 920,386$ 982,482$ 1,358,150$ 1,444,290$ 28.1% Local 1,975,950$ 3,500$ 467,131$ 493,631$ 407,180$ 491,591$ -79.4%Private Gifts, Grants and Contracts 392,914$ 266,205$ 807,632$ 807,295$ 313,669$ 473,247$ -20.2%Endow ment Income -$ -$ -$ -$ -$ -$ NASales and Services Educational Actvities 1,378,003$ 1,630,778$ 1,637,660$ 1,721,378$ 1,615,407$ 942,822$ 17.2%
Hospitals -$ -$ -$ -$ -$ -$ NAOther Investments 951,210$ 798,660$ 479,439$ 511,626$ 374,068$ 542,316$ -60.7%Other 6,647,602$ 7,006,636$ 4,123,034$ 4,881,458$ 5,151,839$ 5,270,381$ -22.5% Total 331,115,129$ 335,333,134$ 337,183,890$ 351,497,306$ 340,372,643$ 337,122,195$ 2.8%
Teaching Salaries 85,087,481$ 86,118,495$ 83,960,861$ 84,496,382$ 83,041,654$ 80,840,292$ -2.4%Dept. Oper. Expense 45,040,860$ 44,970,348$ 50,242,077$ 55,380,185$ 47,275,989$ 46,638,307$ 5.0%Off-Campus Credit 1,567,088$ 2,174,676$ 2,319,004$ 2,196,510$ 1,284,579$ 1,101,632$ -18.0%Non-Credit Instruction 6,203,192$ 4,976,487$ 4,014,178$ 4,118,538$ 4,297,733$ 4,388,054$ -30.7%Research -$ -$ -$ -$ -$ 46,410$ NAPublic Service 3,547,958$ 3,686,516$ 3,980,604$ 5,288,835$ 5,904,431$ 4,784,504$ 66.4%Libraries 6,381,137$ 6,433,591$ 6,638,803$ 6,609,808$ 6,384,014$ 5,896,644$ 0.0%Museums & Galleries -$ -$ -$ -$ -$ -$ NAOrganized Activities 1,963,145$ 2,012,799$ 1,778,800$ 1,819,007$ 1,727,454$ 776,767$ -12.0%Other Academic Support 18,578,919$ 21,752,594$ 19,314,792$ 19,010,631$ 18,116,437$ 21,280,463$ -2.5%Student Services 28,356,195$ 28,676,194$ 30,291,001$ 29,221,565$ 28,766,006$ 28,104,900$ 1.4%Institutional Support 54,124,325$ 55,153,955$ 55,294,626$ 56,782,015$ 55,624,638$ 52,986,243$ 2.8%Utilities 9,868,327$ 10,473,685$ 10,378,878$ 10,955,335$ 11,107,854$ 11,023,712$ 12.6%Other Plant Maintenance 28,547,555$ 28,638,699$ 26,903,111$ 27,647,745$ 27,353,233$ 28,840,397$ -4.2%Scholarships & Fellow ships 9,530,076$ 9,483,259$ 9,923,304$ 10,962,425$ 12,180,458$ 11,091,463$ 27.8%Other 1,490,898$ 1,828,416$ 2,350,296$ 5,256,265$ 4,150,991$ 4,616,347$ 178.4%Transfers - Auxiliary 261,563$ 255,182$ 337,735$ 1,662,041$ (2,716,326)$ 474,212$ -1138.5%Transfers - Mandatory 8,857,543$ 10,767,352$ 12,231,851$ 12,543,418$ 12,938,299$ 12,954,350$ 46.1%Transfers -Non Mandatory 9,247,396$ 9,944,683$ 5,150,843$ 6,262,108$ 2,197,171$ 6,307,026$ -76.2% Total 325,788,873$ 335,486,058$ 333,737,167$ 349,347,321$ 328,724,450$ 330,395,190$ 0.9%
Unrestricted E&G Expenditures
Source: Revenues from ADHE Series 17-1; Expenditures from ADHE Series 17-7a.

135 Back to Table of Contents
TABLE 5.2W – TWO-YEAR SUMMARY (CONT.) AUXILIARY ENTERPRISES
5 yr2010-11 2011-12 2012-13 2013-14 2014-15 2015-16 % Incr
RevenuesIntercollegiate Athletics 35,940$ 56,097$ 47,231$ 58,953$ 70,263$ 67,228$ 95.5%Resident Halls 428,314$ 886,655$ 999,285$ 991,767$ 1,022,579$ 1,045,253$ 138.7%Married Student Housing -$ -$ -$ -$ -$ -$ NAFaculty Housing 31,837$ 38,079$ 43,943$ 47,748$ 47,200$ 51,697$ 48.3%Food Service 1,405,963$ 1,582,219$ 1,726,684$ 1,611,027$ 1,681,804$ 1,398,488$ 19.6%College Union 229,861$ 228,708$ 216,412$ 201,091$ 191,104$ 178,374$ -16.9%Bookstore 17,188,578$ 17,462,997$ 15,960,006$ 14,507,984$ 12,882,389$ 11,696,493$ -25.1%Student Org. and Publications 9,547$ 54,668$ 47,754$ 76,801$ 145,529$ 217,953$ 1424.3%Student Health Service -$ -$ -$ -$ -$ -$ NAOther Auxiliary 551,670$ 1,125,517$ 1,071,863$ 1,078,890$ 997,970$ 983,457$ 80.9% Total 19,881,710$ 21,434,940$ 20,113,178$ 18,633,189$ 17,038,838$ 15,687,881$ -14.3%
ExpendituresIntercollegiate Athletics 430,848$ 478,278$ 457,483$ 491,903$ 493,889$ 520,266$ 14.6%Resident Halls 353,536$ 504,274$ 502,279$ 474,817$ 478,066$ 547,874$ 35.2%Married Student Housing -$ -$ -$ -$ -$ -$ NAFaculty Housing 16,830$ 26,114$ 18,010$ 21,371$ 18,182$ 6,944$ 8.0%Food Service 2,107,093$ 2,301,012$ 2,338,374$ 2,255,200$ 2,108,163$ 2,144,315$ 0.1%College Union 79,542$ 82,402$ 90,323$ 89,375$ 90,354$ 95,113$ 13.6%Bookstore 14,072,106$ 13,943,100$ 13,982,356$ 12,204,334$ 10,896,288$ 9,547,266$ -22.6%Student Org. and Publications 166,573$ 190,230$ 163,943$ 333,561$ 858,652$ 367,629$ 415.5%Student Health Service -$ -$ -$ -$ -$ -$ NAOther Auxiliary 455,001$ 865,600$ 1,107,223$ 1,283,868$ 1,402,645$ 1,315,732$ 208.3% Total 17,681,529$ 18,391,010$ 18,659,991$ 17,154,429$ 16,346,239$ 14,545,138$ -7.6%
Transfers/Debt ServiceIntercollegiate Athletics -$ -$ -$ -$ -$ -$ NAResident Halls -$ -$ -$ -$ -$ -$ NAMarried Student Housing -$ -$ -$ -$ -$ -$ NAFaculty Housing -$ -$ -$ -$ -$ -$ NAFood Service -$ -$ -$ 131,141$ -$ -$ NACollege Union -$ -$ -$ -$ -$ -$ NABookstore -$ -$ -$ -$ -$ -$ NAStudent Org. and Publications -$ -$ -$ -$ -$ -$ NAStudent Health Service -$ -$ -$ -$ -$ -$ NAOther Auxiliary -$ -$ -$ -$ -$ -$ NA Total -$ -$ -$ 131,141$ -$ -$ NA
Excess of Revenues 2,200,181$ 3,043,930$ 1,453,187$ 1,347,619$ 692,599$ 1,142,743$ -68.5%
Special TransfersAuxiliary Transfer Policy 387,462$ 318,796$ 388,400$ 379,725$ 495,151$ 494,666$ 27.8%Other Auxilary Transfer (402,110)$ (1,641,960)$ (2,220,443)$ (1,349,997)$ (4,261,919)$ (1,100,072)$ NA Total (14,648)$ (1,323,164)$ (1,832,043)$ (970,272)$ (3,766,768)$ (605,406)$ NA
Total Excess of Revenues 2,185,533$ 1,720,765$ (378,856)$ 377,347$ (3,074,169)$ 537,337$

136 Back to Table of Contents
CHART 6. UNRESTRICTED E&G AND AUXILIARY REVENUES AND EXPENDITURES TWO-YEAR INSTITUTIONS: 2010-11 THROUGH 2015-16

137 Back to Table of Contents
TABLE 5.2X – FOUR-YEAR AND TWO-YEAR SUMMARY UNRESTRICTED EDUCATIONAL & GENERAL
5 yr2010-11 2011-12 2012-13 2013-14 2014-15 2015-16 % Incr
Unrestricted E&G RevenuesTuition & Fees 655,805,414$ 707,609,206$ 728,785,578$ 779,833,199$ 808,854,678$ 839,517,248$ 28.0%Gov. Appropriations Federal -$ -$ 35,442$ 4,558$ -$ -$ NA State 599,497,464$ 607,257,855$ 602,549,783$ 489,815,571$ 615,826,409$ 616,973,271$ 2.9% Local 18,054,864$ 21,397,802$ 21,262,864$ 22,807,349$ 22,717,899$ 23,218,657$ 28.6%Grants & Contracts Federal 5,860,082$ 5,367,577$ 4,633,923$ 3,519,659$ 3,152,734$ 3,541,408$ -39.6% State 2,120,569$ 1,860,490$ 2,179,107$ 1,798,167$ 2,636,049$ 2,754,771$ 29.9% Local 2,245,169$ 265,147$ 734,907$ 617,068$ 501,218$ 568,587$ -74.7%Private Gifts, Grants and Contracts 6,574,152$ 7,813,195$ 8,059,650$ 7,629,721$ 7,642,076$ 7,685,880$ 16.9%Endow ment Income 1,026,278$ 1,186,657$ 2,009,051$ 1,535,773$ 1,922,576$ 2,011,047$ 96.0%Sales and Services Educational Actvities 22,036,311$ 23,231,107$ 15,776,559$ 17,148,932$ 17,509,842$ 16,945,435$ -23.1%
Hospitals -$ -$ -$ -$ -$ -$ NAOther Investments 6,195,995$ 6,855,889$ 2,908,559$ 6,095,099$ 1,786,067$ 2,499,606$ -59.7%Other 21,704,701$ 21,925,898$ 21,506,324$ 22,434,847$ 22,500,658$ 28,295,367$ 30.4% Total 1,341,120,998$ 1,404,770,822$ 1,410,441,746$ 1,353,239,943$ 1,505,050,205$ 1,544,011,277$ 15.1%
Unrestricted E&G ExpendituresTeaching Salaries 302,517,026$ 335,059,613$ 320,811,625$ 331,053,381$ 334,920,408$ 338,495,028$ 11.9%Dept. Oper. Expense 195,787,934$ 176,531,774$ 207,866,554$ 219,058,079$ 220,542,107$ 230,831,029$ 17.9%Off-Campus Credit 7,366,356$ 10,493,270$ 10,091,023$ 12,113,655$ 12,648,639$ 11,447,675$ 55.4%Non-Credit Instruction 12,219,897$ 10,170,692$ 9,156,364$ 9,037,915$ 9,475,949$ 9,648,119$ -21.0%Research 24,014,726$ 25,541,279$ 27,181,143$ 26,547,351$ 28,329,997$ 34,184,108$ 42.3%Public Service 21,733,762$ 24,277,975$ 23,264,569$ 24,791,116$ 27,769,226$ 22,905,231$ 5.4%Libraries 35,220,809$ 37,753,603$ 38,933,007$ 39,425,963$ 39,442,353$ 39,356,200$ 11.7%Museums & Galleries 782,736$ 1,173,702$ 965,946$ 929,619$ 961,127$ 940,483$ 20.2%Organized Activities 6,585,386$ 7,902,804$ 7,068,829$ 7,113,161$ 6,649,153$ 6,348,045$ -3.6%Other Academic Support 86,000,265$ 90,658,043$ 93,832,953$ 91,665,558$ 94,882,343$ 100,412,211$ 16.8%Student Services 87,363,457$ 93,550,166$ 99,186,248$ 98,805,668$ 100,312,706$ 102,830,673$ 17.7%Institutional Support 164,763,276$ 174,279,280$ 178,504,272$ 183,592,640$ 184,790,733$ 185,118,731$ 12.4%Utilities 39,770,405$ 39,973,208$ 43,364,621$ 45,845,054$ 46,867,785$ 43,555,728$ 9.5%Other Plant Maintenance 89,811,493$ 93,010,317$ 80,670,521$ 83,629,533$ 85,458,472$ 93,681,875$ 4.3%Scholarships & Fellow ships 108,984,562$ 110,924,771$ 112,884,263$ 119,171,213$ 130,217,421$ 135,602,243$ 24.4%Other 11,903,280$ 13,687,313$ 8,141,699$ 17,978,211$ 18,103,030$ 16,363,788$ 37.5%Transfers - Auxiliary 10,659,880$ 6,738,334$ 18,463,578$ 14,183,096$ 10,554,234$ 14,465,905$ 35.7%Transfers - Mandatory 40,777,285$ 50,809,322$ 33,898,703$ 58,329,320$ 63,375,353$ 63,232,675$ 55.1%Transfers -Non Mandatory 55,130,252$ 53,308,920$ 56,663,057$ 65,049,814$ 42,490,753$ 75,913,260$ 37.7% Total 1,301,392,787$ 1,355,844,384$ 1,370,948,974$ 1,448,320,348$ 1,457,791,789$ 1,525,333,008$ 17.2%
Source: Revenues from ADHE Series 17-1; Expenditures from ADHE Series 17-7a.

138 Back to Table of Contents
TABLE 5.2X– FOUR-YEAR AND TWO-YEAR SUMMARY (CONT.) AUXILIARY ENTERPRISES
5 yr2010-11 2011-12 2012-13 2013-14 2014-15 2015-16 % Incr
RevenuesIntercollegiate Athletics 100,813,044$ 108,383,633$ 115,178,776$ 111,562,500$ 129,506,876$ 142,557,684$ 41.4%Resident Halls 82,589,368$ 89,692,789$ 94,166,003$ 100,212,576$ 104,605,243$ 116,650,106$ 41.2%Married Student Housing 1,477,562$ 1,938,329$ 2,001,038$ 1,567,712$ 1,581,648$ 1,461,831$ -1.1%Faculty Housing 203,578$ 185,424$ 165,692$ 177,425$ 165,418$ 140,903$ -30.8%Food Service 26,724,261$ 31,206,680$ 32,611,283$ 33,927,229$ 36,139,376$ 38,308,599$ 43.3%College Union 8,028,088$ 6,181,914$ 5,078,324$ 5,095,141$ 5,001,972$ 5,007,735$ -37.6%Bookstore 40,799,296$ 43,260,466$ 39,151,730$ 37,206,189$ 35,366,924$ 32,215,562$ -21.0%Student Org. and Publications 6,171,649$ 6,554,014$ 8,525,083$ 6,317,736$ 10,750,344$ 6,898,399$ 11.8%Student Health Service 8,083,571$ 7,950,047$ 14,313,241$ 9,477,366$ 12,684,897$ 12,509,300$ 54.7%Other Auxiliary 19,493,904$ 22,124,951$ 23,577,405$ 20,712,233$ 21,155,992$ 23,179,870$ 18.9% Total 294,384,321$ 317,478,246$ 334,768,576$ 326,256,105$ 356,958,690$ 378,929,989$ 28.7%
ExpendituresIntercollegiate Athletics 101,643,854$ 109,236,571$ 114,046,076$ 120,936,958$ 130,566,332$ 142,547,966$ 40.2%Resident Halls 43,776,505$ 47,137,665$ 48,370,372$ 46,782,597$ 46,927,402$ 49,707,807$ 13.5%Married Student Housing 486,413$ 578,654$ 679,084$ 530,876$ 465,066$ 512,952$ 5.5%Faculty Housing 73,796$ 86,293$ 79,868$ 112,767$ 109,610$ 60,139$ -18.5%Food Service 21,217,879$ 25,151,551$ 26,243,092$ 27,296,450$ 28,480,349$ 29,685,574$ 39.9%College Union 6,839,497$ 6,083,101$ 5,201,365$ 5,391,740$ 4,827,799$ 5,550,862$ -18.8%Bookstore 35,019,831$ 36,281,989$ 34,694,060$ 32,015,335$ 29,863,422$ 27,310,824$ -22.0%Student Org. and Publications 4,920,759$ 4,642,497$ 4,737,066$ 4,661,597$ 6,839,370$ 4,680,099$ -4.9%Student Health Service 6,811,145$ 7,545,672$ 8,605,344$ 9,179,039$ 10,118,834$ 10,740,994$ 57.7%Other Auxiliary 13,570,050$ 14,922,786$ 14,104,837$ 13,722,992$ 14,065,013$ 15,271,147$ 12.5% Total 234,359,728$ 251,666,780$ 256,761,165$ 260,630,350$ 272,263,196$ 286,068,363$ 22.1%
Transfers/Debt ServiceIntercollegiate Athletics 8,369,224$ 7,552,816$ 10,684,943$ 11,737,463$ 12,964,256$ 11,193,521$ 33.7%Resident Halls 22,926,050$ 27,792,098$ 26,583,566$ 32,995,760$ 33,449,132$ 35,501,564$ 54.9%Married Student Housing 905,081$ 1,073,125$ 1,075,966$ 858,936$ 872,625$ 872,542$ -3.6%Faculty Housing -$ -$ -$ -$ -$ -$ NAFood Service 618,168$ 119,703$ -$ 894,315$ 642,268$ 640,278$ 3.6%College Union 2,320,299$ 1,948,036$ 1,457,314$ 1,453,236$ 1,527,997$ 1,555,227$ -33.0%Bookstore 847,359$ 880,194$ 908,751$ 940,870$ 1,191,042$ 977,933$ 15.4%Student Org. and Publications 216,042$ 158,962$ 159,017$ 158,931$ 349,152$ -$ -100.0%Student Health Service 690,787$ 376,201$ 375,068$ 376,998$ 359,533$ 133,960$ -80.6%Other Auxiliary 4,334,590$ 4,765,661$ 5,811,677$ 6,387,452$ 6,138,684$ 5,445,314$ 25.6% Total 41,227,598$ 44,666,795$ 47,056,300$ 55,803,961$ 57,494,688$ 56,320,338$ 36.6%
Excess of Revenues 18,796,995$ 21,144,672$ 30,951,110$ 9,821,794$ 27,200,806$ 36,541,288$ 94.4%
Special TransfersAuxiliary Transfer Policy 9,456,537$ 10,207,691$ 10,434,565$ 12,160,149$ 13,338,588$ 15,782,842$ 66.9%Other Auxilary Transfer (13,301,633)$ (26,524,370)$ (29,383,467)$ (19,298,332)$ (38,884,520)$ (42,928,701)$ NA Total (3,845,096)$ (16,316,679)$ (18,948,902)$ (7,138,183)$ (25,545,932)$ (27,145,859)$ NA
Total Excess of Revenues 14,951,899$ 4,827,993$ 12,002,208$ 2,683,611$ 1,654,874$ 9,395,429$

139 Back to Table of Contents
CHART 7. UNRESTRICTED E&G AND AUXILIARY REVENUES AND EXPENDITURES FOUR-YEAR AND TWO-YEAR INSTITUTIONS: 2010-11 THROUGH 2015-16

140 Back to Table of Contents
SECTION 6.
INTERCOLLEGIATE ATHLETIC REVENUES AND EXPENDITURES: 2006-07 THROUGH 2015-16

141 Back to Table of Contents
TABLE 6.1A – SUMMARY OF INTERCOLLEGIATE ATHLETIC REVENUES AND EXPENDITURES FOR UNIVERSITIES: 2006-07
UAF ASUJ UALR UAPB UCA ATU HSU SAUM UAFS UAM 4-yr TOTAL
Ticket Sales 26,578,578$ 943,097$ 520,341$ 374,011$ 870,886$ 94,426$ 27,592$ 26,612$ 70,648$ 16,197$ 29,522,388$
Media/Tournament/Bowl 12,193,686$ 28,557$ 262,379$ 23,093$ -$ -$ -$ -$ 11,080$ -$ 12,518,795$
Concessions/Program Sales 3,168,366$ 75,976$ 3,104$ 16,273$ 18,939$ -$ 29,942$ 19,627$ 38,662$ -$ 3,370,889$
Game Guarantees 16,819$ 1,295,990$ 155,614$ 213,070$ 530,312$ 18,500$ 45,700$ 60,450$ 1,500$ 65,200$ 2,403,155$
Foundations/Clubs & Other Private Gifts 8,884,270$ 539,127$ 334,683$ 132,543$ 129,034$ 92,594$ 43,326$ 8,000$ 3,431$ -$ 10,167,008$
Student Athletic Fees -$ 2,273,704$ 2,949,495$ 3,225,929$ 1,163,466$ 1,956,295$ 1,004,000$ 768,600$ 1,086,939$ 462,812$ 14,891,240$
Other Income 7,365,723$ 1,315,573$ 523,331$ 43,142$ 271,106$ 16,292$ 56,539$ 111,137$ 804$ 6,084$ 9,709,730$
CWSP Federally Funded Portion -$ -$ -$ 76,994$ -$ 14,224$ 11,081$ -$ -$ 26,926$ 129,225$
CWSP Fed. Portion as % Total CWSP 0.0% 0.0% 0.0% 100.0% 0.0% 75.0% 60.1% 0.0% 0.0% 100.0% 91.4%
Other Auxiliary Profits 600,000$ 2,551,780$ -$ 1,516,020$ 912,297$ -$ 540,388$ 319,702$ 51,657$ 1,100,177$ 7,592,021$
Transfers from Unrestricted E&G -$ 1,057,166$ 822,839$ 1,050,000$ 1,057,166$ 1,013,454$ 1,058,798$ 1,058,798$ -$ 625,000$ 7,743,221$ T ransfers from Other Funds/Balance Forward 174,463$ -$ -$ -$ -$ -$ -$ -$ 454,237$ -$ 628,700$ T ransfers from Other Funds/Balance Forward (Inclusive of Interfund Borrowing) -$ -$ -$ -$ -$ -$ -$ -$ -$ -$ -$
Total Revenues for Athletics 58,981,905$ 10,080,970$ 5,571,786$ 6,671,074$ 4,953,205$ 3,205,785$ 2,817,366$ 2,372,926$ 1,718,958$ 2,302,396$ 98,676,371$
Salaries 10,635,958$ 2,640,757$ 1,783,165$ 1,253,805$ 1,014,896$ 701,999$ 656,831$ 503,780$ 374,725$ 453,561$ 20,019,477$
Budgeted FTE Positions 214 69 40 32 27 20 13 12 8 11 446
Fringe Benefits 2,743,416$ 709,883$ 453,535$ 415,501$ 281,558$ 208,082$ 221,076$ 145,532$ 106,337$ 131,764$ 5,416,684$
Fringe Benefits as a % of Salaries 25.8% 26.9% 25.4% 33.1% 27.7% 29.6% 33.7% 28.9% 28.4% 29.1% 27.1%
Extra Help 1,287,856$ 123,778$ 166,312$ 148,488$ 101,723$ 104,871$ -$ 100,543$ 36,840$ 51,992$ 2,122,403$
CWSP -$ -$ -$ 76,994$ -$ 18,965$ 18,436$ -$ -$ 26,926$ 141,321$
Game Guarantees 2,190,570$ 767,609$ 120,500$ 132,150$ -$ 3,850$ -$ -$ 1,200$ 10,000$ 3,225,879$
Athletic Scholarships 4,858,000$ 2,688,968$ 1,456,223$ 1,862,095$ 1,256,262$ 807,372$ 1,134,272$ 728,792$ 588,503$ 572,492$ 15,952,979$
Medical Insurance/Injury Claims 561,470$ 115,266$ 12,713$ 147,604$ 59,422$ 102,399$ -$ 119,021$ 53,276$ 145,552$ 1,316,723$
Travel 6,328,440$ 1,546,229$ 775,406$ 1,267,660$ 865,477$ 375,223$ 193,931$ 342,513$ 191,502$ 155,107$ 12,041,488$
Equipment 116,245$ 6,826$ 8,225$ 21,032$ 11,245$ 3,608$ -$ 9,500$ -$ 20,760$ 197,441$
Concessions/Programs 801,975$ -$ -$ -$ -$ -$ -$ 12,414$ 33,462$ 847,851$
M & O 8,112,190$ 1,253,304$ 543,927$ 536,682$ 815,456$ 216,951$ 410,990$ 232,649$ 148,947$ 371,826$ 12,642,921$
Facilities 8,140,893$ 228,350$ 251,779$ 296,446$ -$ 229,506$ 181,830$ 89,606$ 73,496$ 209,396$ 9,701,302$
Debt Service 12,694,092$ -$ -$ 486,791$ 547,166$ 98,928$ -$ 88,576$ -$ 126,836$ 14,042,390$
Other Expenses -$ -$ -$ 25,826$ -$ 16,958$ -$ -$ 102,988$ 26,184$ 171,956$
T ransfers to Other Funds/Accounts 510,800$ -$ -$ -$ -$ -$ -$ -$ 7,682$ -$ 518,482$
Total Expenditures for Athletics 58,981,905$ 10,080,970$ 5,571,785$ 6,671,074$ 4,953,205$ 2,888,712$ 2,817,366$ 2,372,926$ 1,718,958$ 2,302,396$ 98,359,297$
OTHER FINANCING SOURCES
EXPENDITURES
OTHER FINANCING
USES
INSTITUTIONS
REVENUES

142 Back to Table of Contents
TABLE 6.1B – SUMMARY OF INTERCOLLEGIATE ATHLETIC REVENUES AND EXPENDITURES FOR COLLEGES: 2006-07
NAC UACCM 2-yr TOTAL GRAND TOTAL
Ticket Sales 5,947$ -$ 5,947$ 29,528,335$
Media/Tournament/Bowl -$ -$ -$ 12,518,795$
Concessions/Program Sales -$ -$ -$ 3,370,889$
Game Guarantees -$ -$ -$ 2,403,155$
Foundations/Clubs & Other Private Gifts -$ -$ -$ 10,167,008$
Student Athletic Fees -$ -$ -$ 14,891,240$
Other Income 24,902$ -$ 24,902$ 9,734,632$
CWSP Federally Funded Portion -$ -$ -$ 129,225$
CWSP Fed. Portion as % Total CWSP 0.0% 0.0% 0.0% 91.4%
Other Auxiliary Profits 50,322$ -$ 50,322$ 7,642,343$
Transfers from Unrestricted E&G 101,274$ 25,000$ 126,274$ 7,869,495$
T ransfers from Other Funds/Balance Forward 73,446$ -$ 73,446$ 702,146$ ( Interfund Borrowing) 0 0 0 0
Total Revenues for Athletics 255,891$ 25,000$ 280,891$ 98,957,262$
Salaries 66,758$ 2,000$ 68,758$ 20,088,235$
Budgeted FTE Positions 2 0 2 449
Fringe Benefits 22,326$ 875$ 23,201$ 5,439,885$
Fringe Benefits as a % of Salaries 33.44% 43.75% 33.74% 27.08%
Extra Help 900$ -$ 900$ 2,123,303$
CWSP -$ -$ -$ 141,321$
Game Guarantees -$ -$ -$ 3,225,879$
Athletic Scholarships 36,325$ -$ 36,325$ 15,989,304$
Medical Insurance/Injury Claims 12,912$ -$ 12,912$ 1,329,635$
Travel 37,369$ 3,444$ 40,813$ 12,082,301$
Equipment 4,528$ -$ 4,528$ 201,969$
Concessions/Programs -$ -$ -$ 847,851$
M & O 51,511$ 11,625$ 63,136$ 12,706,057$
Facilities 23,262$ -$ 23,262$ 9,724,564$
Debt Service -$ -$ -$ 14,042,390$
Other Expenses -$ -$ -$ 171,956$
T ransfers to Other Funds/Accounts -$ -$ -$ 518,482$ Total Expenditures for Athletics 255,891$ 17,944$ 273,835$ 98,633,132$
OTHER FINANCING
USES
INSTITUTIONS
REVENUES
EXPENDITURES
OTHER FINANCING SOURCES

143 Back to Table of Contents
TABLE 6.2A – SUMMARY OF INTERCOLLEGIATE ATHLETIC REVENUES AND EXPENDITURES FOR UNIVERSITIES: 2007-08
UAF ASUJ UALR UAPB UCA ATU HSU SAUM UAFS UAM 4-yr TOTAL
Ticket Sales 25,779,252$ 958,619$ 518,732$ 487,389$ 590,471$ 191,816$ 27,332$ 22,819$ 56,345$ 27,399$ 28,660,173$
Media/Tournament/Bowl 12,591,173$ 32,624$ 218,717$ -$ -$ -$ -$ 11,766$ 12,854,280$
Concessions/Program Sales 2,810,016$ 98,363$ 2,695$ 16,958$ 4,525$ -$ 25,325$ 22,466$ 38,978$ 3,019,326$
Game Guarantees 19,309$ 1,888,650$ 68,860$ 224,300$ 686,750$ 53,100$ 68,500$ 30,000$ 2,075$ 79,165$ 3,120,709$
Foundations/Clubs & Other Private Gifts 8,500,000$ 398,116$ 470,395$ 113,172$ 2,363$ 102,109$ 41,037$ 2,000$ 3,015$ 9,632,207$
Student Athletic Fees -$ 2,250,882$ 3,117,094$ 3,236,172$ 1,208,995$ 2,017,895$ 1,044,078$ 770,100$ 1,280,101$ 516,123$ 15,441,440$
Other Income 8,195,566$ 1,437,756$ 600,453$ 69,210$ 165,328$ 25,289$ 36,020$ 24,042$ 2,078$ 9,965$ 10,565,708$
CWSP Federally Funded Portion 17,858$ -$ -$ 73,875$ -$ 15,902$ 2,638$ -$ 32,638$ 142,911$
CWSP Fed. Portion as % Total CWSP 80.0% 0.0% 0.0% 100.0% 0.0% 75.2% 15.2% 0.0% 0.0% 100.0% 85.4%
Other Auxiliary Profits 600,000$ 2,354,530$ -$ 1,664,169$ 1,158,106$ -$ 716,376$ 574,122$ 74,598$ 1,025,832$ 8,167,733$
Transfers from Unrestricted E&G -$ 1,078,234$ 1,028,618$ 1,075,000$ 1,078,234$ 1,078,234$ 1,078,234$ 1,078,234$ -$ 750,000$ 8,244,788$ T ransfers from Other Funds/Balance Forward -$ -$ -$ -$ -$ -$ -$ 536,610$ -$ 536,610$ T ransfers from Other Funds/Balance Forward (Inclusive of Interfund Borrowing) -$ -$ -$ -$ -$ -$ -$ -$ -$ -$ -$
Total Revenues for Athletics 58,513,174$ 10,497,774$ 6,025,564$ 6,960,245$ 4,894,773$ 3,484,345$ 3,039,540$ 2,523,783$ 2,005,566$ 2,441,122$ 100,385,886$
Salaries 13,390,131$ 2,758,456$ 2,006,000$ 1,397,585$ 1,166,998$ 713,553$ 680,745$ 526,711$ 495,219$ 479,777$ 23,615,176$
Budgeted FTE Positions 214 67 38 30 31 21 0 13 0 11 425
Fringe Benefits 3,891,929$ 744,497$ 535,230$ 419,245$ 281,385$ 215,472$ 199,856$ 172,001$ 151,856$ 148,518$ 6,759,989$
Fringe Benefits as a % of Salaries 29.1% 27.0% 26.7% 30.0% 24.1% 30.2% 29.4% 32.7% 30.7% 31.0% 28.6%
Extra Help 1,451,737$ 160,695$ 114,219$ 225,134$ 55,500$ 137,846$ -$ 91,434$ 36,539$ 64,615$ 2,337,719$
CWSP 22,322$ -$ -$ 73,875$ -$ 21,159$ 17,383$ -$ 32,638$ 167,377$
Game Guarantees 2,943,555$ 698,671$ 50,863$ 16,900$ -$ 8,350$ -$ -$ 12,307$ 3,730,646$
Athletic Scholarships 5,087,060$ 2,873,557$ 1,614,323$ 2,186,220$ 1,328,555$ 1,006,656$ 1,249,453$ 812,368$ 741,140$ 599,452$ 17,498,784$
Medical Insurance/Injury Claims 505,196$ 40,286$ 16,753$ 120,854$ 80,368$ 161,780$ 200,151$ 116,911$ 62,245$ 170,008$ 1,474,552$
Travel 6,731,043$ 1,371,170$ 908,953$ 1,146,648$ 728,560$ 366,946$ 226,346$ 348,478$ 233,737$ 189,633$ 12,251,514$
Equipment 510,156$ 14,058$ 23,506$ 20,250$ 10,023$ 4,991$ 8,257$ 13,999$ 10,822$ -$ 616,062$
Concessions/Programs 839,287$ -$ -$ -$ -$ -$ -$ 17,831$ 34,922$ 892,040$
M & O 10,398,201$ 1,486,600$ 571,531$ 705,995$ 715,165$ 239,431$ 449,562$ 225,984$ 133,870$ 358,582$ 15,284,921$
Facilities 6,941,027$ 349,784$ 184,186$ 292,718$ -$ 297,620$ -$ 108,338$ 45,306$ 222,844$ 8,441,823$
Debt Service 5,234,076$ -$ -$ 316,399$ 528,219$ 264,190$ 7,787$ 89,728$ -$ 126,846$ 6,567,245$
Other Expenses -$ -$ -$ 38,422$ -$ 19,448$ -$ -$ 59,910$ 35,902$ 153,682$
T ransfers to Other Funds/Accounts 526,250$ -$ -$ -$ -$ -$ -$ -$ -$ -$ 526,250$
Total Expenditures for Athletics 58,471,970$ 10,497,774$ 6,025,564$ 6,960,245$ 4,894,773$ 3,457,442$ 3,039,540$ 2,523,783$ 2,005,566$ 2,441,122$ 100,317,779$
INSTITUTIONS
REVENUES
OTHER FINANCING SOURCES
EXPENDITURES
OTHER FINANCING
USES

144 Back to Table of Contents
TABLE 6.2B – SUMMARY OF INTERCOLLEGIATE ATHLETIC REVENUES AND EXPENDITURES FOR COLLEGES: 2007-08
NAC 2-yr TOTAL GRAND TOTAL
Ticket Sales 8,051$ 8,051$ 28,668,224$
Media/Tournament/Bowl -$ -$ 12,854,280$
Concessions/Program Sales -$ -$ 3,019,326$
Game Guarantees 1,992$ 1,992$ 3,122,701$
Foundations/Clubs & Other Private Gifts -$ -$ 9,632,207$
Student Athletic Fees -$ -$ 15,441,440$
Other Income 9,895$ 9,895$ 10,575,603$
CWSP Federally Funded Portion -$ -$ 142,911$
CWSP Fed. Portion as % Total CWSP 0.0% 0.0% 85.4%
Other Auxiliary Profits 66,790$ 66,790$ 8,234,523$
Transfers from Unrestricted E&G 134,300$ 134,300$ 8,379,088$
T ransfers from Other Funds/Balance Forward 39,990$ 39,990$ 576,600$ ( Interfund Borrowing) 0 0 0
Total Revenues for Athletics 261,018$ 261,018$ 100,646,904$
Salaries 73,636$ 73,636$ 23,688,812$
Budgeted FTE Positions 2 2 427
Fringe Benefits 23,577$ 23,577$ 6,783,566$
Fringe Benefits as a % of Salaries 32.02% 32.02% 28.64%
Extra Help 900$ 900$ 2,338,619$
CWSP -$ -$ 167,377$
Game Guarantees -$ -$ 3,730,646$
Athletic Scholarships 38,338$ 38,338$ 17,537,122$
Medical Insurance/Injury Claims 10,865$ 10,865$ 1,485,417$
Travel 41,630$ 41,630$ 12,293,144$
Equipment 15,943$ 15,943$ 632,005$
Concessions/Programs -$ -$ 892,040$
M & O 32,400$ 32,400$ 15,317,321$
Facilities 23,729$ 23,729$ 8,465,552$
Debt Service -$ -$ 6,567,245$
Other Expenses -$ -$ 153,682$
T ransfers to Other Funds/Accounts -$ -$ 526,250$ Total Expenditures for Athletics 261,018$ 261,018$ 100,578,797$
OTHER FINANCING
USES
INSTITUTIONS
REVENUES
EXPENDITURES
OTHER FINANCING SOURCES

145 Back to Table of Contents
TABLE 6.3A – SUMMARY OF INTERCOLLEGIATE ATHLETIC REVENUES AND EXPENDITURES FOR UNIVERSITIES: 2008-09
UAF ASUJ UALR UAPB UCA ATU HSU SAUM UAFS UAM 4-yr TOTAL
Ticket Sales 27,423,382$ 995,035$ 493,709$ 735,389$ 432,114$ 172,522$ 38,516$ 22,020$ 54,207$ 34,567$ 30,401,461$
Media/Tournament/Bowl 14,755,044$ 25,985$ 338,085$ -$ -$ -$ -$ -$ 5,600$ -$ 15,124,714$
Concessions/Program Sales 3,405,576$ 110,166$ 4,402$ 130,718$ 21,373$ -$ 33,306$ 20,478$ 52,738$ -$ 3,778,757$
Game Guarantees 453,000$ 1,881,000$ 21,500$ 980,543$ 397,300$ 21,900$ 60,500$ 16,000$ -$ 52,200$ 3,883,943$
Foundations/Clubs & Other Private Gifts 5,270,567$ 557,718$ 827,157$ 48,591$ 255,964$ 82,945$ 11,517$ -$ 26,808$ -$ 7,081,266$
Student Athletic Fees -$ 2,784,556$ 3,314,841$ 1,350,346$ 3,796,589$ 1,964,355$ 1,011,717$ 823,680$ 1,687,907$ 585,784$ 17,319,775$
Other Income 8,831,107$ 1,338,824$ 50,717$ 257,643$ 72,728$ 38,415$ 27,332$ 16,625$ 10,713$ 7,398$ 10,651,501$
CWSP Federally Funded Portion 34,839$ -$ -$ -$ 133,309$ 18,790$ 4,912$ -$ -$ 39,226$ 231,076$
CWSP Fed. Portion as % Total CWSP 80.0% 0.0% 0.0% 0.0% 100.0% 75.0% 20.5% 0.0% 0.0% 100.0% 87.2%
Other Auxiliary Profits -$ 1,942,275$ -$ 1,467,265$ 1,218,461$ -$ 904,927$ 396,358$ 664,170$ 1,251,267$ 7,844,723$
Transfers from Unrestricted E&G -$ 1,124,400$ 1,124,359$ 1,078,234$ 1,124,400$ 1,124,720$ 840,654$ 1,124,400$ -$ 650,000$ 8,191,167$ T ransfers from Other Funds/Balance Forward -$ -$ -$ -$ 187,154$ 78,848$ -$ 315,838$ 48,269$ -$ 630,109$
Total Revenues for Athletics 60,173,515$ 10,759,959$ 6,174,770$ 6,048,729$ 7,639,392$ 3,502,495$ 2,933,381$ 2,735,399$ 2,550,411$ 2,620,442$ 105,138,494$
Salaries 15,143,275$ 2,742,229$ 2,027,529$ 1,302,786$ 1,446,312$ 741,337$ 661,507$ 567,055$ 709,591$ 502,599$ 25,844,220$
Budgeted FTE Positions 243 67 41 30 29 21 0 14 0 11 456
Fringe Benefits 3,790,148$ 744,467$ 490,441$ 358,063$ 438,523$ 228,071$ 178,289$ 192,269$ 217,889$ 149,275$ 6,787,435$
Fringe Benefits as a % of Salaries 25.0% 27.1% 24.2% 27.5% 30.3% 30.8% 27.0% 33.9% 30.7% 29.7% 26.3%
Extra Help 1,657,916$ 164,786$ 293,083$ 151,970$ 243,602$ 133,361$ -$ 108,833$ 42,520$ 123,186$ 2,919,257$
CWSP 43,548$ -$ -$ -$ 133,309$ 25,054$ 23,954$ -$ -$ 39,226$ 265,091$
Game Guarantees 2,765,660$ 595,231$ -$ -$ 64,200$ 12,050$ 4,700$ -$ 2,000$ 17,229$ 3,461,070$
Athletic Scholarships 4,735,911$ 3,008,922$ 1,642,499$ 1,502,787$ 2,392,357$ 999,130$ 1,336,580$ 893,806$ 927,066$ 658,786$ 18,097,843$
Medical Insurance/Injury Claims 400,068$ 22,736$ 27,356$ 93,297$ 126,944$ 261,504$ 135,895$ 116,695$ 58,673$ 173,168$ 1,416,335$
Travel 6,172,246$ 1,605,412$ 937,209$ 722,837$ 1,203,579$ 386,873$ 184,592$ 375,369$ 225,029$ 184,470$ 11,997,616$
Equipment 314,434$ 19,194$ 10,405$ 16,467$ 2,780$ 8,320$ 12,812$ 11,800$ -$ 12,109$ 408,321$
Concessions/Programs 425,200$ -$ 20,159$ -$ -$ -$ -$ 15,171$ 45,252$ -$ 505,782$
M & O 9,303,339$ 1,492,264$ 436,830$ 962,715$ 684,007$ 137,370$ 209,479$ 253,191$ 131,102$ 350,561$ 13,960,858$
Facilities 6,737,773$ 364,718$ 135,440$ 47,950$ 437,512$ 285,795$ 185,573$ 112,619$ 85,244$ 240,013$ 8,632,637$
Debt Service 7,032,571$ -$ -$ 889,857$ 414,287$ 268,896$ -$ 88,591$ -$ 126,783$ 8,820,984$
Other Expenses -$ -$ 153,819$ -$ 51,980$ 14,736$ -$ -$ 106,045$ 43,037$ 369,617$
Transfers to Other Funds/Accounts 1,270,875$ -$ -$ -$ -$ -$ -$ -$ -$ -$ 1,270,875$
Total Expenditures for Athletics 59,792,964$ 10,759,959$ 6,174,770$ 6,048,729$ 7,639,392$ 3,502,495$ 2,933,381$ 2,735,399$ 2,550,411$ 2,620,442$ 104,757,942$
INSTITUTIONS
REVENUES
OTHER FINANCING SOURCES
EXPENDITURES
OTHER FINANCING
USES

146 Back to Table of Contents
TABLE 6.3B – SUMMARY OF INTERCOLLEGIATE ATHLETIC REVENUES AND EXPENDITURES FOR COLLEGES: 2008-09
NAC 2-yr TOTAL GRAND TOTAL
Ticket Sales 7,914$ 7,914$ 30,409,375$
Media/Tournament/Bowl -$ -$ 15,124,714$
Concessions/Program Sales -$ -$ 3,778,757$
Game Guarantees -$ -$ 3,883,943$
Foundations/Clubs & Other Private Gifts -$ -$ 7,081,266$
Student Athletic Fees -$ -$ 17,319,775$
Other Income 4,270$ 4,270$ 10,655,771$
CWSP Federally Funded Portion -$ -$ 231,076$
CWSP Fed. Portion as % Total CWSP 0.0% 0.0% 87.2%
Other Auxiliary Profits 127,175$ 127,175$ 7,971,898$
Transfers from Unrestricted E&G 145,678$ 145,678$ 8,336,845$ T ransfers from Other Funds/Balance Forward 121$ 121$ 630,230$
Total Revenues for Athletics 285,158$ 285,158$ 105,423,652$
Salaries 80,822$ 80,822$ 25,925,042$
Budgeted FTE Positions 2 2 458
Fringe Benefits 25,121$ 25,121$ 6,812,556$
Fringe Benefits as a % of Salaries 31.1% 31.1% 26.3%
Extra Help 1,190$ 1,190$ 2,920,447$
CWSP -$ -$ 265,091$
Game Guarantees -$ -$ 3,461,070$
Athletic Scholarships 49,390$ 49,390$ 18,147,233$
Medical Insurance/Injury Claims 11,641$ 11,641$ 1,427,976$
Travel 53,210$ 53,210$ 12,050,826$
Equipment -$ -$ 408,321$
Concessions/Programs -$ -$ 505,782$
M & O 14,467$ 14,467$ 13,975,325$
Facilities 23,317$ 23,317$ 8,655,954$
Debt Service -$ -$ 8,820,984$
Other Expenses -$ -$ 369,617$
Transfers to Other Funds/Accounts 26,000$ 26,000$ 26,000$
Total Expenditures for Athletics 285,158$ 285,158$ 105,043,100$
OTHER FINANCING SOURCES
EXPENDITURES
OTHER FINANCING
USES
REVENUES
INSTITUTIONS

147 Back to Table of Contents
TABLE 6.4A – SUMMARY OF INTERCOLLEGIATE ATHLETIC REVENUES AND EXPENDITURES FOR UNIVERSITIES: 2009-10
UAF ASUJ UALR UAPB UCA ATU HSU SAUM UAFS UAM 4-yr TOTAL
Ticket Sales 33,129,726$ 890,948$ 448,236$ 605,174$ 412,493$ 203,320$ 20,704$ 27,374$ 35,150$ 35,170$ 35,808,295$
Media/Tournament/Bowl 19,779,516$ 28,785$ 224,143$ -$ -$ 64,708$ 26,993$ -$ -$ -$ 20,124,145$
Concessions/Program Sales 779,239$ 75,121$ 3,081$ 97,014$ 16,191$ -$ 3,726$ 17,803$ 64,325$ -$ 1,056,500$
Game Guarantees 61,255$ 2,200,000$ 77,000$ 1,026,634$ 447,100$ 7,285$ 71,000$ 11,500$ 63,500$ 87,781$ 4,053,055$
Foundations/Clubs & Other Private Gifts 6,168,234$ 586,760$ 157,379$ -$ 297,825$ 67,523$ 12,500$ 4,000$ 12,263$ -$ 7,306,484$
Student Athletic Fees -$ 2,832,773$ 3,627,665$ 1,430,746$ 3,896,835$ 2,348,650$ 1,149,184$ 952,092$ 2,228,227$ 682,144$ 19,148,316$
Other Income 9,088,976$ 1,360,187$ 539,234$ 203,878$ 17,123$ 64,555$ 33,219$ 37,609$ 17,010$ 7,143$ 11,368,934$
CWSP Federally Funded Portion 43,113$ -$ -$ -$ 138,222$ 26,614$ -$ -$ -$ 29,899$ 237,848$
CWSP Fed. Portion as % Total CWSP 80.0% 0.0% 0.0% 0.0% 100.0% 75.0% 0.0% 0.0% 0.0% 100.0% 91.7%
Other Auxiliary Profits -$ 2,514,804$ 17,210$ 3,101,984$ 1,702,750$ -$ 730,447$ 633,416$ 310,907$ 1,268,027$ 10,279,545$
Transfers from Unrestricted E&G -$ 1,124,720$ 1,124,720$ 1,078,234$ 1,124,720$ 1,124,400$ 1,124,720$ 1,124,720$ -$ 620,000$ 8,446,234$ T ransfers from Other Funds/Balance Forward -$ -$ -$ -$ -$ -$ -$ -$ 122,919$ -$ 122,919$
Total Revenues for Athletics 69,050,059$ 11,614,098$ 6,218,668$ 7,543,664$ 8,053,259$ 3,907,055$ 3,172,493$ 2,808,514$ 2,854,301$ 2,730,164$ 117,952,275$
Salaries 16,373,333$ 2,821,545$ 2,161,887$ 1,428,504$ 1,457,607$ 783,370$ 897,618$ 595,534$ 770,427$ 590,182$ 27,880,007$
Budgeted FTE Positions 285 62 40 30 30 21 21 13 20 13 535
Fringe Benefits 3,697,392$ 811,576$ 509,293$ 424,516$ 415,375$ 237,289$ 274,421$ 208,102$ 246,811$ 189,730$ 7,014,505$
Fringe Benefits as a % of Salaries 22.6% 28.8% 23.6% 29.7% 28.5% 30.3% 30.6% 34.9% 32.0% 32.1% 25.2%
Extra Help 1,746,942$ 164,603$ -$ 105,706$ 251,527$ 141,521$ 22,053$ 115,369$ 10,190$ 69,163$ 2,627,074$
CWSP 53,892$ -$ -$ -$ 138,222$ 35,485$ -$ 1,840$ -$ 29,899$ 259,338$
Game Guarantees 2,708,055$ 535,275$ -$ -$ 92,000$ 16,625$ 16,300$ -$ 4,500$ 5,049$ 3,377,804$
Athletic Scholarships 5,145,899$ 3,148,681$ 1,691,537$ 1,599,707$ 2,606,595$ 1,054,255$ 1,258,003$ 861,219$ 1,000,678$ 688,975$ 19,055,549$
Medical Insurance/Injury Claims 770,646$ 15,781$ 3,862$ 102,427$ 118,216$ 250,222$ 120,996$ 133,785$ 76,565$ 163,029$ 1,755,529$
Travel 7,507,853$ 1,618,826$ 995,299$ 718,550$ 1,111,319$ 309,860$ 231,117$ 432,450$ 271,861$ 263,049$ 13,460,184$
Equipment 1,586,522$ -$ 5,843$ 25,403$ 40,585$ 4,022$ 1,928$ 20,835$ -$ 4,222$ 1,689,360$
Concessions/Programs 672,618$ -$ -$ -$ 4,840$ -$ 14,794$ 16,985$ -$ -$ 709,237$
M & O 10,866,267$ 1,800,014$ 807,987$ 965,911$ 883,606$ 293,909$ 200,990$ 214,954$ 297,703$ 315,993$ 16,647,334$
Facilities 7,468,896$ 697,797$ 42,960$ 24,649$ 478,644$ 250,219$ 134,273$ 120,001$ 27,459$ 250,483$ 9,495,381$
Debt Service 7,613,929$ -$ -$ 2,148,291$ 403,821$ 265,680$ -$ 87,440$ -$ 127,729$ 10,646,890$
Other Expenses -$ -$ -$ -$ 50,902$ 32,379$ -$ -$ -$ 32,661$ 115,942$
Transfers to Other Funds/Accounts 1,621,272$ -$ -$ -$ -$ -$ -$ -$ 148,107$ -$ 1,769,379$
Total Expenditures for Athletics 67,833,516$ 11,614,098$ 6,218,668$ 7,543,664$ 8,053,259$ 3,674,836$ 3,172,493$ 2,808,514$ 2,854,301$ 2,730,164$ 116,503,513$
INSTITUTIONS
REVENUES
OTHER FINANCING SOURCES
EXPENDITURES
OTHER FINANCING
USES

148 Back to Table of Contents
TABLE 6.4B – SUMMARY OF INTERCOLLEGIATE ATHLETIC REVENUES AND EXPENDITURES FOR COLLEGES: 2009-10
NAC 2-yr TOTAL GRAND TOTAL
Ticket Sales 7,276$ 7,276$ 35,815,571$
Media/Tournament/Bowl -$ -$ 20,124,145$
Concessions/Program Sales -$ -$ 1,056,500$
Game Guarantees -$ -$ 4,053,055$
Foundations/Clubs & Other Private Gifts -$ -$ 7,306,484$
Student Athletic Fees -$ -$ 19,148,316$
Other Income 3,600$ 3,600$ 11,372,534$
CWSP Federally Funded Portion -$ -$ 237,848$
CWSP Fed. Portion as % Total CWSP 0.0% 0.0% 91.7%
Other Auxiliary Profits 144,143$ 144,143$ 10,423,688$
Transfers from Unrestricted E&G 134,694$ 134,694$ 8,580,928$ T ransfers from Other Funds/Balance Forward (Inclusive of Interfund Borrowing) 121$ 121$ 123,040$
Total Revenues for Athletics 289,834$ 289,834$ 118,242,109$
Salaries 70,568$ 70,568$ 27,950,575$
Budgeted FTE Positions 2 2 537
Fringe Benefits 19,916$ 19,916$ 7,034,421$
Fringe Benefits as a % of Salaries 28.2% 28.2% 25.2%
Extra Help 8,407$ 8,407$ 2,635,481$
CWSP -$ -$ 259,338$
Game Guarantees -$ -$ 3,377,804$
Athletic Scholarships 45,342$ 45,342$ 19,100,891$
Medical Insurance/Injury Claims 10,884$ 10,884$ 1,766,413$
Travel 61,635$ 61,635$ 13,521,819$
Equipment -$ -$ 1,689,360$
Concessions/Programs -$ -$ 709,237$
M & O 8,864$ 8,864$ 16,656,198$
Facilities 27,749$ 27,749$ 9,523,130$
Debt Service -$ -$ 10,646,890$
Other Expenses 36,469$ 36,469$ 152,411$
-$ -$ -$ T ransfers to Other Funds/Accounts
Total Expenditures for Athletics 289,834$ 289,834$ 116,793,347$
OTHER FINANCING
USES
INSTITUTIONS
EXPENDITURES
OTHER FINANCING SOURCES
REVENUES

149 Back to Table of Contents
TABLE 6.5A – SUMMARY OF INTERCOLLEGIATE ATHLETIC REVENUES AND EXPENDITURES FOR UNIVERSITIES: 2010-11
UAF ASUJ UALR UAPB UCA ATU HSU SAUM UAFS UAM 4-yr TOTAL
Ticket Sales 35,931,551$ 838,231$ 439,331$ 514,416$ 412,341$ 229,147$ 46,902$ 26,341$ 19,584$ 33,134$ 38,490,978$
Media/Tournament/Bowl 21,704,940$ 33,950$ 301,567$ 65,424$ 8,536$ 52,570$ 33,893$ -$ 6,200$ 22,207,080$
Concessions/Program Sales 786,614$ 74,750$ 2,518$ 14,631$ 22,340$ -$ 20,083$ 15,562$ 47,509$ 984,007$
Game Guarantees 51,700$ 2,792,250$ 66,000$ 1,140,043$ 415,750$ 700$ 65,000$ 49,000$ 27,500$ 131,500$ 4,739,443$
Foundations/Clubs & Other Private Gifts 7,686,745$ 34,506$ 62,595$ 16,500$ 220,433$ 47,862$ 42,945$ -$ 73,613$ 8,185,198$
Student Athletic Fees -$ 2,899,905$ 4,055,144$ 1,199,943$ 5,053,343$ 2,650,302$ 1,209,524$ 1,076,296$ 2,545,185$ 730,631$ 21,420,273$
Other Income 8,969,985$ 1,323,227$ 506,985$ 464,579$ 80,098$ 39,342$ -$ 28,120$ 16,546$ 17,027$ 11,445,909$
CWSP Federally Funded Portion 34,237$ -$ -$ -$ 113,568$ 16,653$ -$ -$ -$ 37,842$ 202,300$
CWSP Fed. Portion as % Total CWSP 80.0% 0.0% 0.0% 0.0% 100.0% 75.0% 0.0% 0.0% 0.0% 100.0% 85.1%
Other Auxiliary Profits -$ 2,296,922$ -$ 1,438,350$ 1,375,481$ -$ 936,615$ 538,319$ -$ 1,208,337$ 7,794,024$
Transfers from Unrestricted E&G -$ 1,142,715$ 949,859$ 1,078,234$ 1,142,715$ 1,124,400$ 1,142,715$ 1,142,715$ -$ 857,400$ 8,580,753$ T ransfers from Other Funds/Balance Forward -$ -$ -$ -$ -$ -$ -$ -$ 199,259$ -$ 199,259$
Total Revenues for Athletics 75,165,772$ 11,436,456$ 6,383,999$ 5,932,120$ 8,844,605$ 4,160,976$ 3,497,677$ 2,876,353$ 2,935,395$ 3,015,871$ 124,249,224$
Salaries 17,836,158$ 2,832,841$ 2,060,402$ 1,564,166$ 1,928,725$ 810,085$ 947,764$ 562,369$ 795,263$ 676,633$ 30,014,407$
Budgeted FTE Positions 250 65 41 37 39 21 21 13 17 14 518
Fringe Benefits 3,967,162$ 825,140$ 515,446$ 437,170$ 600,876$ 252,124$ 289,438$ 231,845$ 266,022$ 227,100$ 7,612,323$
Fringe Benefits as a % of Salaries 22.2% 29.1% 25.0% 27.9% 31.2% 31.1% 30.5% 41.2% 33.5% 33.6% 25.4%
Extra Help 1,597,302$ 211,620$ 112,361$ 96,963$ 314,284$ 173,629$ -$ 164,479$ 69,193$ 61,025$ 2,800,856$
CWSP 42,796$ -$ -$ -$ 113,568$ 22,205$ 19,678$ 1,715$ -$ 37,842$ 237,804$
Game Guarantees 2,598,328$ 504,395$ -$ -$ 68,500$ 22,050$ -$ -$ 11,300$ 5,629$ 3,210,202$
Athletic Scholarships 5,748,554$ 3,255,905$ 1,806,633$ 1,527,123$ 2,696,233$ 1,153,207$ 1,404,146$ 862,471$ 1,009,175$ 710,365$ 20,173,812$
Medical Insurance/Injury Claims 886,981$ 12,198$ 14,608$ 124,746$ 114,281$ 366,195$ 127,472$ 159,506$ 56,257$ 231,012$ 2,093,256$
Travel 9,401,245$ 1,859,438$ 1,056,452$ 727,236$ 1,140,164$ 306,404$ 195,130$ 389,004$ 308,408$ 229,354$ 15,612,835$
Equipment 395,304$ -$ 74,261$ 66,791$ 43,745$ -$ 70,352$ 1,375$ -$ -$ 651,828$
Concessions/Programs -$ -$ -$ -$ -$ -$ -$ 15,171$ 37,059$ 52,230$
M & O 10,994,088$ 1,580,919$ 677,090$ 748,857$ 857,208$ 299,261$ 347,844$ 277,231$ 240,388$ 397,965$ 16,420,851$
Facilities 12,335,632$ 354,000$ 56,746$ 51,363$ 475,247$ 270,170$ 95,853$ 126,511$ 66,509$ 278,053$ 14,110,084$
Debt Service 7,466,434$ -$ -$ 587,705$ 420,826$ 269,860$ -$ 84,676$ -$ 127,427$ 8,956,928$
Other Expenses -$ -$ -$ -$ 51,245$ 47,212$ -$ -$ -$ 33,466$ 131,923$
Transfers to Other Funds/Accounts 1,635,772$ -$ -$ -$ -$ -$ -$ -$ 75,821$ -$ 1,711,593$
Total Expenditures for Athletics 74,905,756$ 11,436,456$ 6,373,999$ 5,932,120$ 8,824,901$ 3,992,402$ 3,497,677$ 2,876,353$ 2,935,395$ 3,015,871$ 123,790,930$
INSTITUTIONS
REVENUES
OTHER FINANCING SOURCES
EXPENDITURES
OTHER FINANCING
USES

150 Back to Table of Contents
TABLE 6.5B – SUMMARY OF INTERCOLLEGIATE ATHLETIC REVENUES AND EXPENDITURES FOR COLLEGES: 2010-11
NAC MSCC 2-yr TOTAL GRAND TOTAL
Ticket Sales 7,195$ 3,745$ 10,940$ 38,501,918$
Media/Tournament/Bowl -$ -$ -$ 22,207,080$
Concessions/Program Sales -$ -$ -$ 984,007$
Game Guarantees -$ -$ -$ 4,739,443$
Foundations/Clubs & Other Private Gifts -$ 25,000$ 25,000$ 8,210,198$
Student Athletic Fees -$ -$ -$ 21,420,273$
Other Income 3,725$ -$ 3,725$ 11,449,634$
CWSP Federally Funded Portion -$ -$ -$ 202,300$
CWSP Fed. Portion as % Total CWSP 0.0% 0.0% 0.0% 85.1%
Other Auxiliary Profits 157,728$ -$ 157,728$ 7,951,752$
Transfers from Unrestricted E&G 136,831$ 96,593$ 233,424$ 8,814,177$ T ransfers from Other Funds/Balance Forward (Inclusive of Interfund Borrowing) -$ -$ -$ 199,259$
Total Revenues for Athletics 305,479$ 305,479$ 124,554,703$
Salaries 77,419$ 10,436$ 87,855$ 30,102,262$
Budgeted FTE Positions 2 0 2$ 521
Fringe Benefits 19,729$ 7,709$ 27,438$ 7,639,761$
Fringe Benefits as a % of Salaries 25.5% 73.9% 31.2% 25.4%
Extra Help 1,045$ 42,383$ 43,428$ 2,844,284$
CWSP -$ -$ -$ 237,804$
Game Guarantees -$ -$ -$ 3,210,202$
Athletic Scholarships 54,022$ -$ 54,022$ 20,227,834$
Medical Insurance/Injury Claims 9,483$ 80$ 9,563$ 2,102,819$
Travel 49,646$ 22,838$ 72,484$ 15,685,319$
Equipment -$ -$ -$ 651,828$
Concessions/Programs -$ -$ -$ 52,230$
M & O 17,281$ 32,587$ 49,868$ 16,470,719$
Facilities 27,771$ 9,336$ 37,107$ 14,147,191$
Debt Service -$ -$ -$ 8,956,928$
Other Expenses 49,083$ -$ 49,083$ 181,006$
-$ -$ -$ -$ T ransfers to Other Funds/Accounts
Total Expenditures for Athletics 305,479$ 125,369$ 430,848$ 124,221,778$
OTHER FINANCING SOURCES
INSTITUTIONS
OTHER FINANCING
USES
EXPENDITURES
REVENUES

151 Back to Table of Contents
TABLE 6.6A – SUMMARY OF INTERCOLLEGIATE ATHLETIC REVENUES AND EXPENDITURES FOR UNIVERSITIES: 2011-2012
UAF ASUJ UALR UAPB UCA ATU HSU SAUM UAFS UAM 4-yr TOTAL
Ticket Sales 38,167,868$ 1,296,962$ 465,696$ 580,759$ 417,505$ 195,587$ 27,446$ 27,605$ 22,354$ 35,874$ 41,237,655$
Media/Tournament/Bowl 22,220,951$ 333,375$ 310,685$ -$ 74,473$ -$ 12,991$ -$ -$ -$ 22,952,475$
Concessions/Program Sales 973,728$ 97,330$ 11,951$ 81,626$ 17,277$ -$ 20,522$ 9,433$ 44,699$ -$ 1,256,566$
Game Guarantees 13,500$ 2,245,200$ 104,570$ 853,449$ 814,805$ 36,000$ 98,250$ 253$ 11,800$ 75,308$ 4,253,135$
Foundations/Clubs & Other Private Gifts 9,460,978$ 84,237$ 308,696$ -$ 276,825$ 81,166$ 7,234$ -$ 38,491$ -$ 10,257,627$
Student Athletic Fees -$ 3,521,922$ 4,295,375$ 1,175,220$ 4,973,184$ 2,873,863$ 1,210,341$ 1,159,872$ 2,666,434$ 790,993$ 22,667,204$
Other Income 10,953,741$ 1,545,768$ 463,596$ 242,699$ 154,605$ 46,190$ 9,395$ 26,715$ 42,334$ 14,144$ 13,499,187$
CWSP Federally Funded Portion 9,700$ -$ -$ -$ 92,466$ 12,642$ -$ -$ -$ 48,604$ 163,412$
CWSP Fed. Portion as % Total CWSP 80.0% 0.0% 0.0% 0.0% 100.0% 75.0% 0.0% 0.0% 0.0% 100.0% 83.7%
Other Auxiliary Profits -$ 2,816,638$ -$ 2,265,192$ 1,462,407$ -$ 1,016,154$ 601,861$ 308,530$ 1,726,818$ 10,197,599$
Transfers from Unrestricted E&G -$ 1,154,142$ 1,118,625$ 1,078,234$ 1,154,142$ 1,124,400$ 1,154,142$ 1,154,142$ -$ 600,000$ 8,537,827$ T ransfers from Other Funds/Balance Forward -$ -$ -$ -$ -$ -$ -$ -$ -$ -$ -$
Total Revenues for Athletics 81,800,466$ 13,095,573$ 7,079,194$ 6,277,179$ 9,437,688$ 4,369,848$ 3,556,475$ 2,979,881$ 3,134,642$ 3,291,741$ 135,022,687$
Salaries 18,911,990$ 3,108,693$ 2,264,772$ 1,580,454$ 2,058,933$ 885,128$ 937,717$ 583,053$ 852,900$ 689,418$ 31,873,058$
Budgeted FTE Positions 253 67 41 42 42 22 20 13 19 15 533
Fringe Benefits 4,939,636$ 890,677$ 564,623$ 483,607$ 632,908$ 282,122$ 308,504$ 221,937$ 250,147$ 229,380$ 8,803,541$
Fringe Benefits as a % of Salaries 26.1% 28.7% 24.9% 30.6% 30.7% 31.9% 32.9% 38.1% 29.3% 33.3% 27.6%
Extra Help 1,849,759$ 259,099$ 152,257$ 134,922$ 241,162$ 153,547$ -$ 181,277$ 61,216$ 54,604$ 3,087,843$
CWSP 12,125$ -$ -$ -$ 92,466$ 16,856$ 21,055$ 4,209$ -$ 48,604$ 195,315$
Game Guarantees 3,574,319$ 590,010$ -$ -$ 177,550$ 13,500$ -$ -$ 13,500$ 3,000$ 4,371,879$
Athletic Scholarships 6,031,738$ 3,462,575$ 1,876,239$ 1,627,288$ 2,850,844$ 1,233,263$ 1,457,985$ 965,103$ 1,038,968$ 786,946$ 21,330,949$
Medical Insurance/Injury Claims 898,388$ 11,957$ 21,105$ 141,050$ 125,966$ 394,938$ -$ 180,546$ 55,179$ 310,460$ 2,139,589$
Travel 9,349,452$ 1,988,849$ 1,005,414$ 710,404$ 1,311,588$ 315,857$ 244,698$ 383,239$ 427,043$ 222,876$ 15,959,420$
Equipment 607,753$ 33,562$ 28,582$ 13,684$ 5,179$ -$ 36,498$ 8,250$ -$ -$ 733,509$
Concessions/Programs -$ -$ -$ -$ -$ -$ -$ 13,740$ 33,399$ -$ 47,139$
M & O 11,414,259$ 1,846,764$ 864,714$ 940,493$ 894,794$ 319,076$ 426,064$ 234,311$ 242,306$ 474,887$ 17,657,668$
Facilities 15,110,133$ 873,925$ 225,454$ 68,822$ 389,990$ 289,009$ 105,078$ 114,199$ 76,272$ 301,544$ 17,554,426$
Debt Service 6,711,354$ 29,461$ 76,034$ 571,106$ 374,455$ 195,649$ -$ 90,016$ -$ 105,308$ 8,153,383$
Other Expenses 1,829,223$ -$ -$ 5,349$ 51,855$ 44,935$ 18,876$ -$ 73,213$ 64,714$ 2,088,165$
Transfers to Other Funds/Accounts -$ -$ -$ 230,000$ -$ -$ -$ 10,499$ -$ 240,499$
Total Expenditures for Athletics 81,240,129$ 13,095,573$ 7,079,194$ 6,277,179$ 9,437,688$ 4,143,880$ 3,556,475$ 2,979,881$ 3,134,642$ 3,291,741$ 134,236,381$
OTHER FINANCING SOURCES
INSTITUTIONS
REVENUES
EXPENDITURES
OTHER FINANCING
USES

152 Back to Table of Contents
TABLE 6.6B – SUMMARY OF INTERCOLLEGIATE ATHLETIC REVENUES AND EXPENDITURES FOR COLLEGES: 2011-12
CCCUA NAC MSCC 2-yr TOTAL GRAND TOTAL
Ticket Sales -$ 10,750$ 1,379$ 12,129$ 41,249,784$
Media/Tournament/Bowl -$ -$ -$ -$ 22,952,475$
Concessions/Program Sales 18,368$ -$ -$ 18,368$ 1,274,934$
Game Guarantees -$ -$ 600$ 600$ 4,253,735$
Foundations/Clubs & Other Private Gifts -$ -$ 25,000$ 25,000$ 10,282,627$
Student Athletic Fees -$ -$ -$ -$ 22,667,204$
Other Income -$ 1,960$ -$ 1,960$ 13,501,147$
CWSP Federally Funded Portion -$ -$ -$ -$ 163,412$
CWSP Fed. Portion as % Total CWSP 0.0% 0.0% 0.0% 0.0% 83.7%
Other Auxiliary Profits -$ 172,710$ -$ 172,710$ 172,710$
Transfers from Unrestricted E&G 22,654$ 130,851$ 94,006$ 247,511$ 247,511$ T ransfers from Other Funds/Balance Forward (Inclusive of Interfund Borrowing) -$ -$ -$ -$ -$
Total Revenues for Athletics 41,022$ 316,271$ 120,985$ 478,278$ 135,500,965$
Salaries 14,645$ 79,534$ 36,217$ 130,400$ 32,003,458$
Budgeted FTE Positions 1 2 1 30,602$ 31,136$
Fringe Benefits 1,274$ 20,360$ 8,964$ 30,599$ 8,834,140$
Fringe Benefits as a % of Salaries 8.7% 25.6% 24.8% 23.5% 27.6%
Extra Help -$ 150$ 14,620$ 14,770$ 3,102,613$
CWSP -$ -$ -$ -$ 195,315$
Game Guarantees -$ -$ -$ -$ 4,371,879$
Athletic Scholarships -$ 45,977$ -$ 45,977$ 21,376,926$
Medical Insurance/Injury Claims -$ 22,998$ 6,080$ 29,078$ 2,168,667$
Travel 5,097$ 54,899$ 30,200$ 90,196$ 16,049,616$
Equipment -$ -$ -$ -$ 733,509$
Concessions/Programs 295$ -$ -$ 295$ 47,434$
M & O 19,711$ 17,318$ 17,336$ 54,365$ 17,712,033$
Facilities -$ 30,752$ 7,568$ 38,320$ 17,592,746$
Debt Service -$ -$ -$ -$ 8,153,383$
Other Expenses -$ 44,283$ -$ 44,283$ 2,132,448$
-$ -$ -$ -$ 240,499$ T ransfers to Other Funds/Accounts
Total Expenditures for Athletics 41,022$ 316,271$ 120,985$ 478,278$ 134,714,659$
OTHER FINANCING
USES
EXPENDITURES
REVENUES
OTHER FINANCING SOURCES
INSTITUTIONS

153 Back to Table of Contents
TABLE 6.7A – SUMMARY OF INTERCOLLEGIATE ATHLETIC REVENUES AND EXPENDITURES FOR UNIVERSITIES: 2012-13
ASUJ ATU HSU SAUM UAF UAFS UALR UAM UAPB UCA 4-yr TOTAL
Ticket Sales 1,397,515$ 203,398$ 58,208$ 28,389$ 39,062,932$ 25,110$ 434,357$ 35,235$ 420,729$ 463,136$ 42,129,009$
Media/Tournament/Bowl 382,550$ -$ 23,690$ -$ 22,289,859$ 1,500$ 336,944$ -$ -$ 74,461$ 23,109,004$
Concessions/Program Sales 162,761$ -$ 2,620$ 3,766$ 1,131,515$ 38,616$ 3,505$ -$ 59,904$ 19,312$ 1,421,999$
Game Guarantees 2,252,000$ 10,500$ 12,000$ 28,000$ 7,000$ 11,000$ 181,000$ 54,500$ 768,365$ 755,500$ 4,079,865$
Foundations/Clubs & Other Private Gifts 303,389$ 52,796$ 8,729$ 50$ 13,726,954$ 18,758$ 497,925$ -$ 2,025$ 245,433$ 14,856,059$
Student Athletic Fees 4,567,745$ 3,188,142$ 1,363,089$ 1,119,832$ -$ 2,774,885$ 4,260,729$ 735,302$ 1,016,673$ 4,913,412$ 23,939,809$
Other Income 1,349,731$ 191,287$ 4,802$ 21,200$ 12,159,916$ 73,717$ 448,377$ 13,936$ 218,188$ 1,037,453$ 15,518,607$
CWSP Federally Funded Portion -$ 8,790$ -$ -$ 22,474$ -$ -$ 40,223$ -$ 98,830$ 170,317$
CWSP Fed. Portion as % Total CWSP 0.0% 75.0% 0.0% 0.0% 80.0% 0.0% 0.0% 100.0% 0.0% 100.0% 83.7%
Other Auxiliary Profits 3,221,095$ -$ 855,683$ 702,045$ -$ 529,981$ -$ 1,248,995$ 2,649,584$ 1,563,989$ 10,771,372$
Transfers from Unrestricted E&G 1,180,687$ 1,180,687$ 1,180,687$ 1,180,687$ -$ -$ 1,039,529$ 750,000$ 1,138,234$ 1,069,387$ 8,719,898$ T ransfers from Other Funds/Balance Forward -$ -$ -$ -$ -$ -$ -$ 635,790$ -$ -$ 635,790$
-$ -$ -$ -$ -$ -$ -$ -$ -$ -$
Total Revenues for Athletics 14,817,473$ 4,835,600$ 3,509,508$ 3,083,969$ 88,400,650$ 3,473,567$ 7,202,366$ 3,513,981$ 6,273,702$ 10,240,914$ 145,351,730$
Salaries 3,339,694$ 998,077$ 876,574$ 619,777$ 21,766,301$ 949,519$ 2,428,651$ 777,915$ 1,749,275$ 2,091,644$ 35,597,427$
Budgeted FTE Positions 67 18 19 13 255 0 42 18 35 41 508
Fringe Benefits 961,218$ 310,055$ 335,613$ 173,562$ 5,496,968$ 279,470$ 642,207$ 284,916$ 480,089$ 637,752$ 9,601,850$
Fringe Benefits as a % of Salaries 28.8% 31.1% 38.3% 28.0% 25.3% 29.4% 26.4% 36.6% 27.4% 30.5% 27.0%
Extra Help 279,704$ 162,633$ 130,574$ 182,165$ 1,846,766$ 66,135$ 291,709$ 48,065$ 89,217$ 255,321$ 3,352,289$
CWSP -$ 11,719$ 22,864$ 1,653$ 28,093$ -$ -$ 40,223$ -$ 98,830$ 203,382$
Game Guarantees 774,073$ 41,600$ -$ 1,000$ 3,589,684$ 10,500$ -$ 4,500$ -$ 217,800$ 4,639,157$
Athletic Scholarships 3,801,816$ 1,299,581$ 1,415,307$ 983,285$ 6,316,333$ 1,030,477$ 1,936,713$ 888,298$ 1,688,525$ 3,185,815$ 22,546,150$
Medical Insurance/Injury Claims 16,796$ 199,538$ 92,097$ 209,131$ 871,636$ 53,343$ 8,370$ 298,071$ 100,350$ 153,408$ 2,002,740$
Travel 2,374,055$ 303,010$ 288,621$ 385,963$ 8,806,518$ 403,984$ 919,336$ 293,047$ 777,276$ 1,399,948$ 15,951,758$
Equipment 42,918$ 12,706$ 16,127$ 13,855$ 360,531$ -$ 30,516$ -$ 9,208$ 11,774$ 497,635$
Concessions/Programs -$ -$ -$ 15,912$ -$ 38,616$ -$ -$ -$ -$ 54,528$
M & O 2,386,842$ 285,427$ 181,376$ 281,848$ 12,040,948$ 267,842$ 663,787$ 375,397$ 749,266$ 924,011$ 18,156,744$
Facilities 810,895$ 307,730$ 150,355$ 127,254$ 11,633,485$ 267,092$ 188,913$ 322,108$ 56,000$ 600,785$ 14,464,617$
Debt Service 29,461$ 253,156$ -$ 88,564$ 9,806,660$ -$ 76,054$ 130,328$ 574,496$ 406,235$ 11,364,954$
Other Expenses -$ 107,569$ -$ -$ -$ 106,589$ 16,110$ 51,113$ -$ 48,682$ 330,063$
Transfers to Other Funds/Accounts -$ -$ -$ -$ 5,297,109$ -$ -$ -$ -$ 208,909$ 5,506,018$
Total Expenditures for Athletics 14,817,473$ 4,292,801$ 3,509,508$ 3,083,969$ 87,861,032$ 3,473,567$ 7,202,366$ 3,513,981$ 6,273,702$ 10,240,914$ 144,269,312$
OTHER FINANCING
USES
EXPENDITURES
INSTITUTIONS
REVENUES
OTHER FINANCING SOURCES

154 Back to Table of Contents
TABLE 6.7B – SUMMARY OF INTERCOLLEGIATE ATHLETIC REVENUES AND EXPENDITURES FOR COLLEGES: 2012-13
CCCUA MSCC NAC 2-yr TOTAL GRAND TOTAL
Ticket Sales -$ -$ 11,373$ 11,373$ 42,140,382$
Media/Tournament/Bowl -$ -$ -$ -$ 23,109,004$
Concessions/Program Sales 10,858$ -$ -$ 10,858$ 1,432,857$
Game Guarantees -$ -$ -$ -$ 4,079,865$
Foundations/Clubs & Other Private Gifts -$ 54,173$ -$ 54,173$ 14,910,232$
Student Athletic Fees -$ -$ -$ -$ 23,939,809$
Other Income -$ -$ -$ -$ 15,518,607$
CWSP Federally Funded Portion -$ -$ -$ -$ 170,317$
CWSP Fed. Portion as % Total CWSP 0.0% 0.0% 0.0% 0.0% 1$
Other Auxiliary Profits -$ -$ 119,013$ 119,013$ 10,890,385$
Transfers from Unrestricted E&G 35,305$ 105,599$ 150,335$ 291,239$ 9,011,137$
Prior Year Fund Balance -$ -$ -$ -$ 635,790$ T ransfers from Other Funds/Balance Forward (Inclusive of Interfund Borrowing) -$ -$ -$ -$ -$
Total Revenues for Athletics 46,163$ 159,772$ 280,721$ 486,656$ 145,838,386$
Salaries 13,828$ 39,099$ 63,443$ 116,370$ 35,713,797$
Budgeted FTE Positions 1 1 2 3$ 511$
Fringe Benefits 4,094$ 9,368$ 14,234$ 27,696$ 9,629,546$
Fringe Benefits as a % of Salaries 29.61% 23.96% 22.44% 23.80% 27.0%
Extra Help -$ 13,259$ 481$ 13,740$ 13,740$
CWSP -$ -$ -$ -$ 203,382$
Game Guarantees -$ -$ -$ -$ -$
Athletic Scholarships -$ 29,173$ 56,766$ 85,939$ 22,632,089$
Medical Insurance/Injury Claims -$ 7,381$ 20,890$ 28,271$ 2,031,011$
Travel 6,338$ 32,700$ 42,164$ 81,202$ 16,032,960$
Equipment -$ -$ -$ -$ 497,635$
Concessions/Programs 500$ -$ -$ 500$ 55,028$
M & O 19,718$ 18,019$ 57,223$ 94,960$ 18,251,704$
Facilities 1,685$ 10,773$ 25,520$ 37,978$ 14,502,595$
Debt Service -$ -$ -$ -$ 11,364,954$
Other Expenses -$ -$ -$ -$ 330,063$
-$ -$ -$ -$ 5,506,018$ -$ -$ -$ -$
Total Expenditures for Athletics 46,163$ 159,772$ 280,721$ 486,656$ 144,755,968$
EXPENDITURES
OTHER FINANCING
USES T ransfers to Other Funds/Accounts
INSTITUTIONS
REVENUES
OTHER FINANCING SOURCES

155 Back to Table of Contents
TABLE 6.8A – SUMMARY OF INTERCOLLEGIATE ATHLETIC REVENUES AND EXPENDITURES FOR UNIVERSITIES: 2013-14
ASUJ ATU HSU SAUM UAF UAFS UALR UAM UAPB UCA 4-yr TOTAL
Ticket Sales 1,455,567$ 207,105$ 78,963$ 33,097$ 34,284,320$ 35,208$ 377,280$ 34,407$ 583,277$ 426,030$ 37,515,254$
Media/Tournament/Bowl 293,639$ -$ -$ -$ 21,681,751$ -$ 580,009$ -$ -$ 38,076$ 22,593,475$
Concessions/Program Sales 120,346$ -$ 2,692$ 17,975$ 996,231$ 43,831$ 421$ -$ 13,683$ 12,690$ 1,207,869$
Game Guarantees 1,921,000$ 53,250$ 17,000$ 19,700$ 364,725$ 24,000$ 263,315$ 11,700$ 613,189$ 661,000$ 3,948,879$
Foundations/Clubs & Other Private Gifts 445,250$ 31,037$ 140,998$ -$ 11,796,980$ 16,965$ 373,078$ -$ 184$ 251,219$ 13,055,711$
Student Athletic Fees 4,629,080$ 3,072,675$ 1,540,020$ 1,127,098$ -$ 2,865,142$ 4,202,794$ 700,902$ 952,738$ 4,838,092$ 23,928,541$
Other Income 1,805,453$ 170,101$ 16,915$ 28,063$ 12,710,577$ 52,764$ 480,820$ 23,222$ 322,616$ 1,118,749$ 16,729,279$
CWSP Federally Funded Portion -$ 8,769$ -$ 63,096$ 11,710$ -$ -$ 45,476$ -$ 113,877$ 242,928$
CWSP Fed. Portion as % Total CWSP 0.0% 75.0% 0.0% 39.6% 80.0% 0.0% 0.0% 100.0% 0.0% 100.0% 66.4%
Other Auxiliary Profits 3,642,392$ -$ 766,523$ 731,038$ -$ 541,428$ -$ 1,389,390$ 2,281,989$ 2,783,324$ 12,136,084$
Transfers from Unrestricted E&G 1,214,927$ 1,390,687$ 1,214,927$ 1,214,927$ -$ -$ 1,171,233$ 1,075,000$ 1,138,234$ 1,000,000$ 9,419,935$ T ransfers from Other Funds/Balance Forward -$ -$ -$ -$ -$ -$ -$ -$ 949,182$ -$ 949,182$
-$ -$ -$ -$ -$ -$ -$ -$ -$ -$
Total Revenues for Athletics 15,527,654$ 4,933,624$ 3,778,038$ 3,234,994$ 81,846,294$ 3,579,338$ 7,448,950$ 3,280,097$ 6,855,092$ 11,243,057$ 141,727,137$
Salaries 3,694,953$ 1,086,790$ 997,206$ 668,228$ 24,278,774$ 958,989$ 2,553,288$ 823,544$ 1,765,104$ 2,523,177$ 39,350,052$
Budgeted FTE Positions 69 24 19 15 272 18 41 19 36 42 554
Fringe Benefits 1,088,060$ 333,691$ 332,629$ 187,503$ 5,658,315$ 301,577$ 617,649$ 260,633$ 480,867$ 783,576$ 10,044,500$
Fringe Benefits as a % of Salaries 29.4% 30.7% 33.4% 28.1% 23.3% 31.4% 24.2% 31.6% 27.2% 31.1% 25.5%
Extra Help 331,943$ 158,869$ 12,445$ 162,653$ 2,008,986$ 82,345$ 337,672$ 38,298$ 70,420$ 213,989$ 3,417,620$
CWSP -$ 11,692$ 20,873$ 159,214$ 14,638$ -$ -$ 45,476$ -$ 113,877$ 365,771$
Game Guarantees 635,969$ 10,300$ -$ -$ 3,319,072$ 11,500$ -$ -$ -$ 128,000$ 4,104,841$
Athletic Scholarships 4,159,503$ 1,334,116$ 1,506,319$ 1,060,559$ 6,932,224$ 1,098,599$ 1,969,282$ 997,101$ 1,739,422$ 3,351,709$ 24,148,834$
Medical Insurance/Injury Claims 19,679$ 280,041$ 106,410$ 94,658$ 1,150,297$ 53,848$ -$ 224,486$ -$ 245,461$ 2,174,880$
Travel 2,702,121$ 391,025$ 332,432$ 411,927$ 9,039,928$ 364,256$ 891,820$ 271,276$ 643,320$ 1,409,150$ 16,457,255$
Equipment 24,456$ 66,266$ 21,724$ 15,067$ 762,832$ -$ 47,697$ -$ 11,470$ 5,375$ 954,887$
Concessions/Programs -$ -$ -$ 15,499$ -$ 41,981$ -$ -$ -$ -$ 57,480$
M & O 2,487,509$ 315,824$ 289,637$ 242,393$ 11,854,283$ 243,609$ 722,188$ 363,258$ 868,115$ 1,094,925$ 18,481,740$
Facilities 354,000$ 274,280$ 158,363$ 130,225$ 6,016,014$ 298,810$ 162,781$ 89,977$ 65,454$ 544,740$ 8,094,644$
Debt Service 29,461$ 254,748$ -$ 87,068$ 9,406,393$ -$ 75,931$ 120,129$ 1,210,920$ 628,604$ 11,813,254$
Other Expenses -$ 134,072$ -$ -$ -$ 123,824$ -$ 45,919$ -$ 57,065$ 360,880$
Transfers to Other Funds/Accounts -$ -$ -$ -$ 774,902$ -$ 70,642$ -$ -$ 143,409$ 988,953$
Total Expenditures for Athletics 15,527,654$ 4,651,714$ 3,778,038$ 3,234,994$ 81,216,658$ 3,579,338$ 7,448,950$ 3,280,097$ 6,855,092$ 11,243,057$ 140,815,591$
OTHER FINANCING
USES
EXPENDITURES
INSTITUTIONS
REVENUES
OTHER FINANCING SOURCES

156 Back to Table of Contents
TABLE 6.8B – SUMMARY OF INTERCOLLEGIATE ATHLETIC REVENUES AND EXPENDITURES FOR COLLEGES: 2013-14
CCCUA MSCC NAC 2-yr TOTAL GRAND TOTAL
Ticket Sales -$ -$ 11,373$ 11,373$ 37,526,627$
Media/Tournament/Bowl -$ -$ -$ -$ 22,593,475$
Concessions/Program Sales 22,422$ -$ -$ 22,422$ 1,230,291$
Game Guarantees -$ -$ -$ -$ 3,948,879$
Foundations/Clubs & Other Private Gifts -$ 63,500$ -$ 63,500$ 13,119,211$
Student Athletic Fees -$ -$ -$ -$ 23,928,541$
Other Income -$ -$ -$ -$ 16,729,279$
CWSP Federally Funded Portion -$ -$ -$ -$ 242,928$
CWSP Fed. Portion as % Total CWSP 0.0% 0.0% 0.0% 0.0% 66.4%
Other Auxiliary Profits -$ -$ 137,560$ -$ 12,136,084$
Transfers from Unrestricted E&G 53,075$ 130,774$ 111,700$ 130,774$ 9,550,709$
Prior Year Fund Balance -$ -$ -$ 949,182$ T ransfers from Other Funds/Balance Forward (Inclusive of Interfund Borrowing) -$ -$ -$ -$ -$
Total Revenues for Athletics 75,497$ 194,274$ 260,633$ 530,404$ 142,257,541$
Salaries 19,805$ 55,430$ 46,330$ 121,565$ 39,471,617$
Budgeted FTE Positions 1 1 1 3$ 557$
Fringe Benefits 6,665$ 15,720$ 8,596$ 30,981$ 10,075,481$
Fringe Benefits as a % of Salaries 33.7% 28.4% 18.6% 25.5% 25.5%
Extra Help -$ 6,202$ 4,211$ 10,413$ 3,428,033$
CWSP -$ -$ -$ -$ 365,771$
Game Guarantees -$ -$ -$ -$ 4,104,841$
Athletic Scholarships -$ 38,500$ 54,669$ 93,169$ 24,242,003$
Medical Insurance/Injury Claims -$ 7,989$ 22,040$ 30,029$ 2,204,909$
Travel 11,480$ 23,727$ 38,526$ 73,733$ 16,530,988$
Equipment -$ 7,114$ -$ 7,114$ 962,001$
Concessions/Programs -$ -$ -$ -$ 57,480$
M & O 37,547$ 38,771$ 62,567$ 138,885$ 18,620,625$
Facilities -$ 820$ 23,694$ 24,514$ 8,119,158$
Debt Service -$ -$ -$ -$ 11,813,254$
Other Expenses -$ 360,880$
-$ 988,953$ T ransfers to Other Funds/Accounts
Total Expenditures for Athletics 75,497$ 194,273$ 260,633$ 530,403$ 141,345,994$
EXPENDITURES
OTHER FINANCING
USES
INSTITUTIONS
REVENUES
OTHER FINANCING SOURCES

157 Back to Table of Contents
TABLE 6.9A – SUMMARY OF INTERCOLLEGIATE ATHLETIC REVENUES AND EXPENDITURES FOR UNIVERSITIES: 2014-15
ASUJ ATU HSU SAUM UAF UAFS UALR UAM UAPB UCA 4-yr TOTAL
Ticket Sales 1,421,706$ 242,382$ 72,382$ 16,479$ 37,622,177$ 38,033$ 314,522$ 35,580$ 408,373$ 425,919$ 40,597,553$
Student Fees 4,567,829$ 3,265,808$ 1,586,531$ 1,455,625$ -$ 2,723,418$ 3,655,736$ 717,727$ 981,895$ 4,893,041$ 23,847,610$
Game Guarantees 1,533,000$ 66,000$ 63,000$ 39,520$ 313,500$ 29,000$ 173,500$ 16,500$ 783,310$ 854,916$ 3,872,246$
Contributions 625,424$ -$ 63,080$ 32,500$ 12,340,500$ 46,511$ 664,305$ -$ 580$ 141,984$ 13,914,884$
NCAA/Conference Distributions 1,611,838$ 58,087$ 65,043$ -$ 13,854,657$ 42,225$ 735,374$ 9,950$ 160,775$ 967,262$ 17,505,210$
Braodcast, TV, Radio, Internet Rights -$ -$ -$ -$ 21,995,606$ -$ -$ -$ -$ -$ 21,995,606$
Program Sales, Concessions, Novelties, Parking 117,149$ -$ 3,400$ 10,773$ 1,894,587$ 54,100$ 1,719$ -$ 57,595$ 21,383$ 2,160,706$
Royalities, Licensing, Advertisements, Sponsorships 577,376$ 42,687$ -$ -$ 12,010,545$ 33,248$ 479,967$ -$ 72,500$ 343,163$ 13,559,486$
Sports Camps Revenues -$ 90,494$ -$ 33,780$ 46,820$ 59,991$ -$ -$ -$ -$ 231,085$
Endowment and Investment Income 54,985$ 42,671$ -$ -$ 325,218$ -$ -$ -$ -$ -$ 422,874$
Other Income 255,019$ 4,251$ 5,058$ 8,300$ 717,169$ 3,670$ 121,147$ 9,645$ 21,230$ 100$ 1,145,589$
CWSP Federally Funded Portion -$ 8,243$ -$ 80,079$ 26,171$ -$ -$ 49,491$ -$ 111,829$ 275,813$
CWSP Fed. Portion as % Total CWSP 0.00% 75.00% 0.00% 47.05% 80.00% 0.00% 0.00% 100.00% 0.00% 100.00% 71.3%
Other Auxiliary Profits 5,304,302$ -$ 1,128,394$ 620,529$ -$ 548,126$ -$ 1,799,160$ 1,590,836$ 3,250,243$ 14,241,590$
Transfers from Unrestricted E&G 1,235,581$ 1,585,072$ 1,235,581$ 1,235,581$ -$ -$ 2,085,119$ 1,075,000$ 1,235,581$ 1,000,000$ 10,687,515$ Prior Year Fund Balance -$ -$ -$ -$ -$ 33,679$ -$ -$ 788,840$ -$ 822,519$
Total Revenues for Athletics 17,304,209$ 5,405,695$ 4,222,469$ 3,533,166$ 101,146,949$ 3,612,001$ 8,231,389$ 3,713,053$ 6,101,515$ 12,009,839$ 165,280,285$
Salaries 4,097,299$ 1,210,761$ 1,137,821$ 741,954$ 26,275,878$ 887,865$ 2,838,714$ 973,943$ 1,760,084$ 2,684,827$ 42,609,146$
Budgeted FTE Positions 70 25 19 13 279 19 39 22 0 48 533
Fringe Benefits 1,258,440$ 348,305$ 327,950$ 221,083$ 5,303,367$ 266,456$ 683,949$ 331,969$ 477,439$ 727,437$ 9,946,395$
Fringe Benefits as a % of Salaries 30.7% 28.8% 28.8% 29.8% 20.2% 30.0% 24.1% 34.1% 27.1% 27.1% 23.3%
Extra Help 276,066$ 12,322$ 9,090$ 132,900$ 1,354,412$ 21,840$ 118,004$ 39,926$ 115,736$ 173,334$ 2,253,631$
CWSP -$ 10,991$ 11,879$ 170,217$ 32,714$ -$ -$ 49,491$ -$ 111,829$ 387,120$
Athletic Scholarships 4,400,304$ 1,488,984$ 1,636,480$ 1,195,230$ 7,254,080$ 1,087,467$ 2,054,118$ 1,039,510$ 1,801,302$ 3,735,704$ 25,693,178$
Recruiting 429,375$ 27,401$ 71,563$ 43,198$ 1,739,940$ 26,190$ 170,196$ 10,974$ -$ 233,970$ 2,752,807$
Team Travel 2,544,584$ 345,777$ 458,084$ 417,233$ 7,809,195$ 350,934$ 921,877$ 285,960$ 698,632$ 1,605,759$ 15,438,035$
Sports Equipment, Uniforms, Supplies 1,085,917$ 107,072$ 55,524$ 171,627$ 2,143,637$ 139,242$ 139,753$ 207,969$ 156,255$ 368,756$ 4,575,752$
Concessions/Programs -$ -$ -$ 16,770$ -$ 41,905$ -$ -$ -$ 58,675$
Game Expenses 566,011$ 64,918$ 66,901$ 68,071$ 4,199,367$ 42,743$ 379,899$ 60,946$ 240,784$ 538,101$ 6,227,740$
Game Guarantees 618,060$ 22,050$ -$ 6,750$ 3,348,759$ 9,000$ 14,372$ 6,750$ -$ 16,000$ 4,041,741$
Fundraising, Marketing, Promotions 115,164$ 40,075$ 52,544$ 1,529$ 1,027,327$ 52,549$ 124,893$ 4,569$ 1,492$ 15,460$ 1,435,603$
Sports Camps Expenses -$ 54,189$ -$ -$ -$ 59,275$ -$ -$ -$ -$ 113,464$
Direct Facilities, Maintenance, Rentals 878,180$ 322,866$ 91,869$ 29,469$ 7,189,422$ 335,241$ 292,953$ 94,596$ 72,883$ 538,103$ 9,845,582$
Debt Service 33,614$ 251,488$ -$ 90,918$ 9,921,783$ -$ 75,984$ 120,050$ 246,167$ 615,919$ 11,355,923$
Spirit Groups -$ 130,327$ -$ -$ 1,100,632$ 131,717$ 58,642$ 53,367$ -$ 62,753$ 1,537,437$
Medical Expenses and Medical Insurance 173,356$ 251,803$ 90,958$ 120,611$ 1,382,013$ 46,134$ 43,797$ 292,252$ 109,767$ 230,312$ 2,741,002$
Membership and Dues 122,280$ 30,778$ 25,900$ 27,618$ 46,621$ 17,394$ 113,825$ 25,900$ 39,488$ 50,316$ 500,120$
Other Operating Expenses 705,559$ 166,762$ 145,526$ 77,988$ 8,079,855$ 96,049$ 135,616$ 114,881$ 381,486$ 118,020$ 10,021,742$
Transfers to Other Funds/Accounts -$ -$ 40,380$ -$ 2,359,555$ -$ 64,797$ -$ -$ 183,239$ 2,647,971$
Total Expenditures for Athletics 17,304,209$ 4,886,869$ 4,222,469$ 3,533,166$ 90,568,558$ 3,612,001$ 8,231,389$ 3,713,053$ 6,101,515$ 12,009,839$ 154,183,066$
OTHER FINANCING
USES
EXPENDITURES
INSTITUTIONS
REVENUES
OTHER FINANCING SOURCES

158 Back to Table of Contents
TABLE 6.9B – SUMMARY OF INTERCOLLEGIATE ATHLETIC REVENUES AND EXPENDITURES FOR COLLEGES: 2014-15
CCCUA MSCC NAC 2-yr TOTAL GRAND TOTAL
Ticket Sales 7,121$ 2,897$ 9,906$ 19,924$ 40,617,477$
Student Fees -$ -$ -$ -$ 23,847,610$
Game Guarantees -$ -$ -$ -$ 3,872,246$
Contributions -$ 64,497$ 3,300$ 67,797$ 13,982,681$
NCAA/Conference Distributions -$ -$ -$ -$ 17,505,210$
Braodcast, TV, Radio, Internet Rights -$ -$ -$ -$ 21,995,606$
Program Sales, Concessions, Novelties, Parking 9,038$ -$ -$ 2,160,706$
Royalities, Licensing, Advertisements, Sponsorships 7,820$ -$ -$ 13,559,486$
Sports Camps Revenues -$ -$ 12,440$ 231,085$
Endowment and Investment Income -$ -$ -$ 422,874$
Other Income -$ -$ 16,752$ 1,145,589$
CWSP Federally Funded Portion -$ -$ -$ -$ 275,813$
CWSP Fed. Portion as % Total CWSP 0.0% 0.0% 0.0% 0.0% 71.3%
Other Auxiliary Profits -$ -$ 69,903$ -$ 14,241,590$
Transfers from Unrestricted E&G 59,209$ 94,170$ 102,219$ 94,170$ 10,781,685$
Prior Year Fund Balance -$ -$ 69,114$ 822,519$
Total Revenues for Athletics 83,188$ 161,564$ 283,634$ 528,386$ 165,808,671$
Salaries 20,351$ 34,376$ 51,435$ 106,162$ 42,715,308$
Budgeted FTE Positions 1 1 1 2$ 535$
Fringe Benefits 6,884$ 7,215$ 11,629$ 25,728$ 9,972,123$
Fringe Benefits as a % of Salaries 33.8% 21.0% 22.6% 24.2% 23.4%
Extra Help -$ 9,681$ 2,876$ 12,557$ 2,266,187$
CWSP -$ -$ -$ -$ 387,120$
Athletic Scholarships -$ 34,497$ 69,954$ 104,451$ 25,797,629$
Recruiting -$ -$ 282$ 282$ 2,753,089$
Team Travel 21,377$ 19,967$ 37,615$ 78,959$ 15,516,994$
Sports Equipment, Uniforms, Supplies -$ 9,943$ 19,809$ 29,752$ 4,605,504$
Concessions/Programs 500$ 500$ 59,175$
Game Expenses 30,556$ 14,883$ 17,125$ 62,564$ 6,290,304$
Game Guarantees -$ -$ -$ -$ 4,041,741$
Fundraising, Marketing, Promotions 707$ -$ -$ 707$ 1,436,310$
Sports Camps Expenses -$ -$ 6,839$ 6,839$ 120,303$
Direct Facilities, Maintenance, Rentals -$ -$ 25,163$ 9,845,582$
Debt Service -$ -$ -$ 11,355,923$
Spirit Groups -$ -$ 7,973$ 1,537,437$
Medical Expenses and Medical Insurance -$ 9,071$ 23,056$ 2,741,002$
Membership and Dues 1,050$ 2,568$ 1,750$ 500,120$
Other Operating Expenses 1,763$ 19,363$ 8,128$ 29,254$ 10,050,996$
-$ -$ -$ -$ 2,647,971$ T ransfers to Other Funds/Accounts
Total Expenditures for Athletics 83,188$ 161,564$ 283,634$ 528,386$ 154,711,452$
EXPENDITURES
OTHER FINANCING
USES
INSTITUTIONS
OTHER FINANCING SOURCES
REVENUES

159 Back to Table of Contents
TABLE 6.10A – SUMMARY OF INTERCOLLEGIATE ATHLETIC REVENUES AND EXPENDITURES FOR UNIVERSITIES: 2015-16
ASUJ ATU HSU SAUM UAF UAFS UALR UAM UAPB UCA 4-yr TOTAL
Ticket Sales 1,762,021$ 249,134$ 38,166$ 30,477$ 37,424,186$ 32,288$ 486,269$ 32,884$ 371,596$ 431,731$ 40,858,752$
Student Fees 5,027,521$ 3,505,978$ 1,563,031$ 1,683,510$ -$ 2,466,978$ 3,837,889$ 653,152$ 1,069,972$ 4,925,356$ 24,733,387$
Game Guarantees 1,773,000$ 7,500$ 13,000$ 28,000$ 61,000$ 12,750$ 378,903$ 15,500$ 518,600$ 739,830$ 3,548,083$
Contributions 727,381$ -$ 93,356$ -$ 13,491,734$ 81,103$ 537,051$ -$ 5,000$ 146,532$ 15,082,157$
NCAA/Conference Distributions 1,427,795$ 37,723$ 43,598$ -$ 14,636,916$ 39,370$ 621,419$ 8,265$ 153,558$ 1,012,418$ 17,981,062$
Braodcast, TV, Radio, Internet Rights -$ -$ -$ -$ 28,924,899$ -$ -$ -$ -$ -$ 28,924,899$
Program Sales, Concessions, Novelties, Parking -$ -$ 3,701$ 19,525$ 1,703,995$ 52,860$ -$ -$ 126,669$ 28,440$ 1,935,190$
Royalities, Licensing, Advertisements, Sponsorships 639,912$ 47,211$ -$ -$ 14,600,144$ 130,505$ 431,984$ -$ 52,520$ 355,835$ 16,258,111$
Sports Camps Revenues -$ 191,100$ -$ 68,269$ 32,995$ 60,066$ -$ -$ -$ -$ 352,430$
Endowment and Investment Income 151,351$ 47,069$ -$ -$ 365,843$ 636$ -$ -$ -$ -$ 564,899$
Other Income 278,144$ 3,754$ 18,272$ 44,539$ 1,084,641$ 16,265$ 168,125$ 10,180$ 31,161$ 150$ 1,655,231$
CWSP Federally Funded Portion -$ 13,667$ -$ 73,734$ 16,983$ 3,214$ -$ 45,687$ -$ 106,242$ 259,527$
CWSP Fed. Portion as % Total CWSP 0.00% 75.00% 0.00% 48.37% 80.00% 100.00% 0.00% 100.00% 0.00% 100.00% 70.9%
Other Auxiliary Profits 3,936,597$ -$ 1,495,922$ 387,570$ -$ 774,936$ 269,017$ 1,856,724$ 2,715,213$ 3,250,932$ 14,686,911$
Transfers from Unrestricted E&G 2,875,350$ 1,621,878$ 1,255,350$ 1,255,350$ -$ -$ 2,570,111$ 1,162,000$ 1,138,234$ 1,000,000$ 12,878,273$ Prior Year Fund Balance -$ -$ -$ -$ -$ 52,822$ -$ -$ -$ -$ 52,822$
Total Revenues for Athletics 18,599,072$ 5,725,014$ 4,524,396$ 3,590,974$ 112,343,336$ 3,723,793$ 9,300,768$ 3,784,392$ 6,182,523$ 11,997,465$ 179,771,733$
Salaries 4,299,858$ 1,405,391$ 1,232,139$ 731,369$ 28,643,229$ 940,153$ 2,749,197$ 1,005,180$ 1,868,747$ 2,736,906$ 45,612,169$
Budgeted FTE Positions 78 28 22 14 285 17 0 23 0 51 517
Fringe Benefits 1,222,552$ 298,825$ 318,083$ 259,095$ 5,893,014$ 255,635$ 731,328$ 324,880$ 496,247$ 863,828$ 10,663,487$
Fringe Benefits as a % of Salaries 28.4% 21.3% 25.8% 35.4% 20.6% 27.2% 26.6% 32.3% 26.6% 31.6% 23.4%
Extra Help 292,171$ 27,531$ 5,630$ 137,364$ 1,438,616$ 11,592$ 123,376$ 43,037$ 97,831$ 199,979$ 2,377,126$
CWSP -$ 18,222$ 19,046$ 152,438$ 21,228$ 3,214$ -$ 45,687$ -$ 106,242$ 366,077$
Athletic Scholarships 5,415,333$ 1,490,679$ 1,766,455$ 1,268,619$ 8,453,096$ 1,067,818$ 2,400,228$ 1,120,988$ 1,855,605$ 3,890,101$ 28,728,922$
Recruiting 467,314$ 47,199$ 79,303$ 28,802$ 1,974,825$ 34,931$ 176,993$ 15,818$ -$ 277,165$ 3,102,350$
Team Travel 2,612,402$ 347,148$ 403,837$ 454,896$ 8,200,873$ 389,649$ 1,119,665$ 298,979$ 607,951$ 1,413,774$ 15,849,174$
Sports Equipment, Uniforms, Supplies 926,878$ 181,605$ 226,101$ 153,099$ 3,658,768$ 164,057$ 212,694$ 227,326$ 297,785$ 396,423$ 6,444,735$
Concessions/Programs -$ -$ -$ 23,853$ -$ 41,022$ -$ -$ -$ -$ 64,875$
Game Expenses 584,480$ 78,901$ 73,939$ 107,926$ 4,320,146$ 52,376$ 360,758$ 82,767$ 192,114$ 540,913$ 6,394,321$
Game Guarantees 504,500$ 9,700$ -$ 4,000$ 3,682,303$ 11,500$ 79,000$ 5,000$ -$ 76,100$ 4,372,103$
Fundraising, Marketing, Promotions 99,564$ 26,951$ 12,613$ 1,177$ 1,188,177$ 47,697$ 194,824$ 3,500$ 144$ 11,522$ 1,586,168$
Sports Camps Expenses -$ 157,155$ -$ -$ -$ 21,623$ -$ -$ -$ -$ 178,778$
Direct Facilities, Maintenance, Rentals 1,034,212$ 258,618$ 149,826$ 25,697$ 6,768,374$ 293,396$ 216,056$ 89,583$ 154,476$ 414,801$ 9,405,040$
Debt Service 33,614$ 258,428$ -$ 88,631$ 9,931,162$ -$ 75,998$ 119,928$ 248,108$ 547,265$ 11,303,133$
Spirit Groups -$ 120,334$ -$ -$ 1,126,008$ 128,357$ 88,237$ 55,692$ -$ 59,203$ 1,577,831$
Medical Expenses and Medical Insurance 293,925$ 261,887$ 70,560$ 75,048$ 1,586,700$ 47,918$ 14,710$ 219,170$ 157,214$ 135,075$ 2,862,207$
Membership and Dues 131,831$ 30,623$ 29,980$ 27,713$ 48,414$ 39,550$ 110,120$ 25,900$ 39,541$ 64,627$ 548,299$
Other Operating Expenses 680,438$ 210,757$ 123,559$ 51,247$ 9,497,453$ 173,305$ 526,815$ 100,957$ 166,760$ 189,213$ 11,720,505$
Transfers to Other Funds/Accounts -$ -$ 13,325$ -$ 2,337,858$ -$ 120,769$ -$ -$ 74,330$ 2,546,282$
Total Expenditures for Athletics 18,599,072$ 5,229,954$ 4,524,396$ 3,590,974$ 98,770,244$ 3,723,793$ 9,300,768$ 3,784,392$ 6,182,523$ 11,997,465$ 165,703,581$
INSTITUTIONS
REVENUES
OTHER FINANCING SOURCES
EXPENDITURES
OTHER FINANCING
USES

160 Back to Table of Contents
TABLE 6.10B – SUMMARY OF INTERCOLLEGIATE ATHLETIC REVENUES AND EXPENDITURES FOR COLLEGES: 2015-16
ASUMS CCCUA NAC 2-yr TOTAL GRAND TOTAL
Ticket Sales 5,301$ 7,124$ 6,704$ 19,129$ 40,877,881$
Student Fees -$ -$ -$ -$ 24,733,387$
Game Guarantees -$ -$ -$ -$ 3,548,083$
Contributions 53,700$ -$ -$ 53,700$ 15,135,857$
NCAA/Conference Distributions -$ -$ -$ -$ 17,981,062$
Braodcast, TV, Radio, Internet Rights -$ -$ -$ -$ 28,924,899$
Program Sales, Concessions, Novelties, Parking -$ 8,069$ -$ 1,935,190$
Royalities, Licensing, Advertisements, Sponsorships -$ 4,950$ -$ 16,258,111$
Sports Camps Revenues -$ -$ 10,080$ 352,430$
Endowment and Investment Income -$ -$ -$ 564,899$
Other Income -$ -$ 23,460$ 1,655,231$
CWSP Federally Funded Portion -$ -$ -$ -$ 259,527$
CWSP Fed. Portion as % Total CWSP 0.0% 0.0% 0.0% 0.0% 70.9%
Other Auxiliary Profits -$ -$ 151,667$ -$ 14,686,911$
Transfers from Unrestricted E&G 113,840$ 64,979$ 99,092$ 64,979$ 12,943,252$
Prior Year Fund Balance -$ -$ -$ 52,822$
Total Revenues for Athletics 172,841$ 85,122$ 291,003$ 548,966$ 180,320,699$
Salaries 44,139$ 20,548$ 52,653$ 117,340$ 45,729,509$
Budgeted FTE Positions 1 1 1 3$ 519$
Fringe Benefits 9,373$ 6,437$ 9,867$ 25,677$ 10,689,164$
Fringe Benefits as a % of Salaries 21.2% 31.3% 18.7% 21.9% 0$
Extra Help 3,144$ -$ 9,599$ 12,743$ 2,389,869$
CWSP -$ -$ -$ -$ 366,077$
Athletic Scholarships 28,700$ -$ 58,574$ 87,274$ 28,816,196$
Recruiting -$ -$ 320$ 320$ 3,102,670$
Team Travel 19,712$ 18,070$ 43,794$ 81,576$ 15,930,750$
Sports Equipment, Uniforms, Supplies 6,741$ 2,801$ 29,577$ 39,119$ 6,483,855$
Concessions/Programs -$ -$ -$ -$ 64,875$
Game Expenses 17,178$ 29,303$ 18,624$ 65,105$ 6,459,426$
Game Guarantees -$ -$ -$ -$ 4,372,103$
Fundraising, Marketing, Promotions -$ 1,548$ -$ 1,548$ 1,587,716$
Sports Camps Expenses -$ -$ -$ -$ 178,778$
Direct Facilities, Maintenance, Rentals -$ -$ 25,815$ 9,405,040$
Debt Service -$ -$ -$ 11,303,133$
Spirit Groups -$ -$ -$ 1,577,831$
Medical Expenses and Medical Insurance 16,222$ -$ 35,522$ 2,862,207$
Membership and Dues 3,620$ 300$ 2,414$ 548,299$
Other Operating Expenses 24,012$ 6,115$ 4,244$ 34,371$ 11,754,875$
-$ -$ -$ -$ 2,546,282$ T ransfers to Other Funds/Accounts
Total Expenditures for Athletics 172,841$ 85,122$ 291,003$ 548,966$ 166,252,547$
OTHER FINANCING
USES
INSTITUTIONS
REVENUES
OTHER FINANCING SOURCES
EXPENDITURES

161 Back to Table of Contents
SECTION 7.
SUPPLEMENTAL INFORMATION

162 Back to Table of Contents
TABLE 7.1 – FACILITIES AUDIT DATA 2016
UNIVERSITIESASUJ 2,255,000 426,228,969 246,840,637 18,353,149 0.5791ATU 1,115,770 216,562,207 122,897,259 2,984,742 0.5675HSU 712,896 139,704,585 91,198,570 8,027,364 0.6528SAUM 821,252 167,334,641 88,897,799 4,219,081 0.5313UAF 4,360,349 837,693,619 454,268,430 33,940,925 0.5423UAFS 875,121 171,336,619 73,041,151 2,916,322 0.4263UALR 2,090,352 410,036,228 264,884,133 66,237,148 0.6460UAM 717,626 135,620,565 85,619,525 13,425,605 0.6313UAMS 4,821,791 1,020,595,713 536,287,804 20,295,000 0.5255UAPB 958,085 190,228,349 75,181,873 1,510,729 0.3952UCA 1,482,314 287,181,991 182,678,520 13,365,000 0.6361COLLEGESANC 346,470 65,575,432 17,783,280 3,469,198 0.2712ASUB 613,260 111,538,827 53,665,711 1,067,000 0.4811ASUMS 218,842 41,643,311 11,042,520 915,834 0.2652ASUMH 366,659 69,828,055 22,901,060 200,000 0.3280ASUN 317,945 61,164,158 16,960,060 225,000 0.2773BRTC 354,991 66,865,455 19,254,235 145,000 0.2880CCCUA 219,869 41,271,223 14,809,423 516,119 0.3588CotO 152,532 29,445,959 10,129,385 464,644 0.3440EACC 209,306 40,014,531 14,491,732 323,471 0.3622NAC 282,036 54,536,233 23,310,320 5,155,368 0.4274NPC 341,805 64,717,494 23,489,753 1,051,127 0.3630NWACC 466,147 95,368,516 24,373,135 0 0.2556OZC 170,690 34,209,915 11,810,421 21,802 0.3452PCCUA 460,622 86,179,506 45,649,445 1,578,500 0.5297SACC 250,677 46,327,935 21,617,187 690,483 0.4666SAUT 395,950 67,268,373 37,507,702 648,831 0.5576SEARK 247,883 48,210,810 16,338,991 895,346 0.3389UACCB 163,141 30,804,971 8,483,132 3,285,334 0.2754UACCH 261,986 52,141,972 11,638,166 580,120 0.2232UACCM 272,118 50,580,049 20,150,974 449,689 0.3984UACCRM 143,107 26,573,165 4,431,788 434,297 0.1668UAPTC 777,152 152,842,556 27,878,886 2,144,273 0.1824TOTAL 27,243,744 $ 5,339,631,932 $ 2,679,513,007 $ 209,536,500 0.5018
INSTITUTIONSE & G SQUARE
FEETINSTITUTIONAL E&G
MAINTENANCE NEEDINSTITUTIONAL E&G
CRITICAL NEED
E & G CURRENT REPLACEMENT VALUE
(CRV)
E & G FACILITY CONDITION INDEX
(FCI)

163 Back to Table of Contents
TABLE 7.2 – EQUIPMENT RECOMMENDATIONS: 2017-19 BIENNIUM
INSTITUTION
Education & General
Equipment
15-Year Replacement
Schedule
AHECB Equipment Recommendation for 2017-19 Biennium*
UniversitiesASUJ 40,612,688 2,707,513 2,342,774ATU 12,084,450 805,630 1,361,321HSU 6,661,938 444,129 541,895SAUM 6,458,349 430,557 618,586UAF 144,088,085 9,605,872 4,555,200UAFS 14,186,707 945,780 829,488UALR 3,902,732 260,182 1,802,560UAM 5,782,597 385,506 387,969UAPB 19,946,472 1,329,765 387,294UCA 18,246,206 1,216,414 2,041,509
Universities Total 271,970,224$ 18,131,348$ 14,868,595$ CollegesANC 7,552,558 503,504 138,225ASUB 5,598,839 373,256 445,250ASUMS 10,235,703 682,380 159,060ASUMH 2,058,455 137,230 162,705ASUN 5,021,735 334,782 264,730BRTC 9,843,747 656,250 201,595CCCUA 1,732,350 115,490 144,070CotO 2,801,790 186,786 129,325EACC 3,740,119 249,341 116,675NAC 4,605,429 307,029 204,955NPC 0 0 166,755NWACC 5,957,052 397,137 742,865OZC 1,135,440 75,696 128,510PCCUA 5,785,511 385,701 142,145SACC 3,394,210 226,281 166,910SAUT 5,864,998 391,000 169,540SEARK 3,820,970 254,731 156,625UACCB 1,964,066 130,938 143,800UACCH 3,451,919 230,128 136,535UACCM 2,317,246 154,483 231,395UACCRM 1,983,400 132,227 82,065UAPTC 1,871,344 124,756 850,945
Colleges Total 90,736,881$ 6,049,126$ 5,084,680$ Non-FormulaASU-SYS 57,658 3,844 0ATU-Ozark 1,911,169 127,411 149,510SAUT-ETA 0 0 0SAUT-FTA 0 0 0UAMS 221,562,153 14,770,810 1,927,257UA-SYS 508,927 33,928 0UA-AAS 898,326 59,888 0UA-AREON 9,548,282 636,552 0UA-ASMSA 261,503 17,434 0UA-Agri 50,869,930 3,391,329 0UA-CJI 376,724 25,115 0UA-CS 114,987 7,666 0UAM-CROSSETT 856,325 57,088 27,895UAM-MCGEHEE 1,525,237 101,682 28,830
Non-Formula Total 288,491,221$ 18,999,810$ 2,133,492$ Grand Total 651,198,327$ 43,180,284$ 22,086,768$
Source: ADHE Series 17-8 - Actual FY17 & AHECB Replacement Equipment & Library Recommendation for 2017-19
*Recommendations also include funds for library expenses.

164 Back to Table of Contents
TABLE 7.3 – ARKANSAS PUBLIC INSTITUTIONS’ AVERAGE FACULTY SALARIES IN COMPARISON TO SREB AVERAGE FACULTY SALARIES BY TYPE OF INSTITUTION AND RANK 2015-16
FOUR YEAR 1UAF ARK. SREB PERCENT
RANK SALARY SALARY SALARY DIFFERENCEPROFESSOR 115,456 113,812 126,059 -9.18%ASSOC. PROFESSOR 85,130 82,352 87,431 -2.70%ASST. PROFESSOR 77,619 76,794 77,006 0.79%INSTRUCTOR 49,445 48,335 50,467 -2.07%UNDESIGNATED 49,863 48,260 53,981 -8.26%ALL RANKS 81,633 80,878 89,318 -9.41%FOUR YEAR 2
UALR ARK. SREB PERCENTRANK SALARY SALARY SALARY DIFFERENCEPROFESSOR 85,455 90,476 111,636 -30.64%ASSOC. PROFESSOR 68,229 69,139 79,844 -17.02%ASST. PROFESSOR 57,491 60,771 69,877 -21.54%INSTRUCTOR 43,855 47,959 49,280 -12.37%UNDESIGNATED - - 52,934 -ALL RANKS 67,631 70,950 80,525 -19.07%FOUR YEAR 3
ASUJ ATU UCA ARK. SREB PERCENTRANK SALARY SALARY SALARY SALARY SALARY DIFFERENCEPROFESSOR 83,494 78,282 79,951 80,328 88,126 -9.71%ASSOC. PROFESSOR 69,967 64,174 67,114 66,271 71,587 -8.02%ASST. PROFESSOR 58,639 53,944 59,761 56,976 62,375 -9.48%INSTRUCTOR 39,578 41,334 50,068 43,575 45,357 -4.09%UNDESIGNATED - 45,667 40,281 48,604 -20.66%ALL RANKS 62,240 57,146 60,068 58,976 67,308 -14.13%FOUR YEAR 4
HSU SAUM ARK. SREB PERCENTRANK SALARY SALARY SALARY SALARY DIFFERENCEPROFESSOR 68,842 81,159 65,968 88,126 -33.59%ASSOC. PROFESSOR 57,446 62,514 57,482 66,210 -15.18%ASST. PROFESSOR 54,411 54,084 49,924 58,329 -16.84%INSTRUCTOR 44,741 41,751 40,689 46,364 -13.95%UNDESIGNATED 55,773 - 42,863 42,711 0.35%ALL RANKS 57,861 56,709 53,515 62,117 -16.08%FOUR YEAR 5
UAM ARK. SREB PERCENTRANK SALARY SALARY SALARY DIFFERENCEPROFESSOR 66,768 67,966 80,067 -19.92%ASSOC. PROFESSOR 57,833 55,035 65,195 -12.73%ASST. PROFESSOR 49,297 47,950 55,893 -13.38%INSTRUCTOR 40,288 40,384 44,868 -11.37%UNDESIGNATED - - 45,501 -ALL RANKS 49,809 49,136 60,504 -21.47%FOUR YEAR 6
UAFS UAPB ARK. SREB PERCENTRANK SALARY SALARY SALARY SALARY DIFFERENCEPROFESSOR 84,684 63,569 72,708 78,435 -7.88%ASSOC. PROFESSOR 70,906 56,160 63,354 60,518 4.48%ASST. PROFESSOR 57,453 53,005 54,625 54,595 0.05%INSTRUCTOR 51,609 42,983 44,272 43,131 2.58%UNDESIGNATED 27,024 41,991 45,736 -8.92%ALL RANKS 59,156 51,884 55,830 57,355 -2.73%

165 Back to Table of Contents
TWO YEAR INSTITUTIONSINSTITUTION ARK. SREB PERCENT
INSTITUTIONS SALARY SALARY SALARY DIFFERENCETWO YEAR 1 INSTITUTIONS, SINGLE RANKPTC 45,373 46,123 53,811 -18.60%NWACC 53,053 46,123 53,811 -1.43%ALL RANKS 50,766 55,037 -8.41%TWO YEAR 2 INSTITUTIONSASUB
PROFESSOR 65,183 61,037 54,288 16.71%ASSOC. PROFESSOR 61,422 59,870 51,947 15.43%ASST. PROFESSOR 50,217 48,609 44,938 10.51%INSTRUCTOR 41,828 40,510 47,172 -12.78%
NPCC (GCCC) 43,532 41,416 52,889 -21.49%ALL RANKS 43,198 50,180 -16.16%TWO YEAR 3 INSTITUTIONSANC 45,347 41,784 46,518 -2.58%ASUMS 39,130 41,784 46,518 -18.88%ASUMH 44,372 41,784 46,518 -4.84%ASUN
ASST. PROFESSOR 43,414 45,309 46,479 -7.06%INSTRUCTOR 38,975 41,501 41,123 -5.51%
BRTC 43,972 41,784 46,518 -5.79%CCCUA 42,753 41,784 46,518 -8.81%CotO 41,443 41,784 46,518 -12.24%EACC 48,149 41,784 46,518 3.39%NAC 46,921 41,784 46,518 0.86%OZC 41,050 41,784 46,518 -13.32%PCCUA 40,476 41,784 46,518 -14.93%RMCC 41,795 41,784 46,518 -11.30%SACC 42,598 41,784 46,518 -9.20%SAUT 39,971 41,784 46,518 -16.38%SEARK 47,665 41,784 46,518 2.41%UACCB 41,036 41,784 46,518 -13.36%UACCH 41,524 41,784 46,518 -12.03%UACCM 44,566 41,784 46,518 -4.38%ALL RANKS 42,171 45,133 -7.02%SOURCE : SREB SURVEY

166 Back to Table of Contents
TABLE 7.4A - TOTAL SSCH / FTE ENROLLMENTS AT PUBLIC FOUR-YEAR INSTITUTIONS, 2009-10 THROUGH 2015-16
% SSCH Change
Institution Level 2010/11 2011/12 2012/13 2013/14 2014/15 2015/16 1 Year 5 Year
ASUJ Undergraduate SSCH 275,134 276,899 277,271 274,575 268,334 265,352 -1.1% -3.6%FTE 9,171 9,230 9,242 9,153 8,945 8,845
Graduate SSCH 79,772 80,262 72,807 70,202 71,547 81,952 14.5% 2.7%FTE 3,324 3,344 3,034 2,925 2,981 3,415
Inst Total SSCH 354,906 357,161 350,078 344,777 339,881 347,304 2.2% -2.1%FTE 12,495 12,574 12,276 12,078 11,926 12,260
ATU Undergraduate SSCH 213,717 222,156 221,697 224,818 231,607 227,575 -1.7% 6.5%FTE 7,124 7,405 7,390 7,494 7,720 7,586
Graduate SSCH 12,424 14,075 15,371 15,239 16,802 14,214 -15.4% 14.4%FTE 518 587 641 700 700 592
Inst Total SSCH 226,141 236,231 237,068 240,057 248,409 241,789 -2.7% 6.9%FTE 7,642 7,992 8,030 8,194 8,420 8,178
HSU Undergraduate SSCH 97,166 97,182 95,838 91,833 91,422 88,815 -2.9% -8.6%FTE 3,239 3,239 3,195 3,061 3,047 2,961
Graduate SSCH 8,251 8,083 7,976 10,469 5,900 6,828 15.7% -17.2%FTE 344 337 332 436 246 285
Inst Total SSCH 105,417 105,265 103,814 102,302 97,322 95,643 -1.7% -9.3%FTE 3,583 3,576 3,527 3,497 3,293 3,245
SAUM Undergraduate SSCH 83,653 82,887 80,431 82,840 84,906 89,605 5.5% 7.1%FTE 2,788 2,763 2,681 2,761 2,830 2,987
Graduate SSCH 7,527 7,783 7,783 7,421 9,309 22,629 143.1% 200.6%FTE 314 328 324 309 388 943
Inst Total SSCH 91,180 90,670 88,214 90,261 94,215 112,234 19.1% 23.1%FTE 3,102 3,091 3,005 3,071 3,218 3,930
UAF Undergraduate SSCH 498,737 549,199 588,320 608,337 629,027 634,994 0.9% 27.3%FTE 16,625 18,307 19,611 20,278 20,968 21,166
Graduate SSCH 65,774 65,001 65,507 67,580 68,099 69,388 1.9% 5.5%FTE 2,741 2,708 2,730 2,816 2,838 2,891
Inst Total SSCH 564,511 614,200 653,827 675,917 697,126 704,382 1.0% 24.8%FTE 19,365 21,015 22,340 23,094 23,805 24,058
UAFS Undergraduate SSCH 193,119 188,214 183,077 177,228 168,273 162,096 -3.7% -16.1%FTE 6,437 6,273.80 6,102.60 5,907.60 5,609.10 5,403.20
UALR Undergraduate SSCH 236,585 239,104 234,427 223,167 212,303 211,256 -0.5% -10.7%FTE 7,886 7,970.10 7,814.20 7,438.90 7,076.80 7,041.86
Graduate SSCH 37,794 34,914 34,036 31,867 31,068 31,553 1.6% -16.5%FTE 1,575 1,455 1,418.20 1,328 1,295 1,315
Inst Total SSCH 274,379 274,018 268,463 255,034 243,371 242,809 -0.2% -11.5%FTE 9,461 9,424.90 9,232.40 8,766.70 8,371 8,357
UAM Undergraduate SSCH 69,804 72,540 69,401 67,494 70,840 66,575 -6.0% -4.6%FTE 2,327 2,418 2,313 2,250 2,361 2,219
Graduate SSCH 2,436 2,007 2,364 3,267 3,435 3,861 12.4% 58.5%FTE 102 84 99 136 143 161
Inst Total SSCH 72,240 74,547 71,765 70,761 74,275 70,436 -5.2% -2.5%FTE 2,428 2,502 2,412 2,386 2,504 2,380
UAMS Undergraduate SSCH 25,508 21,731 21,681 20,587 19,621 19,042 -3.0% -25.3%FTE 850 724 723 686 654 635
Graduate SSCH 11,622 10,320 13,454 15,631 18,191 18,495 1.7% 59.1%FTE 484 430 561 651 758 771
Inst Total SSCH 37,130 32,051 35,135 36,218 37,812 37,537 -0.7% 1.1%FTE 1,335 1,154 1,283 1,338 1,412 1,405
UAPB Undergraduate SSCH 90,692 85,960 74,819 70,019 67,932 72,930 7.4% -19.6%FTE 3,023 2,865 2,494 2,334 2,264 2,431
Graduate SSCH 1,939 1,782 1,542 1,447 1,818 1,712 -5.8% -11.7%FTE 81 74 64 60 76 71
Inst Total SSCH 92,631 87,742 76,361 71,466 69,750 74,642 7.0% -19.4%FTE 3,104 2,940 2,558 2,394 2,340 2,502
UCA Undergraduate SSCH 272,110 266,530 267,241 268,506 271,053 274,084 1.1% 0.7%FTE 9,070 8,884 8,908 8,950 9,035 9,136
Graduate SSCH 33,027 31,337 25,576 30,849 31,858 30,320 -4.8% -8.2%FTE 1,376 1,306 1,066 1,285 1,327 1,263
Inst Total SSCH 305,137 297,867 292,817 299,355 302,911 304,404 0.5% -0.2%FTE 10,446 10,190 9,974 10,236 10,363 10,399
TOTAL Undergraduate SSCH 2,056,225 2,102,402 2,114,203 2,109,404 2,115,318 2,112,324 -0.1% 2.7%FTE 68,541 70,080 70,474 70,313 70,511 70,411
Graduate SSCH 260,566 255,564 246,416 253,972 258,027 280,952 8.9% 7.8%FTE 10,857 10,652 10,268 10,647 10,751 11,706
Grand Total SSCH 2,316,791 2,357,966 2,360,619 2,363,376 2,373,345 2,393,276 0.8% 3.3%FTE 79,398 80,732 80,741 80,961 81,262 82,117
TOTAL SSCH / FTE ENROLLMENTS IN --

167 Back to Table of Contents
TABLE 7.4B - TOTAL SSCH / FTE ENROLLMENTS AT PUBLIC TWO-YEAR INSTITUTIONS, 2009-10 THROUGH 2015-16
% SSCH Change
Institution 2010/11 2011/12 2012/13 2013/14 2014/15 2015/16 1 Year 5 Year
ANC SSCH 43,017 39,634 34,473 27,841 27,462 27,514 0.2% -36.0%FTE 1,433 1,321 1,149 928 915 917
ASUB SSCH 106,830 104,804 101,622 93,555 90,870 86,957 -4.3% -18.6%FTE 3,561 3,493 3,387 3,119 3,029 2,899
ASUMS SSCH 40,605 38,923 36,498 34,911 32,111 32,068 -0.1% -21.0%FTE 1,354 1,297 1,217 1,164 1,070 1,069
ASUMH SSCH 37,054 35,775 35,266 34,865 32,700 32,567 -0.4% -12.1%FTE 1,235 1,192 1,176 1,162 1,090 1,086
ASUN SSCH 45,543 45,206 46,366 47,035 51,520 55,129 7.0% 21.0%FTE 1,518 1,507 1,546 1,568 1,717 1,838
BRTC SSCH 63,348 60,743 57,903 53,032 44,393 38,111 -14.2% -39.8%FTE 2,112 2,025 1,930 1,768 1,480 1,270
CCCUA SSCH 32,489 28,989 30,318 30,813 28,815 28,954 0.5% -10.9%FTE 1,083 966 1,011 1,027 961 965
CotO SSCH 29,832 28,118 27,522 28,742 27,522 24,139 -12.3% -19.1%FTE 994 937 917 958 917 805
EACC SSCH 30,924 27,393 23,842 25,932 23,842 22,533 -5.5% -27.1%FTE 1,031 913 795 864 795 751
NAC SSCH 57,654 54,161 42,865 47,933 42,865 39,419 -8.0% -31.6%FTE 1,922 1,805 1,429 1,598 1,429 1,314
NPC SSCH 83,039 83,133 67,698 64,038 57,519 57,248 -0.5% -31.1%FTE 2,768 2,771 2,257 2,135 1,917 1,908
NWACC SSCH 173,282 171,630 169,012 159,192 153,998 146,496 -4.9% -15.5%FTE 5,776 5,721 5,634 5,306 5,133 4,883
OZC SSCH 37,602 38,315 36,029 33,217 27,999 24,349 -13.0% -35.2%FTE 1,253 1,277 1,201 1,107 933 812
PCCUA SSCH 38,743 36,007 34,541 34,182 29,585 28,263 -4.5% -27.1%FTE 1,291 1,200 1,151 1,139 986 942
PTC SSCH 253,095 261,581 251,992 219,124 188,763 154,508 -18.1% -39.0%FTE 8,437 8,719 8,400 7,304 6,292 5,150
RMCC SSCH 20,643 19,801 19,068 18,059 16,947 16,535 -2.4% -19.9%FTE 688 660 636 602 565 551
SACC SSCH 41,237 41,596 38,269 35,765 35,429 32,275 -8.9% -21.7%FTE 1,375 1,387 1,276 1,192 1,181 1,076
SAUT SSCH 41,166 41,009 39,485 38,604 36,609 32,511 -11.2% -21.0%FTE 1,372 1,367 1,316 1,287 1,220 1,084
SEAC SSCH 47,113 45,792 37,738 35,341 31,460 30,871 -1.9% -34.5%FTE 1,570 1,526 1,258 1,178 1,049 1,029
UACCB SSCH 40,219 35,053 31,523 29,054 28,322 28,883 2.0% -28.2%FTE 1,341 1,168 1,051 969 944 963
UACCH SSCH 33,785 28,755 31,633 29,685 27,484 28,426 3.4% -15.9%FTE 1,126 959 1,054 990 916 948
UACCM SSCH 59,332 54,917 45,930 50,029 45,930 46,336 0.9% -21.9%FTE 1,978 1,831 1,531 1,668 1,531 1,545
Two-Year Total SSCH 1,356,552 1,321,335 1,239,593 1,170,949 1,082,145 1,014,092 -6.3% -25.2%FTE 45,218 44,045 41,320 39,032 36,072 33,803
TOTAL SSCH / FTE ENROLLMENTS IN --

168 Back to Table of Contents
TABLE 7.5 – STUDENT HEADCOUNT BY INSTITUTION, 2011-2016
INSTITUTION 2011 2012 2013 2014 2015 2016Public Universities
ASUJ 17,666 18,206 17,990 17,603 17,514 18,395ATU 11,732 12,690 13,158 13,575 14,132 13,865HSU 4,449 4,497 4,450 4,448 4,083 4,041SAUM 4,009 4,004 3,906 4,028 4,266 5,164UAF 24,577 26,431 27,610 28,054 29,056 29,809UAFS 9,389 8,924 8,732 8,162 7,847 7,726UALR 16,626 16,315 15,969 15,179 14,664 14,695UAM 4,605 4,895 4,763 4,692 4,576 4,385UAMS 3,202 3,190 3,226 3,269 3,351 3,273UAPB 3,804 3,554 3,138 2,923 2,800 2,959UCA 13,270 12,939 12,825 13,242 13,455 13,625
Universities Subtotal 113,329 115,645 115,767 115,175 115,744 117,937Public Colleges
ANC 3,069 2,865 2,423 2,017 2,074 2,011ASUB 6,974 7,030 6,794 6,359 5,870 5,619ASUMS 3,083 3,168 2,694 2,507 2,469 2,470ASUMH 2,133 2,153 2,090 2,046 1,986 1,992ASUN 3,713 3,863 3,912 3,904 4,507 5,024BRTC 3,712 3,702 3,529 3,354 2,925 2,389CCCUA 2,265 2,166 2,187 2,216 2,248 2,235CotO 1,992 1,863 1,864 1,952 1,861 1,757EACC 2,281 2,119 2,161 2,040 1,981 1,860NAC 3,220 3,079 3,035 2,813 2,542 2,290NPC 5,128 5,297 4,527 4,186 3,788 3,760NWACC 12,190 12,273 12,140 11,575 11,425 11,168OZC 2,166 2,247 2,142 1,990 1,770 1,562PCC/UA 2,903 2,917 2,678 2,534 2,281 2,130PTC 15,932 16,491 16,390 14,406 12,460 10,608RMCC 1,583 1,470 1,391 1,337 1,303 1,296SACC 2,574 2,540 2,435 2,383 2,303 2,135SAUT 3,807 3,830 3,418 3,439 3,336 3,182SEAC 3,125 3,009 2,517 2,233 2,147 2,078UACCB 2,244 2,094 1,869 1,800 1,738 1,805UACCH 2,178 1,908 2,134 2,078 1,873 1,952UACCM 3,266 3,046 2,939 2,886 2,656 2,681
Colleges Subtotal 89,538 89,130 85,269 80,055 75,543 72,004 PUBLIC TOTAL 202,867 204,775 201,036 195,230 191,287 189,941Independent
ABC 1,385 1,576 1,411 1,315 1,218 1,287CBC 822 957 968 938 923 963CRC 228 240 216 208 242 252EC 0 0 0 0 0 238HC 1,494 1,467 1,412 1,459 1,389 1,419HU 7,686 7,747 7,321 6,775 6,655 6,648JBU 2,480 2,800 2,905 3,051 3,277 3,256LC 692 634 622 621 763 747OBU 1,563 1,674 1,619 1,612 1,626 1,659PSC 784 822 733 652 660 697SC 0 0 0 0 531 377UO 662 674 611 619 628 694WBC 701 662 607 622 580 569
INDEPENDENT TOTAL 18,497 19,253 18,425 17,872 18,492 18,806
GRAND TOTAL 221,364 224,028 219,461 213,102 209,779 208,747
Source: ADHE SIS
-1.0%21.1%2.6%-1.5%
1 Year 5 Year
1.3%
0.3%
0.2%-4.2%
5.7%
-4.8%
% Change
1.9%
4.1%18.2%-9.2%
5.0%-1.9%
-3.0%-4.3%
28.8%
4.1%
11.5%-18.3%
-0.1%-0.6%-2.1%2.0%
2.2%
-29.0%
3.9%
5.7%4.3%
-0.6%
-6.1%
-
21.3%-17.7%-11.6%
-2.3%
-6.6%-14.9%-0.5%-7.3%
2.2%-22.2%2.7%4.1%
-34.5%-19.4%
0.0%
-9.9%-0.7%-2.2%
-5.6%
-11.8%
-6.6%35.3%-35.6%-1.3%
-19.6%-4.7%-0.7% -6.4%
-19.6%
-18.5%
-19.9%
-28.9%-26.7%-8.4%
-11.8%
-27.9%-26.6%
-10.4%-17.9%
-4.6%-3.2%
-33.4%-18.1%-17.1%-16.4%-33.5%
4.2%0.9%
10.5%-1.9%1.7%
-0.5%
4.8%-18.8%1.7%
-5.7%
-
6.1%-11.1%5.6%
-13.5%31.3%7.9%
-7.1%17.2%10.5%
-5.0%-

169 Back to Table of Contents
TABLE 7.6A – ANNUAL FULL-TIME UNDERGRADUATE TUITION AND MANDATORY FEES FOR FOUR-YEAR INSTITUTIONS: 2008-09 THROUGH 2017-18
RESIDENTInstitution 2008-09 2009-10 2010-11 2011-12 2012-13 2013-14 2014-15 2015-16 2016-17 2017-18
ASUJ 6,370 6,370 6,640 6,934 7,180 7,510 7,720 8,050 8,200 8,478ATU 5,430 5,610 5,908 6,258 6,528 6,918 7,248 7,740 8,280 8,880HSU 6,024 6,204 6,444 6,714 6,984 7,284 7,561 7,809 8,116 8,311
SAUM 5,646 6,066 6,426 6,786 7,146 7,386 7,656 7,896 8,196 8,346UAF 6,399 6,459 6,767 7,173 7,553 7,818 8,208 8,521 8,819 9,062
UAFS 4,410 4,600 4,918 5,267 5,436 5,625 5,962 6,322 6,701 6,935UALR 6,121 6,331 6,642 7,040 7,343 7,601 8,045 8,165 8,633 8,936
UAM 4,600 4,750 4,990 5,290 5,560 5,793 6,082 6,447 7,210 7,462UAPB 4,676 4,796 5,033 5,330 5,517 5,754 5,956 6,271 6,676 7,212
UCA 6,505 6,698 6,908 7,183 7,332 7,595 7,889 7,889 8,224 8,524
Average 5,618 5,788 6,068 6,398 6,658 6,928 7,233 7,511 7,906 8,214Average
% Change 6.21% 3.03% 4.82% 5.44% 4.07% 4.06% 4.39% 3.85% 5.25% 3.91%
NON-RESIDENTInstitution 2008-09 2009-10 2010-11 2011-12 2012-13 2013-14 2014-15 2015-16 2016-17 2017-18
ASUJ 14,290 14,290 14,860 12,238 12,610 13,120 13,480 14,215 14,260 14,778ATU 10,260 10,620 11,008 11,658 12,138 12,888 13,518 14,190 14,850 15,660HSU 10,944 11,304 11,784 12,324 12,864 13,404 13,921 14,409 14,956 9,961
SAUM 8,106 8,706 9,186 9,666 10,176 10,536 11,106 11,466 11,856 12,156UAF 15,276 15,336 16,000 17,606 18,435 19,075 20,299 21,825 23,168 24,308
UAFS 9,600 10,000 10,888 11,717 12,186 12,555 13,192 14,122 15,011 15,776UALR 14,303 14,798 15,590 16,550 17,213 18,076 19,029 19,235 20,888 21,191
UAM 8,770 9,010 9,640 10,510 11,050 11,590 12,052 12,297 13,060 13,312UAPB 9,236 9,476 9,983 10,595 10,947 11,424 11,626 12,053 12,706 13,464
UCA 11,605 11,903 12,143 12,569 12,830 13,340 13,806 13,806 14,447 15,047Average 11,239 11,544 12,108 12,543 13,045 13,601 14,203 14,762 15,520 15,565Average
% Change 6.23% 2.72% 4.88% 3.59% 4.00% 4.26% 4.43% 3.94% 5.14% 5.44%
SOURCE: ADHE FORM 18-1

170 Back to Table of Contents
TABLE 7.6B – ANNUAL FULL-TIME UNDERGRADUATE TUITION AND MANDATORY FEES FOR TWO-YEAR INSTITUTIONS: 2008-09 THROUGH 2017-18
RESIDENTInstitution 2008-09 2009-10 2010-11 2011-12 2012-13 2013-14 2014-15 2015-16 2016-17 2017-18
ANC 2,020 2,080 2,140 2,180 2,300 2,390 2,390 2,600 2,660 2,750ASUB 2,670 2,670 2,790 2,850 3,060 3,120 3,270 3,420 3,480 3,540
ASUMH 2,760 2,760 2,910 3,030 3,150 3,240 3,330 3,420 3,480 3,540ASUMS 2,280 2,570 2,720 3,080 3,270 3,670 3,790 3,790 3,880 4,000
ASUN 2,400 2,400 2,550 2,700 2,850 3,000 3,150 3,270 3,330 3,450BRTC 2,190 2,190 2,460 2,460 2,790 2,850 3,060 3,240 3,330 3,600
CCCUA 1,920 2,020 2,080 2,272 2,302 2,512 2,647 3,030 3,405 3,600COTO 2,130 2,252 2,312 2,402 2,507 3,182 3,310 3,620 3,620 3,680EACC 2,130 2,280 2,430 2,610 2,700 2,790 2,880 3,090 3,150 3,150NAC 2,460 2,460 2,580 2,700 2,910 3,090 3,090 3,270 3,330 3,510NPC 2,350 2,500 2,670 2,840 3,050 3,320 3,490 3,460 3,460 3,780
NWACC 3,460 3,603 3,813 4,098 4,348 4,513 4,513 4,633 4,633 4,683OZC 2,570 2,570 2,720 2,720 2,810 3,005 3,325 3,445 3,445 3,640
PCCUA 2,300 2,300 2,450 2,630 2,735 2,855 2,968 2,968 3,110 3,200SACC 2,410 2,470 2,620 2,890 3,010 3,140 3,290 3,380 3,510 3,660SAUT 3,030 3,180 3,270 3,420 3,630 4,050 4,050 4,140 4,140 4,500SEAC 2,320 2,320 2,770 2,830 2,980 3,010 3,070 3,070 3,220 3,460
UACCB 2,455 2,570 2,660 2,810 2,900 3,060 3,195 3,195 3,375 3,480UACCH 2,016 2,016 2,121 2,286 2,346 2,421 2,560 2,650 2,890 2,980UACCM 2,730 2,850 3,030 3,300 3,360 3,500 3,635 3,785 3,980 4,130
UACCRM 2,160 2,220 2,430 2,580 2,670 3,180 3,360 3,480 3,630 3,780UAPTC 2,660 2,800 2,860 2,980 3,183 3,563 4,013 4,650 5,280 5,460
Average 2,428 2,504 2,654 2,803 2,948 3,157 3,290 3,437 3,561 3,708Average
% Change 8.46% 3.11% 6.00% 5.62% 5.18% 7.09% 4.21% 4.45% 3.61% 4.13%
NON-RESIDENTInstitution 2008-09 2009-10 2010-11 2011-12 2012-13 2013-14 2014-15 2015-16 2016-17 2017-18
ANC 3,520 3,580 3,640 3,680 3,800 3,890 3,890 4,100 4,160 4,250ASUB 4,350 4,350 4,530 4,650 4,920 5,040 5,310 5,520 5,610 5,700
ASUMH 4,410 4,410 4,560 4,770 4,950 5,100 5,250 5,400 5,460 5,550ASUMS 3,930 4,370 4,520 5,180 5,490 9,370 9,490 4,990 5,080 5,200
ASUN 3,930 3,930 4,140 4,290 4,500 4,680 4,860 5,010 5,100 5,280BRTC 5,550 5,550 5,820 5,820 6,150 6,180 6,240 6,330 6,330 6,510
CCCUA 5,220 4,780 4,780 4,852 4,852 5,062 5,212 5,820 6,345 4,080COTO 3,810 4,022 4,112 4,262 4,457 5,732 5,950 6,110 6,410 6,530EACC 2,550 2,700 2,850 3,060 3,150 3,270 3,390 3,600 3,660 3,660NAC 4,590 4,590 4,710 4,830 5,040 5,220 5,220 5,400 5,460 5,700NPC 4,270 4,270 4,350 4,370 4,370 4,490 4,540 4,540 4,540 4,950
NWACC 4,653 4,863 5,163 5,598 5,923 6,088 6,088 4,708 4,708 4,758OZC 5,660 5,510 5,510 5,660 5,750 5,945 6,265 6,385 6,385 6,580
PCCUA 3,440 3,440 3,650 3,920 4,055 4,175 4,325 4,325 4,520 4,610SACC 4,240 4,360 4,600 4,930 5,170 5,360 5,540 5,660 5,790 5,940SAUT 4,260 4,500 4,590 4,740 4,950 5,490 5,490 5,580 5,580 5,940SEAC 4,360 4,360 5,110 5,230 5,440 5,470 5,590 5,590 5,860 6,280
UACCB 4,165 4,190 4,790 4,850 4,850 4,920 4,920 4,920 5,100 5,265UACCH 3,696 3,696 3,891 4,146 4,206 4,386 4,600 4,780 5,110 5,260UACCM 3,720 3,900 4,140 4,410 4,470 4,610 4,730 4,880 4,970 5,000
RMCC 5,190 5,280 5,430 5,640 5,790 6,330 6,600 6,750 6,900 7,050PTC 4,190 4,330 4,450 4,600 4,923 5,303 5,753 6,390 6,420 6,630
Average 4,259 4,317 4,515 4,704 4,873 5,278 5,421 5,309 5,432 5,487Average
% Change 6.43% 1.36% 4.59% 4.18% 3.59% 8.31% 2.71% -2.07% 2.32% 1.03%
SOURCE: ADHE FORM 18-1

171 Back to Table of Contents
TABLE 7.6C – 2017-18 FULL TIME ANNUALIZED FALL TUITION AND MANDATORY FEES COMPARED TO THE ESTIMATED SREB MEDIAN
UNIVERSITY UNDERGRADUATE RESIDENT2017-18 SREB
2017-18 2017-18 TUITION (PROJECTED)*INSTITUTION ANNUAL ANNUAL & 2017-18
TUITION FEES FEES TUITION & FEESUAF 7,384 1,679 9,062 10,308
LEVEL 1 GROUP AVERAGE 7,384 1,679 9,062 10,308 UALR 6,495 2,441 8,936 8,944
LEVEL 2 GROUP AVERAGE 6,495 2,441 8,936 8,944 ASUJ 6,300 2,178 8,478 8,201ATU 6,780 2,100 8,880 8,201UCA 6,523 2,001 8,524 8,201
LEVEL 3 GROUP AVERAGE 6,534 2,093 8,627 8,201 HSU 6,630 1,681 8,311 7,546SAUM 6,300 2,046 8,346 7,546
LEVEL 4 GROUP AVERAGE 6,465 1,864 8,329 7,546 UAM 4,650 2,812 7,462 6,955
LEVEL 5 GROUP AVERAGE 4,650 2,812 7,462 6,955 UAPB 4,908 2,304 7,212 6,907UAFS 4,989 1,946 6,935 6,907
LEVEL 6 GROUP AVERAGE 4,949 2,125 7,073 6,907
COLLEGE UNDERGRADUATE RESIDENT
Institution 2017-18 Annual Fees
2017-18 Projected
SREB Median*
IN-DISTRICT IN-STATE IN-DIST IN-STATEPTC 3,900 1,560 5,460 3,372NWACC 2,250 3,675 1,008 3,258 4,683 3,372
LEVEL 1 GROUP AVERAGE 2,250 3,788 1,284 3,258 5,071 3,372 ASUB 3,000 540 3,540 3,952NPCC 2,640 2,940 840 3,480 3,780 3,952
LEVEL 2 GROUP AVERAGE 2,640 2,970 690 3,480 3,660 3,952 ANC 2,070 2,370 380 2,450 2,750 3,444ASUMS 2,760 3,360 640 3,400 4,000 3,444ASUMH 2,880 660 3,540 3,444ASUN 2,880 570 3,450 3,444BRTC 2,760 840 3,600 3,444CCCUA 2,130 2,520 1,080 3,210 3,600 3,444COTO 2,850 830 3,680 3,444EACC 2,520 2,820 330 2,850 3,150 3,444NAC 2,130 2,880 630 2,760 3,510 3,444OZC 2,700 940 3,640 3,444PCCUA 2,100 2,490 710 2,810 3,200 3,444RMCC 2,400 2,820 960 3,360 3,780 3,444SACC 2,490 2,880 780 3,270 3,660 3,444SAUT 3,240 1,260 4,500 3,444SEAC 2,820 900 3,720 3,444UACCB 2,175 2,580 900 3,075 3,480 3,444UACCH 1,980 2,220 760 2,740 2,980 3,444UACCM 2,700 2,970 1,160 3,860 4,130 3,444
LEVEL 3 GROUP AVERAGE 2,314 2,780 796 3,071 3,576 3,444
*2017-18 SREB median inflated by 2.53% per year based on HEPI index three-year average.
2017-18 Tuition & Fees2017-18 Annual Tuition

172 Back to Table of Contents
TABLE 7.7 – UNRESTRICTED TUITION AND FEES AS A PERCENT OF TOTAL UNRESTRICTED EDUCATIONAL AND GENERAL EXPENDITURES: 2006-07 THROUGH 2015-16
Notes: 1. Includes ASU Heritage Sites 2. Includes Ozark Campus 3. Includes Community Education Center (CEC) 4. Fayetteville Campus Only 5. Includes Research and Public Service (RAPS). 6. Includes Crossett and McGehee Campuses 7. Includes 1890 Land Grant Universities Match 8. Includes Arkansas Delta Training and Education Consortium (ADTEC) 9. Includes AR Fire Training Academy and AR Environmental Training Academy
10 yr.2007 2008 2009 2010 2011 2012 2013 2014 2015 2016 Avg.
UniversitiesASUJ1 47.5% 48.2% 51.4% 53.8% 59.1% 59.0% 54.6% 57.3% 57.5% 57.2% 53.8%ATU2 49.1% 42.4% 49.7% 55.1% 60.9% 60.7% 57.0% 61.5% 63.6% 61.3% 55.8%HSU3 45.9% 46.8% 49.9% 52.4% 54.6% 55.2% 56.3% 55.2% 54.7% 52.5% 51.5%SAUM 47.4% 45.9% 46.0% 50.4% 51.7% 54.7% 53.3% 57.4% 58.5% 64.2% 52.1%UAF4 41.2% 42.1% 46.8% 50.4% 50.8% 56.5% 58.3% 60.2% 63.7% 65.9% 52.5%UAFS 37.3% 39.4% 42.5% 46.2% 49.5% 49.6% 50.7% 50.5% 51.7% 51.6% 45.8%UALR5 43.1% 42.8% 45.5% 47.7% 49.5% 49.9% 50.5% 50.4% 51.2% 50.3% 47.7%UAM6 39.7% 39.7% 41.5% 45.7% 49.3% 47.4% 39.3% 40.9% 48.9% 47.7% 43.6%UAPB7 33.5% 34.8% 41.1% 43.8% 41.2% 43.0% 44.7% 40.5% 36.8% 36.6% 39.3%UCA 50.4% 52.0% 51.6% 56.6% 54.8% 56.1% 56.0% 53.7% 60.1% 53.5% 54.1%
43.5% 43.4% 46.6% 50.2% 52.1% 53.2% 52.1% 52.8% 54.7% 54.1% 49.6%Colleges
ANC 28.6% 21.8% 27.6% 28.8% 32.0% 29.1% 17.7% 17.4% 18.4% 19.1% 24.3%ASUB 20.7% 14.8% 18.1% 24.5% 18.8% 21.6% 39.2% 38.7% 40.2% 38.6% 27.1%ASUMS8 29.8% 21.9% 29.3% 37.3% 38.1% 38.9% 37.7% 69.6% 36.7% 33.7% 35.9%ASUMH 32.4% 34.5% 34.7% 39.1% 39.8% 39.7% 41.0% 41.6% 40.9% 41.8% 37.8%ASUN 29.8% 28.3% 34.3% 37.6% 40.0% 39.7% 38.5% 33.7% 42.7% 40.3% 36.2%BRTC 37.6% 37.4% 33.3% 36.7% 29.6% 30.5% 44.2% 40.6% 40.3% 36.7% 37.1%CCCUA 30.2% 20.8% 34.5% 30.0% 40.0% 38.5% 32.3% 34.0% 37.5% 38.0% 33.6%COTO 32.0% 36.8% 31.9% 34.3% 36.1% 32.4% 31.2% 38.3% 42.0% 39.9% 35.7%EACC 28.5% 20.8% 26.5% 31.6% 32.6% 29.7% 30.5% 29.5% 28.4% 30.1% 28.8%NAC 27.3% 28.4% 28.5% 32.0% 34.2% 31.7% 35.9% 100.1% 32.2% 32.3% 37.4%NPC 26.3% 26.6% 32.7% 36.0% 39.4% 40.7% 40.7% 39.3% 38.2% 41.1% 35.0%NWACC 43.6% 48.1% 54.4% 56.4% 56.1% 54.7% 58.9% 59.3% 61.3% 57.4% 54.0%OZC 28.4% 32.8% 37.5% 41.3% 47.4% 45.0% 44.3% 43.7% 39.4% 38.9% 39.1%PCCUA 23.5% 24.0% 25.8% 20.8% 20.5% 23.9% 19.8% 19.8% 17.9% 17.1% 21.5%PTC 57.0% 54.4% 57.9% 63.2% 65.8% 61.5% 62.6% 62.5% 67.3% 62.6% 60.9%RMCC 25.5% 19.1% 25.9% 28.2% 34.4% 35.1% 35.9% 38.1% 36.9% 38.1% 30.8%SACC 28.7% 26.1% 31.7% 36.0% 38.5% 39.6% 38.6% 400.7% 39.9% 38.8% 67.5%SAUT9 32.8% 32.1% 37.3% 40.1% 41.2% 38.6% 31.7% 19.1% 36.9% 37.9% 34.2%SEAC 20.2% 26.5% 34.3% 35.0% 47.1% 35.3% 35.5% 28.9% 32.3% 31.4% 33.0%UACCB 30.1% 29.1% 33.4% 38.7% 35.3% 50.3% 35.5% 33.4% 33.7% 35.7% 35.5%UACCH 21.4% 22.0% 23.9% 27.1% 26.8% 25.2% 26.6% 23.5% 23.6% 25.8% 24.5%UACCM 38.6% 37.6% 38.1% 43.3% 48.1% 51.4% 44.1% 45.4% 46.5% 42.9% 43.3%
30.7% 29.6% 33.5% 36.6% 38.6% 38.3% 38.3% 59.0% 38.8% 38.1% 37.6%
Source: ADHE Series 17-1 and 17-2

173 Back to Table of Contents
APPENDICES.

174 Back to Table of Contents
APPENDIX 1 – INSTITUTIONAL ABBREVIATIONS
UniversitiesArkansas State University (Jonesboro) ASUJ Arkansas Tech University (Russellville) ATU Henderson State University (Arkadelphia) HSU Southern Arkansas University (Magnolia) SAUM University of Arkansas (Fayetteville) UAF University of Arkansas - Fort Smith UAFS University of Arkansas at Little Rock UALR University of Arkansas at Monticello UAM University of Arkansas at Pine Bluff UAPB University of Central Arkansas UCA
Arkansas Northeastern College (Blytheville) ANCArkansas State University - Beebe ASUB Arkansas State University Mid-South ASUMSArkansas State University Mountain Home ASUMHArkansas State University - Newport ASUN Black River Technical College (Pocahontas) BRTC Cossatot Community College of the UA (DeQueen) CCCUACollege of the Ouachitas (Malvern) CotOEast Arkansas Community College (Forrest City) EACC North Arkansas College (Harrison) NAC National Park College (Hot Springs) NPCNorthwest Arkansas Community College (Bentonville) NWACCOzarka College (Melbourne) OZC Phillips Community College of the UA (Helena) PCCUASouth Arkansas Community College (El Dorado) SACC Southern Arkansas University - Tech (Camden) SAUT Southeast Arkansas College (Pine Bluff) SEAC UA Community College at Batesville UACCBUA Community College at Hope UACCHUA Community College at Morrilton UACCMUA Community College at Rich Mountain (Mena) UACCRMUA - Pulaski Technical College (North Little Rock) UAPTC
Colleges

175 Back to Table of Contents
Non-Formula Institutions / EntitiesArkansas Delta Training and Education Consortium ADTECArkansas Research and Education Optical Network AREONASU - System Office ASU-SYSASU - Heritage Sites ASU-HeritageHSU - Community Education Center HSU-CECNWACC - Child Protection Training Center NWACC-CPTCSACC - Arboretum SACC - ArboretumSAUT - Environmental Training Academy SAUT-ETASAUT - Fire Training Academy SAUT-FTAUA - System Office UA-SYS UA - Archeological Survey UA-AS UA - Division of Agriculture UA-DivAgriUA - School of Mathematics, Sciences, and the Arts UA-ASMSAUA - Clinton School of Public Service UA-CSUA - Criminal Justice Institute UA-CJI UAF - Arkansas Research and Technology Park UAF-ARTPUAF - Arkansas Centers for Rural Education in Autism and Related Disabilities UAF-AutismUAF - Garvan Woodland Gardens UAF-GWGUAF - The David & Barbara Pryor Center for Arkansas Oral and Visual History UAF-Pryor CenterUAF - World Trade Center Arkansas UAF - WTC ARUALR - Research and Public Service UALR-RAPSUniversity of Arkansas at Pine Bluff (1890 Land Grant Universities Match) UAPB - NonformulaUniversity of Arkansas for Medical Sciences UAMS
Technical CentersUAM - College of Technology - Crossett UAM-CrossettUAM - College of Technology - McGehee UAM-McGehee

176 Back to Table of Contents
APPENDIX 2 – GLOSSARY OF COMMONLY USED TERMS AND ACRONYMS
TERM/ACRONYM DEFINITION CRITICAL MAINTENANCE Essential repairs to educational & general (E&G) buildings that if
neglected could cause substantial cost or damage and includes such items as roofs, foundations, or HVAC systems.
EETF – EDUCATION EXCELLENCE TRUST FUND
General revenue funding source from the ½ cent sales tax enacted for secondary, vocational and higher education in 1991 the distribution of which is codified in A.C.A. §6-5-302.
FCI – FACILITY CONDITION INDEX A percentage measure of how much of the campus infrastructure has been consumed based on the institutional E&G maintenance need divided by the E&G current replacement value (CRV).
FORMULA/NON-FORMULA INSTITUTIONS Formula entities are traditional institutions of higher education that generate FTE, which can be applied to a funding distribution model. Non-formula entities are outreach/service divisions of systems or institutions that do not generate FTE or generate a level of FTE that is minimal compared to the scope of their mission. For example, University of Arkansas Medical Sciences does generate a minimal level of FTE; however, the scope of UAMS includes research and hospital units that are beyond the traditional academic focus.
FTE – FULL-TIME EQUIVALENT Student Semester Credit Hours (SSCH) divided by 30 hours for undergraduate and divided by 24 hours for graduate FTE.
GIF – GENERAL IMPROVEMENT FUND Monies generated from interest and lapsed general revenues and appropriated every biennium primarily for the financing of capital improvement.
IPEDS – INTEGRATED POSTSECONDARY EDUCATION DATA SYSTEM
Web-based data collection system for the National Center for Education Statistics (NCES) utilized by institutions of higher education.
SREB – SOUTHERN REGIONAL EDUCATION BOARD
A nonprofit, nonpartisan organization that helps government and education leaders work together to advance education and improve the social and economic life of the region. The SREB maintains regional databases for K-12 and higher education and publishes numerous reports annually.
RSA – REVENUE STABILIZATION ACT Biennial formula distribution of general revenue allocations designed to prevent deficit spending. EETF and WF2000 distributions are not included as RSA allocations.
WF2000 – WORKFORCE 2000 FUND Funding source for technical colleges, former technical colleges and technical institutes generated from ½ percent tax on corporate incomes in excess of $100,000 the distribution of which is codified in A.C.A. §26-51-205.

177 Back to Table of Contents
APPENDIX 3 – ARKANSAS PUBLIC HIGHER EDUCATION INSTITUTIONS

178 Back to Table of Contents
APPENDIX 4 – ARKANSAS HIGHER EDUCATION INSTITUTIONS BY COUNTY
County Institution CityArkansas PCCUA DewittArkansas PCCUA StuttgartAshley UAM CrossettBaxter ASUMH Mountain HomeBenton NWACC BentonvilleBenton NWACC RogersBoone NAC Harrison (Three Campuses)Bradley SACC WarrenCarroll NAC BerryvilleClark HSU ArkadelphiaCleburne ASUB Heber SpringsColumbia SAU MagnoliaConway UACCM MorriltonCraighead ASUJ JonesboroCrittenden ASUMS West MemphisDesha UAM McGeheeDrew UAM MonticelloFaulkner UCA ConwayFranklin ATU OzarkFulton OZC Mammoth SpringGarland NPC Hot SpringsGreen ANC ParagouldGreen ASUJ ParagouldGreen BRTC ParagouldHempstead UACCH HopeHot Spring COTO MalvernHoward CCCUA DierksHoward CCCUA NashvilleIndependence UACCB BatesvilleIzard OZC MelbourneJackson ASUN NewportJefferson SEAC Pine BluffLawrence BRTC Walnut Ridge (Fire Training Center)Little River CCCUA AshdownMississippi ANC BlythevilleMississippi ANC BurdetteMontgomery UACCRM Mt. IdaOuachita SAUT Camden

179 Back to Table of Contents
County Institution CityPhillips PCCUA Helena-West HelenaPike CCCUA MurfreesboroPolk UACCRM MenaPop ATU RussellvillePulaski ASUB JacksonvillePulaski UAPTC Little Rock - SouthPulaski UAPTC Little Rock-AirportPulaski UAPTC Little Rock-WestPulaski UAPTC North Little Rock (Main Campus & Aerospace Center)Pulaski UALR Little RockPulaski UAMS Little RockRandolph BRTC PocahontasSaline COTO Benton Services CenterSaline PTC BauxiteSaline PTC BentonSaline UALR BentonScott UACCRM WaldronSebastian UAFS Fort SmithSevier CCCUA DeQueenSharp OZC Ash FlatSt. Francis EACC Forrest CityStone OZC Mountain ViewUnion SACC El DoradoWashington NWACC FarmingtonWashington NWACC Fayetteville West CampusWashington NWACC Springdale (Washington County Center & Jones Center)Washington UAF FayettevilleWashington UAMS FayettevilleWhite ASUB BeebeWhite ASUB Searcy