toolsof the trade - Virginia Department of Criminal Justice ...
Upload
khangminh22Category
view
1download
0
0
1
Executive Summary Georgia’s 149 accountability court programs offer an alternative to traditional adjudication and incarceration for nonviolent offenders charged with a variety of drug crimes and DUI. At the time this study began, there were 133 programs reporting enrollment and graduation figures for fiscal year (FY) 2017. Several new courts began operations in FY 2017 but had not reported data on their participants. Therefore, this study considers the enrollment levels of the 133 reporting programs. This number includes 53 drug courts and 21 DUI courts, which are the oldest types. The 18 family treatment courts are among the newest programs and seek to assist defendants charged with substance abuse, domestic violence, and other crimes whose offenses affect young children. The goal of these programs is to assist the participant in overcoming his or her destructive behavior and keep the family intact. The 28 mental health court programs and 15 veterans court programs have similar goals for defendants who are dealing with mental illness or with stress related to military service, especially those suffering from post-traumatic stress disorder. This study identifies the costs and benefits that accrue to state and local governments as well as society generally from the work of these programs in helping participants lead productive lives while overcoming their destructive addictions and behaviors.
The Council of Accountability Court Judges (CACJ) and the Criminal Justice Coordinating Council (CJCC) contracted with the University of Georgia’s Carl Vinson Institute of Government to estimate the fiscal and other benefits that accrue from the state’s accountability courts. Faculty at the Institute of Government found that the economic benefits of accountability courts exceed $22,000 per graduate. This study also found that on average accountability courts costs are almost $5,000 less than the costs for traditional adjudication per defendant when considering both state and local costs.
Data from the CJCC indicate that state grants to accountability court programs and appropriations to the offices of prosecuting attorneys and public defenders provide $4,841 per program participant annually, or about $9,680 for a typical 24-month program. By contrast, a year of incarceration by the Georgia Department of Corrections costs $20,075. Georgia’s accountability court programs also use local resources and, occasionally, federal grant funds for program delivery. When funds from all sources are considered, the Institute of Government research team estimates that accountability court participants cost $4,707 less than defendants in traditional adjudication and incarceration for the typical 24-month program. Defendants who go through traditional adjudication and serve one year in state prison cost the state and local governments an estimated $20,230 in post-sentencing costs. The estimated cost for an accountability court graduate is $15,523, with about $9,680 (62.4 percent) coming from state funds. In addition, participants pay weekly or monthly fees to the court program, further defraying program costs. Accountability court participants also contribute to the state’s

2
economy by paying taxes, supporting their families, and helping the state avoid costs for health care and social programs. This study calculates that each graduate of these programs produces benefits that exceed $22,000 in state and local government savings, additional revenues, and other contributions to the state’s economic well-being.
While drug courts were originally created to deal with increases in caseloads, most drug court programs nationally have demonstrated reduced recidivism among participants compared to defendants who go through traditional adjudication. A review of more than 150 studies of drug court programs suggests that these programs reduce recidivism for participants compared to nonparticipants by about 12 percentage
points, from 50 percent to 38 percent. The recidivism rate for program graduates is even lower at about 15 percent nationally.
The Institute of Government surveyed 463 accountability court program participants in 32 programs of all types to determine the benefits of taking part in the programs for their families and their communities. Program coordinators were instructed to have recent program graduates and participants nearing graduation complete the survey. Using the survey results, the research team was able to estimate the economic benefits of those who have succeeded in the programs. The Institute research team also reviewed the literature on accountability courts to determine how much these programs cost and to identify additional benefits to society. From the information gathered, the researchers estimated the benefits of one accountability court program graduate to be $22,129. Georgia’s accountability court programs graduated 1,7071 persons in FY 2017. For those 1,707 program graduates, the total estimated benefit is $37.7 million.
The major benefits of the accountability court programs stem from the continued productivity of these individuals as they earn income, provide basic support to their families, and cover their health insurance needs. Babies born to program participants are much less likely to suffer from neonatal abstinence syndrome (NAS) as their mothers are much more likely to be drug-free during pregnancy. Participants work and pay taxes, contributing to the Georgia economy. In addition to gainful employment, participants contribute to government and nonprofit agencies
1 Final data on the number graduates from all court programs in FY 2017 increased to 1,729 after work on this study was largely complete. The additional 22 graduates do not change the analysis in a material way.

3
through community service as part of their regular program or as sanctions for program transgressions. The goal of community service is largely to help participants develop as individuals and contribute to worthwhile causes.
Additional costs to the state are avoided by keeping the children of participants out of the foster care system and from reduced recidivism and the victimization costs that subsequent criminal activity would impose on society.
For the 1,707 program graduates in FY 2017, the total estimated benefits of accountability court programs to state and local governments and to society are substantial:
• $37.7 million in total benefits o $8.0 million in reduced adjudication and incarceration costs o $3.3 in program fees paid by participants o $8.0 million in health care benefits from private health insurance and avoided
NAS birth costs o $1.2 million in state income tax revenues o $1.9 million in community service work o $3.9 million in foster care costs avoided o $11.4 million in crime victimization costs avoided from subsequent criminal
offenses

4
The Estimated Economic and Fiscal Impacts of Georgia’s Accountability Courts INTRODUCTION The Council of Accountability Court Judges (CACJ) and the Criminal Justice Coordinating Council (CJCC) contracted with the University of Georgia’s Carl Vinson Institute of Government (Institute of Government) to estimate the fiscal and other benefits that accrue from the state’s accountability courts, primarily drug courts and DUI courts, but also mental health courts, veterans courts, and family treatment courts. A good number of studies conducted across the United States have determined that accountability court programs generally reduce recidivism among nonviolent offenders and lower the costs to state and local governments through reduced incarceration. The CACJ and CJCC asked the Institute of Government to determine the value of other benefits resulting from program participants’ gainful employment, support of their families, and contributions to the state’s economy.
THE ROLE AND PURPOSE OF ACCOUNTABILITY COURTS Accountability courts offer an alternative to traditional adjudication and incarceration to nonviolent offenders, most commonly in response to an arrest for crimes related to drug use (drug courts) and DUI offenses (DUI courts). Accountability courts have also been established that tailor treatment for a wide range of offenses committed by defendants who have families, especially those with young children (family courts); those who are struggling with mental health issues (mental health courts); or those who are dealing with stresses related to military service, especially those stemming from post-traumatic stress (veterans courts). These programs combine judicial oversight of offenders with treatment, counseling, and behavior modification to address the underlying issues or extenuating circumstances. The first DUI courts in Georgia were established in 2002 in three counties: Chatham, Hall, and Clarke. Today Georgia has 149 accountability court programs, shown in Figure 1.
The first drug court program in the nation began in 1989 in Dade County, Florida.2 At that time, researchers and practitioners believed that numerous offenders were pleading guilty, serving a sentence, and then reoffending shortly after release. Drug courts sought to close this “revolving door” by implementing a comprehensive approach to criminal justice and expanding the
2 James L. Nolan. 2001. Reinventing Justice: The American Drug Court Movement. Princeton, NJ: Princeton University Press.

5
options available for adjudication from traditional detention to treatment, supervision, and other sanctions for drug offenders. By taking a rehabilitative approach to offenders, drug courts have focused on several common goals: intensive drug treatment, close supervision, and offender accountability.3
TYPES OF ACCOUNTABILITY COURTS IN GEORGIA There are seven types of accountability court programs in Georgia under the purview of the CACJ, five adult programs and two in the juvenile justice system. The scope of this study is to measure the impacts of the adult programs only. The five types of adult accountability courts—drug, DUI, family, mental health, and veterans—were described briefly in the previous section. These programs operate in phases, usually four or five, that begin with close monitoring of participants’ activities and behaviors in the first phase, coupled with counseling, often both individually and in group sessions. As participants are promoted to the second and each subsequent phase, court appearances, other oversight, and counseling activities are reduced, and the participants become more and more responsible for progress toward eliminating their destructive behavior. Many programs have work requirements, impose fees on participants to defray program costs, and require those without a high school education to complete a general equivalency diploma (GED).
The most common type of accountability court is the felony drug court. In Georgia, drug court programs are authorized by O.C.G.A. § 15-1-5, which states, in part:
(a) (1) Any court that has jurisdiction over any criminal case which arises from the use, sale, possession, delivery, distribution, purchase, or manufacture of a controlled substance, noncontrolled substance, dangerous drug, or other drug may establish a drug court division to provide an alternative to the traditional judicial system for disposition of such cases.
While drug courts were originally created to deal with increases in caseloads and the revolving door mentioned above, most drug court programs nationally have demonstrated reduced recidivism among participants compared to defendants who go through traditional adjudication. A review of more than 150 studies of drug court programs suggests that these
3 James C. Fell, A. Scott Tippetts, and E. A. Langston. 2008. An Evaluation of the Process and Impact of Three Georgia DUI Courts. Pacific Institute for Research and Evaluation. Washington, DC: National Highway Traffic Safety Administration.

6
programs reduce recidivism by about 12 percentage points, from 50 percent to 38 percent. For program graduates, the recidivism rate is even lower, about 15 percent.4
DUI court programs are authorized by O.C.G.A. § 15-1-19 and are designed to deal with the underlying issue of alcohol abuse resulting in operation of a vehicle while impaired. In many court systems, judges may sentence an offender to the DUI court program upon a second or third DUI offense within a specific length of time. For example, the DUI Court Program in Chatham County states the following on its website:
The sentencing judge may sentence anyone with two DUIs in a five year period, or three DUIs in a lifetime to participate. After sentencing, the court mandates substance abuse treatment, 12-step meeting attendance, random drug tests, biweekly court appearances and more, as a condition of probation.5
Failure to meet the requirements of the program typically result in sanctions or revocation of probation, in which case the defendant returns to court for sentencing.
Mental health courts are authorized by O.C.G.A. § 15-1-16 and are intended to address the treatment needs of defendants charged with a wide range of offenses “who meet diagnostic criteria for severe and persistent mental illness and/or dual diagnosis and whose needs can be met by the program.”6 After expert diagnostic evaluation, the treatment team tailors a plan of treatment specific to the needs of the defendant. At the core of a mental health court program are services that include the following:7
• Group counseling • Individual counseling • Drug testing • Psychosocial rehabilitation • Family support • Medication management
4 Mitchell, Ojmarrh, David B. Wilson, Amy Eggers, and Doris L. MacKenzie. 2012. Assessing the effectiveness of drug courts on recidivism: A meta-analytic review of traditional and nontraditional drug courts. Journal of Criminal Justice 40(1): 60–71. 5 www.chathamcourts.org/state-court/dui-court-program 6 www.georgiacourts.org/sites/default/files/Accountability%20Courts/ Standards/Section%20IV%20Adult%20Mental%20Health%20Court%20Treatment%20Standards.pdf 7 www.georgiacourts.org/sites/default/files/Accountability%20Courts/Standards/ Section%20IV%20Adult%20Mental%20Health%20Court%20Treatment%20Standards.pdf

7
According to the Georgia Administrative Office of the Courts, mental health court programs should ideally offer the following:
• Family counseling • Gender-specific counseling • Domestic violence counseling • Health screening • Assessment and counseling for co-occurring substance use issues
Family treatment courts are authorized by O.C.G.A. § 15-11-70, which states that the goal of a family treatment court division is to8
• Reduce alcohol or drug abuse and addiction for respondents in dependency proceedings;
• Improve permanency outcomes for families when dependency is based in part on alcohol or drug use and addiction;
• Increase the personal, familial, and societal accountability of respondents in dependency proceedings; and
• Promote effective intervention and use of resources among child welfare personnel, law enforcement agencies, treatment providers, community agencies, and the courts.
The family treatment court model is designed to reduce foster care stays and restore children to their parents in a stable family unit. Like the mental health court program, treatment and counseling programs are tailored for each participant. Treatment may vary depending on the type of drug abuse involved—alcohol, controlled substances, or uncontrolled substances—and the need to address physical abuse of family members.
Veterans courts, authorized under O.C.G.A. § 15-1-17, are structured on the model of drug and mental health court programs. Georgia law states that a judge may refer any criminal case in which the defendant is a veteran to a veterans court program except for murder, armed robbery, and those involving sexual assault.9 A key feature of veterans court programs is the assistance of a veteran mentor who has some understanding of the issues affecting the participant.
8 www.gaaccountabilitycourts.org/15-11-70%20Family%20treatment%20court%20division.pdf 9 www.gaaccountabilitycourts.org/15-1-17_Veterans.pdf

8
Figure 1. Accountability Courts in Georgia
In its Adult Felony Drug Court Policy and Procedures Manual, the CACJ describes a typical accountability court program in Figure 2.10
10 www.gaaccountabilitycourts.org/Mock%20Manual_Felony-1.pdf

9
Figure 2. Accountability Court Phases
10
Participants who reach the final phase of a program have largely accomplished the goals set for them and are often used as role models for people entering the programs. In the final phase, the participant has demonstrated his or her ability to succeed, often feels a sense of accomplishment, and is typically invested in the program emotionally as well as financially.11
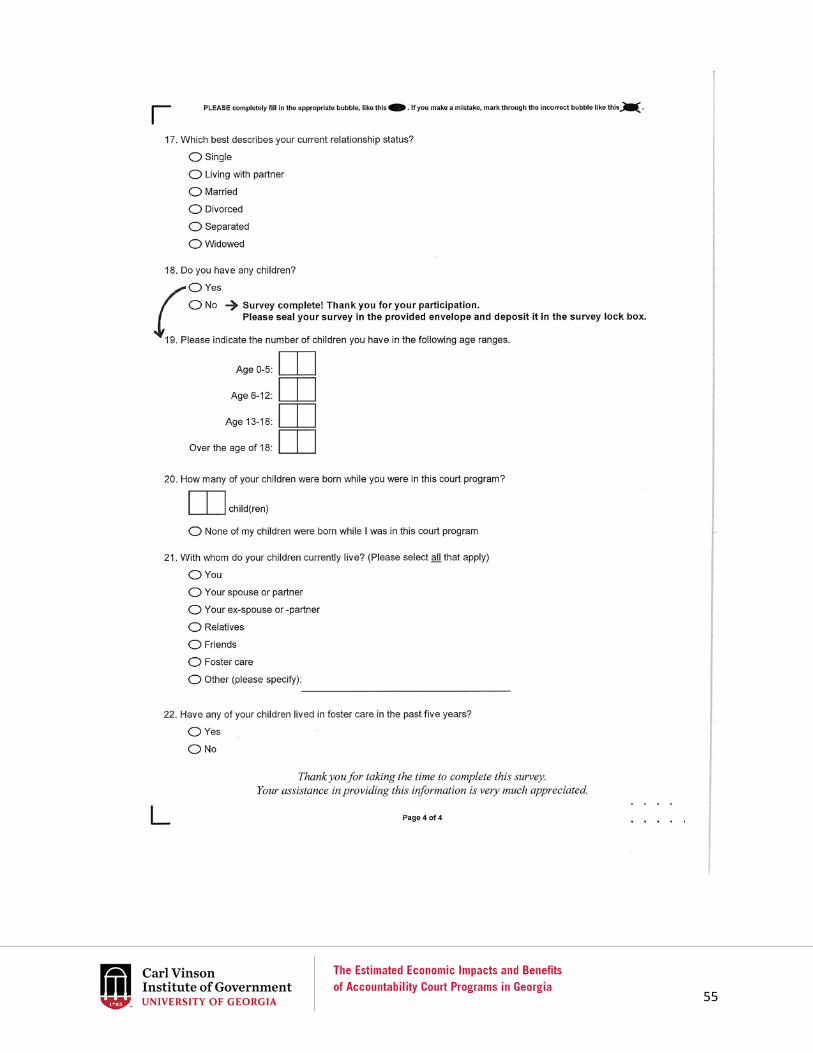
PARTICIPANT SURVEY Estimating the economic and fiscal benefits of accountability court programs requires data about participants’ family and work status, and other activities and behaviors related to their participation in the program. The Institute of Government research team developed a survey instrument to obtain demographic data from participants, information about their marital status, and the ages of their children. The survey also requested information about their employment status, hours of community service work performed, whether they had health insurance for themselves and family members, and the amount of program fees they had paid to offset the accountability court program costs. The survey instrument is included as Appendix A.
Using survey data to make inferences about all participants in accountability court programs in Georgia requires that survey respondents be representative of all program participants. To help ensure that the respondents are representative of all participants statewide, the Institute researchers and program experts at CJCC and CACJ selected 32 accountability court programs from across the state to participate in the survey. These programs, shown in Figure 3, are drawn from urban and rural areas, and represent each geographic region of the state.
The Institute of Government researchers contacted each program coordinator to obtain an estimate of the number of survey forms required. The program coordinators were instructed to administer the survey to participants who had reached the final phase of the program as well as to any former participants they were in contact with who had graduated within the past 12 months. Participants in earlier phases of their programs were not included because most would still be in the stabilization and recovery stages. Prior research indicates that people who are dismissed from accountability court programs, and thus do not reach the final phase, are as costly or more costly to the judicial and corrections systems as defendants who go through traditional adjudication.12 For these reasons, the economic benefits of these programs essentially accrue to those who succeed and graduate. Research also indicates that those who reach the final phase of a program are very likely to graduate and realize the benefits of their treatment.
11 www.myajc.com/news/public-affairs/thankful-and-thriving-georgia-drug-court-grads-flourish/Yt5xCCFtj3sRVvL1K1eI0K/ 12 Eric L. Sevigny, Brian K. Fuleihan, and Frank V. Ferdik. 2013. Do drug courts reduce the use of incarceration? A meta-analysis. Journal of Criminal Justice 41: 416–425

11
For example, a 2014 study of the Forsyth County Drug Court reported that 35 of 54 participants admitted to the program from July 1, 2007, to December 31, 2009, reached the final phase of the program and all 35 graduated.13
Figure 3. Map of Programs Included in the Survey
13 Wes Clarke. 2014. The Forsyth County Drug Court: A Ten Year Perspective. Athens, GA: Carl Vinson Institute of Government.
12
The survey was conducted from August 1 to September 26, 2017. Each program administrator was sent the survey forms, envelopes, instructions for administration of the survey, and a tamper-proof lockbox into which participants placed their completed surveys. Participants first placed the completed survey into an envelope, sealed it, and deposited the envelope into the lockbox through a slot on the end. Because the survey asked respondents to report the amount of fees they had been assessed, the amount in fees that they had paid, and the number of community service hours completed, coordinators were instructed to provide these figures to participants at the time the survey was administered, but to provide no other assistance to participants in completing the survey. Eighty percent of respondents (360 of 452) provided data on fees and community service hours (see Table 6). The survey administration protocols ensured participant privacy, and the court program staff had no access to any completed survey forms. The secured lockboxes were returned to the Institute of Government via United Parcel Service or were picked up by Institute faculty at the court program offices. Participants were told that program staff would not have access to their completed forms and that completion of the survey was voluntary. The instructions further indicated that they did not have to answer any questions on the form and that they could stop at any point if they decided not to answer the remainder of the survey.
All 32 administrators returned survey responses, and 463 participants completed the survey. Of those, 11 were not completed sufficiently to provide usable data, resulting in a data set of 452 responses. Some of the 452 survey forms had missing items. The number of participant surveys received from each court program is shown in Appendix B.
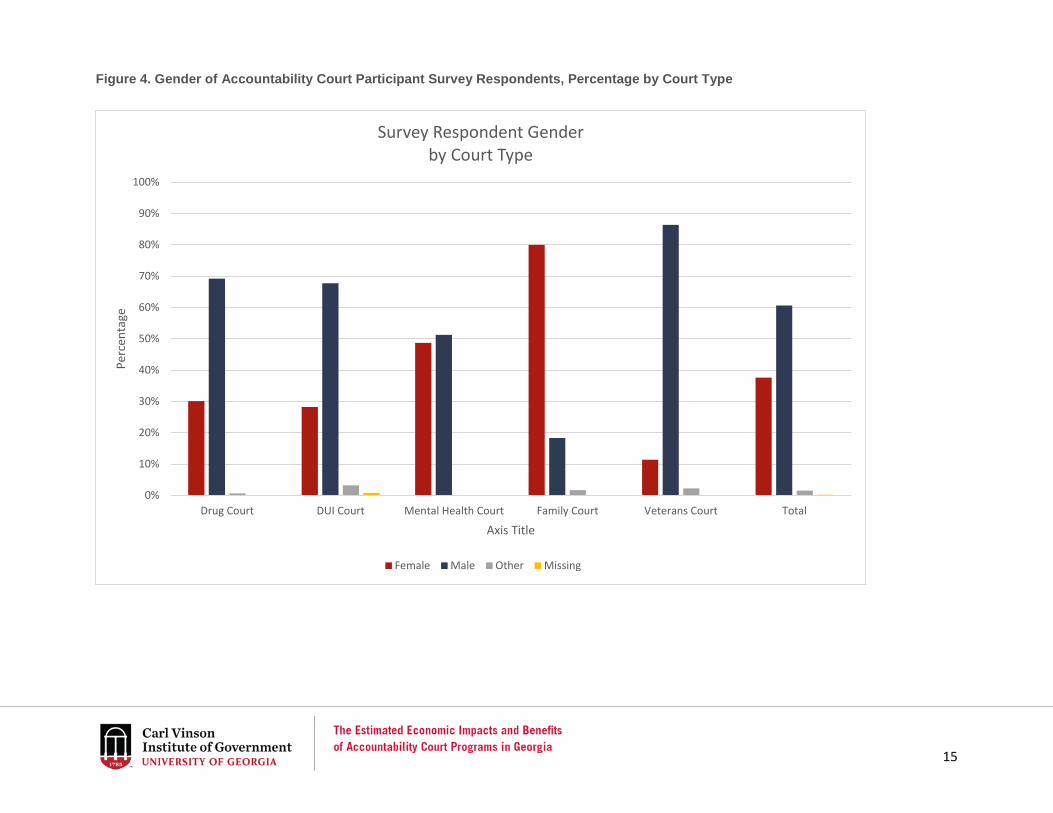
Just over 60 percent of all respondents were male (see Table 1). Males accounted for about two-thirds of all respondents in the drug and DUI court programs and 86 percent of those in veterans court programs. Mental health court participants were nearly evenly divided between males and females—51.3 percent and 48.7 percent, respectively—while females accounted for 80 percent of participants in family treatment court programs.
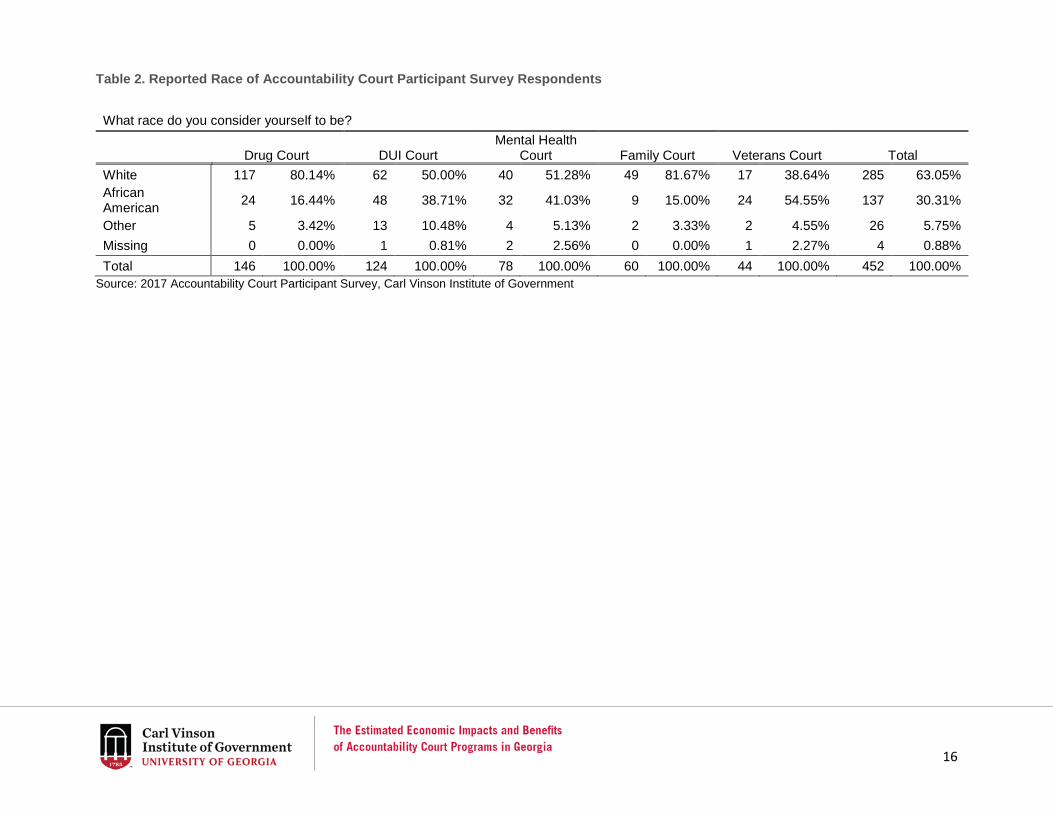
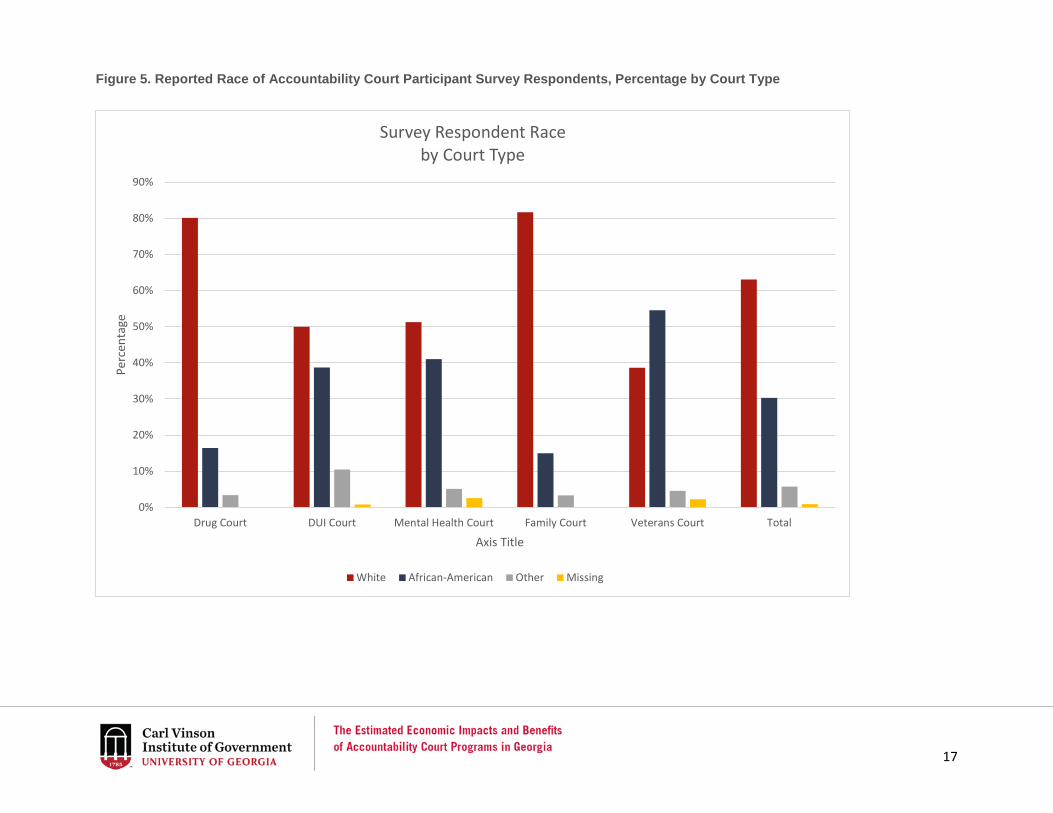
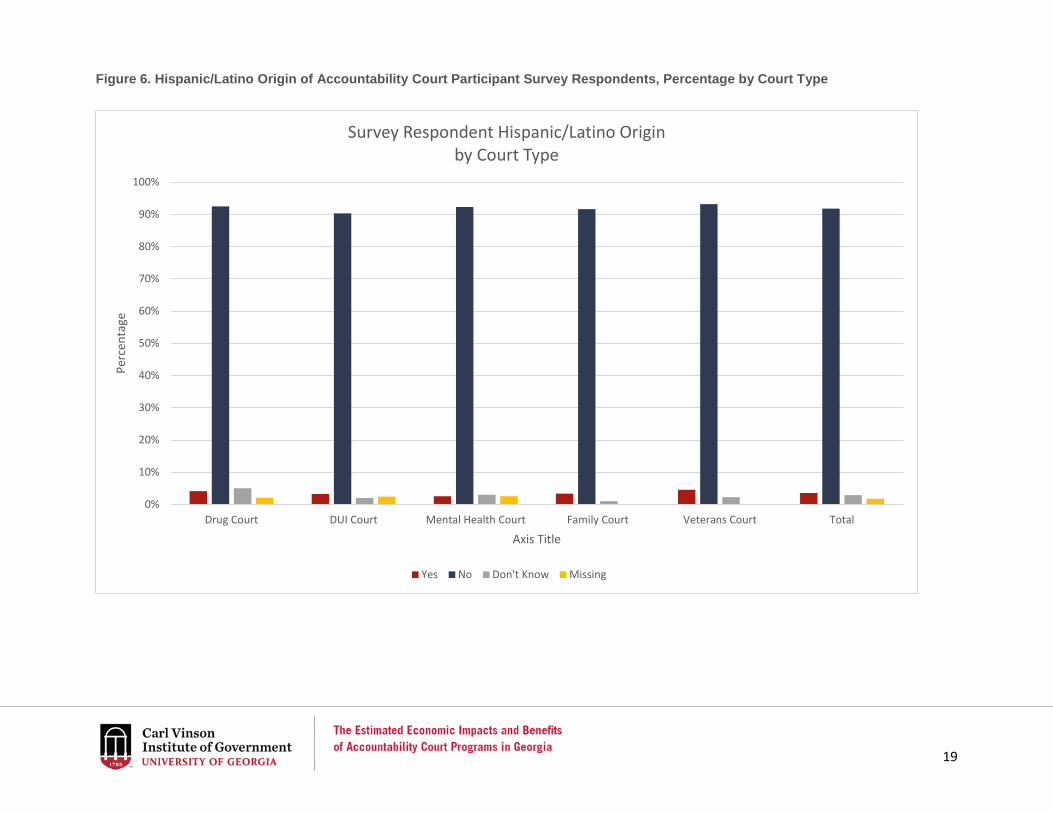
Overall, 63 percent of accountability court program participants in the survey sample identified as White, while 30 percent identified as African American (see Table 2). Whites made up around 80 percent of drug court and family court participants and about half of DUI and mental health courts. African Americans, however, made up 55 percent of those in veterans court programs. Table 3 indicates that less than 4 percent of respondents identified as Hispanic or of Latino or Latina origin.
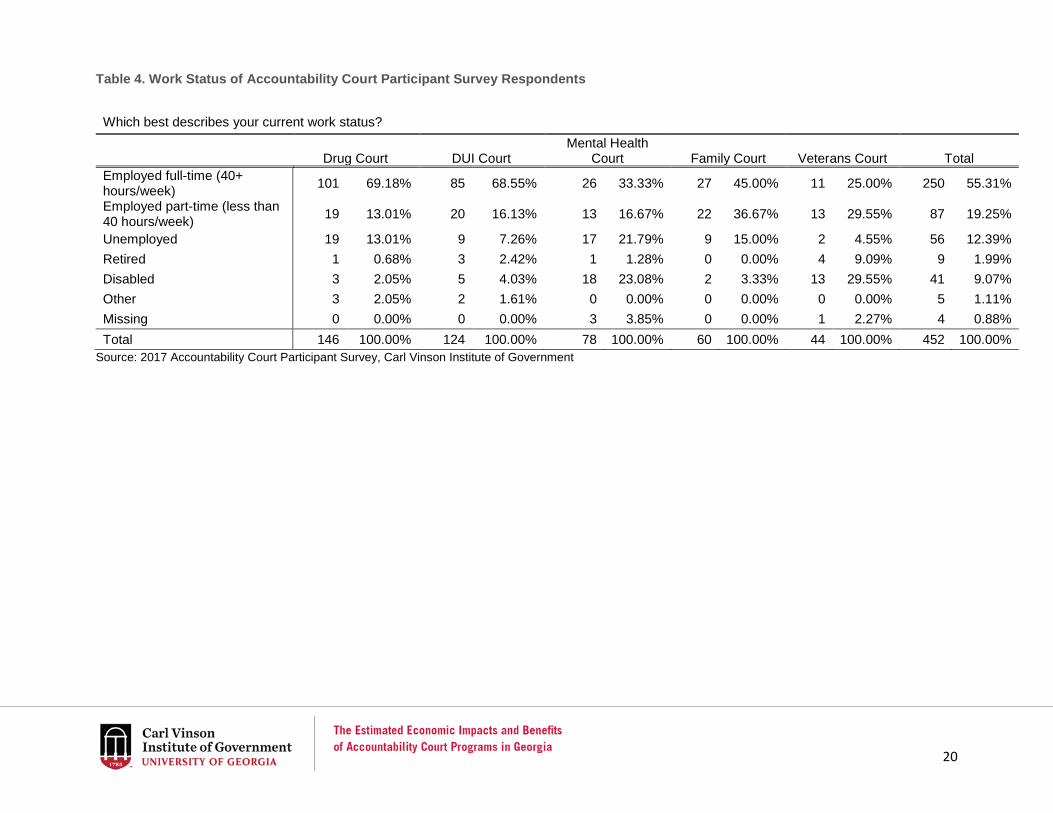
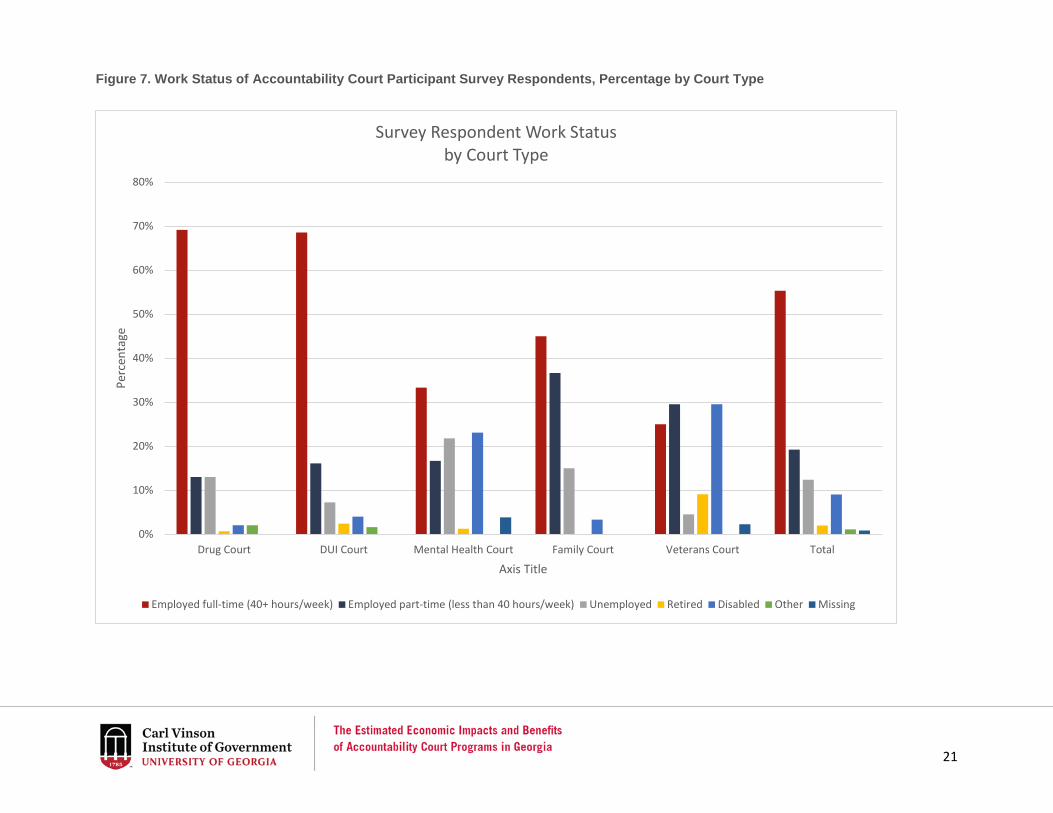
More than two-thirds of participants in the drug and DUI court programs reported that they were employed full time, with another 13 percent and 16 percent, respectively, reporting at least part-time employment (see Table 4). Only 13 percent of drug court participants and 7 percent of

13
DUI court participants reported that they were unemployed. More than 90 percent of family treatment court participants indicated either full-time (45.0 percent) or part-time employment (36.7 percent).
Only one-third of mental health court participants indicated that they were employed full time, with about another 17 percent indicating part-time employment. One-quarter of veterans court participants were employed full time, and about 30 percent indicated part-time employment.
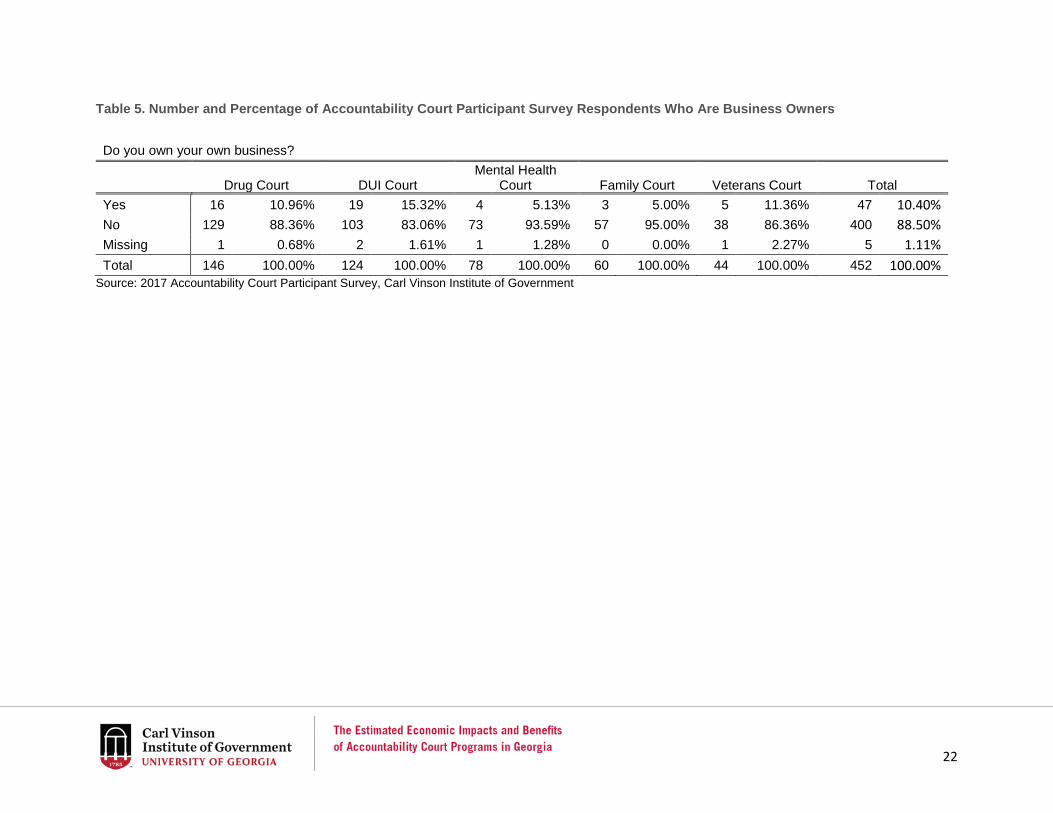
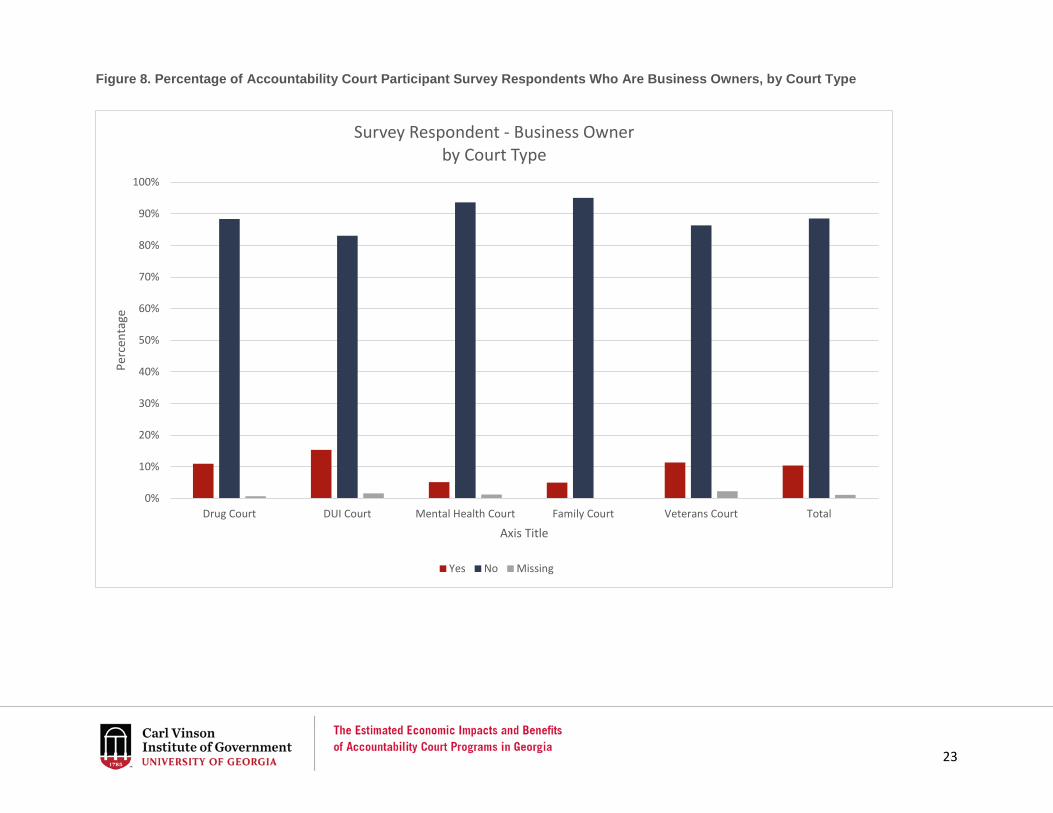
A small minority (10.4 percent) of respondents owned their own business, with the largest percentage (15.3 percent) among DUI court participants (see Table 5).
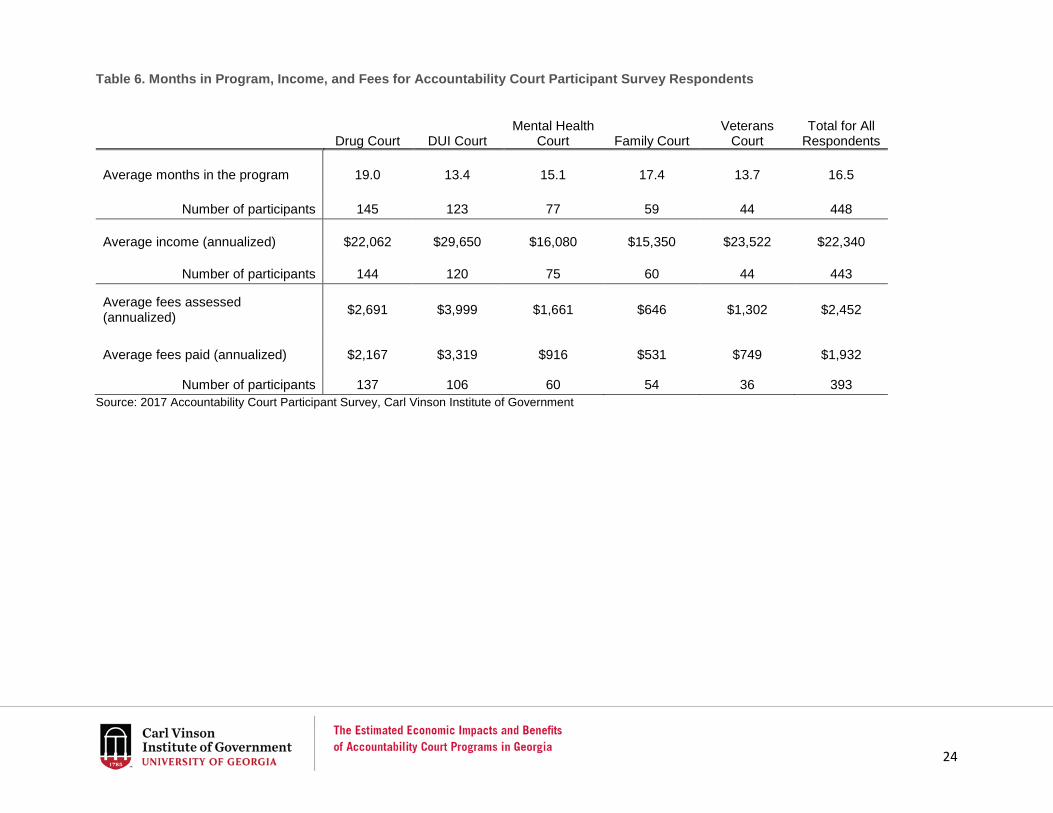
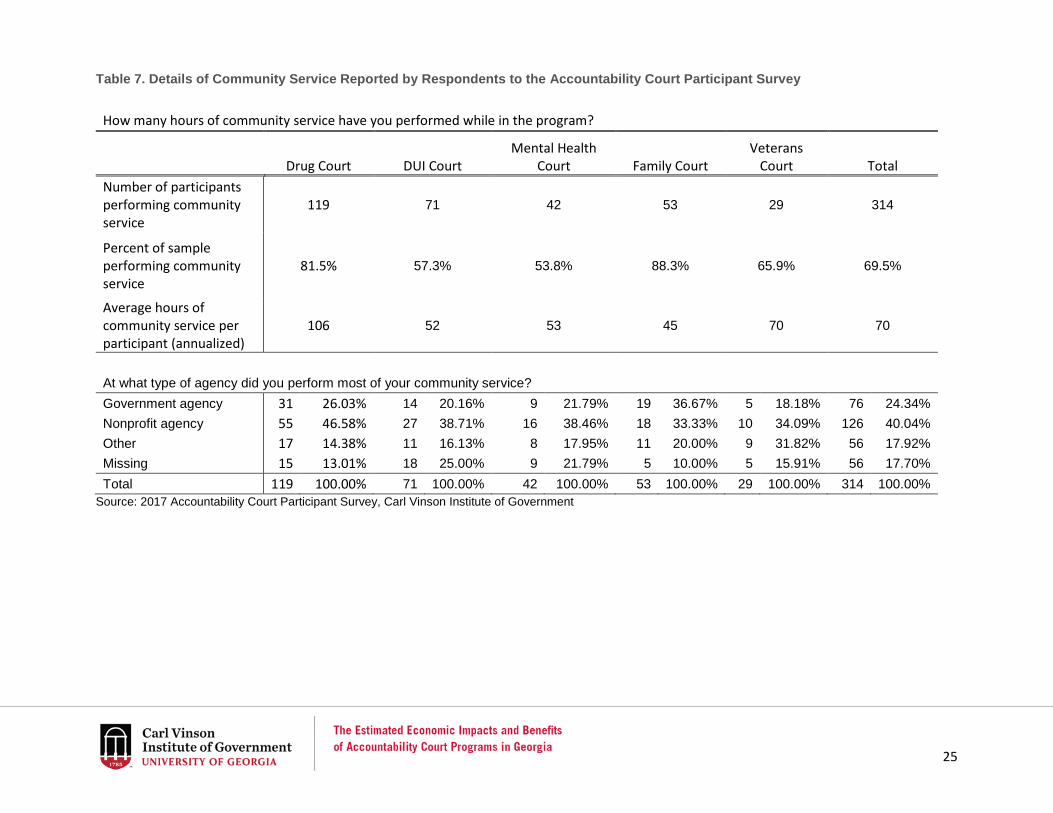
The average length of time for respondents in their court program was 16.5 months, with drug court participants having the longest length at 19.0 months and DUI court participants the shortest at 13.4 months (see Table 6). The average annual income of all participants in these programs was $22,340, about 40 percent of the 2015 Georgia median household income of $55,775. Most respondents had paid nearly 80 percent of their annualized assessed fees ($1,932 of $2,452). Respondents had performed an average of 70 community service hours (see Table 7), with drug court participants performing the greatest number of hours (106) and family treatment court participants the least (45).
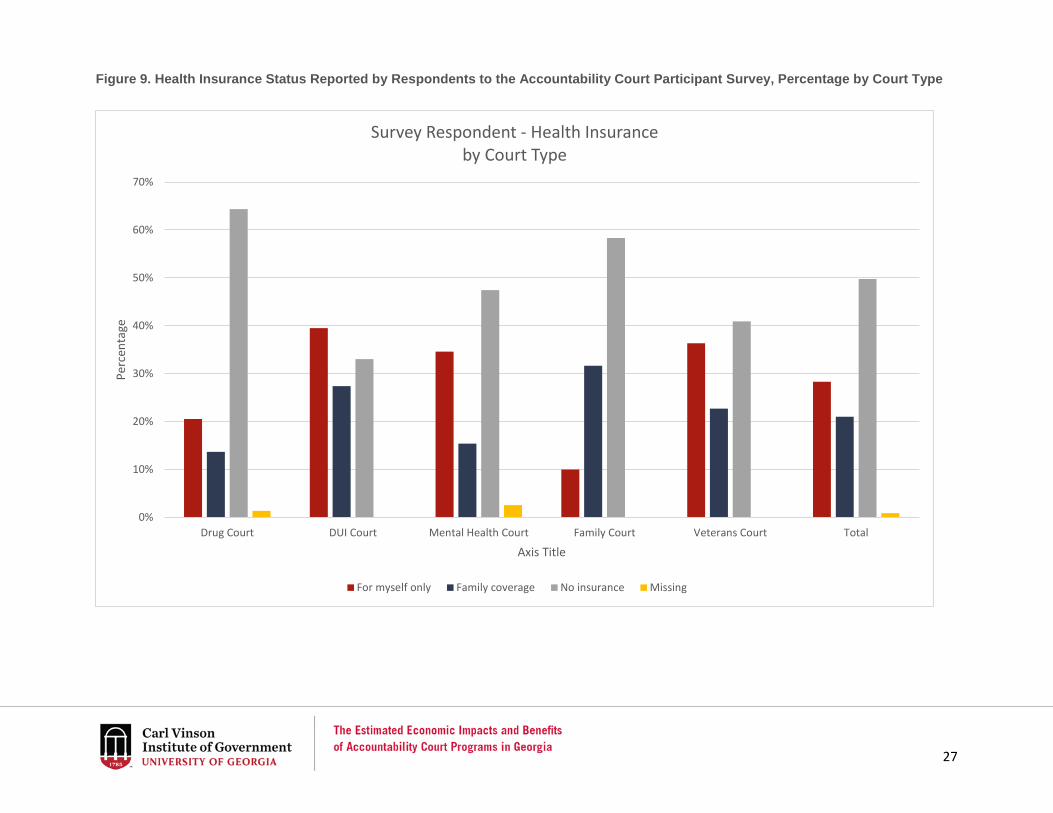
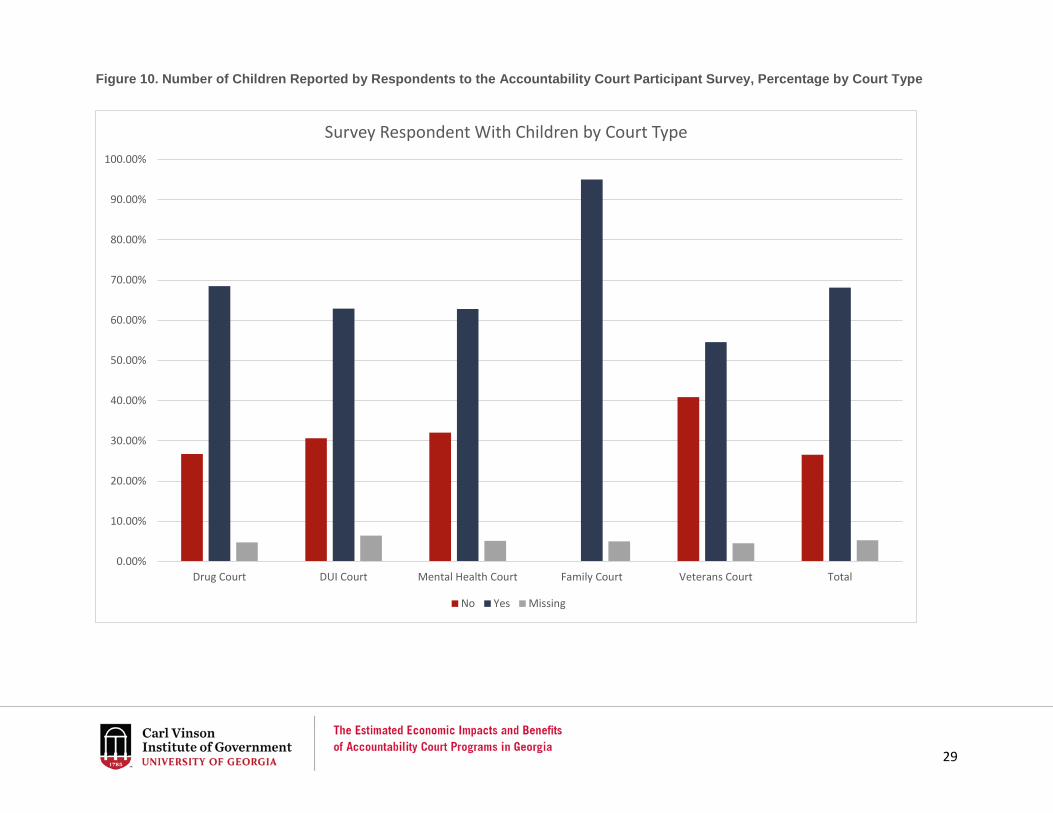
Health insurance is critical because it helps families stay healthy and avoid large expenditures in the case of illness or an accident. Having private health insurance reduces costs imposed on state-funded programs such as Medicaid. About half of all respondents reported that they had no health insurance, with the other half indicating either coverage for just themselves or for their family (see Table 8). Roughly 53 percent of respondents indicated that they had minor children (see Table 9). Table 10 reports the health insurance status of just those 239 respondents, with just over half (51.8 percent) reporting that they had no health insurance. About 20 percent had insurance only for themselves, and 28 percent reported that they had family coverage.

14
Table 1. Gender of Accountability Court Participant Survey Respondents
What gender do you consider yourself to be?
Drug Court DUI Court Mental Health
Court Family Court Veterans Court Total Female 44 30.14% 35 28.23% 38 48.72% 48 80.00% 5 11.36% 170 37.61% Male 101 69.18% 84 67.74% 40 51.28% 11 18.33% 38 86.36% 274 60.62% Other 1 0.68% 4 3.23% 0 0.00% 1 1.67% 1 2.27% 7 1.55% Missing 0 0.00% 1 0.81% 0 0.00% 0 0.00% 0 0.00% 1 0.22% Total 146 100.00% 124 100.00% 78 100.00% 60 100.00% 44 100.00% 452 100.00%
Source: 2017 Accountability Court Participant Survey, Carl Vinson Institute of Government
15
Figure 4. Gender of Accountability Court Participant Survey Respondents, Percentage by Court Type
0%
10%
20%
30%
40%
50%
60%
70%
80%
90%
100%
Drug Court DUI Court Mental Health Court Family Court Veterans Court Total
Perc
enta
ge
Axis Title
Survey Respondent Genderby Court Type
Female Male Other Missing
16
Table 2. Reported Race of Accountability Court Participant Survey Respondents
What race do you consider yourself to be?
Drug Court DUI Court Mental Health
Court Family Court Veterans Court Total White 117 80.14% 62 50.00% 40 51.28% 49 81.67% 17 38.64% 285 63.05% African American 24 16.44% 48 38.71% 32 41.03% 9 15.00% 24 54.55% 137 30.31%
Other 5 3.42% 13 10.48% 4 5.13% 2 3.33% 2 4.55% 26 5.75% Missing 0 0.00% 1 0.81% 2 2.56% 0 0.00% 1 2.27% 4 0.88% Total 146 100.00% 124 100.00% 78 100.00% 60 100.00% 44 100.00% 452 100.00%
Source: 2017 Accountability Court Participant Survey, Carl Vinson Institute of Government
17
Figure 5. Reported Race of Accountability Court Participant Survey Respondents, Percentage by Court Type
0%
10%
20%
30%
40%
50%
60%
70%
80%
90%
Drug Court DUI Court Mental Health Court Family Court Veterans Court Total
Perc
enta
ge
Axis Title
Survey Respondent Raceby Court Type
White African-American Other Missing

18
Table 3. Hispanic/Latino Origin of Accountability Court Participant Survey Respondents
Are you Hispanic, Latino(a), or of Spanish origin?
Drug Court DUI Court Mental Health
Court Family Court Veterans Court Total Yes 6 4.11% 4 3.23% 2 2.56% 2 3.33% 2 4.55% 16 3.54% No 135 92.47% 112 90.32% 72 92.31% 55 91.67% 41 93.18% 415 91.81% Don't Know 2 5.00% 5 2.00% 2 3.00% 3 1.00% 1 2.27% 13 2.88% Missing 3 2.05% 3 2.42% 2 2.56% 0 0.00% 0 0.00% 8 1.77% Total 146 100.00% 124 100.00% 78 100.00% 60 100.00% 44 100.00% 452 100.00%
Source: 2017 Accountability Court Participant Survey, Carl Vinson Institute of Government
19
Figure 6. Hispanic/Latino Origin of Accountability Court Participant Survey Respondents, Percentage by Court Type
0%
10%
20%
30%
40%
50%
60%
70%
80%
90%
100%
Drug Court DUI Court Mental Health Court Family Court Veterans Court Total
Perc
enta
ge
Axis Title
Survey Respondent Hispanic/Latino Originby Court Type
Yes No Don't Know Missing
20
Table 4. Work Status of Accountability Court Participant Survey Respondents
Which best describes your current work status?
Drug Court DUI Court
Mental Health Court Family Court Veterans Court Total
Employed full-time (40+ hours/week) 101 69.18% 85 68.55% 26 33.33% 27 45.00% 11 25.00% 250 55.31%
Employed part-time (less than 40 hours/week) 19 13.01% 20 16.13% 13 16.67% 22 36.67% 13 29.55% 87 19.25%
Unemployed 19 13.01% 9 7.26% 17 21.79% 9 15.00% 2 4.55% 56 12.39% Retired 1 0.68% 3 2.42% 1 1.28% 0 0.00% 4 9.09% 9 1.99% Disabled 3 2.05% 5 4.03% 18 23.08% 2 3.33% 13 29.55% 41 9.07% Other 3 2.05% 2 1.61% 0 0.00% 0 0.00% 0 0.00% 5 1.11% Missing 0 0.00% 0 0.00% 3 3.85% 0 0.00% 1 2.27% 4 0.88% Total 146 100.00% 124 100.00% 78 100.00% 60 100.00% 44 100.00% 452 100.00%
Source: 2017 Accountability Court Participant Survey, Carl Vinson Institute of Government
21
Figure 7. Work Status of Accountability Court Participant Survey Respondents, Percentage by Court Type
0%
10%
20%
30%
40%
50%
60%
70%
80%
Drug Court DUI Court Mental Health Court Family Court Veterans Court Total
Perc
enta
ge
Axis Title
Survey Respondent Work Statusby Court Type
Employed full-time (40+ hours/week) Employed part-time (less than 40 hours/week) Unemployed Retired Disabled Other Missing
22
Table 5. Number and Percentage of Accountability Court Participant Survey Respondents Who Are Business Owners
Do you own your own business?
Drug Court DUI Court Mental Health
Court Family Court Veterans Court Total Yes 16 10.96% 19 15.32% 4 5.13% 3 5.00% 5 11.36% 47 10.40% No 129 88.36% 103 83.06% 73 93.59% 57 95.00% 38 86.36% 400 88.50% Missing 1 0.68% 2 1.61% 1 1.28% 0 0.00% 1 2.27% 5 1.11% Total 146 100.00% 124 100.00% 78 100.00% 60 100.00% 44 100.00% 452 100.00%
Source: 2017 Accountability Court Participant Survey, Carl Vinson Institute of Government
23
Figure 8. Percentage of Accountability Court Participant Survey Respondents Who Are Business Owners, by Court Type
0%
10%
20%
30%
40%
50%
60%
70%
80%
90%
100%
Drug Court DUI Court Mental Health Court Family Court Veterans Court Total
Perc
enta
ge
Axis Title
Survey Respondent - Business Ownerby Court Type
Yes No Missing
24
Table 6. Months in Program, Income, and Fees for Accountability Court Participant Survey Respondents
Drug Court DUI Court
Mental Health Court Family Court
Veterans Court
Total for All Respondents
Average months in the program 19.0 13.4 15.1 17.4 13.7 16.5
Number of participants 145 123 77 59 44 448
Average income (annualized) $22,062 $29,650 $16,080 $15,350 $23,522 $22,340
Number of participants 144 120 75 60 44 443
Average fees assessed (annualized) $2,691 $3,999 $1,661 $646 $1,302 $2,452
Average fees paid (annualized) $2,167 $3,319 $916 $531 $749 $1,932
Number of participants 137 106 60 54 36 393 Source: 2017 Accountability Court Participant Survey, Carl Vinson Institute of Government
25
Table 7. Details of Community Service Reported by Respondents to the Accountability Court Participant Survey
How many hours of community service have you performed while in the program?
Drug Court DUI Court Mental Health
Court Family Court Veterans
Court Total Number of participants performing community service
119 71 42 53 29 314
Percent of sample performing community service
81.5% 57.3% 53.8% 88.3% 65.9% 69.5%
Average hours of community service per participant (annualized)
106 52 53 45 70 70
At what type of agency did you perform most of your community service? Government agency 31 26.03% 14 20.16% 9 21.79% 19 36.67% 5 18.18% 76 24.34% Nonprofit agency 55 46.58% 27 38.71% 16 38.46% 18 33.33% 10 34.09% 126 40.04% Other 17 14.38% 11 16.13% 8 17.95% 11 20.00% 9 31.82% 56 17.92% Missing 15 13.01% 18 25.00% 9 21.79% 5 10.00% 5 15.91% 56 17.70% Total 119 100.00% 71 100.00% 42 100.00% 53 100.00% 29 100.00% 314 100.00%
Source: 2017 Accountability Court Participant Survey, Carl Vinson Institute of Government

26
Table 8. Health Insurance Status Reported by Respondents to the Accountability Court Participant Survey
Do you currently have health insurance?
Drug Court DUI Court Mental Health
Court Family Court Veterans Court Total
For myself only 30 20.55% 49 39.52% 27 34.62% 6 10.00% 16 36.36% 128 28.32% Family coverage 20 13.70% 34 27.42% 12 15.38% 19 31.67% 10 22.73% 95 21.02%
No insurance 94 64.38% 41 33.06% 37 47.44% 35 58.33% 18 40.91% 225 49.78%
Missing 2 1.37% 0 0.00% 2 2.56% 0 0.00% 0 0.00% 4 0.88%
Total 146 100.00% 124 100.00% 78 100.00% 60 100.00% 44 100.00% 452 100.00% Source: 2017 Accountability Court Participant Survey, Carl Vinson Institute of Government
27
Figure 9. Health Insurance Status Reported by Respondents to the Accountability Court Participant Survey, Percentage by Court Type
0%
10%
20%
30%
40%
50%
60%
70%
Drug Court DUI Court Mental Health Court Family Court Veterans Court Total
Perc
enta
ge
Axis Title
Survey Respondent - Health Insuranceby Court Type
For myself only Family coverage No insurance Missing

28
Table 9. Number of Children Reported by Respondents to the Accountability Court Participant Survey
Do you have any children?
Drug Court DUI Court Mental Health
Court Family Court Veterans
Court Total
No 70 47.95% 75 60.48% 40 51.28% 1 1.67% 27 61.36% 213 47.12%
Yes 76 52.05% 49 39.52% 38 48.72% 59 98.33% 17 38.64% 239 52.88%
Missing 0 0.00% 0 0.00% 0 0.00% 0 0.00% 0 0.00% 0 0.00%
Total 146 100.00% 124 100.00% 78 100.00% 60 100.00% 44 100.00% 452 100.00%
Average number of children 2.2 1.9 2.1 2.3 2.7 2.2
Source: 2017 Accountability Court Participant Survey, Carl Vinson Institute of Government
29
Figure 10. Number of Children Reported by Respondents to the Accountability Court Participant Survey, Percentage by Court Type
0.00%
10.00%
20.00%
30.00%
40.00%
50.00%
60.00%
70.00%
80.00%
90.00%
100.00%
Drug Court DUI Court Mental Health Court Family Court Veterans Court Total
Survey Respondent With Children by Court Type
No Yes Missing

30
Table 10. Health Insurance Status for Respondents to the Accountability Court Participant Survey with Minor Children
Do you currently have health insurance?
Drug Court DUI Court Mental Health
Court Family Court Veterans Court Total
For myself only 16 21.05% 12 24.49% 11 28.95% 6 10.17% 2 11.76% 47 19.67%
Family coverage 13 17.11% 19 38.78% 8 21.05% 19 32.20% 8 47.06% 67 28.03%
No insurance 46 60.53% 18 36.73% 19 50.00% 34 57.63% 7 41.18% 124 51.88%
Missing 1 1.32% 0 0.00% 0 0.00% 0 0.00% 0 0.00% 1 0.42%
Total 76 100.00% 49 100.00% 38 100.00% 59 100.00% 17 100.00% 239 100.00% Source: 2017 Accountability Court Participant Survey, Carl Vinson Institute of Government

31
Figure 11. Health Insurance Status for Respondents to the Accountability Court Participant Survey with Minor Children, Percentage by Court Type
0%
10%
20%
30%
40%
50%
60%
70%
Drug Court DUI Court Mental Health Court Family Court Veterans Court Total
Perc
enta
ge
Axis Title
Survey Respondents With Children - Health Insuranceby Court Type
For myself only Family coverage No insurance Missing

32
FISCAL BENEFITS OF ACCOUNTABILITY COURT PROGRAMS Program Costs Versus Traditional Adjudication Accountability court programs in Georgia are funded primarily with resources from state and local government. A number of programs also have received funding from US Department of Justice or Department of Health and Human Services grants. Federal grants typically provide funding for two years and cover initial program costs, training, investments in technology, or program services.
In 2017, the state made $22 million in grants directly to court programs, equating to $4,061 for each of 5,403 program participants. In addition, the state appropriated $3,729,776 and $480,185 in FY 2017 to cover additional staffing needed in the offices of prosecuting attorneys and public defenders, respectively. This brings the state expenditures in FY 2017 for these programs to $26,155,095, or $4,841 per participant. Over a typical 24-month program, state spending per participant is estimated at $9,682.
One of the first questions that research focused on after the proliferation of accountability courts was whether the programs imposed greater costs than traditional adjudication. Many observers speculated that there might be cost savings because accountability court participants are not incarcerated except for the period prior to assignment to the program and pay for at least part of their treatment through fees.
A number of studies have measured the costs of drug and DUI court programs. Most of these report the total cost per participant for programs that typically last 24 months. In this section, we will compare the costs of the typical 24-month accountability court program to the cost of traditional adjudication, incarceration, and probation that often cover a similar period of time.
The cost drivers for accountability court programs are counseling sessions, drug tests, court appearances, and the time needed for interactions with program staff. Due to the more frequent oversight activities and other requirements in the early phases, program costs are heavily front loaded. Family treatment, mental health, and veterans court programs are generally modeled after drug and DUI court programs with some additional components based on participants’ particular needs. The Institute of Government research team examined 12 studies completed between 1996 and 2015, adjusting the finding to 2016 dollars using the Consumer Price Index (CPI). Nine of these studies (see Appendix C, Table C1) were completed by NPC Research in Portland, Oregon. The average cost per participant across these nine drug court programs studied was $21,347. The participant costs ranged from a low of $9,200 in Pima County, Arizona, to $36,923 and $38,134 in two Maryland counties. The cost components of both studies
33
of programs in Maryland included significant “intensive outpatient treatment days.”14 By comparison, a study conducted by the Washington State Institute for Public Policy, which was itself an analysis of nine studies, found an average cost of $12,998. A study of the drug court program in Bexar County, Texas, commissioned by the court and conducted by the University of Texas University Health System, found per participant costs of $11,282. NPC had found a cost of $14,764 for the program in Bexar County.15 A study of the Washington, DC drug court program conducted by the District of Columbia Crime Policy Institute using data from the mid-1990s showed per participant costs of $18,131 (2016 dollars). Averaging the findings from these studies indicates that the average accountability court participant costs $20,545.
The cost of traditional adjudication includes the handling and processing of a case through the judicial system and the cost of incarceration, the latter being the largest driver of costs. Indeed, the typical one-year prison sentence accounts for 80 percent of total expenditures for defendants who are processed through traditional adjudication. Most studies of accountability court
programs seeking to compare their costs to traditional adjudication report a single figure for all costs rather than reporting separate amounts for the handling and processing of the case, which generally includes law enforcement, the prosecuting attorney, the public defender if utilized, and costs for pre-trial jail time and incarceration. However, seven studies reviewed by American University provide detailed information that allows for this calculation. The average costs for traditional adjudication (not including incarceration following a conviction) was $5,022 adjusted to 2016 dollars.16 The costs incurred for handling the case of a defendant assigned to an accountability court program would be similar.
The Georgia Department of Corrections reports that the average cost per inmate-day at its state prisons has been between $55 and $58 over the past 10 years (see Appendix B for details). Three studies of the efficacy of Georgia accountability court programs compared program participants 14 NPC Research. 2010. Montgomery County Adult Drug Court Program Outcome and Cost Evaluation. Portland, OR: NPC Research; NPC Research. 2009. Wicomico County Circuit Court Adult Drug Treatment Court Program Outcome and Cost Evaluation. Portland, OR: NPC Research. 15 www.universityhealthsystem.com/~/media/files/pdf/about-us/healthcare-summit/behavioralhealthandcriminaljusticesubstanceabuseposition.pdf?la=en) 16 OJP Drug Court Clearinghouse. 2004. Memorandum Regarding Cost Benefits/Cost Avoidance Reported by Drug Court Programs and Drug Court Evaluation Reports. Washington, DC: Bureau of Justice Assistance, US Department of Justice.
34
and graduates to control groups of defendants who went through traditional adjudication. Two of those studies evaluated the Forsyth County Drug Court Program, and the third evaluated the Hall County DUI Court Program. In those studies, data made available by the Georgia Bureau of Investigation on the criminal histories of defendants in the control groups indicated that the average sentence imposed was one year with an additional year on probation. At $55 per day, the cost of incarceration for 365 days is $20,075. The Georgia Department of Community Supervision reports that it supervised 224,079 people in 2016 with a budget of $34,639,482.17 While supervision costs vary based on the reporting requirements, the department’s cost per probationer is $155 annually.
Using these data, the estimated costs of a defendant in either traditional adjudication or accountability court assignment is $5,022 in pre-sentencing or pre-diversion costs. The defendant in traditional adjudications costs $20,075 for incarceration, and $155 for 12 months of probation supervision, for a total of $20,230. The post-diversion cost from all sources for an accountability court participant is $15,523, or $4,707 less than the average cost of traditional adjudication and incarceration. As noted earlier, state grants and direct appropriations fund approximately $9,682 (62.3 percent) of that cost.
PROGRAM FEES Program fees are assessed by accountability court programs to cover a portion of the costs to provide services such as counseling sessions, drug testing, and general oversight activities of the staff and court. In addition to defraying program costs, participants are more likely to succeed if they have a vested interest in the form of financial resources. The results of the survey (see Table 6) indicate that the amount of fees collected varied by court type, but that participants overall had paid an average of $1,932 (annualized) in fees to cover program costs. These fees are included in Table 18 and added to the reduction in adjudication and incarceration costs.
17 Georgia Department of Community Supervision. 2016. Annual Report.
35
Health Care Costs Most states, including Georgia, have a variety of ways to cover the health care costs of low-income, homeless, and indigent persons. PeachCare for Kids® operates as the Georgia version of the State Children’s Health Insurance Program (S-CHIP), authorized in 1997 under Title XXI of the Social Security Act and reauthorized in 2009. This program covers the cost of most medical services, including preventive care. The Indigent Care Trust Fund, established in 1990, expanded Medicaid coverage and provides support for hospitals and other health care providers that serve the medically indigent.18
The Kaiser Family Foundation reports that the average uninsured person in the United States spent $2,443 on health services in 2013.19 Adjusting this amount to 2016 dollars yields $2,517. The total costs of uncompensated medical care delivered in 2013 was $84.9 billion. The federal government and state governments offset these costs by more than $50 billion, with $32.8 billion paid by the federal government and $19.8 billion paid by the states. Most (60 percent) of these health care services were hospital-based, with 26 percent provided by publicly supported clinics and 14 percent provided at physicians’ offices.20
In response to the question “Do you currently have health insurance?” 128 of 452 respondents (28.3 percent) indicated that they had coverage for themselves only (see Table 8). Ninety-five of 452 survey respondents (21.0 percent) indicated that they had family coverage. Those 95 respondents indicated that they had an average of 1.7 minor children (see Table 11). If we assume that their family health coverage includes a spouse and their children, each of these families, averaging 3.7 persons, is not a burden to the state programs that provide health care coverage because the participant is working and providing health insurance. Thus, the estimated cost of an uninsured family in 2016 was $9,313, which was funded by the Indigent Care Trust Fund or absorbed by local hospitals and other providers.
18 dch.georgia.gov/indigent-care-trust-fund 19 www.kff.org/uninsured/report/uncompensated-care-for-the-uninsured-in-2013-a-detailed-examination/ 20 www.kff.org/uninsured/report/uncompensated-care-for-the-uninsured-in-2013-a-detailed-examination/

36
Table 11. Number of People Covered by Health Insurance as Reported by Respondents to the Accountability Court Participant Survey
Health Insurance Participant Spouse Children
Average Number of Children
Total Persons Covered
Number of Participants
Percent of
Sample*
Individual ------------ 1 128 28.3%
Family 1.7 3.7 95 21.0% *Sample n=452 Source: 2017 Accountability Court Participant Survey, Carl Vinson Institute of Government
The data in this section indicate that health care coverage could help avoid $2,517 in state-funded health care costs for 28.3 percent of accountability court program graduates and $9,313 in health care costs for 21.0 percent of graduates.
A related but separate health care issue is the birth of children to mothers addicted to illicit drugs. The survey asked parents, “How many of your children were born while you were in this court program?” For female drug court participants, being clean during pregnancy results in a significant savings to the health care system. Children born addicted to the drugs that their mothers ingest are expensive patients. The costs for treating these children immediately after birth far surpasses the typical health care costs for other children, with their care often funded by the Indigent Care Trust Fund or absorbed by hospitals. The female respondents to the survey indicated that 21 babies had been born to 20 mothers while in the accountability court programs. Two were born to drug court participants, four to those in DUI court programs, six to mental health court participants, and nine to those in family treatment court programs. None were born to mothers in the veterans court programs. While data were not available about the health of these children at birth, there is a greater likelihood that they were born without the complications of drug addiction due to their mothers’ participation in the accountability court program. In the survey respondent sample, 170 of 452 participants (37.6 percent) were female. Assuming this is representative of accountability court participants across Georgia, we would expect 21 births for every 452 program participants. The average length of time in the program for the mothers who had a child born while in the program was 18.4 months. Thus, we expect 13.7 births annually per 452 program participants, which is 3.03 percent of the sample.
Children born to mothers addicted to opioid painkillers suffer from neonatal abstinence syndrome (NAS), which is essentially withdrawal from the substances they were exposed to in utero by their mothers’ addiction. Addiction to illegal drugs, such as heroin and amphetamines,

37
and to prescription opioids is a growing problem that is causing an increase in the number of NAS cases in Georgia and nationally. In addition, the Georgia Department of Public Health indicates that NAS can also occur with antidepressants and benzodiazepines.21
The cost to treat cases of NAS averages $66,700 for 17 days in a neonatal intensive care unit (NICU), compared to $3,500 for two days in a regular delivery unit in the case of a normal delivery.22 The typical NICU is set up to treat premature deliveries with the use of sophisticated monitoring equipment. Babies suffering with NAS require more one-on-one treatment, but otherwise may be alert and active. Delivering care the unit is not designed for can place a severe burden on hospital staff, issues that may not be captured in the costs.23
The health care–related cost savings attributable to the accountability courts are made up of the three components discussed in this section: participants who have health insurance for themselves (28.3 percent of the sample), those who have health insurance for their families (21.0 percent), and births that avoid the costs of NAS care (3.03 percent).
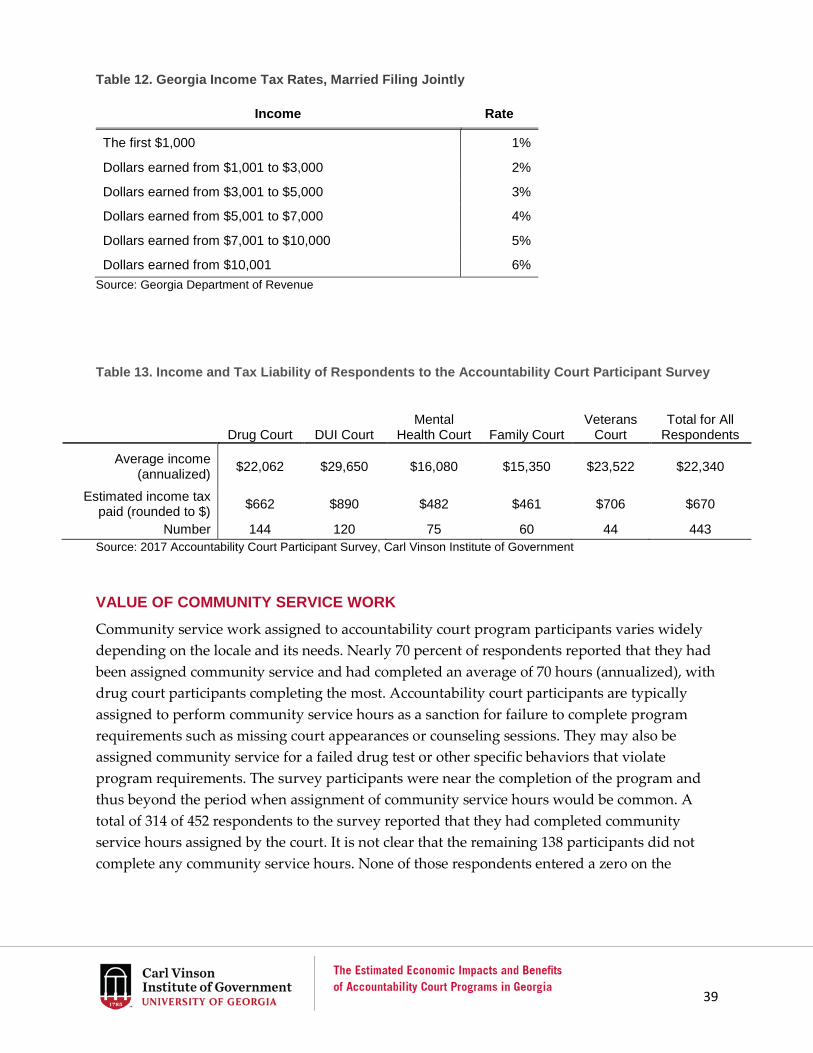
Income Taxes Georgia has a graduated income tax. That is, Georgians pay lower rates at lower levels of income. All Georgians pay no income tax on the first $100 of income; $1 on the second $100; and $2 on the next $100. Married taxpayers who file jointly pay 1 percent on the first $1,000 of adjusted gross income, 2 percent on the next $1,000, and reach a marginal tax rate of 6 percent for income over $10,000, as shown in Table 12. This means that the highest possible tax rate for any taxpayer will be less than 6 percent given the lower rates applied to the first $10,000 of income. These rates are applied to adjusted gross income (AGI), that is, after the taxpayer has subtracted either the standard deduction or the total of their itemized tax deductions from their gross income. After calculating AGI, taxpayers apply the rates according to the chart in Table 12, yielding their tax liability. Dividing the tax liability by gross income (before tax deductions) yields the effective tax rate. The analysis of accountability court costs and benefits must start with the effective tax rate because survey respondents provided gross monthly income (before tax deductions). Both the Fiscal Research Center at Georgia State University and the Georgia Budget and Policy Institute put Georgia’s average effective tax rate at about 3 percent.24 Using a
21 dph.georgia.gov/NAS 22 www.drugabuse.gov/related-topics/trends-statistics/infographics/dramatic-increases-in-maternal-opioid-use-neonatal-abstinence-syndrome 23 cronkitenews.azpbs.org/hookedrx/babies-born-drug-addict/ 24 Shiyan Chen and Sally Wallace. 2007, July. A Flat Rate Income Tax in Georgia [Policy brief 158]. Retrieved from gbpi.org/wp-content/uploads/2012/04/georgias-income-tax-report -essential-for-states-economy-and-family-policy-report-04242012.pdf
38
3 percent effective rate produces the average income tax liability for accountability court participants shown in Table 13.
39
Table 12. Georgia Income Tax Rates, Married Filing Jointly
Income Rate
The first $1,000 1%
Dollars earned from $1,001 to $3,000 2%
Dollars earned from $3,001 to $5,000 3%
Dollars earned from $5,001 to $7,000 4%
Dollars earned from $7,001 to $10,000 5%
Dollars earned from $10,001 6% Source: Georgia Department of Revenue
Table 13. Income and Tax Liability of Respondents to the Accountability Court Participant Survey
Drug Court DUI Court
Mental Health Court Family Court
Veterans Court
Total for All Respondents
Average income (annualized) $22,062 $29,650 $16,080 $15,350 $23,522 $22,340
Estimated income tax paid (rounded to $) $662 $890 $482 $461 $706 $670
Number 144 120 75 60 44 443 Source: 2017 Accountability Court Participant Survey, Carl Vinson Institute of Government
VALUE OF COMMUNITY SERVICE WORK Community service work assigned to accountability court program participants varies widely depending on the locale and its needs. Nearly 70 percent of respondents reported that they had been assigned community service and had completed an average of 70 hours (annualized), with drug court participants completing the most. Accountability court participants are typically assigned to perform community service hours as a sanction for failure to complete program requirements such as missing court appearances or counseling sessions. They may also be assigned community service for a failed drug test or other specific behaviors that violate program requirements. The survey participants were near the completion of the program and thus beyond the period when assignment of community service hours would be common. A total of 314 of 452 respondents to the survey reported that they had completed community service hours assigned by the court. It is not clear that the remaining 138 participants did not complete any community service hours. None of those respondents entered a zero on the
40
survey form; all 138 simply left the item blank. Rather than assume they performed no community service work, the research team assumed that they did not have access to the data and simply did not respond.
Independent Sector (IS) is an umbrella organization that promotes the interests of nonprofits, foundations, and corporations related to issues of public policy and the common good.25 For 2016, IS estimated the value of an hour of nonprofit community service nationally at $24.14 based on the cost of replacing that labor with a full-time employee. In Georgia, the estimate is $24.39 per hour.26 The estimate is based on the cost of all production and nonsupervisory workers in nonfarm payrolls as reported by the Bureau of Labor Statistics (BLS) and includes the value of fringe benefits that would be provided to employees. Organizations that rely on volunteer work use that figure to report the value received on their balance sheets and in their annual reports. A number of organizations have recognized and used the estimate from IS, including the Corporation for National and Community Service, The NonProfit Times, and Nonprofit Quarterly.27
Acknowledging that the value calculated using the BLS data includes a host of skilled workers, even if they are not performing supervisory roles, and that the work typically assigned to participants does not require extensive skill, the Institute of Government research team valued the community service hours performed by accountability court program participants at $16.20, between the minimum wage and the figure reported by IS. Again, the estimate is based on what it would cost to replace that labor with full-time employees.
25 www.independentsector.org/about/ 26 www.independentsector.org/resource/the-value-of-volunteer-time/ 27 www.nationalservice.gov/newsroom/press-releases/2016/new-report-service-unites-americans-volunteers-give-service-worth-184; www.thenonprofittimes.com/news-articles/volunteer-value-hits-23-07-an-hour/; nonprofitquarterly.org/2013/05/01/what-s-an-hour-of-volunteer-work-worth/

41
Table 14. Community Service Details Reported by Respondents on the Accountability Court Participant Survey
How many hours of community service have you performed while in the program?
Drug Court
DUI Court
Mental Health Court
Family Court
Veterans Court Total
Number of participants reporting community service 119 71 42 53 29 314
Percent of sample performing community service 81.50% 57.30% 53.80% 88.30% 65.90% 69.50%
Average hours of community service (annualized) 106 52 53 45 70 70
Value per hour $16.20 $16.20 $16.20 $16.20 $16.20 $16.20
Value per participant $1,717 $842 $859 $729 $1,134 $1,134 Source: 2017 Accountability Court Participant Survey, Carl Vinson Institute of Government
REDUCED FOSTER CARE COSTS Foster care provides for the needs of minor children when parents are unable to do so on their own. The primary goal of this program is to provide this assistance while parents recover financially, emotionally, or physically so that families can be reunited. Accountability court programs can help families avoid separation while parents recover from addiction and other issues that often result in children being placed in foster care.
The costs to the state to compensate foster care parents is based on the per diem schedule shown in Table 15.
Table 15. Georgia Foster Care Per Diem Rates, 2017
Child age birth through 5 $25.27 – per day Child age 6 through 12 $27.26 – per day Child age 13 and older $29.65 – per day
Source: Georgia Division of Family and Children Services
Forty-four respondents to the survey (9.7 percent) specified that their children had been in the foster care program during the previous five years, with only three indicating that their children were currently in the program. The 44 respondents had an average of 2.4 children, for a total of 105 children. Forty-six of these children (44 percent) were under age six; 35 were between six and 12; and 24 were between ages 13 and 17. The Institute research team assumed these children were likely living with their natural families because of the stability provided by the

42
accountability court programs. The analysis also assumes the alternative, that these children would be in foster care for the entire period of the parent’s incarceration. Table 16 shows the total foster care costs avoided for the 44 respondents whose children had been in foster care within the past five years.
Table 16. Total Foster Care Costs Avoided Due to Survey Respondents’ Participation in Accountability Court Programs
Age Number of Children
Foster Care Per Diem Total Annual Cost
0–5 46 25.27 $424,283
6–12 35 27.26 $348,247
13–17 24 29.65 $259,734
Total 105 ——— $1,032,264
Source: Calculated from 2017 Accountability Court Participant Survey using Georgia Department of Children and Family Services foster care per diem rates
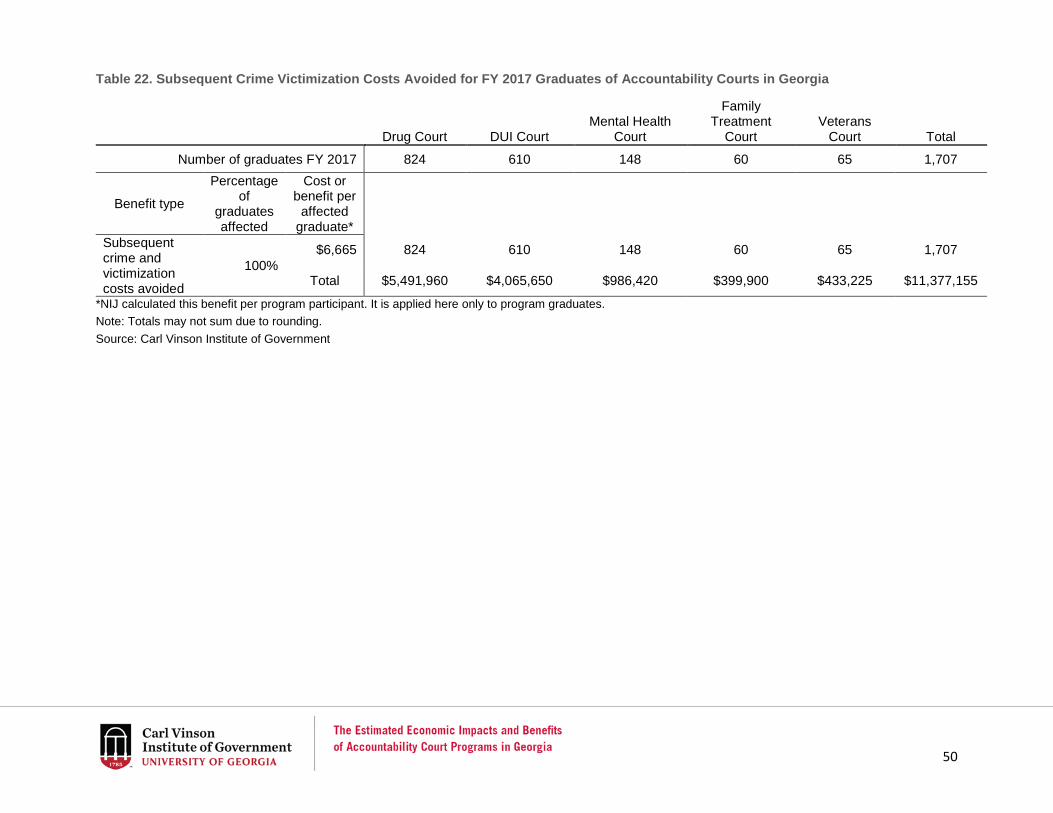
OTHER SOCIETAL BENEFITS – REDUCED DRUG CRIME VICTIMIZATION Studies, including ones conducted on accountability courts in Georgia, show that these programs are effective at reducing recidivism. The National Institute of Justice (NIJ), together with the Office of Justice Programs, US Department of Justice, reported in June 2014 that for each drug court participant, society is saved $6,665 in reduced crime victimization costs resulting from subsequent criminal activity that would have occurred in the absence of the drug court program.28 Crime victimization costs are over and above the costs imposed on the criminal justice system and the benefits of increased social productivity—all the items covered so far in this report.
The NIJ report calculated the costs using the national recidivism rate and spreading benefits over the total number of participants. However, using the number of graduates rather than the number of participants in Georgia’s accountability court programs produces a more conservative estimate of the victimization costs avoided.
28 P. Mitchell Downey and John K. Roman. 2014. Cost-Benefit Analysis: A Guide for Drug Courts and Other Criminal Justice Programs. Washington, DC: National Institute of Justice, Office of Justice Programs, US Department of Justice.
43
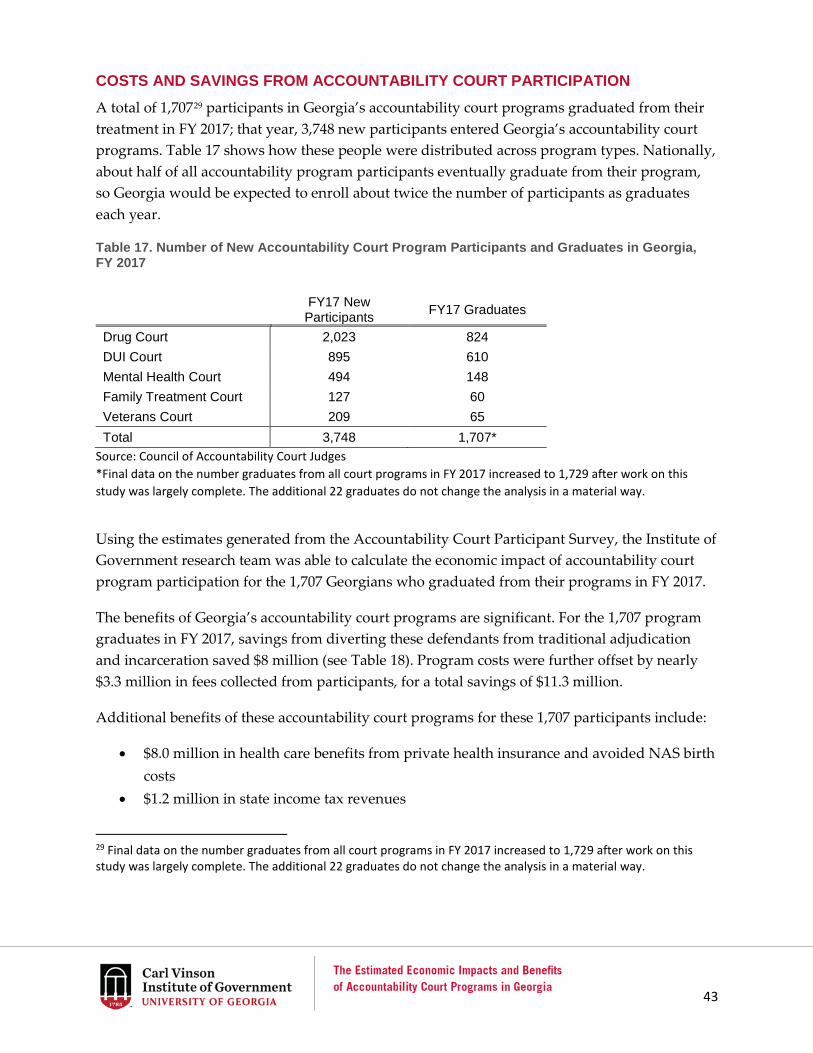
COSTS AND SAVINGS FROM ACCOUNTABILITY COURT PARTICIPATION A total of 1,70729 participants in Georgia’s accountability court programs graduated from their treatment in FY 2017; that year, 3,748 new participants entered Georgia’s accountability court programs. Table 17 shows how these people were distributed across program types. Nationally, about half of all accountability program participants eventually graduate from their program, so Georgia would be expected to enroll about twice the number of participants as graduates each year.
Table 17. Number of New Accountability Court Program Participants and Graduates in Georgia, FY 2017
FY17 New Participants FY17 Graduates
Drug Court 2,023 824 DUI Court 895 610 Mental Health Court 494 148 Family Treatment Court 127 60 Veterans Court 209 65 Total 3,748 1,707*
Source: Council of Accountability Court Judges *Final data on the number graduates from all court programs in FY 2017 increased to 1,729 after work on this study was largely complete. The additional 22 graduates do not change the analysis in a material way.
Using the estimates generated from the Accountability Court Participant Survey, the Institute of Government research team was able to calculate the economic impact of accountability court program participation for the 1,707 Georgians who graduated from their programs in FY 2017.
The benefits of Georgia’s accountability court programs are significant. For the 1,707 program graduates in FY 2017, savings from diverting these defendants from traditional adjudication and incarceration saved $8 million (see Table 18). Program costs were further offset by nearly $3.3 million in fees collected from participants, for a total savings of $11.3 million.
Additional benefits of these accountability court programs for these 1,707 participants include:
• $8.0 million in health care benefits from private health insurance and avoided NAS birth costs
• $1.2 million in state income tax revenues
29 Final data on the number graduates from all court programs in FY 2017 increased to 1,729 after work on this study was largely complete. The additional 22 graduates do not change the analysis in a material way.

44
• $1.9 million in community service work • $3.9 million in foster care costs avoided • $11.4 million in crime victimization costs avoided from subsequent criminal offenses
Detailed estimates of the benefits by court type are presented in Tables 19 through 22 and are summarized in Table 23. Each participant represents an immediate savings of $4,707 compared to traditional adjudication and incarceration. Program costs are further offset by an average of $1,932 in program fees paid by participants, bringing the direct savings to more than $6,600 per participant (see Table 18).
Participants who have their own health insurance coverage for themselves and their families avoid $4,554,346 in costs that would otherwise be largely borne by the Indigent Care Trust Fund, hospitals, or local health care providers (see Table 19). For mothers who give birth to children while in these programs, to the extent that their newborns are not born with drug dependencies, $3,449,864 in NAS costs is avoided (see Table 19). The total for these health-related economic benefits is $8 million.
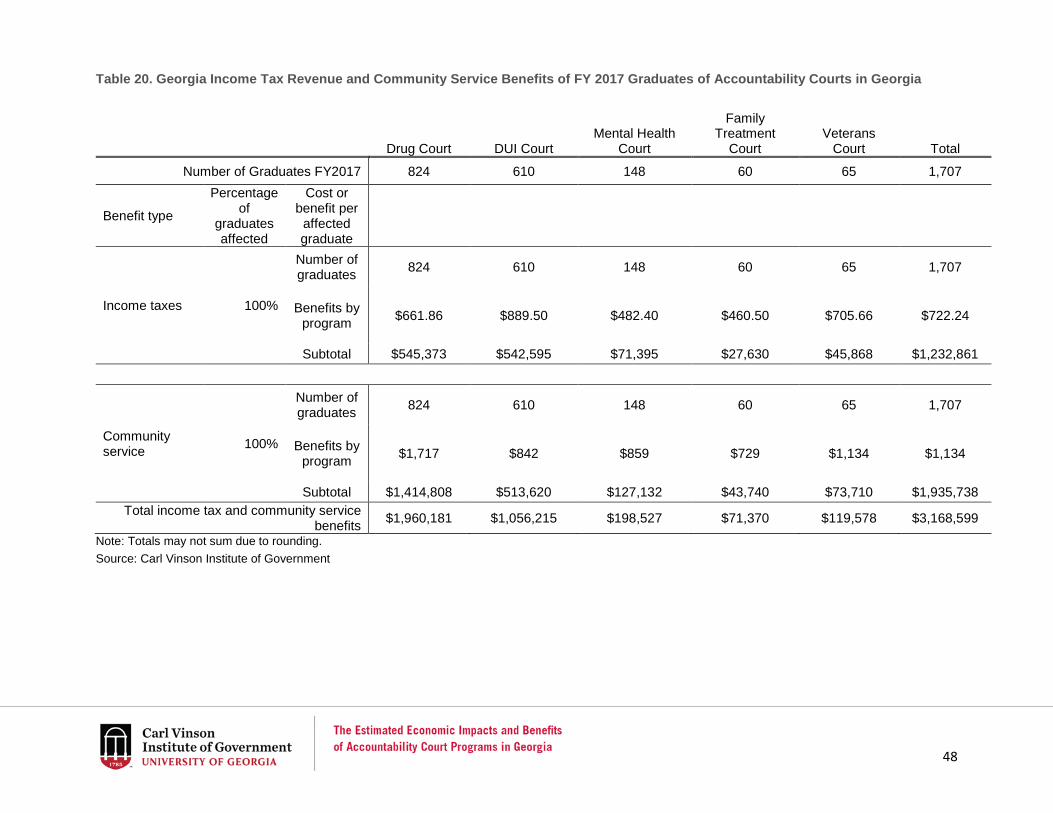
Participants who are working provide an estimated $1,232,861 in income tax revenue to the state, and all participants that provide community service, either as part of their regular program requirements or as a sanction, contribute an estimated $1,935,738 in benefits, largely to governments and nonprofit organizations (see Table 20), resulting in a total economic benefit of nearly $3.2 million from work and community service activities.
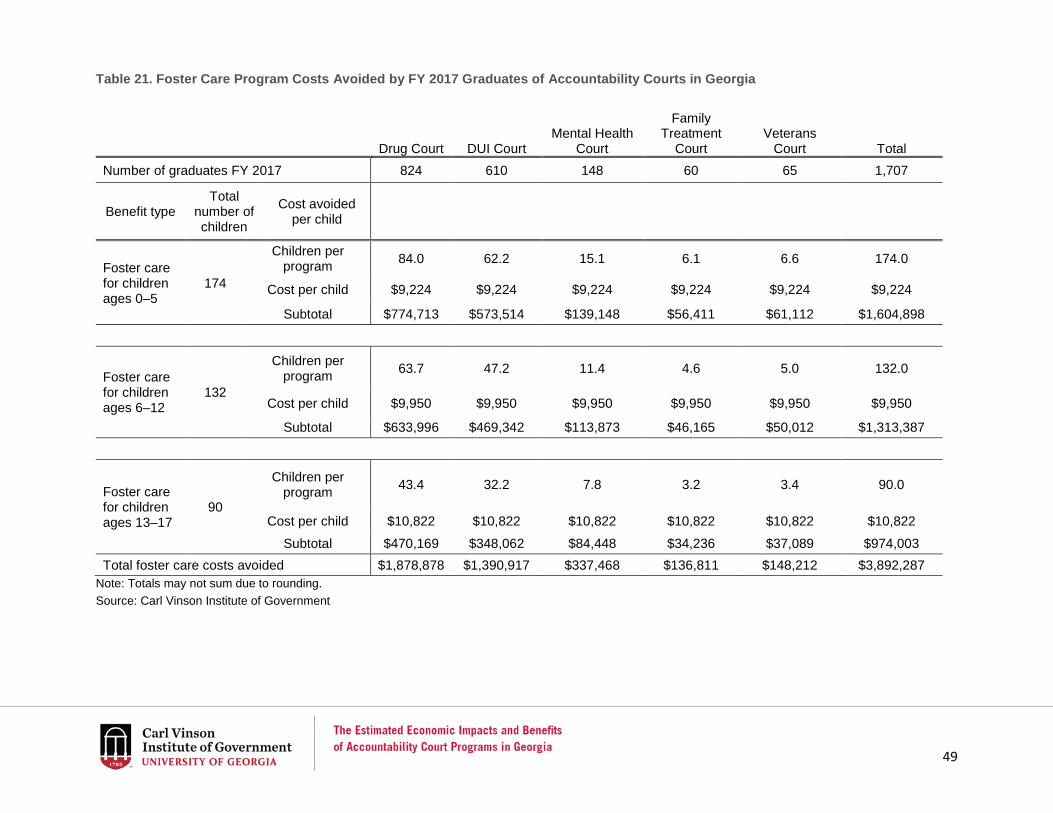
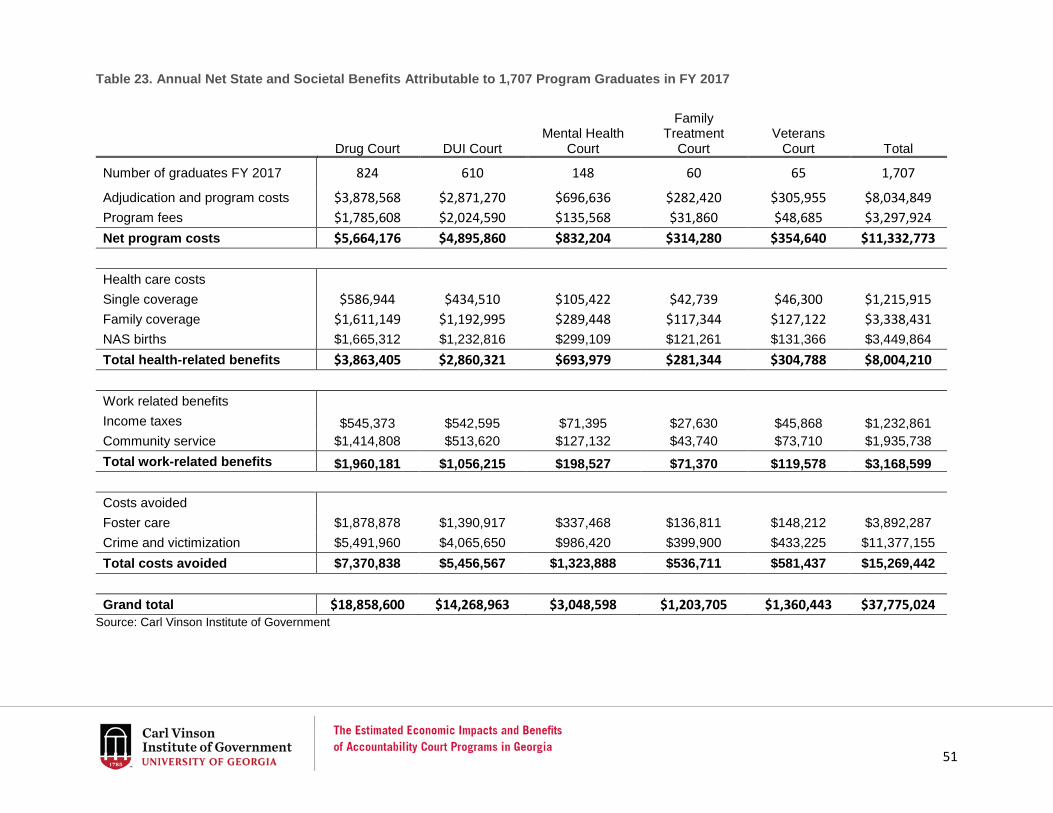
Tables 21 and 22 show estimates of the substantial state costs that are avoided because families are more likely to remain intact and program participants are less likely to reoffend. Estimated foster care program expenditures of $3.9 million are avoided because nearly 400 children are able to remain with their families. This assumes that these children would be in foster care during the period of the parent’s incarceration. Because program graduates are less likely to reoffend, potential crime victimization costs are avoided totaling nearly $11.4 million. The total estimated net benefit of Georgia’s accountability court programs from the 1,707 graduates in FY 2017 is $37,775,024 or $22,129 per graduate. To the extent that defendants can be diverted from traditional adjudication and incarceration into these programs, benefits will continue to accrue to the state and its economy.
45
Georgia has been at the forefront of accountability court development over the past two decades. The investment in these programs has reduced the costs for handling the cases of defendants diverted to these programs. The most significant savings are from reducing the number of prisoners in state correctional facilities and reducing the likelihood of recidivism for program graduates. Beyond that, and of far greater value, program graduates have remained with their families, supported their children, and contributed to the economy while receiving treatment to overcome their addictions and destructive behavior. This study estimates that each defendant who can receive treatment along with structured supervision rather than occupy a prison bed will produce significant economic benefits to state and local government, and the Georgia economy.

46
Table 18. Total Annual Program Estimated Costs and Program Fees for FY 2017 Graduates of Accountability Courts in Georgia
Drug Court DUI Court
Mental Health Court
Family Treatment
Court Veterans
Court Total
Number of graduates FY2017 824 610 148 60 65 1,707
Cost/benefit type
Percentage of
graduates affected
Savings per graduate
Adjudication and program costs
100% $4,707 824 610 148 60 65 1,707
Subtotal $3,878,568 $2,871,270 $696,636 $282,420 $305,955 $8,034,849
Program fees collected 100%
Number of graduates 824 610 148 60 65 1,707
Benefits vary by program
$2,167 $3,319 $916 $531 $749 $1,932
Subtotal $1,785,608 $2,024,590 $135,568 $31,860 $48,685 $3,297,924
Program Savings Compared to Traditional Adjudication $5,664,176 $4,895,860 $832,204 $314,280 $354,640 $11,332,773
Savings per graduate $6,639
Note: Totals may not sum due to rounding. Source: Carl Vinson Institute of Government

47
Table 19. Health Care–Related Benefits of FY 2017 Graduates of Accountability Courts in Georgia
Drug Court DUI Court
Mental Health Court
Family Treatment
Court Veterans
Court Total
Number of graduates FY 2017 824 610 148 60 65 1,707
Benefit type
Percentage of
graduates affected
Cost or benefit per
affected graduate
Health care single coverage
28.3% $2,517 233 173 42 17 18 483
Subtotal $586,944 $434,510 $105,422 $42,739 $46,300 $1,215,915
Health care family coverage
21.0% $9,313 173 128 31 13 14 358
Subtotal $1,611,149 $1,192,995 $289,448 $117,344 $127,122 $3,338,431
NAS births avoided 3.03%
$66,700 25 18 4 2 2 52 Subtotal $1,665,312 $1,232,816 $299,109 $121,261 $131,366 $3,449,864
Total health care–related benefits $3,863,405 $2,860,321 $693,979 $281,344 $304,788 $8,004,210 Note: Totals may not sum due to rounding. Source: Carl Vinson Institute of Government
48
Table 20. Georgia Income Tax Revenue and Community Service Benefits of FY 2017 Graduates of Accountability Courts in Georgia
Drug Court DUI Court Mental Health
Court
Family Treatment
Court Veterans
Court Total
Number of Graduates FY2017 824 610 148 60 65 1,707
Benefit type
Percentage of
graduates affected
Cost or benefit per
affected graduate
Income taxes 100%
Number of graduates 824 610 148 60 65 1,707
Benefits by program $661.86 $889.50 $482.40 $460.50 $705.66 $722.24
Subtotal $545,373 $542,595 $71,395 $27,630 $45,868 $1,232,861
Community service 100%
Number of graduates 824 610 148 60 65 1,707
Benefits by program $1,717 $842 $859 $729 $1,134 $1,134
Subtotal $1,414,808 $513,620 $127,132 $43,740 $73,710 $1,935,738 Total income tax and community service
benefits $1,960,181 $1,056,215 $198,527 $71,370 $119,578 $3,168,599 Note: Totals may not sum due to rounding. Source: Carl Vinson Institute of Government
49
Table 21. Foster Care Program Costs Avoided by FY 2017 Graduates of Accountability Courts in Georgia
Drug Court DUI Court
Mental Health Court
Family Treatment
Court Veterans
Court Total Number of graduates FY 2017 824 610 148 60 65 1,707
Benefit type Total
number of children
Cost avoided per child
Foster care for children ages 0–5
174
Children per program 84.0 62.2 15.1 6.1 6.6 174.0
Cost per child $9,224 $9,224 $9,224 $9,224 $9,224 $9,224
Subtotal $774,713 $573,514 $139,148 $56,411 $61,112 $1,604,898
Foster care for children ages 6–12
132
Children per program 63.7 47.2 11.4 4.6 5.0 132.0
Cost per child $9,950 $9,950 $9,950 $9,950 $9,950 $9,950
Subtotal $633,996 $469,342 $113,873 $46,165 $50,012 $1,313,387
Foster care for children ages 13–17
90
Children per program 43.4 32.2 7.8 3.2 3.4 90.0
Cost per child $10,822 $10,822 $10,822 $10,822 $10,822 $10,822 Subtotal $470,169 $348,062 $84,448 $34,236 $37,089 $974,003
Total foster care costs avoided $1,878,878 $1,390,917 $337,468 $136,811 $148,212 $3,892,287 Note: Totals may not sum due to rounding. Source: Carl Vinson Institute of Government
50
Table 22. Subsequent Crime Victimization Costs Avoided for FY 2017 Graduates of Accountability Courts in Georgia
Drug Court DUI Court
Mental Health Court
Family Treatment
Court Veterans
Court Total
Number of graduates FY 2017 824 610 148 60 65 1,707
Benefit type
Percentage of
graduates affected
Cost or benefit per
affected graduate*
Subsequent crime and victimization costs avoided
100% $6,665 824 610 148 60 65 1,707
Total $5,491,960 $4,065,650 $986,420 $399,900 $433,225 $11,377,155
*NIJ calculated this benefit per program participant. It is applied here only to program graduates. Note: Totals may not sum due to rounding. Source: Carl Vinson Institute of Government
51
Table 23. Annual Net State and Societal Benefits Attributable to 1,707 Program Graduates in FY 2017
Drug Court DUI Court
Mental Health Court
Family Treatment
Court Veterans
Court Total
Number of graduates FY 2017 824 610 148 60 65 1,707
Adjudication and program costs $3,878,568 $2,871,270 $696,636 $282,420 $305,955 $8,034,849 Program fees $1,785,608 $2,024,590 $135,568 $31,860 $48,685 $3,297,924 Net program costs $5,664,176 $4,895,860 $832,204 $314,280 $354,640 $11,332,773
Health care costs
Single coverage $586,944 $434,510 $105,422 $42,739 $46,300 $1,215,915 Family coverage $1,611,149 $1,192,995 $289,448 $117,344 $127,122 $3,338,431 NAS births $1,665,312 $1,232,816 $299,109 $121,261 $131,366 $3,449,864 Total health-related benefits $3,863,405 $2,860,321 $693,979 $281,344 $304,788 $8,004,210
Work related benefits
Income taxes $545,373 $542,595 $71,395 $27,630 $45,868 $1,232,861 Community service $1,414,808 $513,620 $127,132 $43,740 $73,710 $1,935,738 Total work-related benefits $1,960,181 $1,056,215 $198,527 $71,370 $119,578 $3,168,599
Costs avoided
Foster care $1,878,878 $1,390,917 $337,468 $136,811 $148,212 $3,892,287 Crime and victimization $5,491,960 $4,065,650 $986,420 $399,900 $433,225 $11,377,155 Total costs avoided $7,370,838 $5,456,567 $1,323,888 $536,711 $581,437 $15,269,442
Grand total $18,858,600 $14,268,963 $3,048,598 $1,203,705 $1,360,443 $37,775,024 Source: Carl Vinson Institute of Government

52
Appendix A - Accountability Court Program Participant Survey

53

54
55
56
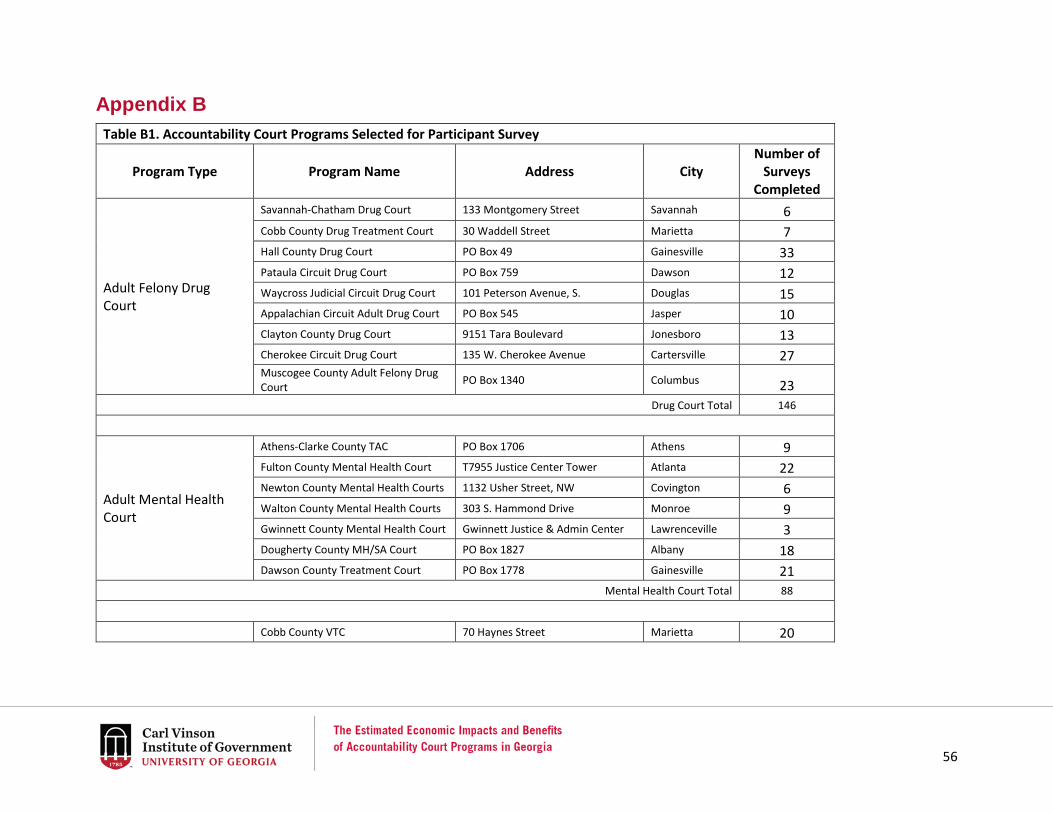
Appendix B Table B1. Accountability Court Programs Selected for Participant Survey
Program Type Program Name Address City Number of
Surveys Completed
Adult Felony Drug Court
Savannah-Chatham Drug Court 133 Montgomery Street Savannah 6 Cobb County Drug Treatment Court 30 Waddell Street Marietta 7 Hall County Drug Court PO Box 49 Gainesville 33 Pataula Circuit Drug Court PO Box 759 Dawson 12 Waycross Judicial Circuit Drug Court 101 Peterson Avenue, S. Douglas 15 Appalachian Circuit Adult Drug Court PO Box 545 Jasper 10 Clayton County Drug Court 9151 Tara Boulevard Jonesboro 13 Cherokee Circuit Drug Court 135 W. Cherokee Avenue Cartersville 27 Muscogee County Adult Felony Drug Court PO Box 1340 Columbus 23
Drug Court Total 146
Adult Mental Health Court
Athens-Clarke County TAC PO Box 1706 Athens 9 Fulton County Mental Health Court T7955 Justice Center Tower Atlanta 22 Newton County Mental Health Courts 1132 Usher Street, NW Covington 6 Walton County Mental Health Courts 303 S. Hammond Drive Monroe 9 Gwinnett County Mental Health Court Gwinnett Justice & Admin Center Lawrenceville 3 Dougherty County MH/SA Court PO Box 1827 Albany 18 Dawson County Treatment Court PO Box 1778 Gainesville 21
Mental Health Court Total 88
Cobb County VTC 70 Haynes Street Marietta 20

57
Table B1. Accountability Court Programs Selected for Participant Survey
Veterans Treatment Court
Appalachian Circuit TVC PO Box 545 Jasper 3 Chatham-Savannah VTC 204 Chatham County Courthouse Savannah 17 Bibb County VTC 601 Mulberry Street Macon 4
Veterans Court Total 44
DUI Court
Athens-Clarke County DUI Court 300 E. Washington Street Athens 35 Chatham County DUI Court Chatham County Courthouse Savannah 11 Forsyth County DUI Court 100 W. Courthouse Square Cumming 11 Rockdale County DUI Court 922 Court Street Conyers 8 DeKalb County DUI Court 556 N. McDonough Street Decatur 40 Cherokee County DUI/Drug Court 90 North Street Canton 20
DUI Court Total 125
Family Treatment Court
Appalachian Circuit FTC PO Box 2043 Blue Ridge 10 Baldwin County FTC PO Box 1810 Milledgeville 11 Hall County FTC PO Box 311 Gainesville 11 Enotah Family Treatment Court 325 Riley Road Dahlonega 18
Fulton County FTC Romae T. Powell Juvenile Justice Center Atlanta 5
Athens-Clarke County FTC 300 E. Washington Street Athens 5 Family Treatment Court Total 60
Grand Total 463 Source: Carl Vinson Institute of Government
58
Appendix C – Average and Marginal Costs of Incarceration Using data from the Georgia Department of Corrections annual reports from 2007 to 2016, the annual cost per offender at state prisons has ranged from about $20,000 to a little more than $22,000, or roughly $55 to $58 per inmate day. The problem with using this estimate of incarceration costs is that it is the average cost and includes both the variable costs (food, clothing, and other expendable items) associated with individual inmates, plus each inmate’s share of fixed costs (prison staff, equipment, utilities, and the like). If the annual inmate population is lower than it would have been otherwise because accountability court programs have kept defendants from serving time in state prisons, the variables costs of housing those inmates are avoided. The fixed costs of operating the prisons, however, are simply spread over fewer inmates, thus raising the average cost. The marginal costs are those that can be completely avoided by keeping an inmate from entering the state prison system. Fixed costs are more difficult to avoid, but prisons and parts of prisons may be taken out of operation when not needed.
A major problem with estimating marginal costs is the lack of data. Methods of estimating marginal costs vary, but all require extensive data. The VERA Institute of Justice produced a report for the Bureau of Justice Assistance at the US Department of Justice outlining several methods depending on the data available.30 Two top-down approaches use aggregate budget data. The first requires the analyst to identify the costs that are related to the activity and the workload increase to be funded. For example, if one knows the costs associated with adding one probation officer to the staff and the number of probationers the officer will supervise, the marginal cost is simply the cost divided by the number of probationers. Estimating the marginal cost of incarceration would require data on all costs associated with prison operations excluding capital and the fixed operational costs of prison operation.
A second approach uses regression analysis to analyze data collected over a period of years. Regression analysis plots a (line) slope that identifies the increase in costs that have been realized historically as the workload changes, in this case the number of inmates or inmate days. The slope can be expressed mathematically and is easily represented on a two-dimensional graph. The regression equation includes an intercept term that places the starting point of the line on the vertical axis. This point represents the fixed costs, and the slope represents the marginal costs associated with different inmate population numbers that are placed on the horizontal axis. Of course, this assumes an upward sloping line for an inmate
30 Christian Henrichson and Sarah Galagano (VERA Institute of Justice). 2013. A Guide to Calculating Justice-System Marginal Costs. Washington, DC: Bureau of Justice Assistance, US Department of Justice.
59
population that increases each year. Regression analysis requires a statistically significant linear association between the two variables to obtain accurate results. A review of the data in Table C2 shows that over the past 10 years, total expenditures by the Georgia Department of Corrections has increased from one year to the next when the inmate population has decreased, and has decreased when the inmate population has increased. For this reason, most studies that compare accountability court program costs to the costs of traditional adjudication and incarceration have used average costs rather than marginal costs of incarceration.

60
Table C1. Costs Per Participant in Nine Drug Court Studies
Year Court Program Cost per Participant*
2015 Oregon (4 programs) – NPC $23,206 2013 Bexar County, Texas – NPC $14,764 2013 Benton County, Oregon – NPC $16,396 2011 Oregon (statewide) – NPC $17,510 2012 Pima County, Arizona – NPC $9,200 2010 Howard County, Maryland – NPC $15,288 2010 Montgomery County, Maryland – NPC $38,134 2009 Wicomico County, Maryland – NPC $36,923 2009 Rutland County, Vermont – NPC $32,709 2007 Washington State (statewide) $12,998 2014 Bexar County, Texas – UT-Austin $11,282 1996 Washington DC – DCCPI $18,131
Average for all 12 studies $20,545 *Costs adjusted to 2016 dollars using Consumer Price Index Sources: NPC studies accessed on npcresearch.com/reports-publications/ Washington State www.wsipp.wa.gov/ReportFile/1405 Bexar County, Texas (2014) www.universityhealthsystem.com/~/media/files/pdf/about-us/healthcare-summit/behavioralhealthandcriminaljusticesubstanceabuseposition.pdf?la=en Washington DC jpo.wrlc.org/bitstream/handle/11204/2090/A%20Bayesian%20Meta-Analysis%20of%20Drug%20Court%20Cost-Effectiveness.pdf?sequence=3
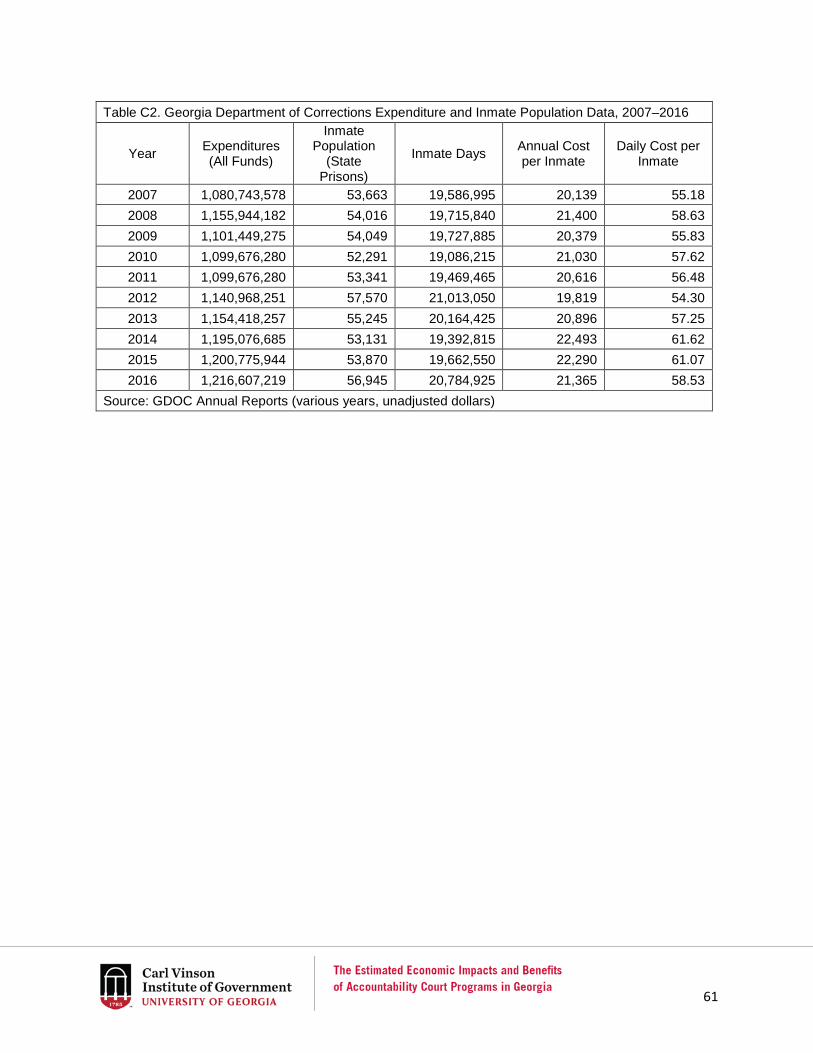
61
Table C2. Georgia Department of Corrections Expenditure and Inmate Population Data, 2007–2016
Year Expenditures (All Funds)
Inmate Population
(State Prisons)
Inmate Days Annual Cost per Inmate
Daily Cost per Inmate
2007 1,080,743,578 53,663 19,586,995 20,139 55.18 2008 1,155,944,182 54,016 19,715,840 21,400 58.63 2009 1,101,449,275 54,049 19,727,885 20,379 55.83 2010 1,099,676,280 52,291 19,086,215 21,030 57.62 2011 1,099,676,280 53,341 19,469,465 20,616 56.48 2012 1,140,968,251 57,570 21,013,050 19,819 54.30 2013 1,154,418,257 55,245 20,164,425 20,896 57.25 2014 1,195,076,685 53,131 19,392,815 22,493 61.62 2015 1,200,775,944 53,870 19,662,550 22,290 61.07 2016 1,216,607,219 56,945 20,784,925 21,365 58.53
Source: GDOC Annual Reports (various years, unadjusted dollars)
Copyright © 2022 FDOKUMEN