Examples of high-frequency EPR studies in bioinorganic chemistry
14
MINI REVIEW Examples of high-frequency EPR studies in bioinorganic chemistry Received: 1 March 2002 / Accepted: 4 November 2002 / Published online: 20 December 2002 Ó SBIC 2002 Abstract Low-temperature EPR spectroscopy with fre- quencies between 95 and 345 GHz and magnetic fields up to 12 T has been used to study metal sites in proteins or inorganic complexes and free radicals. The high-field EPR method was used to resolve g-value anisotropy by separating it from overlapping hyperfine couplings. The presence of hydrogen bonding interactions to the tyrosyl radical oxygens in ribonucleotide reductases were detected. At 285 GHz the g-value anisotropy from the rhombic type 2 Cu(II) signal in the enzyme laccase has its g-value anisotropy clearly resolved from slightly different overlapping axial species. Simple metal site systems with S>1/2 undergo a zero-field splitting, which can be described by the spin Hamiltonian H s ¼ bSgB þ D½S 2 z S ðS þ 1Þ=3 þðE=DÞðS 2 x S 2 y Þ. From high-frequency EPR, the D values that are small compared to the frequency (high-field limit) can be determined directly by measuring the distance of the outermost signal to the center of the spectrum, which corresponds to (2S)1)* |D|. For example, D values of 0.8 and 0.3 cm )1 are observed for S=5/2 Fe(III)-EDTA and transferrin, respectively. When D values are larger compared to the frequency and in the case of half- integer spin systems, they can be obtained from the frequency dependence of the shifts of g eff , as observed for myoglobin in the presence (D=5 cm )1 ) or absence (D=9.5 cm )1 ) of fluoride. The 285 and 345 GHz spectra of the Fe(II)-NO-EDTA complex show that it is best described as a S=3/2 system with D=11.5 cm )1 , E=0.1 cm )1 , and g x =g y =g z =2.0. Finally, the effects of HF-EPR on X-band EPR silent states and weak mag- netic interactions are demonstrated. Keywords High-field EPR Zero-field splitting Iron proteins Copper proteins Heme proteins Introduction The study of the relationship between the molecular structure and the function of macromolecules in con- nection with their evolutionary and applied aspects is a field of growing importance now that several complete genomes are sequenced. The biologically active centers of many proteins contain transition metal-ion and/or redox-active small organic cofactors or amino acids. These proteins play important roles in Nature. Some enzymes are unique in their ability to catalyze many types of reactions, including some that cannot be as ef- fectively and specifically catalyzed by other known chemical systems at similar temperatures (300 K). This is, for instance, the case for the class of mono- oxygenases. Certain metalloproteins (e.g., iron and/or copper), with/without organic cofactors, have an elec- tronic structure that is paramagnetic in some redox state(s). This property makes them suitable for studies by electron paramagnetic resonance (EPR) with minimal interference from the majority of the protein’s amino acids. These physical studies can give information linked to the enzymatic reaction mechanism or the function of the protein. J Biol Inorg Chem (2003) 8: 235–247 DOI 10.1007/s00775-002-0429-0 K. Kristoffer Andersson Peter P. Schmidt Bettina Katterle Kari R. Strand Amy E. Palmer Sang-Kyu Lee Edward I. Solomon Astrid Gra¨slund Anne-Laure Barra K. K. Andersson (&) P. P. Schmidt B. Katterle K. R. Strand Department of Biochemistry, University of Oslo, Blindern, P.O. Box 1041, 0316 Oslo, Norway E-mail: [email protected] Tel.: +47-2-2856625 Fax: +47-2-2854443 A. E. Palmer S.-K. Lee E. I. Solomon Department of Chemistry, Stanford University, Stanford, CA 94305-5080, USA A. Gra¨slund Department of Biochemistry and Biophysics, Stockholm University, 10691 Stockholm, Sweden A.-L. Barra High Magnetic Field Laboratory, CNRS/MPI, B.P. 166, 38042 Grenoble, France Present addresses: Peter P.Schmidt B. Katterle Max-Planck-Institut fu¨r Strahlenchemie/Radiation Chemistry, Stiftstrasse 34–36, 45470 Mulheim an der Ruhr, Germany S.-K. Lee Genencor International, 925 Page Mill Road, Palo Alto, CA 94304-1013, USA
-
Upload
independent -
Category
Documents
-
view
3 -
download
0
Transcript of Examples of high-frequency EPR studies in bioinorganic chemistry

MINI REVIEW
Examples of high-frequency EPR studies in bioinorganic chemistry
Received: 1 March 2002 / Accepted: 4 November 2002 / Published online: 20 December 2002� SBIC 2002
Abstract Low-temperature EPR spectroscopy with fre-quencies between 95 and 345 GHz and magnetic fieldsup to 12 T has been used to study metal sites in proteinsor inorganic complexes and free radicals. The high-fieldEPR method was used to resolve g-value anisotropy byseparating it from overlapping hyperfine couplings. Thepresence of hydrogen bonding interactions to the tyrosylradical oxygens in ribonucleotide reductases weredetected. At 285 GHz the g-value anisotropy from therhombic type 2 Cu(II) signal in the enzyme laccasehas its g-value anisotropy clearly resolved from slightlydifferent overlapping axial species. Simple metal sitesystems with S>1/2 undergo a zero-field splitting,which can be described by the spin HamiltonianHs ¼ bSgBþD½S2
z � SðSþ 1Þ=3þ ðE=DÞðS2x � S2
y Þ�. Fromhigh-frequency EPR, the D values that are smallcompared to the frequency (high-field limit) can bedetermined directly by measuring the distance of theoutermost signal to the center of the spectrum, whichcorresponds to (2S)1)* |D|. For example, D values of
0.8 and 0.3 cm)1 are observed for S=5/2 Fe(III)-EDTAand transferrin, respectively. When D values are largercompared to the frequency and in the case of half-integer spin systems, they can be obtained from thefrequency dependence of the shifts of geff, as observedfor myoglobin in the presence (D=5 cm)1) or absence(D=9.5 cm)1) of fluoride. The 285 and 345 GHz spectraof the Fe(II)-NO-EDTA complex show that it is bestdescribed as a S=3/2 system with D=11.5 cm)1,E=0.1 cm)1, and gx=gy=gz=2.0. Finally, the effects ofHF-EPR on X-band EPR silent states and weak mag-netic interactions are demonstrated.
Keywords High-field EPR Æ Zero-field splitting ÆIron proteins Æ Copper proteins Æ Heme proteins
Introduction
The study of the relationship between the molecularstructure and the function of macromolecules in con-nection with their evolutionary and applied aspects is afield of growing importance now that several completegenomes are sequenced. The biologically active centersof many proteins contain transition metal-ion and/orredox-active small organic cofactors or amino acids.These proteins play important roles in Nature. Someenzymes are unique in their ability to catalyze manytypes of reactions, including some that cannot be as ef-fectively and specifically catalyzed by other knownchemical systems at similar temperatures (300 K). Thisis, for instance, the case for the class of mono-oxygenases. Certain metalloproteins (e.g., iron and/orcopper), with/without organic cofactors, have an elec-tronic structure that is paramagnetic in some redoxstate(s). This property makes them suitable for studiesby electron paramagnetic resonance (EPR) with minimalinterference from the majority of the protein’s aminoacids. These physical studies can give information linkedto the enzymatic reaction mechanism or the function ofthe protein.
J Biol Inorg Chem (2003) 8: 235–247DOI 10.1007/s00775-002-0429-0
K. Kristoffer Andersson Æ Peter P. Schmidt
Bettina Katterle Æ Kari R. Strand Æ Amy E. Palmer
Sang-Kyu Lee Æ Edward I. Solomon Æ Astrid Graslund
Anne-Laure Barra
K. K. Andersson (&) Æ P. P. Schmidt Æ B. Katterle Æ K. R. StrandDepartment of Biochemistry, University of Oslo, Blindern,P.O. Box 1041, 0316 Oslo, NorwayE-mail: [email protected].: +47-2-2856625Fax: +47-2-2854443
A. E. Palmer Æ S.-K. Lee Æ E. I. SolomonDepartment of Chemistry, Stanford University, Stanford,CA 94305-5080, USA
A. GraslundDepartment of Biochemistry and Biophysics,Stockholm University, 10691 Stockholm, Sweden
A.-L. BarraHigh Magnetic Field Laboratory, CNRS/MPI, B.P. 166,38042 Grenoble, France
Present addresses: Peter P.Schmidt Æ B. KatterleMax-Planck-Institut fur Strahlenchemie/Radiation Chemistry,Stiftstrasse 34–36, 45470 Mulheim an der Ruhr, Germany
S.-K. LeeGenencor International, 925 Page Mill Road, Palo Alto, CA94304-1013, USA
Verwendete Distiller 5.0.x Joboptions
Dieser Report wurde automatisch mit Hilfe der Adobe Acrobat Distiller Erweiterung "Distiller Secrets v1.0.5" der IMPRESSED GmbH erstellt. Sie koennen diese Startup-Datei für die Distiller Versionen 4.0.5 und 5.0.x kostenlos unter http://www.impressed.de herunterladen. ALLGEMEIN ---------------------------------------- Dateioptionen: Kompatibilität: PDF 1.2 Für schnelle Web-Anzeige optimieren: Ja Piktogramme einbetten: Ja Seiten automatisch drehen: Nein Seiten von: 1 Seiten bis: Alle Seiten Bund: Links Auflösung: [ 600 600 ] dpi Papierformat: [ 595.276 785.197 ] Punkt KOMPRIMIERUNG ---------------------------------------- Farbbilder: Downsampling: Ja Berechnungsmethode: Bikubische Neuberechnung Downsample-Auflösung: 150 dpi Downsampling für Bilder über: 225 dpi Komprimieren: Ja Automatische Bestimmung der Komprimierungsart: Ja JPEG-Qualität: Mittel Bitanzahl pro Pixel: Wie Original Bit Graustufenbilder: Downsampling: Ja Berechnungsmethode: Bikubische Neuberechnung Downsample-Auflösung: 150 dpi Downsampling für Bilder über: 225 dpi Komprimieren: Ja Automatische Bestimmung der Komprimierungsart: Ja JPEG-Qualität: Mittel Bitanzahl pro Pixel: Wie Original Bit Schwarzweiß-Bilder: Downsampling: Ja Berechnungsmethode: Bikubische Neuberechnung Downsample-Auflösung: 600 dpi Downsampling für Bilder über: 900 dpi Komprimieren: Ja Komprimierungsart: CCITT CCITT-Gruppe: 4 Graustufen glätten: Nein Text und Vektorgrafiken komprimieren: Ja SCHRIFTEN ---------------------------------------- Alle Schriften einbetten: Ja Untergruppen aller eingebetteten Schriften: Nein Wenn Einbetten fehlschlägt: Warnen und weiter Einbetten: Immer einbetten: [ ] Nie einbetten: [ ] FARBE(N) ---------------------------------------- Farbmanagement: Farbumrechnungsmethode: Alle Farben zu sRGB konvertieren Methode: Standard Arbeitsbereiche: Graustufen ICC-Profil: RGB ICC-Profil: sRGB IEC61966-2.1 CMYK ICC-Profil: U.S. Web Coated (SWOP) v2 Geräteabhängige Daten: Einstellungen für Überdrucken beibehalten: Ja Unterfarbreduktion und Schwarzaufbau beibehalten: Ja Transferfunktionen: Anwenden Rastereinstellungen beibehalten: Ja ERWEITERT ---------------------------------------- Optionen: Prolog/Epilog verwenden: Nein PostScript-Datei darf Einstellungen überschreiben: Ja Level 2 copypage-Semantik beibehalten: Ja Portable Job Ticket in PDF-Datei speichern: Nein Illustrator-Überdruckmodus: Ja Farbverläufe zu weichen Nuancen konvertieren: Nein ASCII-Format: Nein Document Structuring Conventions (DSC): DSC-Kommentare verarbeiten: Nein ANDERE ---------------------------------------- Distiller-Kern Version: 5000 ZIP-Komprimierung verwenden: Ja Optimierungen deaktivieren: Nein Bildspeicher: 524288 Byte Farbbilder glätten: Nein Graustufenbilder glätten: Nein Bilder (< 257 Farben) in indizierten Farbraum konvertieren: Ja sRGB ICC-Profil: sRGB IEC61966-2.1 ENDE DES REPORTS ---------------------------------------- IMPRESSED GmbH Bahrenfelder Chaussee 49 22761 Hamburg, Germany Tel. +49 40 897189-0 Fax +49 40 897189-71 Email: [email protected] Web: www.impressed.de
Adobe Acrobat Distiller 5.0.x Joboption Datei
<< /ColorSettingsFile () /AntiAliasMonoImages false /CannotEmbedFontPolicy /Warning /ParseDSCComments false /DoThumbnails true /CompressPages true /CalRGBProfile (sRGB IEC61966-2.1) /MaxSubsetPct 100 /EncodeColorImages true /GrayImageFilter /DCTEncode /Optimize true /ParseDSCCommentsForDocInfo false /EmitDSCWarnings false /CalGrayProfile () /NeverEmbed [ ] /GrayImageDownsampleThreshold 1.5 /UsePrologue false /GrayImageDict << /QFactor 0.9 /Blend 1 /HSamples [ 2 1 1 2 ] /VSamples [ 2 1 1 2 ] >> /AutoFilterColorImages true /sRGBProfile (sRGB IEC61966-2.1) /ColorImageDepth -1 /PreserveOverprintSettings true /AutoRotatePages /None /UCRandBGInfo /Preserve /EmbedAllFonts true /CompatibilityLevel 1.2 /StartPage 1 /AntiAliasColorImages false /CreateJobTicket false /ConvertImagesToIndexed true /ColorImageDownsampleType /Bicubic /ColorImageDownsampleThreshold 1.5 /MonoImageDownsampleType /Bicubic /DetectBlends false /GrayImageDownsampleType /Bicubic /PreserveEPSInfo false /GrayACSImageDict << /VSamples [ 2 1 1 2 ] /QFactor 0.76 /Blend 1 /HSamples [ 2 1 1 2 ] /ColorTransform 1 >> /ColorACSImageDict << /VSamples [ 2 1 1 2 ] /QFactor 0.76 /Blend 1 /HSamples [ 2 1 1 2 ] /ColorTransform 1 >> /PreserveCopyPage true /EncodeMonoImages true /ColorConversionStrategy /sRGB /PreserveOPIComments false /AntiAliasGrayImages false /GrayImageDepth -1 /ColorImageResolution 150 /EndPage -1 /AutoPositionEPSFiles false /MonoImageDepth -1 /TransferFunctionInfo /Apply /EncodeGrayImages true /DownsampleGrayImages true /DownsampleMonoImages true /DownsampleColorImages true /MonoImageDownsampleThreshold 1.5 /MonoImageDict << /K -1 >> /Binding /Left /CalCMYKProfile (U.S. Web Coated (SWOP) v2) /MonoImageResolution 600 /AutoFilterGrayImages true /AlwaysEmbed [ ] /ImageMemory 524288 /SubsetFonts false /DefaultRenderingIntent /Default /OPM 1 /MonoImageFilter /CCITTFaxEncode /GrayImageResolution 150 /ColorImageFilter /DCTEncode /PreserveHalftoneInfo true /ColorImageDict << /QFactor 0.9 /Blend 1 /HSamples [ 2 1 1 2 ] /VSamples [ 2 1 1 2 ] >> /ASCII85EncodePages false /LockDistillerParams false >> setdistillerparams << /PageSize [ 595.276 841.890 ] /HWResolution [ 600 600 ] >> setpagedevice

The recent development of high-frequency and high-field EPR (HF-EPR) opens up novel types of studies ofparamagnetic centers, as described in several reviewsand publications [1, 2, 3, 4, 5, 6, 7, 8, 9, 10, 11, 12, 13, 14,15, 16, 17, 18, 19, 20, 21, 22, 23, 24]. For S=1/2 systems,the high-field method can resolve small g-tensor aniso-tropies of non-oriented samples. The value of the ani-sotropy determines how high a field, and consequently afrequency, is needed in order to directly determine theprincipal values of the g tensor by low-temperature EPRspectroscopy. The MIT group made the first high-fieldstudies, at 140 GHz, of the tyrosyl radical [25] of the keyenzyme ribonucleotide reductase (RNR). RNR catalysesthe reduction of all four ribonucleotides to their corre-sponding deoxyribonucleotides, an essential step in thesynthesis of DNA in all living cells. In Escherichia coli,herpes simplex viruses, and mammals, the class I RNR iscomposed of a ‘‘putative’’ one-to-one complex of twonon-identical homodimer subunits called R1 and R2.The class I RNR protein R2, the small subunit, containsa stable tyrosyl free radical and two iron ions withineach polypeptide chain [26, 27, 28, 29, 30]. Other radicalsin these classes of enzymes have also been studied byHF-EPR [31, 32]. The first HF-EPR studies of mono-nuclear Fe in a heme group were performed in Paris inthe 1970s [33, 34]. HF-EPR has been extensively used instudies of other key biological systems, such as theparamagnetic centers involved in photosynthesis [3, 7,11, 19, 35, 36, 37, 38, 39].
Most of the existing HF-EPR spectrometers arehome-built systems. They are thus very different fromone to the other, but space limitations do not allow adescription of all of them. The interested reader can findthese technical aspects in the detailed review by Smithand Riedi ([40] and references therein). Here we willfocus on the spectrometer developed in the GrenobleHigh Magnetic Field Laboratory, as most of the resultspresented here have been obtained with this type ofspectrometer. It belongs to the so-called single-passtransmission spectrometers, which allow studies on avery broad frequency range but with low sensitivity [41,42]. The available frequencies range from 50 GHz tomore than 1 THz, using either backward wave oscilla-tors (from 50 to 120 GHz, Elmika) or Gunn diodes(Radiometer Physics) and their multipliers (from 95 to575 GHz), or a far-infrared laser (from 160 GHz to>1 THz). Changing frequencies can be accomplished insome cases in less than 10 min. The measurements havebeen performed with a superconducting magnet for thegeneration of the main magnetic field. The exciting lighttransmitted through the sample is then detected with ahot electron In-Sb bolometer. Samples were prepared incylindrical Teflon cups of 7 mm diameter with a typicalvolume of 200 lL. The absence of a cavity allows thesample to be introduced easily at liquid nitrogen tem-perature and spectra to be recorded at several fre-quencies without taking the sample out. For the tyrosylradical studies, spectra with good signal-to-noise ratioswere obtained at low temperature (5–20 K) for radical
concentrations of about 100 lM. For EPR signals frommetal ions sites, at least a minimal concentration of 1–3 mM must be used. In most cases, much higher con-centrations are needed, in the 10 mM range at least.Single-pass transmission systems exist in a few labora-tories; one is used in the National High Magnet FieldLaboratory, Tallahassee, Fla., USA.
There are also several spectrometers with cavities,including the commercial Bruker W-band spectrometeroperating at around 95 GHz, but several home-builtspectrometers at different frequencies are also in use.These types of spectrometers have a similar conceptionas the usual X- and Q-band EPR spectrometers. Theyhave high sensitivity and use very small sample volumes,e.g. a sample volume of a few microliters with micro-molar concentrations, and in some cases a single proteinmicrocrystal is sufficient. In some cases, these high-sen-sitivity systems can also work in pulsed mode and allowENDOR spectroscopy (e.g. in [14, 31, 40, 43]).
In this review we describe some recent studies doneon free radicals, FeIII, CuII, and MnII containing pro-teins, and small inorganic models. We report studies ofS=1/2, 3/2, and 5/2 systems, as well as an example ofthe decoupling of weakly interacting magnetic systemsby the use of HF-EPR.
Selected examples of the use of HF-EPR
Studies with S=1/2 systems
Hydrogen bond to the tyrosyl radicalin RNR R2 proteins
There are three different classes of RNR [26, 27, 28, 29,30] that have similar active sites and a postulated thiylradical located in the active site, which carries out theredox chemistry with the substrate. This active site ra-dical needs to be generated by different sources. In classI RNR, it is a relatively stable tyrosyl radical that is thesource for the thiyl radical. A di-iron-oxygen cluster [26]stabilizes the tyrosyl radical and is formed concomitantwith the tyrosyl radical. In this case, the interest inHF-EPR with respect to the X-band is to increase theZeeman interaction without changing the hyperfineinteraction and thus resolving the g anisotropy. Ourrecent study, which is important for the entire classI RNR field, demonstrates that an earlier model usingthe features of the E. coli enzyme as standard for theclass I RNR enzymes is neither fully valid for the iron-oxygen cluster [26] nor for the tyrosyl radical in the R2proteins from other species. For instance, it had beenbelieved that all tyrosyl radicals in RNR class I haveproperties similar to those of the E. coli enzyme (a classIa RNR). The observed differences in the EPR spectra ofthe tyrosyl radicals from different species are mainlyattributed to changes in the dihedral angles HH of theb-methylene protons. As there are two b-methyleneprotons, only the dihedral angle of the a-carbon HC can
236
be defined unambiguously by the locations of the a-carbon, the b-carbon, and the plane of the tyrosine ring,i.e. any combination of two ring carbons. The HH anglesof the b-methylene protons then are calculated by ad-dition of 120� and 240�, respectively. The E. coli andmouse R2 each have a dihedral angle HC of about 33�.In the Salmonella RNR-R2 (class Ib) the dihedral angleof one b-methylene proton HH was first estimated to bein the range of 5–51� [44], but the spectrum is bestdescribed by about 50� [39, 44, 45, 46, 47, 48, 49, 50, 51],yielding HH=170� and HC=290� or )70� for the secondb-methylene proton and the a-carbon, respectively. Thisradical closely resembles the radicals in photosystem IIwith a dihedral angle HH of 52� [39, 44], i.e. HC=)70�being clearly different from the one found in E. coli [25].HF-EPR showed that both the E. coli and the Salmo-nella tyrosyl radicals lack a hydrogen bond to the tyrosyloxygen [14, 25, 44, 45, 46, 47]. In mouse RNR-R2,HF-EPR using the single-pass spectrometer in Grenoblehas shown the presence of a hydrogen bond to the tyr-osyl radical, based on the decrease of the g1 value (seebelow) (Fig. 1, lower panel). The mouse RNR-R2 g1value (solid line) of g=2.0076 is lower than the pre-viously studied E. coli and Salmonella tyrosyl radicals(dotted line) with g=2.0090. We obtained a good si-mulation of the X-band spectrum of the mouse enzymein D2O (Fig. 1, top panel) using the following para-meters: g=2.0076, 2.0043, 2.0022 for the components ofthe g tensor derived from the measurement at 245 GHz;and hyperfine coupling constants (in G) of Ab1=21.4,19.0, 21.45; Ab2=9.5, 2.5, 5.7; A3,5H1=)9.1, )4.4, )6.6;A3,5H2=)7.3, )4.8, )5.8; and linewidths = 4.5, 3.5,4.4 G. The resolved decreased g1 value of the mousetyrosyl radical was the first report of a hydrogen bond tothe radical oxygen in RNR-R2 [48]. Figure 2 demon-strates the effect of a hydrogen bond on the g1 of tyrosylradicals: whereas Y122* in E. coli R2 wild-type has nohydrogen bond, the artificial Y107* in the W107Y/Y122F double mutant of E. coli R2 [49, 50] has a stronghydrogen bond, shown by its 3D structure [50]; thus theg1 value of Y177* in mouse R2 wild-type suggests aweak hydrogen bond. The presence of this hydrogenbond in mouse R2 as well as in herpes simplex virus type1 RNR-R2 (that had a similar low g1 value) wasreconfirmed using pulsed ENDOR [51] and resonanceRaman spectroscopies [52]. The ENDOR study alsodetermined that the distance from the tyrosyl oxygento a D2O exchangeable weakly coupled proton to bearound 1.9 A in mouse and herpes simplex virus type 1RNR-R2. Several other RNRs [53, 54, 55, 56] havebeen analyzed by this method and a distribution ofhydrogen bond distances to the radicals has beenobserved. For a further discussion of the origin of theseeffects, see [25, 39, 44, 45, 46, 47, 48, 55]. Other tyrosine-and tryptophan-derived radicals have also been obser-ved in catalase, mutated cytochrome c peroxidase, andphotosystem II [35, 39, 45, 46, 57], for example.
In RNR proteins, radicals on other amino acidside chains have also been observed and analyzed by
HF-EPR. One example is the tryptophan radicalinduced in both mutant R2 proteins from E. coli(Y122F) and from mouse (Y177W) [58]. Another ex-ample from RNR is the paramagnetic species X formedas an intermediate in the radical generation reactionwhere protein-bound ferrous ions react with oxygen.The featureless X-band singlet signal has a characteristicg tensor, which is partly resolved at Q-band [59] and wellresolved at 285 GHz [60].
Resolution of copper signals in the multi-copperenzyme laccase
Laccase, ascorbate oxidase, ceruloplasmin, and Fet3p allcatalyze the four-electron reduction of oxygen to water
Fig. 1 Resolving different g anisotropies of the tyrosyl radical frommouse and Salmonella RNR-R2 proteins. Low-temperature EPRspectra of mouse and Salmonella typhimurium RNR-R2 proteins(data from [48]). Top panel: 9.62 GHz; 0.26 mM tyrosyl radicalfrom mouse RNR-R2 reconstituted in D2O (solid line) at 15 K,0.1 mT modulation amplitude at 100 kHz, 0.002 mW microwavepower; simulated spectrum with parameters described in the text.Lower panel: 249.997 GHz; same sample (solid line) as in the otherfrequency at 4 K, maximum 0.3 mT modulation amplitude at10 kHz; 0.07 mM tyrosyl radical from S. typhimurium RNR-R2F(dashed line) under identical conditions. From [63] with permission
237
[61]. These enzymes are multi-copper oxidases with threedifferent types of copper sites, two EPR active mono-nuclear coppers (termed type 1 and 2), and an EPR-silent anti-ferromagnetically coupled dinuclear cluster(termed type 3). The mononuclear non-blue type 2copper ion forms a trinuclear center together with thetype 3 copper cluster, while the blue type 1 copper is at
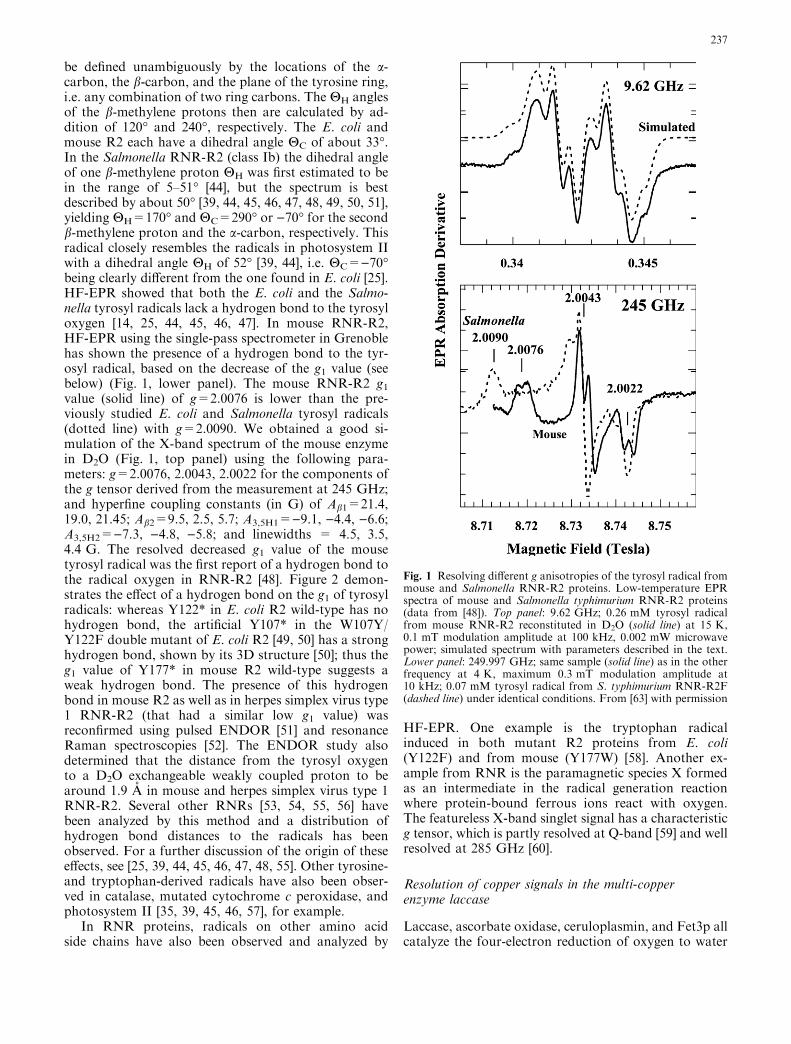
about 13 A distance from the trinuclear copper cluster.Organic substrates interact with the type 1 copper tochannel the four electrons needed for the reduction ofoxygen that takes place at the trinuclear center [61]. AtX-band the spectra from the different Cu species overlap[62] (data not shown) and the multitude of hyperfinecoupled peaks in the g|| region show the existence ofdifferent species. The g^ region is especially poorly re-solved, and HF-EPR could clearly demonstrate theorigin of the overlapping species. We have studied thenative oxidized laccase (from the tree Rhus vernicifera[62]) with all copper ions in the Cu(II) state (S=1/2) byHF-EPR [63]. At 115 GHz (Fig. 3) the g|| signal at2.30 from the type 1 (T1) copper is visible as well as theg|| signal at 2.24 from the type 2 (T2) copper from oneother laccase sample in water. Both species have largebroadening at 115 GHz. The [63, 65] Cu hyperfinecouplings observed at g|| in X-band EPR are not clearlyresolved at 115 GHz for T1 but are resolved for the T2
copper. This difference is very useful for differentiatingthe two copper species and also could be used for specificstudies of the T2 center at HF-EPR. The g^ region at115 GHz, on the other hand, contains overlapping sig-nals, which allow several interpretations.
In the expanded inset showing the g^ part of the285 GHz spectrum (Fig. 3), increased resolution of theoverlapping signals from T1 (with axial g tensor g||=2.30and g^=2.06) and T2 ( with a rhombic g tensor withg=2.24, 2.05 and 2.04) coppers is obtained, demon-strating that the origin of this 115 GHz g^ structure isassociated with the g-matrix anisotropy (which increaseslinearly with the applied field) of two different CuII
S=1/2 centers. This clearly demonstrates the advantagesof a multi-frequency approach to resolve and under-stand complicated multi-component spectra. Inspectionat only one frequency, e.g. at 115 GHz, could easily leadto a misinterpretation that this g^ pattern is from anI=1 hyperfine split signal, with a hyperfine coupling ofthe order of 160 G (a rather large value). However, theuse of two or better three different frequencies canclearly rule out this possibility, as well as comparingwith the X-band spectra.
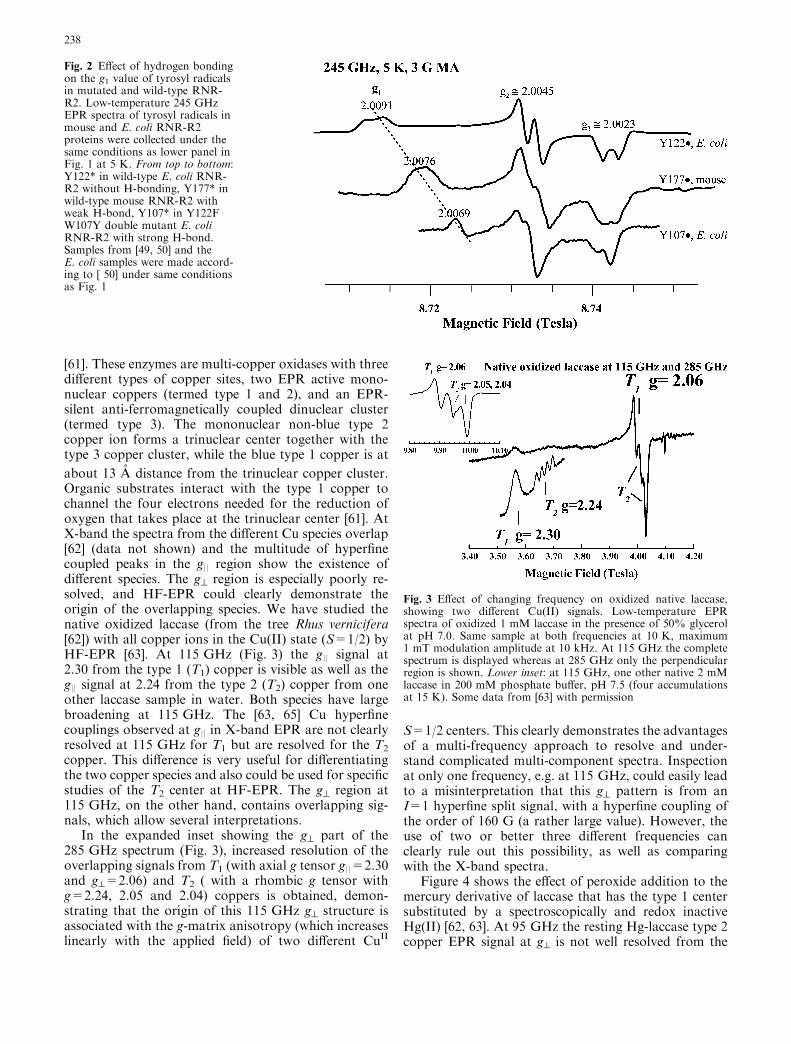
Figure 4 shows the effect of peroxide addition to themercury derivative of laccase that has the type 1 centersubstituted by a spectroscopically and redox inactiveHg(II) [62, 63]. At 95 GHz the resting Hg-laccase type 2copper EPR signal at g^ is not well resolved from the
Fig. 2 Effect of hydrogen bondingon the g1 value of tyrosyl radicalsin mutated and wild-type RNR-R2. Low-temperature 245 GHzEPR spectra of tyrosyl radicals inmouse and E. coli RNR-R2proteins were collected under thesame conditions as lower panel inFig. 1 at 5 K. From top to bottom:Y122* in wild-type E. coli RNR-R2 without H-bonding, Y177* inwild-type mouse RNR-R2 withweak H-bond, Y107* in Y122FW107Y double mutant E. coliRNR-R2 with strong H-bond.Samples from [49, 50] and theE. coli samples were made accord-ing to [ 50] under same conditionsas Fig. 1
Fig. 3 Effect of changing frequency on oxidized native laccase,showing two different Cu(II) signals. Low-temperature EPRspectra of oxidized 1 mM laccase in the presence of 50% glycerolat pH 7.0. Same sample at both frequencies at 10 K, maximum1 mT modulation amplitude at 10 kHz. At 115 GHz the completespectrum is displayed whereas at 285 GHz only the perpendicularregion is shown. Lower inset: at 115 GHz, one other native 2 mMlaccase in 200 mM phosphate buffer, pH 7.5 (four accumulationsat 15 K). Some data from [63] with permission
238

peroxide adduct spectrum. However, at 285 GHz (lowerpanel) the two different species have clearly very differ-ent perpendicular signals with a strong axial signal atg^=2.032 for the peroxide adduct, while the signal ofthe resting protein can be simulated with g1=2.239,g2=2.051 and g3=2.038, as observed in the native type 2copper signal in Fig. 3. These spectral features are inagreement with earlier X-band simulations of much lessresolved spectra [62]. The resting type 2 copper is knownfrom crystallography [64] to be three coordinated andfrom ligand field analysis of the EPR and MCD data theperoxide adduct is four coordinated, which is consistentwith its highly axial signal.
The S=1/2 spectra in these examples demonstrateone major strength of HF-EPR. At X-band the Zeemaninteraction is of the same order of magnitude as themain hyperfine couplings. At high field the Zeemaninteraction is dominant, resulting in a much simplerspectrum when the g anisotropy is clearly resolved.Going to higher fields allows resolution of small g ani-sotropies or separation of signals coming from differentspecies with only slightly different g values. We havestudied with HF-EPR other S=1/2 systems such as low-spin hemes, but their signals are relatively weak due tolarge linewidths associated with g strain. The higher
resolution of the g tensor at high field could be of greathelp to determine the orientation of the g tensor inprotein single crystals and allows a better orientationselection in ENDOR experiments. The latter will alsoallow us to refine/establish the presence/absence ofweakly interacting protons that can usually not be seenin the X-ray structure of the protein single crystal. Whenno single crystals are available, high-field ENDORmeasurements in frozen solutions (powder spectra) atthe well-separated g1 and/or g3 turning points of the gtensor will allow single crystal-like spectra showing thespatial distribution of any weakly interacting protons. Afew thorough studies of this kind on Cu(II), radical, andMn centers have been published recently [65, 66, 67, 68].However, a detailed description of these studies wouldexceed the scope of this review.
Studies of mononuclear metal-ion sites with S>1/2
Systems with S>1/2 may experience an external ligandfield on the paramagnetic metal-ion center that makesthe spin-orbit interactions important, on top of theelectron-electron magnetic dipolar interaction that arisesfrom the presence of several unpaired electrons in S>1/2 ‘‘molecules’’. The metal-ion orbitals lose their degen-eracy and split the spin state into different sub-states(Ms=)S, )S+1, ..., +S), even in the absence of anexternal magnetic field; this is the so-called zero-fieldsplitting (ZFS).
For simple metal sites, these systems with S>1/2 canbe described by the spin Hamiltonian [1, 12, 33, 34, 63,69, 70, 71, 72]:
Hs ¼ bSgBþ D S2z � S S þ 1ð Þ=3þ E=Dð Þ S2
x � S2y
� �h i
ð1Þin which b is the Bohr magneton, B the applied magneticfield, g the Lande matrix, D the axial ZFS parameter,and E the rhombic ZFS parameter. |E/D| ranges be-tween 0 and 1/3, with |E/D|=0.00 corresponding to thefully axial case, whereas the fully rhombic case has |E/D|=0.33. Knowledge of these constants gives informa-tion on the electronic structure and energy levels. Theseare some of the many parameters determining the re-activity of the center, and in turn important to under-standing the reaction and/or binding mechanism.Spectroscopic determination of the different Hamilto-nian parameters can be quite difficult using X-band EPRalone and in many cases other methods must be used.HF-EPR is in principle a very powerful tool for thestudy of systems with large ZFS, as the high frequencyenables one to overcome the extra energy gaps inducedby ZFS. This is particularly relevant in the case of in-teger spin systems, as the presence of ZFS often makesthem EPR silent at low frequencies. In the case of half-integer spin systems, it is possible to obtain a signalat low frequency due to the Kramers degeneracy.However, large ZFS values must be determined byadditional temperature-dependent experiments of con-
Fig. 4 Increased resolution of Hg laccase with or without peroxideat 285 GHz. Low-temperature EPR spectra (perpendicular region)of oxidized 2 mM Hg-substituted laccase (solid lines) and afterincubation with peroxide (dotted line); samples made according to[62]. Same samples at indicated frequencies at 15 K, maximum1 mT modulation amplitude at 10 kHz. From [63] with permission
239

centrated samples. Going to higher frequencies, and thusobserving the signals with conditions closer to the limitwhere the Zeeman interaction is larger than the ZFS,enables one to determine the ZFS parameters or, atleast, to estimate them with a higher precision. Thisapproach has proven to be very useful in studies ofconcentrated model complexes [1], but results are scarcefor biological systems in which the total number of spinsin a sample is much lower. Furthermore, in biologicalsystems, EPR signals tend to broaden when the field isincreased due to g and D strains [12, 69].
Depending on the size of the D value compared to hm(m: exciting frequency), the spectroscopic response of thesystem can be very different. These effects in X-bandEPR and HF-EPR are illustrated below, with examplesdivided into two different cases of half-integer spinsystems: (1) with D values larger than hm or close to it(i.e., close to the low-field approximation for whichbgB £ D); (2) with D values smaller than hm (high-fieldapproximation). One integer spin system will be treatedlater in next section.
In general, determination of both ZFS parameters, Dand E, and the ‘‘real’’ g values of the S>1/2 spin system,requires matrix diagonalization of the spin Hamiltonianof Eq. 1. For the simple system depicted in Eq. 1, whichdoes not contain any (super)hyperfine interactions orexchange couplings, moderately fast computer programsfor matrix diagonalization are available nowadays (forinstance, the program developed by Weihe allowssimulation of any system described by a single spin) [73,74]. However, as one of the terms in Eq. 1 is field-dependent (bSgB) and the other is not, they can be‘‘separated’’ by multiple frequency measurements: (1) atlow field the contribution of the real g value is smalland the EPR spectra are determined by the rhombicity,i.e. the |E/D| value; (2) at high field the EPR spectrareflect the real g value and both the axial and rhombic
ZFS parameters, D and E. Practically, this means thatfrom a spectrum measured in the low-field limit onecan determine |E/D| with the help of rhombograms(see below) and from a spectrum measured in the high-field limit one can read the real g value and the ZFSparameters directly. We will focus on the determinationof the D value in the following.
In half-integer spin systems, e.g. S=3/2 and 5/2, theZFS leads to well-separated Kramers doublets ([ 12, 33,34] and inset of Fig. 5) at low fields. The effect of theZFS of an S=5/2 system on the energy levels of the sixdifferent spin states (mS=)5/2, )3/2, )1/2, +1/2, +3/2,and +5/2) is depicted in the inset of Fig. 5 for the low-field range. At zero field, three energy levels are seen. Assome external field is applied, these levels start to split.Thus, at zero field, each of the energy levels contains twospin states with the same energy, which are calledKramers doublets. In this case, when working with lowfrequencies compared to the energy difference betweenthese Kramers doublets (that is, compared to the ZFS),only transitions within Kramers doublets are detectableand an S=5/2 system can be treated as a superpositionof three separate ‘‘effective’’ spin S=1/2 doublets. In thelimit D>>bgB, the geff value is independent of the ac-tual D value. However, the sign of D determines whichKramers doublet(s) lie(s) lower and the rhombicity |E/D|determines the geff value. For example, in X-band EPRthe S=5/2 of Fe(III) in a rhombic EDTA complex withD=0.8 cm)1 (see below) leads to signals near the max-imum geff of 9.67 (from the lowest Kramers doublet) andclose to the isotropic geff of 4.28 (from the middleKramer doublet) at 9.6 GHz (hm corresponding to0.3 cm)1), although the real g value is g=2.00. In theaxial case (|E/D|=0.00), high-spin ferric heme proteins(S=5/2) with large D values, D�5–10 cm)1, display anintense axial signal around geff=6 and a signal at g=2from the lowest Kramers doublet at X-band. In the low-
Fig. 5 Shift of geff with frequencyof high-spin myoglobin at245 GHz. 10 mM of myoglobin atpH 6.8 and with addition of500 mM fluoride. Same sample at245 GHz, 15 K, maximum 1 mTmodulation amplitude at 10 kHz.Presence of solid O2 is indicated byan asterisk [77]. From [63, 75, 76]with permission. Inset: calculatedenergy levels of D=10 cm)1 (usingthe program EPRNMR; see http://www.chem.queensu.ca/eprmnr)
240
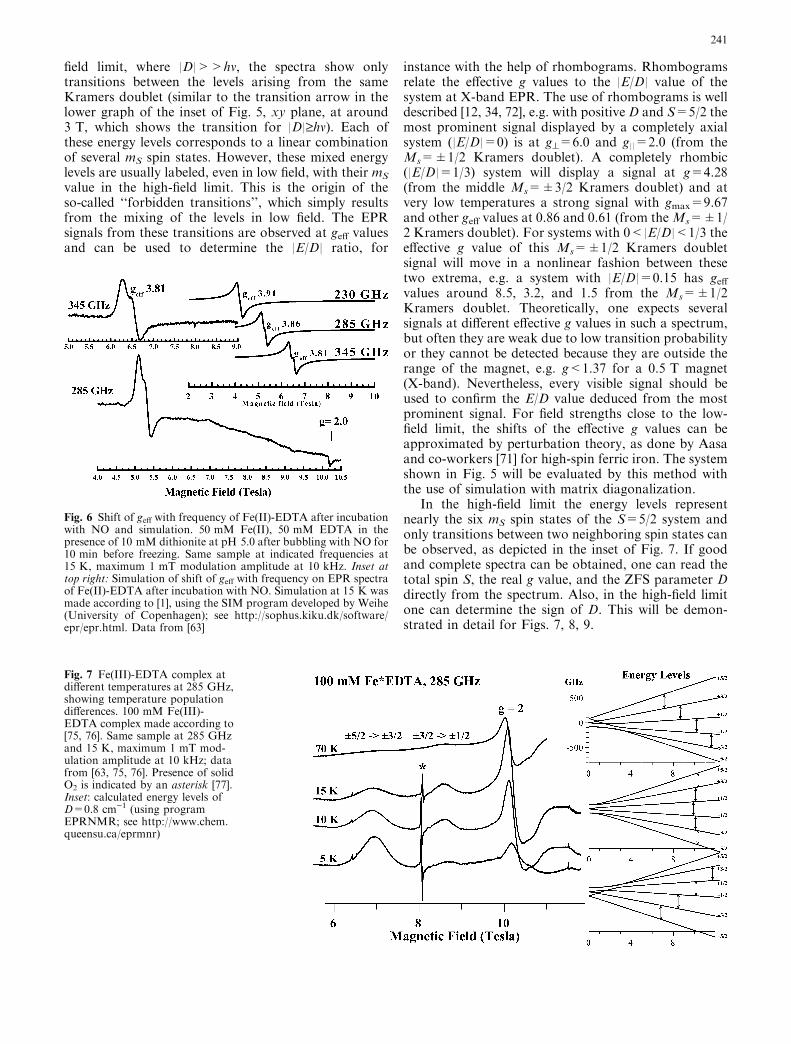
field limit, where |D|>>hm, the spectra show onlytransitions between the levels arising from the sameKramers doublet (similar to the transition arrow in thelower graph of the inset of Fig. 5, xy plane, at around3 T, which shows the transition for |D|‡hm). Each ofthese energy levels corresponds to a linear combinationof several mS spin states. However, these mixed energylevels are usually labeled, even in low field, with their mS
value in the high-field limit. This is the origin of theso-called ‘‘forbidden transitions’’, which simply resultsfrom the mixing of the levels in low field. The EPRsignals from these transitions are observed at geff valuesand can be used to determine the |E/D| ratio, for
instance with the help of rhombograms. Rhombogramsrelate the effective g values to the |E/D| value of thesystem at X-band EPR. The use of rhombograms is welldescribed [12, 34, 72], e.g. with positive D and S=5/2 themost prominent signal displayed by a completely axialsystem (|E/D|=0) is at g^=6.0 and g||=2.0 (from theMs=±1/2 Kramers doublet). A completely rhombic(|E/D|=1/3) system will display a signal at g=4.28(from the middle Ms=±3/2 Kramers doublet) and atvery low temperatures a strong signal with gmax=9.67and other geff values at 0.86 and 0.61 (from theMs=±1/2 Kramers doublet). For systems with 0<|E/D|<1/3 theeffective g value of this Ms=±1/2 Kramers doubletsignal will move in a nonlinear fashion between thesetwo extrema, e.g. a system with |E/D|=0.15 has geffvalues around 8.5, 3.2, and 1.5 from the Ms=±1/2Kramers doublet. Theoretically, one expects severalsignals at different effective g values in such a spectrum,but often they are weak due to low transition probabilityor they cannot be detected because they are outside therange of the magnet, e.g. g<1.37 for a 0.5 T magnet(X-band). Nevertheless, every visible signal should beused to confirm the E/D value deduced from the mostprominent signal. For field strengths close to the low-field limit, the shifts of the effective g values can beapproximated by perturbation theory, as done by Aasaand co-workers [71] for high-spin ferric iron. The systemshown in Fig. 5 will be evaluated by this method withthe use of simulation with matrix diagonalization.
In the high-field limit the energy levels representnearly the six mS spin states of the S=5/2 system andonly transitions between two neighboring spin states canbe observed, as depicted in the inset of Fig. 7. If goodand complete spectra can be obtained, one can read thetotal spin S, the real g value, and the ZFS parameter Ddirectly from the spectrum. Also, in the high-field limitone can determine the sign of D. This will be demon-strated in detail for Figs. 7, 8, 9.
Fig. 6 Shift of geff with frequency of Fe(II)-EDTA after incubationwith NO and simulation. 50 mM Fe(II), 50 mM EDTA in thepresence of 10 mM dithionite at pH 5.0 after bubbling with NO for10 min before freezing. Same sample at indicated frequencies at15 K, maximum 1 mT modulation amplitude at 10 kHz. Inset attop right: Simulation of shift of geff with frequency on EPR spectraof Fe(II)-EDTA after incubation with NO. Simulation at 15 K wasmade according to [1], using the SIM program developed by Weihe(University of Copenhagen); see http://sophus.kiku.dk/software/epr/epr.html. Data from [63]
Fig. 7 Fe(III)-EDTA complex atdifferent temperatures at 285 GHz,showing temperature populationdifferences. 100 mM Fe(III)-EDTA complex made according to[75, 76]. Same sample at 285 GHzand 15 K, maximum 1 mT mod-ulation amplitude at 10 kHz; datafrom [63, 75, 76]. Presence of solidO2 is indicated by an asterisk [77].Inset: calculated energy levels ofD=0.8 cm)1 (using programEPRNMR; see http://www.chem.queensu.ca/eprmnr)
241

Frequency-dependent shift of the effective g valueas a method for determining D values in S=3/2and 5/2 systems with relatively large D values
In half-integer spin systems, e.g. S=3/2 and 5/2, the zero-field splitting leads to well-separated Kramers doubletsat low fields. For the axial (|E/D|=0.00) high-spin ferric
heme (S=5/2) myoglobin (D �10 cm)1) and myoglobinfluoride (D�5 cm)1) complexes with largeD values, bothdisplay an intense axial signal around geff=5.9 and asignal at g=1.99 from the lowest Kramers doublet at X-band (data not shown). The ratio of the signal intensitiesfrom different Kramers doublets depends on theirBoltzmann population and depends strongly on tem-perature. Thus, a variable-temperature study of the in-tensity of the signals at X-band can be done to estimatethe D value and its sign, but it requires accurate tem-perature measurements and concentrated samples.
Early HF-EPR measurements of myoglobin and he-moglobin showed that geff shifted towards the real gvalue with increasing frequency [33, 69]. This is inagreement with our new HF-EPR studies, where we canobserve similar shifts of geff [63, 75, 76]. For instance,owing to the difference in the D values of myoglobin andits fluoride complex, the main signal shifted fromgeff=5.9 at X-band to geff=5.65 and geff=5.0, respec-tively, at 245 GHz (Fig. 5). From these shifts the Dvalues can be determined quite accurately, as the ZFS isno longer much larger than gbB. The study of the shiftof geff at Q-band and X-band was used by Aasa and co-workers [71] for small D values around D=1 cm)1 fornon-heme ferric high-spin signals (S=5/2) in the enzymelipoxygenase. They deduced a simple equation fromthird-order perturbation theory to calculate the D valuedirectly from the measured shifts of geff with frequencyfor S=5/2 systems:
D2 ¼ 3
2
g3realDgeff
hm2gm2
� �2
� hm1gm1
� �2" #
ð2Þ
Here, Dgeff is the absolute value of the difference betweenthe geff values at frequency m1gm1 and frequency m2gm2,Dgeff=|gm2gm1|. Assuming greal=2.0, as expected forhigh-spin Fe(III), and using geff=5.9 at 9.6 GHz andgeff=5.65 or geff=5.00 at 245 GHz for myoglobin or themyoglobin fluoride complex yields a D value of 10.0 or5.97 cm)1, respectively. By simulation using completematrix diagonalization by a program developed byWeihe and co-workers [73, 74], we find DMb�9.5 cm)1
for myoglobin and DMbF�5.0 cm)1 for the myoglo-bin fluoride complex, in agreement with other studieswith magnetic infrared and ENDOR spectroscopy[69, 70]. Thus, although 245 GHz corresponds to8.5 cm)1�DMb=9.5 cm)1, a condition that is the limitfor perturbation theory, the simple Eq. 2 yields a DMb
value within a 10% error margin. However, the shift ofDg�1.0 seen in the myoglobin fluoride complex gives aDMbF value that is 20% off. The broad signal from themyoglobin fluoride complex at neutral pH in Fig. 5 is infact due to the presence of two different fluoride com-plexes [70] with D values of �6 cm)1 (the low-pH form)and 5 cm)1 (the high-pH form) [70]. The presence of twofluoride complexes at neutral pH is in agreement withrecent data of the pH 10 fluoride complex (D value�5 cm)1) and measurements up to 475 GHz (withgeff�3.7 at 475 GHz) [78, 79].
Fig. 9 230 GHz EPR spectra of MnDPDP (TeslaScan) with high-spin Mn(II). A 0.6 mM MnDPDP; B 0.25 mM MnDPDP, 1.0 mMHSA, and 30 lM Zn2+; C 0.25 mM MnDPDP, 1.0 mM HSA, and1.5 mM Zn2+. Inserts: a 0.6 mM MnCl2; b expanded g=2 regionof sample in C. Spectra were corrected for different MnDPDPconcentrations and offsets were applied for clarity. Recordingparameters were 230 GHz EPR frequency, 15 K, 0.7 mT modula-tion amplitude, and 4 mT/s sweep velocity (1 mT/s sweep velocityfor inserts). From [88] with permission
Fig. 8 Comparison between Fe*EDTA and transferrin*CO3 at285 GHz. Spectra under same conditions as Fig. 7 at 10 K. 2 mMtransferrin obtained from Sigma and treated as described in [34].From [75, 76]
242

Figure 5 also shows the energy level diagrams of theKramers doublets, where ! corresponds to the value ofhm at 245 GHz and indicates at which magnetic field thetransitions occur. With D around 10 cm)1 the transi-tions still occur associated with the lowest Kramersdoublet at 245 GHz. More than 70 T and correspondinghigher hm would be needed for transitions under theearlier described high-field approximation condition (2),in agreement with previous simulations discussed in [34].It is of interest to be able to measure in an intermediatefrequency range because, on the one hand, the shift ofthe geff value from its limiting value gives an estimationof the D value. On the other hand, when dealing withnon-oriented samples the signal associated to this geffvalue is still enhanced like a forbidden transition, that is,the transitions associated with different orientations fallat the same field position.
The Fe(II)-EDTA-NO complex has been a very use-ful model as it provides an S=3/2 EPR signal which hasbeen used in elegant isotopic labeling studies by Lips-comb and co-workers to show that binding of substrateto Fe occurs in several enzymes [80, 81, 82, 83]. In Fig. 6the same geff shift technique is used for the S=3/2system Fe(II)-EDTA-NO complex at pH 5, and thecorresponding spectra simulated by complete matrixdiagonalization are shown in the inset in the upper right.The intense axial geff=4.03 and g=2.0 X-band EPRsignals derive from the ‘‘apparent’’ Ms=±1/2 Kramersdoublet of the S=3/2 in NO complexed to non-heme iron [80, 81, 82, 83, 84, 85, 86]. The signalcould either stem from a high-spin ferrous ion (S=2)antiferromagnetically coupled to the NO� radical,resulting in an S=3/2 ground state, from a high-spinferric ion (S=5/2) antiferromagnetically coupled to one-electron reduced NO) (S=1), from one-electron reducedNO) (S=0) and intermediate-spin ferric iron (S=3/2),or from three other possibilities [85]. As is shown inFig. 6 at 285 and 345 GHz, the main geff signal is shiftedin a manner similar to the mononuclear high-spin ferrichemes described above (Fig. 5). The small shift can bebest simulated (Fig. 6 inset, with complete matrix diag-onalization) with D=11.5 cm)1, E=0.1 cm)1, andg1=g2=g3=2.0, in agreement with Mossbauer [80, 82,84] and magnetic susceptibility studies [84, 85]. Thisresult clearly shows that the NO complex does not haveany weak antiferromagnetic coupling with Fe(II). Thus,the pH 5 Fe(II)-EDTA-NO complex is best described asa ferric NO) complex, probably with an S=1 NO verystrongly antiferromagnetically coupled to a high-spinFe(III) S=5/2 as discussed [85, 86].
These results illustrate the limitations of the single-pass technique, as it requires sample concentrationsmuch higher than normally available for biologicalsystems where signals are broad, either because of shortrelaxation times or because of strains in the sample.Nevertheless, the study of the frequency-dependent shiftof geff has proven to be very useful in determining Dvalues with precision. D values up to about 20 cm)1
could be determined using frequencies up to 575 GHz
and fields up to 12 T for axial systems with S=3/2 or 5/2. More generally, the D value will dictate the rightfrequency range for obtaining the spectra in the inter-mediate-field limit; therefore the availability of a verybroad frequency range can be extremely useful.
Obtaining the high-field limit EPR spectrumfor intermediate and small D values
For S>1/2 systems, particularly in the case of inter-mediate/small ZFS, EPR spectra of non-oriented sam-ples are difficult to analyze (Figs. 7, 8, 9). In order tosimplify the spectrum and to obtain parameters de-scribing the electronic structure with precision, it ishighly desirable to record the complete EPR spectrum inthe high-field limit. In this case, the mixing of the levelsbecomes negligible and only the so-called allowed tran-sitions are observed. Along the principal axes of theZFS, the general Hamiltonian (Eq. 1) is simplified to:
H � bgiBSi þ 3Di=2ð ÞS2i ð3Þ
where i denotes x, y, or z. B is applied along the i-axis andDi is the principal value of the D tensor along the i di-rection. The approximation that the g and D tensors arecollinear is assumed. It is clear from this equation that foreach principal direction i, equally spaced lines areexpected with a spacing of 3Di=2D. For instance, in thesimple purely axial and purely rhombic cases, the EPRsignals form a symmetric pattern centered at the real gvalue, at the infinite temperature limit. This pattern de-pends on D and E. In the simplest cases for S=5/2, with|E/D|=1/3, the two outermost signals are +|4D| and)|4D| distant from the g=2.00 center, whereas two othersignals are found at +|2D| and )|2D|. When E=0, ad-ditional peaks at a distance±|D| are present, as describedfor high-spin Mn(II) by Freed and co-workers [87].
Another important property of HF-EPR to consider isthe large polarization effect observed at liquid heliumtemperature. For a frequency m, one can define a polar-ization temperature Tm=hm/kB, where kB is the Boltz-mann constant. At 285 GHz, T285�15 K, which meansthat at 4.2 K only the lowest energy level of the S multi-plet is thermally populated. This simplifies the spectrum,as mostly one transition (the m=)S fi m=)S+1)will be visible for each principal direction, situated atthe extremes of the spectrum. By increasing the tem-perature, higher energy states become populated andthe more intense signals move towards the center of thespectrum.
An example of this limiting case is shown in Fig. 7 foran S=5/2 system, a 100 mM Fe(III)-EDTA complex.Note the different scales in the two energy level diagramsin Figs. 5 and 7, clearly showing that, with a D valuearound 0.8 cm)1, only 5 or 6 T are needed to be underthe high-field approximation condition compared tomore than 70 T for D�10 cm)1. The ratio of thesignal intensities at different temperatures reflects theirBoltzmann populations together with the transition
243

probability. The signal around 7 T (at )|4D|) is from thelowest level for the z principal axis, the one at 10 Tcorresponds to the lowest level for the y direction,whereas the signal associated with the x direction shouldbe at 13 T, out of the field range of the magnet. With anincrease of the temperature, the signal at 8.5 T(at )|2D|), arising from the m=)3/2Mm=)1/2 transi-tion for the z direction, increases. Simultaneously,the relative size of the signal at �7 T decreases. When|E/D|<1/3 and in the low-temperature regime, theobservation of the signals associated with the z principalaxis at low field with respect to the center of spectrumindicates that D is negative, whereas they are found athigh field when D>0. In the case of a completelyrhombic system, the sign of D has no meaning (thiscorresponds to Dx=)Dz and Dy=0 or to Dy=)Dz andDx=0, depending on the sign of E/D). Already for theFe(III)-EDTA complex (D=0.8 cm)1), it is obvious thatthe signals associated with the z direction are very broad,probably because of a D strain in the sample. However,the use of 230 GHz frequency instead of 285 GHzallows both the 2D and 4D signals on the high-field sideto be clearly observed (data not shown), while only the+|2D| signal just below 12 T can be observed in Fig. 8at 285 GHz. To observe +|2D| and +|4D| signals in-stead of lowering the frequency to 230 GHz, one canchoose a complex with a lower D value, e.g. the proteintransferrin [34], for which sufficiently high protein con-centration can be obtained to observe the +|2D| tran-sition (Fig. 8). The Fe(III)-EDTA spectrum at 10 K(Figs. 7 and 8) displays signals at 6.8, 8.5, 10.2 T, whichcorrespond to greal)|4D|, greal)|2D|, and greal, res-pectively. Thus directly from one HF-EPR spectrumone can read greal=2.00 and one can calculate|D|=0.5(10.2)8.5)=0.25(10.2)6.8)=0.85 T, correspon-ding to 0.8 cm)1. As Fe(III)-EDTA shows a strongsignal at geff=4.3 and a smaller signal at geff=9.67 atX-band (data not shown), the rhombicity |E/D| is givenas 1/3 and the sign of D has no meaning (see above). Byanalogy, we find greal=2.00 from the 10.2 T signal oftransferrin (Fig. 8) and |D|=0.5(10.2)9.6)=0.25(10.2)9.0)=0.30 T, corresponding to 0.27 cm)1. The signals oftransferrin at X-band show a small deviation fromcomplete rhombicity and E/D was determined with thehelp of rhombograms to give |E/D|=0.29. As this is anearly rhombic system displaying signals associated withthe z-direction at a field lower than the center of thesignal, let us take D=0.27 cm)1 for transferrin (seeabove). Thus, also in this case, directly with a singleHF-EPR spectrum it is possible to determine the D valuestraightforwardly (if one has concentrated enoughsamples).
Detection of X-band EPR-silent or weakly magneticinteracting states by HF-EPR
Paramagnetic centers may be EPR silent at X-band dueto hm being too small relative to the ZFS or to extensive
broadening of the EPR absorption. The latter mightcome about by a combination of having a D value in anintermediate range with large hyperfine couplings, bothrelated to the frequency, as in Mn(II) complexes, or byweak magnetic interactions (see below). In some cases,depending on the actual D or J values, these signalsmight be detected by HF-EPR to allow the determina-tion of the D values or the weak magnetic couplingJ values, respectively. For instance, the Mn(II)-EDTAcomplex is nearly EPR silent at X-band while it can beobserved with Q-band EPR [88]. The use of HF-EPR isshown here for the NMR contrast agent for liver,Teslascan [Mn-DPDP; manganese(II)-N,N’-dipyridox-ylethylenediamine-N,N’-diacetate-5,5’-bis(phosphate)],that is practically EPR silent at X-band EPR, but dis-plays signals at 230 GHz and 15 K that are consistentwith S=5/2 EPR spectra at the high-field limit. Theposition of the )|4D|, )|2D|, and )|D| transitions couldbe simulated with the use of SimFonia from Bruker forhigh-spin Mn(II) using D=0.16±0.01 cm)1, |E/D|=0,and an isotropic g tensor at 2.00 [88] (Fig. 9). Thesefindings with Mn(II) are in agreement with several otherMn(II) S=5/2 complexes reported previously by Freedand co-workers [87, 89]. In the case of biological samplesin which the D strain is expected to be even larger, onlyvery concentrated solutions will give usable HF-EPRspectra. Several other HF-EPR studies have been doneon Mn(II) sites [90, 91, 92].
HF-EPR can detect so-called X-band EPR-silentmagnetic states owing to the larger energy of the pho-tons, as shown for Mn(III) for the first time by Barraet al. [6], and in heme-like tetrapyrrole structures [93].As an example, the 8,12-diethyl-2,3,7,13,17,18-hexam-ethylcorrolato-manganese(III) complex (S=2) studiedby the Tallahassee group (Fig. 10) is EPR silent atX-band, since hm is too small, but HF-EPR can be usedto determine the D value directly [94]. These 4.2 Kspectra obtained at 98 and 278 GHz can be simulated(dotted lines) with S=2, D=)2.78(1) cm)1,E=0.030(5) cm)1, g||=2.00(1), and g^=2.02(1), and theassignments of the transitions are indicated in Fig. 10.Other examples of integer-spin EPR have been discussedpreviously by Hagen [12] and the HF-EPR spectra of amodel compound for ferrous rubredoxin (S=2) havebeen reported [95]. The ferrous iron was observed withgx=gy=2.08 and gz=2.00, D=+5.84 cm)1, andE=+1.42 cm)1. We have, for instance, tried to detectsimilar HF-EPR signals in S=2 systems from 10 mMferrous myoglobin, 15 mM ferrous bleomycin, and50 mM ferrous EDTA complex, as well as S=4 systemsfrom diferrous methane monooxygenase. Unfort-unately, the sensitivity was too low to obtain anyreasonable spectra in the 95–575 GHz region. Poten-tially, integer-spin HF-EPR spectroscopy will be veryuseful.
The HF-EPR method has been used as a powerfultool to determine weak magnetic interactions between aflavin mononucleotide radical and an iron-sulfur[Fe4S4]
+ cluster in the enzyme trimethylamine dehy-
244

drogenase [96]. According to the known 3D structure,the center-to-center distance is equal to 12 A and thenearest atoms of the two centers are separated by a 4 Agap. The frequency dependence of the EPR signal inthe range 9–340 GHz (Fig. 11) could be used with theHamiltonian:
H ¼ bBgASA þ bBgBSB þ J0SASB þ JXSAXSBX
þ JYSAYSBY þ JZSAZSBZ ð4Þ(with the two paramagnetic centers with spins SA=SB=1/2, and corresponding tensors gA and gB, and anisotropic exchange J0SASB component as well as asymmetric anisotropic component with JX+JY+JZ=0)in advanced numerical spectral simulations to determinethe full set of parameters describing the magneticinteractions between the flavin mononucleotide radicaland the iron-sulfur cluster by Bertrand and collabora-tors [96]. In particular, their study demonstrates thatthe coupling is antiferromagnetic, with 0.72 cm)1
between the two centers and JX=)0.0576(5) cm)1,
Fig. 11 Effect of increasing frequency on decoupling of weakmagnetic interaction between a flavin radical and an iron-sulfurcluster. The high-field uncoupling of the magnetic interactionsbetween the flavin mononucleotide radical and the iron-sulfur[Fe4S4]
+ cluster in the enzyme trimethylamine dehydrogenase at5 K, with the following frequencies (GHz): a 34, b 74, c 95, d 245,e 350. The thin lines represent the best simulations with spinHamiltonian values given in Table 1 in Fournel et al. [96]. From[96] with permission
Fig. 10 HFEPR spectra at 4.2 K of 8,12-diethyl-2,3,7,13,17,18-hexamethylcorrolato-manganese(III) complex in neat pyridinefrozen solution. The spectra were normalized to approximatelyequal amplitude, and the phase was corrected by software toaccount for dispersive components. Instrumental settings: fieldsweep rate, 0.2 T/min; field modulation, 8 kHz frequency, 1.5 mTamplitude; time constant, 0.3 s; applied mW or sub-mW powerstrongly varied with frequency, except for reductions in the fieldsweep rate, and field modulation amplitude to 0.01 T/min and0.5 mT, respectively, in the g=2 spectral region. A Experiment at97.70 GHz. B Simulation using spin Hamiltonian parameters in thetext, with same program as in Fig. 6. Only x,y transitions in thepowder pattern are present at this frequency, with the exception ofthe partly allowed (DMs=2) transition. C Experiment at276.62 GHz. D Simulation using spin Hamiltonian parameters inthe text. The particular transitions in the quintet powder patternare identified and labeled accordingly. Since the spectrum showsobservable rhombicity of the ZFS tensor (E=0.03 cm)1), they useda labeling convention different from the solid spectra (x, y, and ztransitions rather than perpendicular and parallel). ‘‘TP’’ stands foran off-axis turning point. From [94] with permission
245

JY=)0.0154(5) cm)1, JZ=+0.0730(5) cm)1, and D=0.055 cm)1 and E=)0.011 cm)1 for the tripletHamiltonian. This elegant investigation also showedthat iron-sulfur proteins can be studied by HF-EPR.
Another interesting HF-EPR study of dipolar inter-actions between a Mn(II) center and the CuA in cyto-chrome c oxidase from Paracoccus dinitrificans showedan average distance between the centers to be 9.4 A, inagreement with the distance obtained from the X-raystructure [97]. We have studied Mn(II)-substitutedmouse RNR-R2 protein and compared it with thedinuclear site in arginase and catalase [63], but theseresults are unclear at present and reveal a complexHF-EPR spectral behavior.
Conclusions
We have attempted to illustrate the use of HF-EPR forthe study of a number of biological systems, with theapplications showing the range of effects of the highermagnetic field and the higher frequencies. However, theuse of single-pass spectrometers is limited by theirlow sensitivity. New technical developments such asquasi-optical set-ups should improve this aspect whilemaintaining the multifrequency character of the spec-trometer. On the other hand, using W-band witha cavity that has very high sensitivity for very smallsingle crystals or oriented samples, the angle-dependentspectra can be measured for advanced studies inphotosynthesis, in Mn proteins, and in copper proteins[98, 99, 100, 101, 102], showing other potential appli-cations of HF-EPR.
Acknowledgements High-field EPR measurements were carried outin the Grenoble High Magnetic Field Laboratory, CNRS-MPIF,supported by the EU TMR programme under contract no.ERBFMGECT950077 and the ‘‘Access to research infrastructureof the improving human potential programme’’. This work waspartly financed by the Norwegian Research Council (K.K.A.),the Norwegian Cancer Society (K.K.A.), the EU TMR programmeno. ERBMRFXCT980207 (K.K.A.), and ERBFMBICT 961892(P.P.S.), NIH grant DK31450 (E.I.S.), and NIH grant GM40392(E.I.S.), and the Swedish Research Council (A.G.). Prof. JohnD. Lipscomb (University of Minnesota) is thanked for providingsamples for measurements and interesting suggestions. Profs. Pa-trick Bertrand (CNRS, UPR 9036, Marseille) and Joshua Telser(Roosevelt University, Chicago) are thanked for the use of figuresand Høgni Weihe (University of Copenhagen) for the simulationprogram and Dr. Matthias Kolberg (University of Oslo) for finesuggestions. Prof. Britt-Marie Sjoberg (Stockholm University) isthanked for the use of the E. coli RNR-R2 samples in Fig. 2. Prof.Lawrence Que, Jr is thanked for constructive editing.
References
1. Barra AL, Brunel LC, Gatteschi D, Pardi L, Sessoli R (1998)Acc Chem Res 31:460–466
2. Brunel LC (1996) Appl Magn Reson 11:417–4233. Mobius K (1993) Appl Magn Reson 9:389–4074. Borbat PP, Costa-Filho AJ, Earle KA, Moscicki JK, Freed JH
(2001) Science 291:266–269
5. Barra AL, Caneschi A, Gatteschi D, Sessoli R (1995) J AmChem Soc 117:8855–8856
6. Barra AL, Gatteschi D, Sessoli R, Abbati GL, Cornia A,Fabretti AC, Uytterhoeven MG (1997) Angew Chem Int EdEngl 36:2329–2331
7. Levanon H, Mobius K (1997) Annu Rev Biophys BiomolStruct 26:495–540
8. Reijerse EJ, van Dam PJ, Klaassen AAK, Hagen WR, vanBentum PJM, Smith GM (1998) Appl Magn Reson 14:153–167
9. Tesler J, Pardi LA, Krzystek J, Brunel LC (1998) Inorg Chem37:5769–5775
10. van Dam PJ, Klaassen AAK, Reijerse EJ, Hagen WR (1998)J Magn Reson 130:140–144
11. Lubitz W, Feher G (1999) Appl Magn Reson 17:1–4812. Hagen WR (1999) Coord Chem Rev 192:209–22913. Krzystek J, Telser J, Pardi LA, Goldberg DP, Hoffman BM,
Brunel LC (1999) Inorg Chem 38:6121–612914. Bennati M, Farrar CT, Bryant JA, Inati SJ, Weis V, Gerfen
GJ, Riggs-Gelasco P, Stubbe J, Griffin RG (1999) J MagnReson 138:232–243
15. Barnes JP, Liang ZC, Mchaourab HS, Freed JH, Hubbell WL(1999) Biophys J 76:3298–3306
16. Barra AL, Brunel LC, Baumann F, Schwach M, MoscheroschM, Kaim W (1999) J Chem Soc Dalton Trans 3855–3857
17. Arieli D, Vaughan DEW, Strohmaier KG, Thomann H,Bernardo M, Goldfarb D (1999) Magn Reson Chem 37:S43–S54
18. Freed JH (2000) Annu Rev Phys Chem 51:655–68919. Bratt PJ, Poluektov OG, Thurnauer MC, Krzystek J, Brunel
LC, Schrier J, Hsiao YW, Zerner M, Angerhofer A (2000)J Phys Chem B 104:6973–6977
20. Mobius K (2000) Chem Soc Rev 29:129–13921. Barra AL, Gatteschi D, Sessoli R (2000) Chem Eur J 6:1608–
161422. DubocToia C, Hummel H, Bill E, Barra AL, Chouteau G,
Wieghardt K (2000) Angew Chem Int Ed Engl 39:2888–289023. Krzystek J, Telser J, Hoffman BM, Brunel LC, Licoccia S
(2001) J Am Chem Soc 123:7890–789724. Mossin S, Stefan M, ter Heerdt P, Bouwen A, Goovaerts E,
Weihe H (2001) Appl Magn Reson 21:587–59725. Gerfen GJ, Bellew BF, Un S, Bollinger JM, Stubbe J, Griffin
RG, Singel DJ (1993) J Am Chem Soc 115:6420–642126. Andersson KK, Graslund A (1995) Adv Inorg Chem 43:359–
40827. Sjoberg BM (1997) Struct Bonding 88:139–17328. Jordan A, Reichard P (1998) Annu Rev Chem 67:71–9829. Stubbe J, Ge J, Yee CS (2001) Trends Biochem Sci 26:93–9930. Eklund H, Uhlin U, Farnegardh M, Logan DT, Nordlund P
(2001) Prog Biophys Mol Biol 77:177–26831. Lawrence CC, Bennati M, Obias HY, Bar G, Griffin RG,
Stubbe J (1999) Proc Natl Acad Sci USA 96:8979–898432. Kolberg M, Bleifuss G, Potsch S, Graslund A, Lubitz W,
Lassmann G, Lendzian F (2000) J Am Chem Soc 122:9856–9857
33. Albert Y, Couder Y, Tuchendler J, Thome H (1973) BiochimBiophys Acta 322:34–37
34. Gaffney BJ, Silverstone HJ (1993) Biol Magn Reson 13:1–5535. Un S, Tang XS, Diner BA (1996) Biochemistry 35:679–68436. Bratt PJ, Rohrer M, Krzystek J, Evans MCW, Brunel LC,
Angerhofer A (1997) J Phys Chem 101:9686–968937. Calvo R, Isaacson RA, Paddock ML, Abresch EC, Okamura
MY, Maniero AL, Brunel LC, Feher G (2001) J Phys Chem105:4053–4057
38. Lakshmi KV, Reifler MJ, Brudvig GW, Poluektov OG,Wagner AM, Thurnauer MC (2000) J Phys Chem B104:10445–10448
39. Un S, Dorlet P, Rutherford AW (2001) Appl Magn Reson21:341–361
40. Smith GM, Riedi PC (2000) In: Atherton NM, Davies MJ,Gilbert BC (eds) Electron paramagnetic resonance, vol 17.Royal Society of Chemistry, Cambridge, pp 164–197
246

41. Muller F, Hopkins MA, Coron N, Grynberg M, Brunel LC,Martinez G (1989) Rev Sci Instrum 60:3681–3684
42. Barra AL, Brunel LC, Robert JB (1990) Chem Phys Lett165:107–109
43. Manikandan P, Epel B, Goldfarb D (2001) Inorg Chem40:781–787
44. Allard P, Barra AL, Andersson KK, Schmidt PP, Atta M,Graslund A (1996) J Am Chem Soc 118:895–896
45. Un S, Atta M, Fontecave M, Rutherford AW (1995) J AmChem Soc 117:10713–10719
46. Ivancich A, Mattioli TA, Un S (1999) J Am Chem Soc121:5743–5753
47. Un S, Gerez C, Elleingand E, Fontecave M (2001) J Am ChemSoc 123:3048–3054
48. Schmidt PP, Andersson KK, Barra AL, Thelander L, Gra-slund A (1996) J Biol Chem 271:23615–23618
49. Schmidt PP, Schunemann V, Hanson MA, Katterle B,Gunnlaugsson PG, Barra AL, Sjoberg BM, Graslund A, So-lomon EI, Trautwein AX, Andersson KK (2003) J Am ChemSoc (in press)
50. Katterle B, Sahlin M, Schmidt PP, Potsch S, Logan DT,Graslund A, Sjoberg BM (1997) J Biol Chem 272:10414–10421
51. van Dam PJ, Willems JP, Schmidt PP, Potsch S, Barra AL,Hagen WR, Hoffman BM, Andersson KK, Graslund A (1998)J Am Chem Soc 120:5080–5088
52. Hanson MA, Schmidt PP, Strand KR, Graslund A, SolomonEI, Andersson KK (1999) J Am Chem Soc 121:6755–6756
53. Liu A, Potsch S, Davydov A, Barra AL, Rubin H, GraslundA (1998) Biochemistry 37:16369–16377
54. Chabes A, Domkin V, Larsson G, Liu AM, Graslund A,Wijmenga S, Thelander L (2000) Proc Natl Acad Sci USA97:2474–2479
55. Liu AM, Barra AL, Rubin H, Lu GZ, Graslund A (2000)J Am Chem Soc 122:1974–1978
56. Bar G, Bennati M, Nguyen HHT, Ge J, Stubbe J, Griffin RG(2001) J Am Chem Soc 123:3569–3576
57. Ivancich A, Dorlet P, Goodin DB, Sun U (2001) J Am ChemSoc 123:5050–5058
58. Bleifuss G, Kolberg M, Potsch S, Hofbauer W, Bittl R, LubitzW, Graslund A, Lassmann G, Lendzian F (2001) Biochem-istry 40:15362–15368
59. Burdi D, Sturgeon BE, Tong WH, Stubbe J, Hoffman BM(1996) J Am Chem Soc 118:281–282
60. Assarsson M, Andersson ME, Hogbom M, Persson BO,Sahlin M, Barra AL, Sjoberg BM, Nordlund P, Graslund A(2001) J Biol Chem 276:26852–26859
61. Solomon EI, Sundaram UM, Machonkin TE (1996) ChemRev 96:2563–2606
62. Sundaram UM, Zhang HH, Hedman B, Hodgson KO,Solomon EI (1997) J Am Chem Soc 117:12525–12540
63. Andersson KK, Barra AL (2002) Spectrochim Acta A58:1101–1112
64. Messerschmidt A, Ladenstein R, Huber R, Bolognesi M,Avigliano L, Petruzzelli R, Rossi A, Finazziagro A (1992)J Mol Biol 224:179–205
65. van Gastel M, Canters GW, Krupka H, Messerschmidt A,de Waal EC, Warmerdam GCM, Groenen EJJ (2001) J AmChem Soc 122:2322–2328
66. Berthold T, Bechtold M, Heinen U, Link G, Poluektov O,Utschig L, Tang J, Thurnauer MC, Kothe G (1999) J PhysChem B 103:10733–10736
67. Slutter CE, Gromov I, Epel B, Pecht I, Richards JH, GoldfarbD (2001) J Am Chem Soc 123:5325–5336
68. Link G, Berthold T, Bechtold M, Weidner JU, Ohmes E,Tang J, Poluektov O, Utschig L, Schlesselman SL, ThurnauerMC, Kothe G (2001) J Am Chem Soc 123:4211–4222
69. van Kan PJM, van der Horst E, Reijerse EJ, van BentumPJM, Hagen WR (1998) J Chem Soc Faraday Trans 94:2975–2978
70. Fann YC, Ong JL, Nocek JM, Hoffman BM (1995) J AmChem Soc 117:6109–6116
71. Slappendel S, Veldink GA, Vliegenthart JFG, Aasa R, Mal-mstrom BG (1980) Biochim Biophys Acta 624:30–39
72. Hagen WR (1992) Adv Inorg Chem 38:165–22173. Glerup J, Weihe H (1991) Acta Chem Scand 45:444–44874. Jacobsen CJH, Perdersen E, Villadsen J, Weihe H (1993)
Inorg Chem 32:1216–122175. Andersson KK, Barra AL (2001) J Inorg Biochem 86:12476. Schmidt PP, Martinez A, Barra AL, Flatmark T, Andersson
KK (1999) J Inorg Biochem 74:28977. Pardi LA, Krzystek J, Telser J, Brunel LC (2000) J Magn
Reson 146:375–37878. Barra AL, Andersson KK (2002) In: Grenoble High Magnetic
Field Laboratory Annual Report 2001 (http://ghmfl.polycnrs-gre.fr/totalescience.htm), p 73
79. Barra AL, Graslund A, Andersson KK (2003) Biol MagnReson (in press)
80. Arciero DM, Lipscomb JD, Huynh BH, Kent TA, Munck E(1983) J Biol Chem 24:14981–14991
81. Arciero DM, Lipscomb JD (1986) J Biol Chem 261:2170–217882. Orville AM, Chen VJ, Kriauciunas A, Harpel MR, Fox BG,
Munck E, Lipscomb JD (1992) Biochemistry 31:4602–461283. Orville AM, Lipscomb JD (1993) J Biol Chem 268:8596–860784. Hauser C, Glaser T, Bill E, Weyhermuller T, Wieghardt K
(2000) J Am Chem Soc 122:4352–436585. Westcott BL, Enemark JH (1999) In: Solomon EI, Lever ABP
(eds) Inorganic electronic structure and spectroscopy, vol II.Wiley, New York, pp 403–450
86. Brown CA, Pavlosky MA, Westre TE, Zhang Y, Hedman B,Hodgson KO, Solomon EI (1995) J Am Chem Soc 117:715–732
87. Lynch WB, Boorse RS, Freed JH (1993) J Am Chem Soc115:10909–10915
88. Schmidt PP, Toft KG, Skotland T, Andersson KK (2002)J Biol Inorg Chem 7:225–240
89. Wood RM, Stucker DM, Jones LM, Lynch WB, Misra SK,Freed JH (1999) Inorg Chem 38:5384–5388
90. Bellew BF, Halkides CJ, Gerfen GJ, Griffin RG, Singel DJ(1996) Biochemistry 35:12186–12193
91. Policar C, Knupling M, Frapart YM, Un S (1998) J PhysChem 102:10391–10398
92. Un S, Dorlet P, Voyard G, Tabares LC, Cortez N (2001) J AmChem Soc 123:10123–10124
93. Goldberg DP, Telser J, Montalban AG, Brunel LC, BarrettAGM, Hoffman BM (1997) J Am Chem Soc 119:8722–8723
94. Krzystek J, Pardi LA, Brunel LC, Goldberg DP, HoffmanBM, Licoccia S, Telser J (2002) Spectrochim Acta A 58:1113–1127
95. Knapp MJ, Krzystek J, Brunel LC, Hendrickson DN (2000)Inorg Chem 39:281–288
96. Fournel A, Gambarelli S, Guigliarelli B, More C, Asso M,Chouteau G, Hille R, Bertrand P (1998) J Chem Phys24:10905–10913
97. Kass H, MacMillan F, Ludwig B, Prisner TF (2000) J PhysChem B 104:5362–5371
98. Hofbauer W, Zouni A, Bittl R, Kern J, Orth P, Lendzian F,Fromme P, Witt HT, Lubitz W (2001) Proc Natl Acad SciUSA 98:6623–6629
99. Calvo R, Abresch EC, Bittl R, Feher G, Hofbauer W,Isaacson RA, Lubitz W, Okamura MY, Paddock ML (2000)J Am Chem Soc 122:7327–7341
100. van Gastel M, Boulanger MJ, Canters GW, Huber M, Mur-phy MEP, Verbeet MP, Groenen EJJ (2001) J Phys Chem B105:2236–2243
101. Zech SG, Hofbauer W, Kamlowski A, Fromme P, Stehlik D,Lubitz W, Bittl R (2000) J Phys Chem B 104:9728–9739
102. Manikandan P, Carmieli R, Shane T, Kalb AJ, Goldfarb, D(2000) J Am Chem Soc 122:3488–3494
247