A comparison of species growth rates from four moist tropical forest regions using increment-size...
13
A comparison of species growth rates from four moist tropical forest regions using increment- size ordination D. ALDER , F. OAVIKA, M.SANCHEZ, J.N.M. SILVA, P. VAN DER HOUT and H.L.WRIGHT Published in International Forestry Review 4(3)196-205. This text is the author’s pre-publication draft version. SUMMARY Growth rates and typical size are compared for 204 species from permanent sample plots in Brazil, Costa Rica, Guyana and Papua New Guinea. Growth rates were expressed as mean dbh increment, and typical size as 95% point of cumulative diameter distribution (D 95 ). An ordination of species was analysed by a weighted cluster analysis method to form 16 species groups for the data from the 4 regions. Only trees 20 cm and above were included, and species with 50 or more sample trees. Results are tabulated for mean group increments, mortality rates and D 95 . Common species in each group and PSP locality are listed and their ecology discussed. Ecology and wood density are consistent between localities in their position on the increment-size graph. Mortality estimated by formula from the increment-size graph correlates with observed mortalities (R 2 69.9%), although there is systematic overestimation. The methodology presented may be useful for estimating probable growth rates from forest inventory data where PSP data is lacking, for purposes of simple stand projection. A website (www.myrlin.org ) provides worksheets, software and further documentation. INTRODUCTION Certification of forest management to internationally accepted standards, such as those of the Forestry Stewardship Council (FSC), is increasingly being seen as a necessary requirement in the forestry sector in the tropics (eg. Focus on Finance, 2002). This implies that the forest manager must among other things undertake growth projections for the forest in question in order to demonstrate that harvesting is sustainable in the long run (FSC, 2001, §5.6). Although growth projection models can vary greatly in complexity, at a minimum they require estimates of diameter increment and mortality by species in order to make simple stand projections over a number of felling cycles (Alder, 2002). The problem facing the forest manager in many localities in the tropics is that they have no locally available growth data with which to prepare such a simple model, and no standard to indicate how reliably they may borrow data from elsewhere (Wright, 2000). To address this issue, a study has been undertaken of growth rates and species group patterns from Brazil, Costa Rica, Guyana and Papua New Guinea, which combined with a simple stand projection model, is designed to assist in planning sustainable forest management in natural tropical forest. The objectives and directions of this study were summarised in Wright & Alder (2000). A website detailing the methodology and providing a user’s guide and download point for the projection model can be found at http://www.myrlin.org (Alder et al, 2002). The present paper reports some findings from this study concerning the typical growth and mortality rates and species groupings for the data from these four countries. It is also reviews the relationship between these species groups and their ecological attributes. SOURCES OF DATA 1 Alder et al (2002) Revised 17-Oct-02 # 11 The data used in this study derive from four sets of PSPs located respectively in the northern zone of Costa Rica, in the eastern Amazon region of Brazil, in central Guyana, and in the lowland forests of Papua New Guinea. Table 1 summarises some comparative statistics regarding the plot designs. The BR1, BR2 and BR3 plots are located in eastern Amazonia (Pará state) and are managed by EMBRAPA, the federal Brazilian agricultural and forestry research agency. At Tapajos, there are two sites known as km-67 and km-114 respectively. The km-67 plots are described and analysed in some detail in Silva (1989), and with the inclusion of more recent growth data, in Silva et al (1995). Some preliminary results from the km-114 plots are further discussed in Silva et al (1996). Alder (1995) gives some results relating to a growth model based on the BR1 and BR2 plots, whilst Alder & Silva (2000) describe a more evolved version of this model and a comparison of its projections with
Transcript of A comparison of species growth rates from four moist tropical forest regions using increment-size...

A comparison of species growth rates from four moist tropical forest regions using increment-size ordination
D. ALDER , F. OAVIKA, M.SANCHEZ, J.N.M. SILVA, P. VAN DER HOUT and H.L.WRIGHT
Published in International Forestry Review 4(3)196-205. This text is the author’s pre-publication draft version.
SUMMARY Growth rates and typical size are compared for 204 species from permanent sample plots in
Brazil, Costa Rica, Guyana and Papua New Guinea. Growth rates were expressed as mean dbh increment, and typical size as 95% point of cumulative diameter distribution (D95). An ordination of species was analysed by a weighted cluster analysis method to form 16 species groups for the data from the 4 regions. Only trees 20 cm and above were included, and species with 50 or more sample trees. Results are tabulated for mean group increments, mortality rates and D95. Common species in each group and PSP locality are listed and their ecology discussed. Ecology and wood density are consistent between localities in their position on the increment-size graph. Mortality estimated by formula from the increment-size graph correlates with observed mortalities (R2 69.9%), although there is systematic overestimation. The methodology presented may be useful for estimating probable growth rates from forest inventory data where PSP data is lacking, for purposes of simple stand projection. A website (www.myrlin.org) provides worksheets, software and further documentation.
INTRODUCTION Certification of forest management to internationally accepted standards, such as those of the
Forestry Stewardship Council (FSC), is increasingly being seen as a necessary requirement in the forestry sector in the tropics (eg. Focus on Finance, 2002). This implies that the forest manager must among other things undertake growth projections for the forest in question in order to demonstrate that harvesting is sustainable in the long run (FSC, 2001, §5.6). Although growth projection models can vary greatly in complexity, at a minimum they require estimates of diameter increment and mortality by species in order to make simple stand projections over a number of felling cycles (Alder, 2002). The problem facing the forest manager in many localities in the tropics is that they have no locally available growth data with which to prepare such a simple model, and no standard to indicate how reliably they may borrow data from elsewhere (Wright, 2000).
To address this issue, a study has been undertaken of growth rates and species group patterns from Brazil, Costa Rica, Guyana and Papua New Guinea, which combined with a simple stand projection model, is designed to assist in planning sustainable forest management in natural tropical forest. The objectives and directions of this study were summarised in Wright & Alder (2000). A website detailing the methodology and providing a user’s guide and download point for the projection model can be found at http://www.myrlin.org (Alder et al, 2002). The present paper reports some findings from this study concerning the typical growth and mortality rates and species groupings for the data from these four countries. It is also reviews the relationship between these species groups and their ecological attributes.
SOURCES OF DATA
1Alde
r et a
l (20
02)
Rev
ised
17-
Oct
-02
# 1
1
The data used in this study derive from four sets of PSPs located respectively in the northern zone of Costa Rica, in the eastern Amazon region of Brazil, in central Guyana, and in the lowland forests of Papua New Guinea. Table 1 summarises some comparative statistics regarding the plot designs. The BR1, BR2 and BR3 plots are located in eastern Amazonia (Pará state) and are managed by EMBRAPA, the federal Brazilian agricultural and forestry research agency. At Tapajos, there are two sites known as km-67 and km-114 respectively. The km-67 plots are described and analysed in some detail in Silva (1989), and with the inclusion of more recent growth data, in Silva et al (1995). Some preliminary results from the km-114 plots are further discussed in Silva et al (1996). Alder (1995) gives some results relating to a growth model based on the BR1 and BR2 plots, whilst Alder & Silva (2000) describe a more evolved version of this model and a comparison of its projections with

actual growth data over 17 years. As Table 1 indicates, all the BR1 and BR2 plots are of ¼-ha design, with all trees down to 5 cm dbh measured. The BR3 plots at Jari employ a 1-ha square design, with measurement to 20 cm dbh on the whole plot, and a 10% sub-sample to 5 cm dbh using randomly selected quadrats. In total there are 136 PSPs covering 64 ha of natural forest, with 52,320 trees from 224 genera sampled for increment and mortality rates.
In Costa Rica, five groups of PSPs contributed to the present study. Features of the CODEFORSA and Portico plots (CR1-3) have been described in Alder (1997) in the context of the development of the SIRENA growth model. The CR1 and CR2 plots were established by CODEFORSA from 1991 onwards, and comprise 1-ha (100 x 100 m) and ¼-ha (50 x 50 m) designs respectively, both measured down to 10-cm minimum dbh according to standards specified by Synnott (1979). Plot locations, and floristic descriptions are given in Zamora (1997). These were passive monitoring plots, established in selection-managed forests characterised by the predominance of Pentaclethra macroloba and with Vochysia ferruginea commonly occurring. They are similar to the La Tirimbina plots described in detail by Finegan & Camacho (1999). The CR3 plots were established by Portico SA as experimental plots, and include controls and two or three levels of silvicultural treatment. These plots occur in forests dominated by Carapa guianensis, with Pentaclethra macroloba remaining a common stand component and Vochysia ferruginea rare or absent. The CR4 plots were established by ITCR and are 70 m square plots (0.49 ha), but otherwise of similar measurement standard and occurring in the same forest types as CR1 and CR2. The CR5 plots were 20 x 25 m plots (0.05 ha) established to monitor regrowth in abandoned pastures. They are described in detail in Fedlmeier (1996).
The Papua New Guinea PSP locations and measurement standards are described by Oavika (1999), and the data processing systems by Yosi (1999), both in Gideon & Oavika (1999). Alder et al (1998) also describes the plots in some detail. Briefly, these plots were established under an ITTO project in 1992, and re-measured between 2 and 3 times biannually up until 1998. One or two older Forest Research Institute plots were also adopted by the project, giving a total measurement span from 1990-1998. There were 72 plots established, all of 1-ha square design, measured for all species down to 10 cm dbh, of which 70 were re-measured. With two exceptions, the plots were in lowland tropical forests, placed in pairs at randomly selected locations in strata throughout PNG. Two plots were located in sub-montane forest. All plots were established immediately after logging, with a view to monitoring forest recovery. The data from the plots has been analysed in several reports, including Alder (1998a, 1998b) and Alder et al. (1998), and used to develop a growth model for lowland tropical forests in PNG called PINFORM.
The Guyana data comprise two sets of plot dispositions. The Tropenbos plots have been described by van der Hout (1999, 2000) and briefly in Zagt (1997). They comprise plots of 140 x 140 m (1.96ha) arranged in a randomised block experiment at Pibiri in central Guyana. All species down to 20 cm were measured on the main plots, with smaller trees down to 5 cm being sub-sampled. The 1-ha Barama plots were established and managed by the Edinburgh Centre for Tropical Forestry (ECTF) under contract; details have not hitherto been published, but the plot designs and results from analysis of trees down to 20 cm are described in Alder (2000).
All the PSPs in these four regional data sets came from lowland moist tropical forest. The large majority of the plots were logged either before first measurement, or during the course of their measurement period. Only a small number of the plots from the BR2 and BR3, and the GY1 plots were from unlogged ‘virgin’ forest. Because of the irregularities of harvesting, the intensity of disturbance on the logged plots varied from a near total removal of overwood to an almost undisturbed state.
2Alde
r et a
l (20
02)
Rev
ised
17-
Oct
-02
# 1
1
This data was pooled into a common database, with the varying formats of the individual datasets transformed as necessary to a common basis. For each tree, the database includes its origin (origin code, as per Table 1, original plot and tree number), a standardised species code, flags to indicate whether the tree had indications of natural defect or logging damage, whether the tree appeared to be a recruit or to have died or been logged during the period, the first and last dates observed, and the initial and final diameters.

origin code
source plot size m2
no. of plots no. of trees years measured
no. of genera
BR1 EMBRAPA Tapajos km-67 2500 36 13946 1981-97 138
BR2 EMBRAPA Tapajos km-114 2500 60 24876 1981-95 152
BR3 EMBRAPA Jari 10000 40 13498 1984-94 172
CR1 CODEFORSA 1-ha 10000 9 4857 1991-98 227
CR2 CODEFORSA ¼-ha 2500 27 3963 1992-98 159
CR3 Portico SA 10000 17 8811 1989-96 125
CR4 ITCR/DFID Project 4900 41 9958 1994-97 178
CR5 COSAFORMA/GTZ Project 600 34 2712 1991-96 113
PG1 PNG/ITTO Project 10000 70 26549 1990-98 274
GY1 Tropenbos Guyana 19600 15 6018 1993-97 94
GY2 Barama Co. Ltd., Guyana 10000 62 17153 1993-99 84
Total 411 132341
Table 1 : Location and basic statistics for permanent sample plot dispositions used in the study.
PAN-TROPICAL SPECIES GROUPS Some system of species grouping may be regarded as essential in developing management
plans and growth projections for natural tropical forest. This is because there are too many species to be listed or modelled individually, with many less common species being represented by only a few individuals in any given sample. In practical forest management, grouping may be based on commercial or trade categories, but these alone are not very suitable for growth studies, because the economic classes do not correlate well with growth or ecological behaviour of species (Vanclay, 1994, p127). In growth and yield studies in the tropics various statistical methods have often been employed to form groups. For example, Vanclay (1991) used pairwise F-tests to group growth functions with non-significant differences. More commonly, cluster analysis in some form has been used based on diameter increment linked with some other parameters to achieve an ordination in at least two dimensions. The other parameters have included maximum diameter (Alder, 1995, p.165), mean diameter (Eba’a Atyi, 1997, 2000), height (Finegan et al (1999), increment at successive measurements (Atta-Boateng & Moser,1998), mortality, size and commercial status (Alder & Silva, 2000). Favrichon (1994) used diameter, diameter increment and recruitment rates. Purely statistical techniques are however less than ideal. There are subjective choices that must be made about the spatial scaling and weighting of points, and the possible clustering algorithm, that will influence results. The many rarer species represented by one or two observations reduce the effectiveness and functional clarity of the grouping. To avoid these problems, functional groups based on ecological characteristics have been used in some significant studies. Bossel et al (1994) classified species as understorey, treelets (sic), canopy trees, emergents and pioneers. Gourlet-Fleury & Houllier (2000) described Favrichon’s (1994) statistical classes in terms of similar ecological groups, but with shade tolerant and light demanding canopy trees also distinguished. In the functional category, we must also mention the Plant Functional Attributes (PFA) approach evaluated by Vanclay et al. (1997). These attributes are primarily morphological, and include leaf size, inclination, chlorotype, and habit, the general life form, and rooting habit.
3Alde
r et a
l (20
02)
Rev
ised
17-
Oct
-02
# 1
1
For the present study, the approach of Alder (1998a, 2000) was adopted. This involves an ordination of species mean increment (Id) on the 95% percentile of the diameter distribution (D95), with a cluster analysis based on Euclidean distance between points. After some trial and error, Id was scaled by a factor of 100 to calculate distance in the ordination space, with D95 being unscaled; this gives equal weight to the increment range of 0-1 cm yr-1 and diameter range of 0-100 cm). Groups were initiated by subjectively located seed points. The species closer to a given seed point then any other were added to that group as a provisional value. The centroid of the group was then calculated, weighted by the number of observations for each species. The process was then repeated, using the calculated centroids as new seed points, until species group allocations and group centroids

sahrtete
sciciPi
srkd
Alde
r et a
l (20
02)
Rev
ised
17-
Oct
-02
# 1
1
1aAFTte2t
0.0
0.2
0.4
0.6
0.8
1.0
1.2
1.4
1.6
20 40 60 80 100 120 140
95% percentile of diameter distribution (cm)
mea
n di
amet
er in
crem
ent (
cm/y
r)Brazil
Costa Rica
Guyana
Papua New Guinea
Figure 1 : Ordination of species increment and size for 204 species from PSPs in four countries.
All species shown are represented by at least 50 increment trees. The smallest tree size included was 20 cm dbh
tabilised. This typically took 5-6 iterations. The algorithm for this process was coded in Visual Basic, nd performed within Microsoft Excel. A copy of this program can be obtained at ttp://www.myrlin.org. The method is similar to that reported by Eba’a Atyi (1997, 2000), who gives elevant formulae. Pielou (1977, Ch. 20) also describes ordination methods and algorithms and was he basic text used in developing the method. The method is essentially the k-means algorithm mbodied in many statistical packages, but has the advantage that the scaling, weighting and seeding echniques (all of which influence the outcome of k-means clustering – see Hartigan, 1975) are more fficiently and transparently controlled.
The data used to calculate species mean increment and D95 was extracted from the database ummarised in Table 1. Only trees with initial diameters of 20 cm or above were used, to avoid any onfusion due to different lower measurement limits on some of the PSPs. Trees with doubtful ncrement measurements, or recorded as dead were not used to estimated Id, although they ontributed to the D95 estimate. For the ordination, only species with 50 or more observations were ncluded. This left a total of 204 species, comprising 61 from Brazil, 33 from Costa Rica, 48 from apua New Guinea, and 62 from Guyana. ‘Species’ in this context indicates the best available
dentification for a tree, which in some cases was to the generic level only.
The 95% percentile diameter was estimated for each species by sorting the available data from mallest to largest diameter, censored to include only trees above 20 cm. Then the method ecommended by NIST (2002, §7.2.5.2) was applied. The largest integer k is calculated such that ≤0.95N, and a decimal part d as 0.95N - k. If the ordered diameters are D1, D2…DN, then 95% iameter is given as Dk + d(Dk+1 - Dk).
4
The initial seed points were located after examining the data graphically, as shown in Figure . Four size categories were considered: 40, 60, 80 and 100 cm, and four increment levels, which were djusted at each size category to span the distribution of the data from slowest to fastest growing. fter application of the clustering algorithm this resulted in the groups and centroids shown in igure 2. The 16 groups were designated by the letters A-S, omitting I,O and Q for clarity on graphs. able 2 gives group statistics for number of species, number of trees, and centroid Id and D95. This
able also gives the weighted average annual mortality rate (AMR), as discussed below, and an stimate of typical age as the time of passage from 20 cm to D95, conventionally calculated as (D95-0)/Id. Table 3 gives the three most common species in each group from each regional data set. If here are less than three species in the sample data, only those available are listed.
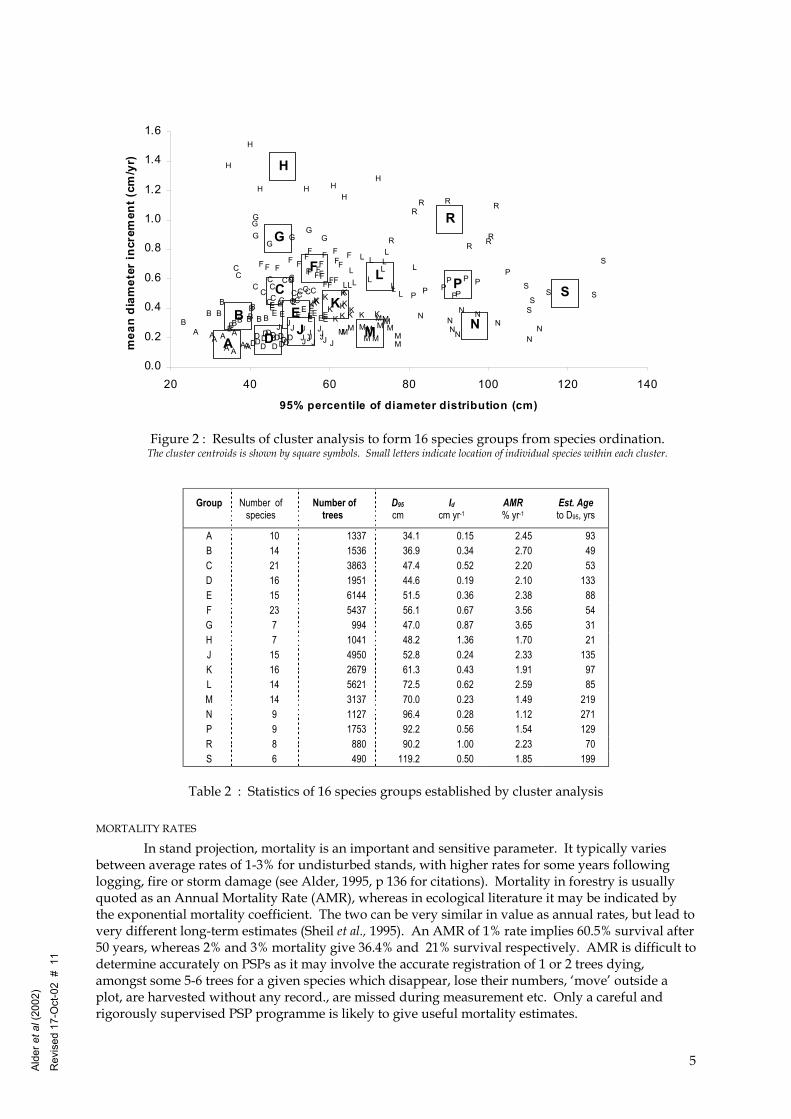
Group Number of species
Number of trees
D95 cm
Id cm yr-1
AMR % yr-1
Est. Age to D95, yrs
A 10 1337 34.1 0.15 2.45 93 B 14 1536 36.9 0.34 2.70 49 C 21 3863 47.4 0.52 2.20 53 D 16 1951 44.6 0.19 2.10 133 E 15 6144 51.5 0.36 2.38 88 F 23 5437 56.1 0.67 3.56 54 G 7 994 47.0 0.87 3.65 31 H 7 1041 48.2 1.36 1.70 21 J 15 4950 52.8 0.24 2.33 135 K 16 2679 61.3 0.43 1.91 97 L 14 5621 72.5 0.62 2.59 85 M 14 3137 70.0 0.23 1.49 219 N 9 1127 96.4 0.28 1.12 271 P 9 1753 92.2 0.56 1.54 129 R 8 880 90.2 1.00 2.23 70 S 6 490 119.2 0.50 1.85 199
S
R
P
NM
L
K
J
H
G
F
E
D
C
B
A
S
A
F
P
J
L
PP
G
S
DD
L
BB E
C
E
S
H
C
E
A A
G
B M
R
L
E
K K
G
DA
E N
D
P
D D NA
N
CL
F
A
BE
M
C
F
FC
C C
H
J
F
H
B
R
SB
F
C
J
L
K
M
K
C
N
A
C
A DJB
J
F
G
M
K
CK
C F
D
L
D
SB
MJJ M
P
E
F
D
E
H
F
B
H
JN
J
F
J
K
D
M N
G
K
L
A
CE
MMM
E
K
R
F
E
R
F
R
N
M
C
B
FF
R
CL
K
D
BK
LF
C
E
D D
K
D
L
B
F
H
P
LF
DJ
K
J
F
RR
K
N
G
M
SC
F
F
BB
P
N
P
J
C
F
KC
EL
G
M
E
M
H
A
C CK
J
F L
J
P
E
L
0.0
0.2
0.4
0.6
0.8
1.0
1.2
1.4
1.6
20 40 60 80 100 120 140
95% percentile of diameter distribution (cm)
mea
n di
amet
er in
crem
ent (
cm/y
r)
Figure 2 : Results of cluster analysis to form 16 species groups from species ordination. The cluster centroids is shown by square symbols. Small letters indicate location of individual species within each cluster.
Table 2 : Statistics of 16 species groups established by cluster analysis
MORTALITY RATES
5Alde
r et a
l (20
02)
Rev
ised
17-
Oct
-02
# 1
1
In stand projection, mortality is an important and sensitive parameter. It typically varies between average rates of 1-3% for undisturbed stands, with higher rates for some years following logging, fire or storm damage (see Alder, 1995, p 136 for citations). Mortality in forestry is usually quoted as an Annual Mortality Rate (AMR), whereas in ecological literature it may be indicated by the exponential mortality coefficient. The two can be very similar in value as annual rates, but lead to very different long-term estimates (Sheil et al., 1995). An AMR of 1% rate implies 60.5% survival after 50 years, whereas 2% and 3% mortality give 36.4% and 21% survival respectively. AMR is difficult to determine accurately on PSPs as it may involve the accurate registration of 1 or 2 trees dying, amongst some 5-6 trees for a given species which disappear, lose their numbers, ‘move’ outside a plot, are harvested without any record., are missed during measurement etc. Only a careful and rigorously supervised PSP programme is likely to give useful mortality estimates.

In the present study mortality was estimated for each species using the methods described in Alder (1995, p.137), excluding trees which had died directly as result of logging, silvicultural treatment, or had been harvested. Mortality rates for the groups were estimated as the weighted mean of the species mortalities, using number of trees observed for each species as the weighting parameter. Table 2 shows the AMR mean values estimated for each group.
The ordination of increment on 95% diameter provides for an alternative way of estimating mortality, based on some theoretical assumptions. If mortality rate and increment are assumed to be approximately constant for a species between 20 cm dbh and the D95 diameter, and the diameter distribution itself is assumed to represent an equilibrium distribution, then AMR can be estimated from Id and D95. By definition, the D95 size limit represents the point at which a cohort of trees has been reduced in numbers by 95% from its value at 20 cm dbh. This is because, given the assumptions of constant increment and mortality rates, one is dealing with an idealised exponential distributito D95, assuming uniform increment, wiand survival after a period t is:
S = (1 – AMR)t
then in this case, S= 0.05 (5% of the popwith a little algebra AMR is given by:
AMR = 1 – 0.05
Alde
r et a
l (20
02)
Rev
ised
17-
Oct
-02
# 1
1
Using this formula, an expectedand D95 value. This is shown graphicaabove on the y-axis, and the observed gfast growing trees) are omitted, the regr99% with 15 data points (13 d.f.). Howeestimating mortality: it consistently ovebe close to the 1:1 line on the graph). Thwhich the weakest is likely to be that cogiven that most of the PSPs in the studytypical pioneer species (Cecropia, Anthocwhich maximum size may not be fully eoriginal 20 cm cohort, but rather a highwould give consistency with the observ
G
BC F
R
LEAK
P D J
SMN
H
1:1
R2 = 0.699
0.01
0.03
0.05
0.07
0.09
0.11
0.13
0.01 0.02 0.03 0.04
Observed Annual Mortality
Ann
ual M
orta
lity
estim
ated
from
Id, D
95
Figure 3 : Mean mortality rates for species groups as observed and estimated from mean increment and 95%
diameter The regression excludes group H, which is treated as an outlier.
on (Meyer, 1952). The time it takes a tree to grow from 20 cm ll be (D95 - 20)/Id. Given that the general formula for AMR
{eq.1}
ulation surviving), and t = (D95 - 20)/Id as noted above. Thus,
Id /(D95–20) {eq.2}
6
AMR has been calculated for each group using its mean Id lly in Figure 3, with the expected value from equation {2} roup mean mortality on the x-axis. If group H (small, very ession has an R2 of 69.9%, which is significant at better than ver, the regression indicates a bias in this method of restimates by a factor of about 2 (an unbiased method would is bias is due to deviations in reality from the assumptions, of
ncerning the equilibrium nature of the diameter distribution, are more or less disturbed. The outlying H group contains ephalus), and its occurrence will indicate a young stand in xpressed. Thus the D95 value should represent not 5% of the
er survival fraction; around 25% survival to D95 for group H ed mortality rate.

The existence of a moderately close relationship (ie. an R2 of 69%) between theoretical mortality rates and the empirical values for species groups indicates that the grouping of species by ordination of Id on D95 also provides appropriate groups for mortality rate estimation. This is important as many species grouping studies do not consider this aspect, and simply assume that groups derived statistically or based on functional characteristics will be internally consistent for mortality rates, without demonstrating any direct evidence.
ECOLOGICAL CHARACTERISTICS The species groups shown on Figure 2 and exemplified by typical species in Table 3 seem to
be consistent with the broad functional groups proposed by Favrichon (1994) and Bossel et al (1994), among others. These include understorey trees, sub-canopy species, canopy light-demanding species (gap opportunists and long-lived pioneers), canopy shade tolerant species, emergents, and pioneer species. However, the increment-size diagram (Figures 2,3) gives an indication of the continuum of ecological strategies. The sixteen groups used in the present analysis map onto these broader groups in a generally clear and consistent way, as evidenced by the common species characteristic of each group in Table 3. This is shown visually in Figure 4.
The discussion which follows also includes basic species-specific wood density as a factor linked to the ecological category and related to growth rate. Enquist et al. (1999) discuss a theoretical model for this relationship, and present data from 29 Amazonian tree species indicating a correlation of –0.47 between growth rate and basic density. Data on tropical tree wood densities will be found in Richter & Dallwitz (2000), and for Brazilian species, Fearnside (1997), among other sources.
Low growth rates (2-3 mm yr-1), associated with the groups A, D, J, M, N are indicators of shade tolerance, and also result in higher wood densities. Average lower growth rates are a result of the species typically occurring in a lower canopy or understorey position. The larger diameter groups in this category (M, N) are likely to be very long lived; Table 2 gives age estimates of 220-270 years. These groups include some important timber trees known for their heavy, durable wood, such as Chlorocardium rodiei (Greenheart, Guyana) and Minquartia guianensis (Acariquara, Brazil).
Alde
r et a
l (20
02)
Rev
ised
17-
Oct
-02
# 1
1
Figure 4 : Species groups related to broader ecological categories Letters in circle are group centroids.
7
S
R
P
NM
L
K
J
H
G
F
E
D
C
B
A
0.00
0.20
0.40
0.60
0.80
1.00
1.20
1.40
1.60
20 40 60 80 100 120 140
95% percentile of diameter d istribution (cm)
mea
n di
amet
er in
crem
ent (
cm/y
r)

Table 3 : Most common species in species groups, by region Species group letter is shown at left. The three most common species are shown. If there are fewer than three species, only
those are shown. Some groups are not represented in some regions, so no species are shown.
Brazil Costa Rica Guyana Papua New Guinea
A Rinorea guianensis (Viol.) Maytenus floribunda (Celastr.) Anaxagorea dolichocarpa (Annon.)
Licania canescens (Chrysobalan.) Chaetocarpus schomburgkianus (Euphorbi.) Guatteria (Annon.)
B Protium apiculatum (Burser.) Drypetes variabilis (Euphorbi.) Protium opacum (Burser.)
Dendropanax arboreus (Icacin.) Protium spp (Burser.) Simira maxoni (Rubi.)
Mabea sp (Euphorbi.) Tovomita (Guttifer.) Inga spp (Mimos.)
Myristica (Myristic.)
C Pentaclethra macroloba (Mimos.) Ocotea spp (Laur.) Clathrotropis (Papilion.)
Canarium (Burser.) Cryptocarya (Laur.) Planchonella (Sapot.)
D Protium sagatianum (Burser.) Dendrobangia boliviana (Icacin.) Eschweilera blanchetiana (Lecythid.)
Brosimum guianensis (Mor.) Grias cauliflora (Lecythid.)
Catostemma fragrans (Bomb.) Licania alba (Chrysobalan.) Vouacapoua macropetala (Caesalpini.)
E Guatteria poeppigiana (Annon.) Virola sebifera (Myristic.) Eschweilera spp (Lecythid.) Licania heteromorpha (Chrysobalan.) Pouteria guianensis (Sapot.)
Pimeleodendron amboinicum (Euphorbi.) Horsfieldia (Myristic.) Vatica rassak (Dipterocarp.)
F Jacaranda copaia (Caric.) Tapirira guianensis (Anacardi.)
Pourouma bicolor (Cecropi.) Couma macrocarpa (Apocyn.) Cordia alliodora (Boragin.)
Alexa sp. (Fab.) Protium decandrum (Burser.) Inga rubiginosa (Mimos.)
Calophyllum (Clusi.) Litsea (Laur.) Terminalia spp (Combret.)
G Inga spp (Mimos.) Bixa arborea (Bix.) Porouma longipendula (Mor.)
Hampea appendiculata (Malv.) Goethalsia meiantha (Tili.)
Tapirira marchandii (Anacardi.) Byrsonima spicata (Malpighi.)
H Cecropia sciadophylla (Mor.) Cecropia leucoma (Mor.)
Qualea paraensis (Vochysi.) Cecropia angulata (Mor.) Pterocarpus officinalis (Papilion.)
Elaeocarpus (Elaeocarp.) Anthocephalus chinensis (Rubi.)
J Geissospermum sericeum (Apocyn.) Eschweilera jurunensis (Lecythid.) Eschweilera amazonica (Lecythid.)
Licania affinis (Chrysobalan.) Licania guianensis (Chrysobalan.) Lecythis confertiflora (Lecythid.) Swartzia leiocalycina (Caesalpini.)
Diospyros spp (Eben.)
K Carapa guianensis (Meli.) Virola michelli (Myristic.) Ocotea douradensis (Laur.)
Elaeoluma glabrescens (Sapot.) Tetragastris paname (Burser.) Otoba novogranatensis (Myristic.)
Carapa guianensis (Meli.) Ecclinusa guianensis (Sapot.) Apeiba echinata (Tili.)
Syzygium (Myrt.) Dysoxylum (Meli.) Garcinia (Clusi.)
L Sclerolobium tinctorium (Caesalpini.) Pentaclethra macroloba (Mimos.) Hernandia didymantha (Hernandi.) Virola koschnyi (Myristic.)
Catostemma commune (Bomb.) Sterculia pruriens (Sterculi.) Pouteria sp (Sapot.)
Pometia pinnata (Sapind.) Pterocarpus indicus (Fab.) Homalium sp (Flacourti.)
M Pouteria sp (Sapot.) Minquartia guianensis (Olac.) Corytophora rimosa (Lecythid.)
Pouteria sp (Sapot.) Brosimum lactescens (Mor.) Guarea sp (Meli.)
Chlorocardium rodiei (Laur.) Mora gongrijpii (Caesalpini.) Eschweilera coriacea (Lecythid.)
N Manilkara huberi (Sapot.) Goupia glabra (Celastr.) Couratari oblongifolia (Rubi.)
P Endopleura uchi (Humiri.) Carapa guianensis (Meli.) Dialium guianense (Caesalpini.) Apeiba membranacea (Tili.)
Aspidosperma cruentum (Apocyn.) Parinari campestris (Chrysobalan.) Pithecelobium jupunba (Mimos.)
Ficus sp (Mor.)
R Sclerolobium chrysophyllum (Caesalpini.) Tachigalia myrmecophylla (Caesalpini.)
Vochysia allenii (Vochysi.) Vochysia ferruginea (Vochysi.)
Goupia glabra (Celastr.) Vitex (Verben.) Euodia (Rut.) Alstonia (Apocyn.)
S Aspidosperma desmanthum (Apocyn.) Pterocarpus officinalis (Papilion.) Dipteryx panamensis (Papilion.)
Manilkara bidentada (Sapot.) Peltogyne (Caesalpini.) Swartzia jenmanii (Caesalpini.)
8Alde
r et a
l (20
02)
Rev
ised
17-
Oct
-02
# 1
1

The groups B, E, K, P and S, in increasing order of typical size (D95) show somewhat higher growth rates, in the range 3-5 mm yr-1. The larger K, P and S groups have typically mid-range wood densities and durability, and include important utility timbers such as Carapa guianensis (Andiroba, Crabwood, Royal Mahogany). These species appear to be still relatively shade tolerant. The S group comprises the large canopy emergents of the climax forest, many of which are important timber trees (eg.. Dipteryx panamensis, Pterocarpus officinalis, Aspidosperma desmanthum, Manilkara bidentata).
The C, F, L, and R groups, with increments in the range 5-10 mm yr-1, appear to be light demanding species with lower density timbers. The C and F groups include smaller trees of the lower canopy. Jacaranda copaia, for example, is a common member of this group from the Brazilian data, and is characteristic of disturbed forest after logging. It is also a significant timber tree, in spite of its relatively small size. In Costa Rica, Cordia alliodora occurs in group F, and is also a typical secondary forest species of medium size and significance as a timber tree (Francis & Lowe, 2000). Groups L and R include important fast-growing, large, long lived trees. Vochysia ferruginea for example is noted by Finegan et al. (1999) to be strongly light demanding; Goupia glabra is similarly described by Rose (2000). In the L group from Papua New Guinea are the important timber trees Pometia pinnata and Pterocarpus indicus. In Guyana, the L group includes the Catostemma commune (Baromalli). In Costa Rica, the ubiquitous and dominant species of the northern lowland forests, Pentaclethra macroloba (Gavilan) is in this group.
The G and H groups are trees of fast growth rate (10-20 mm yr-1), relatively short life spans (20-50 years), low density timber, of strongly pioneer characteristics, occurring after heavy disturbance. The common species noted in table 3 include Cecropia species and Anthocephalus chinensis. Other rarer species, not shown in the table, include Acacia mangium (Papua New Guinea) and Ochroma lagopus (Balsa, Costa Rica). Qualea paraensis is described by Weissenhofer (1996) as a long-lived pioneer, but occurs in this group as a fast-growing tree with mean increment of 1.27 cm yr-1 and D95 of 74.5 cm. This places it to the extreme right of the H cluster (Figure 2) and adjacent to the R group, to which it should more properly belong.
Some widely distributed species occur in different groups in different regions. For example, Pterocarpus officinalis occurs in group H in Guyana (Id 1.1 cm yr-1, D95 63.5 cm, 65 trees sampled) which would suggest a fast-growing pioneer, whilst it is seen in group S in Costa Rica (Id 0.49 cm yr-1, D95 126.6 cm, 192 trees sampled). Carapa guianensis occurs in group K in Brazil (Id 0.424 cm yr-1, D95 63.8 cm, 239 trees sampled), and in group P in Costa Rica (Id 0.593 cm yr-1, D95 94.2 cm, 730 trees sampled). Pentaclethra macroloba occurs in Guyana in group C (Id 0.20 cm yr-1, D95 33.1 cm, 72 trees sampled), and in Costa Rica, where it is a very common species, in group L (Id 0.66 cm yr-1, D95 73.5 cm, 2568 trees sampled). In some cases species identified only to the generic level occur in different groups, but little can be said about this, as they may well represent different species in the different localities.
These different classifications are unlikely to be due to sampling effects alone, although this would be a factor if small numbers of trees were involved. In all cases, these are relatively common, ubiquitous trees. The most likely explanation is a combination of genetic drift, leading to subtle changes in species ecology and growth patterns across a wide distribution, and site differences which favour the growth of a species in one locale and reduce it in another. Further research on the behaviour of these common species across their range is needed to fully explore these issues.
DISCUSSION AND CONCLUSIONS
9Alde
r et a
l (20
02)
Rev
ised
17-
Oct
-02
# 1
1
Ordination of permanent sample plot data from four distinct tropical regions on mean increment and typical size shows consistent patterns and clusters of species that coincide with the major functional groups: understorey trees, mid-, upper-canopy and emergent shade tolerant species, short and long-lived pioneers, medium and large light demanding species. These patterns are also consistent with wood density information, with heavy hardwoods tending to be in slow growing groups, and light, low density timbers in faster growing groups. The range of growth rates is between 2 mm yr-1 and 8 mm yr-1 for the majority of species, with those of recognisably pioneer characteristics having maximum growth rates up to 15 mm yr-1 for smaller sized species, and up to 11 mm yr-1 for the larger, long-lived pioneers. These are average growth rates for the species, including in this data all size class from 20 cm and above.

It is of course true, as many authors have observed, that diameter increment for a given tree varies considerably over its lifespan, both due competitive, biotic, and geometric factors. Average increment for populations of a species similarly show changes with size and competitive classes (see Alder, 1995, for some examples). This should not be regarded as invalidating the use of species mean increment Id, as a robust descriptive statistic, or of implying that increment for a species needs to be constant over size for the methods presented here to be valid.
There is a general tendency for mean growth rate to increase with typical species size. This is probably an effect of both the canopy position of the species and its ecological strategy. On the other hand, the limits to growth rate decline as size increases for the fastest growing species. For smaller pioneers, mean growth rates around 15 mm yr-1 occur. For larger long-lived species considered to be of pioneer habit (such as Vochysia ferruginea, Goupia glabra), maximum species-average growth rates are around 11 mm yr-1, whilst for the largest emergents, this figure falls to 6-7 mm yr-1.
For forest managers and planners in the tropics who need to make a provisional estimate of commercial volume increment, and hence sustainable yield, this information can be of assistance where direct permanent sample plot data is absent. It is necessary to estimate the 95% cumulative diameter (D95), neglecting trees below 20 cm dbh, from conventional forest inventories, and to have some idea of the ecology and/or wood density of the species. Then from Figure 2, a reasonable estimate of likely increment can be made. This is clearly a very provisional method, that does not replace the need for permanent sample plots, but it is a means of providing a rational estimate that is unlikely to be far wrong unless the ecological behaviour or wood density of the species have been incorrectly defined. This approach has been worked up into a series of spreadsheets with accompanying macros and documentation at the website http://www.myrlin.org.
When analysing existing permanent sample plot data, the increment-size diagram is a useful aid to developing a method of species grouping, or of visualising or testing existing species grouping strategies. It has the advantage over more abstract ordinations of being relatively robust with weak data, and easily visualised and presented; and over functional methods of not requiring a priori knowledge of species ecology or morphology.
It may be argued that both Id and D95 are modified by stand treatment. Logging will remove mainly the larger trees, and therefore presumably curtail the diameter distribution. Likewise, increments tend to be higher in disturbed stand than in virgin forest. In practice, with real-world operations, these factors do not seem to be strong enough to invalidate the analysis. At the MYRLIN website noted above, a method is presented for adjusting the D95 scale according to a mean D95 value to compensate for effects of treatment or site. However, further work is required into the statistical behaviour of D95, so that confidence limits relative to sample size can be calculated, and its sensitivity to logging and disturbance evaluated. It would be very interesting to prepare graphs using the methodology described here for the other major moist tropical forest regions that have not been covered: West and Central Africa, and South-East Asia. The Dipterocarps, with their high growth rate and light-demanding habits, would most probably fall into the R group of Figure 2. In West Africa, light-demanding, fast growing species such as Triplochiton scleroxylon (Obeche) or Piptadeniastrum africanum (Dahoma) might similarly fall into the R group, whilst the slower growing but light demanding Khaya ivorensis (African Mahogany) might fall into the P group. These ideas can easily be tested from available information, and the authors suggest this idea to research workers in these countries as a useful line of study.
10Alde
r et a
l (20
02)
Rev
ised
17-
Oct
-02
# 1
1
In conclusion, the authors would wish to emphasise the main points of this research. The increment-size diagram, based on PSP data from four different forest regions, shows consistent patterns that coincide with the known ecology of species. This is useful in placing limits to expected growth rates, given a knowledge of species size (95% diameter) and ecology, and could be used to provide first-order estimates of growth rates where PSP data is lacking (as shown at www.myrlin.org). It also shows that in spite of their great species diversity, the aggregate growth characteristics of moist tropical forest in different regions appears quite similar. The increment-size diagram is also a useful research tool for reporting and describing PSP data sets, whatever method of species grouping or ordination may ultimately be preferred.

ACKNOWLEDGEMENTS
The PSPs in Brazil are supported by EMBRAPA Amazonia Oriental. Financial and logistic support has been given by at various times by IBAMA (Brazilian Institute for the Environment) and the World Wide Fund for Nature (WWF). In Costa Rica, the PSPs are maintained by CODEFORSA and Portico SA. In Papua New Guinea, the plots were established by the Forest Research Institute of the PNG Forest Authority with financial assistance from the International Tropical Timber Organisation. The PSPs in Guyana were supported by the Tropenbos Foundation of the Netherlands.
REFERENCES ALDER, D (1995) Growth modelling for mixed tropical forests. Department of Plant Sciences, University of
Oxford. Tropical Forestry Paper 30, 231 pp. ALDER, D (1997) User's guide for SIRENA II : A simulation model for the management of natural tropical forests.
CODEFORSA, Costa Rica. Natural Forest Management Technical Collection No. 9, 45 pp. ALDER, D (1998a) PINFORM: A growth model for lowland tropical forests in Papua New Guinea. Forest
Research Institute, Lae. ITTO/PNG Project PD 162/91, Consultancy Report, 49 pp. ALDER, D (1998b) The ITTO permanent sample plots in Papua New Guinea: Some results of analysis. Paper
presented to ITTO workshop on "Permanent sample plots and growth models for natural forest management in Papua New Guinea", held at the Forest Research Institute, Lae 10th-13th No 1998. 16 pp.
ALDER, D (2000) Development of growth models for applications in Guyana. DFID Guyana Forestry Commission Support Project. Consultancy Report, 41 pp.
ALDER, D (2002) Simple diameter class and cohort modelling methods for practical forest management. Paper presented to ITTO Workshop on Growth and Yield, Kuala Lumpur, 24th-28th June 2002. 16 pp.
ALDER, D; BAKER, N; WRIGHT, HL (2002) MYRLIN: Methods of Yield Regulation with Limited Information. University of Oxford, Oxford Forestry Institute. http://www.myrlin.org.
ALDER, D; OAVIKA, F; YOSI, C (1998) Data, programs and models for natural forest growth and yield. Forest Research Institute, Lae. ITTO/PNG Project PD 162/91, Consultancy Report, 38 pp.
ALDER, D; SILVA, JNM (2000) An empirical cohort model for the management of Terra Firme forests in the Brazilian Amazon. Forest Ecology & Management, 130:141-157.
ATTA-BOATENG, J; MOSER, JW JR. (1998) A method for classifying commercial tree species of an uneven-aged mixed species tropical forest for growth and yield model construction.. Forest Ecology & Management 104: 89-99.
BOSSEL, H; KRIEGER, H; MOHREN, GMJ ET-AL (1994) Simulation of multi-species tropical forest dynamics using a vertically and horizontally structured model.. Forest Ecology & Management. 1994, 69: 1-3, 123-144.
EBA'A ATYI, R (1997) Potentials of cluster analysis for the aggregation of tree species from African tropical forests. In: Foli, EG ; Vanclay, JK; Ofosu-Asiedu, A (1997) Proceedings, IUFRO conference on growth studies in tropical moist forests in Africa, 11-15 Nov 1996. Forestry Research Institute of Ghana, Kumasi, pp 170-176.
EBA'A ATYI, R (2000) TROPFOMS - A decision support model for sustainable management of south Cameroon's rainforests. Thesis, Waginengen Univerity. Tropenbos-Cameroon Series 2, 203 pp.
ENQUIST, BJ; WEST, GB; CHARNOV, EL; BROWN, JH (1999) Allometric scaling of production and life history variation in vascular plants. Nature 401: 907-911
FAVRICHON, V (1994) Classification of tree species in forests of French Guiana into functional groups based on a dynamic vegetation community matrix.. Revue d'Ecologie la Terre et la Vie. 1994, 49: 4, 379-403; 31 ref.
FEARNSIDE, PM (1997) Wood density for estimating forest biomass in Brazilian Amazonia. Forest Ecology and Management. 90:59-87.
FEDLMEIER, C (1996) Desarollo de bosques sucundarios en zonas de pastoreo abandonadas de la Zona Norte de Costa Rica. Contribucion de la Universidad de Goettingen a la agricultura y a la foresteria de los tropicos y subtropicos 109, 177pp.
11Alde
r et a
l (20
02)
Rev
ised
17-
Oct
-02
# 1
1
FINEGAN, B; CAMACHO, M (1999) Stand dynamics in a logged and silviculturally treated Costa Rican rain forest, 1988-1996. Forest Ecology & Management 121: 177-189.
FINEGAN, B; CAMACHO, M; ZAMORA, N (1999) Diameter increment patterns among 106 tree species in a logged and silviculturally treated Costa Rican rain forest. Forest Ecology & Management 121: 159-176
FOCUS ON FINANCE (2002) Strategy case study: Financial institutions and FSC. Focus on Finance Newsletter, July

2001. http://www.focusonfinance.org/Fsc.htm. FRANCIS, JK; LOWE, CA [EDS.] (2000) Silvics of native and exotic trees of Puerto Rico and the Caribbean Islands..
USDA Forest Service International Institute of Tropical Forestry General Technical Report IITF-15. http://www.fs.fed.us/global/iitf/native.htm.
FSC (2001) FSC Principles and Criteria.. Forestry Stewardship Council, Document 1.2, revised 2001. http://www.fscoax.org/principal.htm.
GIDEON, O; OAVIKA, F [EDS.] (1999) Proceedings of the workshop on permanent sample plots and growth models for lowland tropical forest in Papua New Guinea, 11th-13th November 1998, Lae. ITTO Project PD 162/91, Forest Research Institute, Lae. 133 pp.
GOURLET-FLEURY, S; HOULLIER, F (2000) Modelling diameter increment in a lowland evergreen rain forest in French Guiana. Forest Ecology & Management 131:269-289
HARTIGAN, JA (1975) Clustering Algorithms. J. Wiley & Sons, New York. 351 pp. MEYER, HA (1952) Structure, growth, and drain in balanced uneven-aged forests. Journal of Forestry, 50:85-92. NIST (2002) NIST/SEMATECH Engineering Statistics Internet Handbook..
http://www.itl.nist.gov/div898/handbook/ OAVIKA, F (1999) Location, design and field procedures for PSPs in Papua New Guinea.. In: Gideon, O; Oavika,
F [Eds.] (1999) Proceedings of workshop on permanent sample plots and growth models for lowland tropical forest in Papua New Guinea, 11th-13th Nov 1998, Lae. ITTO Project PD 162/91, Forest Research Institute, Lae. pp 6-14.
PIELOU, EC (1977) Mathematical Ecology. Wiley-Interscience. 385 pp. RICHTER, HG; DALLWITZ, MJ (2000) Commercial timbers: descriptions, illustrations, identification, and
information retrieval.. In English, French, German, and Spanish. Version: 4th May 2000. http://biodiversity.uno.edu/delta/.
ROSE, S (2000) Seeds, seedlings and gaps - size matters: a study in the tropical rain forest of Guyana. Tropenbos-Guyana Series 9. http://www.library.uu.nl/digiarchief/dip/diss/1940705.
SHEIL, D; BURSLEM, DFRP; ALDER, D (1995) The interpretation and misinterpretation of mortality rate measures. Journal of Ecology, 83:331-333.
SILVA, JNM (1989) The behaviour of the tropical rainforest of the Brazilian Amazon after logging. D.Phil. thesis, Oxford University. 302 pp.
SILVA, JNM; DE CARVALHO, JOP; LOPES, J. DE CA; DE OLIVEIRA, RP; DE OLIVEIRA, LC (1996) Growth and yield studies in the Tapajos region, Central Brazilian Amazon. Commonwealth Forestry Review 75(4)325-329.
SILVA, JNM; DE CARVALHO, JOP; LOPES, JCA; ALMEIDA BF; COSTA DHM; DE OLIVEIRA, LC; VANCLAY, JK; SKOVSGAARD, JP (1995) Growth and yield of a tropical rainforest in the Brazilian Amazon 13 years after logging. Forest Ecology & Management, 71:267-274.
SYNNOTT, TJ (1979) A manual of permanent plot procedures for tropical rainforests. Commonwealth Forestry Institute, University of Oxford, Tropical Forestry Papers 14, 67 pp.
VAN DER HOUT, P (1999) Reduced impact logging in the tropical rainforest of Guyana. Tropenbos-Guyana Series 6, 335 pp.
VAN DER HOUT, P (2000) Pibiri permanent plots: Objectives, design and database management. Tropenbos Guyana Reports 2000-2
VANCLAY, JK (1991) Aggregating tree species to develop diameter increment equations for tropical rainforests. Forest Ecology & Management, 42:143-168.
VANCLAY, JK (1994) Modelling of Growth and Yield of Tropical Moist Forests. CAB International, Wallingford. 312 pp.
VANCLAY, JK; GILLISON, AN; KEENAN, RJ (1997) Using plant functional attributes to quantify site productivity and growth patterns in mixed forests. Forest Ecology & Management 94:149-163.
WEISSENHOFER, A (1996) Ökologie und Struktur eines Tieflandregenwaldes in der Pazifikregion von Costa Rica [Structure and ecology of a tropical lowland rainforest in the Pacific region of Costa Rica ].. Diplomarbeit an der Univ. Wien. http://www.esquinaslodge.com/Pag/ESSumWeiss.html.
WRIGHT, HL (2000) Yield determination in tropical moist forest.. OFI Occasional Papers 52, 3-13.
12Alde
r et a
l (20
02)
Rev
ised
17-
Oct
-02
# 1
1 WRIGHT, HL; ALDER, D [ED.] (2000) Humid and semi-humid tropical forest yield regulation with minimal data. Workshop proceedings, CATIE, Costa Rica, 5-9 July 1999. Oxford Forestry Institute Occasional Papers 52. 95 pp.
YOSI, C (1999) Data processing systems for ITTO plots in Papua New Guinea.. In: Gideon, O; Oavika, F [EDS.]

(1999) Proceedings of workshop on permanent sample plots and growth models for lowland tropical forest in Papua New Guinea, 11th-13th Nov 1998, Lae. ITTO Project PD 162/91, Forest Research Institute, Lae. pp 15-17.
ZAGT, RJ (1997) Tree demography in the tropical rain forest of Guyana. Tropenbos Guyana Series 3, 251 pp. ZAMORA, N (1997) Evaluación floristica de los bosques de la zona norte de Costa Rica. CODEFORSA Colleción
Técnica de Manejo de Bosque Natural 10, 10 pp. + apps.
13Alde
r et a
l (20
02)
Rev
ised
17-
Oct
-02
# 1
1