Simulated dynamics of carbon stocks driven by changes in land use, management and climate in a...
6
Simulated dynamics of carbon stocks driven by changes in land use, management and climate in a tropical moist ecosystem of Ghana Zhengxi Tan a, *, Shuguang Liu b,c , Larry L. Tieszen b , Emmanuel Tachie-Obeng d a ARTS, contractor to USGS Earth Resources Observation and Science (EROS) Center, Sioux Falls, SD 57198, USA b USGS EROS Center, Sioux Falls, SD 57198, USA c Geographic Information Science Center of Excellence, South Dakota State University, Brookings, SD 57007, USA d Environmental Protection Agency, Accra, Ghana 1. Introduction Concerns about impacts of global warming on ecosystem performance are motivating scientists to determine the extent to which changes in land use and land cover (LULC) and land management have affected and continue to affect the global carbon (C) budget, nutrient cycling, and sustainability of ecosystems. Many studies have been conducted to assess how both LULC and recent climatic trends have impacted ecosystems of West Africa (Gonzalez, 2001; Nicholson, 2001; Liu et al., 2004a; Woomer et al., 2004; Tan et al., 2009). Increasing attention is being paid to sub-Saharan Africa because this area probably makes a greater contribution to the uncertainty of the C budgets at regional and global scales than any other regions (Houghton and Hackler, 2006). Deforestation for crop production has been a dominant force leading to a substantial loss of ecosystem C stock in sub-Saharan Africa. It not only contributes to the global greenhouse effect but also jeopardizes ecosystem services. For example, deforestation- induced fragmentation can greatly increase the susceptibility of tropical ecosystems to fire in dry years (Laurance, 2004) and in turn provide a positive feedback to climate change by releasing C from soil and reducing evapotranspiration (Field et al., 2007). Meanwhile, the replacement of forests by annually harvested croplands largely reduces the C accumulation associated with forests in response to elevated CO 2 (Field et al., 2007). Therefore, deforestation-induced change in LULC requires critical considera- tion in model simulations for predicting the responses of ecosystems to climate change in the future. For this study, we selected the Assin district of Ghana, a tropical moist ecosystem, as the study area. Our hypothesis is that changes in LULC and management practices have been the primary forces leading to net C sources across the area during the 20th century, and the uncertainties of interannual climate and the application level of nitrogen (N) fertilizers will be major factors controlling ecosystem C dynamics in the future. The specific objectives of this study are to identify the dynamics of ecosystem C and soil organic carbon (SOC) stocks during the 20th century and to simulate the sensitivity of both natural and managed ecosystems to projected climate changes, deforestation, and nitrogen fertilization through the 21st century. Agriculture, Ecosystems and Environment 130 (2009) 171–176 ARTICLE INFO Article history: Received 21 October 2008 Received in revised form 16 December 2008 Accepted 6 January 2009 Available online 7 February 2009 Keywords: Biogeochemical modeling Climate change Ecosystem carbon stock Nitrogen fertilization Soil organic carbon ABSTRACT Sub-Saharan Africa is large and diverse with regions of food insecurity and high vulnerability to climate change. This project quantifies carbon stocks and fluxes in the humid forest zone of Ghana, as a part of an assessment in West Africa. The General Ensemble biogeochemical Modeling System (GEMS) was used to simulate the responses of natural and managed systems to projected scenarios of changes in climate, land use and cover, and nitrogen fertilization in the Assin district of Ghana. Model inputs included historical land use and cover data, historical climate records and projected climate changes, and national management inventories. Our results show that deforestation for crop production led to a loss of soil organic carbon (SOC) by 33% from 1900 to 2000. The results also show that the trend of carbon emissions from cropland in the 20th century will continue through the 21st century and will be increased under the projected warming and drying scenarios. Nitrogen (N) fertilization in agricultural systems could offset SOC loss by 6% with 30 kg N ha 1 year 1 and by 11% with 60 kg N ha 1 year 1 . To increase N fertilizer input would be one of the vital adaptive measures to ensure food security and maintain agricultural sustainability through the 21st century. ß 2009 Elsevier B.V. All rights reserved. * Corresponding author at: ASRC Research and Technology Solutions, Contractor, USGS Earth Resources Observation and Science (EROS) Center, 47914 252nd Street, Sioux Falls, SD 57198, USA. Tel.: +1 605 594 6903; fax: +1 605 594 6529. E-mail address: [email protected] (Z. Tan). Contents lists available at ScienceDirect Agriculture, Ecosystems and Environment journal homepage: www.elsevier.com/locate/agee 0167-8809/$ – see front matter ß 2009 Elsevier B.V. All rights reserved. doi:10.1016/j.agee.2009.01.004
Transcript of Simulated dynamics of carbon stocks driven by changes in land use, management and climate in a...
Sa
Za
b
c
d
A
A
R
R
A
A
K
B
C
E
N
S
U
S
0
d
imulated dynamics of carbon stocks driven by changes in land use, managementnd climate in a tropical moist ecosystem of Ghana
hengxi Tan a,*, Shuguang Liu b,c, Larry L. Tieszen b, Emmanuel Tachie-Obeng d
ARTS, contractor to USGS Earth Resources Observation and Science (EROS) Center, Sioux Falls, SD 57198, USA
USGS EROS Center, Sioux Falls, SD 57198, USA
Geographic Information Science Center of Excellence, South Dakota State University, Brookings, SD 57007, USA
Environmental Protection Agency, Accra, Ghana
Agriculture, Ecosystems and Environment 130 (2009) 171–176
R T I C L E I N F O
rticle history:
eceived 21 October 2008
eceived in revised form 16 December 2008
ccepted 6 January 2009
vailable online 7 February 2009
eywords:
iogeochemical modeling
limate change
cosystem carbon stock
itrogen fertilization
oil organic carbon
A B S T R A C T
Sub-Saharan Africa is large and diverse with regions of food insecurity and high vulnerability to climate
change. This project quantifies carbon stocks and fluxes in the humid forest zone of Ghana, as a part of an
assessment in West Africa. The General Ensemble biogeochemical Modeling System (GEMS) was used to
simulate the responses of natural and managed systems to projected scenarios of changes in climate,
land use and cover, and nitrogen fertilization in the Assin district of Ghana. Model inputs included
historical land use and cover data, historical climate records and projected climate changes, and national
management inventories. Our results show that deforestation for crop production led to a loss of soil
organic carbon (SOC) by 33% from 1900 to 2000. The results also show that the trend of carbon emissions
from cropland in the 20th century will continue through the 21st century and will be increased under the
projected warming and drying scenarios. Nitrogen (N) fertilization in agricultural systems could offset
SOC loss by 6% with 30 kg N ha�1 year�1 and by 11% with 60 kg N ha�1 year�1. To increase N fertilizer
input would be one of the vital adaptive measures to ensure food security and maintain agricultural
sustainability through the 21st century.
� 2009 Elsevier B.V. All rights reserved.
Contents lists available at ScienceDirect
Agriculture, Ecosystems and Environment
journal homepage: www.e lsev ier .com/ locate /agee
1. Introduction
Concerns about impacts of global warming on ecosystemperformance are motivating scientists to determine the extent towhich changes in land use and land cover (LULC) and landmanagement have affected and continue to affect the globalcarbon (C) budget, nutrient cycling, and sustainability ofecosystems. Many studies have been conducted to assess howboth LULC and recent climatic trends have impacted ecosystemsof West Africa (Gonzalez, 2001; Nicholson, 2001; Liu et al., 2004a;Woomer et al., 2004; Tan et al., 2009). Increasing attention is beingpaid to sub-Saharan Africa because this area probably makes agreater contribution to the uncertainty of the C budgets atregional and global scales than any other regions (Houghton andHackler, 2006).
Deforestation for crop production has been a dominant forceleading to a substantial loss of ecosystem C stock in sub-SaharanAfrica. It not only contributes to the global greenhouse effect but
* Corresponding author at: ASRC Research and Technology Solutions, Contractor,
SGS Earth Resources Observation and Science (EROS) Center, 47914 252nd Street,
ioux Falls, SD 57198, USA. Tel.: +1 605 594 6903; fax: +1 605 594 6529.
E-mail address: [email protected] (Z. Tan).
167-8809/$ – see front matter � 2009 Elsevier B.V. All rights reserved.
oi:10.1016/j.agee.2009.01.004
also jeopardizes ecosystem services. For example, deforestation-induced fragmentation can greatly increase the susceptibility oftropical ecosystems to fire in dry years (Laurance, 2004) and inturn provide a positive feedback to climate change by releasing Cfrom soil and reducing evapotranspiration (Field et al., 2007).Meanwhile, the replacement of forests by annually harvestedcroplands largely reduces the C accumulation associated withforests in response to elevated CO2 (Field et al., 2007). Therefore,deforestation-induced change in LULC requires critical considera-tion in model simulations for predicting the responses ofecosystems to climate change in the future. For this study, weselected the Assin district of Ghana, a tropical moist ecosystem, asthe study area. Our hypothesis is that changes in LULC andmanagement practices have been the primary forces leading tonet C sources across the area during the 20th century, and theuncertainties of interannual climate and the application level ofnitrogen (N) fertilizers will be major factors controlling ecosystemC dynamics in the future. The specific objectives of this study areto identify the dynamics of ecosystem C and soil organic carbon(SOC) stocks during the 20th century and to simulate thesensitivity of both natural and managed ecosystems to projectedclimate changes, deforestation, and nitrogen fertilization throughthe 21st century.
Z. Tan et al. / Agriculture, Ecosystems and Environment 130 (2009) 171–176172
2. Materials and methods
2.1. Study area
The Assin district is in the central part of southern Ghana andcovers an area of 2416 km2. The mean annual minimum andmaximum temperatures for this area between 1971 and 2000 were22.3 8C (�0.4) and 32.3 8C (�0.6), respectively. During the sameperiod, the region mean annual precipitation was 1421 mm (�186)and about 86% of the total annual precipitation occurred betweenMarch and October. The natural vegetation community was thoughtthe tropical moist forest. By 2000, closed forest (>60% cover),degraded forest (<60% cover, derived from natural closed forest dueto cutting and other disturbances), and agriculture (with 10–20 trees ha�1) were major LULC types and accounted for 20.3%,34.1%, and 44.0%, respectively, in 2000 (Table 1). Between 1975 and2000, a net area change in LULC amounted 15% of the total land area,primarily as conversions from both closed forest and degraded forestto cropping systems. During this time, closed forest decreased by20.6% and degraded forest declined by 22.2%, whereas the area ofcropland increased by 50.1%. Major crop species included maize (Zea
mays L.), cassava (Manihot esculenta), and cocoyam (Xanthosoma
tannia). Of the total planted area in 2000, these crops accounted for45%, 40%, and 10%, respectively.
2.2. Modeling system and simulations
2.2.1. GEMS (General Ensemble biogeochemical Modeling System)
The modeling approach applied in Senegal by Liu et al. (2004a)was used in this study to help develop an understanding of theclimate and management controls on the biogeochemical cyclingin the more humid country of Ghana. We believed that the modelstructure and performance of GEMS with results validated inSenegal could provide a solid basis for application in Ghana.
GEMS (Liu et al., 2004b) was developed for a better integrationof well-established ecosystem models with various spatialdatabases for simulating biogeochemical cycles over large areas(Liu et al., 2004a). The CENTURY model (Parton et al., 1987) wasselected as the underlying ecosystem biogeochemical model inGEMS because it has solid modules for simulating C dynamics atthe ecosystem level and has been widely applied to variousecosystems worldwide. GEMS has been successfully used tosimulate C dynamics in vegetation and soil at various spatial scales.More detail about this model can be referred to Liu et al. (2004b).
Similar to the model application in Senegal by Liu et al. (2004a)modeling architecture in this study was designed for threescenarios: initial C status around 1900, impacts of humandisturbances on C dynamics from 1900 to 2000, and C trendsunder a changing climate from 2000 to 2100. For initial C statusaround 1900, it was assumed that the ecosystem C flux and SOCstock in 1900 were in equilibrium under natural vegetation, eventhough human presence could be traced back prior to 1900.
Table 1Land use/land cover types and their changes in the Assin district from 1975 to 2000.
Land use and land cover type 1975
km2 %a
Closed forest (>60%) 618 25.6
Degraded forest 1061 43.9
Agriculture 709 29.3
Water 8 0.3
Settlement 20 0.8
Sum 2416 100
Area changed
a Percentage of the total land area.
Estimates of ecosystem C flux and SOC stock in 1900 were obtainedby running GEMS for 1500 years (so that the equilibrium of SOCstock was supposed to reach and the stabilized values of SOC stockin 1900 can be used as the baselines for simulations) under naturalvegetation, coupled with the data of climatic variables (includingmean monthly precipitation, mean monthly minimum andmaximum temperatures) from 1971 to 2000 (climatic data areavailable only for this time period), and contemporary soil anddrainage conditions. As defined by CENTURY SOM model (Partonet al., 1987), SOC stock consists of three pools: labile, slow andpassive. According to Paustian et al. (1995), we used a retrospectiveSOC initialization algorithm to define the slow SOC pool based onthe NPP (net primary productivity) for each land cover type andsoil inventory data. The labile SOC pool was set at about 5% of thetotal SOC stock. The difference between the total SOC and both theslow and labile pools was then used to initialize the passive SOCpool.
2.2.2. Geospatial data for model simulations
The spatial simulation unit of GEMS is a JFD (joint frequencydistribution) case. A JFD case (i.e. a grid) contains multiple,homogeneous, connected or isolated land pixels that represent aunique combination of values from the Geographic InformationSystem (GIS) layers. The GIS layers for JFD generation in this studyconsisted of mean monthly precipitation, mean monthly minimumand maximum temperatures, historical LULC change dynamic datathat were derived from 1975 to 2000 Landsat images provided byGhana Environmental Protection Agency and Center for RemoteSensing and Geographical Information System (CERSGIS), soilinventory taken from the FAO soil database. A total of 36 JFD caseswith a pixel size of 1 km by 1 km were resulted from thecombination of these GIS layers in this study.
2.2.3. Management practice data
The information of management practices for this study wassynthesized from sample site investigations across the study areaand the literature. The dataset of management practices for modelsimulations consisted of crop composition, crop rotation, fallow,and harvesting options (or residue management). These kinds ofinformation and their parameters used in GEMS are listed inTable 2. Besides crop residues retained in field, an average level of2.0 Mg ha�1 year�1 manure was considered for modeling. Bothhand- and animal-driven plowing methods were applied fortillage. The frequency of fuelwood production from woodlands wasassumed to be one time each year. GEMS automates the processesof downscaling those data for C budget simulations.
2.2.4. Ensemble simulations and uncertainty control
According to Liu et al. (2004b), GEMS generates site-level inputswith a Monte Carlo approach from regional datasets. Because anysingle simulation of a JFD case is a unique combination of thespatial units in common of all input GIS layers, the output of a
2000 Change by
km2 %a km2 %a
491 20.3 �127 �5.3
825 34.1 �236 �9.8
1064 44.0 355 14.7
8 0.3 0 0.0
28 1.2 8 0.3
2416 100
363 15.0
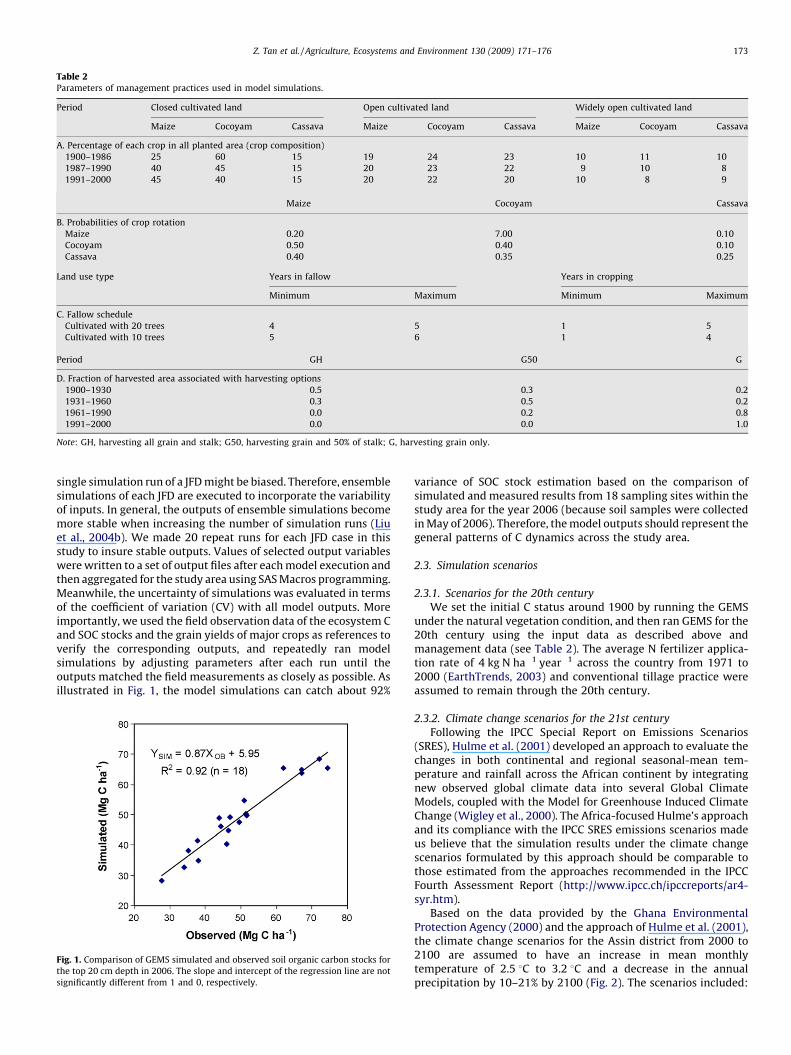
Table 2Parameters of management practices used in model simulations.
Period Closed cultivated land Open cultivated land Widely open cultivated land
Maize Cocoyam Cassava Maize Cocoyam Cassava Maize Cocoyam Cassava
A. Percentage of each crop in all planted area (crop composition)
1900–1986 25 60 15 19 24 23 10 11 10
1987–1990 40 45 15 20 23 22 9 10 8
1991–2000 45 40 15 20 22 20 10 8 9
Maize Cocoyam Cassava
B. Probabilities of crop rotation
Maize 0.20 7.00 0.10
Cocoyam 0.50 0.40 0.10
Cassava 0.40 0.35 0.25
Land use type Years in fallow Years in cropping
Minimum Maximum Minimum Maximum
C. Fallow schedule
Cultivated with 20 trees 4 5 1 5
Cultivated with 10 trees 5 6 1 4
Period GH G50 G
D. Fraction of harvested area associated with harvesting options
1900–1930 0.5 0.3 0.2
1931–1960 0.3 0.5 0.2
1961–1990 0.0 0.2 0.8
1991–2000 0.0 0.0 1.0
Note: GH, harvesting all grain and stalk; G50, harvesting grain and 50% of stalk; G, harvesting grain only.
Z. Tan et al. / Agriculture, Ecosystems and Environment 130 (2009) 171–176 173
single simulation run of a JFD might be biased. Therefore, ensemblesimulations of each JFD are executed to incorporate the variabilityof inputs. In general, the outputs of ensemble simulations becomemore stable when increasing the number of simulation runs (Liuet al., 2004b). We made 20 repeat runs for each JFD case in thisstudy to insure stable outputs. Values of selected output variableswere written to a set of output files after each model execution andthen aggregated for the study area using SAS Macros programming.Meanwhile, the uncertainty of simulations was evaluated in termsof the coefficient of variation (CV) with all model outputs. Moreimportantly, we used the field observation data of the ecosystem Cand SOC stocks and the grain yields of major crops as references toverify the corresponding outputs, and repeatedly ran modelsimulations by adjusting parameters after each run until theoutputs matched the field measurements as closely as possible. Asillustrated in Fig. 1, the model simulations can catch about 92%
Fig. 1. Comparison of GEMS simulated and observed soil organic carbon stocks for
the top 20 cm depth in 2006. The slope and intercept of the regression line are not
significantly different from 1 and 0, respectively.
variance of SOC stock estimation based on the comparison ofsimulated and measured results from 18 sampling sites within thestudy area for the year 2006 (because soil samples were collectedin May of 2006). Therefore, the model outputs should represent thegeneral patterns of C dynamics across the study area.
2.3. Simulation scenarios
2.3.1. Scenarios for the 20th century
We set the initial C status around 1900 by running the GEMSunder the natural vegetation condition, and then ran GEMS for the20th century using the input data as described above andmanagement data (see Table 2). The average N fertilizer applica-tion rate of 4 kg N ha�1 year�1 across the country from 1971 to2000 (EarthTrends, 2003) and conventional tillage practice wereassumed to remain through the 20th century.
2.3.2. Climate change scenarios for the 21st century
Following the IPCC Special Report on Emissions Scenarios(SRES), Hulme et al. (2001) developed an approach to evaluate thechanges in both continental and regional seasonal-mean tem-perature and rainfall across the African continent by integratingnew observed global climate data into several Global ClimateModels, coupled with the Model for Greenhouse Induced ClimateChange (Wigley et al., 2000). The Africa-focused Hulme’s approachand its compliance with the IPCC SRES emissions scenarios madeus believe that the simulation results under the climate changescenarios formulated by this approach should be comparable tothose estimated from the approaches recommended in the IPCCFourth Assessment Report (http://www.ipcc.ch/ipccreports/ar4-syr.htm).
Based on the data provided by the Ghana EnvironmentalProtection Agency (2000) and the approach of Hulme et al. (2001),the climate change scenarios for the Assin district from 2000 to2100 are assumed to have an increase in mean monthlytemperature of 2.5 8C to 3.2 8C and a decrease in the annualprecipitation by 10–21% by 2100 (Fig. 2). The scenarios included:
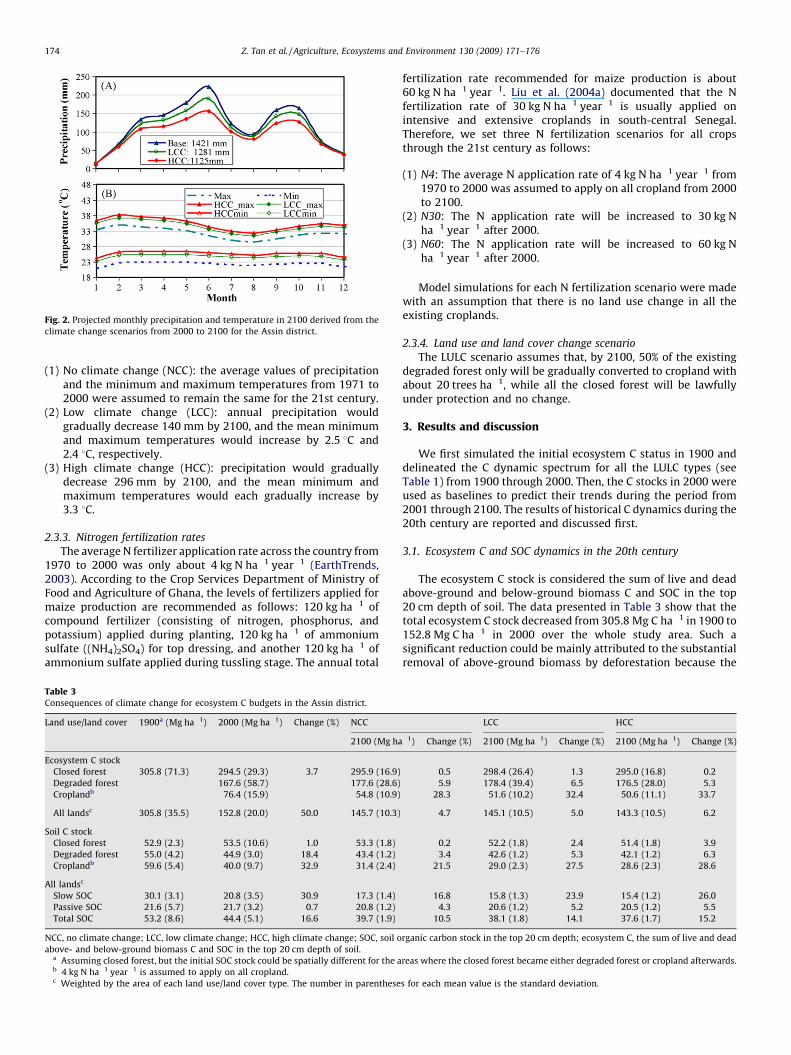
Fig. 2. Projected monthly precipitation and temperature in 2100 derived from the
climate change scenarios from 2000 to 2100 for the Assin district.
Z. Tan et al. / Agriculture, Ecosystems and Environment 130 (2009) 171–176174
(1) N
TabCon
Land
Ecos
Cl
De
Cr
Al
Soil
Cl
De
Cr
All l
Sl
Pa
To
NCC
abova
b
c
o climate change (NCC): the average values of precipitationand the minimum and maximum temperatures from 1971 to2000 were assumed to remain the same for the 21st century.
(2) L
ow climate change (LCC): annual precipitation wouldgradually decrease 140 mm by 2100, and the mean minimumand maximum temperatures would increase by 2.5 8C and2.4 8C, respectively.(3) H
igh climate change (HCC): precipitation would graduallydecrease 296 mm by 2100, and the mean minimum andmaximum temperatures would each gradually increase by3.3 8C.2.3.3. Nitrogen fertilization rates
The average N fertilizer application rate across the country from1970 to 2000 was only about 4 kg N ha�1 year�1 (EarthTrends,2003). According to the Crop Services Department of Ministry ofFood and Agriculture of Ghana, the levels of fertilizers applied formaize production are recommended as follows: 120 kg ha�1 ofcompound fertilizer (consisting of nitrogen, phosphorus, andpotassium) applied during planting, 120 kg ha�1 of ammoniumsulfate ((NH4)2SO4) for top dressing, and another 120 kg ha�1 ofammonium sulfate applied during tussling stage. The annual total
le 3sequences of climate change for ecosystem C budgets in the Assin district.
use/land cover 1900a (Mg ha�1) 2000 (Mg ha�1) Change (%) NCC
2100 (Mg ha
ystem C stock
osed forest 305.8 (71.3) 294.5 (29.3) �3.7 295.9 (16.9)
graded forest 167.6 (58.7) 177.6 (28.6)
oplandb 76.4 (15.9) 54.8 (10.9)
l landsc 305.8 (35.5) 152.8 (20.0) �50.0 145.7 (10.3)
C stock
osed forest 52.9 (2.3) 53.5 (10.6) 1.0 53.3 (1.8)
graded forest 55.0 (4.2) 44.9 (3.0) �18.4 43.4 (1.2)
oplandb 59.6 (5.4) 40.0 (9.7) �32.9 31.4 (2.4)
andsc
ow SOC 30.1 (3.1) 20.8 (3.5) 30.9 17.3 (1.4)
ssive SOC 21.6 (5.7) 21.7 (3.2) 0.7 20.8 (1.2)
tal SOC 53.2 (8.6) 44.4 (5.1) 16.6 39.7 (1.9)
, no climate change; LCC, low climate change; HCC, high climate change; SOC, soil o
e- and below-ground biomass C and SOC in the top 20 cm depth of soil.
Assuming closed forest, but the initial SOC stock could be spatially different for the a
4 kg N ha�1 year�1 is assumed to apply on all cropland.
Weighted by the area of each land use/land cover type. The number in parenthese
fertilization rate recommended for maize production is about60 kg N ha�1 year�1. Liu et al. (2004a) documented that the Nfertilization rate of 30 kg N ha�1 year�1 is usually applied onintensive and extensive croplands in south-central Senegal.Therefore, we set three N fertilization scenarios for all cropsthrough the 21st century as follows:
(1) N
�1)
rgan
reas
s for
4: The average N application rate of 4 kg N ha�1 year�1 from1970 to 2000 was assumed to apply on all cropland from 2000to 2100.
(2) N
30: The N application rate will be increased to 30 kg Nha�1 year�1 after 2000.(3) N
60: The N application rate will be increased to 60 kg Nha�1 year�1 after 2000.Model simulations for each N fertilization scenario were madewith an assumption that there is no land use change in all theexisting croplands.
2.3.4. Land use and land cover change scenario
The LULC scenario assumes that, by 2100, 50% of the existingdegraded forest only will be gradually converted to cropland withabout 20 trees ha�1, while all the closed forest will be lawfullyunder protection and no change.
3. Results and discussion
We first simulated the initial ecosystem C status in 1900 anddelineated the C dynamic spectrum for all the LULC types (seeTable 1) from 1900 through 2000. Then, the C stocks in 2000 wereused as baselines to predict their trends during the period from2001 through 2100. The results of historical C dynamics during the20th century are reported and discussed first.
3.1. Ecosystem C and SOC dynamics in the 20th century
The ecosystem C stock is considered the sum of live and deadabove-ground and below-ground biomass C and SOC in the top20 cm depth of soil. The data presented in Table 3 show that thetotal ecosystem C stock decreased from 305.8 Mg C ha�1 in 1900 to152.8 Mg C ha�1 in 2000 over the whole study area. Such asignificant reduction could be mainly attributed to the substantialremoval of above-ground biomass by deforestation because the
LCC HCC
Change (%) 2100 (Mg ha�1) Change (%) 2100 (Mg ha�1) Change (%)
0.5 298.4 (26.4) 1.3 295.0 (16.8) 0.2
5.9 178.4 (39.4) 6.5 176.5 (28.0) 5.3
�28.3 51.6 (10.2) �32.4 50.6 (11.1) �33.7
�4.7 145.1 (10.5) �5.0 143.3 (10.5) �6.2
�0.2 52.2 (1.8) �2.4 51.4 (1.8) �3.9
�3.4 42.6 (1.2) �5.3 42.1 (1.2) �6.3
�21.5 29.0 (2.3) �27.5 28.6 (2.3) �28.6
�16.8 15.8 (1.3) �23.9 15.4 (1.2) �26.0
�4.3 20.6 (1.2) �5.2 20.5 (1.2) �5.5
�10.5 38.1 (1.8) �14.1 37.6 (1.7) �15.2
ic carbon stock in the top 20 cm depth; ecosystem C, the sum of live and dead
where the closed forest became either degraded forest or cropland afterwards.
each mean value is the standard deviation.
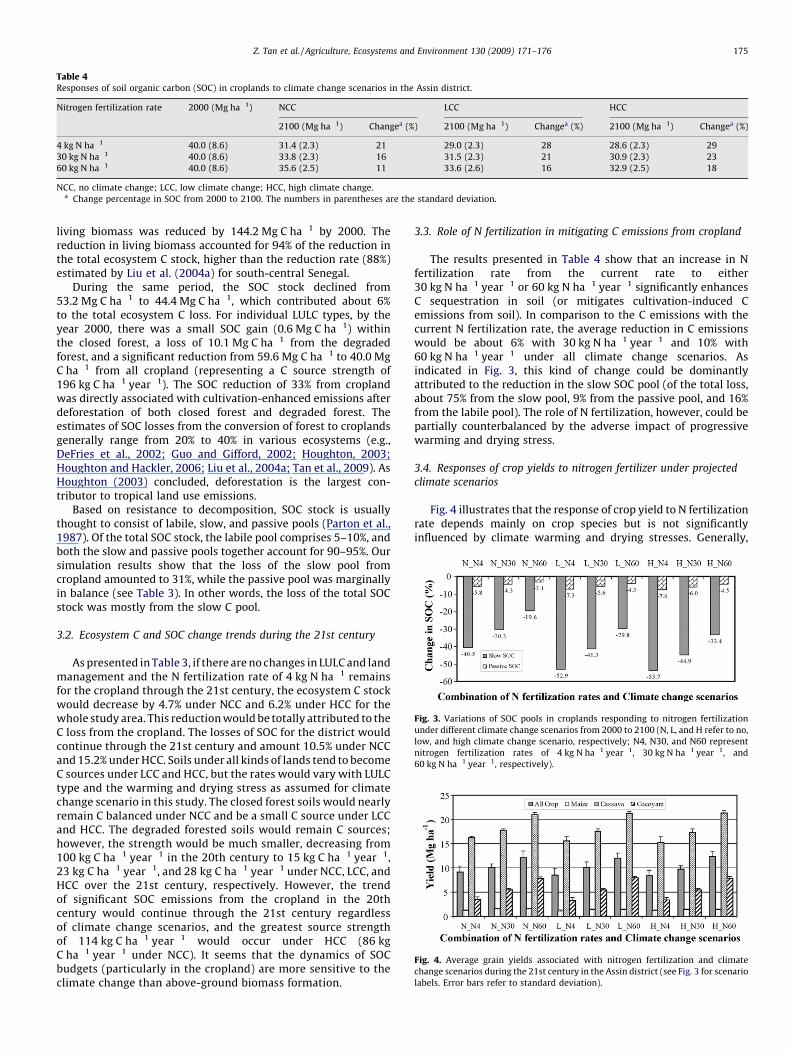
Table 4Responses of soil organic carbon (SOC) in croplands to climate change scenarios in the Assin district.
Nitrogen fertilization rate 2000 (Mg ha�1) NCC LCC HCC
2100 (Mg ha�1) Changea (%) 2100 (Mg ha�1) Changea (%) 2100 (Mg ha�1) Changea (%)
4 kg N ha�1 40.0 (8.6) 31.4 (2.3) �21 29.0 (2.3) �28 28.6 (2.3) �29
30 kg N ha�1 40.0 (8.6) 33.8 (2.3) �16 31.5 (2.3) �21 30.9 (2.3) �23
60 kg N ha�1 40.0 (8.6) 35.6 (2.5) �11 33.6 (2.6) �16 32.9 (2.5) �18
NCC, no climate change; LCC, low climate change; HCC, high climate change.a Change percentage in SOC from 2000 to 2100. The numbers in parentheses are the standard deviation.
Fig. 3. Variations of SOC pools in croplands responding to nitrogen fertilization
under different climate change scenarios from 2000 to 2100 (N, L, and H refer to no,
low, and high climate change scenario, respectively; N4, N30, and N60 represent
nitrogen fertilization rates of 4 kg N ha�1 year�1, 30 kg N ha�1 year�1, and
60 kg N ha�1 year�1, respectively).
Fig. 4. Average grain yields associated with nitrogen fertilization and climate
change scenarios during the 21st century in the Assin district (see Fig. 3 for scenario
labels. Error bars refer to standard deviation).
Z. Tan et al. / Agriculture, Ecosystems and Environment 130 (2009) 171–176 175
living biomass was reduced by 144.2 Mg C ha�1 by 2000. Thereduction in living biomass accounted for 94% of the reduction inthe total ecosystem C stock, higher than the reduction rate (88%)estimated by Liu et al. (2004a) for south-central Senegal.
During the same period, the SOC stock declined from53.2 Mg C ha�1 to 44.4 Mg C ha�1, which contributed about 6%to the total ecosystem C loss. For individual LULC types, by theyear 2000, there was a small SOC gain (0.6 Mg C ha�1) withinthe closed forest, a loss of 10.1 Mg C ha�1 from the degradedforest, and a significant reduction from 59.6 Mg C ha�1 to 40.0 MgC ha�1 from all cropland (representing a C source strength of196 kg C ha�1 year�1). The SOC reduction of 33% from croplandwas directly associated with cultivation-enhanced emissions afterdeforestation of both closed forest and degraded forest. Theestimates of SOC losses from the conversion of forest to croplandsgenerally range from 20% to 40% in various ecosystems (e.g.,DeFries et al., 2002; Guo and Gifford, 2002; Houghton, 2003;Houghton and Hackler, 2006; Liu et al., 2004a; Tan et al., 2009). AsHoughton (2003) concluded, deforestation is the largest con-tributor to tropical land use emissions.
Based on resistance to decomposition, SOC stock is usuallythought to consist of labile, slow, and passive pools (Parton et al.,1987). Of the total SOC stock, the labile pool comprises 5–10%, andboth the slow and passive pools together account for 90–95%. Oursimulation results show that the loss of the slow pool fromcropland amounted to 31%, while the passive pool was marginallyin balance (see Table 3). In other words, the loss of the total SOCstock was mostly from the slow C pool.
3.2. Ecosystem C and SOC change trends during the 21st century
As presented in Table 3, if there are no changes in LULC and landmanagement and the N fertilization rate of 4 kg N ha�1 remainsfor the cropland through the 21st century, the ecosystem C stockwould decrease by 4.7% under NCC and 6.2% under HCC for thewhole study area. This reduction would be totally attributed to theC loss from the cropland. The losses of SOC for the district wouldcontinue through the 21st century and amount 10.5% under NCCand 15.2% under HCC. Soils under all kinds of lands tend to becomeC sources under LCC and HCC, but the rates would vary with LULCtype and the warming and drying stress as assumed for climatechange scenario in this study. The closed forest soils would nearlyremain C balanced under NCC and be a small C source under LCCand HCC. The degraded forested soils would remain C sources;however, the strength would be much smaller, decreasing from100 kg C ha�1 year�1 in the 20th century to 15 kg C ha�1 year�1,23 kg C ha�1 year�1, and 28 kg C ha�1 year�1 under NCC, LCC, andHCC over the 21st century, respectively. However, the trendof significant SOC emissions from the cropland in the 20thcentury would continue through the 21st century regardlessof climate change scenarios, and the greatest source strengthof 114 kg C ha�1 year�1 would occur under HCC (86 kgC ha�1 year�1 under NCC). It seems that the dynamics of SOCbudgets (particularly in the cropland) are more sensitive to theclimate change than above-ground biomass formation.
3.3. Role of N fertilization in mitigating C emissions from cropland
The results presented in Table 4 show that an increase in Nfertilization rate from the current rate to either30 kg N ha�1 year�1 or 60 kg N ha�1 year�1 significantly enhancesC sequestration in soil (or mitigates cultivation-induced Cemissions from soil). In comparison to the C emissions with thecurrent N fertilization rate, the average reduction in C emissionswould be about 6% with 30 kg N ha�1 year�1 and 10% with60 kg N ha�1 year�1 under all climate change scenarios. Asindicated in Fig. 3, this kind of change could be dominantlyattributed to the reduction in the slow SOC pool (of the total loss,about 75% from the slow pool, 9% from the passive pool, and 16%from the labile pool). The role of N fertilization, however, could bepartially counterbalanced by the adverse impact of progressivewarming and drying stress.
3.4. Responses of crop yields to nitrogen fertilizer under projected
climate scenarios
Fig. 4 illustrates that the response of crop yield to N fertilizationrate depends mainly on crop species but is not significantlyinfluenced by climate warming and drying stresses. Generally,
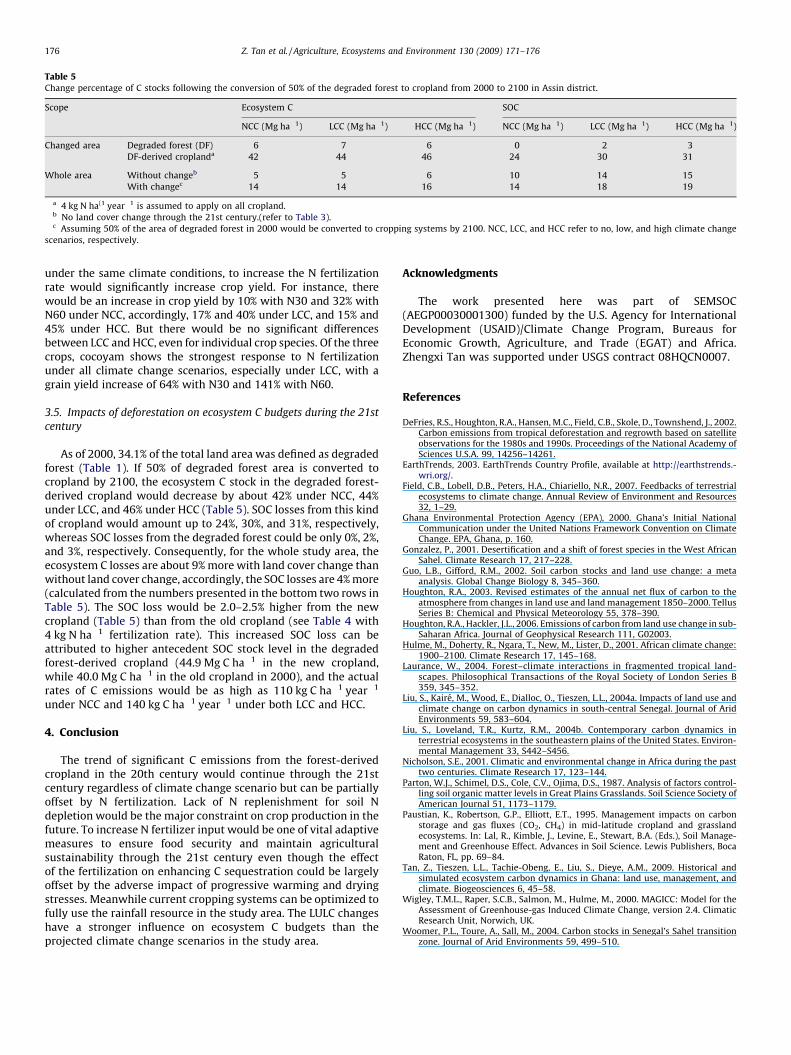
Table 5Change percentage of C stocks following the conversion of 50% of the degraded forest to cropland from 2000 to 2100 in Assin district.
Scope Ecosystem C SOC
NCC (Mg ha�1) LCC (Mg ha�1) HCC (Mg ha�1) NCC (Mg ha�1) LCC (Mg ha�1) HCC (Mg ha�1)
Changed area Degraded forest (DF) 6 7 6 0 �2 �3
DF-derived croplanda �42 �44 �46 �24 �30 �31
Whole area Without changeb �5 �5 �6 �10 �14 �15
With changec �14 �14 �16 �14 �18 �19
a 4 kg N ha(1 year�1 is assumed to apply on all cropland.b No land cover change through the 21st century.(refer to Table 3).c Assuming 50% of the area of degraded forest in 2000 would be converted to cropping systems by 2100. NCC, LCC, and HCC refer to no, low, and high climate change
scenarios, respectively.
Z. Tan et al. / Agriculture, Ecosystems and Environment 130 (2009) 171–176176
under the same climate conditions, to increase the N fertilizationrate would significantly increase crop yield. For instance, therewould be an increase in crop yield by 10% with N30 and 32% withN60 under NCC, accordingly, 17% and 40% under LCC, and 15% and45% under HCC. But there would be no significant differencesbetween LCC and HCC, even for individual crop species. Of the threecrops, cocoyam shows the strongest response to N fertilizationunder all climate change scenarios, especially under LCC, with agrain yield increase of 64% with N30 and 141% with N60.
3.5. Impacts of deforestation on ecosystem C budgets during the 21st
century
As of 2000, 34.1% of the total land area was defined as degradedforest (Table 1). If 50% of degraded forest area is converted tocropland by 2100, the ecosystem C stock in the degraded forest-derived cropland would decrease by about 42% under NCC, 44%under LCC, and 46% under HCC (Table 5). SOC losses from this kindof cropland would amount up to 24%, 30%, and 31%, respectively,whereas SOC losses from the degraded forest could be only 0%, 2%,and 3%, respectively. Consequently, for the whole study area, theecosystem C losses are about 9% more with land cover change thanwithout land cover change, accordingly, the SOC losses are 4% more(calculated from the numbers presented in the bottom two rows inTable 5). The SOC loss would be 2.0–2.5% higher from the newcropland (Table 5) than from the old cropland (see Table 4 with4 kg N ha�1 fertilization rate). This increased SOC loss can beattributed to higher antecedent SOC stock level in the degradedforest-derived cropland (44.9 Mg C ha�1 in the new cropland,while 40.0 Mg C ha�1 in the old cropland in 2000), and the actualrates of C emissions would be as high as 110 kg C ha�1 year�1
under NCC and 140 kg C ha�1 year�1 under both LCC and HCC.
4. Conclusion
The trend of significant C emissions from the forest-derivedcropland in the 20th century would continue through the 21stcentury regardless of climate change scenario but can be partiallyoffset by N fertilization. Lack of N replenishment for soil Ndepletion would be the major constraint on crop production in thefuture. To increase N fertilizer input would be one of vital adaptivemeasures to ensure food security and maintain agriculturalsustainability through the 21st century even though the effectof the fertilization on enhancing C sequestration could be largelyoffset by the adverse impact of progressive warming and dryingstresses. Meanwhile current cropping systems can be optimized tofully use the rainfall resource in the study area. The LULC changeshave a stronger influence on ecosystem C budgets than theprojected climate change scenarios in the study area.
Acknowledgments
The work presented here was part of SEMSOC(AEGP00030001300) funded by the U.S. Agency for InternationalDevelopment (USAID)/Climate Change Program, Bureaus forEconomic Growth, Agriculture, and Trade (EGAT) and Africa.Zhengxi Tan was supported under USGS contract 08HQCN0007.
References
DeFries, R.S., Houghton, R.A., Hansen, M.C., Field, C.B., Skole, D., Townshend, J., 2002.Carbon emissions from tropical deforestation and regrowth based on satelliteobservations for the 1980s and 1990s. Proceedings of the National Academy ofSciences U.S.A. 99, 14256–14261.
EarthTrends, 2003. EarthTrends Country Profile, available at http://earthstrends.-wri.org/.
Field, C.B., Lobell, D.B., Peters, H.A., Chiariello, N.R., 2007. Feedbacks of terrestrialecosystems to climate change. Annual Review of Environment and Resources32, 1–29.
Ghana Environmental Protection Agency (EPA), 2000. Ghana’s Initial NationalCommunication under the United Nations Framework Convention on ClimateChange. EPA, Ghana, p. 160.
Gonzalez, P., 2001. Desertification and a shift of forest species in the West AfricanSahel. Climate Research 17, 217–228.
Guo, L.B., Gifford, R.M., 2002. Soil carbon stocks and land use change: a metaanalysis. Global Change Biology 8, 345–360.
Houghton, R.A., 2003. Revised estimates of the annual net flux of carbon to theatmosphere from changes in land use and land management 1850–2000. TellusSeries B: Chemical and Physical Meteorology 55, 378–390.
Houghton, R.A., Hackler, J.L., 2006. Emissions of carbon from land use change in sub-Saharan Africa. Journal of Geophysical Research 111, G02003.
Hulme, M., Doherty, R., Ngara, T., New, M., Lister, D., 2001. African climate change:1900–2100. Climate Research 17, 145–168.
Laurance, W., 2004. Forest–climate interactions in fragmented tropical land-scapes. Philosophical Transactions of the Royal Society of London Series B359, 345–352.
Liu, S., Kaire, M., Wood, E., Dialloc, O., Tieszen, L.L., 2004a. Impacts of land use andclimate change on carbon dynamics in south-central Senegal. Journal of AridEnvironments 59, 583–604.
Liu, S., Loveland, T.R., Kurtz, R.M., 2004b. Contemporary carbon dynamics interrestrial ecosystems in the southeastern plains of the United States. Environ-mental Management 33, S442–S456.
Nicholson, S.E., 2001. Climatic and environmental change in Africa during the pasttwo centuries. Climate Research 17, 123–144.
Parton, W.J., Schimel, D.S., Cole, C.V., Ojima, D.S., 1987. Analysis of factors control-ling soil organic matter levels in Great Plains Grasslands. Soil Science Society ofAmerican Journal 51, 1173–1179.
Paustian, K., Robertson, G.P., Elliott, E.T., 1995. Management impacts on carbonstorage and gas fluxes (CO2, CH4) in mid-latitude cropland and grasslandecosystems. In: Lal, R., Kimble, J., Levine, E., Stewart, B.A. (Eds.), Soil Manage-ment and Greenhouse Effect. Advances in Soil Science. Lewis Publishers, BocaRaton, FL, pp. 69–84.
Tan, Z., Tieszen, L.L., Tachie-Obeng, E., Liu, S., Dieye, A.M., 2009. Historical andsimulated ecosystem carbon dynamics in Ghana: land use, management, andclimate. Biogeosciences 6, 45–58.
Wigley, T.M.L., Raper, S.C.B., Salmon, M., Hulme, M., 2000. MAGICC: Model for theAssessment of Greenhouse-gas Induced Climate Change, version 2.4. ClimaticResearch Unit, Norwich, UK.
Woomer, P.L., Toure, A., Sall, M., 2004. Carbon stocks in Senegal’s Sahel transitionzone. Journal of Arid Environments 59, 499–510.