Moisture dynamics of moss-dominated surface fuel in relation to the structure of Picea abies and...
10
Moisture dynamics of moss-dominated surface fuel in relation to the structure of Picea abies and Pinus sylvestris stands Heidi Tanskanen a, * , Anders Granstro ¨m b , Ari Vena ¨la ¨inen c , Pasi Puttonen d a Department of Forest Ecology, PO Box 27, FI-00014, University of Helsinki, Finland b Department of Forest Vegetation Ecology, Swedish University of Agricultural Sciences, 901-83 Umea ˚, Sweden c Finnish Meteorological Institute, PO Box 503, FI-00101 Helsinki, Finland d Finnish Forest Research Institute, General Services, Helsinki Unit, Unioninkatu 40 A, 00170 Helsinki, Finland Received 4 May 2005; received in revised form 17 December 2005; accepted 30 January 2006 Abstract We examined moss-dominated surface fuel moisture in a southern boreal fire environment by carrying out destructive moisture sampling on 47 days in Pinus sylvestris L. stands aged 0, 15, 30, 45, and in Picea abies (L.) Karst stands aged 0, 40, and 60 years since regeneration cutting. The moss layer was found to be consistently moister under dense canopy cover, formed by either of the studied tree species, than in the respective open stands. In the most exposed stand type (clear-felled Pinus), the frequency distribution of daily surface fuel moisture was strongly skewed towards the low end, with 37% of the observations falling below 50% MC. For 45-year-old Pinus, the corresponding figure was only 7%. Moisture difference between open and closed stands increased during the latter half of fire season, probably due to increased canopy-interception of radiation with lowering sun-angle. Average surface fuel moisture correlated with effective leaf area index and canopy openness with r ranging from 0.68 to 0.84 ( p < 0.001). There was on average a two-fold difference in drying efficiency between the closed and cut-over stands. The Finnish fire risk index (a weather-based fuel moisture index that uses the data input of precipitation, solar radiation, temperature, relative humidity, and wind) predicted the average daily moisture content of surface fuels in most stand types with reasonable accuracy (R 2 : 0.56–0.98). Surface fuels reached a postulated ignition threshold moisture content of 30% and below in Pinus clear-cuts at an FFI value of 3.6, and in closed Pinus sylvestris stands at FFI 5.6, but never went below 40% in the closed P. abies stands. The results show that stand structure has a remarkable impact on surface fuel moisture regimes. Integrating spatially explicit stand data such as LAI with weather-derived fire risk indices would greatly improve moisture content predictions to the benefit of various fire management operations. # 2006 Elsevier B.V. All rights reserved. Keywords: Forest fires; Boreal forest; Surface fuel moisture; Moss; Stand structure; Picea abies; Pinus sylvestris 1. Introduction Surface fuel moisture plays a critical part in the ignition, spread, and fuel consumption properties of forest fires (Byram, 1959; Rothermel, 1972; Nelson, 2001). In dead fuels, moisture dynamics are considered to depend mostly on relative humidity, air temperature, wind, solar radiation, and precipitation (Van Wagner, 1969, 1979; Nelson, 2001) and these variables have been incorporated into most systems that predict fuel moisture (e.g. Van Wagner, 1987; Stocks et al., 1989; Vena ¨la ¨inen and Heikinheimo, 2003). Being able to provide real-time and predictive information about fuel moisture conditions with the minimal input of labor and time the weather-based fuel moisture indices have largely replaced field fuel moisture sampling in fire operations (Van Wagner, 1987; Stocks et al., 1989). Fuel moisture estimates derived solely from general weather can, however, be very different from the reality due to additional variation caused by factors such as boundary layer weather conditions (Fosberg et al., 1970; Oke, 1987; Kunkel, 2001) and the composition of fuel material (Nelson, 2001). The lack of tools for making reliable fuel moisture estimates is especially evident in the boreal European coniferous forest fire environment. In mesic boreal forests dominated by conifers Picea abies L. Karst (Norway spruce) and Pinus sylvestris L. (Scots pine), moss mixed with litter is a principal surface fuel material, and www.elsevier.com/locate/foreco Forest Ecology and Management 226 (2006) 189–198 * Corresponding author. E-mail addresses: heidi.tanskanen@helsinki.fi (H. Tanskanen), [email protected] (A. Granstro ¨m), ari.venalainen@fmi.fi (A. Vena ¨la ¨inen), pasi.puttonen@metla.fi (P. Puttonen). 0378-1127/$ – see front matter # 2006 Elsevier B.V. All rights reserved. doi:10.1016/j.foreco.2006.01.048
-
Upload
independent -
Category
Documents
-
view
0 -
download
0
Transcript of Moisture dynamics of moss-dominated surface fuel in relation to the structure of Picea abies and...
Moisture dynamics of moss-dominated surface fuel in relation to the
structure of Picea abies and Pinus sylvestris stands
Heidi Tanskanen a,*, Anders Granstrom b, Ari Venalainen c, Pasi Puttonen d
a Department of Forest Ecology, PO Box 27, FI-00014, University of Helsinki, Finlandb Department of Forest Vegetation Ecology, Swedish University of Agricultural Sciences, 901-83 Umea, Sweden
c Finnish Meteorological Institute, PO Box 503, FI-00101 Helsinki, Finlandd Finnish Forest Research Institute, General Services, Helsinki Unit, Unioninkatu 40 A, 00170 Helsinki, Finland
Received 4 May 2005; received in revised form 17 December 2005; accepted 30 January 2006
Abstract
We examined moss-dominated surface fuel moisture in a southern boreal fire environment by carrying out destructive moisture sampling on 47
days in Pinus sylvestris L. stands aged 0, 15, 30, 45, and in Picea abies (L.) Karst stands aged 0, 40, and 60 years since regeneration cutting. The
moss layer was found to be consistently moister under dense canopy cover, formed by either of the studied tree species, than in the respective open
stands. In the most exposed stand type (clear-felled Pinus), the frequency distribution of daily surface fuel moisture was strongly skewed towards
the low end, with 37% of the observations falling below 50% MC. For 45-year-old Pinus, the corresponding figure was only 7%. Moisture
difference between open and closed stands increased during the latter half of fire season, probably due to increased canopy-interception of radiation
with lowering sun-angle. Average surface fuel moisture correlated with effective leaf area index and canopy openness with r ranging from�0.68 to
�0.84 ( p < 0.001). There was on average a two-fold difference in drying efficiency between the closed and cut-over stands. The Finnish fire risk
index (a weather-based fuel moisture index that uses the data input of precipitation, solar radiation, temperature, relative humidity, and wind)
predicted the average daily moisture content of surface fuels in most stand types with reasonable accuracy (R2: 0.56–0.98). Surface fuels reached a
postulated ignition threshold moisture content of 30% and below in Pinus clear-cuts at an FFI value of 3.6, and in closed Pinus sylvestris stands at
FFI 5.6, but never went below 40% in the closed P. abies stands. The results show that stand structure has a remarkable impact on surface fuel
moisture regimes. Integrating spatially explicit stand data such as LAI with weather-derived fire risk indices would greatly improve moisture
content predictions to the benefit of various fire management operations.
# 2006 Elsevier B.V. All rights reserved.
Keywords: Forest fires; Boreal forest; Surface fuel moisture; Moss; Stand structure; Picea abies; Pinus sylvestris
www.elsevier.com/locate/foreco
Forest Ecology and Management 226 (2006) 189–198
1. Introduction
Surface fuel moisture plays a critical part in the ignition,
spread, and fuel consumption properties of forest fires (Byram,
1959; Rothermel, 1972; Nelson, 2001). In dead fuels, moisture
dynamics are considered to depend mostly on relative humidity,
air temperature, wind, solar radiation, and precipitation (Van
Wagner, 1969, 1979; Nelson, 2001) and these variables have
been incorporated into most systems that predict fuel moisture
(e.g. Van Wagner, 1987; Stocks et al., 1989; Venalainen and
* Corresponding author.
E-mail addresses: [email protected] (H. Tanskanen),
[email protected] (A. Granstrom), [email protected]
(A. Venalainen), [email protected] (P. Puttonen).
0378-1127/$ – see front matter # 2006 Elsevier B.V. All rights reserved.
doi:10.1016/j.foreco.2006.01.048
Heikinheimo, 2003). Being able to provide real-time and
predictive information about fuel moisture conditions with the
minimal input of labor and time the weather-based fuel
moisture indices have largely replaced field fuel moisture
sampling in fire operations (Van Wagner, 1987; Stocks et al.,
1989). Fuel moisture estimates derived solely from general
weather can, however, be very different from the reality due to
additional variation caused by factors such as boundary layer
weather conditions (Fosberg et al., 1970; Oke, 1987; Kunkel,
2001) and the composition of fuel material (Nelson, 2001). The
lack of tools for making reliable fuel moisture estimates is
especially evident in the boreal European coniferous forest fire
environment.
In mesic boreal forests dominated by conifers Picea abies L.
Karst (Norway spruce) and Pinus sylvestris L. (Scots pine),
moss mixed with litter is a principal surface fuel material, and
H. Tanskanen et al. / Forest Ecology and Management 226 (2006) 189–198190
live vascular plants such as Vaccinium sp. dwarf shrubs
typically constitute only a minor part of total fuel quantity (Van
Wagner, 1983; Schimmel and Granstrom, 1997). Boreal forest
mosses have high surface-to-volume ratios of 115–135 cm�1
which make them very flammable (Brown, 1970; Norum, 1982;
Schimmel and Granstrom, 1997) and sensitive to changes in
atmospheric conditions (Fons, 1950). Due to lack of roots and
stomatal control mosses are highly dependent on incoming
precipitation in their moisture acquisition and prone to rapid
desiccation in the absence of rain (Proctor, 1981; Zotz et al.,
2000). In vascular plants, moisture content typically presents
slow seasonal changes as a result of phenological processes
(Nelson, 2001) and little short-term variation. Live moss
moisture dynamics thus resemble more those occurring in fine
dead forest fuels (Norum, 1982), the main difference being the
higher maximum moisture holding capacity, approximately
500–600% (dry weight basis) (Dilks and Proctor, 1979;
Granstrom and Schimmel, 1998), in comparison to 250% of
fine dead fuels like conifer needles and twigs (Simard, 1968).
The moisture regimes of the forest floor may vary
remarkably due to the influence of canopies (Chen et al.,
1999; Kunkel, 2001). A closed canopy, whether created by trees
or understory vegetation, reduces the amount of precipitation
reaching the forest floor (e.g. Lukkala, 1942; Oke, 1987). On
the other hand, the net radiation, considered the primary factor
sustaining drying, is below the canopy only a fraction of that
above the canopy (e.g. Baldocchi and Vogel, 1996). Addition-
ally, the canopy abates evaporation in the surface fuel layer by
reducing the ventilation of the forest floor by the wind (Raynor,
1971; Kunkel, 2001).
Little information exists on surface fuel moisture dynamics
in boreal European coniferous forests. This is a severe problem
both for fire control operations and prescribed burning which
today is becoming increasingly used as a forest management
tool to maintain biological diversity (Granstrom, 2001;
Kuuluvainen et al., 2002). The aim of this study is to map
and analyze surface fuel moisture dynamics in P. abies and
Pinus sylvestris stands at different stages of stand succession.
The observed moisture contents are linked to a fire-weather
Table 1
Structural characteristics of the study plots
Stand typea
(no. of plots)
Stand height
(m)/canopy depth (m)
DBH (cm) Stocking/opennessb
ha�1 %
Picea_0 (3) 0/0 – 0 74.4
Picea_40 (3) 15.6/9.6 15.9 1170 6.5
Picea_60 (2) 21.3/11.6 21.4 720 8.9
Pinus_0 (2) 0/0 – 0 60.2
Pinus_15 (3) 4.6/3.8 7.2 760 44.3
Pinus_30 (3) 12.2/5.1 12.4 2000 11.7
Pinus_45 (3) 18.1/5.7 18.4 850 14.1
a Picea indicates the dominance (>85% of the basal area) of Picea abies, Pinus the
passed since the last regeneration cutting.b The percentage of open sky as seen from beneath a forest canopy, calculated uc The cover percentages of total field layer vegetation (the dominant species indi
Vaccinium myrtillus L., (3) Vaccinium vitis-idaea L.), mosses and litter on the ford The depth and the dry matter fuel loads of the litter and moss layer, measured
index called the Finnish Fire Risk Index (hereafter, referred to
as FFI) which is a system calculating fuel moisture in boreal fire
environment as a function of precipitation, solar radiation,
temperature, relative humidity, and wind (Heikinheimo et al.,
1998; Venalainen and Heikinheimo, 2003) without the effect of
canopy cover on drying or wetting processes. The findings will
serve prescribed burning activities and wildfire risk assess-
ments, by providing more accurate fuel moisture predictions as
modified by stand structure.
2. Methods
2.1. Study site
The field data was collected in the southern boreal
coniferous forest zone (Ahti et al., 1968) in southern Finland
in the districts of Lammi and Padasjoki (618120N, 258070E;
140–180 m above sea level) within a total area of
30 km � 30 km. In the study region, Pinus sylvestris dominates
on 57% and P. abies on 32% of the forest land area (Finnish
Forest Research Institute, 2000). Average annual precipitation
is 631, 250 mm of which falls as snow. The mean annual
temperature is 3.9 8C and snow cover is normally present from
early December to mid-April (Drebs et al., 2002). The length of
the growing season is approximately 168 days (Drebs et al.,
2002). In July, the mean temperature is 16.2 8C and average
monthly rainfall 81 mm.
In April and May 2001, 24 experimental plots (40 m �40 m) were established in Pinus sylvestris stands of 0, 15, 30,
and 45 years of age after regeneration cutting and in P. abies
stands of 0, 40, and 60 years of age (Table 1). Site-species
composition was chosen to be consistent with the traditional
Finnish site type classifications: Pinus sylvestris on xeric to
sub-xeric, low nutrient soils and P. abies on mesic, medium
fertile soils (Cajander, 1926). Stand age classes were chosen to
present the widest available variation in canopy cover and stand
structure (Fig. 1). Paludified depressions, ditches, and slopes
(inclination > 5%) were excluded on the map before random
plot placement.
Field layerc
(%)
Mossc
(%)
Litterc
(%)
Fueld depth
(cm)
Fueld load
(kg m�2)
37.6 (1) 54 44.4 1.9 1.01
10.5 (2) 97 18.2 4.1 1.37
28.7 (2) 84 20.5 4.5 1.18
18.4 (3) 76 31.8 1.9 1.03
19.2 (3) 80 25.4 – 0.96
9.7 (3) 98 15.2 4.5 0.98
14.3 (3) 93 12.8 4.0 1.09
dominance of Pinus sylvestris. The numbers 0–60 in the titles refer to the years
sing fisheye photos.
cated with the number in parentheses: (1) Deschampsia flexuosa (L.) Trin., (2)
est floor.
and calculated based on the moisture samples of summer 2001.
H. Tanskanen et al. / Forest Ecology and Management 226 (2006) 189–198 191
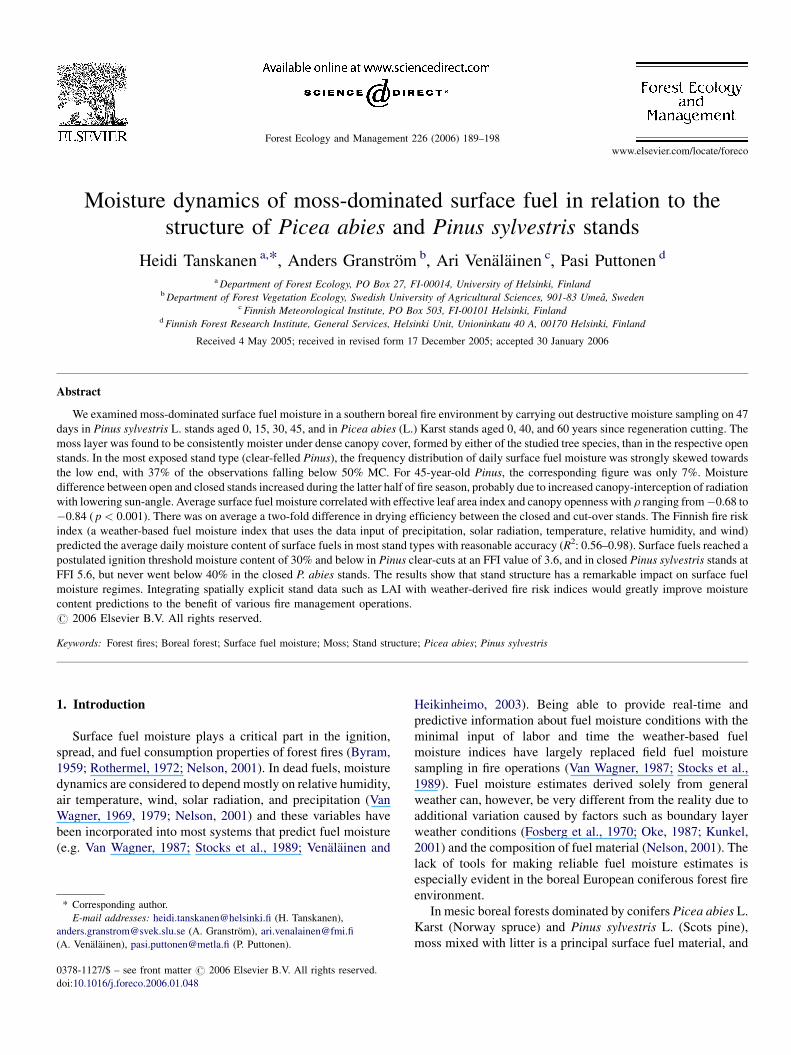
Fig. 1. Examples of canopy cover in the experimental stands, presented as the Gap Light Analyzer working images of hemispherical photos. (A) A total clear-cut of
Picea (Picea_0), (B) a clear-cut of Pinus with a few mature seed trees left on the site (Pinus_0), (C) a thinned, 18-m-tall Pinus stand (Pinus_45) and (D) a dense 16-m-
tall Picea stand (Picea_40). Original photos: Ilkka Taponen, Finnish Forest Research Institute.
In each plot, diameter at breast height (DBH) was recorded
with a caliper on every tree having DBH of 5.0 cm or greater. The
tree height and the height of the lower canopy limit were defined
from every 5th tree in a diameter class using a hypsometer
(Forestor Vertex, Forestor Instrument AB, Sweden). Hemi-
spherical photographs were taken of the canopy in five
systematically placed locations. The coverage (%) of surface
vegetation (Pakarinen, 1984) and litter/cutting residual were
inventoried in each plot on six to nine systematically placed
quadrates of 0.5 m � 0.5 m. The depth of the litter–moss layer
(cm) (Table 1) down to the fermentation boundary layer was
measured in August 2001 for all stand types except Pinus_15.
Average DBH (cm) and stand dominant height (m) were
calculated for seven stand types defined by dominant tree
species and stand age (Table 1). Canopy depth (m) was defined
as the average difference between the tree height and the height
of the crown base. Estimates of site canopy openness (%) and
effective leaf area index were produced using fisheye
photographs and Gap Light Analyzer (GLA) imaging software
Version 2.0 (Frazer et al., 1999). Cover percentages of moss,
litter, and the field vegetation, as an average of all observed field
Table 2
The pair-wise t-test comparisons of surface fuel moisture contents between differe
Compared stands Mean S.D. S.E. 9
o
L
Picea_60 � Picea_40 �6.879 60.618 8.660
Picea_60 � Picea_0 98.200 87.315 12.474
Picea_60 � Pinus_45 8.733 73.332 10.371
Picea_60 � Pinus_30 �34.069 71.398 10.200
Picea_60 � Pinus_0 102.506 88.754 12.811
Picea_40 � Picea_0 104.224 84.703 12.226
Picea_40 � Pinus_45 18.285 54.417 7.774
Picea_40 � Pinus_30 �27.190 64.500 9.214
Picea_40 � Pinus_0 111.499 80.271 11.586
Picea_0 � Pinus_45 �89.112 92.041 13.149 �Picea_0 � Pinus_30 �131.823 107.646 15.537 �Picea_0 � Pinus_0 4.616 77.221 11.264
Pinus_45 � Pinus_30 �45.335 60.881 8.136
Pinus_45 � Pinus_0 92.522 60.983 8.223
Pinus_30 � Pinus_0 135.163 82.219 10.987
Picea indicates the dominance (>85% of the basal area) of Picea abies, Pinus the d
passed since the last regeneration cutting. Mean = mean difference of fuel moistur* Significant difference.
layer species pooled, were calculated for each stand type
(Table 1).
2.2. Moisture sampling
Surface fuel moisture sampling was carried out during the
period of 5 June–29 August 2001 between 11:00 and 15:00 h
(solar time) in seven types of stands with two to five replicates
(Table 2) weekends and rainy afternoons excluded. There were
47 sampling days for all stand types except Pinus_15 which was
excluded from the scheme for the last month. To extract
moisture content information, samples 15 cm � 15 cm in
surface area, consisting of litter, green and brown parts of
the growing moss down to the more compact humus layer, were
cut in randomly chosen position on each plot, and sealed in
plastic bags. Field moisture content (hereafter referred to as
MC) was calculated on dry-weight basis based on differences
between the fresh and dry (after 24 h at 105 8C) weights of
entire sample contents. The litter–moss fuel loads (kg m�2)
were derived relating average stand-specific dry-matter values
to the sample size (Table 1).
nt stand types
5% Confidence interval
f the difference
t d.f. Significance
(two-tailed)
ower Upper
�24.291 10.533 �0.794 48 0.431
73.120 123.280 7.873 48 0.000*
�12.107 29.574 0.842 49 0.404
�54.577 �13.562 �3.340 48 0.002*
76.734 128.277 8.002 47 0.000*
79.628 128.819 8.525 47 0.000*
2.654 33.915 2.352 48 0.023*
�45.717 �8.664 �2.951 48 0.005*
88.191 134.808 9.624 47 0.000*
115.550 �62.675 �6.777 48 0.000*
163.080 �100.566 �8.484 47 0.000*
�18.057 27.289 0.410 46 0.684
�61.639 �29.031 �5.572 55 0.000*
76.036 109.008 11.252 54 0.000*
113.145 157.181 12.302 55 0.000*
ominance of Pinus sylvestris. The numbers 0–60 in the titles refer to the years
e (MC%), S.D. = standard deviation, S.E. = standard error.
H. Tanskanen et al. / Forest Ecology and Management 226 (2006) 189–198192
2.3. Weather data and the Finnish fire risk index
The weather data were acquired from the meteorological
station network of the Finnish Meteorological Institute (http://
www.fmi.fi/weather/stations.html, Venalainen and Heikin-
heimo, 2002). The network uses automatic stations of type
MILOS 500 equipped with standard instruments used by
national meteorological services (manufactured by Vaisala,
Vantaa, Finland). Precipitation measurements are sent to
climatological database daily by about 200 stations and
3-hourly precipitation values are calculated from the daily
values with the help of synoptic weather observations made at
the nearest available station. Air temperature, air humidity and
wind speed observations are available from about 160 stations.
Direct solar radiation measurements are being received from
about 20 stations and indirect radiation estimates from about
40 stations making cloud observations (Venalainen and
Heikinheimo, 2002). The distance between the nearest weather
station and our study sites was 5–20 km, the three next closest
weather stations being located within 40–60 km radius from
the study area.
Weather measurements were interpolated to our study area
from the total station network using the spatial statistics method
of kriging (Ripley, 1981) with a program especially designed
for climatological applications in forestry (Henttonen, 1991).
The method has been previously used in many studies and
proved to provide reasonably good local estimates of most
weather variables. In a sensitivity test study, where climato-
logical parameters sampled by the network stations were
interpolated onto a 1 km � 1 km grid in northern Finland where
the between-station distances are higher, the error in the case of
average summer daily mean temperature varied between �0.6
and +0.6 8C with an RMS error of 0.3 8C (Vajda and
Venalainen, 2003). The interpolation of precipitation, however,
has been found to be more problematic due to the nature of local
rain showers that can cause very high and abruptly changing
spatial variation. The calculation has been observed to create
systematic error in the interpolated values because the method
cuts off the peak values when the measured precipitation values
are above 10 mm/day (Venalainen et al., 2005). To improve the
accuracy of precipitation observations, eight rain collectors
were located within the 30 km � 30 km study area in the
proximity of the study plots and monitored daily at noon to
control the spatial variation of precipitation and eliminate the
disturbance of the local rain showers in the data series. If large
differences in timing or amount occurred between locally
recorded and interpolated precipitation, the respective moisture
observations were excluded from the fire risk index-analysis.
Local precipitation values were used in stand-specific fuel
wetting-analysis.
Fire weather conditions were evaluated using the Finnish
fire risk index (FFI), a system designed to estimate the
volumetric moisture content of organic layer (a 6-cm-deep
fuel layer consisting of litter, moss, and humus) in clear-cut
areas as a function of precipitation and evaporation
(Heikinheimo et al., 1998; Venalainen and Heikinheimo,
2003). The FFI uses the input of air temperature, relative
humidity, 10-m wind, and surface net radiation for fuel drying
and precipitation for fuel wetting. Fuel drying is modeled as a
function of potential evaporation, calculated using Penman–
Monteith equation for evapotranspiration (Monteith, 1981)
with the surface resistance parameter set to zero. The FFI is
scaled to range 1.0–6.0, 1.0 indicating the lowest possible fire
risk (usually occurs after snowmelt or heavy long-term rain)
and 6.0 conditions of the highest fire risk that occur only rarely,
after a prolonged drought. FFI is calculated during fire season
every 3 h; in this study, we used the FFI values for noon.
Because the FFI evaluates moisture content in a fairly thick
surface fuel layer it is more likely a tool for estimating
expected ignition potential and fuel consumption than fire
spread (Stocks et al., 1989). Due to the large potential
absorbance volume of the deep fuel layer feature, the FFI tends
to overestimate fire risk following shallow precipitation events
(Tanskanen et al., unpublished data).
2.4. Analysis
The range and frequency distribution of MC during the
study season were calculated for each stand type. The MC
status differences were analyzed using paired sample t-tests of
the SPSS program, version 10 (SPSS Inc., Chicago, IL). In the
analysis, averaged moisture observations of each stand type
were paired with average moisture observed on respective
dates in every other stand type resulting in 15 pair-wise
comparisons (Pinus_15 was excluded from the comparisons
because this stand type had less than 40 sampling days which
could have weakened the quality of the analysis). The
assumptions of paired t-test were reasonably well met due
to the large sample size (Moore and McCabe, 1989) which
ranged 46–56 in the different strings. Due to the nature of the
observed phenomenon all the data series contained simulta-
neous temporal autocorrelation (stands were drying and
wetting simultaneously). Significant autocorrelation has
potential to seriously impair the results of t-test analysis by
overestimating the difference between the variables. The
impact of the autocorrelation on our results was examined by
comparing each paired t-test result to the time series graph of
the respective pair of stands (e.g. Fig. 2). The results of the
statistical analysis appeared to be in good concordance with the
original data and correctly indicating large, small, or non-
existent difference. Therefore, no corrections were applied to
standard paired samples t-test of SPSS 10. Correlation analysis
was used to search for dependency between the average plot-
wise MC (as sub-sets of June, July, August, and total season)
and corresponding stand characteristics: canopy openness, leaf
area index, and canopy depth.
Based on precipitation records, 15 drying and 28 wetting
sequences (24-h periods containing observations of two
subsequent days) were extracted from the total dataset. The
24-h change in MC status was calculated for all stand types by
subtracting the observed MC value of an afternoon (n) from the
MC recorded on the previous afternoon (n � 1). Changes were
analyzed using both MC % values as well as MC as mm of
water, derived using the information on the surface area and the
H. Tanskanen et al. / Forest Ecology and Management 226 (2006) 189–198 193
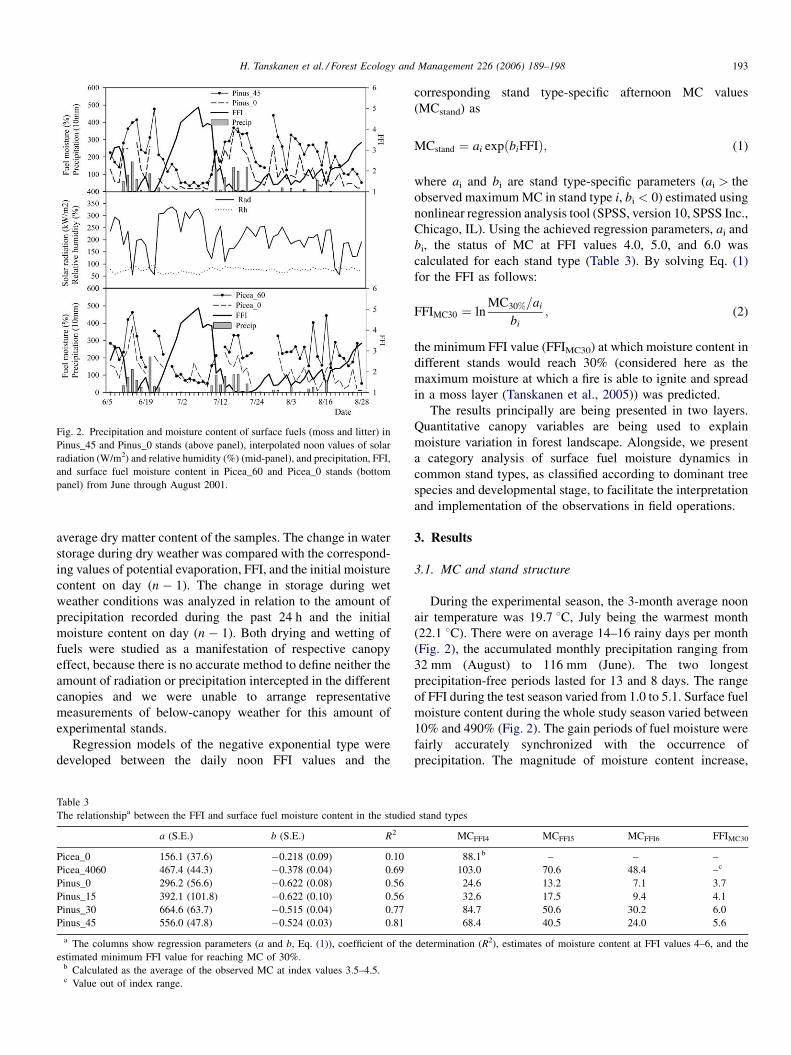
Fig. 2. Precipitation and moisture content of surface fuels (moss and litter) in
Pinus_45 and Pinus_0 stands (above panel), interpolated noon values of solar
radiation (W/m2) and relative humidity (%) (mid-panel), and precipitation, FFI,
and surface fuel moisture content in Picea_60 and Picea_0 stands (bottom
panel) from June through August 2001.
average dry matter content of the samples. The change in water
storage during dry weather was compared with the correspond-
ing values of potential evaporation, FFI, and the initial moisture
content on day (n � 1). The change in storage during wet
weather conditions was analyzed in relation to the amount of
precipitation recorded during the past 24 h and the initial
moisture content on day (n � 1). Both drying and wetting of
fuels were studied as a manifestation of respective canopy
effect, because there is no accurate method to define neither the
amount of radiation or precipitation intercepted in the different
canopies and we were unable to arrange representative
measurements of below-canopy weather for this amount of
experimental stands.
Regression models of the negative exponential type were
developed between the daily noon FFI values and the
able 3
he relationshipa between the FFI and surface fuel moisture content in the studied stand types
a (S.E.) b (S.E.) R2 MCFFI4 MCFFI5 MCFFI6 FFIMC30
icea_0 156.1 (37.6) �0.218 (0.09) 0.10 88.1b – – –
icea_4060 467.4 (44.3) �0.378 (0.04) 0.69 103.0 70.6 48.4 –c
inus_0 296.2 (56.6) �0.622 (0.08) 0.56 24.6 13.2 7.1 3.7
inus_15 392.1 (101.8) �0.622 (0.10) 0.56 32.6 17.5 9.4 4.1
inus_30 664.6 (63.7) �0.515 (0.04) 0.77 84.7 50.6 30.2 6.0
inus_45 556.0 (47.8) �0.524 (0.03) 0.81 68.4 40.5 24.0 5.6
a The columns show regression parameters (a and b, Eq. (1)), coefficient of the determination (R2), estimates of moisture content at FFI values 4–6, and the
stimated minimum FFI value for reaching MC of 30%.b Calculated as the average of the observed MC at index values 3.5–4.5.c Value out of index range.
T
T
P
P
P
P
P
P
e
corresponding stand type-specific afternoon MC values
(MCstand) as
MCstand ¼ ai expðbiFFIÞ; (1)
where ai and bi are stand type-specific parameters (ai > the
observed maximum MC in stand type i, bi < 0) estimated using
nonlinear regression analysis tool (SPSS, version 10, SPSS Inc.,
Chicago, IL). Using the achieved regression parameters, ai and
bi, the status of MC at FFI values 4.0, 5.0, and 6.0 was
calculated for each stand type (Table 3). By solving Eq. (1)
for the FFI as follows:
FFIMC30 ¼ lnMC30%=ai
bi; (2)
the minimum FFI value (FFIMC30) at which moisture content in
different stands would reach 30% (considered here as the
maximum moisture at which a fire is able to ignite and spread
in a moss layer (Tanskanen et al., 2005)) was predicted.
The results principally are being presented in two layers.
Quantitative canopy variables are being used to explain
moisture variation in forest landscape. Alongside, we present
a category analysis of surface fuel moisture dynamics in
common stand types, as classified according to dominant tree
species and developmental stage, to facilitate the interpretation
and implementation of the observations in field operations.
3. Results
3.1. MC and stand structure
During the experimental season, the 3-month average noon
air temperature was 19.7 8C, July being the warmest month
(22.1 8C). There were on average 14–16 rainy days per month
(Fig. 2), the accumulated monthly precipitation ranging from
32 mm (August) to 116 mm (June). The two longest
precipitation-free periods lasted for 13 and 8 days. The range
of FFI during the test season varied from 1.0 to 5.1. Surface fuel
moisture content during the whole study season varied between
10% and 490% (Fig. 2). The gain periods of fuel moisture were
fairly accurately synchronized with the occurrence of
precipitation. The magnitude of moisture content increase,
H. Tanskanen et al. / Forest Ecology and Management 226 (2006) 189–198194
however, seemed to be somewhat indifferent to amount of
precipitation. The longest dry period at the beginning of July
coincides with the prolonged high level of FFI values and solar
radiation (Fig. 2). The fluctuation of FFI presented in large part
a mirror trend of the direction of fuel moisture content changes
(Fig. 2). The connection between the magnitude of FFI changes
and the amount of precipitation remained difficult to evaluate
because precipitation events were somewhat clustered affecting
other observations (Fig. 2).
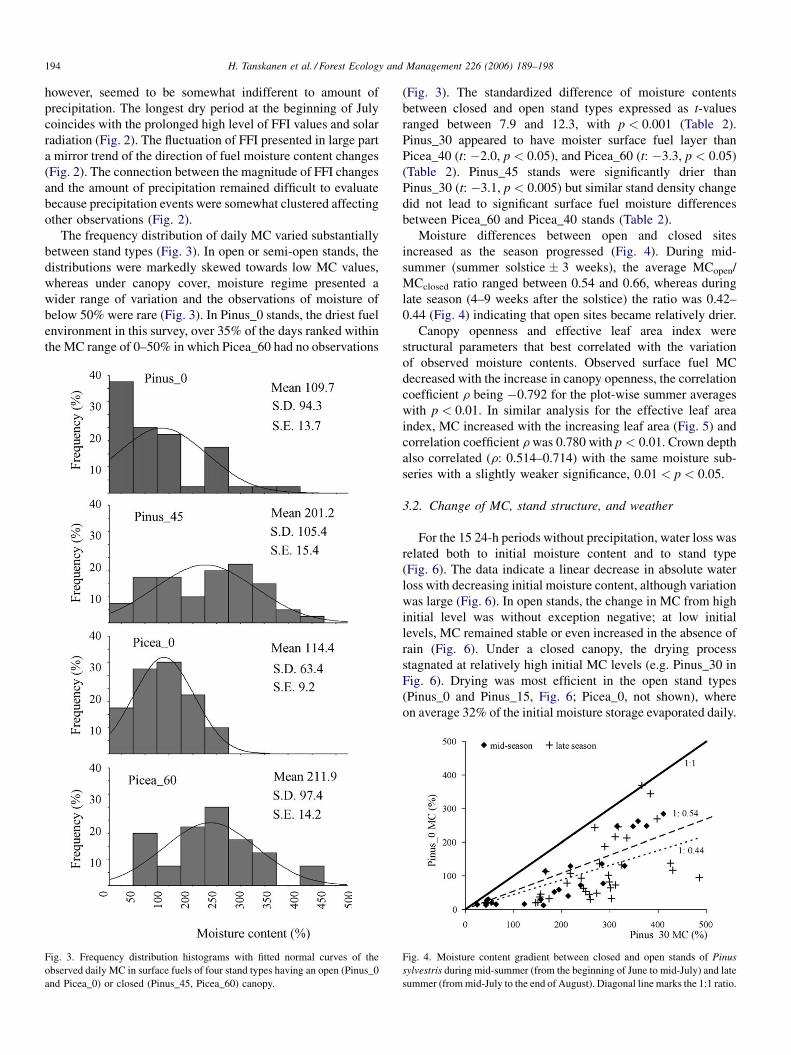
The frequency distribution of daily MC varied substantially
between stand types (Fig. 3). In open or semi-open stands, the
distributions were markedly skewed towards low MC values,
whereas under canopy cover, moisture regime presented a
wider range of variation and the observations of moisture of
below 50% were rare (Fig. 3). In Pinus_0 stands, the driest fuel
environment in this survey, over 35% of the days ranked within
the MC range of 0–50% in which Picea_60 had no observations
Fig. 3. Frequency distribution histograms with fitted normal curves of the
observed daily MC in surface fuels of four stand types having an open (Pinus_0
and Picea_0) or closed (Pinus_45, Picea_60) canopy.
(Fig. 3). The standardized difference of moisture contents
between closed and open stand types expressed as t-values
ranged between 7.9 and 12.3, with p < 0.001 (Table 2).
Pinus_30 appeared to have moister surface fuel layer than
Picea_40 (t: �2.0, p < 0.05), and Picea_60 (t: �3.3, p < 0.05)
(Table 2). Pinus_45 stands were significantly drier than
Pinus_30 (t: �3.1, p < 0.005) but similar stand density change
did not lead to significant surface fuel moisture differences
between Picea_60 and Picea_40 stands (Table 2).
Moisture differences between open and closed sites
increased as the season progressed (Fig. 4). During mid-
summer (summer solstice � 3 weeks), the average MCopen/
MCclosed ratio ranged between 0.54 and 0.66, whereas during
late season (4–9 weeks after the solstice) the ratio was 0.42–
0.44 (Fig. 4) indicating that open sites became relatively drier.
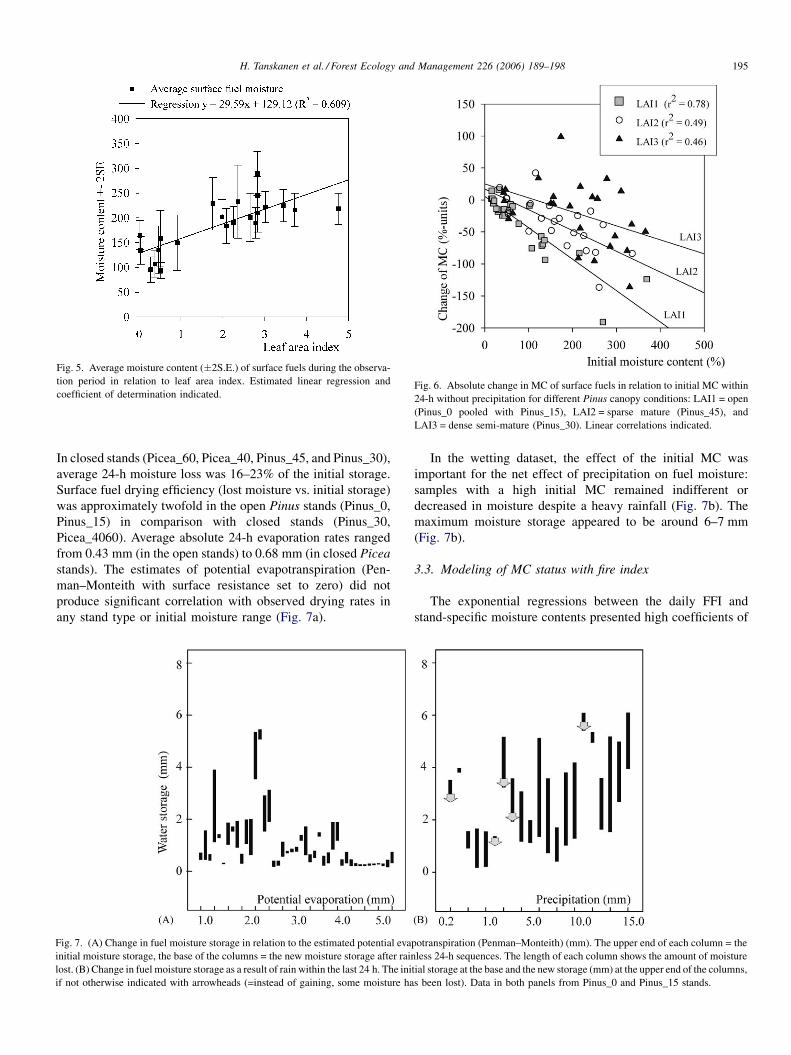
Canopy openness and effective leaf area index were
structural parameters that best correlated with the variation
of observed moisture contents. Observed surface fuel MC
decreased with the increase in canopy openness, the correlation
coefficient r being �0.792 for the plot-wise summer averages
with p < 0.01. In similar analysis for the effective leaf area
index, MC increased with the increasing leaf area (Fig. 5) and
correlation coefficient r was 0.780 with p < 0.01. Crown depth
also correlated (r: 0.514–0.714) with the same moisture sub-
series with a slightly weaker significance, 0.01 < p < 0.05.
3.2. Change of MC, stand structure, and weather
For the 15 24-h periods without precipitation, water loss was
related both to initial moisture content and to stand type
(Fig. 6). The data indicate a linear decrease in absolute water
loss with decreasing initial moisture content, although variation
was large (Fig. 6). In open stands, the change in MC from high
initial level was without exception negative; at low initial
levels, MC remained stable or even increased in the absence of
rain (Fig. 6). Under a closed canopy, the drying process
stagnated at relatively high initial MC levels (e.g. Pinus_30 in
Fig. 6). Drying was most efficient in the open stand types
(Pinus_0 and Pinus_15, Fig. 6; Picea_0, not shown), where
on average 32% of the initial moisture storage evaporated daily.
Fig. 4. Moisture content gradient between closed and open stands of Pinus
sylvestris during mid-summer (from the beginning of June to mid-July) and late
summer (from mid-July to the end of August). Diagonal line marks the 1:1 ratio.
H. Tanskanen et al. / Forest Ecology and Management 226 (2006) 189–198 195
Fig. 6. Absolute change in MC of surface fuels in relation to initial MC within
24-h without precipitation for different Pinus canopy conditions: LAI1 = open
(Pinus_0 pooled with Pinus_15), LAI2 = sparse mature (Pinus_45), and
LAI3 = dense semi-mature (Pinus_30). Linear correlations indicated.
Fig. 5. Average moisture content (�2S.E.) of surface fuels during the observa-
tion period in relation to leaf area index. Estimated linear regression and
coefficient of determination indicated.
In closed stands (Picea_60, Picea_40, Pinus_45, and Pinus_30),
average 24-h moisture loss was 16–23% of the initial storage.
Surface fuel drying efficiency (lost moisture vs. initial storage)
was approximately twofold in the open Pinus stands (Pinus_0,
Pinus_15) in comparison with closed stands (Pinus_30,
Picea_4060). Average absolute 24-h evaporation rates ranged
from 0.43 mm (in the open stands) to 0.68 mm (in closed Picea
stands). The estimates of potential evapotranspiration (Pen-
man–Monteith with surface resistance set to zero) did not
produce significant correlation with observed drying rates in
any stand type or initial moisture range (Fig. 7a).
Fig. 7. (A) Change in fuel moisture storage in relation to the estimated potential eva
initial moisture storage, the base of the columns = the new moisture storage after rain
lost. (B) Change in fuel moisture storage as a result of rain within the last 24 h. The ini
if not otherwise indicated with arrowheads (=instead of gaining, some moisture ha
In the wetting dataset, the effect of the initial MC was
important for the net effect of precipitation on fuel moisture:
samples with a high initial MC remained indifferent or
decreased in moisture despite a heavy rainfall (Fig. 7b). The
maximum moisture storage appeared to be around 6–7 mm
(Fig. 7b).
3.3. Modeling of MC status with fire index
The exponential regressions between the daily FFI and
stand-specific moisture contents presented high coefficients of
potranspiration (Penman–Monteith) (mm). The upper end of each column = the
less 24-h sequences. The length of each column shows the amount of moisture
tial storage at the base and the new storage (mm) at the upper end of the columns
s been lost). Data in both panels from Pinus_0 and Pinus_15 stands.
,
H. Tanskanen et al. / Forest Ecology and Management 226 (2006) 189–198196
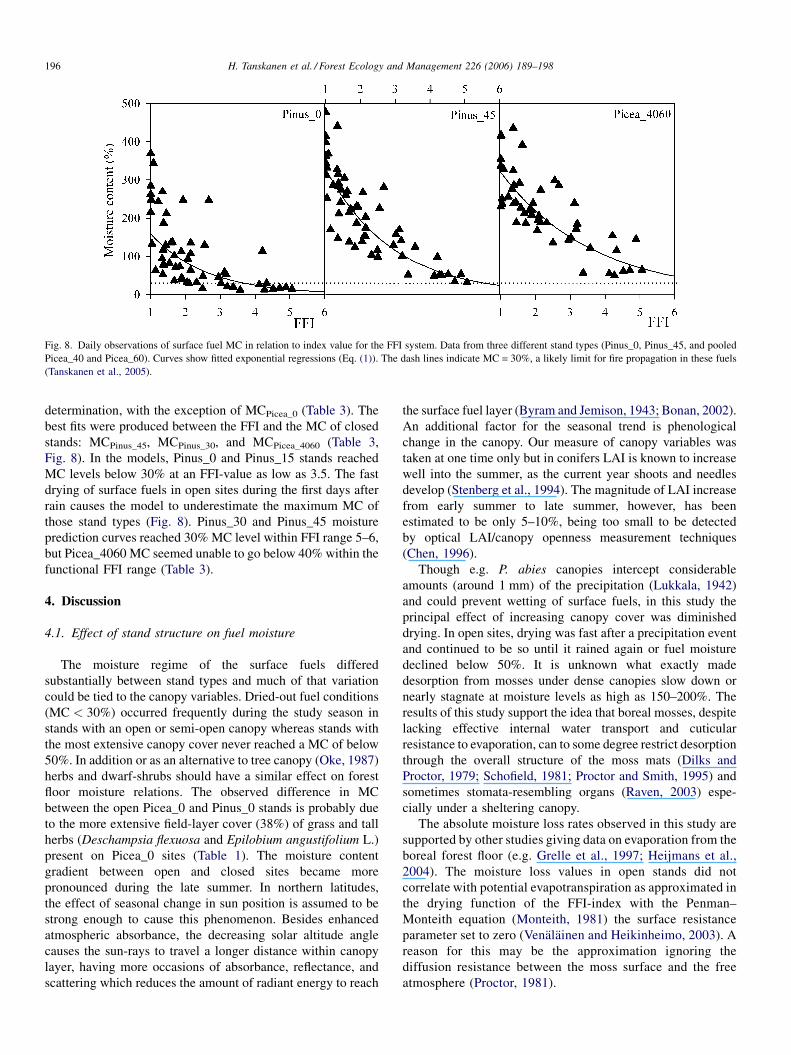
Fig. 8. Daily observations of surface fuel MC in relation to index value for the FFI system. Data from three different stand types (Pinus_0, Pinus_45, and pooled
Picea_40 and Picea_60). Curves show fitted exponential regressions (Eq. (1)). The dash lines indicate MC = 30%, a likely limit for fire propagation in these fuels
(Tanskanen et al., 2005).
determination, with the exception of MCPicea_0 (Table 3). The
best fits were produced between the FFI and the MC of closed
stands: MCPinus_45, MCPinus_30, and MCPicea_4060 (Table 3,
Fig. 8). In the models, Pinus_0 and Pinus_15 stands reached
MC levels below 30% at an FFI-value as low as 3.5. The fast
drying of surface fuels in open sites during the first days after
rain causes the model to underestimate the maximum MC of
those stand types (Fig. 8). Pinus_30 and Pinus_45 moisture
prediction curves reached 30% MC level within FFI range 5–6,
but Picea_4060 MC seemed unable to go below 40% within the
functional FFI range (Table 3).
4. Discussion
4.1. Effect of stand structure on fuel moisture
The moisture regime of the surface fuels differed
substantially between stand types and much of that variation
could be tied to the canopy variables. Dried-out fuel conditions
(MC < 30%) occurred frequently during the study season in
stands with an open or semi-open canopy whereas stands with
the most extensive canopy cover never reached a MC of below
50%. In addition or as an alternative to tree canopy (Oke, 1987)
herbs and dwarf-shrubs should have a similar effect on forest
floor moisture relations. The observed difference in MC
between the open Picea_0 and Pinus_0 stands is probably due
to the more extensive field-layer cover (38%) of grass and tall
herbs (Deschampsia flexuosa and Epilobium angustifolium L.)
present on Picea_0 sites (Table 1). The moisture content
gradient between open and closed sites became more
pronounced during the late summer. In northern latitudes,
the effect of seasonal change in sun position is assumed to be
strong enough to cause this phenomenon. Besides enhanced
atmospheric absorbance, the decreasing solar altitude angle
causes the sun-rays to travel a longer distance within canopy
layer, having more occasions of absorbance, reflectance, and
scattering which reduces the amount of radiant energy to reach
the surface fuel layer (Byram and Jemison, 1943; Bonan, 2002).
An additional factor for the seasonal trend is phenological
change in the canopy. Our measure of canopy variables was
taken at one time only but in conifers LAI is known to increase
well into the summer, as the current year shoots and needles
develop (Stenberg et al., 1994). The magnitude of LAI increase
from early summer to late summer, however, has been
estimated to be only 5–10%, being too small to be detected
by optical LAI/canopy openness measurement techniques
(Chen, 1996).
Though e.g. P. abies canopies intercept considerable
amounts (around 1 mm) of the precipitation (Lukkala, 1942)
and could prevent wetting of surface fuels, in this study the
principal effect of increasing canopy cover was diminished
drying. In open sites, drying was fast after a precipitation event
and continued to be so until it rained again or fuel moisture
declined below 50%. It is unknown what exactly made
desorption from mosses under dense canopies slow down or
nearly stagnate at moisture levels as high as 150–200%. The
results of this study support the idea that boreal mosses, despite
lacking effective internal water transport and cuticular
resistance to evaporation, can to some degree restrict desorption
through the overall structure of the moss mats (Dilks and
Proctor, 1979; Schofield, 1981; Proctor and Smith, 1995) and
sometimes stomata-resembling organs (Raven, 2003) espe-
cially under a sheltering canopy.
The absolute moisture loss rates observed in this study are
supported by other studies giving data on evaporation from the
boreal forest floor (e.g. Grelle et al., 1997; Heijmans et al.,
2004). The moisture loss values in open stands did not
correlate with potential evapotranspiration as approximated in
the drying function of the FFI-index with the Penman–
Monteith equation (Monteith, 1981) the surface resistance
parameter set to zero (Venalainen and Heikinheimo, 2003). A
reason for this may be the approximation ignoring the
diffusion resistance between the moss surface and the free
atmosphere (Proctor, 1981).
H. Tanskanen et al. / Forest Ecology and Management 226 (2006) 189–198 197
4.2. Modeling moisture development with fire weather
index
The surface fuel of the forest floor represents relatively small
water storage of around 4–6 mm, as shown from the maximum
observed MC (Fig. 6). Excessive precipitation simply sinks
deeper into the soil. The FFI index seems realistic in this respect
since in the simulations, it uses a maximal rain interception of
7 mm (Venalainen and Heikinheimo, 2003).
The results describe the general difficulty of modeling fuel
moisture conditions and fire risk on a landscape presenting wide
variety of canopy structures and fuel compositions. After only a
couple of days without rain the most exposed locations are dry
enough to burn (Fig. 8). As the dry spell continues and weather-
based fire risk estimates increase, fuel moisture under very
dense forest canopies may still remain too high to support any
fire spread (Fig. 8). Considering the simple structure of the FFI,
it provides remarkably consistent stand-specific relationships
with fuel moisture. The few deviating observations are likely
caused by the occurrence of slight rain events; since the FFI
models the moisture content of a 6-cm-thick fuel layer it reacts
only weakly to minor precipitation, which, however, are able to
raise the moisture content of mosses to a high level.
5. Conclusions
This study produced stand-specific thresholds of the FFI that
can have greatly improve the accuracy of fuel moisture
predictions for fire control efforts and prescribed burning. Our
results support the idea of using information on tree species and
stand age to improve the interpretation of fire-risk indices at a
landscape scale. It might be possible to merge satellite-derived
spatial information on forest composition with daily fire risk
indices, for field use in fire control operations or prescribed
burning. Attempts to produce fuel moisture and ignition potential
estimations based on satellite data have been made in other fire
environments (mainly for grasslands) with promising results
(Chuvieco et al., 2004). Development of such spatial tools for
closed boreal coniferous forests, however, requires some further
research, e.g. on more complex stand structures and the effects of
the seasonal variation of plant phenology on fuel moisture.
Acknowledgements
We thank Hanne Liukko, Pauli Pihlajamaki, Taneli Salonen,
Anni Uusi-Kuitti, and Timo Vesterinen for carrying out the fuel
moisture sampling, and the landowners (Finnish Forest
Research Institute, Hame Polytechnic, and UPM-Kymmene
Ltd.), the personnel of Vantaa Research Center of the Finnish
Forest Research Institute, project secretary Timo Heikkila
(Rescue Service, Ministry of the Interior, Finland), and
researcher Ilkka Vanha-Majamaa (Finnish Forest Research
Institute) for their contributions. This study has been financially
supported by the Finnish Fire Prevention Fund, the Finnish
Forest Research Institute, the Academy of Finland (FIRE-
project of the SUNARE Program), the Graduate School in
Forest Sciences, and a FORMAS-grant to Anders Granstrom.
References
Ahti, T., Hamet-Ahti, L., Jalas, J., 1968. Vegetation zones and their sections in
northwestern Europe. Ann. Bot. Fenn. 5, 169–211.
Baldocchi, D.D., Vogel, C.A., 1996. Energy and CO2 flux densities above and
below temperate and broadleafed forest and a boreal pine forest. Tree
Physiol. 16, 5–16.
Bonan, G., 2002. Ecological Climatology: Concepts and Applications. Cam-
bridge University Press, Cambridge, UK.
Brown, J.K., 1970. Ratios of surface area to volume for common fine fuels. For.
Sci. 16, 101–105.
Byram, G.M., 1959. Combustion of forest fuels. In: Davis, K.P. (Ed.), Forest
Fire: Control and Use. MCGraw-Hill, New York, pp. 61–89.
Byram, G.M., Jemison, G.M., 1943. Solar radiation and forest fuel moisture. J.
Agric. Res. 67 (4), 149–176.
Cajander, A.K., 1926. The theory of forest types. Acta For. Fenn. 29, 1–118.
Chen, J.M., 1996. Optically-based methods for measuring seasonal variation of
leaf area index in boreal conifer stands. Agric. For. Meteorol. 80 (2–4), 135–
163.
Chen, J., Saunders, S.C., Crow, T.R., Naiman, R.J., Brosofske, K.D., Mroz,
G.D., Brookshire, B.L., Franklin, J.F., 1999. Microclimate in forest eco-
system and landscape ecology. BioScience 49 (4), 288–297.
Chuvieco, E., Aguado, I., Dimitrakopoulos, A.P., 2004. Conversion of fuel
moisture content values to ignition potential for integrated fire danger
assessment. Can. J. For. Res. 34, 2284–2293.
Dilks, T.J.K., Proctor, M.C.F., 1979. Photosynthesis, respiration and water
content in bryophytes. N. Phytol. 82, 97–114.
Drebs, A., Nordlund, A., Karlsson, P., Helminen, J., Rissanen, P., 2002.
Climatological statistics of Finland 1971–2000. Climatic statistics of Fin-
land 2002:2. Finnish Meteorological Institute, Helsinki, p. 99.
Finnish Forest Research Institute, 2000. Finnish Statistical Yearbook of For-
estry. Gummerus Kirjapaino Oy, Jyvaskyla. ISBN 951-40-1752-8.
Fons, W.I., 1950. Heating and ignition of small wood cylinders. Ind. Eng. Chem.
42, 2130–2133.
Fosberg, M.A., Lancaster, J.W., Schroeder, M.J., 1970. Fuel moisture response–
drying relationshipsunder standardand field conditions.For. Sci. 16, 121–128.
Frazer, G.W., Canham, C.D., Lertzman, K.P., 1999. Gap Light Analyzer (GLA),
Version 2.0: Imaging Software to Extract Canopy Structure and Gap Light
Transmission Indices from True-colour Fisheye Photographs, Users Manual
and Program Documentation. Simon Fraser University,/the Institute of
Ecosystem Studies, Burnaby, BC/Millbrook, NY.
Granstrom, A., 2001. Fire management for biodiversity in the European boreal
forest. Scand. J. For. Res. 62–69 (Suppl. 3).
Granstrom, A., Schimmel, J., 1998. Utvardering av det kanadensiska bran-
drisksystemet—testbranningar och uttorkningsanalyser. (English abstract:
Assessment of the Canadian forest fire danger rating system for Swedish
fuel conditions) In: Rescue Service, Karlstad, Sweden, p. P21-244/98.
Grelle, A., Lundberg, A., Lindroth, A., Moren, A.-S., Cienciala, E., 1997.
Evaporation components of a boreal forest: variations during the growing
season. J. Hydrol. 197, 70–87.
Heijmans, M.M.P.D., Arp, W.J., Chapin III, F.S., 2004. Controls on moss
evaporation in a boreal black spruce forest. Global Biogeochem. Cycles 18,
GB2004, doi:10.1029/2003GB002128.
Heikinheimo, M., Venalainen, A., Tourula, T., 1998. A soil moisture index for
the assessment of forest fire risk in the boreal zone. In: Proceedings of the
COST 77, 79, 711 International Symposium on Applied Agrometeorology
and Agroclimatology, EUR 18328 EN, Volos, Greece, April 24–26. Eur-
opean Commission, Belgium, pp. 549–556.
Henttonen, H., 1991. Kriging in Interpolating July Mean Temperatures and
Precipitation Sums, Publication No. 12. University of Jyvaskyla, Depart-
ment of Statistical Science, Jyvaskyla, p. 41.
Kunkel, K.E., 2001. Surface energy budget and fuel moisture. In: Johnson,
E.A., Miyanishi, K. (Eds.), Forest Fires: Behavior and Ecological Effects.
Academic Press, San Francisco, CA, pp. 303–350.
Kuuluvainen, T., Aapala, K., Ahlroth, P., Kuusinen, M., Lindholm, T., Sallan-
taus, T., Siitonen, J., Tukia, H., 2002. Principles of ecological restoration of
boreal forested ecosystems: Finland as an example. Silva Fenn.ca 36 (1),
409–422.
H. Tanskanen et al. / Forest Ecology and Management 226 (2006) 189–198198
Lukkala, O., 1942. Sateen mittauksia erilaisissa metsikoissa. Referat: Nieders-
chlagsmessungen in verschniedernartigen Bestanden. Acta For. Fenn. 50,
23.
Monteith, J.L., 1981. Evaporation and surface temperature. Quart. J. R. Meteor.
Soc. 10 (451), 1–27.
Moore, D.S., McCabe, G.P., 1989. Introduction to the Practice of Statistics.
W.H. Freeman and Company, New York, Oxford, pp. 509–563.
Nelson, R.M., 2001. Water relations in forest fuels. In: Johnson, E.A., Miya-
nishi, K. (Eds.), Forest Fires: Behavior and Ecological Effects. Academic
Press, San Francisco, CA, pp. 79–143.
Norum, R.A., 1982. Predicting wildfire behavior in black spruce forests in Alaska.
Res. Note PNW-401. U.S. Department of Agriculture, Forest Fire, Pacific
Northwest Forest and Range Experiment Station, Portland, OR. p. 10.
Oke, T.R., 1987. Boundary Layer Climates. Routledge, London, p. 451.
Pakarinen, P., 1984. Cover estimation and sampling of boreal vegetation in
Northern Europe. In: Knapp, R. (Ed.), Sampling Methods and Taxon
Analysis in Vegetation Science. Handbook of Vegetation Science, vol. 4. Dr.
W. Junk Publishers, The Hague, pp. 35–44.
Proctor, M.C.F., 1981. Diffusion resistances in bryophytes. In: Grace, J., Ford,
E.D., Jarvis, P.G. (Eds.), Plants and their Atmospheric Environment. Black-
well Scientific, Oxford, pp. 219–229.
Proctor, M.C.F., Smith, A.J.E., 1995. Ecological and systematic implications of
branching patterns in bryophytes. In: Hoch, P., Stephenson, A.G. (Eds.),
Experimental and Molecular Approaches to Plant Biosystematics. Missouri
Botanical Gardens, St. Louis, MO, USA, pp. 87–110.
Raven, J.A., 2003. Long-distance transport in non-vascular plants. Plant Cell
Environ. 26 (1), 73–85.
Raynor, G.S., 1971. Wind and temperature structure in a coniferous forest and a
contiguous field. For. Sci. 17, 351–363.
Ripley, B.D., 1981. Spatial Statistics. Wiley, New York, p. 252.
Rothermel, R.C., 1972. A mathematical model for predicting fire spread in
wildland fuels. In: USDA For. Serv. Res. Pap. INT-115, Intermt For. and
Range Exp. Stn., Ogden, UT, p. 40.
Schimmel, J., Granstrom, A., 1997. Fuel succession and fire behavior in the
Swedish boreal forest. Can. J. For. Res. 27, 1207–1216.
Schofield, W.B., 1981. Ecological significance of morphological characters in
the moss gametophyte. Bryologist 84, 149–165.
Simard, A.J., 1968. The moisture content of forest fuels. II. Comparison of
moisture content variations above the fibre saturation point between a
number of fuel types. Information Report FF-X-15. Forestry Branch, Forest
Fire Research Institute, Ottawa, Ont., p. 68.
Stenberg, P., Linder, S., Smolander, H., Flowerellis, J., 1994. Performance of the
LAI-2000 plant canopy analyzer in estimating leaf-area index of some Scots
pine stands. Tree Physiol. 14 (7–9), 981–995.
Stocks, B.J., Lawson, B.D., Alexander, M.E., Van Wagner, C.E., McAlpine,
R.S., Lynham, T.J., Dube, D.E., 1989. Canadian forest fire danger rating
system: an overview. For. Chron. 65, 450–457.
Tanskanen, H., Venalainen, A., Puttonen, P., Granstrom, A., 2005. Impact of
stand structure on surface fire ignition potential in Picea abies and Pinus
sylvestris forests in southern Finland. Can. J. For. Res. 35, 410–420.
Vajda, A., Venalainen, A., 2003. The influence of natural conditions on the
spatial variation of climate in Lapland, northern Finland. Int. J. Climatol. 23,
1011–1022.
Van Wagner, C.E., 1969. Drying rates of some fine forest fuels. Fire Contr.
Notes 30 (4), 1–4 (Reprint).
Van Wagner, C.E., 1979. A laboratory study of weather effects on the drying rate
of jack pine litter. Can. J. For. Res. 9 (2), 267–275.
Van Wagner, C.E., 1983. Fire behavior in northern coniferous forests and
shrublands. In: Wein, R.W., MacLean, D.A. (Eds.), The Role of Fire in
Northern Circumpolar Ecosystems. John Wiley & Sons, New York, USA,
pp. 65–80.
Van Wagner, C.E., 1987. Development and Structure of the Canadian Forest
Fire Weather Index System. Forestry Technical Report 35. Canadian
Forestry Service, Ottawa, p. 37.
Venalainen, A., Heikinheimo, M., 2002. Meteorological data for agricultural
applications. Phys. Chem. Earth Parts A/B/C 27 (23/24), 1045–1050.
Venalainen, A., Heikinheimo, M., 2003. The Finnish forest fire index calcula-
tion system. In: Zschau, J., Kuppers, A. (Eds.), Early Warning Systems for
Natural Disasters Reduction. Springer, pp. 645–648.
Venalainen, A., Tuomenvirta, H., Pirinen, P., Drebs, A., 2005. A Basic Finnish
climate data set 1961–2000—description and illustrations. Reports 5, 27s.
Zotz, G., Schweikert, A., Jetz, W., Westerman, H., 2000. Water relations and
carbon gain are closely related to cushion size in the moss Grimmia
pulvinata. N. Phytol. 148, 59–67.