Population dynamics and genetic changes of Picea abies in the South Carpathians revealed by pollen...
16
Population dynamics and genetic changes of Picea abies in the South Carpathians revealed by pollen and ancient DNA analyses Magyari et al. Magyari et al. BMC Evolutionary Biology 2011, 11:66 http://www.biomedcentral.com/1471-2148/11/66 (10 March 2011)
Transcript of Population dynamics and genetic changes of Picea abies in the South Carpathians revealed by pollen...
Population dynamics and genetic changes ofPicea abies in the South Carpathians revealed bypollen and ancient DNA analysesMagyari et al.
Magyari et al. BMC Evolutionary Biology 2011, 11:66http://www.biomedcentral.com/1471-2148/11/66 (10 March 2011)

RESEARCH ARTICLE Open Access
Population dynamics and genetic changes ofPicea abies in the South Carpathians revealedby pollen and ancient DNA analysesEnikő K Magyari1*, Ágnes Major2, Miklós Bálint3,7, Judit Nédli4, Mihály Braun5, István Rácz2, Laura Parducci6
Abstract
Background: Studies on allele length polymorphism designate several glacial refugia for Norway spruce (Piceaabies) in the South Carpathian Mountains, but infer only limited expansion from these refugia after the lastglaciation. To better understand the genetic dynamics of a South Carpathian spruce lineage, we compared ancientDNA from 10,700 and 11,000-year-old spruce pollen and macrofossils retrieved from Holocene lake sediment in theRetezat Mountains with DNA extracted from extant material from the same site. We used eight primer pairs thatamplified short and variable regions of the spruce cpDNA. In addition, from the same lake sediment we obtained a15,000-years-long pollen accumulation rate (PAR) record for spruce that helped us to infer changes in populationsize at this site.
Results: We obtained successful amplifications for Norway spruce from 17 out of 462 pollen grains tested, whilethe macrofossil material provided 22 DNA sequences. Two fossil sequences were found to be unique to theancient material. Population genetic statistics showed higher genetic diversity in the ancient individuals comparedto the extant ones. Similarly, statistically significant Ks and Kst values showed a considerable level of differentiationbetween extant and ancient populations at the same loci.Lateglacial and Holocene PAR values suggested that population size of the ancient population was small, in therange of 1/10 or 1/5 of the extant population. PAR analysis also detected two periods of rapid population growths(from ca. 11,100 and 3900 calibrated years before present (cal yr BP)) and three bottlenecks (around 9180, 7200and 2200 cal yr BP), likely triggered by climatic change and human impact.
Conclusion: Our results suggest that the paternal lineages observed today in the Retezat Mountains persisted atthis site at least since the early Holocene. Combination of the results from the genetic and the PAR analysesfurthermore suggests that the higher level of genetic variation found in the ancient populations and the loss ofancient allele types detected in the extant individuals were likely due to the repeated bottlenecks during theHolocene; however our limited sample size did not allow us to exclude sampling effect.This study demonstrates how past population size changes inferred from PAR records can be efficiently used incombination with ancient DNA studies. The joint application of palaeoecological and population genetics analysesproved to be a powerful tool to understand the influence of past population demographic changes on the haplotypediversity and genetic composition of forest tree species.
* Correspondence: [email protected] Research Group for Paleontology, 1476 Budapest, P. O. Box 222,HungaryFull list of author information is available at the end of the article
Magyari et al. BMC Evolutionary Biology 2011, 11:66http://www.biomedcentral.com/1471-2148/11/66
© 2011 Magyari et al; licensee BioMed Central Ltd. This is an Open Access article distributed under the terms of the Creative CommonsAttribution License (http://creativecommons.org/licenses/by/2.0), which permits unrestricted use, distribution, and reproduction inany medium, provided the original work is properly cited.
BackgroundIn the last two decades ancient DNA (aDNA) has beensuccessfully extracted from fossil plant material, and theresults from the specimens of late Quaternary remains(up to 100 ka yrs) have provided insights into many evo-lutionary processes [1-9]. These studies represented thefirst attempts in linking extant and fossil plant popula-tions and provided important information on geneticchanges through time. Parducci et al. [7] did a promis-ing attempt to analyze short chloroplast DNA (cpDNA)regions in fossil pollen extracted from a Holocene lakesediment in Sweden. Fossil pollen grains are abundantin lake sediments. Under ideal preservation conditions(neutral pH, low temperature, no oxygen) the study ofpollen DNA allows studying past demographic events byanalyzing neutrally evolving regions of the organellegenome, such as microsatellites and introns [10,11].During the Quaternary (last 2.6 million years) climaticoscillations have dramatically influenced the distributionof plant species [12]. Repeated range expansions andcontractions in response to warming and coolingresulted in large-scale demographic changes with conse-quent impact on their genetic composition [11].Progress in aDNA-based phylogenetic and population
genetic studies have been very rapid in animal speciesand lately several specific primers have been designed tostudy population-level changes (reviewed in Leonard[13] and Hofreiter [14]). Rohland et al. [15] have forexample detected divergence events between mammothand the two extant elephant species. Barnes et al. [16]and Valdiosera et al. [17] successfully reconstructedpopulation movements during the last glaciation inbrown bears and detected frequent events of extinctionsand recolonizations. Unfortunately, similar studies onwoody plants are still in their infancy with few attemptsdone on fossil pollen and wood [7,18,19]. This is despitethe many questions that plant aDNA analyses are amen-able to answer [20].In this study we focus on Picea abies (Norway spruce),
one of the ecologically and economically most importantforest tree species in Europe. Pollen and macrofossil evi-dence combined with genetic surveys of the currentEuropean populations of this species showed that its wide-ranging distribution in central and south-eastern Europeoriginated from several glacial refugia [21-26]. One suchrefugium was identified in the South Carpathians, whereseveral unique cpDNA and mitochondrial DNA (mtDNA)haplotypes suggested long-lasting isolation [22,25]. Popu-lations from these regions showed lower level of geneticvariation compared to other refugial populations in centralEurope, and north- and westward postglacial expansionfrom this area showed to be limited, as these haplotypesdo not appear in the central and northwest European
populations today. In addition, the genetic diversityincreased north of the Carpathians, probably as a result ofadmixture of expanding populations from two separaterefugia. Tollefsrud et al. [25] suggested that the dry plainsof central and south-eastern Europe, including the Hun-garian Plain, formed an ecological barrier to any expan-sion, whereas humid mountain ranges elsewhere in centralEurope facilitated the northward spread of other sprucelineages. The lateglacial and early Holocene warming alsobrought major altitudinal displacements of the speciesrange in the South Carpathians [27,28]. In addition, fossilpollen records indicate that a large proportion of glaciallowland coniferous woodlands went destroyed by fire inthe early Holocene as summer temperatures rose [29]. Anongoing pollen and plant macrofossil study of a sedimentsequence retrieved from a lake located in the RetezatMountains (Tăul dintre Brazi) in the South CarpathianRange demonstrates that at the onset of the early Holo-cene warming (around 11,000 cal yr BP) a rapid popula-tion expansion of Norway spruce took place around thislake [30].Based on all this knowledge, we hypothesized two pos-
sible population demographic scenarios during theHolocene in the South Carpathian refugium. (1) Thespruce populations of the Retezat Mountains remainedconstrained to this region with a relatively constantpopulation size. In this case we expect to find the samehaplotypes and similar levels of diversity in extant andancient samples. (2) The population of the Retezat Mtsunderwent significant demographic changes, most prob-ably due to climatic shifts and anthropogenic influences.In this case we expect altered haplotype frequencies inthe extant population relative to the ancient population,and different levels of genetic diversity.To asses the consistency of the two scenarios, we ana-
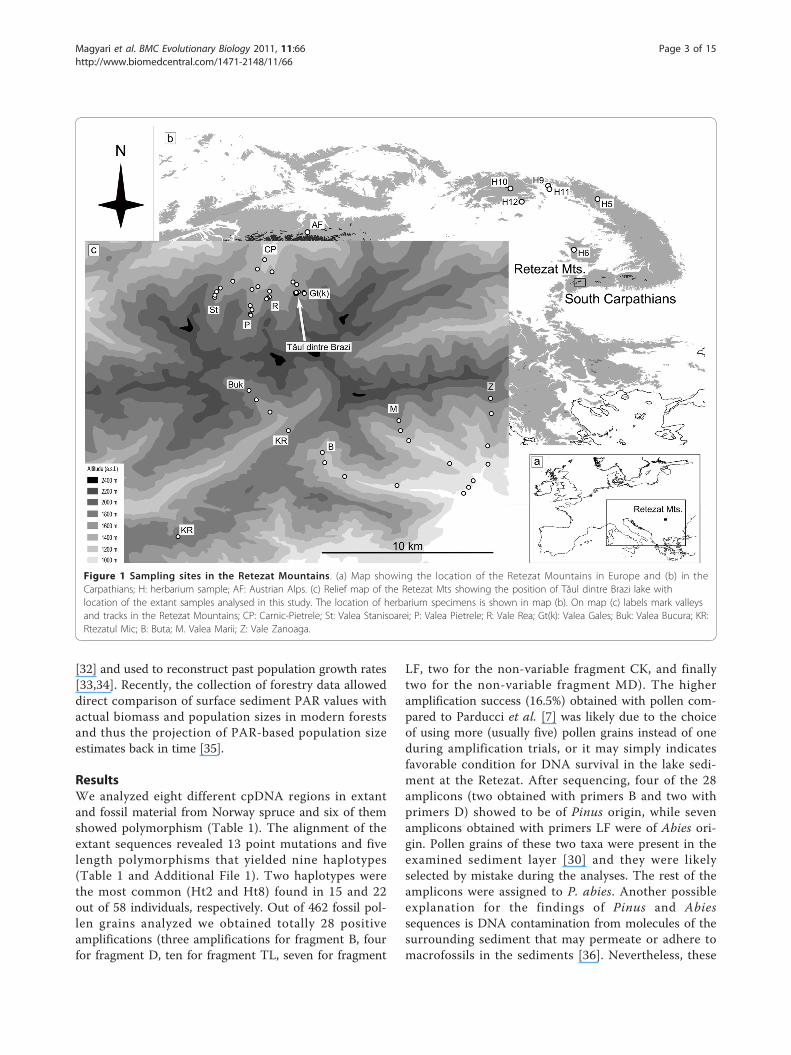
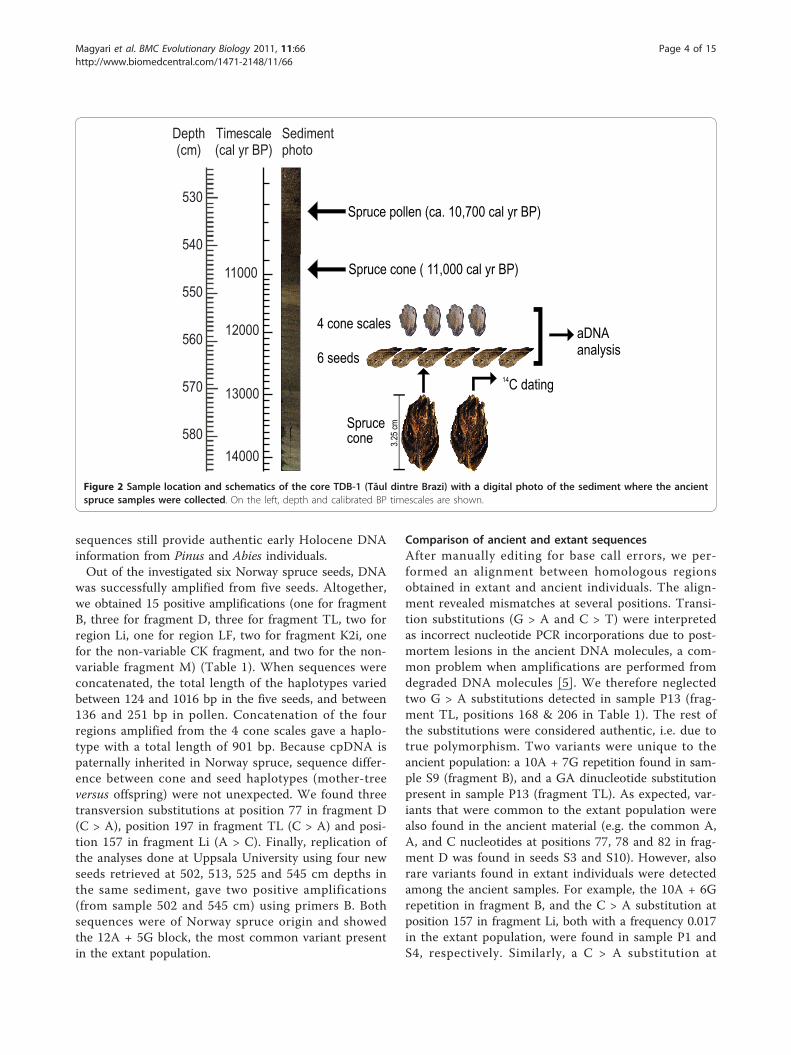
lyzed fossil spruce pollen and other macrofossils (seedsand cone scales) from the early Holocene section of asediment core extracted at lake Tăul dintre Brazi (TDB)in the Retezat Mountains (Figure 1). We analyzedcpDNA from material retrieved from two radiocarbondated sediment layers (11,000 and 10,700 cal yr BP levels)(Figure 2) and compared results with genetic dataobtained from the extant spruce population of the Rete-zat Mountains. Population genetic inferences from thepast were then linked to a 15,000-year record of sprucepollen accumulation rates (PAR) obtained from the samesediment core and used to infer past population sizechanges. PAR values represent the number of pollengrains accumulated at the sediment surface (cm2) in ayear and they can be directly related to the populationsize of the studied taxon in the effective pollen sourcearea of the examined lake [31]. The importance of thisrelationship has been long recognized by palaeoecologists
Magyari et al. BMC Evolutionary Biology 2011, 11:66http://www.biomedcentral.com/1471-2148/11/66
Page 2 of 15
[32] and used to reconstruct past population growth rates[33,34]. Recently, the collection of forestry data alloweddirect comparison of surface sediment PAR values withactual biomass and population sizes in modern forestsand thus the projection of PAR-based population sizeestimates back in time [35].
ResultsWe analyzed eight different cpDNA regions in extantand fossil material from Norway spruce and six of themshowed polymorphism (Table 1). The alignment of theextant sequences revealed 13 point mutations and fivelength polymorphisms that yielded nine haplotypes(Table 1 and Additional File 1). Two haplotypes werethe most common (Ht2 and Ht8) found in 15 and 22out of 58 individuals, respectively. Out of 462 fossil pol-len grains analyzed we obtained totally 28 positiveamplifications (three amplifications for fragment B, fourfor fragment D, ten for fragment TL, seven for fragment
LF, two for the non-variable fragment CK, and finallytwo for the non-variable fragment MD). The higheramplification success (16.5%) obtained with pollen com-pared to Parducci et al. [7] was likely due to the choiceof using more (usually five) pollen grains instead of oneduring amplification trials, or it may simply indicatesfavorable condition for DNA survival in the lake sedi-ment at the Retezat. After sequencing, four of the 28amplicons (two obtained with primers B and two withprimers D) showed to be of Pinus origin, while sevenamplicons obtained with primers LF were of Abies ori-gin. Pollen grains of these two taxa were present in theexamined sediment layer [30] and they were likelyselected by mistake during the analyses. The rest of theamplicons were assigned to P. abies. Another possibleexplanation for the findings of Pinus and Abiessequences is DNA contamination from molecules of thesurrounding sediment that may permeate or adhere tomacrofossils in the sediments [36]. Nevertheless, these
Figure 1 Sampling sites in the Retezat Mountains. (a) Map showing the location of the Retezat Mountains in Europe and (b) in theCarpathians; H: herbarium sample; AF: Austrian Alps. (c) Relief map of the Retezat Mts showing the position of Tăul dintre Brazi lake withlocation of the extant samples analysed in this study. The location of herbarium specimens is shown in map (b). On map (c) labels mark valleysand tracks in the Retezat Mountains; CP: Carnic-Pietrele; St: Valea Stanisoarei; P: Valea Pietrele; R: Vale Rea; Gt(k): Valea Gales; Buk: Valea Bucura; KR:Rtezatul Mic; B: Buta; M. Valea Marii; Z: Vale Zanoaga.
Magyari et al. BMC Evolutionary Biology 2011, 11:66http://www.biomedcentral.com/1471-2148/11/66
Page 3 of 15
sequences still provide authentic early Holocene DNAinformation from Pinus and Abies individuals.Out of the investigated six Norway spruce seeds, DNA
was successfully amplified from five seeds. Altogether,we obtained 15 positive amplifications (one for fragmentB, three for fragment D, three for fragment TL, two forregion Li, one for region LF, two for fragment K2i, onefor the non-variable CK fragment, and two for the non-variable fragment M) (Table 1). When sequences wereconcatenated, the total length of the haplotypes variedbetween 124 and 1016 bp in the five seeds, and between136 and 251 bp in pollen. Concatenation of the fourregions amplified from the 4 cone scales gave a haplo-type with a total length of 901 bp. Because cpDNA ispaternally inherited in Norway spruce, sequence differ-ence between cone and seed haplotypes (mother-treeversus offspring) were not unexpected. We found threetransversion substitutions at position 77 in fragment D(C > A), position 197 in fragment TL (C > A) and posi-tion 157 in fragment Li (A > C). Finally, replication ofthe analyses done at Uppsala University using four newseeds retrieved at 502, 513, 525 and 545 cm depths inthe same sediment, gave two positive amplifications(from sample 502 and 545 cm) using primers B. Bothsequences were of Norway spruce origin and showedthe 12A + 5G block, the most common variant presentin the extant population.
Comparison of ancient and extant sequencesAfter manually editing for base call errors, we per-formed an alignment between homologous regionsobtained in extant and ancient individuals. The align-ment revealed mismatches at several positions. Transi-tion substitutions (G > A and C > T) were interpretedas incorrect nucleotide PCR incorporations due to post-mortem lesions in the ancient DNA molecules, a com-mon problem when amplifications are performed fromdegraded DNA molecules [5]. We therefore neglectedtwo G > A substitutions detected in sample P13 (frag-ment TL, positions 168 & 206 in Table 1). The rest ofthe substitutions were considered authentic, i.e. due totrue polymorphism. Two variants were unique to theancient population: a 10A + 7G repetition found in sam-ple S9 (fragment B), and a GA dinucleotide substitutionpresent in sample P13 (fragment TL). As expected, var-iants that were common to the extant population werealso found in the ancient material (e.g. the common A,A, and C nucleotides at positions 77, 78 and 82 in frag-ment D was found in seeds S3 and S10). However, alsorare variants found in extant individuals were detectedamong the ancient samples. For example, the 10A + 6Grepetition in fragment B, and the C > A substitution atposition 157 in fragment Li, both with a frequency 0.017in the extant population, were found in sample P1 andS4, respectively. Similarly, a C > A substitution at
Figure 2 Sample location and schematics of the core TDB-1 (Tăul dintre Brazi) with a digital photo of the sediment where the ancientspruce samples were collected. On the left, depth and calibrated BP timescales are shown.
Magyari et al. BMC Evolutionary Biology 2011, 11:66http://www.biomedcentral.com/1471-2148/11/66
Page 4 of 15

position 197 in fragment TL was detected in samplesP12 and S10.
Population genetic analysesEstimates of nucleotide diversity, haplotype diversity andaverage number of nucleotide differences calculated atthe six polymorphic cpDNA loci are presented in Table2. Observed values for fragment D, TL and Li suggestthat the ancient spruce population harbored higherlevels of genetic variation compared to the extant popu-lation. Fst values at these loci were also statistically sig-nificant, an unusual result considering the low level ofdifferentiation usually observed among populations ofconifer species. Nucleotide-based genetic differentiation(Ks and Kst,) was also statistically significant at thesethree loci. On the whole, our results suggest differentia-tion between extant and ancient spruce populations that
inhabited the areas surrounding Tăul dintre Brazi at10,700-11,000 cal yr BP.
Phylogenetic relationships of ancient and extantspecimensResults of the phylogenetic analyses conducted on sepa-rate loci based on all sequences available (data set c inthe Methods) for fragments D, TL, Li and LF are pre-sented in Figure 3. A small group of sequences isformed by nine extant and four ancient sequences inthe case of fragment D, while the other two ancientsequences are grouped with the rest of the extant mate-rial. In the case of LF fragment, the ancient sequencesobtained from the cone and seed S8 are clusteringtogether with the majority of the extant samples, while asmaller group of extant sequences that included samplescollected on the northern slopes of the Retezat, form a
Table 1 Base substitutions detected in extant and ancient cpDNA sequences of Norway spruce (Picea abies)
cpDNA region CK MD B D TL Li LF K2i
Variableposition
88 107-126 77 78 82 168 196 197 206 154 157 115 133 114
Position total 424 443 - 462 629 630 634 834 872 873 882 1081 1084 1279 1297 1464 Seq.length
Rel.freq.
Extant haplotypes
Ht1. √ √ C 12A + 5G A A C G T C G T C T T C 1551 0.103
Ht2. √ √ C 11A + 6G A A C G T C G T C A T C 1551 0.259
Ht3. √ √ C 11A + 6G C A C G T C G T C A T C 1551 0.103
Ht4. √ √ C 10A + 6G A A C G T C G T A A T T 1550 0.017
Ht5. √ √ C 13A + 5G A A C G T C G T C A T C 1552 0.034
Ht6. √ √ C 12A + 5G C A C G T C G T C A T C 1551 0.034
Ht7. √ √ C 10A + 6G A A C G T C G T C A T C 1550 0.017
Ht8. √ √ C 12A + 5G A A C G T C G T C A T C 1551 0.379
Ht9. √ √ T 12A + 4G + 3A+ G
A C T G T A G C C A G C 1554 0.017
Macrofossil haplotypes
Cone √ C A C G T C G A T C 901
S 3. A A C 124
S 4. T A 237
S 8. √ C A C G T C G 575
S 9. √ C 10A + 7GA +7G
G T C G A T C 990
S 10. √ A A C G T A G T C C 1016
S 502-S 545 C 12A + 5G 211
Fossil pollen haplotypes
P1. C 10A + 6G 212
P2-P3. C A C 124
P4-P11. G T C G 251
P12. G T A G 251
P13. G G A G 251
P14-P15. √ 136
P16-P17. √ 200
(√) successful amplification of the fragment with no variation in the sequence; length of concatenated sequences is shown on the right; rows below the name ofthe fragments indicate the nucleotide position in the single fragments and in the concatenated sequence, respectively; base substitutions in bold were foundonly in the fossil material; Ht: haplotype; S: seed; P: pollen.
Magyari et al. BMC Evolutionary Biology 2011, 11:66http://www.biomedcentral.com/1471-2148/11/66
Page 5 of 15
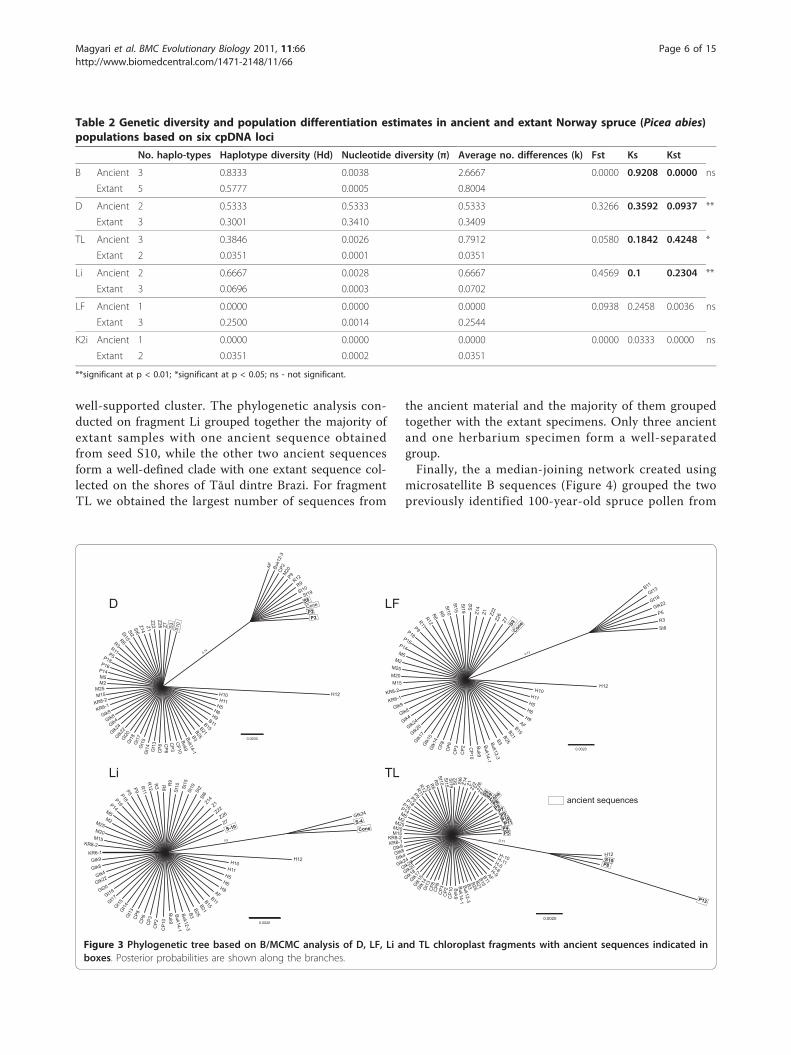
well-supported cluster. The phylogenetic analysis con-ducted on fragment Li grouped together the majority ofextant samples with one ancient sequence obtainedfrom seed S10, while the other two ancient sequencesform a well-defined clade with one extant sequence col-lected on the shores of Tăul dintre Brazi. For fragmentTL we obtained the largest number of sequences from
the ancient material and the majority of them groupedtogether with the extant specimens. Only three ancientand one herbarium specimen form a well-separatedgroup.Finally, the a median-joining network created using
microsatellite B sequences (Figure 4) grouped the twopreviously identified 100-year-old spruce pollen from
Table 2 Genetic diversity and population differentiation estimates in ancient and extant Norway spruce (Picea abies)populations based on six cpDNA loci
No. haplo-types Haplotype diversity (Hd) Nucleotide diversity (π) Average no. differences (k) Fst Ks Kst
B Ancient 3 0.8333 0.0038 2.6667 0.0000 0.9208 0.0000 ns
Extant 5 0.5777 0.0005 0.8004
D Ancient 2 0.5333 0.5333 0.5333 0.3266 0.3592 0.0937 **
Extant 3 0.3001 0.3410 0.3409
TL Ancient 3 0.3846 0.0026 0.7912 0.0580 0.1842 0.4248 *
Extant 2 0.0351 0.0001 0.0351
Li Ancient 2 0.6667 0.0028 0.6667 0.4569 0.1 0.2304 **
Extant 3 0.0696 0.0003 0.0702
LF Ancient 1 0.0000 0.0000 0.0000 0.0938 0.2458 0.0036 ns
Extant 3 0.2500 0.0014 0.2544
K2i Ancient 1 0.0000 0.0000 0.0000 0.0000 0.0333 0.0000 ns
Extant 2 0.0351 0.0002 0.0351
**significant at p < 0.01; *significant at p < 0.05; ns - not significant.
AF
Buk1
2-3
CP
2M
20P9
R12
R9
St10
St19
S8
Cone
P2
P3
S10
S3
Z7
Z26
Z22Z
1
Z14St6St2St15R
6
R11
R3
P5P18P16
P14M5M2
M25
M15
KR8-2
KR6-1
Gtk9
Gtk8
Gtk
4
Gtk
24
Gtk
22G
t20
Gt1
8G
t17
Gt1
5G
t14
Gt1
3
CP
8
CP
6C
P3
CP
10
Buk9
Buk1
4-1
B3
B25
B21
B15
B11
H9
H6
H5
H11
H10 H12
B11
Gt13
Gt18
Gtk22
P5
R3
St6
ConeS9Z
7Z26Z
22
Z1
Z14St2
St1
9
St1
5
St1
0R9R6R
12R11P9P18
P16P14M5
M2
M25
M20
M15
KR8-2
KR6-1
Gtk9
Gtk8
Gtk4
Gtk
24
Gtk
20
Gtk
17G
tk15
Gtk
14
CP
8
CP
6C
P3
CP
2 CP
10
Buk9
Buk14-1
Buk1
2-3
B3
B25
B21
B15
AF
H9
H6
H5
H11
H10H12
D LF
Gtk24
S-4
ConeS-10Z7
Z26Z22
Z1Z14S
t6
St2
St1
9
St1
5
St1
0R9
R6
R3
R12R11
P9P5P
18P16P14
M5
M2M25M20
M15KR8-2
KR6-1
Gtk9
Gtk8
Gtk4
Gtk22
Gt20
Gt18
Gt1
7
Gt1
5G
t14
Gt1
3C
P8
CP
6C
P3
CP
2
CP
10
Buk9
Buk14-1
Buk12-3
B21
B3
B25
B15
B11
AF
H9
H6
H5
H11
H10H12
P13
P8
S10
H12
P5
P4P11
P10P9
P7P8
P6C
one
S9S
8Z7Z
26
Z22Z1Z14
St6
St2
St1
9S
t15
St1
0
R9R
6R3
R12R
11P9P5P18P16P14M5
M2M25
M20M15
KR8-2
KR6-1
Gtk9
Gtk8
Gtk4
Gtk24
Gtk22
Gtk20
Gtk
18
Gtk17
Gtk
15G
tk14
Gt1
3C
P8
CP
6C
P3
CP
2C
P10 Bu
k9
Buk14-1
Buk12-3
B3
B25
B21
B15
B11
AF
H-9
H-6
H-5
H-11
H-10
Li TL
ancient sequences
Figure 3 Phylogenetic tree based on B/MCMC analysis of D, LF, Li and TL chloroplast fragments with ancient sequences indicated inboxes. Posterior probabilities are shown along the branches.
Magyari et al. BMC Evolutionary Biology 2011, 11:66http://www.biomedcentral.com/1471-2148/11/66
Page 6 of 15
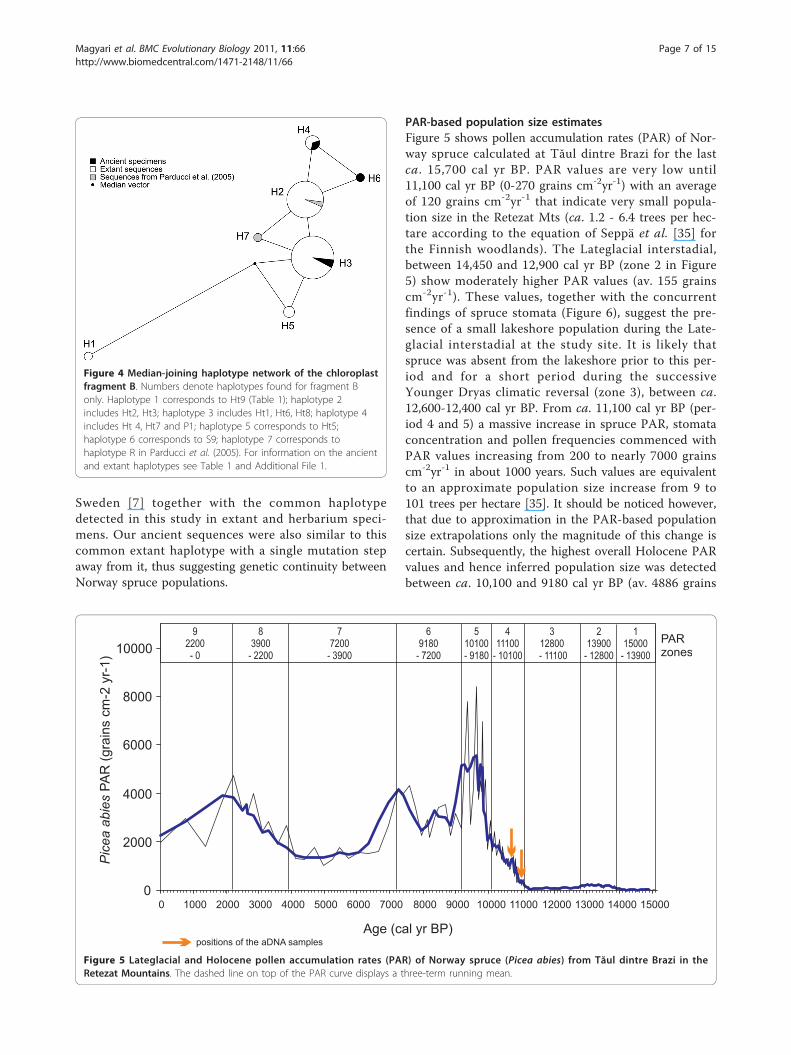
Sweden [7] together with the common haplotypedetected in this study in extant and herbarium speci-mens. Our ancient sequences were also similar to thiscommon extant haplotype with a single mutation stepaway from it, thus suggesting genetic continuity betweenNorway spruce populations.
PAR-based population size estimatesFigure 5 shows pollen accumulation rates (PAR) of Nor-way spruce calculated at Tăul dintre Brazi for the lastca. 15,700 cal yr BP. PAR values are very low until11,100 cal yr BP (0-270 grains cm-2yr-1) with an averageof 120 grains cm-2yr-1 that indicate very small popula-tion size in the Retezat Mts (ca. 1.2 - 6.4 trees per hec-tare according to the equation of Seppä et al. [35] forthe Finnish woodlands). The Lateglacial interstadial,between 14,450 and 12,900 cal yr BP (zone 2 in Figure5) show moderately higher PAR values (av. 155 grainscm-2yr-1). These values, together with the concurrentfindings of spruce stomata (Figure 6), suggest the pre-sence of a small lakeshore population during the Late-glacial interstadial at the study site. It is likely thatspruce was absent from the lakeshore prior to this per-iod and for a short period during the successiveYounger Dryas climatic reversal (zone 3), between ca.12,600-12,400 cal yr BP. From ca. 11,100 cal yr BP (per-iod 4 and 5) a massive increase in spruce PAR, stomataconcentration and pollen frequencies commenced withPAR values increasing from 200 to nearly 7000 grainscm-2yr-1 in about 1000 years. Such values are equivalentto an approximate population size increase from 9 to101 trees per hectare [35]. It should be noticed however,that due to approximation in the PAR-based populationsize extrapolations only the magnitude of this change iscertain. Subsequently, the highest overall Holocene PARvalues and hence inferred population size was detectedbetween ca. 10,100 and 9180 cal yr BP (av. 4886 grains
Figure 4 Median-joining haplotype network of the chloroplastfragment B. Numbers denote haplotypes found for fragment Bonly. Haplotype 1 corresponds to Ht9 (Table 1); haplotype 2includes Ht2, Ht3; haplotype 3 includes Ht1, Ht6, Ht8; haplotype 4includes Ht 4, Ht7 and P1; haplotype 5 corresponds to Ht5;haplotype 6 corresponds to S9; haplotype 7 corresponds tohaplotype R in Parducci et al. (2005). For information on the ancientand extant haplotypes see Table 1 and Additional File 1.
0
2000
4000
6000
8000
10000
0 1000 2000 3000 4000 5000 6000 7000 8000 9000 10000 11000 12000 13000 14000 15000
Age (cal yr BP)
Pic
ea
ab
ies
PA
R(g
rain
scm
-2yr-
1)
PARzones
1
15000
- 13900
2
13900
- 12800
3
12800
- 11100
4
11100
- 10100
5
10100
- 9180
6
9180
- 7200
7
7200
- 3900
8
3900
- 2200
9
2200
- 0
positions of the aDNA samples
Figure 5 Lateglacial and Holocene pollen accumulation rates (PAR) of Norway spruce (Picea abies) from Tăul dintre Brazi in theRetezat Mountains. The dashed line on top of the PAR curve displays a three-term running mean.
Magyari et al. BMC Evolutionary Biology 2011, 11:66http://www.biomedcentral.com/1471-2148/11/66
Page 7 of 15

cm-2yr-1) followed by a modest decline, with still highPAR values until 7200 cal yr BP (zone 6). At this time, asignificant decrease suggests also a decrease in popula-tion size (from ca. 252 to 120 trees per hectare on thebasis of Seppä et al. [35]). These values were maintaineduntil ca. 3900 cal yr BP and were followed by a secondsignificant increase between 3900 and 2200 cal yr BP(zone 8). Finally, the PAR curve suggests a thirddecrease in population size after 2200 cal yr BP. Thisperiod coincides with the late Iron Age increase in live-stock and the development of high altitude seasonal pas-turing in the Romanian Carpathians [37] suggestingintensive timber exploitation by humans in the region.Overall, the PAR record suggests that following an earlyHolocene massive population increase on the northernslopes of the Retezat, the spruce population size did notremain constant, but showed marked fluctuation withthree clear population bottlenecks dated to ca. 9180,7200 and 2200 cal yr BP.
DiscussionPatterns of plant genetic diversity in Europe show thatlevels of diversity usually decrease during postglacialcolonization from the refugia [25,38-41]. There can behowever large differences between colonization routesfollowed by different plant species due to climatic andenvironmental factors, altitudinal range expansion and
contraction, proximity to the ice sheets, and topography.Results from our study suggest that these factors werecrucial in determining the distribution and demographythat shaped the genetic structure of the populations ofthe South Carpathians in the Retezat. In Central Europe,high levels of diversity are usually found in the oldestspruce regions ( i.e. where spruce pollen is present sinceat least the Early Holocene), in the south-eastern Alps,southern Bohemian Massif, West Carpathians andnorthern Dinaric Alps [25]. The only exception is theSouth Carpathian refugium, where scientists have foundunique haplotypes and relatively low diversity levels inextant populations [25]. Indeed, in our study we found adecreased genetic variation in the extant populations inthe Retezat compared to the ancient population, andsuch lower diversity could be easily associated with theseveral population bottlenecks identified by the PARdata. Nevertheless, we cannot exclude that the limitednumber of fossil sequences affected the interpretation ofthe aDNA data.It is reasonable to assume that the fluctuations
observed in population size after an early Holocenerapid expansion at Tăul dintre Brazi had a substantialimpact on the genetic structure of the spruce popula-tion. The pollen record shows that a small populationwas already established in the lateglacial period around13,900 cal yr BP at high altitudes formerly covered by
Figure 6 Pollen and stomata record of Tăul dintre Brazi plotted against depth and calibrated BP timescales. Norway spruce (Picea abies)fossils are highlighted in red. LPAZ: local pollen assemblage zones as in Table 3; ➊ first occurrence of spruce stomata at 13,900 cal yr BP; ➋ -➌early Holocene population expansion of spruce between 11,750 - 10,780 cal yr BP inferred by pollen and stomata increases. Black rectanglesalong the timescale bar indicate the position of the radiocarbon dated samples.
Magyari et al. BMC Evolutionary Biology 2011, 11:66http://www.biomedcentral.com/1471-2148/11/66
Page 8 of 15
glacier ice (Figure 5 and 6) supporting the presence of arefugium in this area. Such a refugium has been alsodetected by genetic analysis conducted on living popula-tions by Bucci & Vendramin [22] and Tollefsrud et al.[25]. Assuming therefore that spruce was present andprobably abundant throughout the last glacial cycle atlower elevations in the Retezat, it is likely that oursampled ancient population is similar in genetic compo-sition to this refugial population. The pollen and thestomata record (Figure 6) show that the lateglacialexpansion came to a halt during the Younger Dryas cli-matic reversal (between ca. 12,900 and 11,500 cal yrBP), and the spruce population was greatly reducedand/or eradicated from the lakeshore [30]. The speciesexpanded again during the early Holocene and ourancient material was sampled at the beginning of thissecond population expansion that started around 11,100cal yr BP. Such increase in population size started froma population that was very small, according to the PARrecord about 1/10 or 1/5 of the extant one, and thatsuccessively increased between ca. 11,100 and 10,100 calyr BP. A significant increase in population size, however,only began around 10,000 cal yr BP, when the largestoverall Holocene distribution was reached. Fossil pollendata from this site (Figure 5) indicates that between10,100 and 9180 cal yr BP Norway spruce replaced Eur-opean larch (Larix decidua) on the lakeshore and prob-ably also in other areas at the same altitudinal belt [30].By this time, the population increased to a number thatlikely exceeded the extant population size.According to the PAR record, the maximum extension
of Norway spruce in the Retezat was followed by threedistinct population bottlenecks. The first reductionoccurred at 9180 cal yr BP and was likely caused by alocal population decline due to the expanding lake sur-face area [42]. A second reduction in size occurred at7200 cal yr BP and it was attributable to the climate-induced spread of European hornbeam (Carpinus betu-lus) that partially replaced former mixed Norway spruce- hazel forests at mid elevations [27,42]. The third bot-tleneck started 2200 years ago and was of anthropogenicorigin as suggested by the accompanying decrease inmany other arboreal elements and the spread of human-indicator herbs [42].Typically, population bottlenecks are characterized by
loss in allelic richness and a more limited decrease ofgenetic diversity at neutral loci [43]. This theory how-ever is not strictly applicable to the events that seem tohave occurred during postglacial recolonization in theRetezat. In our case, a combination of factors may haveacted to limit the initial loss in allelic richness (originallarge population sizes in the early Holocene), and laterto increase it (population bottlenecks and range frag-mentation due to forest management). Several pollen
studies and historical documents show indeed that for-est management was intense from 2200 cal years BPand destroyed the large continuous distribution of Nor-way spruce in this region [27,44,45].Results from the genetic and PAR analyses seem
therefore to support the hypothesis that the higherancient genetic variability and the absence of someancient haplotypes in the extant spruce populations wasdue to repeated bottlenecks experienced during theHolocene in the Retezat. In addition, as suggested byTollefsrud et al. [25], the dry plains of central andsouth-eastern Europe, may also have acted as an ecolo-gical barrier to the expansion of the early Holocenepopulations from this site, whereas humid mountainranges elsewhere in central Europe facilitated the north-ward spread of new spruce lineages in the successiveperiods. As a result, despite the proximity to the SouthCarpathian refugium, the genetic diversity of this sitedeclined during the Holocene.
ConclusionsThis study demonstrates how past population sizechanges inferred from PAR records can be efficientlyused in combination with aDNA data. The joint applica-tion of palaeoecological and population genetic analysesproved to be a powerful tool to understand the influ-ence of past population demographic changes on thehaplotype diversity and genetic composition of animportant forest tree species. We used a pollen andplant macrofossil-based aDNA approach and tracedpopulation size changes of Norway spruce in a refugialarea in the South Carpathian Mountains. Results clearlyshow that the paternal lineage observed at the beginningof the Holocene in the Retezat Mts persisted at the siteuntil today. Problems associated with low sample size inour aDNA data could be overcome by the informationobtained from the PAR data that clearly showed signifi-cant population size fluctuations in the Retezat Mts dur-ing the Holocene. This combined information supportthe hypothesis that the spruce population of the RetezatMts underwent significant demographic changes, mostprobably due to climatic shifts and anthropogenic influ-ences, and that likely these changes significantly alteredthe haplotype frequencies and the level of geneticdiversity.This study thus laid down the first basis for further
aDNA analyses. By examining additional levels of thissediment profile we can provide further insight to sup-port the hypotheses presented in this study.We have shown also that longer sequences, and
more robust phylogenetic inferences can be obtainedfrom plant macrofossils like seeds and cone scaleswhen aliquots of the DNA extracts are used in multi-ple PCR reactions providing sequences from different
Magyari et al. BMC Evolutionary Biology 2011, 11:66http://www.biomedcentral.com/1471-2148/11/66
Page 9 of 15
cpDNA regions. Similar attempts performed with fossilpollen grains were not as successful limiting at themoment population genetic inferences to single loci.On the other hand, multiple PCR products (obtainedby applying multiple primer sets in one reaction) andthus longer sequences might be obtained from pollenusing the new generation sequencing platforms, likethe 454 GS FLX [14,46] or multiple-loci PCR analyses.With this type of analyses, the use of DNA extractedfrom plant macrofossils allows the study of longerDNA sequences or, in the case of the 454 platform,even complete genomes from ancient plant specimensproviding good resolution data sets for populationgenetic analyses, as recently done with an extinct cavebear species [47]. The main obstacle to the use ofplant macrofossils for detecting population levelchanges is the limited number of individuals that canbe obtained from a sediment sample. In cases, how-ever, where macrofossils are well preserved andretrieved in large quantities from multiple time hori-zons [48], they can easily provide multiple genotypessuitable for population genetic studies similarly to ourrecovery of an intact 11,000-year-old Norway sprucecone from Tăul dintre Brazi. In such cases, the oppor-tunity offered by new data analytical methods in popu-lation genetics that work with multi-locus data,enables an efficient use of a relatively small number ofindividuals in the reconstruction of past populationdemographic changes [49]. Indeed, there are severalfossil sites in Europe where Upper Weichselian (ca.11,500 - 45,000 cal yr BP) plant macrofossils from sin-gle or multiple chronological horizons have beenrecovered in large numbers [24]. In the Carpathians,for example, numerous Picea sp., Pinus cembra andLarix sp. cones have been reported from several lastglacial (15,000-45,000 cal yr BP) and Holocene peatsediments [50,51]. Such material seems ideal for aDNAanalysis, as both organellar and nuclear DNA in theseeds of these cones hold many alleles. Its study havethe potential of revealing ancient genetic diversity incryptic northern refugia and adding valuable informa-tion on the role of this area in the postglacial recoloni-zation of northern and western Europe [11].Our analyses in particular proved that the use of
aDNA in combination with PAR data obtained from thesame site can be very efficient in discovering demo-graphic changes that occurred in the past in Norwayspruce, and will hopefully be used in other wind-polli-nated tree species. Finally, PAR-inferred demographicscenarios offer the opportunity of being incorporated incoalescence-based Bayesian mutation rate estimations,and this way more accurate substitution rates can beobtained [52].
MethodsAncient materialOur ancient material came from the early Holocene partof a 5-m long sediment sequence extracted at Tăul din-tre Brazi (0.5 ha, 1740 m a.s.l.). The lake is situated in anorth-facing slope of the Retezat Mts, South Car-pathians (Figure 1) and was formed in a glacial basinapproximately 15,700 years ago, directly after the retreatof the Lolaia glacier from this valley [42,53]. Today, theforest around the lake consists of P. abies, Pinus cembra(Stone pine), Pinus mugo (Mountain pine) and Rhodo-dendron myrtifolium. The core was analysed for fossilpollen, plant macrofossils, and an age-depth model wasconstructed based on eleven radiocarbon determinationsof terrestrial plant macro remains (Additional File 2)[42]. Pollen preservation was excellent throughout theentire core. The sediment sample from which the sprucepollen grains were retrieved for DNA analysis wasorganic-rich gyttja showing the first major concentrationincrease of spruce pollen (533 cm; Figure 2). The age ofthe studied layer was 10,700 cal yr BP.An intact Norway spruce cone at 545 cm sediment
depth and dated 11,000 cal yr BP [42], was used foraDNA analysis (Figure 2). Half of this cone was sent tothe Poznań Radiocarbon Laboratory for dating, whilethe other half including 6 seeds and 4 cone scales wasused for aDNA analysis. The fossil spruce pollen andcone were analyzed in the arche DNA laboratory of theHungarian Natural History Museum (NHMUS).Replication of the aDNA analyses was performed at
Uppsala University, where DNA from four additionalseeds were analyzed. These seeds were retrieved fromthe same sediment at 502, 513, 525 and 545 cm depthscorresponding to 9972, 10,145, 10,331 and 11,000 cal yrBP, respectively.
Pre-PCR preparation of the fossil samples - MolecularTaxonomy Laboratory at the Natural History Museum ofBudapest, Hungary (NHMUS)In a clean-air, DNA-free room (room 1) at the arche-DNA laboratory of NHMUS, one cm3 sediment wasremoved from the inner section of the core at 533 cmusing sterile scalpels (Figure 2). The sample was sievedthrough 120 μm mesh and stored in sterile distilledwater at 2°C until further treatment. Aliquots of the fil-trate were examined under a light microscope at magni-fication x100 (Olympus CX 42). Spruce pollen grainswere isolated and serially moved between water dropson microscope slides using sterile Hamilton syringes.Totally, we selected 462 fossil pollen grains from sedi-ments dated 10,700 cal BP and stored them at -80°Cuntil aDNA analysis. For PCR set up we followed themethods described in Parducci et al. [7], but we
Magyari et al. BMC Evolutionary Biology 2011, 11:66http://www.biomedcentral.com/1471-2148/11/66
Page 10 of 15
increased the number of pollen grains up to five in eachaliquots prepared for amplification and used a finermesh (120 μm instead of 180 μm) to obtain more effi-cient concentration of the grains.Seeds and cone scales were separated from the 11,000-
year-old fossil cone under a sterile hood irradiated byhigh intensity UV light (1 J/cm2, 1 hour, several times,turning around the particles at each step to decontami-nate the whole surface). All lab ware used for manipula-tions (forceps, tubes, pestles and mortars, etc.) wasnightly UV-irradiated.In a second room in the arche DNA lab (room 2) we
transferred the pollen grains on sterilized microscopeslides using a sterile Hamilton syringe and washedthem separately ten times with UV-irradiated sterilewater. After washing, we moved five to six grains toseparate UV-irradiated sterile PCR microtube with 5μL UV-irradiated sterile water. Along with each tube,we prepared also a negative control including 5 μL ofthe last drop of water used for washing the five grains.The tubes were stored at -20°C and before PCR theywere transferred to the third room in the arche DNAlab (room 3) where the frozen pollen grains werecrushed on ice with a sterile pestle in 12 μL sterile dis-tilled water. Five μL aliquots were immediately used as
template for PCR. Each pollen sample was amplifiedwith one primer pair. A reagent blank and a negativecontrol including 5 μL of the last washing water wereprepared for each amplification.DNA from seeds and cone scales was extracted in
room 3. We manually powdered the material using aNucleoSpin Plant II Kit (Macherey-Nagel) and followingthe CTAB protocol provided by the manufacturer in100 μL elution volume. Aliquots of each seed DNAextract was amplified with all primers used in this study.
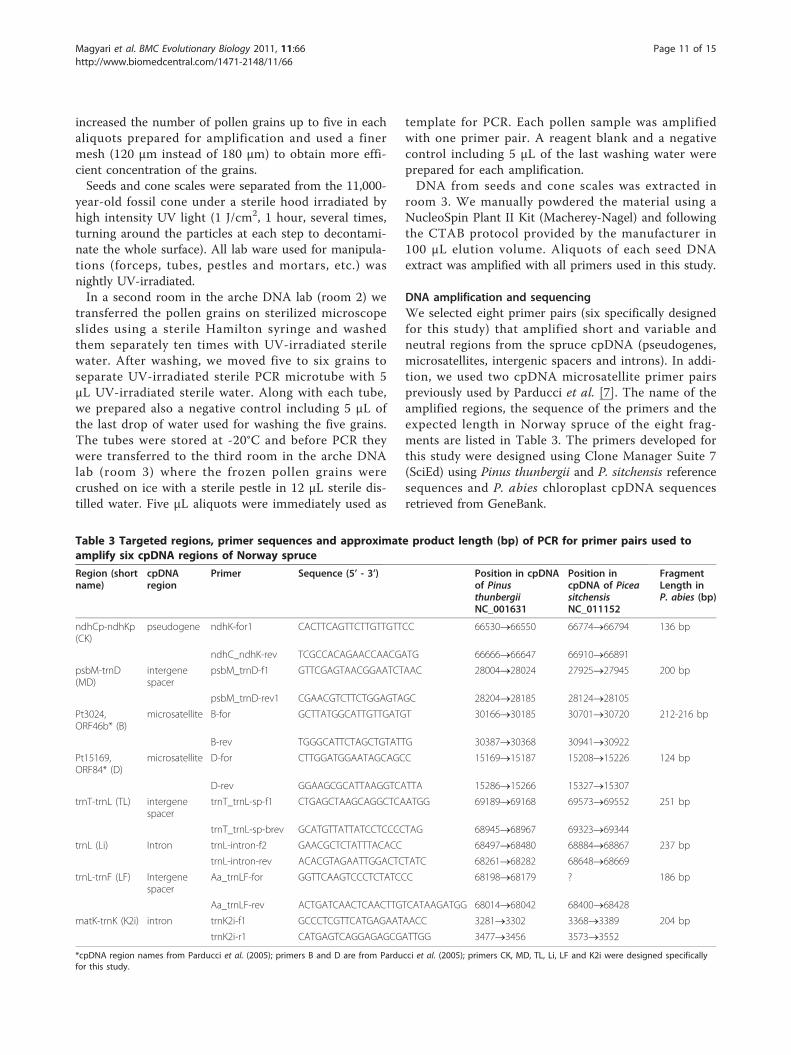
DNA amplification and sequencingWe selected eight primer pairs (six specifically designedfor this study) that amplified short and variable andneutral regions from the spruce cpDNA (pseudogenes,microsatellites, intergenic spacers and introns). In addi-tion, we used two cpDNA microsatellite primer pairspreviously used by Parducci et al. [7]. The name of theamplified regions, the sequence of the primers and theexpected length in Norway spruce of the eight frag-ments are listed in Table 3. The primers developed forthis study were designed using Clone Manager Suite 7(SciEd) using Pinus thunbergii and P. sitchensis referencesequences and P. abies chloroplast cpDNA sequencesretrieved from GeneBank.
Table 3 Targeted regions, primer sequences and approximate product length (bp) of PCR for primer pairs used toamplify six cpDNA regions of Norway spruce
Region (shortname)
cpDNAregion
Primer Sequence (5’ - 3’) Position in cpDNAof PinusthunbergiiNC_001631
Position incpDNA of PiceasitchensisNC_011152
FragmentLength inP. abies (bp)
ndhCp-ndhKp(CK)
pseudogene ndhK-for1 CACTTCAGTTCTTGTTGTTCC 66530®66550 66774®66794 136 bp
ndhC_ndhK-rev TCGCCACAGAACCAACGATG 66666®66647 66910®66891
psbM-trnD(MD)
intergenespacer
psbM_trnD-f1 GTTCGAGTAACGGAATCTAAC 28004®28024 27925®27945 200 bp
psbM_trnD-rev1 CGAACGTCTTCTGGAGTAGC 28204®28185 28124®28105
Pt3024,ORF46b* (B)
microsatellite B-for GCTTATGGCATTGTTGATGT 30166®30185 30701®30720 212-216 bp
B-rev TGGGCATTCTAGCTGTATTG 30387®30368 30941®30922
Pt15169,ORF84* (D)
microsatellite D-for CTTGGATGGAATAGCAGCC 15169®15187 15208®15226 124 bp
D-rev GGAAGCGCATTAAGGTCATTA 15286®15266 15327®15307
trnT-trnL (TL) intergenespacer
trnT_trnL-sp-f1 CTGAGCTAAGCAGGCTCAATGG 69189®69168 69573®69552 251 bp
trnT_trnL-sp-brev GCATGTTATTATCCTCCCCTAG 68945®68967 69323®69344
trnL (Li) Intron trnL-intron-f2 GAACGCTCTATTTACACC 68497®68480 68884®68867 237 bp
trnL-intron-rev ACACGTAGAATTGGACTCTATC 68261®68282 68648®68669
trnL-trnF (LF) Intergenespacer
Aa_trnLF-for GGTTCAAGTCCCTCTATCCC 68198®68179 ? 186 bp
Aa_trnLF-rev ACTGATCAACTCAACTTGTCATAAGATGG 68014®68042 68400®68428
matK-trnK (K2i) intron trnK2i-f1 GCCCTCGTTCATGAGAATAACC 3281®3302 3368®3389 204 bp
trnK2i-r1 CATGAGTCAGGAGAGCGATTGG 3477®3456 3573®3552
*cpDNA region names from Parducci et al. (2005); primers B and D are from Parducci et al. (2005); primers CK, MD, TL, Li, LF and K2i were designed specificallyfor this study.
Magyari et al. BMC Evolutionary Biology 2011, 11:66http://www.biomedcentral.com/1471-2148/11/66
Page 11 of 15
DNA amplifications were performed on all DNAextracts (from pollen, seeds and cone) using single pri-mers pairs. We used 20 μL that included 5 μL of tem-plate solution (regardless of the source), 1x reactionbuffer, 1.5 mM MgCl2, 0.1 mM dNTP (each), 0.25 mMforward and reverse primers, and 0.4 U of AmpliTaqGold polymerase (Applied Biosystems). The PCR profilewas 10 min at 94°C, 45 cycles of 20 sec at 94°C, 30 secat 55°C, 1 min at 72°C and final elongation 7 min at 72°C. Five μL of the PCR reactions were tested for ampli-cons on 2% agarose by gel-electrophoresis in 0.5x TBEand stained with ethidium bromide. In case of successfulamplification, 2-3 μL of the first PCR product was ream-plified and purified using High Pure PCR Product Purifi-cation Kit (Roche) in a PCR room in the modern DNAlab at NHMUS where spruce had never been processedbefore (room 4). Finally, DNA sequencing reactionswere prepared in a fifth room at NHMUS (room 5)using 10 ng of purified PCR products using forward andreverse primers and BigDye Terminator v1.1 CycleSequencing Kit (Applied Biosystems). After purificationthe products were run on a 3130 Genetic Analyzer(Applied Biosystems).
Analysis on extant materialFresh needles were collected from 52 adult trees ofextant spruce populations located in the Retezat Mts. Inaddition, we sampled needles from 6 herbarium speci-mens (5 from the Carpathians, 1 from the AustrianAlps) (Figure 1; Additional File 3). Needles were storedat 4°C until use, and total genomic DNA was extractedwith DNeasy Plant Mini Kit (QIAGEN). PCR amplifica-tions and DNA sequencing were performed after all fos-sil DNA analyses had been completed in room 6 thatwas physically separated from rooms 1-3 at the arche-DNA laboratory, and also from room 4 in the modernDNA laboratory, using the same procedures as for thefossil material.Altogether 833 sample and 322 control PCR reactions
were done on the modern and extant material atNHMUS (without re-amplification and sequencingPCRs).
DNA amplification, cloning and sequencing - MolecularGenetic Laboratory (EBC, Uppsala University, Sweden)Replication of the aDNA analyses was performed onfour seeds using the Quiagen Multiplex PCR kit andincreasing the number of amplification cycles to 38.This kit contains a built-in hot start polymerase enzymeand a unique PCR buffer that makes it appropriate forthe amplification of difficult templates like in the case offragmented aDNA. We run single reactions with singleprimer pairs at a time in 20 μL volume, including 3 μLof extracted DNA solution, 1X Multiplex PCR Master
Mix (QIAGEN), 0.2 μM of each primer, and water foradjusting the final volume. After amplification 5 uL ofPCR products visible as bands of the expected size on2% agarose gel were purified using ExoSAP-IT (Affyme-trix, Inc.). Two μL of purified product was used directlyfor cloning using the CloneJet PCR Cloning Kit (Fer-mentas). Two μL of the purified products were ligatedinto pJET1.2/blunt Cloning Vector in the presence ofT4 DNA ligase at room temperature for 30’. Fifty μL ofcompetent DH5 cells were transformed using 5 μl of theligation and grown in SOC solution for 90’ at 37°C. Thecells were plated on LB-ampicillin plates. Colonies werescreened in 10 uL PCRs using pJET universal primersand following manufacture’s instructions. All cloneswith inserts of expected sizes were sequenced usingMacrogen DNA Sequencing service in Korea.
Precautions against contamination and criteria used forsequence authenticationWe extracted DNA in environments specifically dedi-cated to aDNA studies (see methods). At NHMUS inHungary and at EBC in Sweden all analyses on ancientmaterial were performed in separate DNA-free rooms,in laboratories specifically dedicated to aDNA work andphysically separated from laboratories where the modernDNA analyses were performed. Analyses on extantmaterial were performed after aDNA analyses had beencompleted. No amplifications were obtained in extrac-tion and reagent controls and amplifications fromaDNA extracts always produced PCR products visibleon agarose gel as single and clear bands.Cloning is generally performed in the case of aDNA
studies to detect mosaic sequences as a result ofjumping PCR between sequences, to identify amplifi-cation errors due to post-mortem DNA damage in thetemplate and to detect PCR-slippage in the case ofmicrosatellites [20,54]. Initially we planned tosequence PCR products using forward and reverse pri-mers to detect sequence variants after cloning.Because we found no sequence variation in our pro-ducts after three independent cycle-sequencing assays,we disregarded the cloning step at NHMUS. The mul-tiple cycle-sequencing method also allowed us toexclude the presence of artifacts resulting from PCR-slippage in the microsatellite B region. Importantly,generation of mosaic sequences was excluded in ourcase due to the uniparental inheritance of the chloro-plast genome in spruce.
Data analysisAncient and extant DNA sequences were manuallyaligned in MEGA v4 [55] and identity was verified usingBLASTN [56]. The 10,700-year-old DNA sequencesobtained from pollen were analyzed together with the
Magyari et al. BMC Evolutionary Biology 2011, 11:66http://www.biomedcentral.com/1471-2148/11/66
Page 12 of 15
sequences derived from fossil seeds and cone scales atNHMUS and EBC.To compare genetic diversity in ancient and extant
spruce populations, we estimated haplotype (Hd) andnucleotide diversities (π, [57]), average number ofnucleotide differences (k, [58]), weighted average of thenumber of differences between sequences from twopopulations (KS, averaged with a weight of w = n1/(n1+n2), where n1 and n2 represent population sizes [59]),and an estimate of genetic differentiation between twopopulations (KST, calculated from KS and the averagenumber of differences between two sequences in thetotal sample [59]). We calculated the statistical supportof KS and KST values with permutation tests through1000 randomizations [59]. Gene flow between extant andancient populations was estimated using FST [59]. KST
and FST statistics are identical except for a differentweighting with population sizes [59]. Alignment gapswere considered as fifth-state characters when calculatingHd, k, KS, KST and FST values. We performed the calcula-tions in DnaSP v 4 [60].Phylogenetic relationships between ancient and
extant sequences were analyzed using B/MCMC infer-ence as implemented in MrBayes [61]. Only pointmutations in the form of transversion were taken intoconsideration, disregarding also allele length poly-morphisms of microsatellite B. In the phylogeneticanalysis we also included two previously obtained 100-year-old spruce sequences obtained by Parducci et al.[7] using primer pair B. The nucleotide substitutionmodel was selected using the Akaike Information Cri-terion in ModelTest 3.7 [62]. The analyses were run(a) on concatenated fragments using all ancient andextant sequences; (b) on concatenated fragments of allextant sequences and of the longest ancient sequences(obtained from cone scales and seeds S8, S9 and S10);(c) on single fragments on all sequences. Two paralleltests were run for 20 million generations in the case ofdataset (a) and dataset (b) to achieve convergence. Thedetermined substitution model was K81uf+I [63] inboth cases, with a proportion I = 0.9667 of invariablesites for dataset (a) and I = 0.9606 for dataset (b). Onecold and eleven heated chains were used in both ana-lyses, sampling for every 10,000 generations. After dis-carding 25% of the samples as burnin, all identifiedcompatible groups were added to consensus trees. Thetrees were visualized in FigTree [64].Substitution model for dataset (c) were TrN for frag-
ment B [55], F81 [65] for fragments D, LF, Li and TLand HKY for K2i [66], all without Γ-distributed orinvariable loci. The parallel tests were run until achiev-ing convergence (i.e. 5 million generations for fragmentK2i, 16 million generations for Li, and 20 million for B,D, LF and TL). Sampling was performed in every 10,000
generations. Twenty-five percent of the samples werediscarded as burnin and 50% majority rule consensustrees were constructed. The trees were visualized inFigTree.To map haplotype relationships for fragment B, we also
calculated a median-joining network [67] using the soft-ware Network v4.510 (http://www.fluxus-engineering.com/ accessed on September 25 2009). Two 100-year oldNorway spruce pollen sequences from Parducci et al. [7]were included in this analysis, and the entire sequenceset was truncated to the common length of 112 bp.
Additional material
Additional file 1: Sequences of the cpDNA fragments in Norwayspruce (Picea abies) with information on the region name, appliedprimer pairs, name of the fossil and extant samples and length ofthe sequence. Bold and underlined bases refer to variable positions orblocks.
Additional file 2: Radiocarbon dates and age-depth modeling ofsediment core TDB-1, Taŭl dintre Brazi (1740 m a.s.l), RetezatMountains, South Carpathians, Romania.
Additional file 3: Location and geographical coordinates of theextant Norway spruce (Picea abies) samples and herbariumspecimens used for cpDNA analysis.
AcknowledgementsThis research was funded by the European Commission through a Marie CurieReintegration Grant (MERG-CT-2006-041088: Combining Palaeoecology andPalaeogenetics), the Bólyai Scholarship (BO/00518/07) and the OTKA ResearchFunds (F026036, PD73234) to EKM. This is MTA-MTM Paleo Contribution No.121. The Hungarian Scholarship Board provided postdoctoral grant to MB atthe Hungarian Natural History Museum. Additional funding to MB was providedby the research funding program “LOEWE - Landes-Offensive zur EntwicklungWissenschaftlich-ökonomischer Exzellenz” of Hesse’s Ministry of HigherEducation, Research, and the Arts. LP research was supported by The SwedishNational Council of Research and The Carl Trygger’s Foundation in Sweden. Wethank Mária Tuschek and Anikó Gál for her help during laboratory analyses.
Author details1MTA-MTM Research Group for Paleontology, 1476 Budapest, P. O. Box 222,Hungary. 2Hungarian Natural History Museum, 1431 Budapest, P. O. Box 137,Hungary. 3Molecular Biology Center, Babeş -Bolyai University, Str. TreboniuLaurian 42, 400271 Cluj, Romania. 4Balaton Limnological Research Institute,8237 Tihany, P.O. Box 35, Hungary. 5University of Debrecen, Department ofInorganic and Analytical Chemistry, 4010 Debrecen, P.O. Box 21, Hungary.6Department of Ecology and Genetics, Evolutionary Biology Centre, UppsalaUniversity, Norbyvägen 18D, 75236, Uppsala, Sweden. 7Biodiversität undKlima Forschungszentrum (BiK-F), Senckenberganlage 25, D-60325 Frankfurtam Main, Germany.
Authors’ contributionsÁM, JN and EM designed the experiment. EM, MB and MB collected andsampled the extant material. EM provided the fossil samples and thepalynological data information. IR conducted the taxonomic identification ofthe macrofossils. ÁM, JN, EM and LP conducted PCR and sequencing analyses.ÁM and MB performed sequence alignment and data analysis. EM, LP, MB andÁM wrote the manuscript. All authors read and approved the final manuscript.
Competing interestsThe authors declare that they have no competing interests.
Received: 7 October 2010 Accepted: 10 March 2011Published: 10 March 2011
Magyari et al. BMC Evolutionary Biology 2011, 11:66http://www.biomedcentral.com/1471-2148/11/66
Page 13 of 15
References1. Suyama Y, Kawamuro K, Kinoshita I, Yoshimura K, Tsumura Y, Takahara H:
DNA sequence from a fossil pollen of Abies spp. from Pleistocene peat.Genes Genet Syst 1996, 71(3):145-149.
2. Poinar HN, Hofreiter M, Spaulding WG, Martin PS, Stankiewicz BA, Bland H,Evershed RP, Possnert G, Pääbo S: Molecular coproscopy: Dung and dietof the extinct ground sloth Nothrotheriops shastensis. Science 1998,281:402-406.
3. Dumolin-Lapègue S, Pemonge MH, Gielly L, Taberlet P, Petit RJ:Amplification of oak DNA from ancient and modern wood. MolecularEcology 1999, 8:2137-2140.
4. Küch M, Rohland N, Betancourt JL, Latorre C, Steppan S, Poinar HN:Molecular analysis of a 11700-year-old rodent midden from theAtacama Desert, Chile. Molecular Ecology 2002, 11:913-924.
5. Höss M, Jaruga P, Zastawny TH, Dizdaroglu M, Pääbo S: DNA damage andDNA sequence retrieval from ancient tissues. Nucleic Acids Research 1996,24:1304-1307.
6. Coolen MJL, Boere A, Abbas B, Baas M, Wakeham SG, Sinninghe Damsté JS:Ancient DNA derived from alkenone-biosynthesizing haptophytes andother algae in Holocene sediments from the Black Sea. Paleoceanography2006, 21, PA1005.
7. Parducci L, Suyama Y, Lascoux M, Bennett KD: Ancient DNA from pollen: agenetic record of population history in Scots pine. Molecular Ecology2005, 14:2873-82.
8. Lia VV, Confalonieri VA, Ratto N, Hernández JAC, Alzogaray AMM, Poggio L,Brown TA: Microsatellite typing of ancient maize: insights into thehistory of agriculture in southern South America. Proceedings of the RoyalSociety London B 2007, 274:545-554.
9. Brown TA, Jones MK, Powell W, Allaby RG: The complex origins ofdomesticated crops in the Fertile Crescent. Trends in Ecology & Evolution2009, 24:103-109.
10. Bennett KD, Parducci L: DNA from pollen: principles and potential. TheHolocene 2006, 16:1031-1034.
11. Provan J, Bennett KJ: Phylogeographic insights into cryptic glacial refugia.Trends in Ecology and Evolution 2008, 23:564-571.
12. Davis MB, Shaw RG: Range Shifts and Adaptive Responses to QuaternaryClimate Change. Science 2001, 292:673-679.
13. Leonard JA: Ancient DNA applications for wildlife conservation. MolecularEcology 2008, 17:4186-4196.
14. Hofreiter M: Long DNA sequences and large data sets: investigating theQuaternary via ancient DNA. Quaternary Science Reviews 2008, 27:2586-2592.
15. Rohland N, Malaspinas AS, Pollack JL, Slatkin M, Matheus P, Hofreiter M:Proboscidean mitogenomics: chronology and mode of elephantevolution using Mastodon as outgroup. PLoS Biology 2007, 5:e207.
16. Barnes I, Matheus P, Shapiro B, Jensen D, Cooper A: Dynamics ofPleistocene population extinctions in Beringian brown bears. Science2002, 295:2267-2270.
17. Valdiosera CE, García-Garitagoitia JL, Garcia N, Doadrio I, Thomas MG,Hänni C, Arsuaga JL, Barnes J, Hofreiter M, Orlando L, Götherström A:Surprising migration and population size dynamics in ancient Iberianbrown bears (Ursus arctos). Proceedings of the National Academy of Sciencesof the USA 2008, 105:5123-5128.
18. Liepelt S, Bialozyt R, Ziegenhagen B: Wind-dispersed pollen mediatespostglacial gene flow among refugia. Proceedings of the National Academyof Sciences of the USA 2002, 99:14590-14594.
19. Paffetti D, Vettori C, Caramelli D, Vernesi C, Lari M, Paganelli A, Paule L,Giannini R: Unexpected presence of Fagus orientalis complex in Italy asinferred from 45,000-year-old DNA pollen samples from Venice lagoon.BMC Evolutionary Biology 2007, 7(Suppl 2):S6.
20. Schlumbaum A, Tensen M, Jaenicke-Després V: Ancient plant DNA inarchaeobotany. Vegetation History and Archaeobotany 2008, 17:233-244.
21. Vendramin G, Anzidei M, Madaghiele A, Sperisen C, Bucci G: Chloroplastmicrosatellite analysis reveals the presence of population subdivision inNorway spruce (Picea abies K.). Genome 2000, 43:68-78.
22. Bucci G, Vendramin GG: Delineation of genetic zones in the EuropeanNorway spruce natural range: preliminary evidence. Molecular Ecology2000, 9:923-934.
23. Sperisen C, Büchler U, Gugerli F, Mátyás G, Geburek T, Vendramin GG: Tandemrepeats in plant mitochondrial genomes: application to the analysis ofpopulation differentiation in the conifer Norway spruce. Molecular Ecology2001, 10:257-263.
24. Ravazzi C: Late Quaternary history of spruce in southern Europe. Reviewof Palaeobotany and Palynology 2002, 120:131-177.
25. Tollefsrud MM, Kissling R, Gugerli F, Johnsen O, Skrøppa T, Cheddadi R, Vander Knaap WO, Latałowa M, Terhürne-Berson R, Litt T, Geburek T,Brochmann C, Sperisen C: Genetic consequences of glacial survival andpostglacial colonization in Norway spruce: combined analysis ofmitochondrial DNA and fossil pollen. Molecular Ecology 2008,17:4134-4150.
26. Tollefsrud MM, Sonstebo JH, Brochmann C, Johnsen O, Skroppa T,Vendramin GG: Combined analysis of nuclear and mitochondrial markersprovide new insight into the genetic structure of North European Piceaabies. Heredity 2009, 102:549-562.
27. Fărcaş S, de Beaulieu J, Reille M, Coldea G, Diaconeasa B, Goeury C,Goslar T, Jull T: First 14C datings of Late Glacial and Holocene pollensequences from Romanian Carpathes. Comptes Rendus de l’Académie desSciences - Series III - Sciences de la Vie 1999, 322:799-807.
28. Feurdean A, Wohlfarth B, Björkman L, Tantau I, Bennike O, Willis KJ, Farcas S,Robertsson AM: The influence of refugial population on Lateglacial andearly Holocene vegetational changes in Romania. Review of Palaeobotanyand Palynology 2007, 145:305-320.
29. Willis K, Sümegi P, Braun M, Tóth A: Does soil change cause vegetationchange or vica versa? A temporal perspective from Hungary. Ecology1997, 78:740-750.
30. Magyari EK, Jakab G, Braun M, Buczkó K, Bálint M: High-resolution study ofLate Glacial and Early Holocene tree line changes in the SouthernCarpathian Mountains. Geophysical Research Abstracts 2009, 11:10549.
31. Seppä H, Hicks S: Integration of modern and past pollen accumulationrate (PAR) records across the arctic tree-line: a method for more precisevegetation reconstructions. Quaternary Science Reviews 2006, 25:1501-1516.
32. Davis MB, Deevey E: Pollen accumulation rates: estimates from late-glacial sediment of Rogers Lake. Science 1964, 145:1293-1295.
33. Bennett KD: Postglacial population expansion of forest trees in Norfolk,UK. Nature 1983, 303:164-167.
34. Giesecke T, Fontana S: Revisiting pollen accumulation rates from Swedishlake sediments. The Holocene 2008, 18:293-305.
35. Seppä H, Alenius T, Bradshaw RHW, Giesecke T, Heikkilä M, Muukkonen P:Invasion of Norway spruce (Picea abies) and the rise of the borealecosystem in Fennoscandia. Journal of Ecolog 2009, 97:629-640.
36. Anderson-Carpenter LL, McLachlan JS, Jackson ST, Kuch M, Lumibao CY,Poinar HN: Ancient DNA from lake sediments: Bridging the gap betweenpaleoecology and genetics. BMC Evolutionary Biology 2011, 11:30.
37. Feurdean AN, Willis KJ, Astaloş C: Legacy of the past land-use changesand management on the ‘natural’ upland forest composition in theApuseni Natural Park, Romania. The Holocene 2009, 19:967-981.
38. Hewitt G: Some genetic consequences of ice ages, and their roles indivergence and speciation. Biological Journal of the Linnean Society 1996,58:247-276.
39. Hewitt G: The genetic legacy of the Quaternary ice ages. Nature 2000,405:907-913.
40. Petit RJ, Aguinagalde I, de Beaulieu JL, Bittkau C, Brewer S, Cheddadi R,Ennos R, Fineschi S, Grivet D, Lascoux M, Mohanty A, Müller-Starck G,Demesure-Musch B, Palmé A, Martín JP, Rendell S, Vendramin GG: GlacialRefugia: Hotspots But Not Melting Pots of Genetic Diversity. Science2003, 300(5625):1563-5156.
41. Magri D, Vendramin GG, Comps B, Dupanloup I, Geburek T, Gömöry D,Latałova M, Litt T, Paule L, Roure JM, Tantau I, van der Knaap WO, Petit RJ,de Beaulieu J-L: A new scenario for the quarternary history of Europeanbeech populations: paleobotanical evidence and genetic consequences.New Phytologist 2006, 171:199-221.
42. Magyari EK, Braun M, Buczkó K, Kern Z, László P, Hubay K, Bálint M:Radiocarbon chronology of glacial lake sediments in the Retezat Mts (SCarpathians, Romania): a window to Lateglacial and Holocene climatic andpalaeoenvironmental changes. Central European Geology 2009, 52:225-248.
43. Comps B, Gömöry , Letouzey D, Thiébaut B, Petit RJ: Diverging TrendsBetween Heterozygosity and Allelic Richness During PostglacialColonization in the European Beech. Genetics 2001, 157:389-397.
44. Nyárádi G: Flora şi vegetaţia Munţilor Retezat Bucuresti, Editura AcademieiRepublicii Populare Române; 1958.
45. Grodzińska K, Godzik B, Frączek W, Badea O, Oszlányi J, Postelnicu D,Shparyk Y: Vegetation of the selected forest stands and land use in theCarpathian Mountains. Environmental Pollution 2004, 130:17-32.
Magyari et al. BMC Evolutionary Biology 2011, 11:66http://www.biomedcentral.com/1471-2148/11/66
Page 14 of 15
46. Margulies M, Egholm M, Altman WE, Attiya S, Bader JS, Bemben LA, Berka J,Braverman MS, Chen YJ, Chen Z, Dewell SB, Du L, Fierro JM, Gomes XV,Godwin BC, He W, Helgesen S, Ho CH, Irzyk GP, Jando SC, Alenquer ML,Jarvie TP, Jirage KB, Kim JB, Knight JR, Lanza JR, Leamon JH, Lefkowitz SM,Lei M, Li J, Lohman KL, Lu H, Makhijani VB, McDade KE, McKenna MP,Myers EW, Nickerson E, Nobile JR, Plant R, Puc BP, Ronan MT, Roth GT,Sarkis GJ, Simons JF, Simpson JW, Srinivasan M, Tartaro KR, Tomasz A,Vogt KA, Volkmer GA, Wang SH, Wang Y, Weiner MP, Yu P, Begley RF,Rothberg JM: Genome sequencing in microfabricated high-densitypicolitre reactors. Nature 2005, 437:376-380.
47. Stiller M, Knapp M, Stenzel U, Hofreiter M, Meyer M: Direct multiplexsequencing (DMPS) - a novel method for targeted high-throughputsequencing of ancient and highly degraded DNA. Genome Research 2009,19:1843-1848.
48. Tinner W, Kaltenrieder P: Rapid responses of high-mountain vegetation toearly Holocene environmental changes in the Swiss Alps. Journal ofEcology 2005, 93:936-947.
49. Heled J, Drummond A: Bayesian inference of population size history frommultiple loci. BMC Evolutionary Biology 2008, 8:289.
50. Jankovská V: Late glacial finds of Pinus cembra l. in the Lubovnianskákotlina Basin. Folia Geobotanica & Phytotaxonomica 1984, 19:323-325.
51. Jankovská V: Palaeoecology of Pinus cembra, Larix europaea and Piceaexcelsa in the Poprad part of Spišská kotlina Basin. Diverzita rastlinatvaSlovenska, Zbornik zo VI. zjazdu SBS pri SAV 1995, 6:141-145.
52. Navascués M, Emerson BC: Elevated substitution rate estimates fromancient DNA: model violation and bias of the Bayesian methods.Molecular Ecology 2009, 18:4390-4397.
53. Reuther AU, Urdea P, Geiger C, Ivy-Ochs S, Niller HP, Kubik PW, Heine K:Late Pleistocene glacial chronology of the Pietrele Valley, RetezatMountains, Southern Carpathians constrained by 10Be exposure agesand pedological investigations. Quaternary International 2007, 164-165:151-169.
54. Pääbo S, Poinar H, Serre D, Jaenicke-Despres V, Hebler J, Rohland N,Kuch M, Krause J, Vigilant L, Hofreiter M: Genetic analyses from ancientDNA. Annual Review of Genetics 2004, 38:645-679.
55. Tamura K, Dudley J, Nei M, Kumar S, MEGA4: Molecular EvolutionaryGenetics Analysis (MEGA) software version 4.0. Molecular Biology andEvolution 2004, 24:1596-1599.
56. Altschul SF, Madden TL, Schäffer AA, Zhang J, Zhang Z, Miller W,Lipman DJ: Gapped BLAST and PSI-BLAST: a new generation of proteindatabase search programs. Nucleic Acids Research 1997, 25:3389-3402.
57. Nei M: Molecular Evolutionary Genetics New York, Columbia University Press;1987.
58. Tajima F: Evolutionary relationship of DNA sequences in finitepopulations. Genetics 1983, 105:437-460.
59. Hudson RR, Boos D, Kaplan NL: A statistical test for detecting populationsubdivision. Molecular Biology and Evolution 1992, 9:138-151.
60. Rozas J, Sánchez-DelBarrio JC, Messeguer X, Rozas R: DnaSP, DNApolymorphism analyses by the coalescent and other methods.Bioinformatics 2003, 19:2496-2497.
61. Huelsenbeck JP, Ronquist F: MrBayes: Bayesian inference of phylogenetictrees. Bioinformatics 2001, 17:754-755.
62. Posada D, Crandall KA: Modeltest: testing the model of DNA substitution.Bioinformatics 1998, 14:817-818.
63. Kimura M: Estimation of evolutionary distances between homologousnucleotide sequences. Proceedings of the National Academy of Sciences ofthe USA 1981, 78:454-458.
64. Rambaut A: Figtree: Tree figure drawing tool version 1.2.1 [http://tree.bio.ed.ac.uk/], Computer program, Accessed 21 January 2009.
65. Felsenstein J: Evolutionary trees from DNA sequences: a maximumlikelihood approach. Journal of Molecular Evolution 1981, 17:368-376.
66. Hasegawa M, Kishino K, Yano T: Dating the human-ape splitting by amolecular clock of mitochondrial DNA. Journal of Molecular Evolution1985, 22:160-174.
67. Bandelt HJ, Forster P, Röhl A: Median-joining networks for inferringintraspecific phylogenies. Molecular Biology and Evolution 1999, 16:37-48.
doi:10.1186/1471-2148-11-66Cite this article as: Magyari et al.: Population dynamics and geneticchanges of Picea abies in the South Carpathians revealed by pollen andancient DNA analyses. BMC Evolutionary Biology 2011 11:66.
Submit your next manuscript to BioMed Centraland take full advantage of:
• Convenient online submission
• Thorough peer review
• No space constraints or color figure charges
• Immediate publication on acceptance
• Inclusion in PubMed, CAS, Scopus and Google Scholar
• Research which is freely available for redistribution
Submit your manuscript at www.biomedcentral.com/submit
Magyari et al. BMC Evolutionary Biology 2011, 11:66http://www.biomedcentral.com/1471-2148/11/66
Page 15 of 15