
Ring-level models for predicting wood and fibre properties of Abies balsamea
17
See discussions, stats, and author profiles for this publication at: http://www.researchgate.net/publication/265014169 Ring-level models for predicting wood and fibre properties of Abies balsamea ARTICLE in WOOD SCIENCE AND TECHNOLOGY · AUGUST 2014 Impact Factor: 1.87 · DOI: 10.1007/s00226-014-0664-x CITATION 1 DOWNLOADS 54 VIEWS 32 4 AUTHORS, INCLUDING: Francesco Cortini Natural Resources Canada 12 PUBLICATIONS 25 CITATIONS SEE PROFILE Isabelle Duchesne Natural Resources Canada 25 PUBLICATIONS 215 CITATIONS SEE PROFILE Available from: Francesco Cortini Retrieved on: 22 July 2015
Transcript of Ring-level models for predicting wood and fibre properties of Abies balsamea

Seediscussions,stats,andauthorprofilesforthispublicationat:http://www.researchgate.net/publication/265014169
Ring-levelmodelsforpredictingwoodandfibrepropertiesofAbiesbalsamea
ARTICLEinWOODSCIENCEANDTECHNOLOGY·AUGUST2014
ImpactFactor:1.87·DOI:10.1007/s00226-014-0664-x
CITATION
1
DOWNLOADS
54
VIEWS
32
4AUTHORS,INCLUDING:
FrancescoCortini
NaturalResourcesCanada
12PUBLICATIONS25CITATIONS
SEEPROFILE
IsabelleDuchesne
NaturalResourcesCanada
25PUBLICATIONS215CITATIONS
SEEPROFILE
Availablefrom:FrancescoCortini
Retrievedon:22July2015

ORI GIN AL
Ring-level models for predicting wood and fibreproperties of Abies balsamea
Francesco Cortini • Arthur Groot • Queju Tong •
Isabelle Duchesne
Received: 12 August 2013
� Crown Copyright 2014
Abstract Wood and fibre properties such as wood density, microfibril angle, and
modulus of elasticity are industrially relevant factors in determining the mechanical
properties of wood. Radial ring-level predictive models of these properties were
developed using balsam fir data from a long-term trial in New Brunswick (Canada),
where precommercial thinning was applied 8 years after the site was harvested. The
mixed effects models developed accounted for most of the variability in wood
density (68 %), microfibril angle (94 %), and modulus of elasticity (77 %) with low
RMSE. This study shows that balsam fir wood and fibre properties are strongly
related to distance from the pith, particularly in the first 20 mm, and much less to
annual ring width. Disk height and selected weather variables related to air tem-
perature during the growing season significantly improved the models, whereas the
effect of precommercial thinning was not significant. These equations can be
incorporated into computer models, such as Optitek, that simulate mill recovery and
wood properties to obtain accurate information on wood products. The unexplained
variation in these models is likely related in part to between-tree genetic variation,
which is unknown in this study.
F. Cortini (&)
Natural Resources Canada, Canadian Wood Fibre Centre, 506 West Burnside Rd., Victoria,
BC V8Z 1M5, Canada
e-mail: [email protected]
A. Groot
Natural Resources Canada, Canadian Wood Fibre Centre, 1219 Queen St. E., Sault Ste. Marie,
ON P6A 2E5, Canada
Q. Tong
FPInnovations, 2665 East Mall, Vancouver, BC V6T 1W6, Canada
I. Duchesne
Natural Resources Canada, Canadian Wood Fibre Centre, 1055 Du P.E.P.S. St., Quebec,
QC G1V 4C7, Canada
123
Wood Sci Technol
DOI 10.1007/s00226-014-0664-x

Introduction
Balsam fir (Abies balsamea (L.) Mill.) is a widely distributed and abundant conifer
in eastern Canada and the northeastern United States of America. Balsam fir stands
often regenerate to high densities through plentiful advance regeneration, prolific
seed production, and vigorous growth on a variety of soils. Consequently,
precommercial thinning (PCT) has been increasingly applied to overstocked
balsam fir stands in order to enhance saw log production (e.g. Pitt and Lanteigne
2008). Although stand growth and yield predictions are relatively well documented
for balsam fir, there are still knowledge gaps in terms of its wood quality
attributes.
In eastern Canada, balsam fir is mainly used for lumber and pulp production. The
wood is light in weight, relatively soft, and fairly low in resistance to impact (Burns
and Honkala 1990). Balsam fir has the lowest strength properties of the spruce–
pine–fir (SPF) species group (Zhang and Koubaa 2008) and is therefore a minor
machine stress-rated (MSR) species.
Many studies have already shown a strong relationship between wood and fibre
properties and important attributes of wood and fibre products (e.g. Duchesne et al.
1997; Jansson 2000; Wilhelmsson et al. 2000). Thus, the capability to predict wood
and fibre properties can improve planning of wood flow to industrial plants and can
allow a more in-depth analyses of wood resources (Wilhelmsson et al. 2002).
The differences in wood and fibre properties of the juvenile core of the tree and
that of the outer wood can be relatively large and can influence the processing
properties of each log. Changes in properties from pith to bark are affected by many
factors including site, genotype, and silvicultural management of the stand
(Raymond and Joe 2007). Additionally, the tree crown has long been considered
to have a regulatory influence on wood formation and fibre properties (Larson
1969).
Among the many wood and fibre properties, wood density, microfibril angle,
and modulus of elasticity were found to be relevant factors in determining the
mechanical performance of wood (e.g. Cave and Walker 1994; Reiterer et al.
1999). Wood density is of key importance in forest products manufacturing
because it has a major impact on yield, quality, and value of wood products.
Microfibril angle in the secondary cell wall layer (S2), although not as easily
measurable as density, is known as one of the major determinants of stiffness and
longitudinal shrinkage of wood (Cave and Walker 1994; Harris and Meylan 1965).
Modulus of elasticity, or a material’s tendency to be deformed elastically (non-
permanently), is influenced by the density of wood fibres, and their underlying cell
wall layers composed of cellulose microfibrils embedded in a complex matrix of
lignin and hemicelluloses. The combined effect of these properties determines
product performance.
The purpose of this study was to develop radial ring-level predictive models
of wood density, microfibril angle, and modulus of elasticity using balsam fir
data from a long-term PCT trial in New Brunswick, Canada (Pitt and Lanteigne
2008).
Wood Sci Technol
123
Methods
Study description and sampling
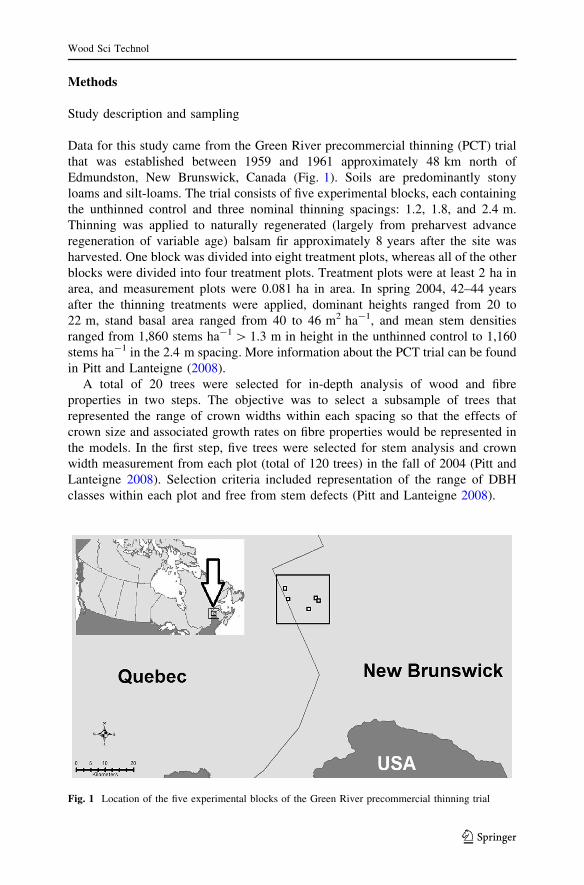
Data for this study came from the Green River precommercial thinning (PCT) trial
that was established between 1959 and 1961 approximately 48 km north of
Edmundston, New Brunswick, Canada (Fig. 1). Soils are predominantly stony
loams and silt-loams. The trial consists of five experimental blocks, each containing
the unthinned control and three nominal thinning spacings: 1.2, 1.8, and 2.4 m.
Thinning was applied to naturally regenerated (largely from preharvest advance
regeneration of variable age) balsam fir approximately 8 years after the site was
harvested. One block was divided into eight treatment plots, whereas all of the other
blocks were divided into four treatment plots. Treatment plots were at least 2 ha in
area, and measurement plots were 0.081 ha in area. In spring 2004, 42–44 years
after the thinning treatments were applied, dominant heights ranged from 20 to
22 m, stand basal area ranged from 40 to 46 m2 ha-1, and mean stem densities
ranged from 1,860 stems ha-1 [ 1.3 m in height in the unthinned control to 1,160
stems ha-1 in the 2.4 m spacing. More information about the PCT trial can be found
in Pitt and Lanteigne (2008).
A total of 20 trees were selected for in-depth analysis of wood and fibre
properties in two steps. The objective was to select a subsample of trees that
represented the range of crown widths within each spacing so that the effects of
crown size and associated growth rates on fibre properties would be represented in
the models. In the first step, five trees were selected for stem analysis and crown
width measurement from each plot (total of 120 trees) in the fall of 2004 (Pitt and
Lanteigne 2008). Selection criteria included representation of the range of DBH
classes within each plot and free from stem defects (Pitt and Lanteigne 2008).
Fig. 1 Location of the five experimental blocks of the Green River precommercial thinning trial
Wood Sci Technol
123

In the second step, the 30 trees from each spacing were pooled and divided into
five groups of six trees, with each group representing equal intervals of the range of
crown width for that spacing. One tree was randomly selected from each group of
six trees. The result of these two steps was the selection of five trees from each
spacing (total of 20 trees) for laboratory analysis of wood and fibre properties. The
number of disks collected from each tree varied depending on tree height. For trees
taller than 14 m, disks were sampled at 2-m intervals for the first 10 m of the stem,
and at 1-m intervals for the upper part of the tree. For trees shorter than 14 m, disks
were uniformly sampled at 1-m intervals. For each tree, disks were also collected at
stump height and at breast height. Stump height disks were excluded from analysis
because preliminary analysis indicated that fibre properties at stump height
substantially differ from the rest of the tree, likely due to butt flare and frequent
compression wood in this region of the stem. Cortini et al. (2013) also excluded
stump height disks when investigating the longitudinal distribution of ring area.
Sample preparation and analysis
A total of 268 disks were analysed with a SilviScanTM system (Evans et al. 1996)
located at the FPInnovations laboratory in Vancouver, British Columbia, Canada.
The system combines image analysis, X-ray densitometry, and X-ray diffractometry
to provide multiple wood and fibre properties including pith-to-bark profiles of
wood density (WD), microfibril angle (MFA), and modulus of elasticity (MOE).
A 15 9 15 mm2 bark-to-bark block encompassing the pith was cut from the
north side of each wood disk. The blocks were soaked in acetone solution for 12 h
and later extracted for 8 h at 70 �C in a modified Soxhlet extraction system. This
process removes resinous substances that may interfere with density measurements.
After extraction, the blocks were air-dried and conditioned at 20 �C temperature and
40 % relative humidity until the moisture content reached approximately 8 %. The
blocks were then cut into 2 9 7 mm2 (tangentially 9 longitudinally) pith-to-bark
strips with specially designed pneumatic twin blade saws. One cross section of each
strip was polished with various grits of sandpaper (i.e. 400-grit to 1,200-grit) to
obtain a smooth surface for image analysis. Each sample was then scanned for cell
dimensions, WD, and MFA using optical microscopy, X-ray densitometry, and
X-ray diffractometry, respectively. Ring orientation from image analysis was used
as reference for X-ray densitometry and X-ray diffractometry analyses. The samples
were then analysed by the densitometer and diffractometer at variable angles to
correct for annual growth ring orientation. WD was determined at 25-lm resolution,
whereas MFA was determined at 1-mm resolution.
The densitometric measurements were based on Beer’s Law, which states that the
intensity of an X-ray beam that passes through a sample falls off exponentially with
sample thickness, and the extent of that attenuation is related to the density of the
sample.
The diffraction profiles provided information about the orientation of the
cellulose microfibrils in the S2 layer of the secondary cell wall (Evans 1999) in
relation to the longitudinal cell axis. MFA was estimated based on the relationship
between the variance of the 002 azimuthal diffraction profile of cellulose-I and
Wood Sci Technol
123
microfibril orientation distribution. The 002 diffraction patterns were obtained from
the planes whose normal was perpendicular to the microfibril axis. More
information about this technique can be found in Evans et al. (1996) and Evans
(1999).
Wood density (WD) from the X-ray densitometry analysis and the coefficient of
variation of the intensity of the X-ray diffraction profile (ICV) were then combined
to compute the fibre dynamic MOE (Evans 2006):
MOE ¼ A ICVWDð ÞB ð1Þ
The ICV includes the scattering from the S2 layer and the background scattering
from other cell wall constituents such as the S1 and S3 layers, parenchyma, and
amorphous cellulose and lignin present in the fibre wall. The model contains two
statistically determined calibration constants (A and B), which have been shown to
be insensitive to species, and relate to the sonic resonance method used for cali-
bration of MOE (Evans 2006).
Variable selection
For this study, the following wood and fibre properties measured with SilviScanTM
were selected: (1) distance from the pith (DP), (2) ring width (RW), (3) basic wood
density (WD), (4) microfibril angle (MFA), and (5) modulus of elasticity (MOE).
Two disks, from each of two different trees, with a lower ring count than those
disks higher up within the same stem (likely caused by stem defects or extremely
narrow rings) were removed from the analysis. One highly suppressed tree
presented three disks with a lower ring count than those disks higher up within the
same stem, and the entire tree was therefore removed from the analysis. A total of
19 trees, 209 disks, and 6,278 rings were used to develop the predictive models
(Table 1).
Tree and stand attributes including crown radius, crown length, stand dominant
tree height, and basal area of the trees larger than the subject tree (within each of
the four treatment plots) were measured for each tree. Annual weather data relative
to the growing seasons were also available (Table 1) (McKenney et al. 2011). The
weather variables tested included: mean annual temperature, mean temperature
during the growing season, mean annual precipitation, mean precipitation during
the growing season, precipitation of the wettest period, precipitation of the driest
period, number of days of the growing season, GDD (i.e. growing degree
days [ 5 �C), and Julian day number at end of growing season. The growing
season is defined as the period starting when the mean daily temperature is greater
than or equal to 5 �C for five consecutive days from 1 March and ending when
minimum temperatures are below -2 �C after 1 August. Some parameters are
based on time periods associated with the growing season, as follows: period 1
includes the 3 months prior to the growing season; period 2 includes the first
6 weeks of the growing season; period 3 includes the entire growing season; and
period 4 includes the final weeks of the growing season (i.e. period 3–period 2)
(Mackey et al. 1996).
Wood Sci Technol
123

Model development
Given the hierarchical structure of the dataset (i.e. tree rings nested within disks and
disks nested within trees), the parameters were estimated using nonlinear mixed
effect models, which can account for multiple sources of variation and the mutual
dependence of observations. By using tree and disk effects as random subjects in the
models, the parameter estimates can vary around the fixed effects values. Moreover,
the appropriate variance function and correlation structure were included into the
model (as suggested by Pinheiro and Bates 2000) in order to model heterosced-
asticity and unequal variance among within-group errors.
Preliminary analysis indicated that an exponential equation provided the best fit
between the wood and fibre properties investigated (i.e. WD, MFA, and MOE), and
RW and DP. The base model comprises two components, as follows:
Yijz ¼ a0 þ a1 � EXPða2 � RWijzÞ þ a3 � EXPða4 � DPijzÞ þ eijz ð2Þ
where Yijz wood density (kg m-3), or microfibril angle (�), or modulus of elasticity
(GPa) of ring z, in disk j, in tree i, RWijz ring width (mm), DPijz Distance from the
Pith (mm), and an (n = 0, 1, 2, 3, and 4) are the fixed effects parameters; the eijz
term represents the unexplained error.
The sampling strategy did not use the block structure of the original experiment,
but the selected trees were well-distributed across the range of crown widths and
spacing treatments. Consequently, indicator variables were used to test whether
treatment effects were present when the effects of RW and DP were accounted for.
In a subsequent step, the base model was modified by adding one-by-one in separate
steps (in linear form) tree-level attributes such as disk height above ground, tree
height, tree age, live crown length, crown radius, crown ratio (i.e. crown length/tree
height), crown base projected area, height to crown base, crown volume (i.e. volume
of a cone), crown surface area, and diameter at breast height. Only those variables
that contributed significantly (a\ 0.05) to the model were retained.
Table 1 Basic statistical information for selected variables
Minimum Mean Maximum Standard deviation
Wood density (kg m-3) 230.0 403.7 854.0 61.9
Microfibril angle (�) 7.30 13.52 45.30 6.96
Modulus of elasticity (GPa) 1.70 10.97 18.00 2.98
Ring width (mm) 0.050 1.818 7.150 1.103
Distance from pith (mm) 0.05 39.61 144.72 26.83
Disk height (m) 1.3 6.8 19.0 4.5
Growing degree days 796 1,148 1,531 121
Mean growing season temperature (�C) 10.5 12.4 14.8 0.7
Tree age at breast height 48 59 77 7.7
Diameter at breast height 1.3 m (cm) 10.0 19.4 30.6 6.1
Tree height (m) 12.0 17.3 21.4 2.7
Wood Sci Technol
123

Furthermore, other tree attributes were tested relative to the stand characteristics
such as basal area, basal area of the larger trees (i.e. the basal area sum of each tree
larger than the subject tree within the plot) (Biging and Dobbertin 1995), and
dominant height.
In a final step, it was tested whether the inclusion of annual weather information
improved the overall model fit.
The models were then compared using several criteria including: (1) residual
plots, (2) the coefficient of determination (Pseudo-R2), (3) Akaike’s information
criterion (AIC; Burnham and Anderson 1998), and (4) the root mean square error
(RMSE) of each wood and fibre attribute (i.e. absolute values and percentage
relative to the averaged wood and fibre attribute). Parameter estimation was
completed using the NLME statistical package (Pinheiro et al. 2009) in R (version
2.15.1) (The R foundation for Statistical Computing).
Results
The inclusion of indicator variables representing the treatment effects did not
significantly improve the model (p [ 0.05) and were therefore not included in the
final models.
Among the tree-level attributes and the tree attributes relative to the stand
characteristics tested only disk height for MFA and MOE significantly improved the
final model. For MFA, after including disk height, the parameter value related to
ring width (a2) became not significantly different from zero, and therefore, RW was
removed from the final model.
Annual weather information significantly improved the final models. GDD (i.e.
growing degree days [ 5 �C) improved the model fit for WD and MFA, while
MTGS (i.e. mean temperature during the growing season) improved the model fit of
MOE.
The following final model provided the best fit for WD:
Yijz ¼ a0 þ ða1 þ ua1iÞ � EXPða2 � RWijzÞ þ ða3 þ ua3iÞ � EXPða4 � DPijzÞþ a5 � GDDþ eijz ð3Þ
where Yijz wood density (kg m-3) of ring z, in disk j, in tree i, GDD growing degree
days above 5 �C, and an (n = 0, 1, 2, 3, 4, and 5) are the fixed effects parameters.
For tree i, the error structure is defined by an unstructured variance–covariance
matrix of random effects uani with a power variance function Gi (uani, d) = |DPijz|d,
and a serial correlation function Ci(/) = CAR(1) to account for correlation
between disks j within each tree i.
The RMSE for Eq. 3 is 34.15 kg m-3, which represents 8.5 % of the average
wood density value (403.7 kg m-3) across the 19 trees (Table 2). The Pseudo-R2
improves by 15 % moving from the fixed effect model to the mixed effect model
with tree as random subject and improves further by an additional 11 % with the
mixed effect model having tree and disk as random subjects.
The following model provided the best fit for MFA:
Wood Sci Technol
123

Yijz ¼ a0 þ ðða1 þ ua1iÞ þ a2 � GDDÞ � EXPða3 � DPðða4þua4iÞþa5�DHÞijz Þ þ eijz ð4Þ
where Yijz microfibril angle (�) of ring z, in disk j, in tree i, DH disk height (m), and
an (n = 0, 1, 2, 3, 4, and 5) are the fixed effects parameters. For tree i, the error
structure is defined by an unstructured variance–covariance matrix of random
effects uani with a power variance function Gi (uani, d) = |DPijz|d, and a serial
correlation function Ci(/) = CAR(1) to account for correlation between disks j
within each tree i.
The RMSE for Eq. 4 is 1.64�, which represents 12.1 % of the average microfibril
angle value (13.52�) across the 19 trees (Table 2). The Pseudo-R2 improves by 7 %
moving from the fixed effect model to the mixed effect model with tree as random
subject, and improves further by an additional 6 % with the mixed effect model
having tree and disk as random subjects.
Table 2 Parameter estimates reported with standard error and goodness-of-fit for the disk-level mixed
effects version of Eqs. 3–5
Equations Parameter Estimate Standard
error
RMSE RMSE
(%)
Pseudo-R2
Fixed Mixed
Tree Disk
(3) a0 489.4784 46.884 34.15 kg m-3 8.5 0.430 0.579 0.685
a1 -134.749 46.434
WD a2 0.053 0.016
a3 211.4457 12.383
a4 -0.1855 0.007
a5 0.0389 0.003
(4) a0 9.278583 0.079 1.64� 12.1 0.812 0.880 0.943
a1 24.61626 0.875
MFA a2 -0.00145 0.0004
a3 -0.01248 0.001
a4 1.352283 0.044
a5 0.033897 0.002
(5) a0 7.767211 1.866 1.39 GPa 12.7 0.577 0.781 0.774
a1 5.996475 1.903
MOE a2 -0.02723 0.009
a3 -10.8772 0.520
a4 0.160858 0.026
a5 0.054067 0.022
a6 -0.02539 0.003
a7 1.187729 0.039
Pseudo-R2 values for the fixed effects and tree-level mixed effects versions are included for comparison
RMSE ¼ffiffiffiffiffiffiffiffiffiffiffiffiffiffiffiffiffiffiffiffiffiffi
Pn
i¼1yi�yið Þ2
n�k
r
; Pseudo� R2 ¼ 1�Pn
i¼1yi�yið Þ2
Pn
i¼1yi��yð Þ2
where yi observed values, yi predicted values,
�y average, n sample size, k number of model parameters
Wood Sci Technol
123
The following model provided the best fit for MOE:
Yijz ¼ a0 þ ða1 þ ua1iÞ � EXPða2 � RWijzÞ þ ðða3 þ ua3iÞ þ a4 � DH
þ a5 �MTGSÞ � EXPða6 � DPa7
ijzÞ þ eijz ð5Þ
where Yijz modulus of elasticity (GPa) of ring z, in disk j, in tree i, MTGS mean
temperature during the growing season (�), and an (n = 0, 1, 2, 3, 4, and 5) are the
fixed effects parameters. For tree i, the error structure is defined by an unstructured
variance–covariance matrix of random effects uani with a power variance function
Gi (uani, d) = |DPijz|d, and a serial correlation function Ci(/) = CAR(1) to account
for correlation between disks j within each tree i.
The RMSE for Eq. 5 is 1.39 GPa, which represents 12.7 % of the averaged
modulus of elasticity (10.97 GPa) across the 19 trees (Table 2). The Pseudo-R2
improves by 20 % moving from the fixed effect model to the mixed effect model
with tree as random subject and slightly decreases by \1 % with the mixed effect
model having tree and disk as random subjects.
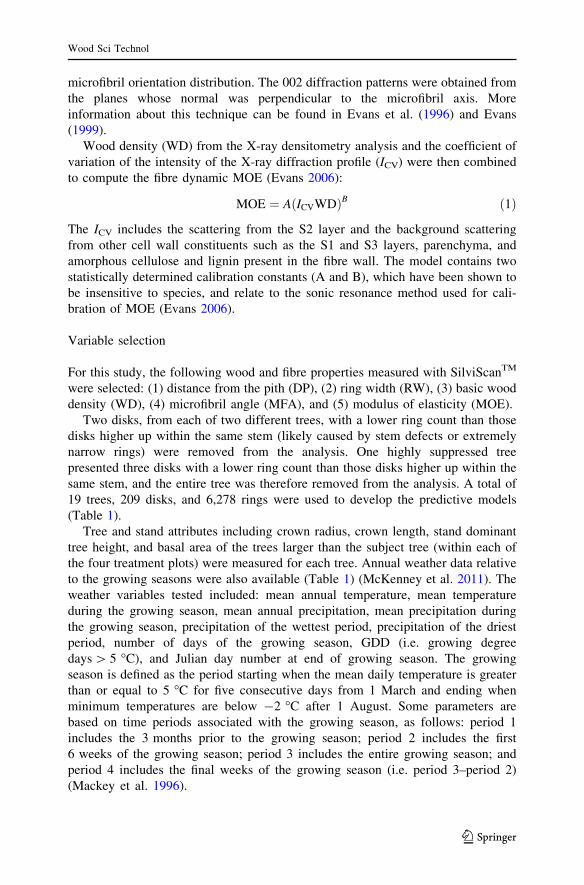
Scatter plots of residuals and studentised residuals suggest that Eqs. 3–5 provided
consistent and unbiased estimates of observed values (Fig. 2). Figures 3, 4 and 5
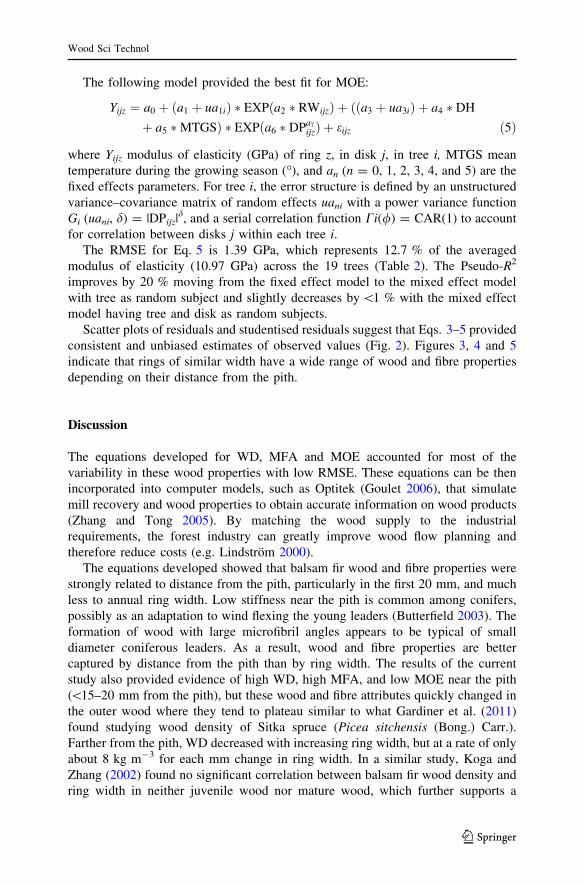
indicate that rings of similar width have a wide range of wood and fibre properties
depending on their distance from the pith.
Discussion
The equations developed for WD, MFA and MOE accounted for most of the
variability in these wood properties with low RMSE. These equations can be then
incorporated into computer models, such as Optitek (Goulet 2006), that simulate
mill recovery and wood properties to obtain accurate information on wood products
(Zhang and Tong 2005). By matching the wood supply to the industrial
requirements, the forest industry can greatly improve wood flow planning and
therefore reduce costs (e.g. Lindstrom 2000).
The equations developed showed that balsam fir wood and fibre properties were
strongly related to distance from the pith, particularly in the first 20 mm, and much
less to annual ring width. Low stiffness near the pith is common among conifers,
possibly as an adaptation to wind flexing the young leaders (Butterfield 2003). The
formation of wood with large microfibril angles appears to be typical of small
diameter coniferous leaders. As a result, wood and fibre properties are better
captured by distance from the pith than by ring width. The results of the current
study also provided evidence of high WD, high MFA, and low MOE near the pith
(\15–20 mm from the pith), but these wood and fibre attributes quickly changed in
the outer wood where they tend to plateau similar to what Gardiner et al. (2011)
found studying wood density of Sitka spruce (Picea sitchensis (Bong.) Carr.).
Farther from the pith, WD decreased with increasing ring width, but at a rate of only
about 8 kg m-3 for each mm change in ring width. In a similar study, Koga and
Zhang (2002) found no significant correlation between balsam fir wood density and
ring width in neither juvenile wood nor mature wood, which further supports a
Wood Sci Technol
123

general view that relationships between WD and ring width are inconsistent
(Dutilleul et al. 1998; Downes et al. 2002). The results of this study also
demonstrate that the strong influence of distance from pith on WD confounds the
relationship between WD and ring width, particularly near the pith. Alteyrac et al.
(2006) reported for boreal black spruce trees that ring width was not a significant
factor of variation of MOE and MOR measured on small clear specimens. However,
400 500 600 700 800
300
400
500
600
700
800
Fitted Wood Density (Kg/m^3)
Obs
erve
d W
ood
Den
sity
(K
g/m
^3)
400 500 600 700 800
-4-2
02
46
8
Fitted Wood Density (Kg/m^3)
Stu
dent
ized
Res
idua
ls (
Kg/
m^3
)
10 15 20 25 30 35 40
1020
3040
Fitted Microfibril Angle (°)
Obs
erve
d M
icro
fibril
Ang
le (
°)
10 15 20 25 30 35 40
-4-2
02
46
8
Fitted Microfibril Angle (°)
Stu
dent
ized
Res
idua
ls (
°)
(a)
(b)
4 6 8 10 12 14 16
510
15
Fitted Modulus of elasticity (GPa)
Obs
erve
d M
odul
us o
f ela
stic
ity (
GP
a)
4 6 8 10 12 14 16
-4-3
-2-1
01
23
Fitted Modulus of elasticity (GPa)
Stu
dent
ized
Res
idua
ls (
GP
a)(c)
Fig. 2 Plots representing the goodness-of-fit for Eqs. 3 (a), 4 (b), and 5 (c). Each row presents graphs of:(1) observed against predicted together with the fitted lowest line, and (2) scatter plots of residuals againstpredicted together with the fitted Lowess line
Wood Sci Technol
123

MFA was strongly correlated to wood mechanical performance, explaining 72 and
50 % of the variation in MOE and MOR, respectively.
Among the variables of tree attributes (e.g. tree crown length) and tree attributes
relative to the stand characteristics (e.g. basal area) tested, only disk height
significantly improved the models. The goodness-of-fit information (e.g. Pseudo-R2)
indicated that the intra-tree variability captured by disk height, and the random
300
400
500
600
700
0 15 30 45 60 75 90 105 120 135 150
Fit
ted
Woo
d D
ensi
ty (
m3
Kg-
1)
Distance from the pith (mm)
(a)Minimum Ring Width Average Ring Width Maximum Ring Width
(b)
Fig. 3 For Eq. 3, plots of predicted wood density against distance from the pith. Graph a presents threelevels of ring width (i.e. minimum = dashed line, average = solid line, and maximum = dotted line)calculated using the average value of GDD. Graph b presents three levels of GDD (i.e.minimum = dashed line, average = solid line, and maximum = dotted line) calculated using theaverage value of ring width
Wood Sci Technol
123

Fig. 4 For Eq. 4, plots of predicted wood density against distance from the pith. Graph a presents threelevels of disk height (i.e. minimum = dashed line, average = solid line, and maximum = dotted line)calculated using the average value of GDD. Graph b presents three levels of GDD (i.e.minimum = dashed line, average = solid line, and maximum = dotted line) calculated using theaverage value of disk height
cFig. 5 For Eq. 5, plots of predicted microfibril angle against distance from the pith. Graph a presentsthree levels of ring width (i.e. minimum = dashed line, average = solid line, and maximum = dottedline) calculated using the average value of disk height and MTGS. Graph b presents three levels of diskheight (i.e. minimum = dashed line, average = solid line, and maximum = dotted line) calculated usingthe average value of ring width and MGST. Graph c presents three levels of MTGS (i.e.minimum = dashed line, average = solid line, and maximum = dotted line) calculated using theaverage value of ring width and disk height
Wood Sci Technol
123

Wood Sci Technol
123
effects in the mixed effects models, have similar magnitude to the inter-tree
variability. Koga and Zhang (2002) also indicated that the relationship between
wood density and ring width components within a tree (i.e. intra-tree level) was
similar to that at the inter-tree level. The substantial increase of MFA near the pith
with increasing disk height may be a response to increased wind loading at greater
heights above the ground (Booker and Sell 1998; Wimmer et al. 2002).
In this study here, weather variables related to air temperature during the growing
season had a statistically significant role in models for all three wood and fibre
attribute variables. Only for WD, however, was the size of the effect large enough to
suggest that inter-annual variability in weather influenced wood formation, with
WD increasing with GDD. These results are consistent with the positive response of
WD and neutral responses of MFA and MOE in field-grown Norway spruce (Picea
abies) to elevated air temperature (Kostiainen et al. 2009). As other studies have
shown, climatic characteristics during the growing season have a direct effect on the
proportion of earlywood and latewood produced within an annual growth ring,
which consequently have an influence on the overall characteristics of the wood and
fibres (e.g. Kantavichai et al. 2010).
The spacing treatment (i.e. PCT) did not have a significant effect on the modelled
relationships for the wood and fibre properties investigated, likely because the
treatment effects were reflected in ring width. A recent study from the Green River
PCT trial (Duchesne et al. 2013) found that average wood density at the disk level,
cut at stump height, decreased with increasing DBH class (or growth rate), and that
spacing generally resulted in decreased disk density. This outcome is consistent with
the finding from the current study; disk-level wood density averages will result in an
overall lower wood density for larger disks since wood density is relatively constant
after 15–20 mm from the pith. Duchesne et al. (2013) also indicated that the average
wood density measured on the lumber produced along the tree was not influenced by
thinning, which is again consistent with the findings of this study. Another study
(Koga et al. 2002) also found that: (1) the treatment (i.e. PCT) had minimal effect
on balsam fir wood density, and (2) the treatment effect on annual growth lasted for
only 7 years. Correspondingly, the current study did not detect any treatment effects
on wood and fibre properties because (1) treatment effects were already accounted
for in the ring width response, and (2) substantial amount of time had elapsed since
the thinning event.
The unexplained variation in these models is likely related in part to the between-
tree genetic variation, which is unknown in this study. Other studies have shown
that wood and fibre properties are subject to considerable genetic variation (e.g.
Hannrup et al. 2001; Rozenberg et al. 2001).
Conclusion
This study investigated the predictive ability of radial ring-level models of wood
and fibre properties such as wood density, microfibril angle, and modulus of
elasticity for balsam fir. The mixed effects models developed accounted for most of
the variability in wood density (68 %), microfibril angle (94 %), and modulus of
Wood Sci Technol
123

elasticity (77 %) and included tree and stand level variables such as distance from
the pith, ring width, disk height, and selected weather variables related to air
temperature during the growing season. These equations can be incorporated into
computer models (e.g. Optitek) that simulate mill recovery and wood properties to
obtain accurate information on wood products. The unexplained variation in the
models is likely related to the genetic variation among trees, which is unknown in
this study.
Acknowledgments Special thanks go to Dr. Doug Pitt, Mr. Len Lanteigne, and Mr. Jamie Farell
(Natural Resources Canada, Canadian Wood Fibre Centre) and to FPInnovations (Vancouver) for
supplying the balsam fir data, and to Mr. Gurp Thandi (Natural Resources Canada, Canadian Forest
Service) for creating the map presented in this manuscript. Funding of this research was provided by the
Canadian Wood Fibre Centre (Natural Resources Canada).
References
Alteyrac H, Cloutier A, Ung CH, Zhang SY (2006) Mechanical properties in relation to selected wood
characteristics of black spruce. Wood Fiber Sci 38:229–237
Biging GS, Dobbertin M (1995) Evaluation of competition indices in individual tree growth models. For
Sci 41:360–377
Booker RE, Sell J (1998) The nanostructure of the cell wall of softwoods and its functions in a living tree.
Holz Roh-Werkst 56:1–8
Burnham KP, Anderson DR (1998) Model selection and inference: a practical information-theoretic
approach. Springer, New York, NY
Burns RM, Honkala BH (1990) Silvics of North America, vol 1. Conifers. Washington (DC): US
Department of Agriculture. Agricultural Handbook no. 654
Butterfield BG (2003) Wood anatomy in relation to wood quality. In: Barnett JR, Jeronimidis G (eds)
Wood quality and its biological basis. Blackwell, Oxford, pp 30–52
Cave ID, Walker JCF (1994) Stiffness of wood in fast-grown plantation softwoods: the influence of
microfibril angle. For Prod J 44:43–48
Cortini F, Groot A, Filipescu CN (2013) Models of the longitudinal distribution of ring area as a function
of tree and stand attributes for four major Canadian conifers. Ann For Sci 70:637–648
Downes GM, Wimmer R, Evans R (2002) Understanding wood formation: gains to commercial forestry
through tree-ring research. Dendrochr 20:37–51
Duchesne I, Wilhelmsson L, Spangberg K (1997) Effects of in-forest sorting of Norway spruce (Picea
abies) and Scots pine (Pinus sylvestris) on wood and fibre properties. Can J For Res 27:790–795
Duchesne I, Pitt DG, Tanguay F (2013) Effects of precommercial thinning on the forest value chain in
northwestern New Brunswick: part 4—Lumber production, quality and value. For Chron
89:474–489
Dutilleul P, Herman M, Avella-Shaw T (1998) Growth rate effects on correlations among ring width,
wood density, and mean tracheid length in Norway spruce (Picea abies). Can J For Res 28:56–68
Evans R (1999) A variance approach to the X-ray diffractometric estimation of microfibril angle in wood.
Appita J 52:283–289
Evans R (2006) Wood stiffness by X-ray diffractometry. In: Stokke D, Groom L (ed) Characterisation of
the cellulosic cell wall, Chapter 11. Proceedings of the workshop 25–27 August 2003, Grand Lake,
Colorado, USA. Sothern Research Station, University of Iowa and the Society of Wood Science and
technology. Blackwell Publishing
Evans R, Stuart SA, Van Der Touw J (1996) Microfibril angle scanning of increment cores by X-ray
diffractometry. Appita J 49:411–414
Gardiner B, Leban JM, Auty D, Simpson H (2011) Models for predicting wood density of British-grown
Sitka spruce. Forestry 84:119–132
Goulet P (2006) Optitek: User’s manual (Document E-4130). Forintek Canada Corp, Quebec City
Hannrup B, Danell O, Ekberg I, Moell M (2001) Relationships between wood density and tracheid
dimensions in Pinus sylvestris L. Wood Fiber Sci 33:173–181
Wood Sci Technol
123
Harris JM, Meylan BA (1965) The influence of microfibril angle on longitudinal and tangential shrinkage
in Pinus radiata. Holzforschung 19:144–153
Jansson U (2000) Influences of raw material quality on softwood Kraft pulp properties, 63 pp. Licentiate
Thesis, Dept of Pulp and Paper Chemistry and Technology, Royal Institute of Technology,
Stockholm. ISSN 1104-7003
Kantavichai R, Briggs D, Turnblom E (2010) Modeling effects of soil, climate, and silviculture on growth
ring specific gravity of Douglas-fir on a drought-prone site in western Washington. For Ecol Manag
259:1085–1092
Koga S, Zhang SY (2002) Relationship between wood density and annual growth rate components in
Balsam fir (Abies balsamea). Wood Fib Sci 34:146–157
Koga S, Zhang SY, Begin J (2002) Effects of precommercial thinning on annual radial growth and wood
density in Balsam fir (Abies balsamea). Wood Fiber Sci 34:625–642
Kostiainen K, Kaakinen S, Saranpaa P, Sigurdsson BD, Lundqvist S-O, Linder S, Vapaavuori E (2009)
Stem wood properties of mature Norway spruce after 3 years of continuous exposure to elevated
[CO2] and temperature. Global Change Biol 15:368–379
Larson PR (1969) Wood formation and the concept of wood quality. Yale University, School of Forestry.
Bulletin No. 74. 54 p
Lindstrom H (2000) Intra-tree models of basic density in Norway spruce as an input to simulation
software. Silva Fenn 34:411–421
Mackey BG, McKenney DW, Yang YQ, McMahon JP, Hutchinson MF (1996) Site regions revisited: a
climatic analysis of Hills’ site regions for the province of Ontario using a parametric method. Can J
For Res 26:333–354
McKenney DW, Hutchinson MF, Papadopol P et al (2011) Customized spatial climate models for North
America. Bull Am Meteor Soc 92:1611–1622
Pinheiro JC, Bates DM (2000) Mixed-effects models in S and S-plus. Springer, New York
Pinheiro JC, Bates DM, DebRoy S, Sarkar D (2009) Nlme: linear and nonlinear mixed effects models. R
package version 3.1-96
Pitt D, Lanteigne L (2008) Long-term outcome of precommercial thinning in northwestern New
Brunswick: growth and yield of balsam fir and red spruce. Can J For Res 38:592–610
Raymond CA, Joe B (2007) Patterns of basic density variation for Pinus Radiata grown in South-west
slopes region of New South Wales, Australia. N Z J For Sci 37:81–95
Reiterer A, Lichtenegger H, Tschegg SE, Fratzl P (1999) Experimental evidence for a mechanical
function of the cellulose spiral angle in wood cell walls. Philos Mag A 79:2173–2186
Rozenberg P, Franc A, Bastien C, Cahalan C (2001) Improving models of wood density by including
genetic effects: a case study in Douglas-fir. Ann For Sci 58:385–394
Wilhelmsson L, Arlinger J, Brunberg T et al (2000) Sorting the wood for improved paper and board
products. Redogorelse 4. SkogForsk, Uppsala, 105 pp. ISSN 1103–4580
Wilhelmsson L, Arlinger J, Spangberg K, Lundqvist S, Grahn T, Hedenberg O, Olsson L (2002) Models
for predicting wood properties in stems of Picea abies and Pinus sylvestris in Sweden. Scan J For
Res 17:330–350
Wimmer R, Downes GM, Evans R (2002) Temporal variation of microfibril angle in Eucalyptus nitens
grown in different irrigation regimes. Tree Phys 22:449–457
Zhang SY, Koubaa A (2008) Softwood of Eastern Canada: their silvics, characteristics, manufacturing
and end-uses. Special publication SP-526E. FPInnovations-Forintek division, Quebec, Canada
Zhang SY, Tong QJ (2005) Modelling lumber recovery in relation to selected tree characteristics in jack
pine using sawing simulator Optitek. Ann For Sci 62:219–228
Wood Sci Technol
123


![A close-up view of wood structure and properties across a growth ring of Norway spruce ( Picea abies [L] Karst](https://static.fdokumen.com/doc/165x107/6314ef2c3ed465f0570b5bd7/a-close-up-view-of-wood-structure-and-properties-across-a-growth-ring-of-norway.jpg)