EFFECT OF DRYING TEMPERATURE ON THE ...
104
EFFECT OF DRYING TEMPERATURE ON THE COMPOSITION OF HYDRO DISTILLED CINNAMON BARK OIL N.D.I. Kumarage (09/8959) Degree of Master of Science in Sustainable Process Development Department of Chemical and Process Engineering University of Moratuwa Sri Lanka August 2013 Click here to buy A B B Y Y P D F T r a n s f o r m e r 2 . 0 w w w . A B B Y Y . c o m Click here to buy A B B Y Y P D F T r a n s f o r m e r 2 . 0 w w w . A B B Y Y . c o m
-
Upload
khangminh22 -
Category
Documents
-
view
4 -
download
0
Transcript of EFFECT OF DRYING TEMPERATURE ON THE ...
EFFECT OF DRYING TEMPERATURE ON THE
COMPOSITION OF HYDRO DISTILLED CINNAMON
BARK OIL
N.D.I. Kumarage
(09/8959)
Degree of Master of Science in Sustainable Process Development
Department of Chemical and Process Engineering
University of Moratuwa
Sri Lanka
August 2013
Click h
ere to
buy
ABB
YY PDF Transformer 2.0
www.ABBYY.comClic
k here
to buy
ABB
YY PDF Transformer 2.0
www.ABBYY.com
EFFECT OF DRYING TEMPERATURE ON THE
COMPOSITION OF HYDRO DISTILLED CINNAMON
BARK OIL
Nawammalie Dushyantha Iroshini Kumarage
(09/8959)
Thesis submitted in partial fulfillment of the requirements for the degree Master of
Science in Sustainable Process Development
Department of Chemical and Process Engineering
University of Moratuwa
Sri Lanka
August 2013
Click h
ere to
buy
ABB
YY PDF Transformer 2.0
www.ABBYY.comClic
k here
to buy
ABB
YY PDF Transformer 2.0
www.ABBYY.com
i
DECLARATION OF THE CANDIDATE AND SUPERVISOR
“I declare that this is my own work and this thesis does not incorporate without
acknowledgement any material previously submitted for a Degree or Diploma in any
University or other institute of higher learning and to the best of my knowledge and
belief it does not contain any material previously published or written by another
person except where the acknowledgement is made in the text”
……………………..
Candidate : N.D.I. Kumarage Date : 08th November 2013
I endorse the declaration by the candidate.
………………………..
Supervisor : Dr. A.D.U. Shantha Amarasinghe Date : 08th November 2013
Copyright Statement
“I hereby grant the University of Moratuwa the right to archive and to make
available my thesis or dissertation in whole or part in the University Libraries in all
forms of media, subject to the provisions of the current copyright act of Sri Lanka. I
retrain all proprietary rights, such as patent rights. I also retain the right to use in
future works (such as articles or books) all or part of this thesis or dissertation”.
……………………..
Candidate : N.D.I. Kumarage Date : 08th November 2013
“I have supervised and accepted this thesis/dissertation for the award of the degree”
………………………..
Supervisor : Dr. A.D.U. Shantha Amarasinghe Date : 08th November 2013
Click h
ere to
buy
ABB
YY PDF Transformer 2.0
www.ABBYY.comClic
k here
to buy
ABB
YY PDF Transformer 2.0
www.ABBYY.com
ii
Abstract
Cinnamon (Cinnamomum Zeylanicum) is an endemic plant popularly known as “Kurundu”in Sri Lanka. Cinnamon yields mainly cinnamon leaf oil and cinnamon bark oil. Cinnamonbark oil produces by processing dried cinnamon chips. Composition of cinnamon bark oilvaries due to many factors including the type and quality of cinnamon chips. Good qualitycinnamon chips can be produced by uniform drying. Present study examines the effect of airdrying temperature during pre processing of cinnamon chips on the volatile organiccompounds of cinnamon bark oil extracted by the method of hydro-distillation of cinnamonchips. Laboratory scale tunnel dryer fitted with an electrical heater was used to dry cinnamonchips at five different air drying temperatures; ambient temperature, 35 °C, 40 °C, 45 °C and50 °C. The extracted cinnamon bark oil was analysed by gas chromatography-massspectrometry (GC-MS). A total of 16 compounds were identified, cinnamaldehyde-E,cinnamyl acetate, linalool and eugenol, in that order, being the main volatile organiccompounds. Results indicated that air drying temperature of cinnamon chips significantlyaltered the composition of cinnamon bark oil. Percentage of Cinnamaldehyde-E increasedwith the increase in drying temperature. High percentage of monoterpenes, cinnamaldehydeand cinnamaldehyde derivatives such as cinnamyl acetate, and 2-methoxy-cinnamaldehydewas observed at low temperature drying. Increase in drying temperature resulted insubstantial losses in certain oxygenated terpenes and sesquiterpene. The percentage ofcinnamaldehyde-E could be substantially increased by hot air drying but at the expense of oilyield.
Keywords: Bark oil, air drying, volatile organic compounds, cinnamon chips
ABSTRACT
Click h
ere to
buy
ABB
YY PDF Transformer 2.0
www.ABBYY.comClic
k here
to buy
ABB
YY PDF Transformer 2.0
www.ABBYY.com

iii
DEDICATION
This thesis is dedicated to my beloved PARENTS, HUSBAND and SON
Click h
ere to
buy
ABB
YY PDF Transformer 2.0
www.ABBYY.comClic
k here
to buy
ABB
YY PDF Transformer 2.0
www.ABBYY.com
iv
ACKNOWLEDGEMENT
I take this opportunity to acknowledge to people who has done an immense support
to enable my thesis work a success from its start to the end. First of all my sincere
thanks goes to my supervisor Dr. A.D.U.S. Amarasinghe, Senior Lecturer,
Department of Chemical & Process Engineering, University of Moratuwa for his
continuous in depth guidance throughout my research. My gratitude also goes to the
Post Graduate Division and NORAD fund of Telemark University, Norway.
My special thanks to Mr. Prasanna Welahetti and Mr. Sujeewa Buddhasiri for giving
their valuable support. All the staff members in the Dept. of Chemical & Process
Engineering, specially, Indika Athukorala, Lalith Fernando, Shantha Peris, Ranjith
Abeywardhane, Jayweera Wijesinghe, Nihal Perera, Ranjith Maskorala, and
Sajeewani Silva are gratefully acknowledged for their support in various occasions.
Cooperation given by staff members at Cinnamon Research Institute, Thihagoda is
appreciated specially in the stages of literature survey in this research. I would like to
extend my sincere appreciation to Dr. M.A.B. Prashantha in the Dept. of Chemistry
of university of Jayawardanapura for their support for doing Gas chromatography
analysis.
I sincerely thank my beloved parents and husband for providing continued support
and encouragement during my research work.
Finally, I would like to express my thankfulness for many individuals especially
Amila Chandra, Janitha Bandara & Gagani Nandadewa and friends who have not
been mentioned here personally and helped me by thought word or deeds in making
this research a success.
Click h
ere to
buy
ABB
YY PDF Transformer 2.0
www.ABBYY.comClic
k here
to buy
ABB
YY PDF Transformer 2.0
www.ABBYY.com
v
TABLE OF CONTENTSDeclaration of the Candidate and Supervisor ........................................................ i
Abstract .................................................................................................................. ii
Dedication ............................................................................................................. iii
Acknowledgement ................................................................................................. iv
List of Figures ..................................................................................................... viii
List of Tables ......................................................................................................... ix
List of Abbreviations ..............................................................................................x
List of Appendices ................................................................................................. xi
1 INTRODUCTION ...........................................................................................1
1.1 Background .................................................................................................1
1.2 Drying of Cinnamon Chips ..........................................................................1
1.3 Justification of Research ..............................................................................2
1.4 Objectives of the Research ...........................................................................3
1.5 Outline of the Thesis ....................................................................................4
2 LITERATURE REVIEW ................................................................................5
2.1 Cinnamon Products ......................................................................................5
2.1.1 Quills .................................................................................................6
2.1.2 Quillings ............................................................................................7
2.1.3 Featherings ........................................................................................7
2.1.4 Chips .................................................................................................7
2.1.5 Cinnamon oil .....................................................................................7
2.1.5.1 Leaf Oil......................................................................................8
2.1.5.2 Bark Oil .....................................................................................8
2.1.5.3 Properties of cinnamon oil..........................................................8
2.1.5.4 Chemical composition ................................................................9
2.2 Processing of Cinnamon Chips .................................................................. 10
2.2.1 Cinnamon process flow .................................................................... 10
2.2.2 Types of “katta-chips” ..................................................................... 11
Click h
ere to
buy
ABB
YY PDF Transformer 2.0
www.ABBYY.comClic
k here
to buy
ABB
YY PDF Transformer 2.0
www.ABBYY.com
vi
2.2.3 Cinnamon “katta-Chips” peeling process ......................................... 11
2.2.4 Drying and storage ........................................................................... 12
2.2.5 Cinnamon oil extraction methods ..................................................... 13
2.2.5.1 Steam distillation ..................................................................... 13
2.2.5.2 Hydro distillation ..................................................................... 14
2.2.5.3 Solvent extraction .................................................................... 14
2.2.5.4 Super critical CO2 extraction .................................................... 14
2.3 Essential Oil Analysis ................................................................................ 14
2.3.1 Methods of oil analysis .................................................................... 15
2.3.2 Volatile organic compounds of cinnamon oil ................................... 16
2.3.3 Effect of the drying on the volatile organic compounds of essential oil
19
2.4 Statistical Analysis of the Effect of the Drying Using SPSS ....................... 22
3 MATERIALS AND METHODOLOGY ....................................................... 24
3.1 Materials & Equipments ............................................................................ 24
3.2 Drying of Cinnamon Chips ........................................................................ 26
3.3 Extraction of Cinnamon Bark Oil ............................................................... 28
3.4 Identification of Volatile Organic Compounds ........................................... 29
4 DATA ANAYSIS ........................................................................................... 30
4.1 Calculation of Moisture Content ................................................................ 30
4.2 Gas Chromatography and Mass Spectrometer Analysis .............................. 31
4.3 Statistical Analysis ..................................................................................... 33
4.3.1 One way ANOVA............................................................................ 33
4.3.1.1 Performing the ANOVA with SPSS ......................................... 33
4.3.2 Principal component analysis (PCA) ................................................ 36
5 RESULTS AND DISCUSSION ..................................................................... 38
5.1 Drying characteristics of Cinnamon chips .................................................. 38
5.2 Gas Chromatography Analysis ................................................................... 40
5.3 Statistical Analysis ..................................................................................... 42
5.3.1 Mean comparison by ANOVA ......................................................... 42
5.3.1.1 Verification for the validity of assumption ............................... 42
5.3.1.2 One way ANOVA descriptives................................................. 44
Click h
ere to
buy
ABB
YY PDF Transformer 2.0
www.ABBYY.comClic
k here
to buy
ABB
YY PDF Transformer 2.0
www.ABBYY.com
vii
5.3.1.3 Mean comparison using Student-Newman-Keuls (SNK) test .... 45
5.3.2 Principal component analysis (PCA) ................................................ 47
6 CONCLUSIONS AND RECOMMENDATIONS ........................................ 52
Reference List ...................................................................................................... 54
Appendices ............................................................................................................ 61
Click h
ere to
buy
ABB
YY PDF Transformer 2.0
www.ABBYY.comClic
k here
to buy
ABB
YY PDF Transformer 2.0
www.ABBYY.com
viii
LIST OF FIGURES
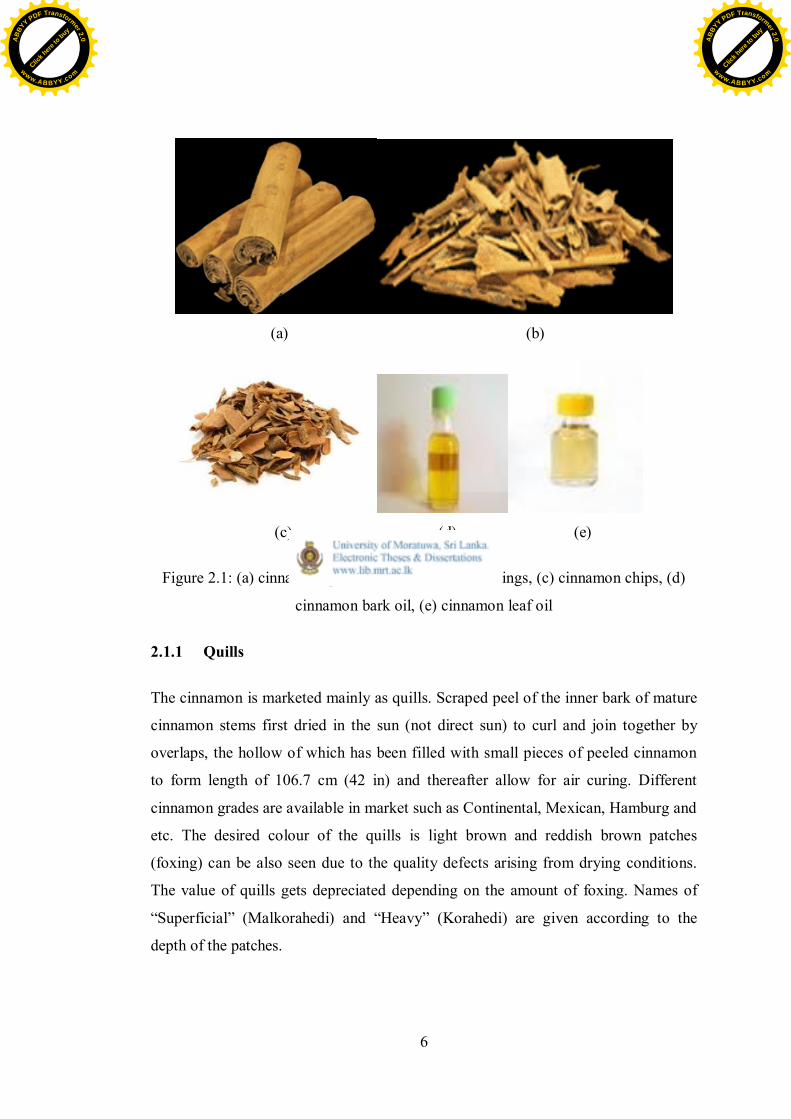
Figure 2.1: (a) cinnamon quills, (b) cinnamon featherings, (c) cinnamon chips, (d)
cinnamon bark oil, (e) cinnamon leaf oil ..................................................6
Figure 2.2: Flow diagram of cinnamon processing .................................................. 11
Figure 2.3: (a) Collected cinnamon tree parts, (b) Katta peeling process, (c) Peeled
Katta ...................................................................................................... 12
Figure 3.1: (a) Weighing balance, (b) Moisture balance .......................................... 24
Figure 3.2: Fixed bed dryer with component ........................................................... 25
Figure 3.3: (a) Thermocouple, (b) Anemometer ...................................................... 26
Figure 3.4: GC-MS-7890A gas chromatograph equipped with a 5975C plus mass
spectrometer (Agilent, American) .......................................................... 26
Figure 3.5: Cinnamon chips sampling method ......................................................... 27
Figure 3.6: Cinnamon oil extraction apparatus ........................................................ 28
Figure 3.7: Cinnamon oil separation apparatus ........................................................ 29
Figure 4.1: Chromatogram of cinnamon bark oil (35 °C temperature -Trial 1) ......... 32
Figure 4.2: Flow chart of ANOVA procedure in SPSS software .............................. 35
Figure 5.1: Variation of moisture content with time for different air drying
temperatures ......................................................................................... 39
Figure 5.2: Variation of drying rate with moisture content for different air drying
temperatures……………………………………………………………39
Figure 5.3: Normal Q-Q plot of cinnamaldehyde-E at ambient temperature............. 43
Figure 5.4: Principal component plot (PC2 vs PC1). ambient temperature dried (�),
air dried at 35 °C (*), air dried at 40 °C (Í), air dried at 45 °C (Æ), air
dried at 50 °C (∆) ................................................................................. 50
Figure 5.5: Principal component plot (PC1 vs PC3). ambient temperature dried (�),
air dried at 35 °C (*), air dried at 40 °C (Í), air dried at 45 °C (Æ), air
dried at 50 °C (∆) ................................................................................. 51
Click h
ere to
buy
ABB
YY PDF Transformer 2.0
www.ABBYY.comClic
k here
to buy
ABB
YY PDF Transformer 2.0
www.ABBYY.com
ix
LIST OF TABLES
Table 2.1: Physico-chemical properties of cinnamon oil ............................................9
Table 2.2: Properties of selected volatile organic compounds of cinnamon bark oil . 10
Table 5.1: Moisture content on dry basis and drying time for different drying
temperatures .......................................................................................... 38
Table 5.2: Gas chromatography analysis for cinnamon oil dried at different
temperatures .......................................................................................... 41
Table 5.3: Levene's test of homogeneity of variances for cinnamaldehyde-E ........... 42
Table 5.4: Welch test of equality of means .............................................................. 42
Table 5.5: Shapiro-Wilk tests of normality for cinnamaldehyde-E ........................... 43
Table 5.6: Descriptive table of cinnamaldehyde-E at different temperatures ............ 44
Table 5.7: ANOVA table of cinnamaldehyde-E ...................................................... 44
Table 5.8: Mean comparisons of cinnamaldehyde-E................................................ 45
Table 5.9: Concentration of volatile compounds (relative content %) in hydro
distilled cinnamon bark .......................................................................... 46
Table 5.10: Correlations between volatile organic compounds and principal
components (PC) ................................................................................... 48
Table 5.11: Correlation coefficient values for the volatile organic compounds against
principal component 1 ,2 and 3 ............................................................. 49
Click h
ere to
buy
ABB
YY PDF Transformer 2.0
www.ABBYY.comClic
k here
to buy
ABB
YY PDF Transformer 2.0
www.ABBYY.com
x
LIST OF ABBREVIATIONS
Abbreviation Description
R&D Research & Deveopment
SNK Student Newman Keuls
PCA Principal Component Analysis
SCF Super Critical Fluids
GLC Gas Liquid Chromatography
GC Gas Chromatography
MS Mass Spectrometry
IR Infrared
HPLC High Performance Liquid Chromatography
TTE 1,1,2-trichloro- 1,2,2-trifluoroethane
SDE Simultaneous distillation extraction
LSD Least Significant Difference
ANOVA Analysis of Variance
MST Mean Square Treatment
MSE Mean Square Error
PC Principal Component
DF Degrees of Freedom
RSD Relative standard deviation
Click h
ere to
buy
ABB
YY PDF Transformer 2.0
www.ABBYY.comClic
k here
to buy
ABB
YY PDF Transformer 2.0
www.ABBYY.com
xi
LIST OF APPENDICES
Appendix A: Gas chromatograms of hydro distilled cinnamon oil at different drying
temperatures ...................................................................................... 61
Appendix B: Standard & obtained mass spectra of different volatile organic
compounds of cinnamon bark oil ........................................................ 66
Appendix C: Gas chromatogram data sheets of hydro distilled cinnamon oil at
different drying temperatures .............................................................. 70
Appendix D: One-Way ANOVA and principal components analysis (PCA) steps in
IBM SPSS statistics 19 ....................................................................... 75
Appendix E: Matlab code for plotting the drying curves .......................................... 78
Appendix F: SPSS Output of the One-Way ANOVA .............................................. 80
Click h
ere to
buy
ABB
YY PDF Transformer 2.0
www.ABBYY.comClic
k here
to buy
ABB
YY PDF Transformer 2.0
www.ABBYY.com

xii
Click h
ere to
buy
ABB
YY PDF Transformer 2.0
www.ABBYY.comClic
k here
to buy
ABB
YY PDF Transformer 2.0
www.ABBYY.com
1
1 INTRODUCTION
1.1 Background
Cinnamon (Cinnamomum Zeylanicum) is an endemic plant popularly known as
“Kurundu” in Sri Lanka. Cinnamon is mostly used in cooking and baking and can be
added to any food item such as salads, confectionaries, beverages, soups, stews and
sauces. Cinnamon yields mainly cinnamon leaf oil and cinnamon bark oil. Cinnamon bark
oil which has a light yellow colour is used in food and pharmaceutical industries.
Cinnamon leaf oil is cheaper than bark oil and is used in the flavor industry.
Cinnamon bark oil is produced by processing dry cinnamon chips.
1.2 Drying of Cinnamon Chips
Fresh cinnamon chips contain very high amount of moisture; up to about 60% (w/w
wet basis). Drying is the most common and fundamental method for post-harvest
preservation of medicinal plants, vegetables and spices to inhibit microorganism
growth and prevent degradation due to biochemical reactions. Nevertheless, a series
of physical and chemical alterations that may have an adverse effect on quality may
take place during drying. Such alterations include changes in appearance, as well as
in aroma, caused by the loss of volatile organic compounds or the formation of other,
new components as a consequence of oxidation reactions, esterification reactions,
etc. (Diaz-Maroto, et al.,2002c). Traditional drying methods (e.g. sun and solar
drying) have many drawbacks due to the inability to handle the large throughput of
mechanical harvesters and to achieve the high-quality standards required for
medicinal plants. High ambient air temperature and relative humidity during the
harvesting and drying season promote the insect and mould development in
harvested crops. Furthermore, the intensive solar radiation causes several quality
reductions like vitamin losses or color changes in dried crops. Thus, the traditional
natural drying in the shade does not meet the particular requirements of the related
standards. To overcome these problems, producers mostly adopt the heated-air batch
dryers or continuous conveyor dryers (Oztekin et al., 1999).
Click h
ere to
buy
ABB
YY PDF Transformer 2.0
www.ABBYY.comClic
k here
to buy
ABB
YY PDF Transformer 2.0
www.ABBYY.com
2
General to the Sri Lankan spice industry, improper drying has been identified as the
main reason for losses such as presence of high moisture content, semi-dry and
mould developed conditions. A study done by Economics Research Unit of
Department of Export Agriculture, reports that around 70% of the producers use sun
drying on home yard having no brick or cemented floor which has a high potential to
moisture retention and microbial contamination. More than 69% of the producers
who had been interviewed in this study claimed that their drying process was
disturbed by occasional rain.
1.3 Justification of Research
Sri Lanka is the major cinnamon producing, country in the world and it controls over
60% of the world cinnamon trade. Sri Lanka produces the best quality cinnamon
bark, mainly as quills, while quilling, featherings, chips, ground cinnamon,
cinnamon powder, leaf oil and bark oil are the other products. It also produces
annually around 120 T leaf oil and 4–5 MT bark oil. Cinnamon bark oil is very high
value oil due to the presence of high amount of cinnamaldehyde and other valuable
aromatic compounds and Sri Lanka is the main supplier of this commodity
(Parthasarathy, et al., 2008). World trade in Sri Lankan cinnamon is centered on
London and Dutch ports of Amsterdam and Rotterdam, which are the main
transshipment points for the leading buyers such as Mexico, US, UK, Germany,
Holland, Colombia, etc.
A growing demand for cinnamon in future can be expected with the increasing of
concern on health hazards associated with synthetic flavoring agents used in food
industry and increasing preference for natural flavors all over the world. As a
pioneering cinnamon supplier to the international market, Sri Lanka holds a major
responsibility in developing methods to increase the cinnamon harvest and extract
more oil yield per hectare by minimizing the pre and post harvesting losses along the
cinnamon supply chain while conserving its existing quality.
Due to the increasing demand for cinnamon oil in global market, there is an urgent
need for increased investment in research and product development for value
Click h
ere to
buy
ABB
YY PDF Transformer 2.0
www.ABBYY.comClic
k here
to buy
ABB
YY PDF Transformer 2.0
www.ABBYY.com
3
addition in cinnamon. Investigation of the current supply chain of cinnamon oil
production, identification of the drawbacks and adapting necessary technological
input has been a timely need which results in value adding to the industry. This
research is an effort of exploring of such a value adding technological contribution
which can be practically substituted to the current oil production process.
Cinnamon has a vast research area to explore. Only limited numbers of R&D efforts
have contributed to the progress of cinnamon research and most of them were
initiated from Sri Lanka. Publications by Ceylon Institute of Scientific and Industrial
Research and by the Department of Export Agriculture hold some of these research
efforts and they were mainly concentrated on cinnamon chemistry, quality
assessment, developing agro-technology for cultivation and post-harvest processing.
Thihagoda, Sri Lanka is the only dedicated cinnamon research station in the world
which also works for dissemination of R&D results to farmers, interested institutions
and industries. In addition to Sri Lanka, Research Station at Calicut, Kozhikode
under the Central Plantation Crops Research Institute, Kerala in India has done some
R&D efforts on cinnamon tree spices.
Various studies have been performed on the effect of drying on the volatile organic
compounds of different spices. However no studies have been performed to
investigate the effect of drying on the volatile organic compounds of cinnamon bark
and leaf oil.
Considering the observations made with respect to cinnamon bark oil production
industry, the need for optimization of drying temperature has been identified as the
most affecting parameter for the cinnamon bark oil production in this research.
1.4 Objectives of the Research
Composition of cinnamon bark oil varies due to many factors including the type and
quality of cinnamon chips. Good quality cinnamon chips can be produced by uniform
drying. Present study has examined the influence of five different air drying
Click h
ere to
buy
ABB
YY PDF Transformer 2.0
www.ABBYY.comClic
k here
to buy
ABB
YY PDF Transformer 2.0
www.ABBYY.com
4
temperatures, ambient temperature, 35 °C, 40 °C, 45 °C and 50 °C on the volatile
compounds in cinnamon bark.
1.5 Outline of the Thesis
This thesis is consisted with five chapters. In the first chapter, research objectives are
mentioned and justified with the introduction to the research area. A literature review
on cinnamon bark and available extraction methods of cinnamon bark oil, methods of
oil analysis and effect of drying on volatile organic compounds of essential oil has
been presented in the second chapter. In the third chapter, all the materials used to
conduct the study and the methodology followed to fulfil the research objectives are
described. Data analysis using IBM SPSS Statistics 19 are mentioned in fourth
chapter. The results obtained during the present study are presented and discussed in
the fifth chapter. The last and sixth chapter contains the conclusion of the study.
Click h
ere to
buy
ABB
YY PDF Transformer 2.0
www.ABBYY.comClic
k here
to buy
ABB
YY PDF Transformer 2.0
www.ABBYY.com
5
2 2 LITERATURE REVIEW
In the first section of the literature review, information has been given on various
cinnamon bark types and how they can be graded. After that major cinnamon oil
types are discussed with their physical and chemical properties. Cinnamon bark oil
production process is described starting from plantation to oil production. Oil
extraction methods, essential oil analysis methods, and the physico chemical analysis
of volatile organic compounds of cinnamon oil are discussed in the next sections.
Since drying is the main preprocessing step recognized in this research, the effect of
the drying on volatile organic compounds of cinnamon oil and methods of statistical
analysis are presented finally.
2.1 Cinnamon Products
About 24,000 ha are under cinnamon cultivation in Sri Lanka and cinnamon groves
are located in the western and south-western regions of the island such as Negambo,
Kaluthara, Ambalangoda, Matara and Rathnapura (Ravindran et al., 2004). The
tropical sunshine and abundant rain in many parts of Sri Lanka provide the ideal
habitat for the growth of cinnamon. Cinnamon is a moderate sized plant grown up to
16 m height and 60 cm breast diameter. It has a smooth bark having light pinkish
brown, grown up to 10 mm thick which gives a strong pleasant spicy and burning
taste. It has oval or elliptical leaves bearing pale yellowish green flowers,
ellipsoidical dark purple fruits.
The most commonly produced product is cinnamon quills. There are several other
by-products generated during the processing of quills. They are classified into five
major commercial groups as quillings, featherings, chips, bark oil and leaf oil which
are shown in Figure 2.1. The major export product out of them is always quills that
accounts for about 90% of the whole industry.
Click h
ere to
buy
ABB
YY PDF Transformer 2.0
www.ABBYY.comClic
k here
to buy
ABB
YY PDF Transformer 2.0
www.ABBYY.com
6
(a) (b)
(c) (d) (e)
Figure 2.1: (a) cinnamon quills, (b) cinnamon featherings, (c) cinnamon chips, (d)
cinnamon bark oil, (e) cinnamon leaf oil
2.1.1 Quills
The cinnamon is marketed mainly as quills. Scraped peel of the inner bark of mature
cinnamon stems first dried in the sun (not direct sun) to curl and join together by
overlaps, the hollow of which has been filled with small pieces of peeled cinnamon
to form length of 106.7 cm (42 in) and thereafter allow for air curing. Different
cinnamon grades are available in market such as Continental, Mexican, Hamburg and
etc. The desired colour of the quills is light brown and reddish brown patches
(foxing) can be also seen due to the quality defects arising from drying conditions.
The value of quills gets depreciated depending on the amount of foxing. Names of
“Superficial” (Malkorahedi) and “Heavy” (Korahedi) are given according to the
depth of the patches.
Click h
ere to
buy
ABB
YY PDF Transformer 2.0
www.ABBYY.comClic
k here
to buy
ABB
YY PDF Transformer 2.0
www.ABBYY.com
7
2.1.2 Quillings
Quillings are marketed as medium quality cinnamon but their aroma and taste are
similar to those of quills. Quillings can be separated from quills due to their shape
and size which is done prior to the sun drying process. Another type called
featherings can be contained with quillings up to 3% by mass.
2.1.3 Featherings
Featherings are pieces of inner bark, obtained by peeling and/ or scraping the bark of
small twigs and stalks of cinnamon shoots, which may include a quantity of chips as
specified.
2.1.4 Chips
Chips are inferior quality cinnamon and the raw materials which were used in this
research. Chips scraped off from the greenish brown, mature thick pieces of bark.
Also the outer bark, which is obtained by beating or scraping the shoots, is also
considered to be chips. Chips are graded into two categories as;
Grade 1- Those containing small featherings obtained by scraping very small twigs.
They contain a small amount of the outer bark material and, which are inferior
quality cinnamon.
Grade 2- Those containing inner and outer bark and pieces of wood.
2.1.5 Cinnamon oil
Cinnamon leaf and bark are sources of cinnamon oil, which are named as leaf oil and
bark oil. Cinnamon oil has been mostly focused on the biologic effects in human
beings and animals, such as antifungal activities (Guynot, et al., 2003; Suhr and
Nielsen, 2003), antibacterial activities (Kalemba and Kunicka, 2003) and anti-
diabetic activities (Bailey and Day, 1989; Qin, et al., 2003; Mang, et al., 2006).
Click h
ere to
buy
ABB
YY PDF Transformer 2.0
www.ABBYY.comClic
k here
to buy
ABB
YY PDF Transformer 2.0
www.ABBYY.com

8
2.1.5.1 Leaf Oil
Cinnamon leaves are obtained as a by-product in the cinnamon industry and they are
steam distilled in large vessels to produce leaf oil. Normally before distilling, leaves
are left in fields for 3 to 4 days. Since leaf oil is heavier than water, oil collects at the
bottom of the separation vessel. Yield is normally 1% oil based on dry weight basis.
The amount of eugenol content determines the grading of leaf oil. In the local
market, leaf oil directly goes from the distillers to the local merchants. Major buying
countries of cinnamon leaf oil from Sri Lanka are US ( 57 %), and European market
UK ( 14.4 %), Germany ( 6.07 % ), France (4.40%), Spain (4.83 %), Italy (3.3 %)
and India (4.12 %) (Ravindran et al., 2004). The issue with the leaf oil production is
that the amount of leaves available for distillation varies with the season and labour
(Ravindran et al., 2004).
2.1.5.2 Bark Oil
Cinnamon bark oil is one of the expensive essential oils in the world market. The
price or value of bark oils, largely depend on the material used to distill the oil.
Similar apparatus and techniques to leaf oil production, are used for bark oil
production and hydro distillation is also used by some manufacturers.
Cinnamaldehyde content determines the quality of cinnamon bark oil. The lowest
quality bark oil which is called “katta thel” is produced from rough bark (“katta-
chips”). When high quality bark oil is required, quills, qullings and featherings are
used (Ravindran et al., 2004).
2.1.5.3 Properties of cinnamon oil
There is no international standard for cinnamon bark oil properties. Higher the
cinnamaldehyde percentage is the higher market price. In the United States, EOA
standard specifies an aldehyde content of 55-78%. However, in the case of leaf oil,
international standards do exist. In this case, a phenol content of 75–85% has been
specified for oil of Sri Lankan origin. Cinnamaldehyde is another constituent of leaf
essential oil, contributing to the total flavor, and the specification limits its content to
Click h
ere to
buy
ABB
YY PDF Transformer 2.0
www.ABBYY.comClic
k here
to buy
ABB
YY PDF Transformer 2.0
www.ABBYY.com
9
5%. In the USA, the FMA (Fragrance Materials Association) specifies the eugenol
content (80–88%) in cinnamon leaf oil in terms of its solubility in KOH. The
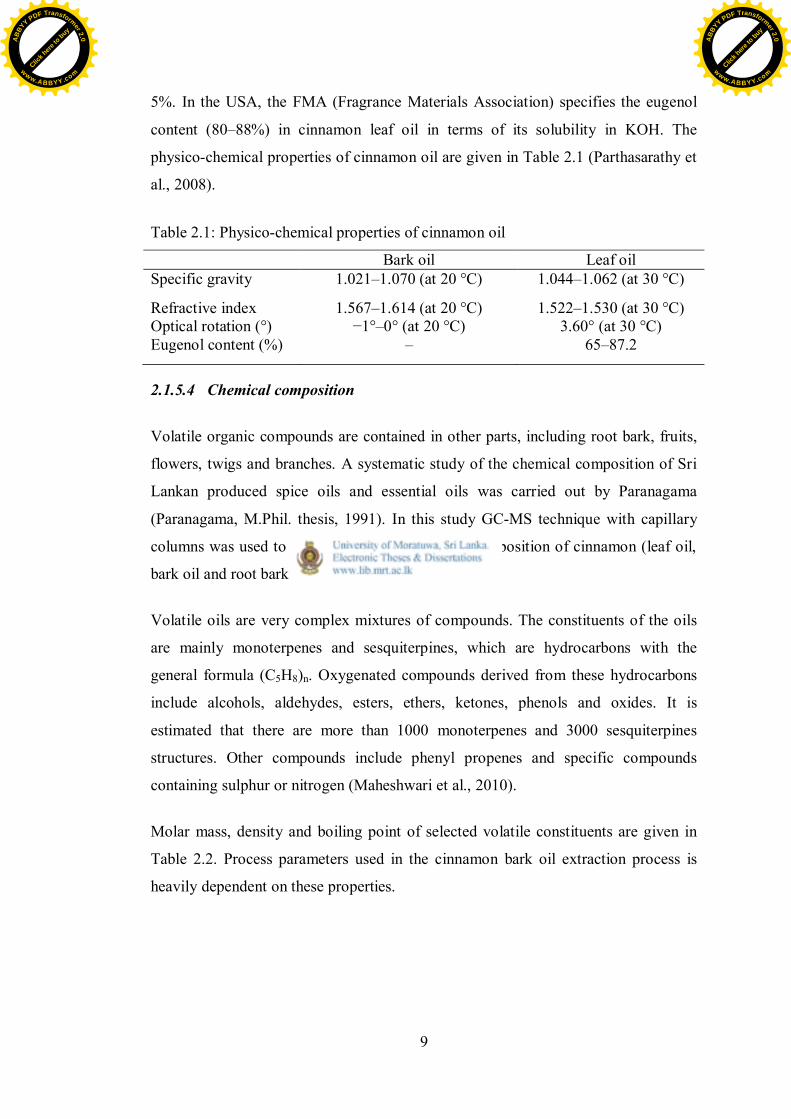
physico-chemical properties of cinnamon oil are given in Table 2.1 (Parthasarathy et
al., 2008).
Table 2.1: Physico-chemical properties of cinnamon oil
Bark oil Leaf oilSpecific gravity 1.021–1.070 (at 20 °C) 1.044–1.062 (at 30 °C)
Refractive index 1.567–1.614 (at 20 °C) 1.522–1.530 (at 30 °C)Optical rotation (°) −1°–0° (at 20 °C) 3.60° (at 30 °C)Eugenol content (%) – 65–87.2
2.1.5.4 Chemical composition
Volatile organic compounds are contained in other parts, including root bark, fruits,
flowers, twigs and branches. A systematic study of the chemical composition of Sri
Lankan produced spice oils and essential oils was carried out by Paranagama
(Paranagama, M.Phil. thesis, 1991). In this study GC-MS technique with capillary
columns was used to investigate the essential oil composition of cinnamon (leaf oil,
bark oil and root bark oil).
Volatile oils are very complex mixtures of compounds. The constituents of the oils
are mainly monoterpenes and sesquiterpines, which are hydrocarbons with the
general formula (C5H8)n. Oxygenated compounds derived from these hydrocarbons
include alcohols, aldehydes, esters, ethers, ketones, phenols and oxides. It is
estimated that there are more than 1000 monoterpenes and 3000 sesquiterpines
structures. Other compounds include phenyl propenes and specific compounds
containing sulphur or nitrogen (Maheshwari et al., 2010).
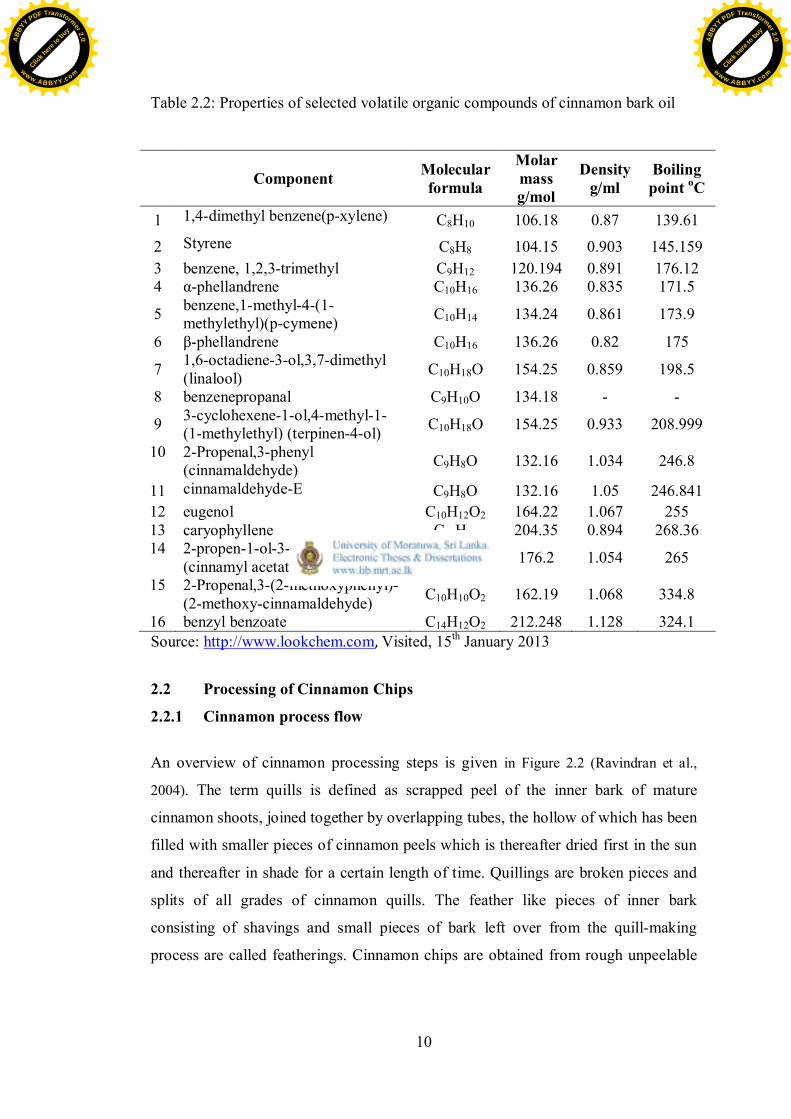
Molar mass, density and boiling point of selected volatile constituents are given in
Table 2.2. Process parameters used in the cinnamon bark oil extraction process is
heavily dependent on these properties.
Click h
ere to
buy
ABB
YY PDF Transformer 2.0
www.ABBYY.comClic
k here
to buy
ABB
YY PDF Transformer 2.0
www.ABBYY.com
10
Table 2.2: Properties of selected volatile organic compounds of cinnamon bark oil
Source: http://www.lookchem.com, Visited, 15th January 2013
2.2 Processing of Cinnamon Chips
2.2.1 Cinnamon process flow
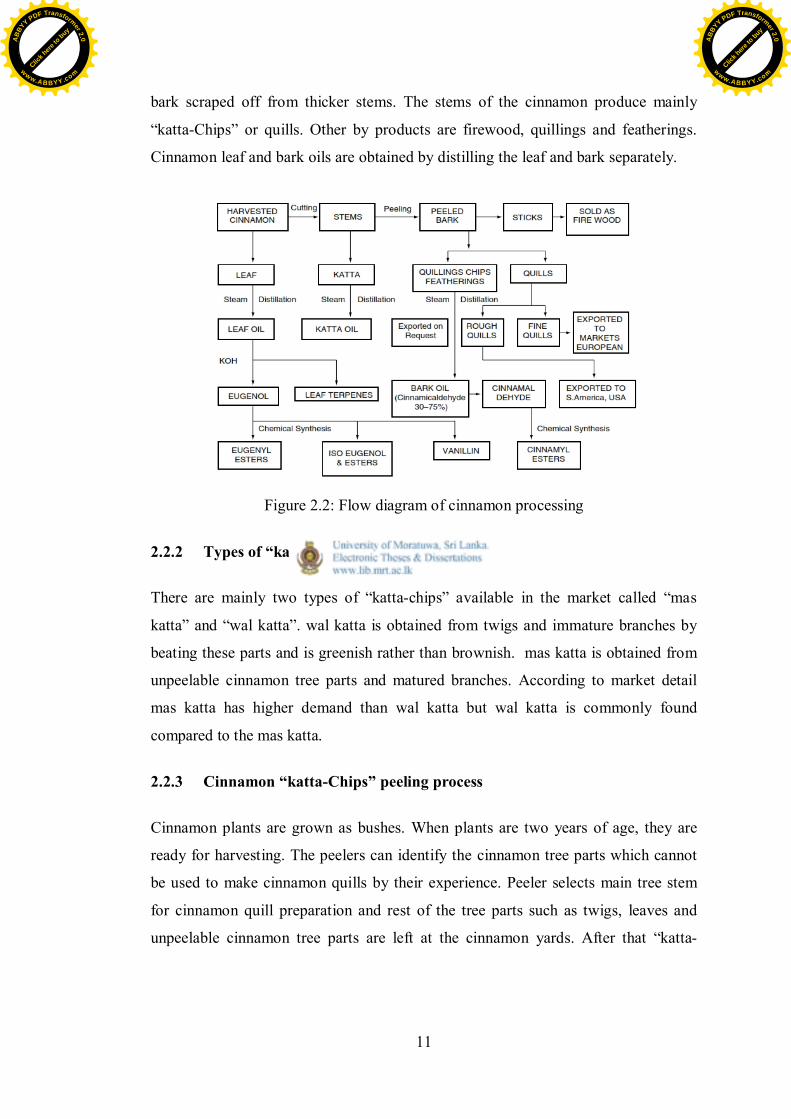
An overview of cinnamon processing steps is given in Figure 2.2 (Ravindran et al.,
2004). The term quills is defined as scrapped peel of the inner bark of mature
cinnamon shoots, joined together by overlapping tubes, the hollow of which has been
filled with smaller pieces of cinnamon peels which is thereafter dried first in the sun
and thereafter in shade for a certain length of time. Quillings are broken pieces and
splits of all grades of cinnamon quills. The feather like pieces of inner bark
consisting of shavings and small pieces of bark left over from the quill-making
process are called featherings. Cinnamon chips are obtained from rough unpeelable
Component Molecularformula
Molarmassg/mol
Densityg/ml
Boilingpoint oC
1 1,4-dimethyl benzene(p-xylene) C8H10 106.18 0.87 139.61
2 Styrene C8H8 104.15 0.903 145.1593 benzene, 1,2,3-trimethyl C9H12 120.194 0.891 176.124 α-phellandrene C10H16 136.26 0.835 171.5
5 benzene,1-methyl-4-(1-methylethyl)(p-cymene) C10H14 134.24 0.861 173.9
6 β-phellandrene C10H16 136.26 0.82 175
7 1,6-octadiene-3-ol,3,7-dimethyl(linalool) C10H18O 154.25 0.859 198.5
8 benzenepropanal C9H10O 134.18 - -
9 3-cyclohexene-1-ol,4-methyl-1-(1-methylethyl) (terpinen-4-ol) C10H18O 154.25 0.933 208.999
10 2-Propenal,3-phenyl(cinnamaldehyde) C9H8O 132.16 1.034 246.8
11 cinnamaldehyde-E C9H8O 132.16 1.05 246.84112 eugenol C10H12O2 164.22 1.067 25513 caryophyllene C15H24 204.35 0.894 268.3614 2-propen-1-ol-3-phenyl-, acetate
(cinnamyl acetate) C11H12O2 176.2 1.054 265
15 2-Propenal,3-(2-methoxyphenyl)-(2-methoxy-cinnamaldehyde) C10H10O2 162.19 1.068 334.8
16 benzyl benzoate C14H12O2 212.248 1.128 324.1
Click h
ere to
buy
ABB
YY PDF Transformer 2.0
www.ABBYY.comClic
k here
to buy
ABB
YY PDF Transformer 2.0
www.ABBYY.com
11
bark scraped off from thicker stems. The stems of the cinnamon produce mainly
“katta-Chips” or quills. Other by products are firewood, quillings and featherings.
Cinnamon leaf and bark oils are obtained by distilling the leaf and bark separately.
Figure 2.2: Flow diagram of cinnamon processing
2.2.2 Types of “katta-chips”
There are mainly two types of “katta-chips” available in the market called “mas
katta” and “wal katta”. wal katta is obtained from twigs and immature branches by
beating these parts and is greenish rather than brownish. mas katta is obtained from
unpeelable cinnamon tree parts and matured branches. According to market detail
mas katta has higher demand than wal katta but wal katta is commonly found
compared to the mas katta.
2.2.3 Cinnamon “katta-Chips” peeling process
Cinnamon plants are grown as bushes. When plants are two years of age, they are
ready for harvesting. The peelers can identify the cinnamon tree parts which cannot
be used to make cinnamon quills by their experience. Peeler selects main tree stem
for cinnamon quill preparation and rest of the tree parts such as twigs, leaves and
unpeelable cinnamon tree parts are left at the cinnamon yards. After that “katta-
Click h
ere to
buy
ABB
YY PDF Transformer 2.0
www.ABBYY.comClic
k here
to buy
ABB
YY PDF Transformer 2.0
www.ABBYY.com
12
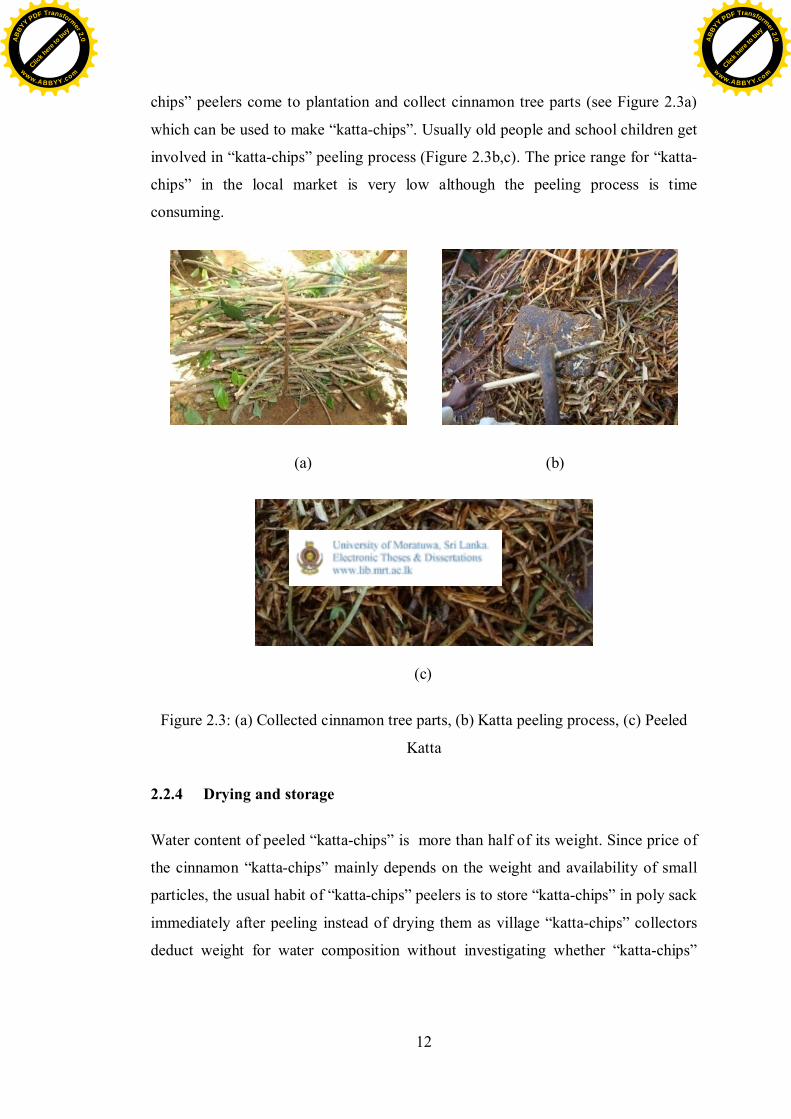
chips” peelers come to plantation and collect cinnamon tree parts (see Figure 2.3a)
which can be used to make “katta-chips”. Usually old people and school children get
involved in “katta-chips” peeling process (Figure 2.3b,c). The price range for “katta-
chips” in the local market is very low although the peeling process is time
consuming.
(a) (b)
(c)
Figure 2.3: (a) Collected cinnamon tree parts, (b) Katta peeling process, (c) Peeled
Katta
2.2.4 Drying and storage
Water content of peeled “katta-chips” is more than half of its weight. Since price of
the cinnamon “katta-chips” mainly depends on the weight and availability of small
particles, the usual habit of “katta-chips” peelers is to store “katta-chips” in poly sack
immediately after peeling instead of drying them as village “katta-chips” collectors
deduct weight for water composition without investigating whether “katta-chips”
Click h
ere to
buy
ABB
YY PDF Transformer 2.0
www.ABBYY.comClic
k here
to buy
ABB
YY PDF Transformer 2.0
www.ABBYY.com
13
peelers have dried them or not. Therefore peeled “katta-chips” remain in poly sacks
until village “katta-chips” collector come to peeler’s houses for buying. Therefore
storage time in poly sack at peeler’s house depend on the frequency of collecting by
village “katta-chips” collector. It may be one day or one week. The frequency of
collection varies due to many factors including the season of the year. During the
main season, collection is very frequent due to the availability.
Village “katta-chips” collectors examine the wetness of “katta-chips” by touching
and visual examination and dry them if they are not at the required dryness as
requested by the “katta-chips” traders. Cinnamon traders in towns, remove
unnecessary parts such as cinnamon leaves, wood pieces and sieve to remove dust.
Cleaned “katta-chips” are packed in poly sacks until they are sent to the cinnamon oil
producers for distillation.
2.2.5 Cinnamon oil extraction methods
This section describes main methods of cinnamon oil extraction and their
fundamental concepts. The choice of each extraction method lies on, sensitivity of
the essential oils to the action of heat and water, volatility of the essential oil and
water solubility of the essential oil (Ravindran et al., 2004).
2.2.5.1 Steam distillation
Dried cinnamon bark is placed in still and the steam is allowed to pass through the
cinnamon bark under pressure which softens the cells and allows the bark oil to
escape in vapour form. The vapour produced is passed into a condenser and then it is
cooled. The mixture of water and cinnamon bark oil is left from the condenser and
separated into two layers in a separator. Proper temperature must be maintained
throughout the distillation process, and pressure, length of time, equipment, and
batch size are strictly monitored.
Click h
ere to
buy
ABB
YY PDF Transformer 2.0
www.ABBYY.comClic
k here
to buy
ABB
YY PDF Transformer 2.0
www.ABBYY.com
14
2.2.5.2 Hydro distillation
Water or hydro distillation is one of the oldest and easiest methods being used for the
extraction of essential oils. In this method, the material is completely immersed in
water, which is boiled by applying heat using direct fire, steam jacket, closed steam
jacket, closed steam coil or open steam coil. One of the drawbacks of hydro
distillation is esterification due to the prolong action of hot water.
2.2.5.3 Solvent extraction
The dried cinnamon bark gets contacted with a solvent like ether, petroleum, hexane
or acetone and the soluble volatile organic compounds of the cinnamon bark dissolve
in the solvent. This is not considered the best method for extraction as the solvents
can leave a small amount of residue behind which could cause allergies and effect
the immune system.
2.2.5.4 Super critical CO2 extraction
This method can be introduced as a tool to overcome disadvantages of the traditional
essential oil extraction processes such and also can be used for applications where
high purity is required. CO2 is the most common super critical fluid (SCF). In the
process of cinnamon bark oil production, super critical CO2 at 300-600 bar are used.
This method gives a higher yield (1.4%) than conventional distillation yield (0.5-
0.8%). However this method is more costly, due to high capital investment and
operational costs.
2.3 Essential Oil Analysis
Aromatic plants are generally referred to as essential oil yielding plants and have
volatile, odoriferous oils in special cells, glands or ducts located in different parts of
a plant, such as the leaves, barks, roots, flowers and fruits and sometimes in just one
or two parts. The oils are usually present in very small amounts and comprise only a
tiny fraction of the entire plant material. The oils are produced during some
metabolic processes of the plant and are secreted or excreted as odoriferous by-
Click h
ere to
buy
ABB
YY PDF Transformer 2.0
www.ABBYY.comClic
k here
to buy
ABB
YY PDF Transformer 2.0
www.ABBYY.com
15
products. The fragrant oils may not necessarily be present as such in the living plants
but may occur as odourless compounds called glycosides. When the plant tissues are
macerated, an enzyme reaction occurs, these causes the glycosides to undergo a
chemical change. This action in turn liberates the distinctive essential oil
(Vishwambhar, 2013).
Essential oil can be analyzed in both qualitatively and quantitatively. The
information given by such analyses are very useful in research to evaluate the
performance and in economy it is the factor which determines the price of the
commodity.
2.3.1 Methods of oil analysis
The easiest and quickest way of qualitative analysis is the sensory evaluation, such as
the viscosity, colour, clarity and odour. Sensory evaluation can also be used as the
first identification of oil adulteration. Testing of physical parameters such as specific
gravity, optical rotation and refractive index can be used to reveal any adulteration
with a foreign substance in an oil sample. Apart from these basic methods, with the
introduction of new technologies of instrumentation, gas liquid chromatography
(GLC) has come to play a big role as it can be used to detect relatively minor
compounds in essential oil which cannot be detected from the classical methods such
as titration. By combining infrared (IR) spectroscopy and mass spectroscopy (MS) to
GLC more positive identification of compounds can be obtained (Ravindran et al.,
2004). GC could detect the major volatile organic compounds, but it is difficult to
detect the minor volatile organic compounds of the extracts that are present at low
levels. There are also limitations associated with mass spectrometry, including an
inability to distinguish closely related isomers due to very similar mass spectra,
compounds to be investigated are not present in spectra library and the computer
incorrectly choosing a compound based on a similar mass (Cai et al., 2006).
Moreover, a singular analytic method gives little information, and thus, the analysis
for herbal medicines does not completely reflect the quality of herbal medicines (Liu
et al., 2010). GC–MS has been proven to be a powerful and suitable tool for the
determination of volatile compounds because of its high separation efficiency and
Click h
ere to
buy
ABB
YY PDF Transformer 2.0
www.ABBYY.comClic
k here
to buy
ABB
YY PDF Transformer 2.0
www.ABBYY.com
16
sensitive detection (Kopka, 2006). However, the essential oils are complex systems
with varying compositions, and the peaks are often overlapping or embedded, even
when the chromatographic/spectral conditions are optimized (Wang et al., 2010). As
in other studies, the essential oils of cinnamon were analyzed using high performance
liquid chromatography (HPLC), gas chromatography (GC) and gas chromatography–
mass spectrometry (GC–MS) (Jayaprakasha et al., 2002; Wang et al., 2005; Ding et
al., 2011; Geng et al., 2011).
2.3.2 Volatile organic compounds of cinnamon oil
Cinnamon yields mainly leaf and bark oils, which are used in perfumery and
flavouring. The major component of leaf oil is eugenol, while that of bark oil is
cinnamaldehyde. Volatile organic compounds do occur in other parts, including root
bark, fruits, flowers, twigs and branches. The volatile oil content in cinnamon bark
varies from 0.4 to 2.8% and leaves from 0.24–3.0%, depending on the location and
method of distillation (Angmor et al., 1972; Wijesekera, 1978; Rao et al., 1988
Krishnamoorthy et al., 1996; Raina et al., 2001).
The chemical composition of the essential oils in cinnamon has been studied by
different researchers. Analysis of cinnamon bark and leaf oils has been done by high-
pressure liquid chromatography (HPLC) and most important distinguishing feature is
the cinnamaldehyde (55-75%) and eugenol(5-18%) content in cinnamon bark oil
(Ross, 1976). Similarly, Senanayake, (1978) reported that the oil from the stem bark
of a commercial sample contained 75% cinnamaldehdyde, 5% cinnamyl acetate,
3.3% caryophyllene, 2.4% linalool and 2.2% eugenol, while camphor (56%) was the
major component of root bark oil with cineole, cu-terpineol, α-pinene, and limonene
also of importance. The principal component of leaf oil, namely, eugenol, varies
from 65 to 92%. Cinnamaldehyde is the major component in all the cases and is the
character-impact component in cinnamon bark, followed by cinnamyl acetate,
eugenol and 2-methoxy-cinnamaldehyde (Archer, 1988). Another analysis of
cinnamon bark volatile oil claimed the presence of 13 volatile organic compounds
accounting for 100% of the total amount and (E)-cinnamaldehyde was found as the
major component along with δ-cadinene (0.9%) (Singh, et al., 2007). The volatile
Click h
ere to
buy
ABB
YY PDF Transformer 2.0
www.ABBYY.comClic
k here
to buy
ABB
YY PDF Transformer 2.0
www.ABBYY.com
17
compounds of cinnamon barks extracted using hydro distillation from three species
and seven habitats, were detected and identified by GC–MS and indicated that the
main compound in the volatile oils of nine samples was trans-cinnamaldehyde
(66.28–81.97%) (Li, et al., 2013).
Krishnamoorthy et al., (1988) observed variation in the bark oil content in plants
with purple leaf flushes (1.84%) and those with green flushes (1.43%). Various
researches have been carries out to investigate the chemical composition of the oil
obtained from cinnamon leaf (Singh, et al., 2007), buds (Jayaprakasha, 2002) and
stem (Senanayake, et al., 1978). The volatile oil from the stem bark of Madagascan
origin was rich in eugenol (Medici et al., 1992). Krishnamoorthy et al., (1996)
reported 2.7–2.8% volatile oil was contained with 58-68% cinnamaldehyde content
in the bark and 75-78% eugenol in the leaves of the cinnamon varieties Navashree
and Nithyasree. Several chemotypes of C. zeylanicum have been reported, based on
the chemical composition of leaf oil. Guenther, (1953) and Rao et al., (1988)
reported two chemical races of C. zeylanicum from Bubhaneshwar, India, one rich in
eugenol (83.1-88.6%) and the other dominated by benzyl benzoate (63.6-66.0%).
Another chemotype with 85.7% linalool in leaf oil was reported by Jirovetz et al.,
(2001). Nath et al., (1996) recorded a chemotype of C. verum with 84.7% benzyl
benzoate in bark oil and 65.4% benzyl benzoate in leaf oil from the Brahmaputra
Valley, India. Two chemotypes of C. verum from Brazil were reported by Koketsu et
al., (1997); one rich in eugenol (94.14-95.09%) and the other predominated by
eugenol and safrole (with 55.08-58.66% eugenol and 29.57-39.52% safrole,
respectively). According to Variyar and Bandyopadhyay, (1989), eugenol type is the
most commonly occurring chemical race of C. verum. Higher oil content was
reported in cinnamon leaf from Hyderabad (4.7%) compared with that from
Bangalore (1.8%) (Mallavarapu et al., 1995). The two oils were of eugenol type and
differed with respect to the relative amounts of linalool, cinnamaldehyde, cinnamyl
alcohol, cinnamyl acetate and benzyl benzoate. The essential oil of the leaves of C.
zeylanicum from Cameroon contained eugenol (85.2%), (E)-cinnamaldehyde (4.9%),
linalool (2.8%) and b-caryophyllene (1.8%) (Jirovetz et al., 1998). The oils from the
leaves and bark of C. zeylanicum from Madagascar contained cinnamaldehyde and
Click h
ere to
buy
ABB
YY PDF Transformer 2.0
www.ABBYY.comClic
k here
to buy
ABB
YY PDF Transformer 2.0
www.ABBYY.com

18
camphor as the major volatile organic compounds (Chalchat and Valade, 2000). The
leaf oil from Little Andaman Island contained 47 detectable constituents,
representing 99.96% of the oil. The main constituents were eugenol (76.60%),
linalool (8.5%), piperitone (3.31%), eugenyl acetate (2.74%) and cinnamyl acetate
(2.59%) (Raina et al., 2001). The leaves harvested in summer gave the highest oil
recovery (1.84%) and eugenol content (83%), whereas in the rainy season, the
concentration of esters, namely, eugenyl acetate and benzyl benzoate, were
comparatively higher (Kaul et al., 1996). Cinnamon leaves affected by leaf spot
disease yielded less oil (1.2%), but the eugenol content was unaffected (Kaul et al.,
1998). Rao et al., 2006 reported that the essential oil content (1.9–2.2%) and the
chemical composition of C. verum leaves were not affected by storage up to a period
of 15 months.
Kaul et al., (2003) analysed essential oil profiles of various parts of cinnamon. The
oil yields of different plant parts were: 0.40% in tender twigs; 0.36% in the pedicels
of buds and flowers; 0.04% in buds and flowers; 0.33% in the pedicels of fruits; and
0.32% in fruits. The tender twig oil was richer in α-phellandrene (3.4%), limonene
(1.6%) and (E)-cinnamaldehyde (4%). The volatile oils from pedicels were richer in
(E)-cinnamyl acetate (58.1–64.5%), β-caryophyllene (9.6–11.1%) and neryl acetate
(1.4–2.0%). Higher amounts of (Z)- cinnamyl acetate (6.1%), α-humulene (2.2%),δ-
cadinene (2.2%), humulene epoxide I (5%), α-muurolol (4.9%) and α-cadinol (2.4%)
were observed in the oil of buds and flowers. However, all the oils contained linalool
(3.6–27.4%), (E)-cinnamyl acetate (22.0–64.5%) and β-caryophyllene (6.9–11.1%)
as their major compounds.
Bernard et al., (1989) studied the composition of volatiles from C. zeylanicum bark
by two methods, namely, direct distillation and extraction using TTE (1,1,2-
trichloro- 1,2,2-trifluoroethane) followed by hydro distillation. Both methods were
comparable, yielding 0.98–1.1% volatile oil. However, compositional differences
were observed in both the oils. The TTE extract had a higher cinnamaldehyde
content (84.1%) compared with the direct hydro distilled oil (75%). α-Pinene, 1,8-
cineole and p-cymene, which were present in minor amounts in the hydro distilled
Click h
ere to
buy
ABB
YY PDF Transformer 2.0
www.ABBYY.comClic
k here
to buy
ABB
YY PDF Transformer 2.0
www.ABBYY.com
19
oil, were absent in the TTE product. There was less linalool, β-caryophyllene and
cinnamyl acetate in the oil obtained by the TTE method compared with the direct
distillation method.
2.3.3 Effect of the drying on the volatile organic compounds of essential oil
Drying is commonly employed in preparing spices for market, as some spices can
contain up to 75-80% water, and water levels need to be lowered to less than 15%. In
the countryside, the household method of drying in the shade, or in well-ventilated
rooms is still in use today, but industrial-scale drying is carried out in convection
ovens. Drying of spices inhibits microorganism growth and forestalls certain
biochemical changes; but at the same time it can give rise to other alterations that
affect spice quality, such as changes in appearance and alterations in aroma caused
by losses in volatiles or the formation of new volatiles as a result of oxidation
reactions, esterification reactions, etc (Diaz-Maroto, et al.,2002c).
Changes taking place in the volatile compounds present in spices and other plants
have been studied by different workers who have shown that the changes depend on
several factors: primarily the drying method and the biological characteristics of the
plant concerned. Reductions in the total quantities of essential oils have been
reported, amounting to 36-45% in sweet basil, 23-33% in marjoram, and 6-17% in
oregano during drying at ambient temperature (Nykanen and Nykanen, 1987).
Conventionally, low drying temperatures between 30 °C and 50 °C are recommended
to protect sensitive active ingredients for drying of medicinal plants, but the
decelerated drying process causes a low capacity of drying installations (Muller and
Heindl, 2006).
Drying in a convection oven also produces losses in volatiles, with the losses varying
according to the drying temperature and drying time employed (Raghavan, et al.,
1994a; Venskutonis, 1997). Increases in the quantities of certain compounds
normally present in the spice (Baritaux, et al., 1992; Yousif, et al., 1999; Bartley &
Jacobs, 2000) or formation of new compounds have in some cases been observed
after drying, probably as a consequence of oxidation reactions, hydrolysis of
Click h
ere to
buy
ABB
YY PDF Transformer 2.0
www.ABBYY.comClic
k here
to buy
ABB
YY PDF Transformer 2.0
www.ABBYY.com
20
glycosylated forms, or the release of substances following the rupture of cell walls
(Huopalahti, et al., 1985).
Accordingly, processing (grinding, drying, etc.) not only brings about a reduction in
overall spice aroma but may also result in qualitative changes by giving rise to a
secondary aroma in addition to the original aroma of the fresh plant.
Prematilake, et al., (1997) has studied the effect of the drying time of fillings on the
quality of cinnamon quills. High quality quills and the bark oils extracted from them
with more aroma and flavor constituents can be prepared by making the quills with
4-5 day dried fillings.
The effect of the drying methods: oven-drying at 45°C, air-drying at ambient
temperature, and freeze-drying on the volatile compounds was evaluated for Bay
Leaf (Laurus nobilis L.) (Diaz-Moroto, et al., 2002a); Spearmint (Mentha spicata L.)
(Diaz-Moroto, et al., 2002b); and parsley (Petroselinum crispum L.) (Diaz-Moroto, et
al., 2002c). Air drying at ambient temperature resulted in few losses in volatile
compounds compared with the fresh herb, whereas oven drying at 45 °C and freeze-
drying caused a decrease in the concentrations of the majority of the volatile organic
compounds.
Using freeze-drying as the drying treatment has been reported to result in changes
that are less pronounced, and the spice has been observed to retain features that are
closer to the characteristic appearance and aroma of the fresh plant (Raghavan, et al.,
1994a; Paakkonen, et al., 1989; Venskutonis, et al., 1996).
The effect of a particular drying method on the release or retention of volatile
compounds is not predictable and depends on the compound and the spice concerned.
Oven-drying and freeze-drying of dill herbs lead to decrease in most of the volatile
compounds compared with the levels in the fresh spice (Huopalahti, et al., 1985;
Raghavan, et al., 1994a). The same occurs in parsley (Diaz-Moroto, et al., 2002c). In
contrast, the effect of oven drying at 30 °C and freeze-drying on the volatile
Click h
ere to
buy
ABB
YY PDF Transformer 2.0
www.ABBYY.comClic
k here
to buy
ABB
YY PDF Transformer 2.0
www.ABBYY.com
21
compounds in thyme and sage has been minor, whereas losses at 60 °C were 43% in
thyme and 31% in sage (Venskutonis, 1997).
Microwave-drying produced greater losses in volatile compounds than oven-drying
in rosemary, although it did preserve the spice’s characteristic green color
(Jaganmohan, et al., 1998). Likewise, freeze-drying preserves the characteristic
appearance of the fresh product (Yousif, et al., 2000), although causing substantial
losses to certain volatiles in the cases of parsley and bay leaf (Diaz-Moroto, et al.,
2002a; Diaz-Moroto, et al., 2002c), whereas shade-drying of spearmint leaves has
resulted in a product with a good green color and few losses of volatiles (Raghavan,
et al., 1994b).
On the other hand, certain compounds normally present have been observed to
increase in different spices after drying, for example, eugenol in bay leaf (Diaz-
Moroto, et al., 2002a), thymol in thyme (Venskutonis, 1997), and some
sesquiterpenes in different spices (Baritaux, et al., 1992; Raghavan, et al., 1994a;
Yousif, et al., 1999; Bartley & Jacobs, 2000; Jerkovic, et al., 2001).
The method used to extract and analyze the volatiles can also influence the results.
The traditional method of extracting essential oils from plants, steam distillation,
primarily collects the most volatile organic compounds, whereas solvent-based
extraction methods are capable of extracting substances spanning a broader range of
volatilities, depending on the solvent employed.
Simultaneous distillation extraction (SDE) has been widely used in analyzing the
volatiles of herbs and plants. Supercritical fluid extraction (SFE) offers an advantage
over SDE, in that the substances extracted can be altered by making minor variations
in the pressure and temperature conditions of the extraction fluid (Reverchon, 1997).
In owers of Roman chamomile (Chamaemelum nobile L. All. var. ora plena), it
was found that drying methods had no effect on the number of chemical components
of the essential oil, but had a signicant effect on the proportion of the various
components in sun-drying, shade-drying and oven-drying at 40 °C (Omidbaigi, et al.,
Click h
ere to
buy
ABB
YY PDF Transformer 2.0
www.ABBYY.comClic
k here
to buy
ABB
YY PDF Transformer 2.0
www.ABBYY.com
22
2004). However, in Felicia muricata leaves, chemical composition in leaves were
affected by the drying method and total of 38,40,33 and 30 volatile organic
compounds has been identified in the oils of fresh, air dried, sun dried and oven dried
samples (Ashafa and Grierson, 2008). Drying at 45ºC was found as the best
condition based on the changes of essential oil and color during drying and storage
for tarragon (Artemisia dracunculusL.) (Hosseini, et al., 2011).
There were significant chemical alterations in the major volatile organic compounds
of the essential oils obtained from Helichrysumodoratissimum plant using different
methods of drying (Asekun, et al., 2007).
Studies conducted to investigate the effect of different temperatures in the oils of
sweet wormwood (Artemisia annuaL.) indicate that the drying temperature has a
significant effect on volatile organic compounds, as when the temperature was
increased, the monoterpenes content was gradually decreased and vice versa for
sesquiterpenes. (Khangholi and Rezaeinodehi, 2008).
2.4 Statistical Analysis of the Effect of the Drying Using SPSS
Statistics is a mathematical tool for quantitative analysis of data and it has been used
by different researchers for analyzing the data to find out the effect of the drying for
volatile compounds present in spices and other plants.
Powerful statistical software (Minitab, SAS, STAT, IBM SPSS Statistics, Stata,
STATISTICA and etc.) has been developed that allows for thorough calculations on
large data sets that would be impossible to perform manually. Some of the available
methods are complex and difficult to apply, while others can easily and successfully
be employed by researchers without a strong statistical background (Ho, 2006).
Ruse, et al., (2007) reported that the effect of pre-treatment methods (perforation,
halving and steam-blanching) and drying conditions on the composition of volatile
compounds in cranberries. A three-way ANOVA analysis using IBM SPSS 20.0 was
selected to investigate factor effects (volatile compound, cultivar and drying method)
and interactions among them.
Click h
ere to
buy
ABB
YY PDF Transformer 2.0
www.ABBYY.comClic
k here
to buy
ABB
YY PDF Transformer 2.0
www.ABBYY.com
23
Li, et al., (2013) showed that the nine samples of cinnamon bark can be effectively
identified and evaluated using principal component analysis. Load factor analysis
revealed that the differences in the volatile compounds of the nine samples were
mainly reflected in the aldehyde, alcohol, alkane and eugenol contents.
Principal component analysis (PCA) and the Student-Newman-Keuls test (SPSS,
Program 2000) were used to assess the significance of the differences among the
various drying methods for Bay Leaf (Laurus nobilis L.) (Diaz-Moroto, et al.,
2002a); Spearmint (Mentha spicata L.) (Diaz-Moroto, et al., 2002b); and parsley
(Petroselinum crispum L.) (Diaz-Moroto, et al., 2002c). Oven drying at 45 °C and
air-drying at ambient temperature produced quite similar results and caused hardly
any loss in volatiles as compared to the fresh herb, whereas freezing and freeze-
drying brought about substantial losses.
The leaves of lemongrass (Cymbopogon citratus) were dried using three different
drying methods and statistical analysis was carried out using the Least Significant
Difference (LSD) test at 0.05%. Oven drying at 45 °C gave the highest essential oil
percentage (2.45%) compared to shade-drying (2.12%) and sun-drying methods
(2.10%) (Hanna, et al., 2007).
Mercer, 2012 investigated and compared the kinetics of mango drying using three
elevated temperatures in an Armfield Model UOP8 laboratory-scale tray dryer.
Analysis of variance (ANOVA) and Duncan test using SPSS 19.0.0 (IBM SPSS
Statistics, Chicago, Illinois, USA) was performed to determine the differences in
temperatures. Even though the curves at 44 °C and 50 °C were not statistically
different (p = 0.05), a significant difference (at p=0.05) was observed between the
curves at 50 °C and 60 °C.
Click h
ere to
buy
ABB
YY PDF Transformer 2.0
www.ABBYY.comClic
k here
to buy
ABB
YY PDF Transformer 2.0
www.ABBYY.com

24
3 3 MATERIALS AND METHODOLOGY
After selecting a suitable cinnamon type, experimental setup was equipped for
carrying out the research. Fixed bed tunnel dryer was used for drying cinnamon at
different drying temperatures. Cinnamon bark oil was extracted by hydro distilling
the dried sample. Finally the composition analysis was carried out for each cinnamon
bark oil sample.
3.1 Materials & Equipments
Cinnamon chips were collected from a cinnamon plantation at Gonapinuwala area in
Galle district, southern province of Sri Lanka during the month of August. These
cinnamon chips were of the type "mas-katta".
Mettler PM4000 (0-4000 grams) electronic balance was used for weighing the
cinnamon chips (Figure 3.1a). Laboratory moisture balance (Citizen-MB 200X) was
used to determine the initial moisture content of samples (Figure 3.1b).
(a) (b)
Figure 3.1: (a) Weighing balance, (b) Moisture balance
Laboratory tunnel dryer fitted with an electrical heater was used to uniformly dry
cinnamon chips on a fixed bed (Figure 3.2) of the dimensions 30.5 x 30.5 x 5 cm3.
The dryer was consisted of a centrifugal blower which was used to blow air over an
Click h
ere to
buy
ABB
YY PDF Transformer 2.0
www.ABBYY.comClic
k here
to buy
ABB
YY PDF Transformer 2.0
www.ABBYY.com
25
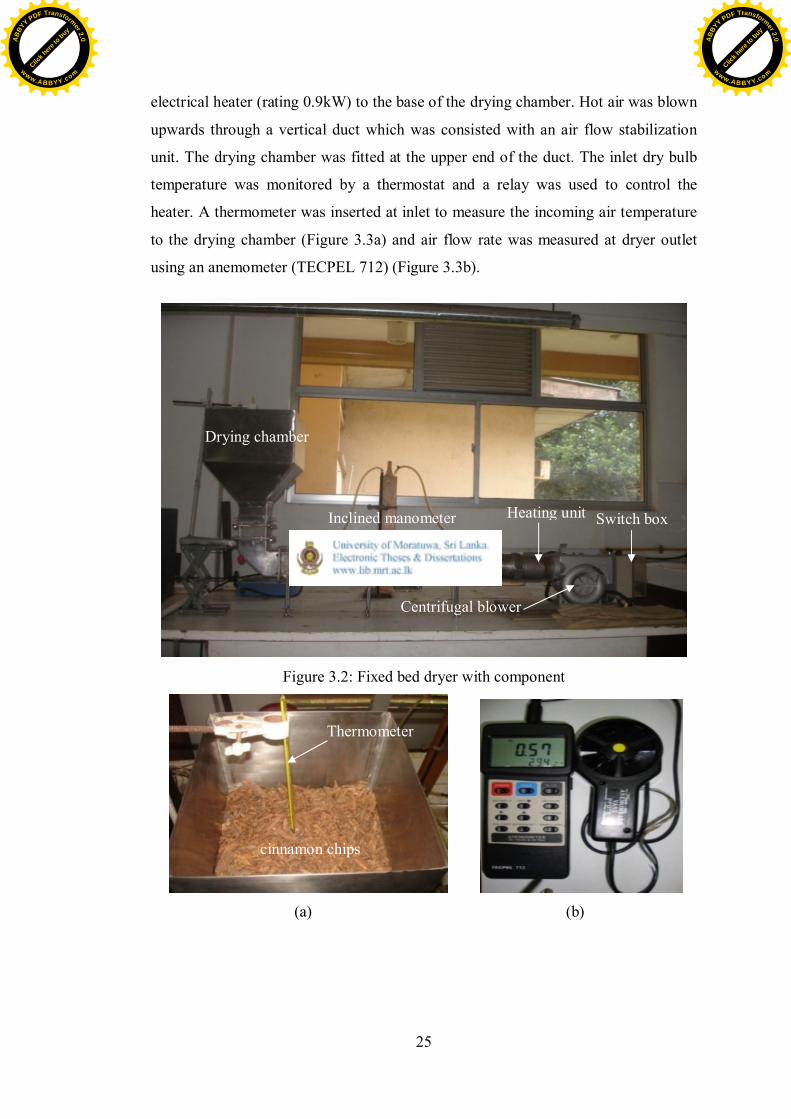
electrical heater (rating 0.9kW) to the base of the drying chamber. Hot air was blown
upwards through a vertical duct which was consisted with an air flow stabilization
unit. The drying chamber was fitted at the upper end of the duct. The inlet dry bulb
temperature was monitored by a thermostat and a relay was used to control the
heater. A thermometer was inserted at inlet to measure the incoming air temperature
to the drying chamber (Figure 3.3a) and air flow rate was measured at dryer outlet
using an anemometer (TECPEL 712) (Figure 3.3b).
Figure 3.2: Fixed bed dryer with component
(a) (b)
Inclined manometer Switch boxHeating unit
Centrifugal blower
Drying chamber
Thermometer
cinnamon chips
Click h
ere to
buy
ABB
YY PDF Transformer 2.0
www.ABBYY.comClic
k here
to buy
ABB
YY PDF Transformer 2.0
www.ABBYY.com

26
Figure 3.3: (a) Thermocouple, (b) Anemometer
Inlet air temperature was controlled with an accuracy of ± 1 °C. A constant air flow
rate of 0.023 m3/s (this is the maximum air flow rate of the unit) was maintained
throughout the experiment. The oil samples were analysed using gas chromatography
mass spectrometer (Agilent, American 7890A/5975C GC-MS system) (Figure 3.4).
Figure 3.4: GC-MS-7890A gas chromatograph equipped with a 5975C plus mass
spectrometer (Agilent, American)
3.2 Drying of Cinnamon Chips
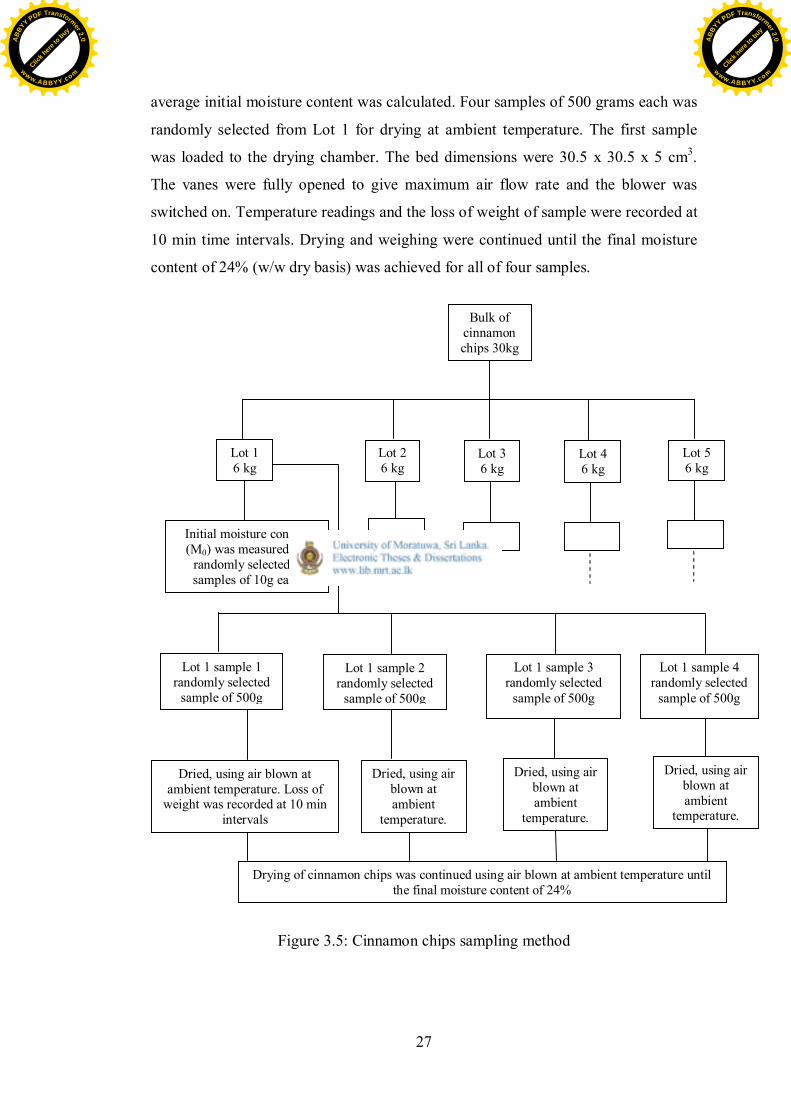
A bulk of 30 kg of cinnamon chips of the type “mas katta” was selected for the
experiments. Cinnamon chips were kept in sealed poly sack bags to avoid loss of
moisture. The sampling method indicated in Figure 3.5 was used to maintain the
uniformity between experiments. Cinnamon chips of weight 30 kg was divided into 5
lots containing 6 kg each for air drying at temperatures of ambient, 35 °C, 40 °C, 45
°C and 50 °C. Initial moisture content (M0) of cinnamon chips (w/w wet basis) was
measured using moisture balance for randomly selected 5 samples from each Lot and
Click h
ere to
buy
ABB
YY PDF Transformer 2.0
www.ABBYY.comClic
k here
to buy
ABB
YY PDF Transformer 2.0
www.ABBYY.com
27
average initial moisture content was calculated. Four samples of 500 grams each was
randomly selected from Lot 1 for drying at ambient temperature. The first sample
was loaded to the drying chamber. The bed dimensions were 30.5 x 30.5 x 5 cm3.
The vanes were fully opened to give maximum air flow rate and the blower was
switched on. Temperature readings and the loss of weight of sample were recorded at
10 min time intervals. Drying and weighing were continued until the final moisture
content of 24% (w/w dry basis) was achieved for all of four samples.
Figure 3.5: Cinnamon chips sampling method
Lot 1 sample 1randomly selected
sample of 500g
Lot 1 sample 2randomly selected
sample of 500g
Lot 1 sample 3randomly selected
sample of 500g
Lot 1 sample 4randomly selected
sample of 500g
Dried, using air blown atambient temperature. Loss of
weight was recorded at 10 minintervals
Dried, using airblown atambient
temperature.
Dried, using airblown atambient
temperature.
Dried, using airblown atambient
temperature.
Drying of cinnamon chips was continued using air blown at ambient temperature untilthe final moisture content of 24%
Bulk ofcinnamonchips 30kg
Lot 16 kg
Lot 26 kg
Lot 36 kg
Lot 46 kg
Lot 56 kg
Initial moisture content(M0) was measured for
randomly selected 5samples of 10g each
Click h
ere to
buy
ABB
YY PDF Transformer 2.0
www.ABBYY.comClic
k here
to buy
ABB
YY PDF Transformer 2.0
www.ABBYY.com
28
The final moisture content of 24 % was selected based on the average moisture
content of cinnamon chips available in the market. The moisture content (on dry
basis) at any instant was calculated using the equations given in section 4.1. Frequent
mixing of cinnamon chips was done to achieve uniform drying. Dried samples were
packed in poly sack bags and stored in a dry place before hydro distilled.
For temperatures above ambient, the loading of cinnamon chips was done after the
blowing air reached the required set temperature for drying. All the other
experimental procedures were carried out as similar to ambient temperature (Lot 1)
for air drying at temperatures of 35 °C (Lot 2), 40 °C (Lot 3), 45 °C (Lot 4) and 50
°C (Lot 5).
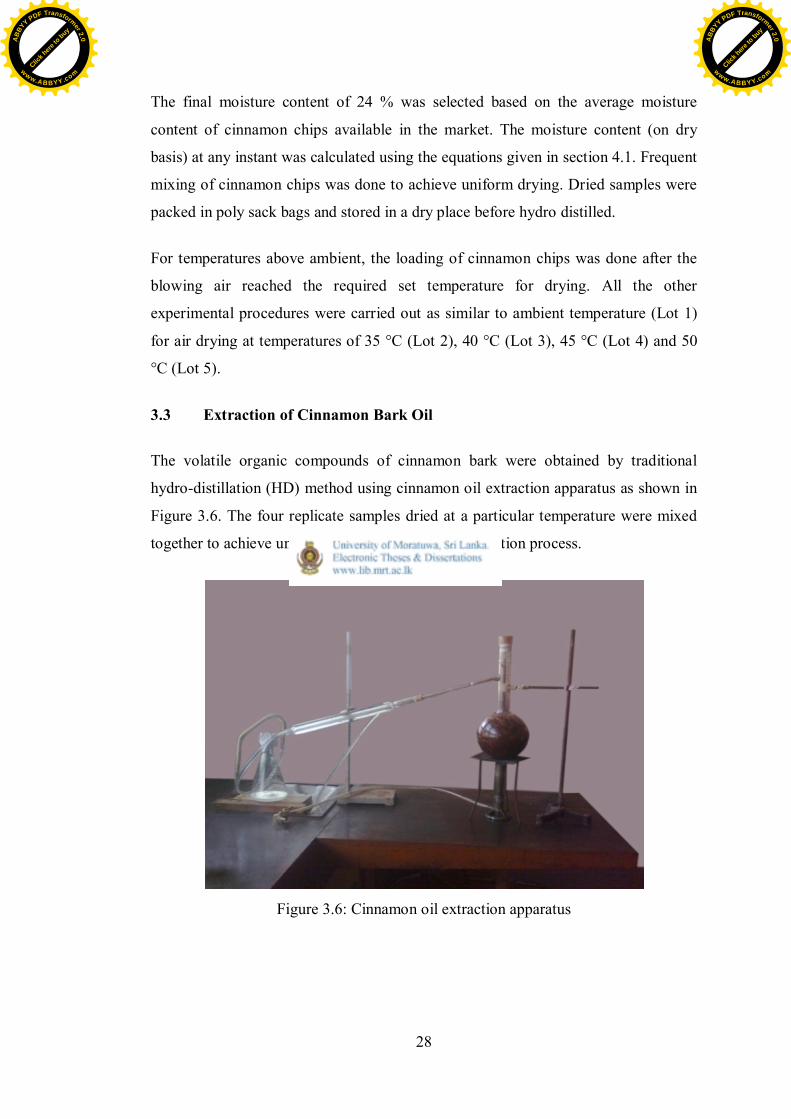
3.3 Extraction of Cinnamon Bark Oil
The volatile organic compounds of cinnamon bark were obtained by traditional
hydro-distillation (HD) method using cinnamon oil extraction apparatus as shown in
Figure 3.6. The four replicate samples dried at a particular temperature were mixed
together to achieve uniformity before the hydro distillation process.
Figure 3.6: Cinnamon oil extraction apparatus
Click h
ere to
buy
ABB
YY PDF Transformer 2.0
www.ABBYY.comClic
k here
to buy
ABB
YY PDF Transformer 2.0
www.ABBYY.com
29
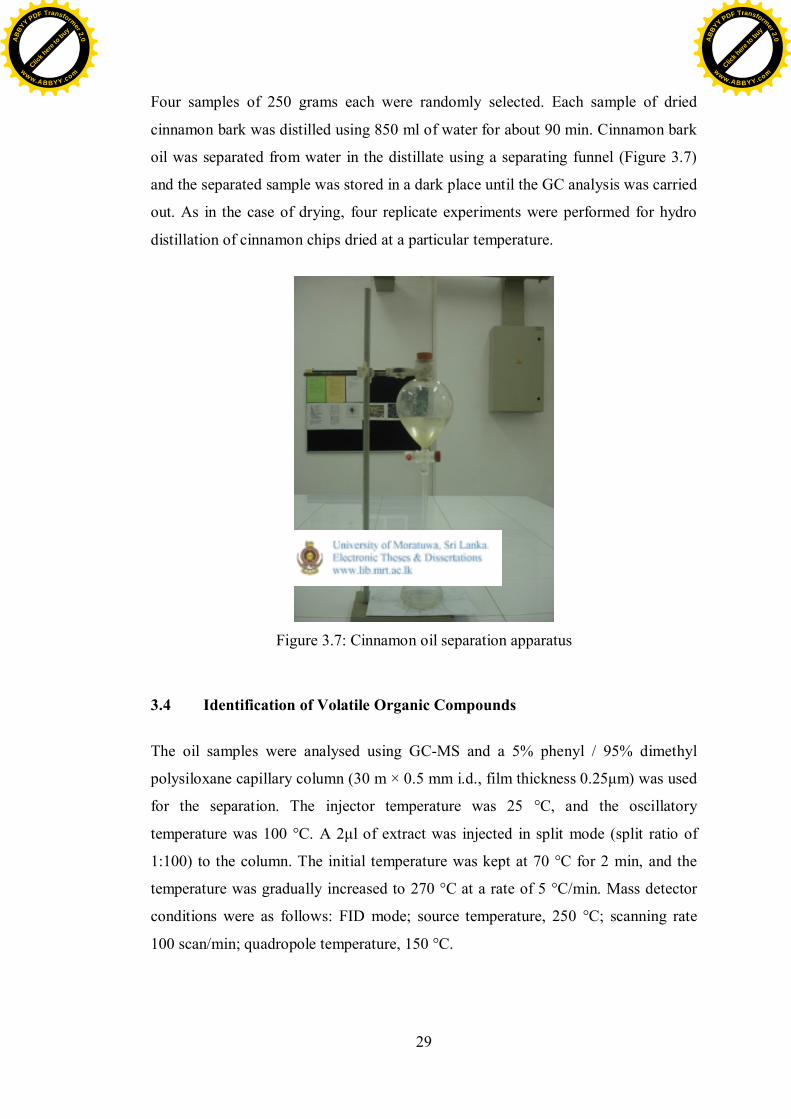
Four samples of 250 grams each were randomly selected. Each sample of dried
cinnamon bark was distilled using 850 ml of water for about 90 min. Cinnamon bark
oil was separated from water in the distillate using a separating funnel (Figure 3.7)
and the separated sample was stored in a dark place until the GC analysis was carried
out. As in the case of drying, four replicate experiments were performed for hydro
distillation of cinnamon chips dried at a particular temperature.
Figure 3.7: Cinnamon oil separation apparatus
3.4 Identification of Volatile Organic Compounds
The oil samples were analysed using GC-MS and a 5% phenyl / 95% dimethyl
polysiloxane capillary column (30 m × 0.5 mm i.d., film thickness 0.25μm) was used
for the separation. The injector temperature was 25 °C, and the oscillatory
temperature was 100 °C. A 2μl of extract was injected in split mode (split ratio of
1:100) to the column. The initial temperature was kept at 70 °C for 2 min, and the
temperature was gradually increased to 270 °C at a rate of 5 °C/min. Mass detector
conditions were as follows: FID mode; source temperature, 250 °C; scanning rate
100 scan/min; quadropole temperature, 150 °C.
Click h
ere to
buy
ABB
YY PDF Transformer 2.0
www.ABBYY.comClic
k here
to buy
ABB
YY PDF Transformer 2.0
www.ABBYY.com
30
4 4 DATA ANAYSIS4.1 Calculation of Moisture Content
The moisture content (w/w wet basis) was calculated using the equation 4.1.
4.1
Where,
The wet basis moisture content was converted to dry basis using the equation 4.2.
4.2
Where,
The average initial moisture content was found to be 0.5844 (w/w wet basis) and
calculated dry basis moisture contents of cinnamon chips at different temperatures
are mentioned in Table 5.1.
Click h
ere to
buy
ABB
YY PDF Transformer 2.0
www.ABBYY.comClic
k here
to buy
ABB
YY PDF Transformer 2.0
www.ABBYY.com
31
The rate of drying was calculated using the equation 4.3.
4.3
Where,
4.2 Gas Chromatography and Mass Spectrometer Analysis
The extracted cinnamon bark oil samples were analysed to identify the volatile
organic compounds by the method of Gas-Chromatography and Mass-Spectrometer
(GC-MS) analysis. Figure 4.1 depicts the chromatogram of the cinnamon bark oil
hydro distilled from cinnamon chips which were dried using air at 35 °C condition
(Trial 1). Gas chromatograms of cinnamon oil at different drying temperatures are
shown in Appendix A. The volatile organic compounds which were indicated as a
peak in gas chromatograms were identified by matching with the recorded mass
spectra from the National Institute of Standards and Technology (NIST08. LIB)
libraries data provided by the software of the GC-MS systems, whose spectra most
closely resemble with the submitted component spectrum. Li, et al., (2013) identified
the volatile organic compounds using the libraries of National Institute of Standards
and Technology (NIST05. LIB), provided by the software of the GC-MS systems.
The submitted spectrum is commonly originated from a GC/MS data file, where it
can be a single mass spectral scan or an average.
Click h
ere to
buy
ABB
YY PDF Transformer 2.0
www.ABBYY.comClic
k here
to buy
ABB
YY PDF Transformer 2.0
www.ABBYY.com
32
Appendix B represents the comparison of the standard and mass spectra of different
volatile organic compounds in cinnamon bark oil obtained in the current study. Each
search produces a “hit list” of library spectra, which was ordered by similarity to the
target spectrum according to a computed “match factor”. Ideally, this quantity should
reflect the likelihood that the user and reference spectrum arose from the same
compound. Quantitative analyses of each essential oil component were carried out by
a peak area normalization measurement. Relative content percentage was calculated
as the area corresponding to each component with regards to the total area of the
chromatogram. Gas chromatogram data sheets at different drying temperatures are
represented in Appendix C. Table 5.2 summarizes the relative content (%) of volatile
Click h
ere to
buy
ABB
YY PDF Transformer 2.0
www.ABBYY.comClic
k here
to buy
ABB
YY PDF Transformer 2.0
www.ABBYY.com
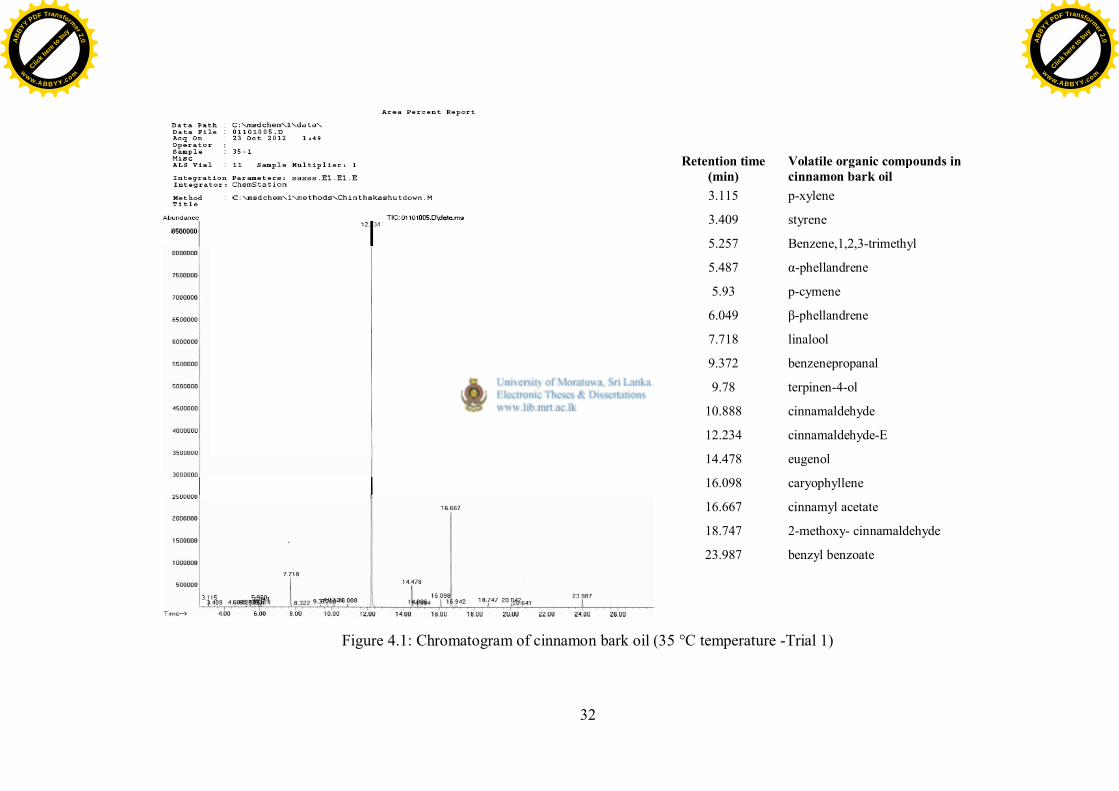
32
Retention time(min)
Volatile organic compounds incinnamon bark oil
3.115 p-xylene
3.409 styrene
5.257 Benzene,1,2,3-trimethyl
5.487 α-phellandrene
5.93 p-cymene
6.049 β-phellandrene
7.718 linalool
9.372 benzenepropanal
9.78 terpinen-4-ol
10.888 cinnamaldehyde
12.234 cinnamaldehyde-E
14.478 eugenol
16.098 caryophyllene
16.667 cinnamyl acetate
18.747 2-methoxy- cinnamaldehyde
23.987 benzyl benzoate
Figure 4.1: Chromatogram of cinnamon bark oil (35 °C temperature -Trial 1)
Click h
ere to
buy
ABB
YY PDF Transformer 2.0
www.ABBYY.comClic
k here
to buy
ABB
YY PDF Transformer 2.0
www.ABBYY.com
33
organic compounds of cinnamon bark oil at five air drying temperatures (ambient, 35
°C, 40 °C, 45 °C and 50 °C).
4.3 Statistical Analysis
Statistics is a mathematical tool for quantitative analysis of data, and as such it serves
as the means by which we extract useful information from data. Statistical analyses
are a critical component of research.
One way - analysis of variance (ANOVA) test and principal component analysis
(PCA) test in IBM SPSS statistics 19 statistical software were used to assess the
significance of the differences among the samples dried at different air drying
temperatures.
4.3.1 One way ANOVA
Analysis of variance (ANOVA) is a statistical test for detecting differences in group
means when there is one parametric dependent variable and one or more independent
variables. The ANOVA procedure can be used correctly if the following conditions
are satisfied. The dependent variable should be of the type either interval data or ratio
data. Interval data type means, the differences of two scale of measured variable are
same. Ratio data type means, size of one scale of measured variable has half, twice or
three times than other scale. The populations should be approximately normally
distributed. The population variances should be equal (homogeneity of variances) and
the observations are all independent of one another. Post-Hoc multiple comparison
procedures (eg: Student-Newman-Keuls (SNK) and etc.) are used to determine which
means are significantly different, if there are more than two treatments (Gaur & Gaur,
2009).
4.3.1.1 Performing the ANOVA with SPSS
One way ANOVA was used to compare the group means of five dying temperatures.
By referring Table 5.2, temperature intervals (ambient, 35 °C, 40 °C, 45 °C and 50
Click h
ere to
buy
ABB
YY PDF Transformer 2.0
www.ABBYY.comClic
k here
to buy
ABB
YY PDF Transformer 2.0
www.ABBYY.com
34
°C) and 16 volatile organic compounds of cinnamon bark oil were considered as
independent variable and dependent variables respectively. Null Hypothesis (H0:
μambient= μ35= μ40= μ45= μ50, μ represents mean temperature), alternative hypothesis
(H1: not H0) and α level (α = 0.05) were defined.
An assessment of the normality and homogeneity of data was a prerequisite for one
way ANOVA test. The significance value (Sig.) in Levene’s F test, greater than 0.05
means that homogeneity of variances (variances of each independent group are
similar) can be achieved. If the Levene's F statistic is less than 0.05 (significant), the
variances of each independent group are not similar and the significant differences
between groups are determined using Welch test instead of ANOVA table. If the
significance value is less than 0.05, then there are statistically significant differences
between groups. There are two main methods of assessing the normality; graphically
and numerically. Shapiro-Wilk test was applied for verifying the normality of data set.
It is more appropriate for small sample sizes (< 50 samples) but can also handle
sample sizes as large as 2000. If the Significance value of the Shapiro-Wilk test is
greater than 0.05 then the data is normal and if not, then the data significantly deviate
from a normal distribution. In order to determine normality graphically, output of a
normal Q-Q (quantile-quantile) plot can be used. This plot compares each point in
data set to where those points would be in an idealized (calculate expected normal
values), perfectly normal distribution with the same mean and standard deviation as
data set. If the data are normally distributed then the data points will be close to the
diagonal line. If the data points stray from the line in an obvious non-linear fashion
then the data are not normally distributed (Ho, 2006).
One way ANOVA in IBM SPSS statistics 19 was applied for analyzing the effect of
drying temperatures (ambient, 35 °C, 40 °C, 45 °C and 50 °C) on these 16 volatile
organic compounds of cinnamon bark oil separately (Refer Appendix D-Figure D.1 &
D.2). Mean, standard deviation and average standard error were calculated for five
drying temperatures of volatile organic compounds of cinnamon bark oil, using one
way ANOVA. Range of minimum and maximum values were obtained to provide an
overall indication of the level of variations manifested by the drying temperatures.
Click h
ere to
buy
ABB
YY PDF Transformer 2.0
www.ABBYY.comClic
k here
to buy
ABB
YY PDF Transformer 2.0
www.ABBYY.com
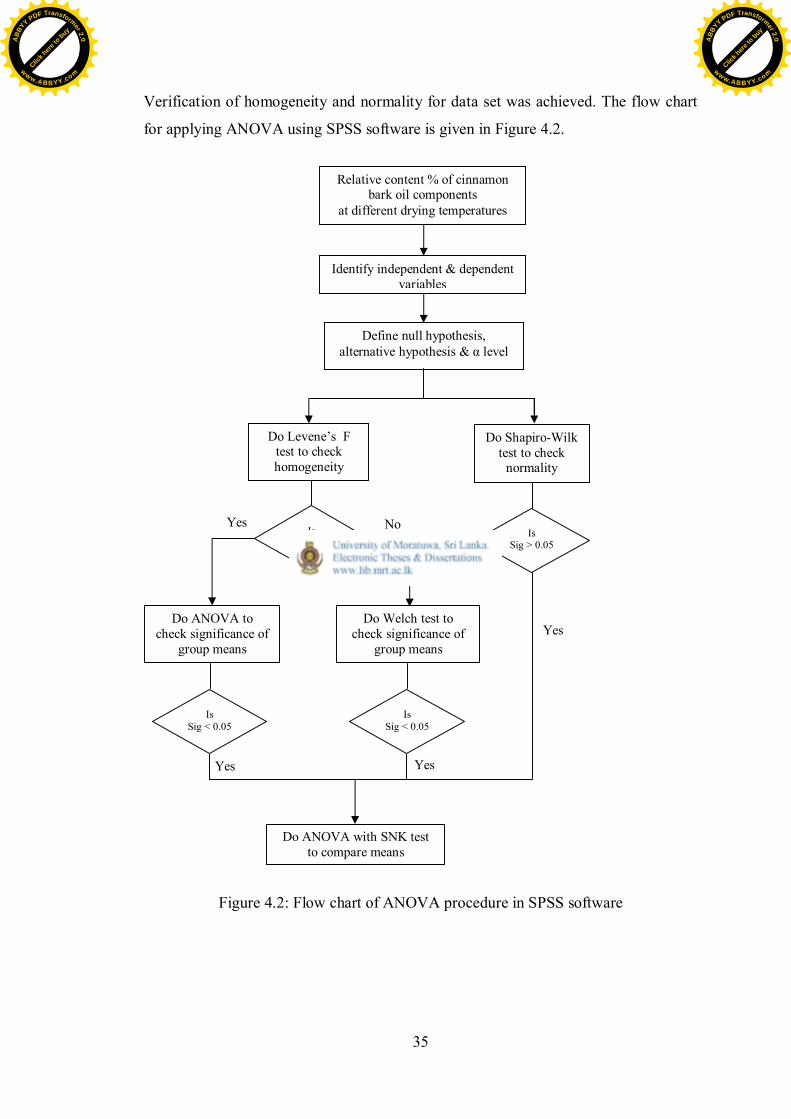
35
Verification of homogeneity and normality for data set was achieved. The flow chart
for applying ANOVA using SPSS software is given in Figure 4.2.
Figure 4.2: Flow chart of ANOVA procedure in SPSS software
Relative content % of cinnamonbark oil components
at different drying temperatures
Define null hypothesis,alternative hypothesis & α level
Identify independent & dependentvariables
Do ANOVA tocheck significance of
group means
Do Welch test tocheck significance of
group means
Yes
Do Levene’s Ftest to checkhomogeneity
Do Shapiro-Wilktest to check
normality
Yes NoIsSig > 0.05
Yes
IsSig > 0.05
IsSig < 0.05
Yes
IsSig < 0.05
Do ANOVA with SNK testto compare means
Click h
ere to
buy
ABB
YY PDF Transformer 2.0
www.ABBYY.comClic
k here
to buy
ABB
YY PDF Transformer 2.0
www.ABBYY.com
36
In ANOVA table, F-ratio is MST/MSE and Sig. is the significance level for the F-
ratio. If the significance value less than 0.0005 means that F-ratio is highly significant.
In SPSS software, this significance value is mentioned to three digits as 0.000 and it is
not actually zero. The mean square for between groups gives the mean square of each
source of variance, is often called “Mean Square Treatment”, or MST. The mean
square for within groups is often called “Mean Square Error”, or MSE. Each mean
square is the relevant sum of squares divided by its degrees of freedom (df).
Student-Newman-Keuls (SNK) test was used to compare means of drying
temperatures (ambient, 35 °C, 40 °C, 45 °C and 50 °C). The means of temperature
groups were divided into homogeneous subsets that were statistically significantly
different from each other. If two groups appear in the same column, then those groups
are not significantly different.
The coefficients of variation (RSD or %RSD) for these five drying temperatures were
determined by the ratio of standard deviation to the mean.
4.3.2 Principal component analysis (PCA)
The central idea of principal component analysis (PCA) is to reduce the
dimensionality of a data set consisting of a large number of interrelated variables,
while retaining as much as possible of the variation present in the data set. The goals
of PCA are to (a) extract the most important information from the data table, (b)
compress the size of the data set by keeping only this important information, (c)
simplify the description of the data set, and (d) analyze the structure of the
observations and the variables. In order to achieve these goals, PCA computes new
variables called principal components which are obtained as linear combinations of
the original variables. The assumptions underlying PCA can be classified as statistical
(normality and linearity) and conceptual (homogeneity) (Jolliffe, 2002).
The complete set of data in Table 5.2 was subjected to principal component analysis
(PCA) using the varimax rotation method (Refer Appendix D- Figure D.3). This
analysis was done for identifying the interrelated variables. Correlations between
Click h
ere to
buy
ABB
YY PDF Transformer 2.0
www.ABBYY.comClic
k here
to buy
ABB
YY PDF Transformer 2.0
www.ABBYY.com
37
volatile organic compounds of cinnamon bark oil & principal components (PCs) and
explained variance % & cumulative variance % of principal components were
calculated. Explained variance % of principal components was the percentage
variance of each and every PC divided by total variance. For a good principal
component solution, a particular volatile organic compound should load high
correlation value on one principal component and low correlation values on all other
principal components in the rotated component matrix. In case if a volatile organic
compound has high correlation on more than one principal component, it may be
wanted to drop from the analyses. Correlation value > 0.6 was considered as relevant
for that principal component and the value may be positively or negatively signed.
The Principal component plots were plotted using principal component scores for four
replicates of each drying temperatures.
Click h
ere to
buy
ABB
YY PDF Transformer 2.0
www.ABBYY.comClic
k here
to buy
ABB
YY PDF Transformer 2.0
www.ABBYY.com

38
5 5 RESULTS AND DISCUSSION5.1 Drying characteristics of Cinnamon chips
The results of the variation of moisture content of cinnamon chips dried at different
temperatures are summarized in Table 5.1.
Table 5.1: Moisture content on dry basis and drying time for different drying
temperatures
Moisture content on dry basis (kgH2O/kg dry solid)
Drying Temperature (°C) 30±2 35±1 40±1 45±1 50±1
Time (minutes)0.000 1.406 1.406 1.406 1.406 1.406
10 1.344 1.216 - - -
15 - - 0.917 0.831 0.831
20 1.227 1.093 0.848 0.756 -
30 1.122 0.981 0.710 0.605 0.568
40 1.017 0.869 0.631 0.501 -
45 - - - - 0.367
50 0.917 0.793 0.552 0.404 -
55 - - - - 0.246
60 0.817 0.717 0.473 0.311 -
70 0.766 0.649 0.412 0.221 -
80 0.717 0.581 0.356 - -
90 0.664 0.513 0.29 - -
100 0.612 0.462 0.245 - -
110 0.555 0.414 - - -
120 0.502 0.367 - - -
130 0.455 0.318 - - -
140 0.432 0.268 - - -
150 0.408 0.234 - - -
160 0.384 - - - -
170 0.361 - - - -
180 0.337 - - - -
190 0.313 - - - -
200 0.288 - - - -
210 0.266 - - - -
220 0.248 - - - -
Click h
ere to
buy
ABB
YY PDF Transformer 2.0
www.ABBYY.comClic
k here
to buy
ABB
YY PDF Transformer 2.0
www.ABBYY.com
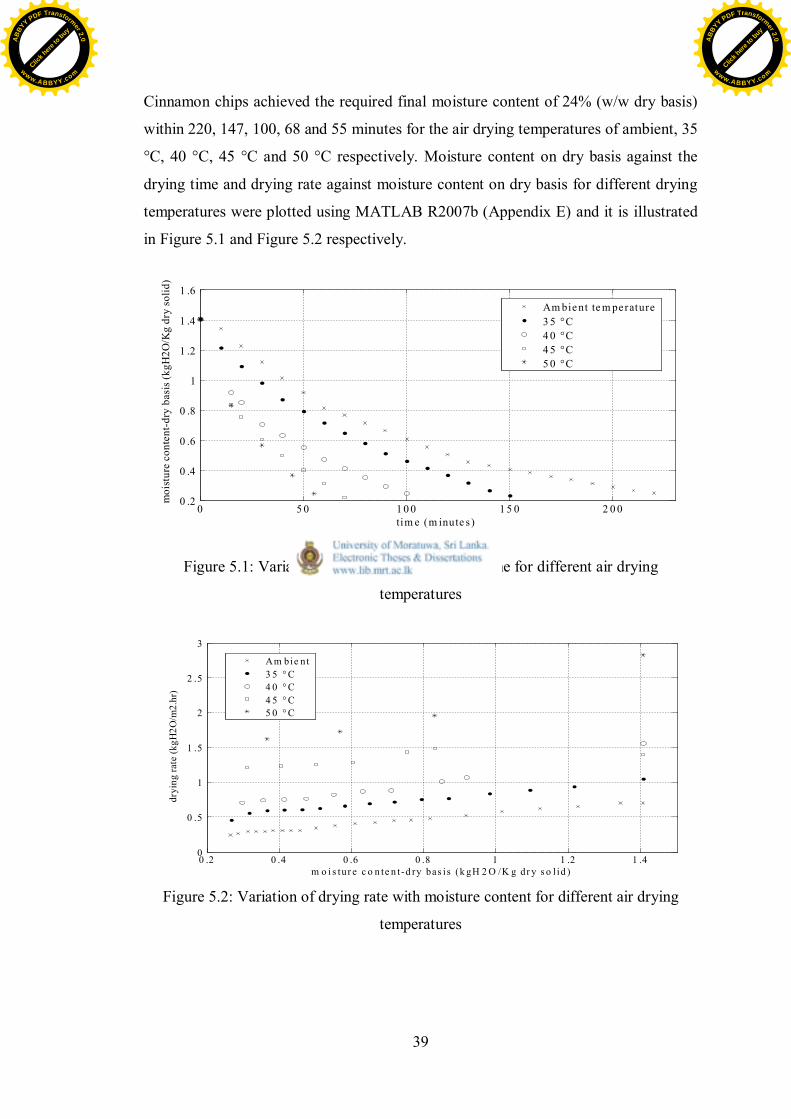
39
Cinnamon chips achieved the required final moisture content of 24% (w/w dry basis)
within 220, 147, 100, 68 and 55 minutes for the air drying temperatures of ambient, 35
°C, 40 °C, 45 °C and 50 °C respectively. Moisture content on dry basis against the
drying time and drying rate against moisture content on dry basis for different drying
temperatures were plotted using MATLAB R2007b (Appendix E) and it is illustrated
in Figure 5.1 and Figure 5.2 respectively.
0 5 0 1 0 0 1 5 0 2 0 00 .2
0 .4
0 .6
0 .8
1
1 .2
1 .4
1 .6
tim e (m inute s)
moi
stur
e co
nten
t-dry
bas
is (k
gH2O
/Kg
dry
solid
)
Am bie nt te m perature3 5 °C4 0 °C4 5 °C5 0 °C
Figure 5.1: Variation of moisture content with time for different air drying
temperatures
0 .2 0 .4 0 .6 0 .8 1 1 .2 1 .40
0 .5
1
1 .5
2
2 .5
3
m o i s tur e c o n te n t -d ry bas is (k gH 2 O /K g dr y s o l id )
dryi
ng ra
te (k
gH2O
/m2.
hr)
Am bie nt3 5 ° C4 0 ° C4 5 ° C5 0 ° C
Figure 5.2: Variation of drying rate with moisture content for different air drying
temperatures
Click h
ere to
buy
ABB
YY PDF Transformer 2.0
www.ABBYY.comClic
k here
to buy
ABB
YY PDF Transformer 2.0
www.ABBYY.com
40
The result, clearly indicates a falling rate drying period, which is corresponded to
internal migration of moisture from inner layers to the surface. The reduction in
drying rate may due to the shrinkage of the cell structure and the reduction in water
concentration of cinnamon chips which result in a lower diffusion coefficient.
5.2 Gas Chromatography Analysis
The results of gas chromatography analysis are given in this section and it describes
how the volatile organic compounds in cinnamon bark oil behaves with respect to five
air drying temperatures (ambient, 35 °C, 40 °C, 45 °C and 50 °C). Relative content %
for 16 identified volatile organic compounds of cinnamon bark oil at different drying
temperatures are summarized in Table 5.2.
Quantitatively, cinnamaldehyde-E was the most abundant aromatic compound in
cinnamon bark oil, followed by cinnamyl acetate, linalool and eugenol in all the
samples. Similar results were obtained by other workers using steam distillation of
cinnamon stem bark of commercial samples (Senanayake, et al., 1978) and hydro
distillation of air dried cinnamon stem bark samples (Paranagama, et al., 2001) in Sri
Lanka.
Click h
ere to
buy
ABB
YY PDF Transformer 2.0
www.ABBYY.comClic
k here
to buy
ABB
YY PDF Transformer 2.0
www.ABBYY.com
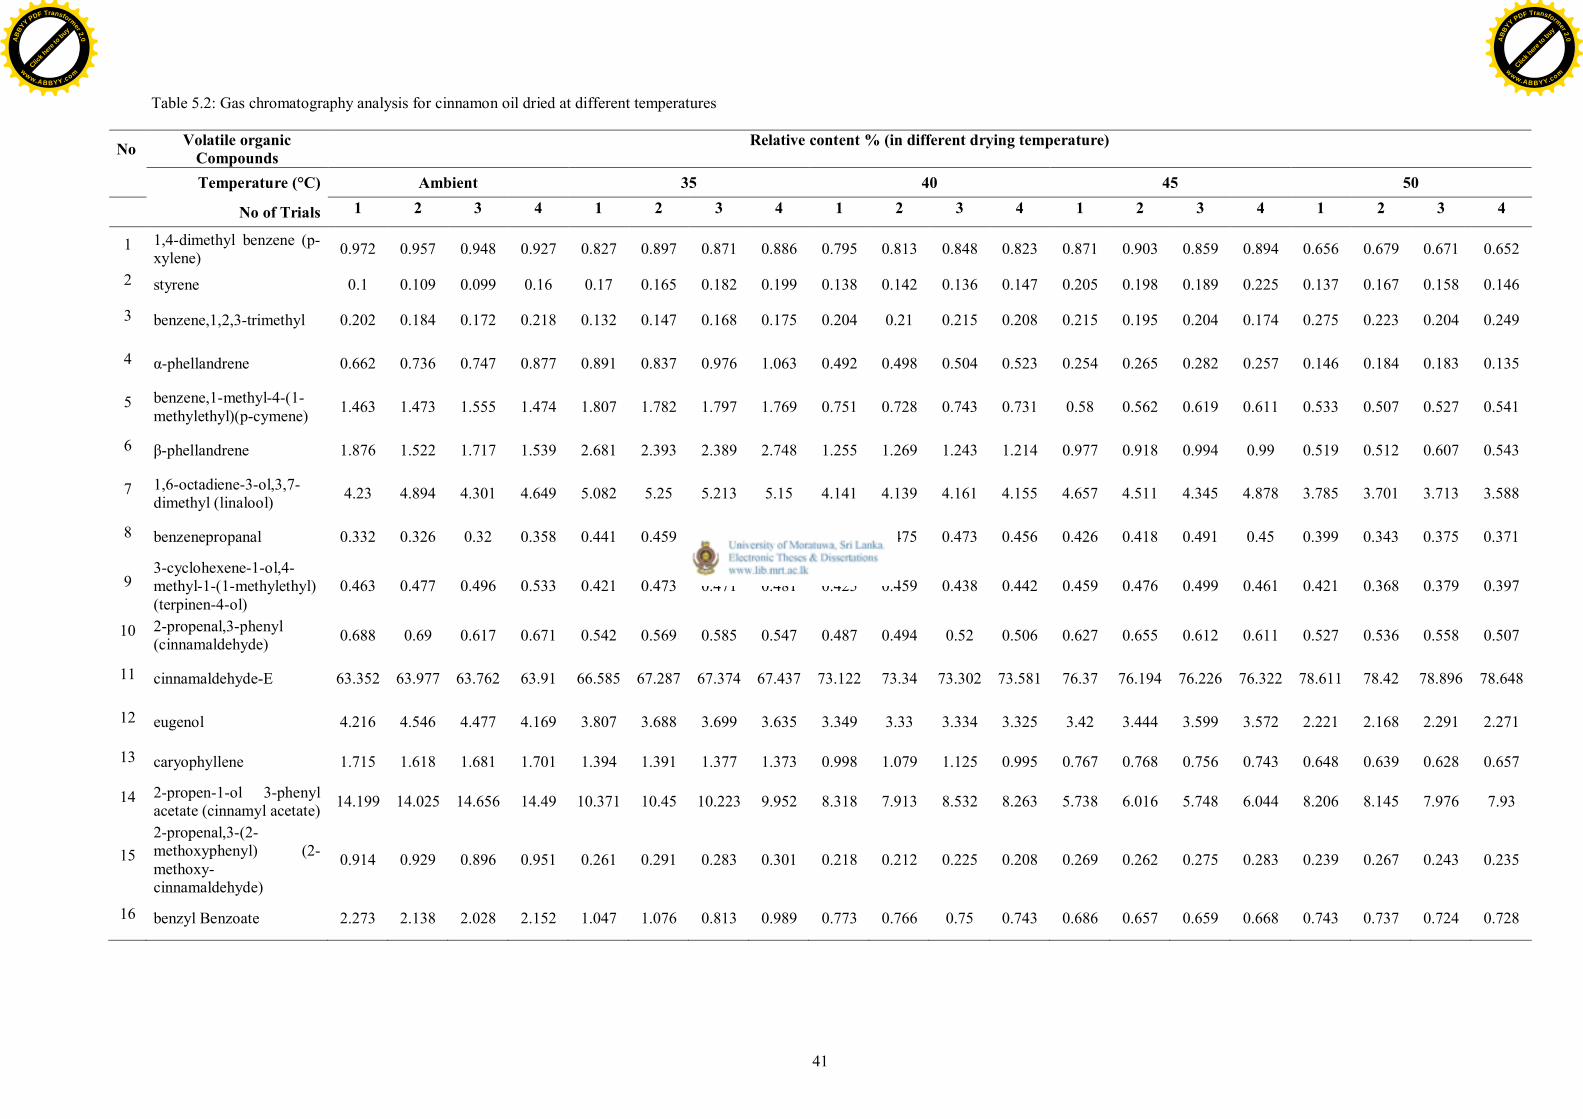
41
Table 5.2: Gas chromatography analysis for cinnamon oil dried at different temperatures
No Volatile organicCompounds
Relative content % (in different drying temperature)
Temperature (°C) Ambient 35 40 45 50
No of Trials 1 2 3 4 1 2 3 4 1 2 3 4 1 2 3 4 1 2 3 4
1 1,4-dimethyl benzene (p-xylene) 0.972 0.957 0.948 0.927 0.827 0.897 0.871 0.886 0.795 0.813 0.848 0.823 0.871 0.903 0.859 0.894 0.656 0.679 0.671 0.652
2 styrene 0.1 0.109 0.099 0.16 0.17 0.165 0.182 0.199 0.138 0.142 0.136 0.147 0.205 0.198 0.189 0.225 0.137 0.167 0.158 0.146
3 benzene,1,2,3-trimethyl 0.202 0.184 0.172 0.218 0.132 0.147 0.168 0.175 0.204 0.21 0.215 0.208 0.215 0.195 0.204 0.174 0.275 0.223 0.204 0.249
4 α-phellandrene 0.662 0.736 0.747 0.877 0.891 0.837 0.976 1.063 0.492 0.498 0.504 0.523 0.254 0.265 0.282 0.257 0.146 0.184 0.183 0.135
5 benzene,1-methyl-4-(1-methylethyl)(p-cymene) 1.463 1.473 1.555 1.474 1.807 1.782 1.797 1.769 0.751 0.728 0.743 0.731 0.58 0.562 0.619 0.611 0.533 0.507 0.527 0.541
6 β-phellandrene 1.876 1.522 1.717 1.539 2.681 2.393 2.389 2.748 1.255 1.269 1.243 1.214 0.977 0.918 0.994 0.99 0.519 0.512 0.607 0.543
7 1,6-octadiene-3-ol,3,7-dimethyl (linalool) 4.23 4.894 4.301 4.649 5.082 5.25 5.213 5.15 4.141 4.139 4.161 4.155 4.657 4.511 4.345 4.878 3.785 3.701 3.713 3.588
8 benzenepropanal 0.332 0.326 0.32 0.358 0.441 0.459 0.482 0.485 0.46 0.475 0.473 0.456 0.426 0.418 0.491 0.45 0.399 0.343 0.375 0.371
93-cyclohexene-1-ol,4-methyl-1-(1-methylethyl)(terpinen-4-ol)
0.463 0.477 0.496 0.533 0.421 0.473 0.471 0.481 0.425 0.459 0.438 0.442 0.459 0.476 0.499 0.461 0.421 0.368 0.379 0.397
10 2-propenal,3-phenyl(cinnamaldehyde) 0.688 0.69 0.617 0.671 0.542 0.569 0.585 0.547 0.487 0.494 0.52 0.506 0.627 0.655 0.612 0.611 0.527 0.536 0.558 0.507
11 cinnamaldehyde-E 63.352 63.977 63.762 63.91 66.585 67.287 67.374 67.437 73.122 73.34 73.302 73.581 76.37 76.194 76.226 76.322 78.611 78.42 78.896 78.648
12 eugenol 4.216 4.546 4.477 4.169 3.807 3.688 3.699 3.635 3.349 3.33 3.334 3.325 3.42 3.444 3.599 3.572 2.221 2.168 2.291 2.271
13 caryophyllene 1.715 1.618 1.681 1.701 1.394 1.391 1.377 1.373 0.998 1.079 1.125 0.995 0.767 0.768 0.756 0.743 0.648 0.639 0.628 0.657
14 2-propen-1-ol 3-phenylacetate (cinnamyl acetate) 14.199 14.025 14.656 14.49 10.371 10.45 10.223 9.952 8.318 7.913 8.532 8.263 5.738 6.016 5.748 6.044 8.206 8.145 7.976 7.93
152-propenal,3-(2-methoxyphenyl) (2-methoxy-cinnamaldehyde)
0.914 0.929 0.896 0.951 0.261 0.291 0.283 0.301 0.218 0.212 0.225 0.208 0.269 0.262 0.275 0.283 0.239 0.267 0.243 0.235
16 benzyl Benzoate 2.273 2.138 2.028 2.152 1.047 1.076 0.813 0.989 0.773 0.766 0.75 0.743 0.686 0.657 0.659 0.668 0.743 0.737 0.724 0.728
Click h
ere to
buy
ABB
YY PDF Transformer 2.0
www.ABBYY.comClic
k here
to buy
ABB
YY PDF Transformer 2.0
www.ABBYY.com
42
5.3 Statistical Analysis
5.3.1 Mean comparison by ANOVA
5.3.1.1 Verification for the validity of assumption
One of the assumptions of the one-way ANOVA is that the variances between the
independent groups are similar (homogeneity of variances). Table 5.3 indicates the
result of Levene's test of homogeneity of variance for cinnamaldehyde-E among
different temperature groups.
Table 5.3: Levene's test of homogeneity of variances for cinnamaldehyde-E
Component Significance
cinnamaldehyde-E 0.251
The significance value, greater than 0.05 means that homogeneity of variances can
be achieved. For cinnamaldehyde-E, Levene's F Statistic has a significance value of
0.251. Therefore, the assumption of homogeneity of variance (similar variance) is
met for cinnamaldehyde-E. By referring Appendix F.1 significance values of other
volatile organic compounds of cinnamon bark oil except β-phellandrene, linalool,
eugenol and caryophyllene are greater than 0.05 and their group variances are equal.
Welch test was performed to examine the statistical significance of these four
components (β-phellandrene, linalool, eugenol and caryophyllene) and the results are
given in Table 5.4. Results indicate that the significance values are less than 0.05 and
hence the group means are statistically significant.
Table 5.4: Welch test of equality of means
Component Significance
β-phellandrene 0.000
linalool 0.000
eugenol 0.000
caryophyllene 0.000
Click h
ere to
buy
ABB
YY PDF Transformer 2.0
www.ABBYY.comClic
k here
to buy
ABB
YY PDF Transformer 2.0
www.ABBYY.com
43
The assumption of normality in one-way ANOVA is used to determine whether a
data set is well-modelled by a normal distribution or not. Table 5.5 represents the
results of Shapiro-Wilk test (verifying the normality) for cinnamaldehyde-E at five
air drying temperatures (ambient, 35 °C, 40 °C, 45 °C and 50 °C). The significance
values for these temperature groups are greater than 0.05 and hence data set of
cinnamaldehyde-E are normally distributed. Test of normality for other 15 volatile
organic compounds of cinnamon bark oil has mentioned in Appendix F.2 and
normality condition was achieved.
Table 5.5: Shapiro-Wilk tests of normality for cinnamaldehyde-E
Temperature (°C) Significance
Ambient 0.318
35 0.056
40 0.827
45 0.594
50 0.828
In Figure 5.3 the normal Q-Q plot of cinnamaldehyde-E at ambient temperature
indicates that the data points are close to the diagonal line. This is a clear evidence
that the data is normally distributed.
Figure 5.3: Normal Q-Q plot of cinnamaldehyde-E at ambient temperature
Click h
ere to
buy
ABB
YY PDF Transformer 2.0
www.ABBYY.comClic
k here
to buy
ABB
YY PDF Transformer 2.0
www.ABBYY.com
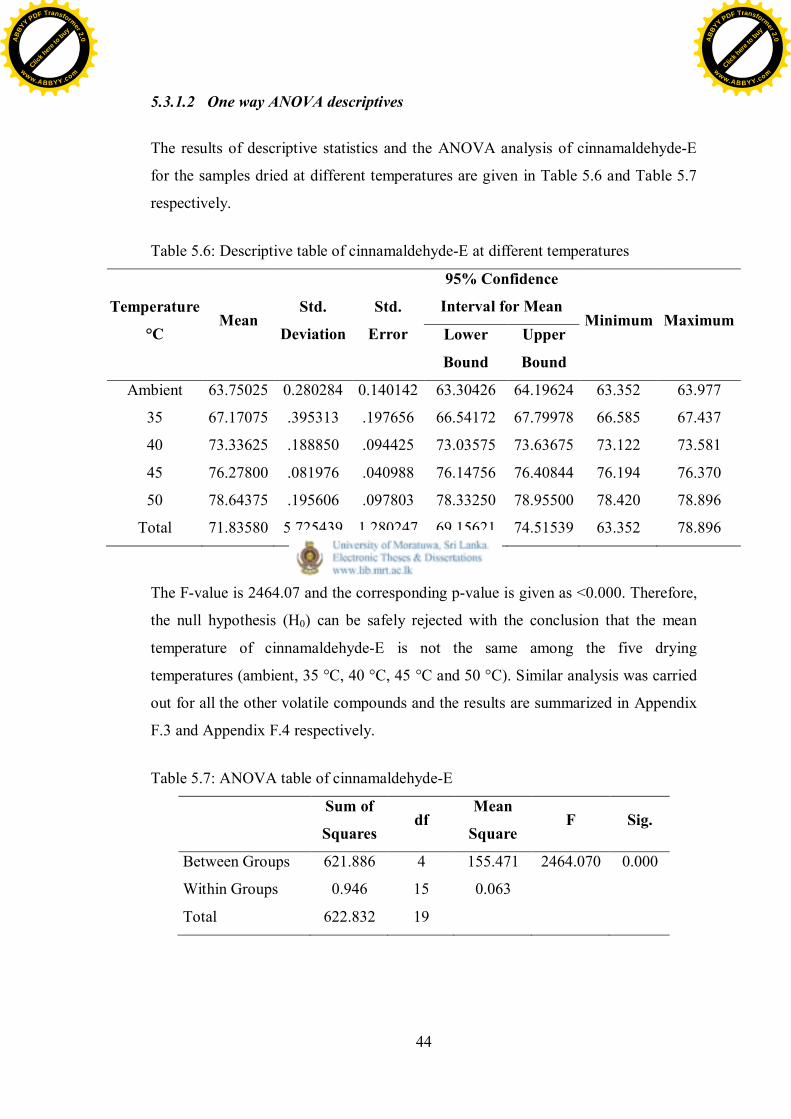
44
5.3.1.2 One way ANOVA descriptives
The results of descriptive statistics and the ANOVA analysis of cinnamaldehyde-E
for the samples dried at different temperatures are given in Table 5.6 and Table 5.7
respectively.
Table 5.6: Descriptive table of cinnamaldehyde-E at different temperatures
Temperature
°CMean
Std.
Deviation
Std.
Error
95% Confidence
Interval for MeanMinimum Maximum
Lower
Bound
Upper
Bound
Ambient 63.75025 0.280284 0.140142 63.30426 64.19624 63.352 63.977
35 67.17075 .395313 .197656 66.54172 67.79978 66.585 67.437
40 73.33625 .188850 .094425 73.03575 73.63675 73.122 73.581
45 76.27800 .081976 .040988 76.14756 76.40844 76.194 76.370
50 78.64375 .195606 .097803 78.33250 78.95500 78.420 78.896
Total 71.83580 5.725439 1.280247 69.15621 74.51539 63.352 78.896
The F-value is 2464.07 and the corresponding p-value is given as <0.000. Therefore,
the null hypothesis (H0) can be safely rejected with the conclusion that the mean
temperature of cinnamaldehyde-E is not the same among the five drying
temperatures (ambient, 35 °C, 40 °C, 45 °C and 50 °C). Similar analysis was carried
out for all the other volatile compounds and the results are summarized in Appendix
F.3 and Appendix F.4 respectively.
Table 5.7: ANOVA table of cinnamaldehyde-E
Sum of
Squaresdf
Mean
SquareF Sig.
Between Groups 621.886 4 155.471 2464.070 0.000
Within Groups 0.946 15 0.063
Total 622.832 19
Click h
ere to
buy
ABB
YY PDF Transformer 2.0
www.ABBYY.comClic
k here
to buy
ABB
YY PDF Transformer 2.0
www.ABBYY.com
45
The results of all the volatile organic compounds of cinnamon bark oil under
investigation clearly indicate that null hypothesis (H0) can be safely rejected.
5.3.1.3 Mean comparison using Student-Newman-Keuls (SNK) test
Table 5.8 is the mean comparison table which contains the results of Student-
Newman-Keuls (SNK) test for cinnamaldehyde-E. This method, gives an idea of
which groups differ from each other.
Table 5.8: Mean comparisons of cinnamaldehyde-E
Temperature NSubset for alpha = 0.05
1 2 3 4 5
Ambient 4 63.75025
35 4 67.17075
40 4 73.33625
45 4 76.27800
50 4 78.64375
Sig. 1.000 1.000 1.000 1.000 1.000
The first column contains the list of temperature groups in order from lowest to
highest mean. The second column of the table identifies the number of replicate
experiments in each and every temperature group. The remaining columns identify
the five homogeneous subsets of temperature groups that are statistically
significantly different from each other. The results of Student-Newman-Keuls (SNK)
test for all the other volatile organic compounds are given in Appendix F.5. The
homogeneous subsets which are formed including more than one temperature groups
indicate that mean of such temperature groups are not differed significantly at the
α=0.05 significance level.
The peak area of volatile organic compounds in gas chromatogram was chosen as the
analytical signal for the relative content, and the identified volatile organic
compounds are given in Table 5.9 with mean and relative standard deviation (RSD)
values based on quadruplicated experiments carried out to find the compositions
Click h
ere to
buy
ABB
YY PDF Transformer 2.0
www.ABBYY.comClic
k here
to buy
ABB
YY PDF Transformer 2.0
www.ABBYY.com
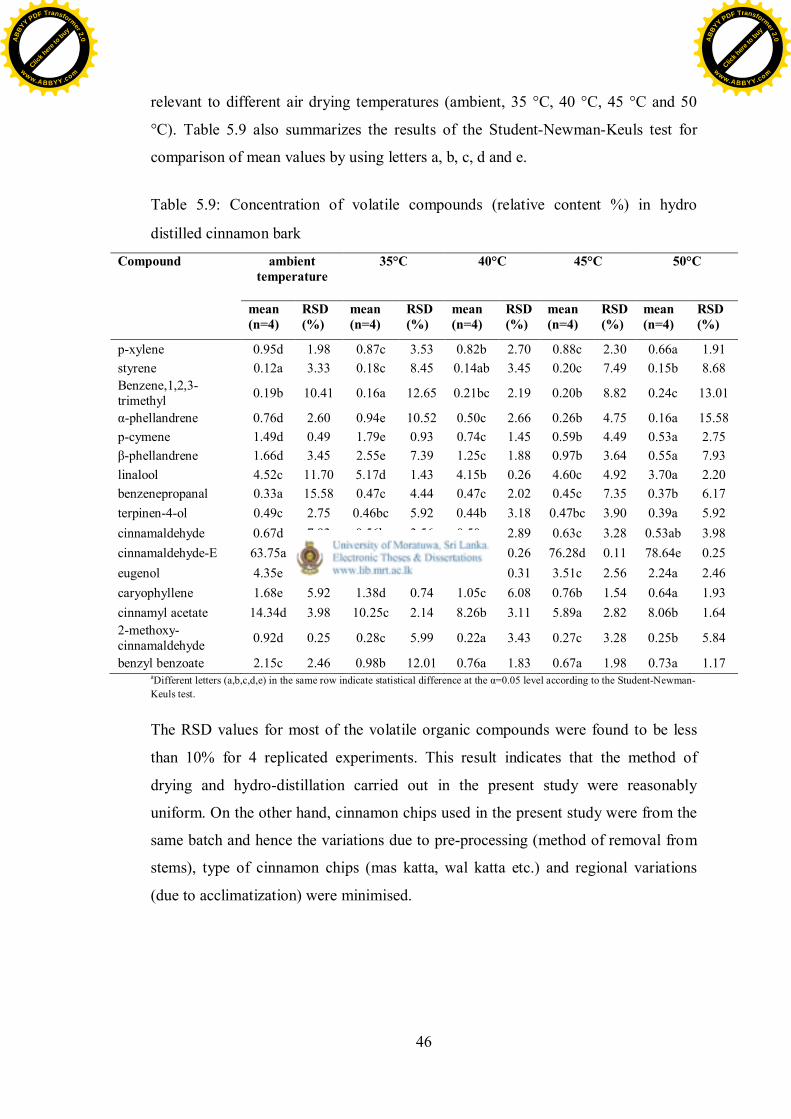
46
relevant to different air drying temperatures (ambient, 35 °C, 40 °C, 45 °C and 50
°C). Table 5.9 also summarizes the results of the Student-Newman-Keuls test for
comparison of mean values by using letters a, b, c, d and e.
Table 5.9: Concentration of volatile compounds (relative content %) in hydro
distilled cinnamon bark
aDifferent letters (a,b,c,d,e) in the same row indicate statistical difference at the α=0.05 level according to the Student-Newman-Keuls test.
The RSD values for most of the volatile organic compounds were found to be less
than 10% for 4 replicated experiments. This result indicates that the method of
drying and hydro-distillation carried out in the present study were reasonably
uniform. On the other hand, cinnamon chips used in the present study were from the
same batch and hence the variations due to pre-processing (method of removal from
stems), type of cinnamon chips (mas katta, wal katta etc.) and regional variations
(due to acclimatization) were minimised.
Compound ambienttemperature
35°C 40°C 45°C 50°C
mean(n=4)
RSD(%)
mean(n=4)
RSD(%)
mean(n=4)
RSD(%)
mean(n=4)
RSD(%)
mean(n=4)
RSD(%)
p-xylene 0.95d 1.98 0.87c 3.53 0.82b 2.70 0.88c 2.30 0.66a 1.91styrene 0.12a 3.33 0.18c 8.45 0.14ab 3.45 0.20c 7.49 0.15b 8.68Benzene,1,2,3-trimethyl 0.19b 10.41 0.16a 12.65 0.21bc 2.19 0.20b 8.82 0.24c 13.01
α-phellandrene 0.76d 2.60 0.94e 10.52 0.50c 2.66 0.26b 4.75 0.16a 15.58p-cymene 1.49d 0.49 1.79e 0.93 0.74c 1.45 0.59b 4.49 0.53a 2.75β-phellandrene 1.66d 3.45 2.55e 7.39 1.25c 1.88 0.97b 3.64 0.55a 7.93linalool 4.52c 11.70 5.17d 1.43 4.15b 0.26 4.60c 4.92 3.70a 2.20benzenepropanal 0.33a 15.58 0.47c 4.44 0.47c 2.02 0.45c 7.35 0.37b 6.17terpinen-4-ol 0.49c 2.75 0.46bc 5.92 0.44b 3.18 0.47bc 3.90 0.39a 5.92cinnamaldehyde 0.67d 7.93 0.56b 3.56 0.50a 2.89 0.63c 3.28 0.53ab 3.98cinnamaldehyde-E 63.75a 2.20 67.17b 0.59 73.34c 0.26 76.28d 0.11 78.64e 0.25eugenol 4.35e 6.17 3.71d 1.95 3.33b 0.31 3.51c 2.56 2.24a 2.46caryophyllene 1.68e 5.92 1.38d 0.74 1.05c 6.08 0.76b 1.54 0.64a 1.93cinnamyl acetate 14.34d 3.98 10.25c 2.14 8.26b 3.11 5.89a 2.82 8.06b 1.642-methoxy-cinnamaldehyde 0.92d 0.25 0.28c 5.99 0.22a 3.43 0.27c 3.28 0.25b 5.84
benzyl benzoate 2.15c 2.46 0.98b 12.01 0.76a 1.83 0.67a 1.98 0.73a 1.17
Click h
ere to
buy
ABB
YY PDF Transformer 2.0
www.ABBYY.comClic
k here
to buy
ABB
YY PDF Transformer 2.0
www.ABBYY.com
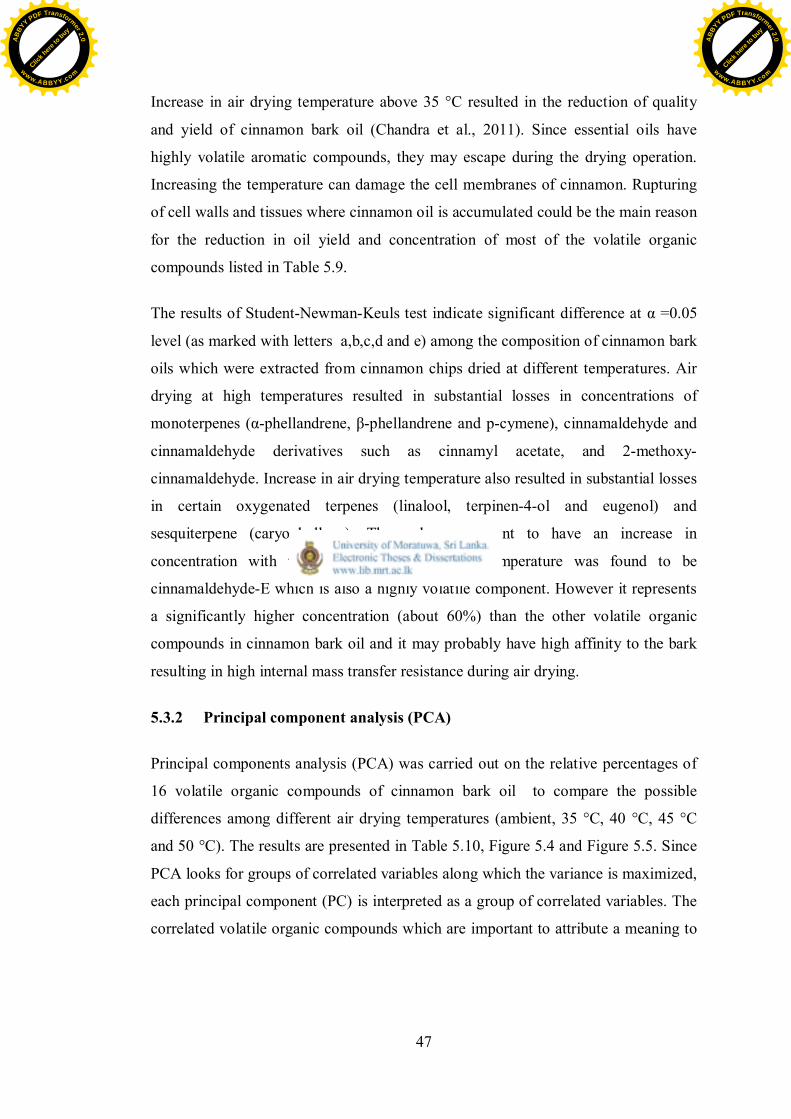
47
Increase in air drying temperature above 35 °C resulted in the reduction of quality
and yield of cinnamon bark oil (Chandra et al., 2011). Since essential oils have
highly volatile aromatic compounds, they may escape during the drying operation.
Increasing the temperature can damage the cell membranes of cinnamon. Rupturing
of cell walls and tissues where cinnamon oil is accumulated could be the main reason
for the reduction in oil yield and concentration of most of the volatile organic
compounds listed in Table 5.9.
The results of Student-Newman-Keuls test indicate significant difference at α =0.05
level (as marked with letters a,b,c,d and e) among the composition of cinnamon bark
oils which were extracted from cinnamon chips dried at different temperatures. Air
drying at high temperatures resulted in substantial losses in concentrations of
monoterpenes (α-phellandrene, β-phellandrene and p-cymene), cinnamaldehyde and
cinnamaldehyde derivatives such as cinnamyl acetate, and 2-methoxy-
cinnamaldehyde. Increase in air drying temperature also resulted in substantial losses
in certain oxygenated terpenes (linalool, terpinen-4-ol and eugenol) and
sesquiterpene (caryophyllene). The only component to have an increase in
concentration with the increase in air drying temperature was found to be
cinnamaldehyde-E which is also a highly volatile component. However it represents
a significantly higher concentration (about 60%) than the other volatile organic
compounds in cinnamon bark oil and it may probably have high affinity to the bark
resulting in high internal mass transfer resistance during air drying.
5.3.2 Principal component analysis (PCA)
Principal components analysis (PCA) was carried out on the relative percentages of
16 volatile organic compounds of cinnamon bark oil to compare the possible
differences among different air drying temperatures (ambient, 35 °C, 40 °C, 45 °C
and 50 °C). The results are presented in Table 5.10, Figure 5.4 and Figure 5.5. Since
PCA looks for groups of correlated variables along which the variance is maximized,
each principal component (PC) is interpreted as a group of correlated variables. The
correlated volatile organic compounds which are important to attribute a meaning to
Click h
ere to
buy
ABB
YY PDF Transformer 2.0
www.ABBYY.comClic
k here
to buy
ABB
YY PDF Transformer 2.0
www.ABBYY.com
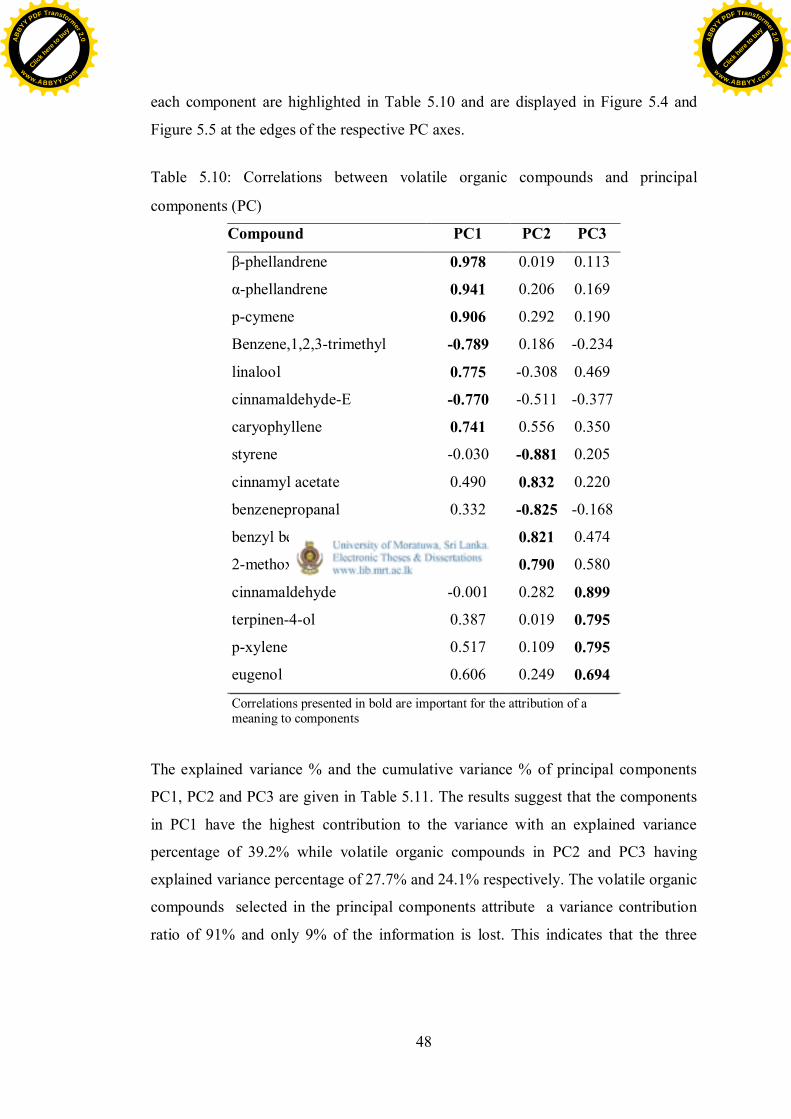
48
each component are highlighted in Table 5.10 and are displayed in Figure 5.4 and
Figure 5.5 at the edges of the respective PC axes.
Table 5.10: Correlations between volatile organic compounds and principal
components (PC)
Compound PC1 PC2 PC3
β-phellandrene 0.978 0.019 0.113
α-phellandrene 0.941 0.206 0.169
p-cymene 0.906 0.292 0.190
Benzene,1,2,3-trimethyl -0.789 0.186 -0.234
linalool 0.775 -0.308 0.469
cinnamaldehyde-E -0.770 -0.511 -0.377
caryophyllene 0.741 0.556 0.350
styrene -0.030 -0.881 0.205
cinnamyl acetate 0.490 0.832 0.220
benzenepropanal 0.332 -0.825 -0.168
benzyl benzoate 0.296 0.821 0.474
2-methoxy- cinnamaldehyde 0.159 0.790 0.580
cinnamaldehyde -0.001 0.282 0.899
terpinen-4-ol 0.387 0.019 0.795
p-xylene 0.517 0.109 0.795
eugenol 0.606 0.249 0.694
Correlations presented in bold are important for the attribution of ameaning to components
The explained variance % and the cumulative variance % of principal components
PC1, PC2 and PC3 are given in Table 5.11. The results suggest that the components
in PC1 have the highest contribution to the variance with an explained variance
percentage of 39.2% while volatile organic compounds in PC2 and PC3 having
explained variance percentage of 27.7% and 24.1% respectively. The volatile organic
compounds selected in the principal components attribute a variance contribution
ratio of 91% and only 9% of the information is lost. This indicates that the three
Click h
ere to
buy
ABB
YY PDF Transformer 2.0
www.ABBYY.comClic
k here
to buy
ABB
YY PDF Transformer 2.0
www.ABBYY.com
49
principal components express 91% of the all information. Hence, the three principal
components can reflect the vast majority of cinnamon oil composition. All of the
samples in the space of the principal components had relatively independent
positions and were effectively distinguished.
Table 5.11: Correlation coefficient values for the volatile organic compounds against
principal component 1 ,2 and 3
PC volatile compound loading%
explainedvariance
%cumulative
variance1 β-phellandrene 0.978 39.227 39.227α-phellandrene 0.941p-cymene 0.906benzene,1,2,3-trimethyl -0.789linalool 0.775cinnamaldehyde-E -0.770caryophyllene 0.741
2 styrene -0.881 27.691 66.918cinnamyl acetate 0.832benzenepropanal -0.825benzyl benzoate 0.8212-methoxycinnamaldehyde 0.790
3 cinnamaldehyde 0.899 24.070 90.988terpinen-4-ol 0.795p-xylene 0.795eugenol 0.694
Figure 5.4 and Figure 5.5 depict the planes of principal components 1 vs 2 and 1 vs 3
respectively. PC1 is mainly separating the samples of cinnamon chips which were
dried using hot air at 35 °C (loaded on the positive, right side of PC1) and 50 °C
(loaded on the negative, left side of PC1). Hot air at 35 °C is characterized by high
amounts of monoterpenes (α-phellandrene, β-phellandrene and p-cymene),
oxygenated terpene (linalool) and sesquirtepene (caryophyllene) and 50 °C is
characterized by high amounts of benzene,1,2,3-trimethyl and cinnamaldehyde-E .
PC2 is mainly separating the ambient air temperature (displaced towards the positive,
upper side of PC2), and hot air at 45 °C (displaced towards the negative, lower side
Click h
ere to
buy
ABB
YY PDF Transformer 2.0
www.ABBYY.comClic
k here
to buy
ABB
YY PDF Transformer 2.0
www.ABBYY.com
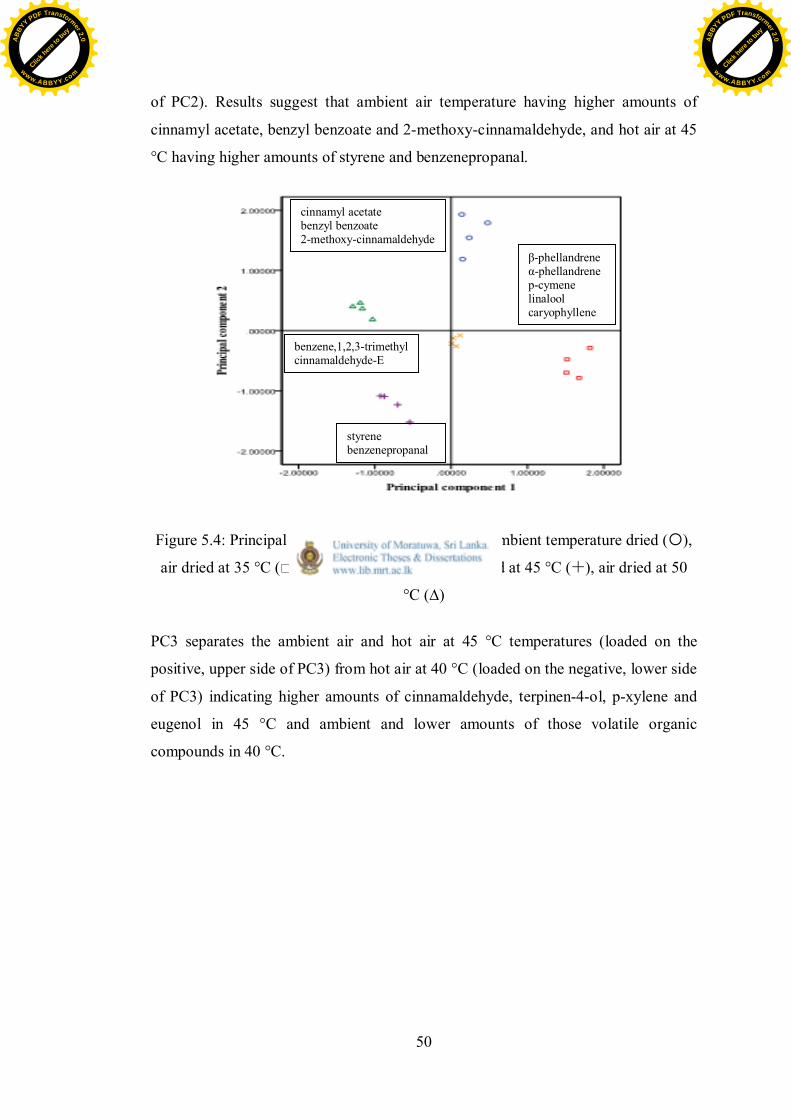
50
of PC2). Results suggest that ambient air temperature having higher amounts of
cinnamyl acetate, benzyl benzoate and 2-methoxy-cinnamaldehyde, and hot air at 45
°C having higher amounts of styrene and benzenepropanal.
Figure 5.4: Principal component plot (PC2 vs PC1). ambient temperature dried (�),
air dried at 35 °C (*), air dried at 40 °C (Í), air dried at 45 °C (Æ), air dried at 50
°C (∆)
PC3 separates the ambient air and hot air at 45 °C temperatures (loaded on the
positive, upper side of PC3) from hot air at 40 °C (loaded on the negative, lower side
of PC3) indicating higher amounts of cinnamaldehyde, terpinen-4-ol, p-xylene and
eugenol in 45 °C and ambient and lower amounts of those volatile organic
compounds in 40 °C.
β-phellandreneα-phellandrenep-cymenelinaloolcaryophyllene
benzene,1,2,3-trimethylcinnamaldehyde-E
cinnamyl acetatebenzyl benzoate2-methoxy-cinnamaldehyde
styrenebenzenepropanal
Click h
ere to
buy
ABB
YY PDF Transformer 2.0
www.ABBYY.comClic
k here
to buy
ABB
YY PDF Transformer 2.0
www.ABBYY.com

51
Figure 5.5: Principal component plot (PC1 vs PC3). ambient temperature dried (�),
air dried at 35 °C (*), air dried at 40 °C (Í), air dried at 45 °C (Æ), air dried at 50
°C (∆)
cinnamaldehydeterpinen-4-olp-xylene eugenol
β-phellandreneα-phellandrenep-cymenelinaloolcaryophyllene
benzene,1,2,3-trimethylcinnamaldehyde-E
Click h
ere to
buy
ABB
YY PDF Transformer 2.0
www.ABBYY.comClic
k here
to buy
ABB
YY PDF Transformer 2.0
www.ABBYY.com
52
6 6 CONCLUSIONS AND RECOMMENDATIONS
The use of GC-MS to analyze the volatile oil compounds of cinnamon chips can
effectively identify the 16 volatile organic compounds. Quantitatively,
cinnamaldehyde-E was the most abundant aromatic compound in cinnamon bark oil
extracted from chips, followed by cinnamyl acetate, linalool and eugenol in all the
samples. Statistical analysis using Student-Newman-Keuls (SNK) test and principal
component analysis (PCA) reveals the effect of air drying temperatures for varying
the chemical composition of cinnamon bark.
Effect of drying cinnamon chips at high temperatures on the composition of
cinnamon bark oil was found to be significant (at a=0.05). Substantial reduction in
concentrations of monoterpenes, oxygenated terpenes and sesquiterpenes was
observed with the increase in air drying temperature. However the concentration of
cinnamaldehyde-E has increased significantly from 63.75% for drying at ambient
tempearture to 78.64% for drying at 50 °C.
The results obtained in the study of principal component analysis can provide a
comprehensive evaluation of the air drying temperature on cinnamon quality. The
highest amounts of monoterpenes, oxygenated terpenes, sesquirtepene and
cinnamaldehyde and its derivatives were observed in the composition of bark oil
extracted from cinnamon chips which was died using ambient air. Because drying at
ambient temperature takes longer and the drying conditions are difficult to control,
air drying at 35 °C would seem to be more advisable, in that this drying treatment is
fast, simple, and easy to control.
In a previous study, the oil yield was found to be significantly reduced due to hot air
drying, specifically above 35 °C (Chandra et al., 2011). Therefore even if high
percentage of cinnamaldehyde-E is preferred in cinnamon bark oil, increase of
drying temperature may not be the best option due to reduction in oil yield. Results
of statistical analysis confirmed the selection of 35 °C as the maximum hot air
temperature for drying cinnamon chips without affecting the quality of bark oil.
Click h
ere to
buy
ABB
YY PDF Transformer 2.0
www.ABBYY.comClic
k here
to buy
ABB
YY PDF Transformer 2.0
www.ABBYY.com
53
GC-MS and statistical analysis can be used to carry out the studies of determining
the quality of cinnamon bark oil & cinnamon leaf oil according to the maturity level
of cinnamon tree, variations of type of katta, and climate & region variations of
cinnamon cultivating.
Click h
ere to
buy
ABB
YY PDF Transformer 2.0
www.ABBYY.comClic
k here
to buy
ABB
YY PDF Transformer 2.0
www.ABBYY.com
54
REFERENCE LIST
J. E. Angmor, D. M. Dicks, W. C. Evans, and D. K. Sandra, " Studies onCinnamomum zeylanicum Part 1 The essential oil components of C. ZeylanicumNees grown in Ghana," Planta Medica, vol. 21, pp. 416–420, 1972.
A. W. Archer, "Determination of cinnamaldehyde, coumarin and cinnamyl alcohol incinnamon and cassia by high-performance liquid chromatography," Journal ofChromatography, vol. 441, pp. 272-216, 1988.
O. T. Asekun, D. S. Grierson, and A. J. Afolayan, "Characterization of essential oilsfrom helichrysum odoratissium using different drying methods," J. Applied. Sci, vol.7, pp. 1005-1008, 2007.
A. O. T. Ashafa and D. S. a. A. Grierson, A. J., "Effects of drying methods on thechemical composition of essential oil from felicia muricata leaves," Asian Journal ofPlant Sciences, vol. 7(6), pp. 603-606, 2008.
C. J. Bailey and C. Day, "Traditional plant medicines as treatments for diabetes,"Diabetes Care, vol. 12, pp. 553-564, 1989.
O. Baritaux, H. Richard, J. Touche, and M. Derbesy, "Effects of drying and storageof herbs and spices on the essential oil. Part I. Basil. Ocimum basilicum L," FlaVourFragrance J., vol. 7, pp. 267-271, 1992.
J. P. Bartley and A. L. Jacobs, "Effects of drying on flavour compounds inAustralian-grown ginger (Zingiber officinale)," J. Sci. Food Agric. , vol. 80, pp. 209-215, 2000.
T. Bernard, F. Perineau, M. Delmas, and A. Gaset, "Extraction of essential oils byrefining of plant materials. II. Processing of products in the dry state: Illicium verumHooker (fruit) and Cinnamomum zeylanicum (bark)," Flavour and FragranceJournal vol. 4, pp. 85–90, 1989.
D. B. Brooker, F. W. Bakker-Arkema, and C. W. Hall, "Drying and storage of grainsand oil seeds.," Van Nostrand Reinhold, p. 206, 1992.
J. B. Cai, P. Lin, X. L. Zhu, and Q. D. Su, "Comparative analysis of clary sage (S.sclarea L.) oil volatiles by GC–FTIR and GC–MS," Food Chemistry, vol. 99, pp.401–407, 2006.
Click h
ere to
buy
ABB
YY PDF Transformer 2.0
www.ABBYY.comClic
k here
to buy
ABB
YY PDF Transformer 2.0
www.ABBYY.com

55
J. C. Chalchat and I. Valade, "Chemical composition of leaf oils of Cinnamomumfrom Madagascar: C. zeylanicum Blume, C. camphora L., C. fragrans Baillon and C.angustifolium," Journal of Essential Oil Research, vol. 12, pp. 537–540, 2000.
K. A. Chandra, A. D. U. S. Amarasinghe and S. Walpolage, ”Performance analysisof a dryer design for drying cinnamon chips” Annual Transactions of IESL, vol. 1,part B, pp.123-129, 2011.
R. W. Day and Q. G. P. Quinn, "Comparisons of treatments after an analysis ofvariance in ecology," Ecological Monographs, vol. 59, pp. 433–463, 1989.
M. C. Diaz-Maroto, M. S. Perez-Coello, and M. D. Cabezudo, "Effect of dryingmethod on the volatiles in Bay Leaf (Laurus nobilis L.)," J. Agric. Food Chem, vol.50, pp. 4520-4, 2002a.
M. C. Diaz-Maroto, M. S. P. Perez -Coello, M. A. G. L. Vinas, and M. D. Cabezudo,"Influence of drying on the flavor quality of spearmint (Mentha Spicata L.)," J.Agric. Food Chem, vol. 51, pp. 1265-1269, 2002b.
M. C. Diaz-Maroto, M. S. Perez -Coello, and M. D. Cabezudo, "Effect of differentdrying methods on the volatile components of parsley (Petroselinum Crispum L.),"Eur. Food Res. Technol, vol. 215, pp. 227-230, 2002c.
Y. Ding, E. Q. Wu, C. Liang, J. B. Chen, M. N. Tran, C. H. Hong, Y. Jang, K. L.Park, K. H. Bae, Y. H. Kim, and J. S. Kang, "Discrimination of cinnamon bark andcinnamon twig samples sourced from various countries using HPLC-basedfingerprint analysis," Food Chemistry, vol. 127, pp. 755–760, 2011.
S.A. Gaur and S.S. Gaur, "Statistical Methods for Practice and Research, A guide todata analysis using SPSS," 2009.
S. L. Geng, Z. X. Cui, X. C. Huang, Y. F. Chen, D. Xu, and P. Xiong, "Variations inessential oil yield and composition during Cinnamomum cassia bark growth,"Industrial Crops and Products, vol. 33, pp. 248–252, 2011.
M. E. Guynot, A. J. Ramos, L. Setó, P. Purroy, V. Sanchis, and S. Marin,"Antifungal activity of volatile compounds generated by essential oils against fungicommonly causing deterioration of bakery products," Journal of AppliedMicrobiology, vol. 94, pp. 893–899, 2003.
A. A. Hosseini, S. Padhye, W. Huisman, A. v. Boxtel, and J. Müller, "Effect ofdrying on the color of tarragon (Artemisia Dracunculus L.) leaves," Food andBioprocess Techonology, vol. 4(7), pp. 1281-1287, 2011.
Click h
ere to
buy
ABB
YY PDF Transformer 2.0
www.ABBYY.comClic
k here
to buy
ABB
YY PDF Transformer 2.0
www.ABBYY.com
56
D. C. Howell, "Statistical Methods for Psychology," vol. Chapter 12; Multiplecomparisons among treatment means, 2013.
http://www.lookchem.com, Visited, 15th January 2013
R. Huopalahti, R. Kesa lahti, and R. Linko, "Effect of hot air and freeze-drying on
the volatile compounds of dill (Anethum graVeolens L.) herb," J. Agric. Sci. Finland
vol. 57, pp. 133-138, 1985.
G. K. Jayaprakasha, L. Jaganmohan Rao, and K. K. Sakariah, "Chemicalcomposition of volatile oil from Cinnamomum verum buds," Zeitschrift fürNaturforschung C, vol. 57, pp. 990-993, 2002.
I. Jerkovic, J. Mastelic, and M. Milos, "The impact of both the season of collectionand drying on the volatile constituents of Origanum Vulgare L. ssp. hirtum grownwild in Croatia," Int. J. Food Sci. Technol. , vol. 36, pp. 649-654, 2001.
L. Jirovetz, G. Buchbauer, M. B. Ngassoum, and R. Eberhardt, "Analysis and qualitycontrol of the essential oil of the leaves of Cinnamomum zeylanicum fromCameroon," Ernahrung, vol. 22(10), pp. 443–445, 1998.
L. Jirovetz, G. Buchbauer, J. Ruzika, M. P. Shafi, and M. K. Rosamma, "Analysis ofCinnamomum zeylanicum Blume leaf oil from South India," Journal of Essential OilResearch, vol. 13, pp. 442-443, 2001.
I. T. Jolliffe, "Principal Component Analysis," New York: Springer, 2002.
D. Kalemba and A. Kunicka, "Antibacterial and antifungal properties of essentialoils," Current Medicinal Chemistry, vol. 10, pp. 813-829, 2003.
P. N. Kaul, A. K. Bhattacharjee, and B. R. R. Rao, "Seasonal variation in thecomposition of the essential oil of cinnamon (Cinnamomum zeylanicum Blume)leaves," Indian Perfumer, vol. 40(2), pp. 36–38, 1996.
P. N. Kaul, Bhattacharjee, A.K. and Rao, B.R.R. (1998) . ,, "Chemical compositionof the essential oils of cinnamon (Cinnamomum zeylanicum Blume) leaves affectedby leaf spot disease," Indian Perfumer, vol. 42(1), pp. 33–35, 1998.
P. N. Kaul, A. K. Bhattacharya, B. R. R. Rao, K. V. Syamasundar, and S. Ramesh, "Volatile constituents of essential oils isolated from different parts of cinnamon(Cinnamomum zeylanicum Blume)," Journal ofScience of Food and Agriculture, vol.83(1), pp. 53–55, 2003.
S. Khangholi and A. Rezaeinodehi, "Effect of drying temperature on essential oilcontent and composition of sweet wormwood (Artemisia Annua) growing wild inIran," Pak. J. Biol. Sci, vol. 11, pp. 934-937, 2008.
Click h
ere to
buy
ABB
YY PDF Transformer 2.0
www.ABBYY.comClic
k here
to buy
ABB
YY PDF Transformer 2.0
www.ABBYY.com
57
A. J. Klockars and G. Sax, "Multiple comparisons," Thousand Oaks, CA: SagePublications. Quantitative Applications in the Social Sciences series #61, 1986.
M. Koketsu, S. L. Gonclaves, R. L. Godoi, D. Lopez, and N. Morsbach, "The barkand leaf essential oils of cinnamon (Cinnamomum verum Presl.) grown atParana,Brazil," Ciência Tecnologia Alimentos, vol. 17(3), pp. 281–285, 1997.
J. Kopka, "Gas chromatography–mass spectrometry," Biotechnology in Agricultureand Forestry, vol. 57, pp. 3–20, 2006.
B. Krishnamoorthy, A. Gopalam, and J. Abraham, "Quality parameters of cinnamon(Cinnamomum verum) in relation to flush colour," Indian Cocoa Arecanut andSpices Journal XII, vol. 2, p. 38, 1988.
B. Krishnamoorthy, J. Rema, T. J. Zachariah, A. Jose, and A. Gopalam, "Navasreeand Nithyasreee –two high yielding and high quality cinnamon (Cinnamomum verum– Bercht & Presl.)," Journal of Spices and Aromatic Crops, vol. 5(1), pp. 28–33,1996.
Y. Q. Li, D. X. De-xin Kong, and H. Wu, "Analysis and evaluation of essential oilcomponents of cinnamon barks using GC–MS and FTIR spectroscopy," IndustrialCrops and Products, vol. 41, pp. 269-278, 2013.
J. Liu, X. Chen, W. Yang, W. Liu, and T. Jiang, "Study on establishment of RP-HPLC and GC–MS ingerprints for wild germplasm resource of Ophiopogonjaponicas in Sichuan and hierarchical clustering analysis," Journal of ChineseMedical Materials, vol. 35, pp. 2726-2730, 2010.
D. K. Maheshwari, R. C. Dubey, and Saravanamurthu R., " Industrial exploitation ofmicroorganisms" p. 412, 2010.
G. R. Mallavarapu, R. S., R. S. Chandrasekhara, B. R. R. Rao, P. N. Kaul, and A. K.Bhattacharya, "Investigation of the essential oil of cinnamon leaf grown at Bangaloreand Hyderabad," Flavour and Fragrance Journal vol. 10, pp. 239-242, 1995.
B. Mang, M. Wolters, B. Schmitt, K. Kelb, R. Lichtinghagen, D. O. Stichtenoth, andA. Hahn, "Effects of a cinnamon extract on plasma glucose, hba1c, and serum lipidsin diabetes mellitus type 2," European Journal of Clinical Investigation, vol. 36, pp.340–344., 2006.
D. D. Medici, S. Pieretti, G. Salvatore, M. Nicoletti, and P. Rasoanaivo, "Chemicalanalysis of essential oils of Malagasy medicinal plants by gas chromatography andNMR spectroscopy," Flavour and Fragrance Journal, vol. 7, pp. 275-281, 1992.
Click h
ere to
buy
ABB
YY PDF Transformer 2.0
www.ABBYY.comClic
k here
to buy
ABB
YY PDF Transformer 2.0
www.ABBYY.com
58
D. G. Mercer, "A comparison of the kinetics of mango drying in open-air, solar, andforced air dyers," Department of Food Science, University of Guelph, Guelph,Ontario, N1G 2W1Canada, 2012.
J. Muller and A. Heindl, "Drying of Medicinal plants, Medicinal and AromaticPlants," University of Hohenheim, Institute of Agricultural Engineering, Germany,pp. 237-252, 2006.
L. Nykanen and I. Nykanen, "The effect of drying on the composition of the essentialoil of some Labiatae herbs cultivated in Finland," In Flavour Science andTechnology; Martens, M., Dalen, G. A., Russwurm, H., Eds.; John Wiley: New York,pp. 83-88, 1987.
R. Omidbaigi, F. Sedkon, and F. Kazemi, "Inuence of drying methods on theessential oil content and composition of roman chamomile," Flavour and FragranceJournal, vol. 19, pp. 196-198, 2004.
S. Oztekin, Bascetincelik, A., & Soysal, Y. (1999). . , 16 (1-4), . "Crop DryingProgramme in Turkey," Renewable Energy, vol. 16, pp. 789-794, 1999.
K. Paakkonen, T. Malmsten, and L. Hyvonen, "Effects of drying methods, packagingand storage temperature and time on the quality of dill (Anethum graVeolens)," J.Food Sci., vol. 54, pp. 1485-1495, 1989.
P.A. Paranagama, “Analysis of Sri Lanka Essential Oils by Gas Chromatography andMass spectroscopy,” M.Phil. Thesis, Kelaniya University, Sri Lanka, 1991
P. A. Paranagama, S. Wimalasena, G.S. Jayatilake, A.L. Jayawardena, U.M.Senanayake and A.M. Mubarak, "A comparison of essential oil constituents of bark,leaf, root and fruit of cinnamon (Cinnamomum Zeylanicumblum) grown in SriLanka," J.Natn. Sci. Foundation Sri Lanka, Kelaniya University, Sri Lanka, vol29(3&4), pp. 147-153, 2001.
V. A. Parthasarathy, C. Bhageerathy, and Z. T.John, "Cinnamon and Cassia,Chemistry of Spices," Indian Institute of Spices Research Calicut, Kerala, India, pp.124-145, 2008.
S. P. Prematilake, S. Kathirgamathaiyah, and D. N. Samaraweera, "The effect offillings on the quality of cinnamon (Gnnamomum verum) quills," Research Station,Dept of Export Agriculture, Matale,Dept of Export Agriculture, Peradeniya,Cinnamon Research Station, Matara, 1997.
B. Qin, M. Nagasaki, M. Ren, G. Bajotto, Y. Oshida, and Y. Sato, "Cinnamon extract(traditional herb) potentiates in vivo insulin-regulated glucose utilization viaenhancing insulin signaling in rats," Diabetes Research and Clinical Practice, vol.62, pp. 139-148, 2003.
Click h
ere to
buy
ABB
YY PDF Transformer 2.0
www.ABBYY.comClic
k here
to buy
ABB
YY PDF Transformer 2.0
www.ABBYY.com
59
B. Raghavan, K. O. Abraham, L. Jaganmohan Rao, and M. L. Shankaranarayana,"Effect of drying on flavour quality of Indian spearmint (Mentha Spicata L.)," J.Spices Aromatic Crops, vol. 3, pp. 142-151, 1994b.
B. Raghavan, K. O. Abraham, M. L. Shankaranarayana, and W. D. Koller, "Studieson flavor changes during drying of dill (Anethum sowa Roxb.) leaves," J. Food Qual., vol. 17, pp. 457-466, 1994a.
V. K. Raina, S. K. Srivastava, K. K. Aggarwal, S. Ramesh, and S. Kumar, "Essentialoil composition of Cinnamomum zeylanicum Blume leaves from Little Andaman,India," Flavour and Fragrance Journal, vol. 16(5), pp. 374–376, 2001.
B. R. R. Rao, D. K. Rajput, P. N. Kaul, A. K. Bhattacharya, and A. A. Naqvi, "Effectof short and long-termstorage on essential oil content and composition of cinnamon(Cinnamomum verum Bercht & Presl) leaves," Journal of Spices and AromaticCrops, vol. 15(1), pp. 19–24, 2006.
Y. R. Rao, S. C. Paul, and P. K. Dutta, "Major constituents of essential oils ofCinnamum zeylanicum," Indian Perfumer, vol. 32, pp. 86–89, 1988.
P. N. Ravindran, K. Nirmal Babu, and M. Shylaia, " Cinnamon and Cassia (TheGenus Cinnamomum)," CRC Press, Boca Raton, USA, pp. 1–379, 2004.
E. Reverchon, "Supercritical fluid extraction and fractionation of essential oils andrelated products," J. Supercrit. Fluids, vol. 10, pp. 1-37, 1997.
M. S. F. Ross, "Analysis of cinnamon oils by high-pressure liquid chromatography,"Journal of chromatogruphy, vol. 118, pp. 273-275, 1976.
K. Ruse, M. Sabovics, T. Rakcejeva, L. Dukalska, R. Galoburda, and L. Berzina.,"he effect of drying conditions on the presence of volatile compounds incranberries," T. World Academy of Science, Engineering and Technology, 2012.
U. M. Senanayake, T. H. Lee, and R. B. H. Wills, "Volatile constituents of cinnamon(cinnamomum zeylanicum) oils," Agric. Food Chem J. , vol. 26(4), pp. 822–824,1978.
G. Singh, S. Maurya, M. P. Delampasona, and C. A. N. Catalan, "A comparison ofchemical, antioxidant and antimicrobial studies of cinnamon leaf and bark volatileoils, oleoresins and their constituents," Food and Chemical Toxicology vol. 45, pp.1650-1661, 2007.
K. Suhr and P. Nielsen, "Antifungal activity of essential oils evaluated by twodifferent application techniques against rye bread spoilage fungi," Journal of AppliedMicrobiology, vol. 94, pp. 665–674, 2003.
Click h
ere to
buy
ABB
YY PDF Transformer 2.0
www.ABBYY.comClic
k here
to buy
ABB
YY PDF Transformer 2.0
www.ABBYY.com
60
P. S. Variyar and C. Bandyopadhyay, "On some chemical aspects of Cinnamomumzeylanicum," PAFAI Journal vol. Oct–Dec, pp. 35–38, 1989.
R. Venskutonis, "Effect of drying on the volatile constituents of thyme (ThymusVulgaris L.) and sage (SalVia Officinalis L.)," Food Chem., vol. 59, pp. 219-227,1997.
R. Venskutonis, L. Poll, and M. Larsen, "Influence of drying and irradiation on thecomposition of volatile compounds of thyme (Thymus Vulgaris L.)," FlaVvourFragr. J., vol. 11, pp. 123-128, 1996.
P. S. Vishwambhar, "Cultivation of medicinal plants and its contribution tolivelihood enhancement in the Indian Central Himalayan Region," Advancement inMedicinal Plant Research, vol. 1(2), pp. 17-23, 2013.
S. Y. Wang, P. F. Chen, and S. T. Chang, "Antifungal activities of essential oils andtheir constituents from indigenous cinnamon (Cinnamomum Osmophloeum) leavesagainst wood decay fungi," Bioresource Technology, vol. 96, pp. 813–818, 2005.
Y. Wang, Z. T. Jiang, and S. Jiang, "Chemical composition of the essential oils ofCinnamomum loureirii Nees. from China obtained by hydrodistillation andmicrowave-assisted hydrodistillation," Journal of Essential Oil Research, vol. 22, pp.129–131, 2010.
R. O. B. Wijesekera, "The chemistry and technology of cinnamon," CRC CriticalReviews in Food Science and Nutrition vol. 10, pp. 1–30, 1978.
A. L. Yousif, C. H. Scaman, T. D. Durance, and B. Girard, "Flavor volatiles andphysical properties of vacuum-microwave and airdried sweet basil (OcimumBasilicum L.)," J. Agric. Food Chem, vol. 47, pp. 4777-4781, 1999.
A. N. Yousif, T. D. Durance, D. H. Scaman, and B. Girard, "Headspace volatiles andphysical characteristics of vacuummicrowave, air, and freeze-dried oregano (Lippiaberlandieri Schauer)," J. Food Sci., vol. 65, pp. 926-930, 2000.
Click h
ere to
buy
ABB
YY PDF Transformer 2.0
www.ABBYY.comClic
k here
to buy
ABB
YY PDF Transformer 2.0
www.ABBYY.com
61
APPENDICES
Appendix A: Gas chromatograms of hydro distilled cinnamon oil at different
drying temperatures
(a) (b)
(c) (d)
Click h
ere to
buy
ABB
YY PDF Transformer 2.0
www.ABBYY.comClic
k here
to buy
ABB
YY PDF Transformer 2.0
www.ABBYY.com

62
Figure A.1: Air drying at ambient temperature (a) Trial 1, (b) Trial 2, (c) Trial 3 and
(d) Trial 4
(a) (b)
(c) (d)
Click h
ere to
buy
ABB
YY PDF Transformer 2.0
www.ABBYY.comClic
k here
to buy
ABB
YY PDF Transformer 2.0
www.ABBYY.com

63
Figure A.2: Air drying at 35 °C temperature (a) Trial 1, (b) Trial 2, (c) Trial 3 and (d)
Trial 4
(a) (b)
(c) (d)
Click h
ere to
buy
ABB
YY PDF Transformer 2.0
www.ABBYY.comClic
k here
to buy
ABB
YY PDF Transformer 2.0
www.ABBYY.com
64
Figure A.3: Air drying at 40 °C temperature (a) Trial 1, (b) Trial 2, (c) Trial 3 and (d)
Trial 4
(a) (b)
(c) (d)
Click h
ere to
buy
ABB
YY PDF Transformer 2.0
www.ABBYY.comClic
k here
to buy
ABB
YY PDF Transformer 2.0
www.ABBYY.com
65
Figure A.4: Air drying at 45 °C temperature (a) Trial 1, (b) Trial 2, (c) Trial 3 and (d)
Trial 4
(a) (b)
Click h
ere to
buy
ABB
YY PDF Transformer 2.0
www.ABBYY.comClic
k here
to buy
ABB
YY PDF Transformer 2.0
www.ABBYY.com
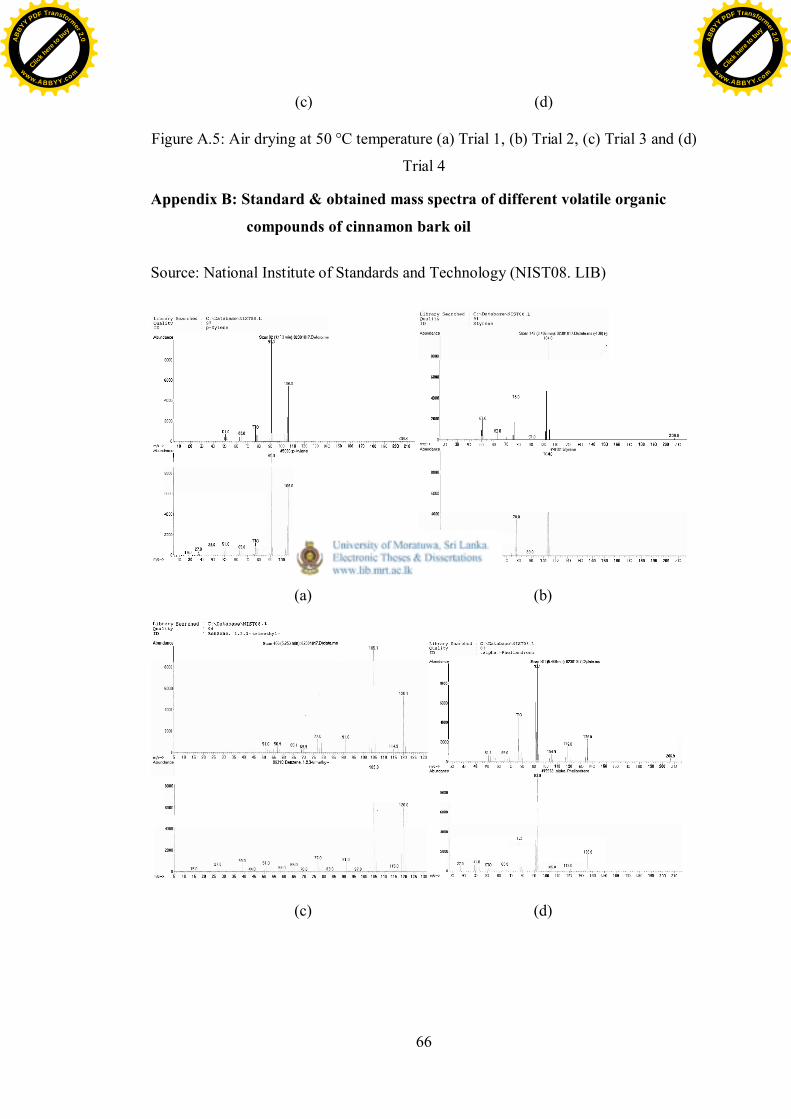
66
(c) (d)
Figure A.5: Air drying at 50 °C temperature (a) Trial 1, (b) Trial 2, (c) Trial 3 and (d)
Trial 4
Appendix B: Standard & obtained mass spectra of different volatile organic
compounds of cinnamon bark oil
Source: National Institute of Standards and Technology (NIST08. LIB)
(a) (b)
(c) (d)
Click h
ere to
buy
ABB
YY PDF Transformer 2.0
www.ABBYY.comClic
k here
to buy
ABB
YY PDF Transformer 2.0
www.ABBYY.com
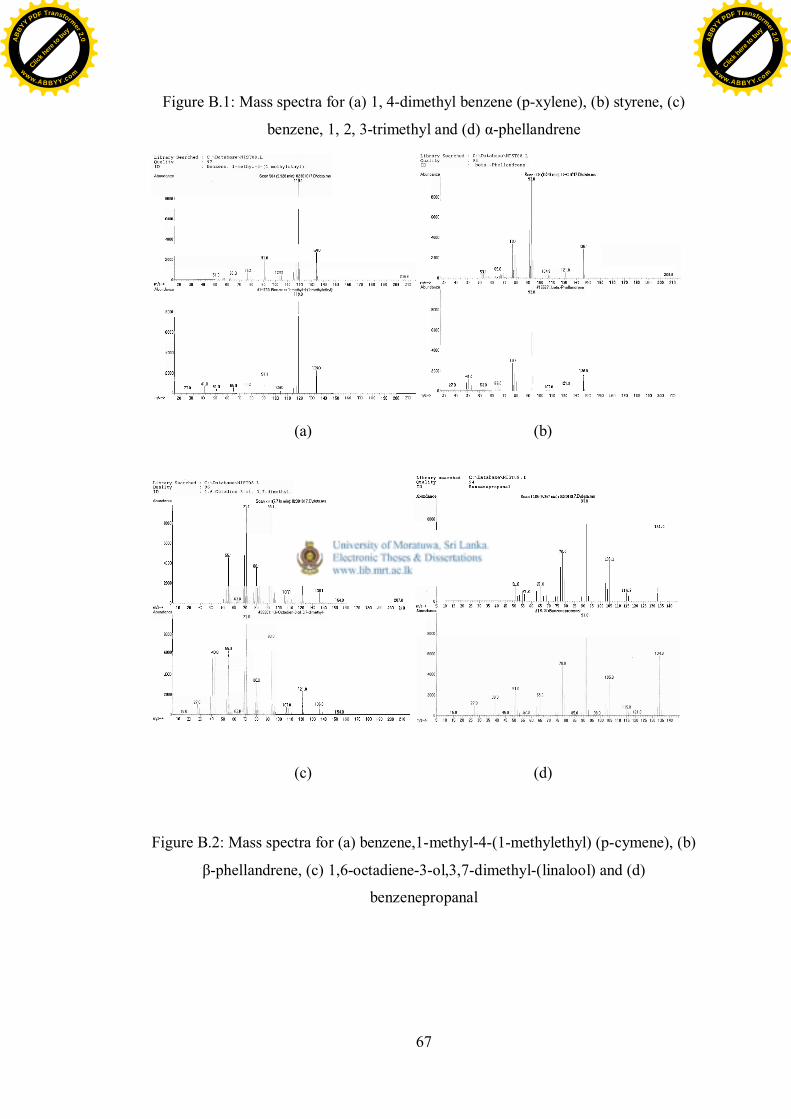
67
Figure B.1: Mass spectra for (a) 1, 4-dimethyl benzene (p-xylene), (b) styrene, (c)
benzene, 1, 2, 3-trimethyl and (d) α-phellandrene
(a) (b)
(c) (d)
Figure B.2: Mass spectra for (a) benzene,1-methyl-4-(1-methylethyl) (p-cymene), (b)
β-phellandrene, (c) 1,6-octadiene-3-ol,3,7-dimethyl-(linalool) and (d)
benzenepropanal
Click h
ere to
buy
ABB
YY PDF Transformer 2.0
www.ABBYY.comClic
k here
to buy
ABB
YY PDF Transformer 2.0
www.ABBYY.com
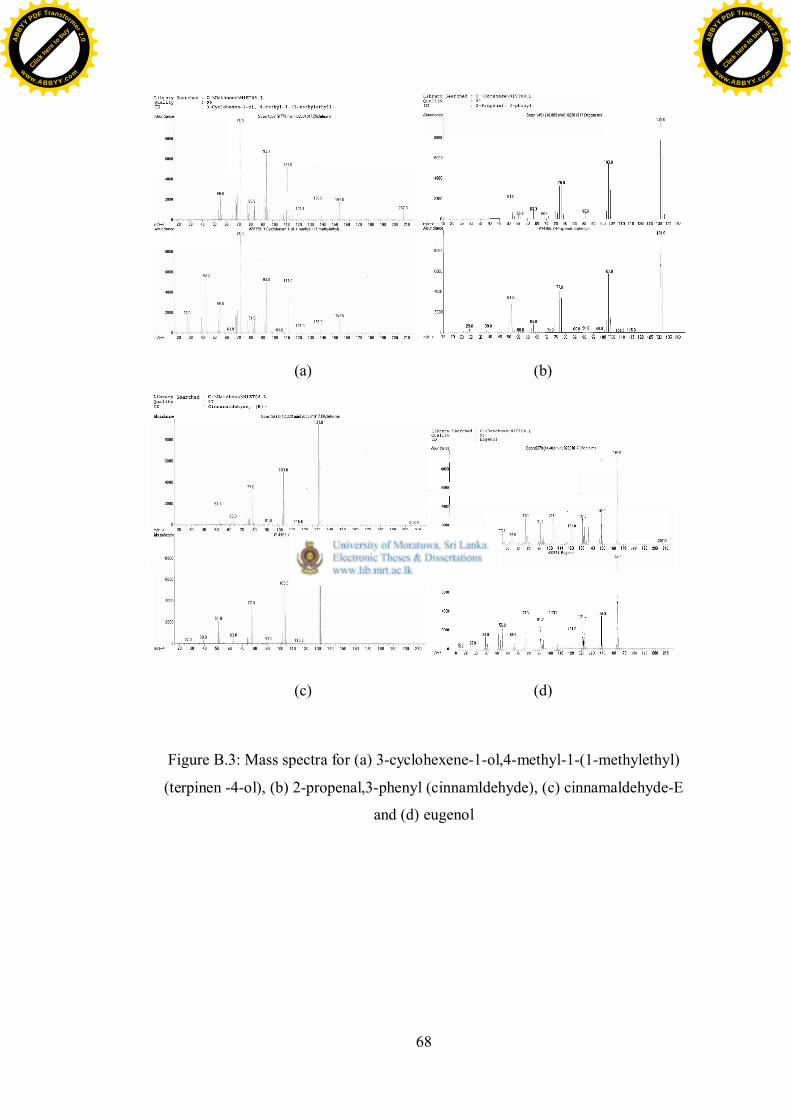
68
(a) (b)
(c) (d)
Figure B.3: Mass spectra for (a) 3-cyclohexene-1-ol,4-methyl-1-(1-methylethyl)
(terpinen -4-ol), (b) 2-propenal,3-phenyl (cinnamldehyde), (c) cinnamaldehyde-E
and (d) eugenol
Click h
ere to
buy
ABB
YY PDF Transformer 2.0
www.ABBYY.comClic
k here
to buy
ABB
YY PDF Transformer 2.0
www.ABBYY.com

69
(a) (b)
(c) (d)
Figure B.4: Mass spectra for (a) caryophyllene, (b) 2-propen-1-ol 3-phenyl acetate
(cinnamyl acetate), (c) 2-Propenal,3-(2-methoxyphenyl)- (2-methoxy-
cinnamadehyde) and (d) benzyl benzoate
Click h
ere to
buy
ABB
YY PDF Transformer 2.0
www.ABBYY.comClic
k here
to buy
ABB
YY PDF Transformer 2.0
www.ABBYY.com

70
Appendix C: Gas chromatogram data sheets of hydro distilled cinnamon oil at
different drying temperatures
(a) (b)
(c) (d)
Figure C.1: Air drying at ambient temperature (a) Trial 1, (b) Trial 2, (c) Trial
3 and (d) Trial 4
Click h
ere to
buy
ABB
YY PDF Transformer 2.0
www.ABBYY.comClic
k here
to buy
ABB
YY PDF Transformer 2.0
www.ABBYY.com
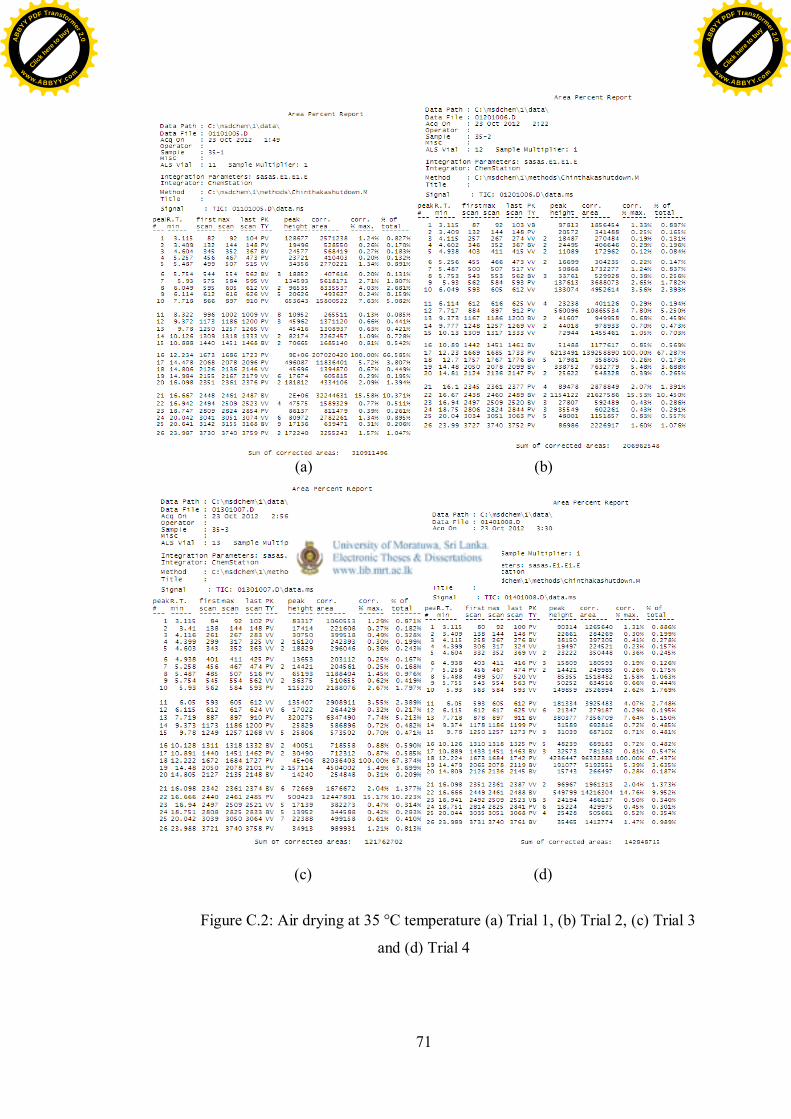
71
(a) (b)
(c) (d)
Figure C.2: Air drying at 35 °C temperature (a) Trial 1, (b) Trial 2, (c) Trial 3
and (d) Trial 4
Click h
ere to
buy
ABB
YY PDF Transformer 2.0
www.ABBYY.comClic
k here
to buy
ABB
YY PDF Transformer 2.0
www.ABBYY.com
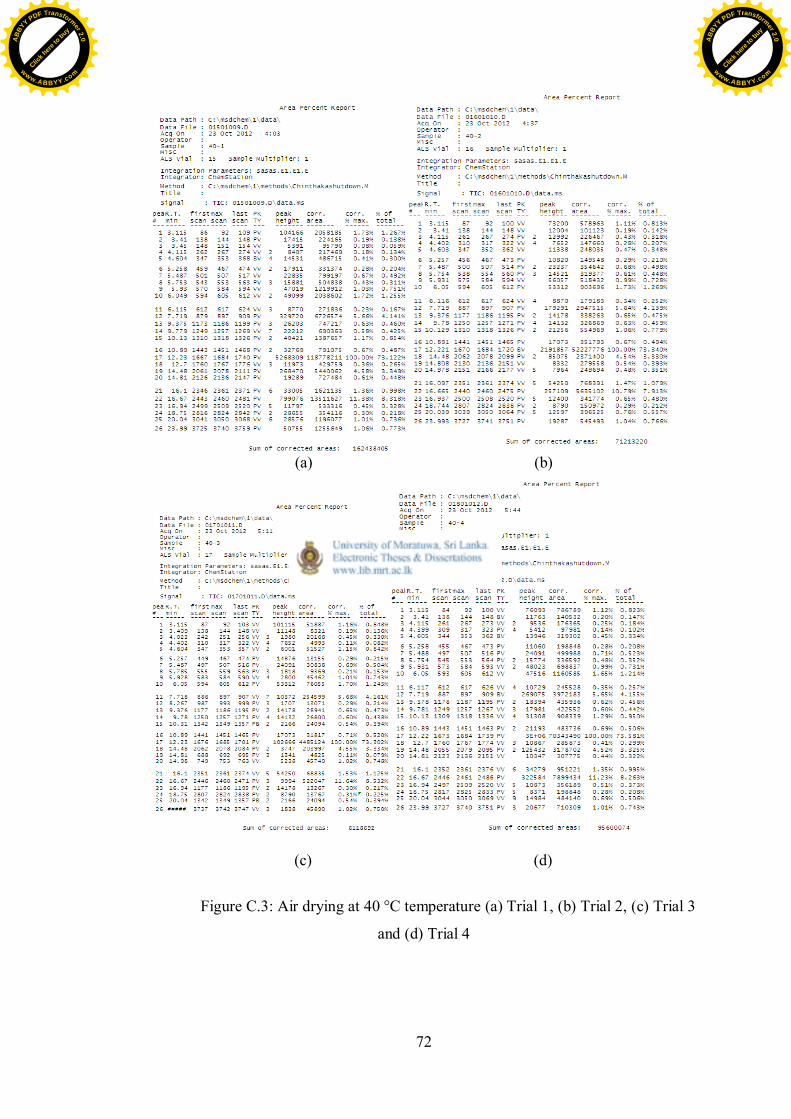
72
(a) (b)
(c) (d)
Figure C.3: Air drying at 40 °C temperature (a) Trial 1, (b) Trial 2, (c) Trial 3
and (d) Trial 4
Click h
ere to
buy
ABB
YY PDF Transformer 2.0
www.ABBYY.comClic
k here
to buy
ABB
YY PDF Transformer 2.0
www.ABBYY.com
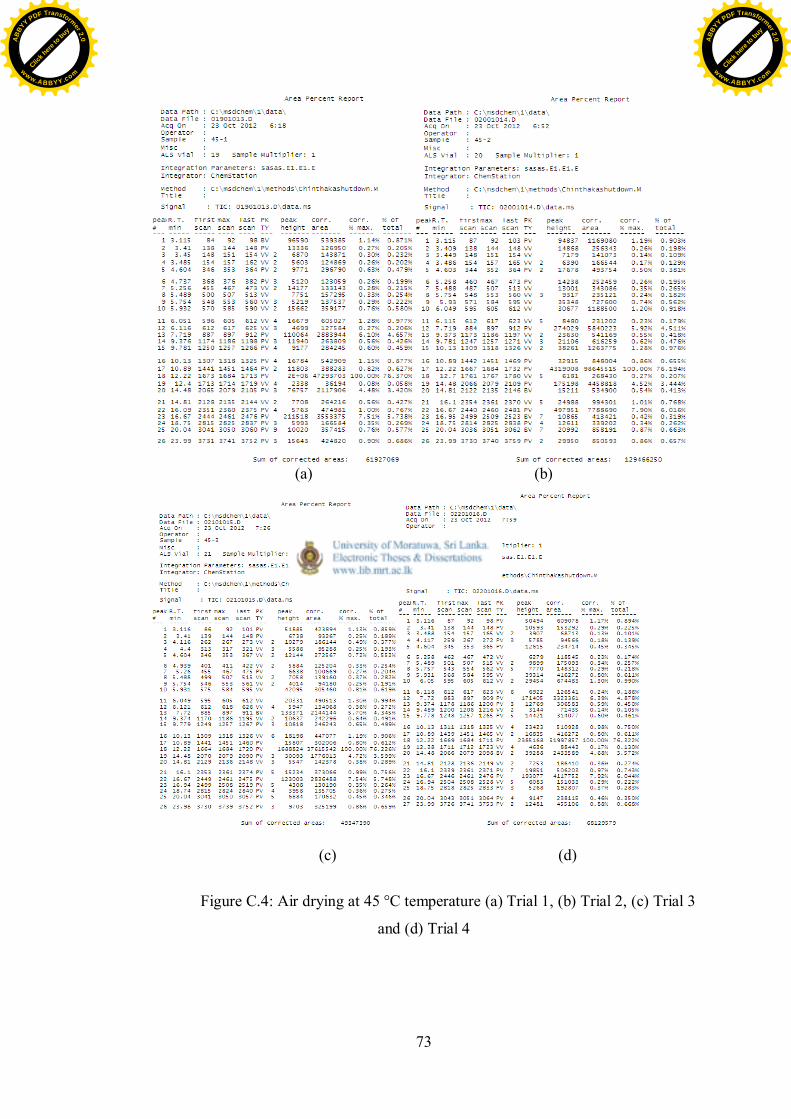
73
(a) (b)
(c) (d)
Figure C.4: Air drying at 45 °C temperature (a) Trial 1, (b) Trial 2, (c) Trial 3
and (d) Trial 4
Click h
ere to
buy
ABB
YY PDF Transformer 2.0
www.ABBYY.comClic
k here
to buy
ABB
YY PDF Transformer 2.0
www.ABBYY.com
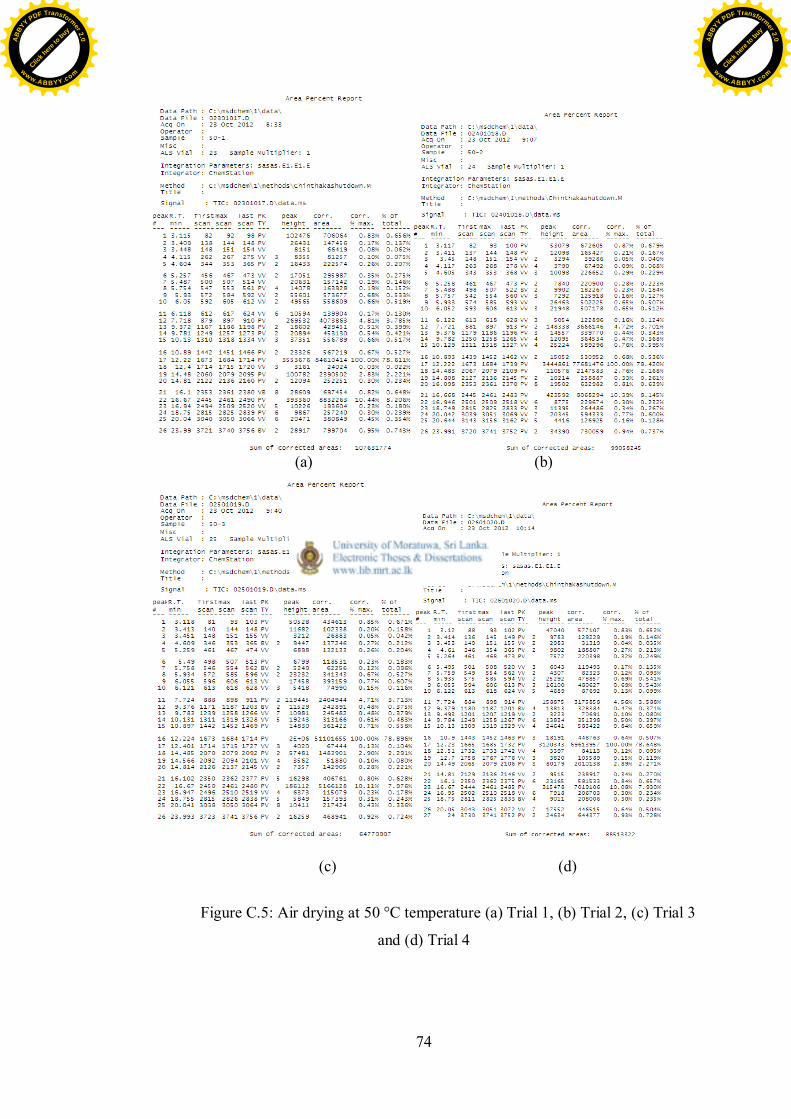
74
(a) (b)
(c) (d)
Figure C.5: Air drying at 50 °C temperature (a) Trial 1, (b) Trial 2, (c) Trial 3
and (d) Trial 4
Click h
ere to
buy
ABB
YY PDF Transformer 2.0
www.ABBYY.comClic
k here
to buy
ABB
YY PDF Transformer 2.0
www.ABBYY.com
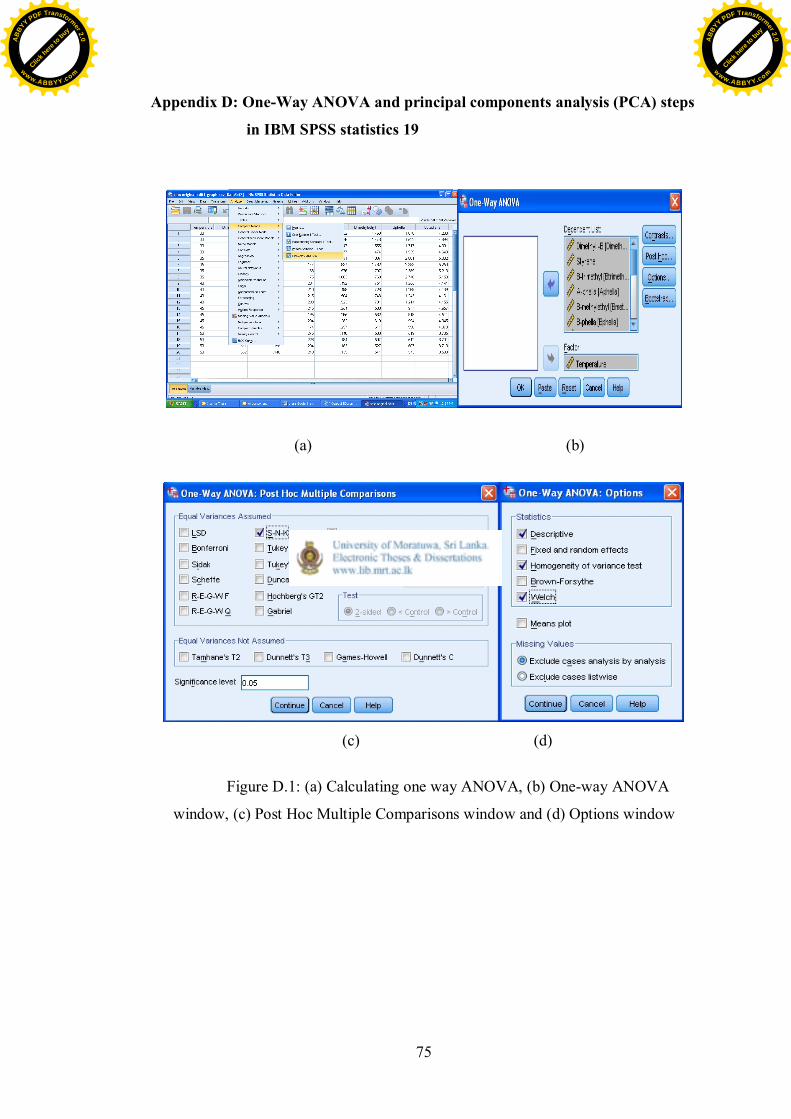
75
Appendix D: One-Way ANOVA and principal components analysis (PCA) steps
in IBM SPSS statistics 19
(a) (b)
(c) (d)
Figure D.1: (a) Calculating one way ANOVA, (b) One-way ANOVA
window, (c) Post Hoc Multiple Comparisons window and (d) Options window
Click h
ere to
buy
ABB
YY PDF Transformer 2.0
www.ABBYY.comClic
k here
to buy
ABB
YY PDF Transformer 2.0
www.ABBYY.com
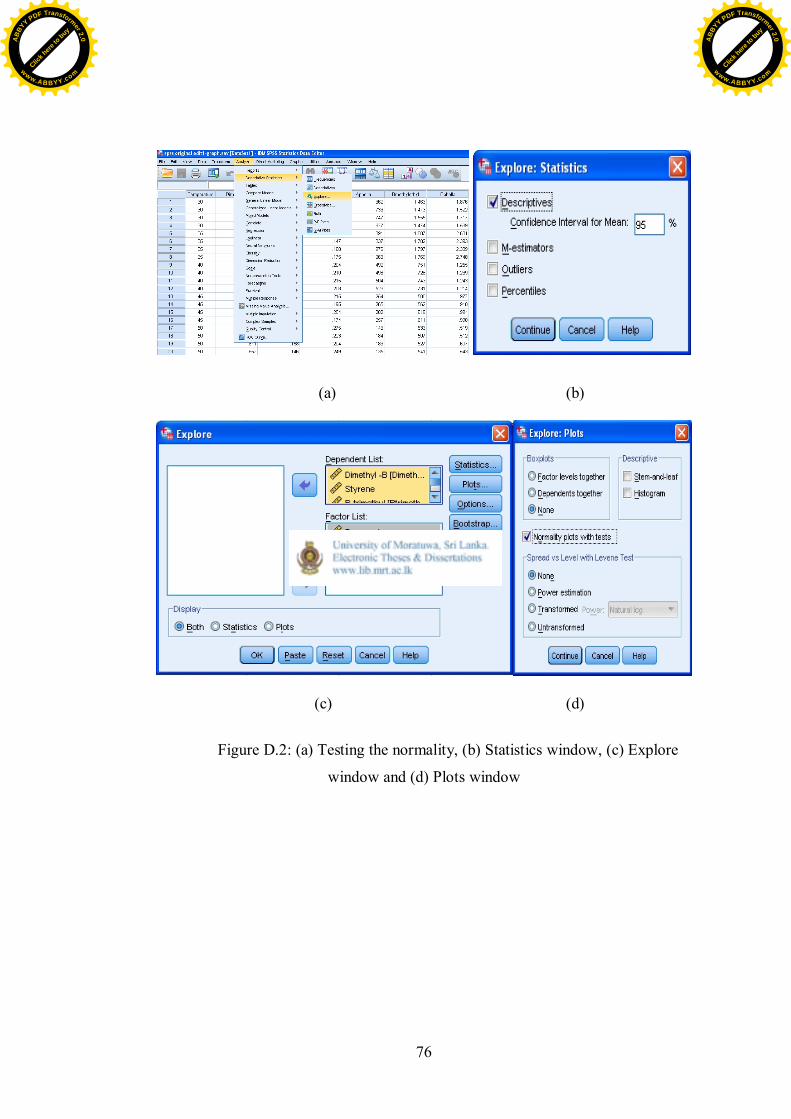
76
(a) (b)
(c) (d)
Figure D.2: (a) Testing the normality, (b) Statistics window, (c) Explore
window and (d) Plots window
Click h
ere to
buy
ABB
YY PDF Transformer 2.0
www.ABBYY.comClic
k here
to buy
ABB
YY PDF Transformer 2.0
www.ABBYY.com
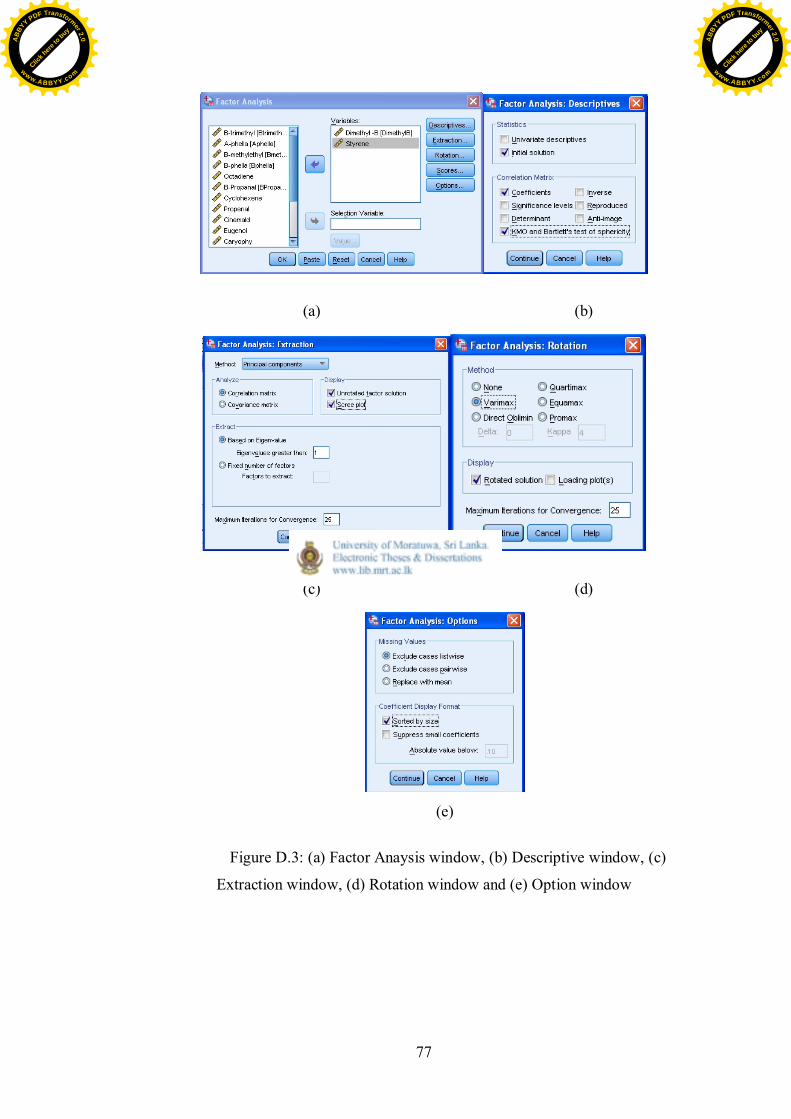
77
(a) (b)
(c) (d)
(e)
Figure D.3: (a) Factor Anaysis window, (b) Descriptive window, (c)
Extraction window, (d) Rotation window and (e) Option window
Click h
ere to
buy
ABB
YY PDF Transformer 2.0
www.ABBYY.comClic
k here
to buy
ABB
YY PDF Transformer 2.0
www.ABBYY.com
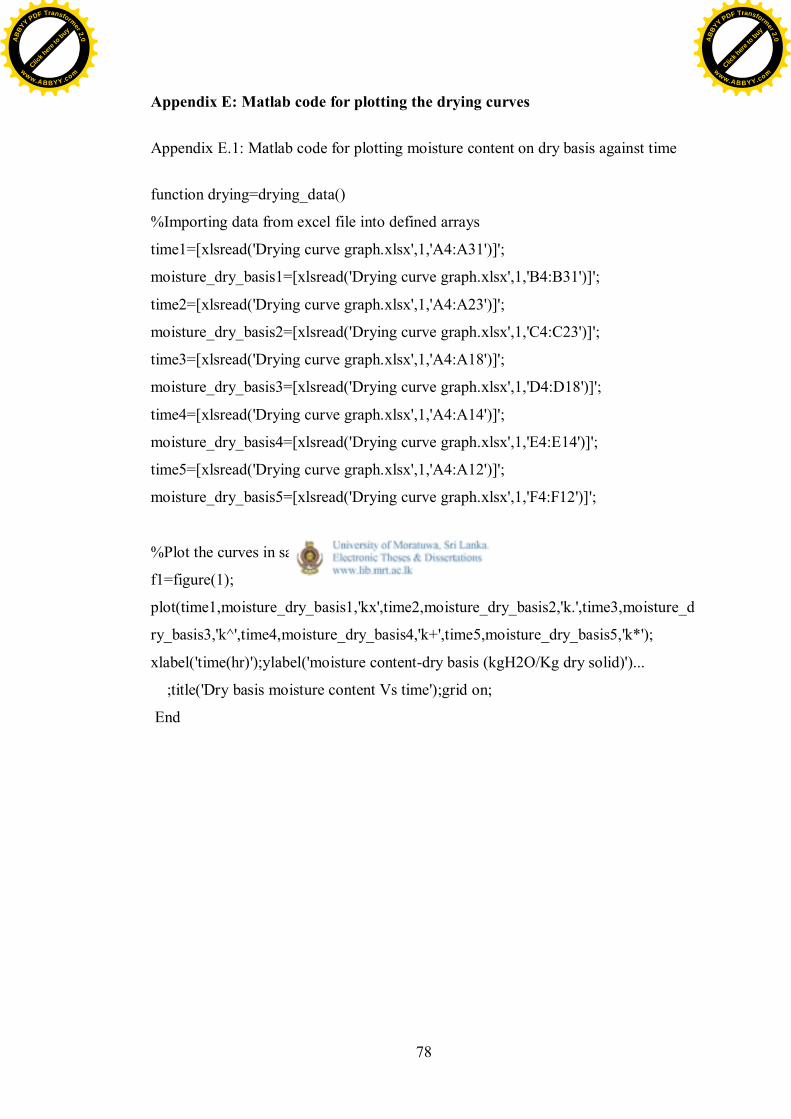
78
Appendix E: Matlab code for plotting the drying curves
Appendix E.1: Matlab code for plotting moisture content on dry basis against time
function drying=drying_data()
%Importing data from excel file into defined arrays
time1=[xlsread('Drying curve graph.xlsx',1,'A4:A31')]';
moisture_dry_basis1=[xlsread('Drying curve graph.xlsx',1,'B4:B31')]';
time2=[xlsread('Drying curve graph.xlsx',1,'A4:A23')]';
moisture_dry_basis2=[xlsread('Drying curve graph.xlsx',1,'C4:C23')]';
time3=[xlsread('Drying curve graph.xlsx',1,'A4:A18')]';
moisture_dry_basis3=[xlsread('Drying curve graph.xlsx',1,'D4:D18')]';
time4=[xlsread('Drying curve graph.xlsx',1,'A4:A14')]';
moisture_dry_basis4=[xlsread('Drying curve graph.xlsx',1,'E4:E14')]';
time5=[xlsread('Drying curve graph.xlsx',1,'A4:A12')]';
moisture_dry_basis5=[xlsread('Drying curve graph.xlsx',1,'F4:F12')]';
%Plot the curves in same figures
f1=figure(1);
plot(time1,moisture_dry_basis1,'kx',time2,moisture_dry_basis2,'k.',time3,moisture_d
ry_basis3,'k^',time4,moisture_dry_basis4,'k+',time5,moisture_dry_basis5,'k*');
xlabel('time(hr)');ylabel('moisture content-dry basis (kgH2O/Kg dry solid)')...
;title('Dry basis moisture content Vs time');grid on;
End
Click h
ere to
buy
ABB
YY PDF Transformer 2.0
www.ABBYY.comClic
k here
to buy
ABB
YY PDF Transformer 2.0
www.ABBYY.com
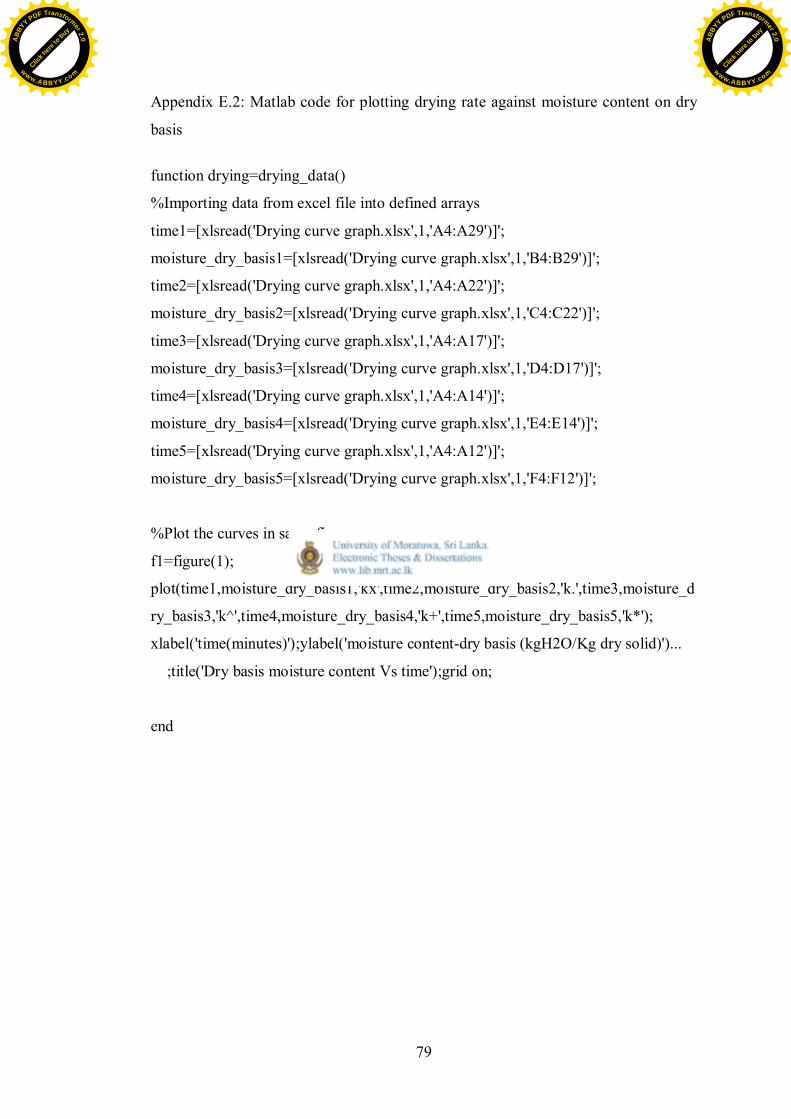
79
Appendix E.2: Matlab code for plotting drying rate against moisture content on dry
basis
function drying=drying_data()
%Importing data from excel file into defined arrays
time1=[xlsread('Drying curve graph.xlsx',1,'A4:A29')]';
moisture_dry_basis1=[xlsread('Drying curve graph.xlsx',1,'B4:B29')]';
time2=[xlsread('Drying curve graph.xlsx',1,'A4:A22')]';
moisture_dry_basis2=[xlsread('Drying curve graph.xlsx',1,'C4:C22')]';
time3=[xlsread('Drying curve graph.xlsx',1,'A4:A17')]';
moisture_dry_basis3=[xlsread('Drying curve graph.xlsx',1,'D4:D17')]';
time4=[xlsread('Drying curve graph.xlsx',1,'A4:A14')]';
moisture_dry_basis4=[xlsread('Drying curve graph.xlsx',1,'E4:E14')]';
time5=[xlsread('Drying curve graph.xlsx',1,'A4:A12')]';
moisture_dry_basis5=[xlsread('Drying curve graph.xlsx',1,'F4:F12')]';
%Plot the curves in same figures
f1=figure(1);
plot(time1,moisture_dry_basis1,'kx',time2,moisture_dry_basis2,'k.',time3,moisture_d
ry_basis3,'k^',time4,moisture_dry_basis4,'k+',time5,moisture_dry_basis5,'k*');
xlabel('time(minutes)');ylabel('moisture content-dry basis (kgH2O/Kg dry solid)')...
;title('Dry basis moisture content Vs time');grid on;
end
Click h
ere to
buy
ABB
YY PDF Transformer 2.0
www.ABBYY.comClic
k here
to buy
ABB
YY PDF Transformer 2.0
www.ABBYY.com
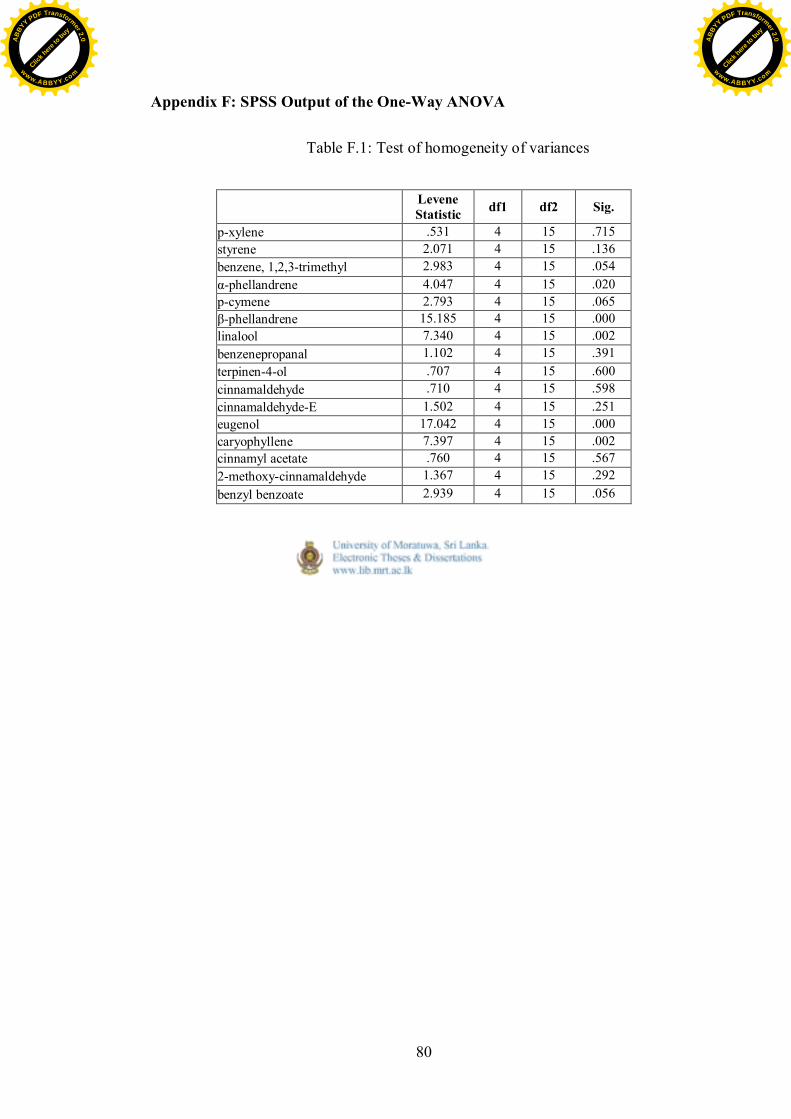
80
Appendix F: SPSS Output of the One-Way ANOVA
Table F.1: Test of homogeneity of variances
LeveneStatistic df1 df2 Sig.
p-xylene .531 4 15 .715styrene 2.071 4 15 .136benzene, 1,2,3-trimethyl 2.983 4 15 .054α-phellandrene 4.047 4 15 .020p-cymene 2.793 4 15 .065β-phellandrene 15.185 4 15 .000linalool 7.340 4 15 .002benzenepropanal 1.102 4 15 .391terpinen-4-ol .707 4 15 .600cinnamaldehyde .710 4 15 .598cinnamaldehyde-E 1.502 4 15 .251eugenol 17.042 4 15 .000caryophyllene 7.397 4 15 .002cinnamyl acetate .760 4 15 .5672-methoxy-cinnamaldehyde 1.367 4 15 .292benzyl benzoate 2.939 4 15 .056
Click h
ere to
buy
ABB
YY PDF Transformer 2.0
www.ABBYY.comClic
k here
to buy
ABB
YY PDF Transformer 2.0
www.ABBYY.com

81
Table F.2: Tests of Normality
Temperature Kolmogorov-Smirnova Shapiro-WilkStatistic df Sig. Statistic df Sig.
p-xylene Ambient .187 4 . .990 4 .95735 .260 4 . .903 4 .44840 .192 4 . .989 4 .95345 .227 4 . .940 4 .65350 .249 4 . .921 4 .544
styrene Ambient .359 4 . .746 4 .03635 .224 4 . .938 4 .64140 .214 4 . .956 4 .75545 .230 4 . .955 4 .74750 .175 4 . .980 4 .900
benzene, 1,2,3-trimethyl
Ambient .190 4 . .979 4 .89335 .237 4 . .941 4 .65840 .185 4 . .993 4 .97145 .204 4 . .972 4 .85450 .183 4 . .983 4 .919
α-phellandrene Ambient .288 4 . .934 4 .61935 .196 4 . .976 4 .87840 .257 4 . .920 4 .53645 .234 4 . .895 4 .40650 .297 4 . .831 4 .169
p-cymene Ambient .407 4 . .732 4 .02635 .189 4 . .978 4 .89240 .251 4 . .925 4 .56445 .250 4 . .923 4 .55250 .250 4 . .939 4 .650
β-phellandrene Ambient .272 4 . .891 4 .39035 .301 4 . .812 4 .12640 .212 4 . .965 4 .81245 .331 4 . .793 4 .09150 .271 4 . .855 4 .243
linalool Ambient .258 4 . .916 4 .51735 .203 4 . .971 4 .84740 .272 4 . .885 4 .36145 .149 4 . .994 4 .97850 .271 4 . .949 4 .708
Benzenepropanal Ambient .298 4 . .875 4 .31935 .269 4 . .900 4 .43340 .271 4 . .871 4 .30145 .232 4 . .910 4 .48150 .233 4 . .970 4 .843
terpinen-4-ol Ambient .201 4 . .951 4 .72535 .386 4 . .770 4 .05940 .222 4 . .979 4 .89645 .255 4 . .879 4 .33550 .202 4 . .966 4 .816
cinnamaldehyde Ambient .303 4 . .806 4 .11335 .254 4 . .922 4 .54640 .204 4 . .968 4 .83245 .256 4 . .849 4 .22250 .175 4 . .995 4 .983
cinnamaldehyde-E Ambient .267 4 . .875 4 .318
Click h
ere to
buy
ABB
YY PDF Transformer 2.0
www.ABBYY.comClic
k here
to buy
ABB
YY PDF Transformer 2.0
www.ABBYY.com
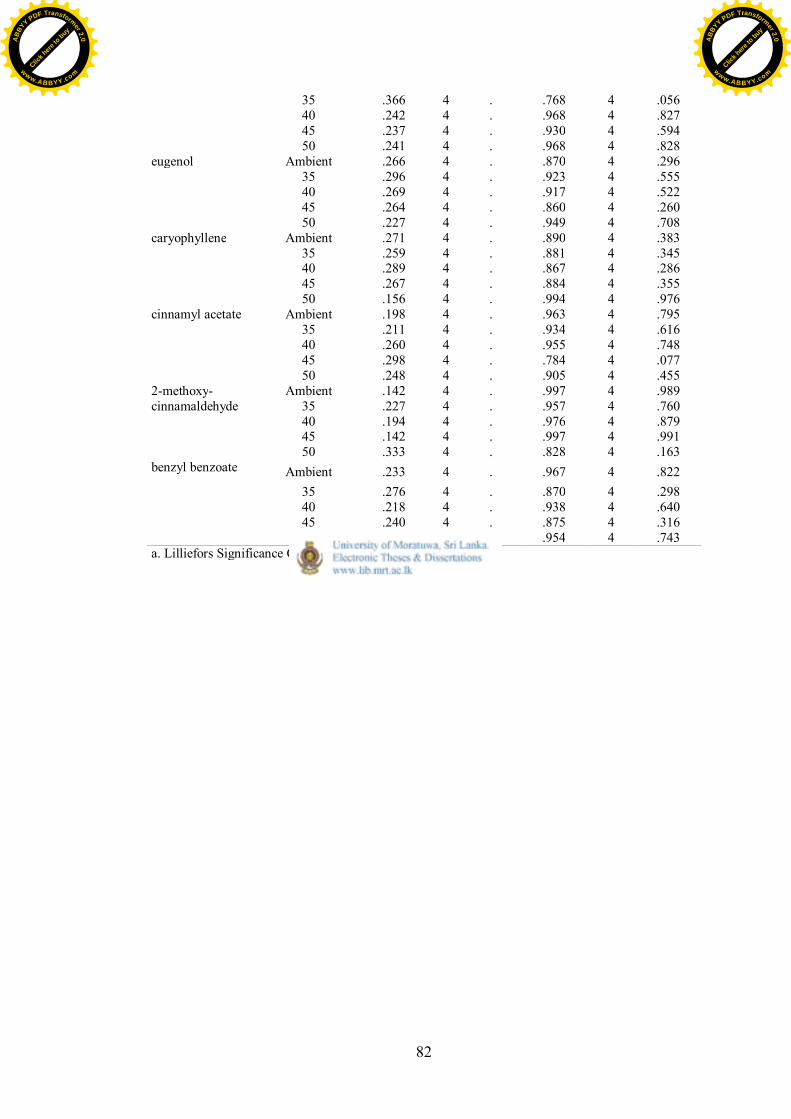
82
35 .366 4 . .768 4 .05640 .242 4 . .968 4 .82745 .237 4 . .930 4 .59450 .241 4 . .968 4 .828
eugenol Ambient .266 4 . .870 4 .29635 .296 4 . .923 4 .55540 .269 4 . .917 4 .52245 .264 4 . .860 4 .26050 .227 4 . .949 4 .708
caryophyllene Ambient .271 4 . .890 4 .38335 .259 4 . .881 4 .34540 .289 4 . .867 4 .28645 .267 4 . .884 4 .35550 .156 4 . .994 4 .976
cinnamyl acetate Ambient .198 4 . .963 4 .79535 .211 4 . .934 4 .61640 .260 4 . .955 4 .74845 .298 4 . .784 4 .07750 .248 4 . .905 4 .455
2-methoxy-cinnamaldehyde
Ambient .142 4 . .997 4 .98935 .227 4 . .957 4 .76040 .194 4 . .976 4 .87945 .142 4 . .997 4 .99150 .333 4 . .828 4 .163
benzyl benzoate Ambient .233 4 . .967 4 .82235 .276 4 . .870 4 .29840 .218 4 . .938 4 .64045 .240 4 . .875 4 .31650 .219 4 . .954 4 .743
a. Lilliefors Significance Correction
Click h
ere to
buy
ABB
YY PDF Transformer 2.0
www.ABBYY.comClic
k here
to buy
ABB
YY PDF Transformer 2.0
www.ABBYY.com
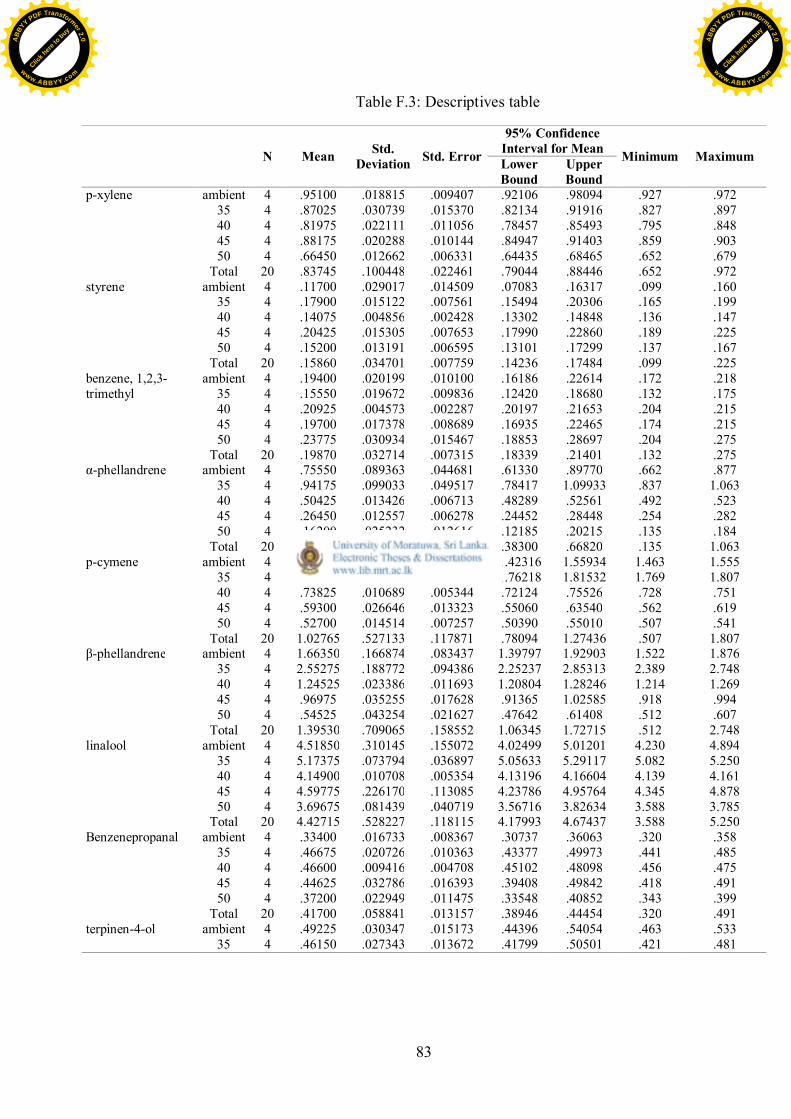
83
Table F.3: Descriptives table
N Mean Std.Deviation Std. Error
95% ConfidenceInterval for Mean Minimum MaximumLowerBound
UpperBound
p-xylene ambient 4 .95100 .018815 .009407 .92106 .98094 .927 .97235 4 .87025 .030739 .015370 .82134 .91916 .827 .89740 4 .81975 .022111 .011056 .78457 .85493 .795 .84845 4 .88175 .020288 .010144 .84947 .91403 .859 .90350 4 .66450 .012662 .006331 .64435 .68465 .652 .679
Total 20 .83745 .100448 .022461 .79044 .88446 .652 .972styrene ambient 4 .11700 .029017 .014509 .07083 .16317 .099 .160
35 4 .17900 .015122 .007561 .15494 .20306 .165 .19940 4 .14075 .004856 .002428 .13302 .14848 .136 .14745 4 .20425 .015305 .007653 .17990 .22860 .189 .22550 4 .15200 .013191 .006595 .13101 .17299 .137 .167
Total 20 .15860 .034701 .007759 .14236 .17484 .099 .225benzene, 1,2,3-trimethyl
ambient 4 .19400 .020199 .010100 .16186 .22614 .172 .21835 4 .15550 .019672 .009836 .12420 .18680 .132 .17540 4 .20925 .004573 .002287 .20197 .21653 .204 .21545 4 .19700 .017378 .008689 .16935 .22465 .174 .21550 4 .23775 .030934 .015467 .18853 .28697 .204 .275
Total 20 .19870 .032714 .007315 .18339 .21401 .132 .275α-phellandrene ambient 4 .75550 .089363 .044681 .61330 .89770 .662 .877
35 4 .94175 .099033 .049517 .78417 1.09933 .837 1.06340 4 .50425 .013426 .006713 .48289 .52561 .492 .52345 4 .26450 .012557 .006278 .24452 .28448 .254 .28250 4 .16200 .025232 .012616 .12185 .20215 .135 .184
Total 20 .52560 .304681 .068129 .38300 .66820 .135 1.063p-cymene ambient 4 1.49125 .042789 .021395 1.42316 1.55934 1.463 1.555
35 4 1.78875 .016701 .008350 1.76218 1.81532 1.769 1.80740 4 .73825 .010689 .005344 .72124 .75526 .728 .75145 4 .59300 .026646 .013323 .55060 .63540 .562 .61950 4 .52700 .014514 .007257 .50390 .55010 .507 .541
Total 20 1.02765 .527133 .117871 .78094 1.27436 .507 1.807β-phellandrene ambient 4 1.66350 .166874 .083437 1.39797 1.92903 1.522 1.876
35 4 2.55275 .188772 .094386 2.25237 2.85313 2.389 2.74840 4 1.24525 .023386 .011693 1.20804 1.28246 1.214 1.26945 4 .96975 .035255 .017628 .91365 1.02585 .918 .99450 4 .54525 .043254 .021627 .47642 .61408 .512 .607
Total 20 1.39530 .709065 .158552 1.06345 1.72715 .512 2.748linalool ambient 4 4.51850 .310145 .155072 4.02499 5.01201 4.230 4.894
35 4 5.17375 .073794 .036897 5.05633 5.29117 5.082 5.25040 4 4.14900 .010708 .005354 4.13196 4.16604 4.139 4.16145 4 4.59775 .226170 .113085 4.23786 4.95764 4.345 4.87850 4 3.69675 .081439 .040719 3.56716 3.82634 3.588 3.785
Total 20 4.42715 .528227 .118115 4.17993 4.67437 3.588 5.250Benzenepropanal ambient 4 .33400 .016733 .008367 .30737 .36063 .320 .358
35 4 .46675 .020726 .010363 .43377 .49973 .441 .48540 4 .46600 .009416 .004708 .45102 .48098 .456 .47545 4 .44625 .032786 .016393 .39408 .49842 .418 .49150 4 .37200 .022949 .011475 .33548 .40852 .343 .399
Total 20 .41700 .058841 .013157 .38946 .44454 .320 .491terpinen-4-ol ambient 4 .49225 .030347 .015173 .44396 .54054 .463 .533
35 4 .46150 .027343 .013672 .41799 .50501 .421 .481
Click h
ere to
buy
ABB
YY PDF Transformer 2.0
www.ABBYY.comClic
k here
to buy
ABB
YY PDF Transformer 2.0
www.ABBYY.com
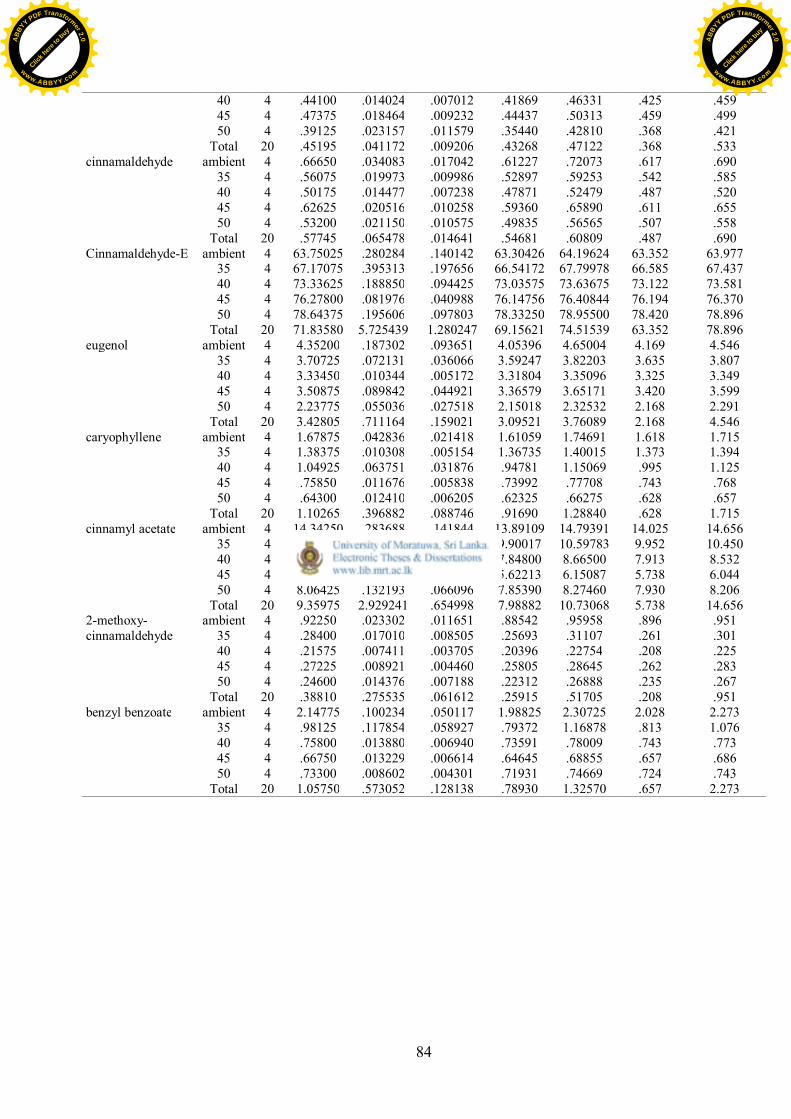
84
40 4 .44100 .014024 .007012 .41869 .46331 .425 .45945 4 .47375 .018464 .009232 .44437 .50313 .459 .49950 4 .39125 .023157 .011579 .35440 .42810 .368 .421
Total 20 .45195 .041172 .009206 .43268 .47122 .368 .533cinnamaldehyde ambient 4 .66650 .034083 .017042 .61227 .72073 .617 .690
35 4 .56075 .019973 .009986 .52897 .59253 .542 .58540 4 .50175 .014477 .007238 .47871 .52479 .487 .52045 4 .62625 .020516 .010258 .59360 .65890 .611 .65550 4 .53200 .021150 .010575 .49835 .56565 .507 .558
Total 20 .57745 .065478 .014641 .54681 .60809 .487 .690Cinnamaldehyde-E ambient 4 63.75025 .280284 .140142 63.30426 64.19624 63.352 63.977
35 4 67.17075 .395313 .197656 66.54172 67.79978 66.585 67.43740 4 73.33625 .188850 .094425 73.03575 73.63675 73.122 73.58145 4 76.27800 .081976 .040988 76.14756 76.40844 76.194 76.37050 4 78.64375 .195606 .097803 78.33250 78.95500 78.420 78.896
Total 20 71.83580 5.725439 1.280247 69.15621 74.51539 63.352 78.896eugenol ambient 4 4.35200 .187302 .093651 4.05396 4.65004 4.169 4.546
35 4 3.70725 .072131 .036066 3.59247 3.82203 3.635 3.80740 4 3.33450 .010344 .005172 3.31804 3.35096 3.325 3.34945 4 3.50875 .089842 .044921 3.36579 3.65171 3.420 3.59950 4 2.23775 .055036 .027518 2.15018 2.32532 2.168 2.291
Total 20 3.42805 .711164 .159021 3.09521 3.76089 2.168 4.546caryophyllene ambient 4 1.67875 .042836 .021418 1.61059 1.74691 1.618 1.715
35 4 1.38375 .010308 .005154 1.36735 1.40015 1.373 1.39440 4 1.04925 .063751 .031876 .94781 1.15069 .995 1.12545 4 .75850 .011676 .005838 .73992 .77708 .743 .76850 4 .64300 .012410 .006205 .62325 .66275 .628 .657
Total 20 1.10265 .396882 .088746 .91690 1.28840 .628 1.715cinnamyl acetate ambient 4 14.34250 .283688 .141844 13.89109 14.79391 14.025 14.656
35 4 10.24900 .219218 .109609 9.90017 10.59783 9.952 10.45040 4 8.25650 .256721 .128360 7.84800 8.66500 7.913 8.53245 4 5.88650 .166144 .083072 5.62213 6.15087 5.738 6.04450 4 8.06425 .132193 .066096 7.85390 8.27460 7.930 8.206
Total 20 9.35975 2.929241 .654998 7.98882 10.73068 5.738 14.6562-methoxy-cinnamaldehyde
ambient 4 .92250 .023302 .011651 .88542 .95958 .896 .95135 4 .28400 .017010 .008505 .25693 .31107 .261 .30140 4 .21575 .007411 .003705 .20396 .22754 .208 .22545 4 .27225 .008921 .004460 .25805 .28645 .262 .28350 4 .24600 .014376 .007188 .22312 .26888 .235 .267
Total 20 .38810 .275535 .061612 .25915 .51705 .208 .951benzyl benzoate ambient 4 2.14775 .100234 .050117 1.98825 2.30725 2.028 2.273
35 4 .98125 .117854 .058927 .79372 1.16878 .813 1.07640 4 .75800 .013880 .006940 .73591 .78009 .743 .77345 4 .66750 .013229 .006614 .64645 .68855 .657 .68650 4 .73300 .008602 .004301 .71931 .74669 .724 .743
Total 20 1.05750 .573052 .128138 .78930 1.32570 .657 2.273
Click h
ere to
buy
ABB
YY PDF Transformer 2.0
www.ABBYY.comClic
k here
to buy
ABB
YY PDF Transformer 2.0
www.ABBYY.com

85
Table F.4: ANOVA table
Sum ofSquares df Mean Square F Sig.
p-xylene Between Groups .185 4 .046 97.800 .000Within Groups .007 15 .000Total .192 19
styrene Between Groups .018 4 .005 15.284 .000Within Groups .005 15 .000Total .023 19
benzene, 1,2,3-trimethyl
Between Groups .014 4 .004 8.501 .001Within Groups .006 15 .000Total .020 19
α-phellandrene Between Groups 1.707 4 .427 113.724 .000Within Groups .056 15 .004Total 1.764 19
p-cymene Between Groups 5.270 4 1.318 2094.795 .000Within Groups .009 15 .001Total 5.280 19
β-phellandrene Between Groups 9.351 4 2.338 174.093 .000Within Groups .201 15 .013Total 9.553 19
linalool Between Groups 4.823 4 1.206 37.788 .000Within Groups .479 15 .032Total 5.301 19
benzenepropanal Between Groups .059 4 .015 30.514 .000Within Groups .007 15 .000Total .066 19
terpinen-4-ol Between Groups .024 4 .006 10.930 .000Within Groups .008 15 .001Total .032 19
cinnamaldehyde Between Groups .074 4 .018 34.844 .000Within Groups .008 15 .001Total .081 19
cinnamaldehyde-E Between Groups 621.886 4 155.471 2464.070 .000Within Groups .946 15 .063Total 622.832 19
eugenol Between Groups 9.455 4 2.364 229.521 .000Within Groups .154 15 .010Total 9.609 19
caryophyllene Between Groups 2.974 4 .743 590.460 .000Within Groups .019 15 .001Total 2.993 19
cinnamyl acetate Between Groups 162.310 4 40.578 847.059 .000Within Groups .719 15 .048Total 163.029 19
2-methoxy-cinnamaldehyde
Between Groups 1.439 4 .360 1532.758 .000Within Groups .004 15 .000Total 1.442 19
benzyl benzoate Between Groups 6.166 4 1.542 316.176 .000Within Groups .073 15 .005Total 6.239 19
Click h
ere to
buy
ABB
YY PDF Transformer 2.0
www.ABBYY.comClic
k here
to buy
ABB
YY PDF Transformer 2.0
www.ABBYY.com
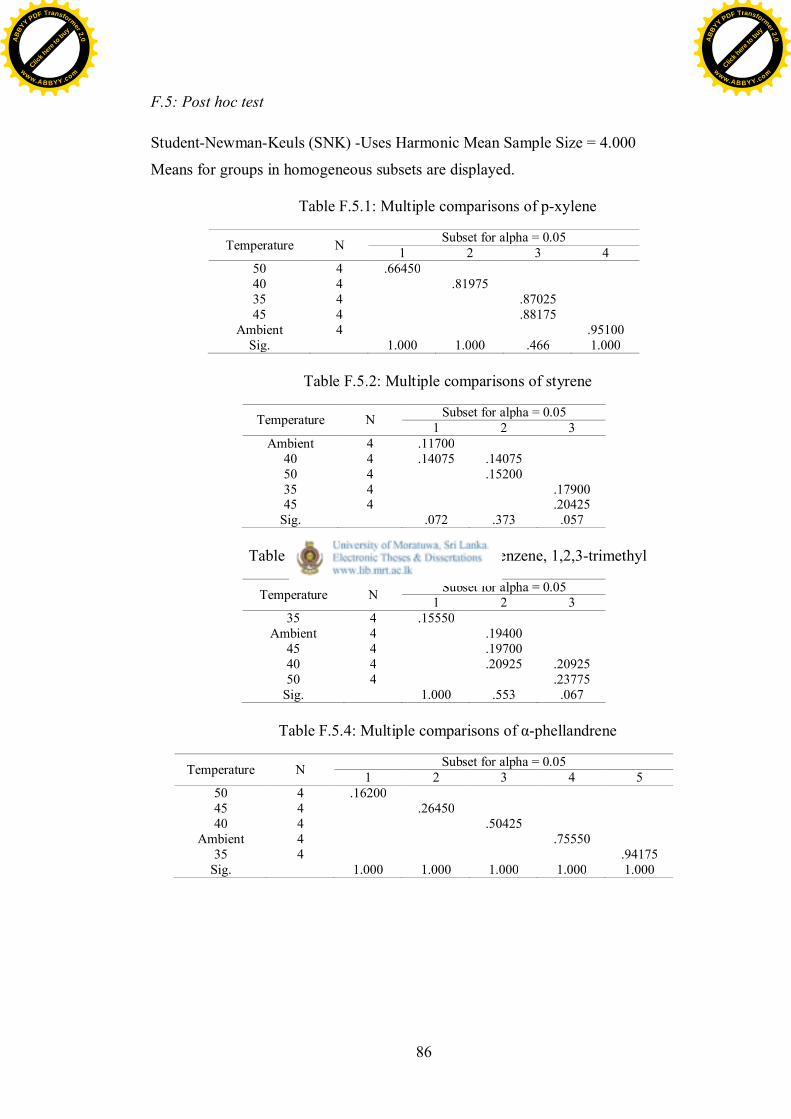
86
F.5: Post hoc test
Student-Newman-Keuls (SNK) -Uses Harmonic Mean Sample Size = 4.000
Means for groups in homogeneous subsets are displayed.
Table F.5.1: Multiple comparisons of p-xylene
Temperature N Subset for alpha = 0.051 2 3 4
50 4 .6645040 4 .8197535 4 .8702545 4 .88175
Ambient 4 .95100Sig. 1.000 1.000 .466 1.000
Table F.5.2: Multiple comparisons of styrene
Temperature N Subset for alpha = 0.051 2 3
Ambient 4 .1170040 4 .14075 .1407550 4 .1520035 4 .1790045 4 .20425
Sig. .072 .373 .057
Table F.5.3: Multiple comparisons of benzene, 1,2,3-trimethyl
Temperature N Subset for alpha = 0.051 2 3
35 4 .15550Ambient 4 .19400
45 4 .1970040 4 .20925 .2092550 4 .23775
Sig. 1.000 .553 .067
Table F.5.4: Multiple comparisons of α-phellandrene
Temperature N Subset for alpha = 0.051 2 3 4 5
50 4 .1620045 4 .2645040 4 .50425
Ambient 4 .7555035 4 .94175
Sig. 1.000 1.000 1.000 1.000 1.000
Click h
ere to
buy
ABB
YY PDF Transformer 2.0
www.ABBYY.comClic
k here
to buy
ABB
YY PDF Transformer 2.0
www.ABBYY.com
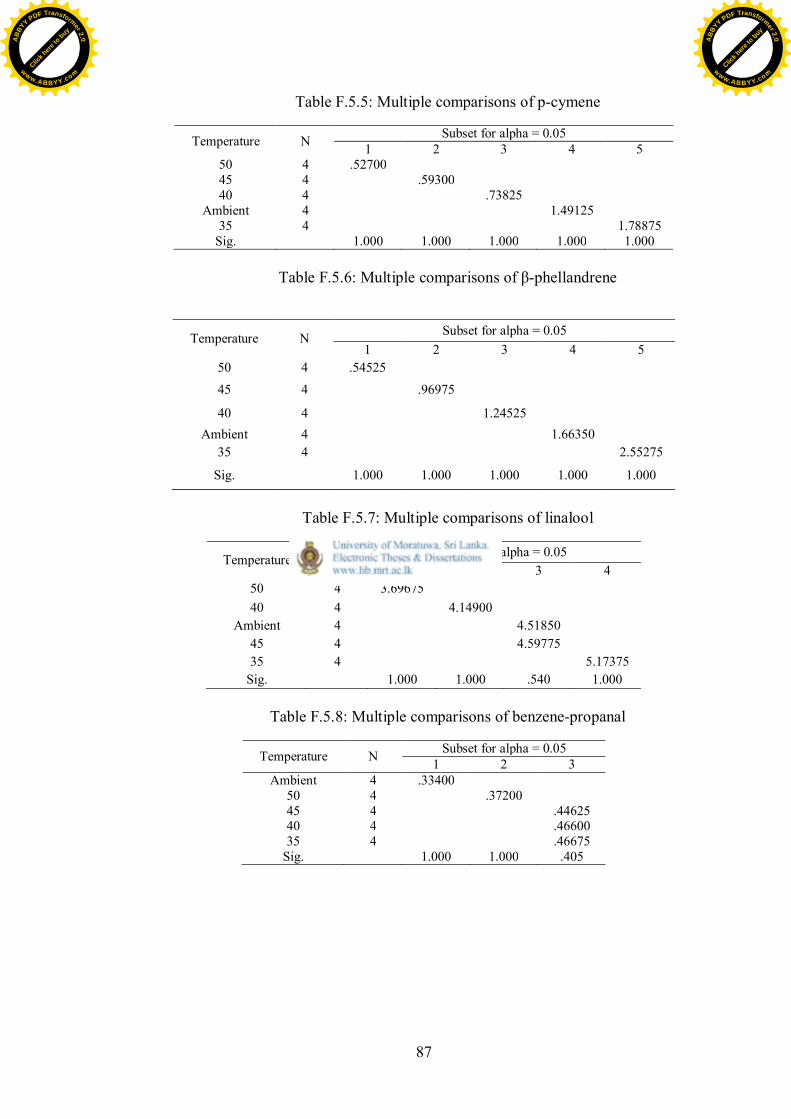
87
Table F.5.5: Multiple comparisons of p-cymene
Temperature N Subset for alpha = 0.051 2 3 4 5
50 4 .5270045 4 .5930040 4 .73825
Ambient 4 1.4912535 4 1.78875
Sig. 1.000 1.000 1.000 1.000 1.000
Table F.5.6: Multiple comparisons of β-phellandrene
Temperature N Subset for alpha = 0.051 2 3 4 5
50 4 .54525
45 4 .96975
40 4 1.24525Ambient 4 1.66350
35 4 2.55275
Sig. 1.000 1.000 1.000 1.000 1.000
Table F.5.7: Multiple comparisons of linalool
Temperature N Subset for alpha = 0.051 2 3 4
50 4 3.6967540 4 4.14900
Ambient 4 4.5185045 4 4.5977535 4 5.17375
Sig. 1.000 1.000 .540 1.000
Table F.5.8: Multiple comparisons of benzene-propanal
Temperature N Subset for alpha = 0.051 2 3
Ambient 4 .3340050 4 .3720045 4 .4462540 4 .4660035 4 .46675
Sig. 1.000 1.000 .405
Click h
ere to
buy
ABB
YY PDF Transformer 2.0
www.ABBYY.comClic
k here
to buy
ABB
YY PDF Transformer 2.0
www.ABBYY.com

88
Table F.5.9: Multiple comparisons of terpinen-4-ol
Temperature N Subset for alpha = 0.051 2 3
50 4 .3912540 4 .4410035 4 .46150 .4615045 4 .47375 .47375
Ambient 4 .49225Sig. 1.000 .152 .185
Table F.5.10: Multiple comparisons of cinnamaldehyde
Temperature N Subset for alpha = 0.051 2 3 4
40 4 .5017550 4 .53200 .5320035 4 .5607545 4 .62625
Ambient 4 .66650Sig. .082 .097 1.000 1.000
Table F.5.11: Multiple comparisons of cinnamaldehyde-E
Temperature N Subset for alpha = 0.051 2 3 4 5
Ambient 4 63.7502535 4 67.1707540 4 73.3362545 4 76.2780050 4 78.64375
Sig. 1.000 1.000 1.000 1.000 1.000
Table F.5.12: Multiple comparisons of eugenol
Temperature N Subset for alpha = 0.051 2 3 4 5
50 4 2.2377540 4 3.3345045 4 3.5087535 4 3.70725
Ambient 4 4.35200SiH. 1.000 1.000 1.000 1.000 1.000
Table F.5.13: Multiple comparisons of caryophyllene
Temperature N Subset for alpha = 0.051 2 3 4 5
50 4 .6430045 4 .7585040 4 1.0492535 4 1.38375
Ambient 4 1.67875Sig. 1.000 1.000 1.000 1.000 1.000
Click h
ere to
buy
ABB
YY PDF Transformer 2.0
www.ABBYY.comClic
k here
to buy
ABB
YY PDF Transformer 2.0
www.ABBYY.com
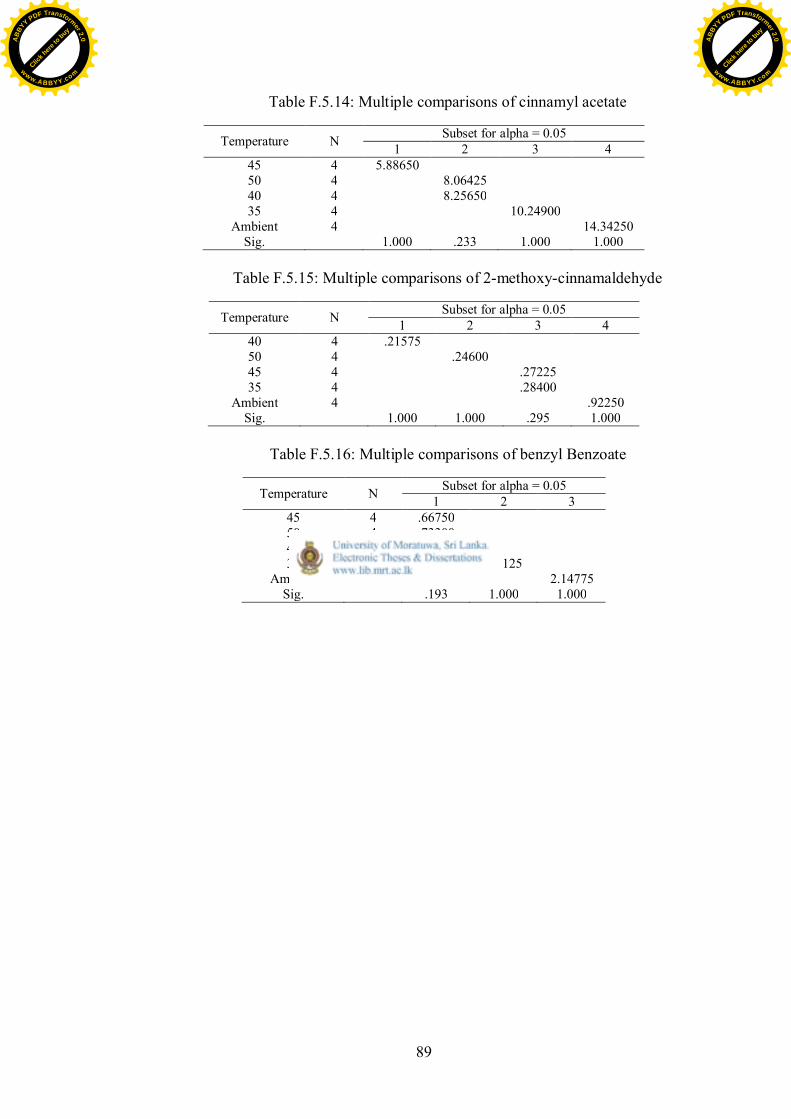
89
Table F.5.14: Multiple comparisons of cinnamyl acetate
Temperature N Subset for alpha = 0.051 2 3 4
45 4 5.8865050 4 8.0642540 4 8.2565035 4 10.24900
Ambient 4 14.34250Sig. 1.000 .233 1.000 1.000
Table F.5.15: Multiple comparisons of 2-methoxy-cinnamaldehyde
Temperature N Subset for alpha = 0.051 2 3 4
40 4 .2157550 4 .2460045 4 .2722535 4 .28400
Ambient 4 .92250Sig. 1.000 1.000 .295 1.000
Table F.5.16: Multiple comparisons of benzyl Benzoate
Temperature N Subset for alpha = 0.051 2 3
45 4 .6675050 4 .7330040 4 .7580035 4 .98125
Ambient 4 2.14775Sig. .193 1.000 1.000
Click h
ere to
buy
ABB
YY PDF Transformer 2.0
www.ABBYY.comClic
k here
to buy
ABB
YY PDF Transformer 2.0
www.ABBYY.com