Effect of Intake Air Temperature, Pressure And Fuel Injection ...
25
Page 1/25 Effect of Intake Air Temperature, Pressure And Fuel Injection Pressure On Low Temperature Combustion (LTC) Engine BY Using Dual Injection Strategy For Pollution Reduction Bharathiraja Moorthy ( [email protected] ) Bannari Amman Institute of Technology https://orcid.org/0000-0003-1021-1840 Nithyanandhan Kamaraj Kongu Engineering College Somasundaram Periasamy Kongu Engineering College Saji Raveendran Padmavathy Kongu Engineering College Gaurav Dwivedi Maulana Azad National Institute of Technology Ranjithkumar Subramaniam Kongu Engineering College Research Article Keywords: Low temperature combustion, split injection, injection pressure, injection angle, air fuel charge temperature Posted Date: July 8th, 2021 DOI: https://doi.org/10.21203/rs.3.rs-593550/v1 License: This work is licensed under a Creative Commons Attribution 4.0 International License. Read Full License
-
Upload
khangminh22 -
Category
Documents
-
view
3 -
download
0
Transcript of Effect of Intake Air Temperature, Pressure And Fuel Injection ...

Page 1/25
Effect of Intake Air Temperature, Pressure And FuelInjection Pressure On Low Temperature Combustion (LTC)Engine BY Using Dual Injection Strategy For PollutionReductionBharathiraja Moorthy ( [email protected] )
Bannari Amman Institute of Technology https://orcid.org/0000-0003-1021-1840Nithyanandhan Kamaraj
Kongu Engineering CollegeSomasundaram Periasamy
Kongu Engineering CollegeSaji Raveendran Padmavathy
Kongu Engineering CollegeGaurav Dwivedi
Maulana Azad National Institute of TechnologyRanjithkumar Subramaniam
Kongu Engineering College
Research Article
Keywords: Low temperature combustion, split injection, injection pressure, injection angle, air fuel charge temperature
Posted Date: July 8th, 2021
DOI: https://doi.org/10.21203/rs.3.rs-593550/v1
License: This work is licensed under a Creative Commons Attribution 4.0 International License. Read Full License
Page 2/25
AbstractStarting from the invention of engines, automobiles require engines for their application. Even though several alternativeshave been proposed like fuel cells, engines play the vital role in the automobile sector. In this scenario, the emissionscoming out from the engine contributes to the global air pollution at an unbelievable rate. This led the government toenforce strict emission regulations on automobiles. To achieve those regulations several ideas have been proposed sofar, which are generally classi�ed into two categories as in-cylinder measures and after-treatment measures. But the thingis after-treatment measures are too costly and also it mainly depends on combustion rate. So obviously in-cylindercontrols will be the potential area for the research. Automobile sector not only focused on emissions; it also wants highthermal e�ciency in engine. Due to high thermal e�ciency and good fuel economy diesel engines are the favorite one inautomobiles. But it emits NOx and PM at higher rate. To overcome this issue low temperature combustion (LTC) conceptis introduced, added to the objective it can also maintain high thermal e�ciency as like as diesel combustion. Theproblem regarding to LTC are combustion phasing control, transient operations, limited operating range and mainly itcontributes to HC and CO emissions while concentrating on reduction of NOx and PM. In the present work, controlemissions and combustion phasing of LTC combustion concept by dual injection strategy was studied and the effect offuel injection pressure, intake air temperature and pressure also studied. The project was done only on partial load withdiesel as fuel. Late injection strategy of LTC was used. Results shown that compared to single injection strategy, thermale�ciency was improved by dual injection strategy. Pilot injection timing and mass fraction played a vital role incontrolling emissions and improving thermal e�ciency. In all intake air temperature, if fuel injection pressure increaseresult in increase of thermal e�ciency, NO emission and decrease of smoke, CO and HC emissions. Likewise in all intakeair temperature and fuel injection pressure, if Intake air pressure increase result in increase of thermal e�ciency, smokeand decrease of NO, HC and CO emissions. Maximum Indicated thermal e�ciency achieved was 38% which was 8%higher than base readings. Lowest NO emission achieved was 187 ppm, that was 68% less than base reading. Lowestsmoke achieved was 3% of opacity, which was 75% less than base reading. An overall comparing result, optimized fuelinjection pressure is 600 bar, intake air temperature is 310 K, intake air pressure is 107 kPa. At that condition, smokereduced to 23%, NO reduced to 63%, CO reduced to 75% and indicated thermal e�ciency increased to 4% compare tobase readings.
IntroductionIn the 21st century, automobiles are extensively used. Conventional fuels like diesel and gasoline demands are increasedday by day and in future, demand reaches peak level. In present, fuel cost also increasing and people also focus onreduction of greenhouses gases. This put pressure to evolve new engine technology with an engine having highe�ciency. Already, diesel engines (CI Engine) having high e�ciency than petrol engines (SI Engine). so people areworking more on diesel Engines (CI Engine). Major CI engine emissions are NOx and soot. Owing to their harmful effectson the atmosphere as well as on human health, pollutants emitted by engines are a major concern. In addition, existingand future regulations set down strict standards on exhaust emissions.
Current advance CI engine does not withstand these emission norms, so the only way is to go for alternate combustiontechnology like HCCI (Homogeneous Charge Compression Ignition engine), PCCI (Partial /Premixed Charge CompressionIgnition engine), RCCI (Reactive Controlled Compression Ignition) and LTC (Low-Temperature Combustion). Euro normsare shown in Fig. 1.1, it clearly denotes how NOx and soot have been narrow down. LTC combustion technology operatesat low temperature and forms homogeneous charge mixture of air and fuel which reduce both NOx and sootsimultaneously.Presently a day, a few US inquire about lab generally supported by U.S. O�ce of Vitality (U.S. DOE) areclosely included in LTC combustion investigate. For occurrence Argonne National Lab (ANL), Sandia National Lab (SNL),Lawrence Barkley National Lab [LBNL] and Oak Edge, National Lab (ORNL) are among the foremost noteworthy, but thereare few challenges to overcome in case this innovation wanted to execute it within the future.
Page 3/25
John E. Dec (2009) explored in-cylinder forms in progressed compression-ignition engines and provide progressedcompression-ignition (CI) engines give both tall e�ciencies and exceptionally moo NOX and particulate (PM) out�ows.E�ciencies are comparable to customary diesel engines, but not at all like customary diesel engines, the charge isprofoundly weakened and premixed (or in part premixed) to realize moo emanations. Weakening is �nished by workingeither incline or with huge sums of EGR. To get weaken LTC, this approach depends on tall levels of EGR, and injectiontiming is ordinarily moved 10–15CA prior or afterward than for customary diesel combustion so temperatures are lower,which delays start and gives more time for premixing. In spite of the fact that these progressed CI combustion modeshave vital preferences, there are troubles in executing them in down to earth engines. Advance in this article surveyed thestandards of HCCI and diesel LTC engines alongside the comes about of investigating on the in-cylinder forms,overcoming the most challenges confronting these engines, counting: progressing low-load combustion pro�ciency,expanding the high-load restrain, understanding fuel impacts, and keeping up moo NOX and PM out�ows over theworking extend. Santiago Molin et al (2005) examined the Low Temperature Combustion of Light-Duty Diesel Enginesand clarify the possibility of getting moo temperature mixing-controlled combustion (mixing-controlled LTC) in a littleHSDI engine with the objective of maintaining a strategic distance from concurrent NOx and sediment arrangement. Thismixing-controlled LTC methodology is based on decreasing the comparability proportion at the lift-off cross-sectionconjointly the nearby combustion temperatures but keeping up the customary diesel shower structure. Assist aparametric think about also carried out to assess the impacts of in-cylinder gas thickness, temperature, and oxygenconcentration on the characteristics of the mixing-controlled LTC characteristics. Moo NOx and moo sediment mixing-controlled diesel combustion have been accomplished by combining moo in-cylinder gas temperatures along with talldiscuss densities and moo oxygen concentrations. Xingcai Lu et al (2015) looked into Fuel plan and administration forthe control of progressed compression-ignition combustion modes and clari�ed the foremost unmistakable characteristicof unused combustion modes, such as Homogenous-Charge Compression-Ignition (HCCI), Strati�ed-ChargeCompression-Ignition (SCCI), and Low-Temperature Combustion (LTC), is the prerequisite of making a homogenous blendor controllable strati�ed blend earlier to start and incline fuel/air blend and/or a controllable tall level of debilitate gasdistribution (EGR) are utilized to drag out the timescale of the start chemistry and harbour fuel injection or early in-cylinder injection is utilized to stretch the blending period. The blend at that point experiences controlled self-ignitionclose the beat dead centre (TDC) position due to the compression impact of the piston’s upward development.It is worthnoticing that the complete combustion preparation needs a coordinated strategy for the control of start timing andcombustion rate, which are instep controlled basically by chemical energy and, to a lesser degree, by turbulence andblending. Since of the noteworthy impacts of fuel physical, chemical properties on the start and combustion handle, fueldesign and administration has ended up the foremost common approach for the control of start timing and combustionrate in such progressed combustion modes, at long last summarizes the concepts and strategies of fuel plan andadministration and gives a diagram of the impacts of these techniques on start, combustion, and emanations for HCCI,LTC, and SCCI engines. LTC has three sorts of fuel injection procedures. D. Ganesh et al (2013) was conducted anexploratory Examination of the Homogeneous Charge Compression Start Combustion of Biodiesel Fuel with OutsideBlend Arrangement in a CI engine. Fuel was infused in the harbour itself. The test was conducted on the single cylindercoordinate injection diesel engine with a consistent speed of 1500 rpm and performed at a changing stack. The fuelutilized was jatropha methyl ester and this fuel has a tall oxygen substance. Fuel vaporizer framework was utilized tocreate fuel discuss blend remotely. Cooled EGR utilized up to 30% comes approximately found that HC and COoutpourings were lower compared to standard due to the closeness of oxygen inside the fuel structure itself and warmeffectiveness, BMEP decreased since of fuel divider wetting inside the harbour and spatial combustion within thecylinder. Pranab Das et al (2015) explored the impact of fundamental injection timing for controlling the combustionstaging of a homogeneous charge compression start engine employing a modern double injection methodology. The trywas conducted on a Single cylinder CI engine with a coordinate injection at steady speed 1350 rpm and injection weightat 200 bars.Fuel used was commercial diesel. Dual injection strategies were used, the �rst injection was injected too early270 deg. bTDC had 80% of fuel volume and second injection at varying crank angle 26, 23, 20, 17, 14, 11, 8° CA bTDC

Page 4/25
had remaining fuel volume. The test took at diverse stack 45% and 60% and comes about were compared withcustomary diesel operation. The comes about appeared that impeding of the moment injection, Top weight diminishesfor both loads. PRR and HRR shift towards TDC and reduced its value. Combustion duration reduced up to the secondinjection 14° CA bTDC than increased. Starts of combustion highly depended on injection timing at 45% load and at 60%load it highly depended on premixed equivalence ratio. Engine with 45% load HC and CO increase due to fuel and airmixture enter into crevice volume and combustion took at low temperature. HC and CO emission was normally foundhigher in all operating condition. The try incorporates a downside as Lower brake warm pro�ciency, Higher BSFC, HC, andCO out�ows than the pattern.Ali Turkcan et al(2013)also investigated early injection but fuels used were gasoline andalcohol blend E10 (Ethanol 10%), E20 (Ethanol 20%), M10 (Methanol 10%) and M20 (Methanol 20%). gasoline andalcohol. The test was conducted on single cylinder engine with direct injection at a constant speed of 1100+-20 rpm andhad intake air temperature 100°C and injection pressure at 10Mpa. Dual injection strategies were used, the �rst injectionat 240° CA bTDC had 80% of fuel volume and second injection at varying crank angle 15, 20, 25, 30° CA bTDC. The testtook at two proportionality proportions 45% and 60% and comes about were compared with customary diesel operation.The comes about appeared that the combustions and out�ows were controlled by the moment injection, in all testconditions and �lls utilized. Expanding ethanol mix would diminish most extreme weight, PRR, HRR, and NOx values andit impedes timing of begins of combustion, most extreme weight area, and CA 50 at moo and tall comparabilityproportion. Expanding Methanol mix would raise the greatest weight, PRR, HRR, and NOx values and it progressed timingof begins of combustion, the greatest weight area, and CA 50 at moo and tall proportionality proportion. PRR of liquormix was closer to thump restrain at tall proportionality proportion. Liquor mixes had shorter combustion length at tallproportionality proportion and long combustion length at moo comparability proportion. HC and CO were in�uenced lessby the moment injection compared to NOx and smoke. Lower NOx, HC, CO, out�ow, and higher IMEP and warmproductivity were accomplished by utilizing ideal moment fuel injection timing for liquor mixes at moo comparabilityproportion. The smoke of liquor mixes was lower than gasoline for impeding moment injection and higher than gasolinefor progress moment injection. NOx decreased without a drop in IMEP and warm pro�ciency for all test fuels. K.Mathivananet al (2016)explored the Impact of numerous fuel injection procedures on execution and combustioncharacteristics of a diesel-fuelled HCCI engine. The test was conducted on 4- cylinder engine at consistent speed 1800rpm, consistent stack 3 bars (IMEP), and injection weight 1200 bar (add up to a term of fuel injection 1765+-1microsecond), and with admissions weight and temperature 1bar and 25° C. Fuel used was commercial diesel. Multiplefuel injection technique was used. The fuel injected in �ve pulses with timing start from 100° CA bTDC and other pulsesinjected in regular interval of 10° CA after previous injection. There were two phases of experiments were conducted. Inphase 1, �rst pulse duration changed in the sequence of 274, 304 and 334 micro second with varying late pulse timing inthe manner of 20,10,0 CA bTDC. In phase 2, late pulse duration changed in the sequence of 274, 304 and 334 microsecond with varying late pulse timing in the manner of 20,10,0° CA bTDC. Results were compared to single injection HCCIand conventional diesel mode. In phase 1 results, as �rst injection duration raises HRR reduced its value and retard itstiming, NOx and soot emissions got reduced, HC got reduce with increase in injection duration and HC increase withretard late injection timing. In phase 2, HRR was half of the phase 1 value. Combustion in phase 2 got advanced, NOx gotraise its value when injection duration increases and NOx got reduced with retard late injection timing. HC and CO gotreduced with an increase in injection duration and both got an increase when injection timing got retard. Overall, thethermal e�ciency of multiple injections was higher than single injection but lower than conventional injection. HC, CO,NOx and Smoke of multiple injections were lower than a single injection. Finally, experiment suggested that multipleinjections were better than a single injection.
The main challenges faced on LTC are Controlling Combustion Phasing, Limited Load range operation, Transient controlof operation, High level of HC and CO emissions and Fuel characteristics. In this combustion phasing was controlled byusing dual injection and by multiple injection on LTC that result in bring up loss of thermal e�ciency happened duringLTC operation. High level of HC and CO emissions also controlled by changing some parameters like intake air

Page 5/25
temperature, pressure, geometry of engine and injection pressure and spray angle. Myung Yoon Kim A and Chang Sik LeeB (2007)too explored early injection but in arrange to decrease HC and CO out�ows, divider wetting ought to be dodged,for that fuel injection weight utilized was kept at 100Mpa and fuel splash point was kept at 60°. The test was conductedon a single cylinder CI engine with a coordinate injection at a consistent speed of 1500 rpm and compression proportionof 15:1. Dual injection strategy was used in three modes of operations. In the �rst mode, a second injection (fuel injected25% by mass) was injected at a constant timing at 10° CA aTDC and �rst injection (fuel injected 75% by mass) wasinjected in varying crank angle 50, 60, 70° CA bTDC. The moment mode of operation the primary injection was settled at60° CA bTDC and the moment injection changed from TDC to 20° CA aTDC. The ultimate mode of operation the primaryinjection was settled at 70° CA bTDC and moment injection was shifted from TDC to 20° CA aTDC. Results obtainedusing three mode of operation were higher IMEP was found with later �rst and early second injection timing that is �rstinjection at 50° CA bTDC and second injection at TDC, advance the �rst injection would decrease IMEP because fuel wallwetting, IMEP decreased by retarding the second injection because shifting diffusion combustion to later side, COV IMEPincreased when retarding second injection timing beyond 15° CA aTDC CO, HC emissions, and ISFC were increasedsteeply when �rst injection timing advance. HC diminished at to begin with injection timing settled at 50° CA bTDC andimpede moment injection timing since retard the moment injection effectively burned remains HC show within the, tobegin with, injection. HC expanded at, to begin with, injection timing settled at 70° CA bTDC and hinder moment injectiontiming since charge temperature was as well moo to burn the moment injection. Development moment injection timingdiminishes CO. NOx diminishes with early, to begin with, injection and hinders the moment injection. At long lastcomparing all come about for way better IMEP and controlled emanations, ideal to begin with injection timing was at50°CA bTDC and moment injection timing was at afterward TDC or to begin with injection timing at 60°CA bTDC andmoment injection at early. Changhwan Woo et al (2016)investigated the effect of intake air temperature and common-railpressure on ethanol combustion in a single-cylinder light-duty diesel engine. The experiment was conducted on Singlecylinder direct injection CI engine with constant speed 2000 rpm and BMEP of 426kPa, fuel used was ethanol. Dualinjection strategies were used, the �rst injection injected at 170° CA bTDC (80% by volume) and second injection injectedat 3° CA bTDC. First intake air temperature varied like 70, 80, 100° C and kept injection pressure constant at 50 MPa, testwas conducted. Second fuel injection pressure varied like 50, 70, 100 MPa and kept intake air temperature constant at80° C, test was conducted. Increase intake air temperature would increase peak pressure, HRR, improve engine e�ciencyand it also decrease HC, CO emission, and BSFC but smoke and NOx slightly increased but lower than conventional dieseloperation. Increase injection pressure would increase peak pressure, HRR, BSFC, HC, CO and Smoke, NOx emission. Fromall results found that intake air temperature 80° C and injection pressure 50 MPa was optimum operating condition. CanCinar Aet al (2015)explored impacts of admissions discuss temperature on combustion, execution, and emissioncharacteristics of an HCCI motor fuelled with the mixes of 20% n-heptane and 80% isooctane powers? The test wasconducted on single cylinder port injection with a steady speed of 1200 rpm. The fuel utilized was 20% n-heptane’s and80% isooctane. The test was conducted by changing the intake air temperature from 40 to 120° C in two lambda regard0.6 and 0.7. Results found that increment admissions discuss temperature would increment PRR, HRR, in-cylindertemperature, and top weight and quicken a chemical response. Start timing and combustion were overwhelmed by in-cylinder gas temperature, weight, and blend composition. Increment admissions discuss temperature would diminish Topesteem of LTR, Combustion length decreased due to quickening a chemical response, SFC and NOx expanded at highertemperature due to progressed combustion (i.e.,) SOC absent from TDC and CO out�ows increment to begin with at thatpoint begun to decrease.
S. Swami Nathan et al (2010) examined the impacts of charge temperature and deplete gas re-circulation on combustionand emission characteristics of acetylene fuelled HCCI engine. The test was conducted on the single-cylinder engine thathad a port injection with consistent speed 1500 rpm and infusion weight of 220 bars. The fuel utilized as acetylene. HotEGR was recycled by the external pipe. The experiment was conducted by shifting admissions charge temperature from40°C-110°C to found the best esteem for each BMEP. Increasing intake charge temperature leads to increase thermal

Page 6/25
e�ciency than baseline. HC emissions decrease with increment in admissions air temperature and HC emissionsincrement with an increment in EGR %. CO out�ows were exceptionally low compared to the pattern at tall BMEP. At mooBMEP CO emanations were high and increment with increment EGR%. The warm productivity of the engine wascontinuously higher than the pattern with optimum charge temperature and EGR. Mustafa Canakci et al (2008)conducted an exploratory think about the impacts of boost weight on the performance and exhaust emissions of a DI-HCCI gasoline engine. The test was conducted on a single cylinder coordinate injection motor with steady injectionpressure 10 MPa (splash point 60), admissions discuss temperature 119°C, proportionality proportion 0.22 but shiftingspeed. The fuel utilized as gasoline. Intake air pressure varied as 101, 117, and 138 kPa, and injection timing shifted from336 to 72° CA bTDC test was conducted. Results shown that increasing boost pressure would increase torque, increasedpower, BSFC reduced, combustion e�ciency decreased and thermal e�ciency increased. Start of combustion advancedwhile increasing boost pressure.
Experimental SetupEngine used for the experiment was Kirloskar TAF1 model single cylinder, four-stroke air-cooled direct injection, dieselengine with a displacement volume of 661 cm3, developing 4.4 kW at 1500 rpm. The engine speci�cations are given inTable 2.1. Direct fuel injection well equipped with separate electronic control units was attached with the engine.
Engine speci�cation
Table 2.1
Engine speci�cation
Name of the enginemanufacturer
KIRLOSKAR OIL ENGINES LTD
Type of Engine Vertical, 4 stroke cycle, single acting, totally closed, high speed, Compression ignitiondiesel engine
No.of Cylinder 1
Bore 87.5 mm
Stroke 110 mm
Cubic capacity 661.5 cm3
Nominal Compression Ratio 17.5:1
Power output 4.7 kW@1500 rpm
Speci�c Fuel Consumption 265 g/kWh
Method of cooling Air cooled
Valve timingIVO bTDCIVC ABDCEVO BBDCEVC aTDC
4.535.535.53.5
The test engine furnished with AVL Data Acquisition System and PID controlled preheater system. Cylinder pressure wasmeasured with AVL in-cylinder pressure transducer in combination with AVL charge ampli�er. Optical AVL crank angleencoder was �xed to measure Crank angle. HFM 5 air �ow sensor was �tted to measure Intake air �ow. The intake and
Page 7/25
exhaust system surge tanks were equipped with K-type thermocouple for measuring temperature. The manifoldtemperature and Pressure were measured using bosch manifold air pressure sensor.
The AVL model 437c smoke meter was used for measuring Smoke. All gaseous emissions measurements were measurewith an AVL 444 Di-gas Analyser which is shown in the Fig. 2.1.Engine operation
Initially, the stationary engine had only mechanical fuel supply system which was converted into electronic fuel supplysystem and also it had injector, positioned in inclined which also converted into vertical. Readings were taken from theengine equipped with electronic fuel supply system with vertical positioned injector and best reading from that was takenas base reading for further comparison. LTC concept was introduced to reduce both NOx and smoke. It has three typemethods to implement LTC in normal stationary engine, fueled with diesel. They are port injection, early injection and lateinjection. In this project late injection strategy was implemented. First in order to �nd the injection timing which wassuitable for LTC, injection timing was retarded from normal base reading. After that injection timing which had low NOx
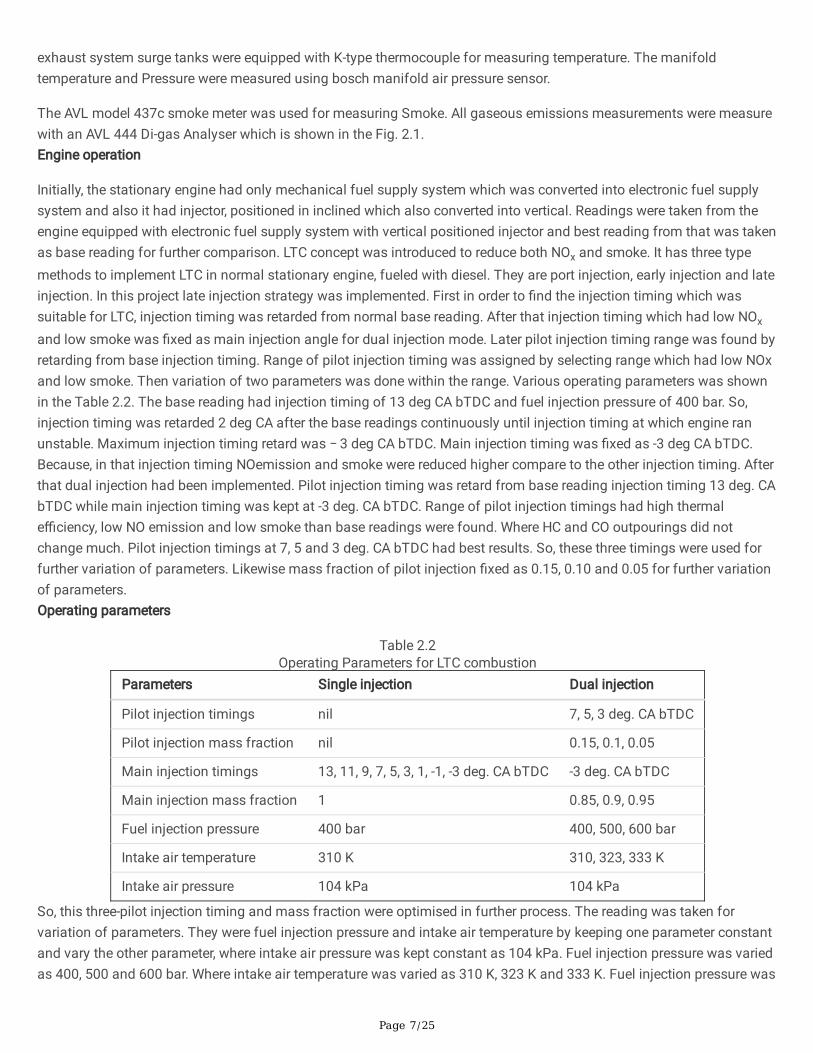
and low smoke was �xed as main injection angle for dual injection mode. Later pilot injection timing range was found byretarding from base injection timing. Range of pilot injection timing was assigned by selecting range which had low NOxand low smoke. Then variation of two parameters was done within the range. Various operating parameters was shownin the Table 2.2. The base reading had injection timing of 13 deg CA bTDC and fuel injection pressure of 400 bar. So,injection timing was retarded 2 deg CA after the base readings continuously until injection timing at which engine ranunstable. Maximum injection timing retard was − 3 deg CA bTDC. Main injection timing was �xed as -3 deg CA bTDC.Because, in that injection timing NOemission and smoke were reduced higher compare to the other injection timing. Afterthat dual injection had been implemented. Pilot injection timing was retard from base reading injection timing 13 deg. CAbTDC while main injection timing was kept at -3 deg. CA bTDC. Range of pilot injection timings had high thermale�ciency, low NO emission and low smoke than base readings were found. Where HC and CO outpourings did notchange much. Pilot injection timings at 7, 5 and 3 deg. CA bTDC had best results. So, these three timings were used forfurther variation of parameters. Likewise mass fraction of pilot injection �xed as 0.15, 0.10 and 0.05 for further variationof parameters.Operating parameters
Table 2.2Operating Parameters for LTC combustion
Parameters Single injection Dual injection
Pilot injection timings nil 7, 5, 3 deg. CA bTDC
Pilot injection mass fraction nil 0.15, 0.1, 0.05
Main injection timings 13, 11, 9, 7, 5, 3, 1, -1, -3 deg. CA bTDC -3 deg. CA bTDC
Main injection mass fraction 1 0.85, 0.9, 0.95
Fuel injection pressure 400 bar 400, 500, 600 bar
Intake air temperature 310 K 310, 323, 333 K
Intake air pressure 104 kPa 104 kPa
So, this three-pilot injection timing and mass fraction were optimised in further process. The reading was taken forvariation of parameters. They were fuel injection pressure and intake air temperature by keeping one parameter constantand vary the other parameter, where intake air pressure was kept constant as 104 kPa. Fuel injection pressure was variedas 400, 500 and 600 bar. Where intake air temperature was varied as 310 K, 323 K and 333 K. Fuel injection pressure was
Page 8/25
limited to 600 bar because beyond that NO got increased and near to base reading. Likewise, intake air temperaturelimited to 333 K because beyond that smoke got increased above base reading.Engine Layout
The engine layout used in this research is shown in the Fig. 2.1. The eddy current dynamometer, combustionmeasurement, performance measurement and emission measurement are also indicated here.
Results And DiscussionsThe results and discussions of the experimental setup and testing is discussed in this chapter.
Optimization of main injection for LTC operation
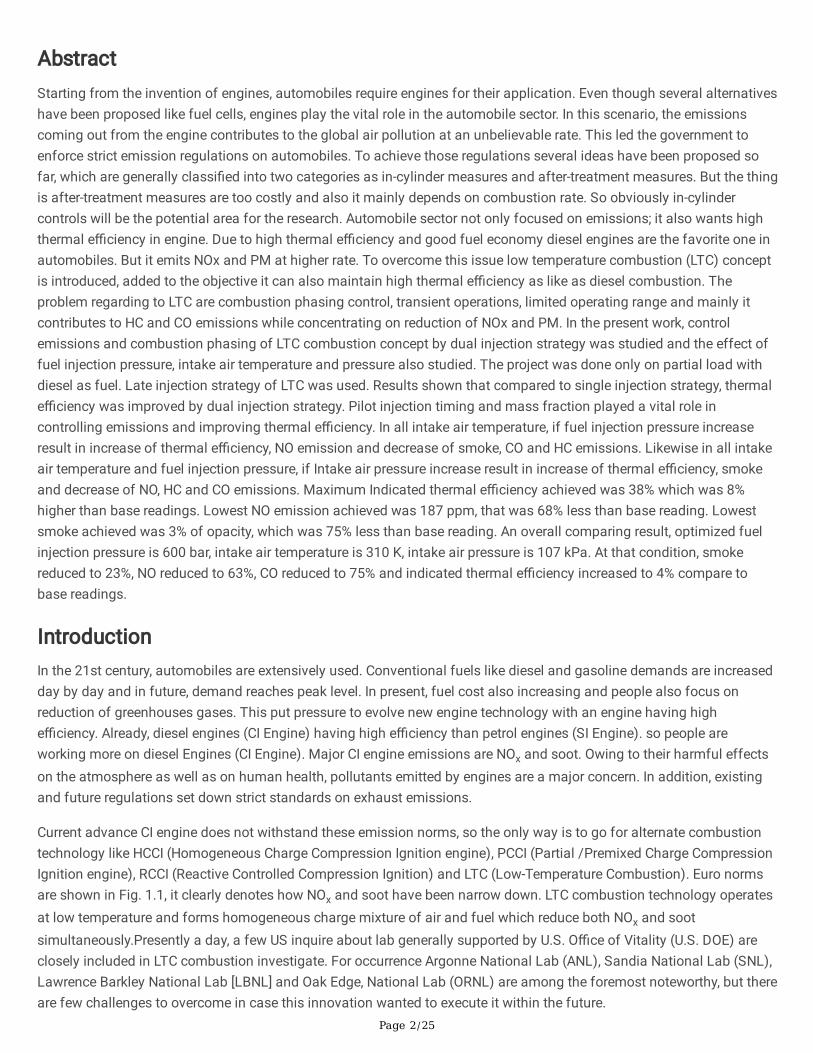
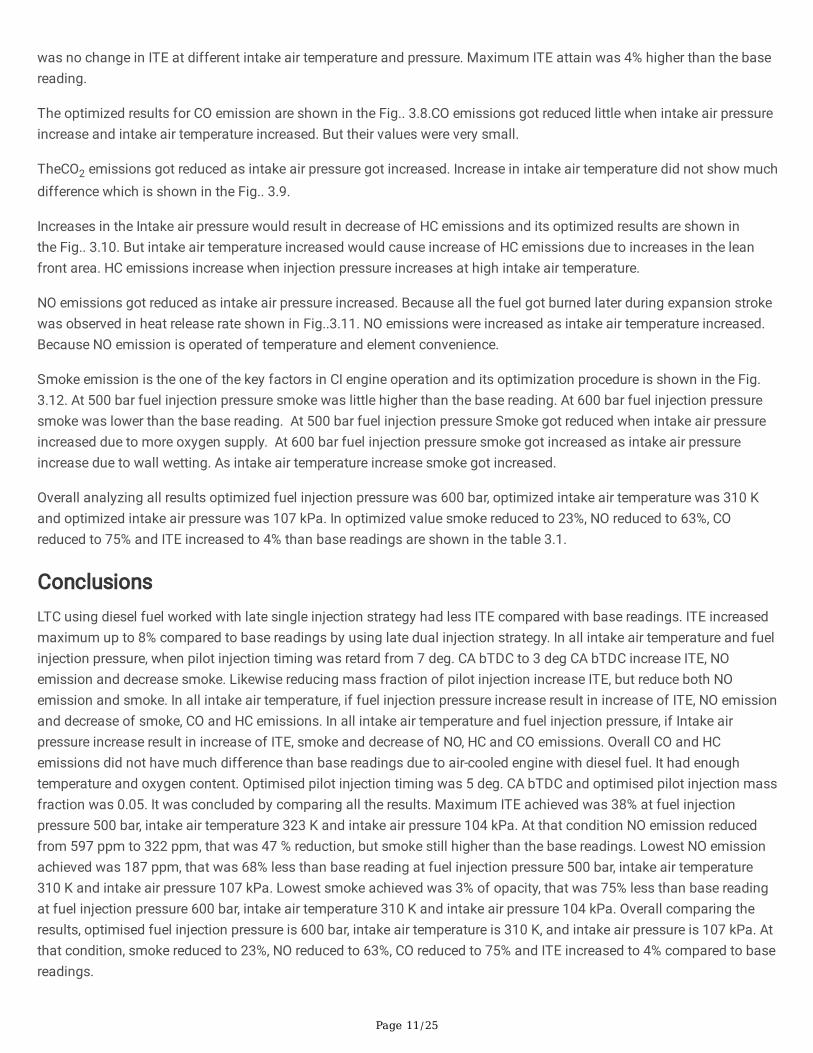
In-cylinder pressure and heat release rate were superimposed on the crank angle were appeared in Fig. 3.1.In-cylinderpressure were drop down as injection timing was retard, due to thermodynamic condition for combustion and duringcombustion already expansion stroke started which would reduce peak pressure. In Late injection, the combustion startsafter TDC, which also reduce the peak pressure in cylinder. Heat release rate show that as injection timing was retard,premixed combustion was raised more than the diffusion combustion because fuel injected had some ignition delay.Injection timing retard made the fuel to inject in low temperature and pressure which make longer ignition delay. PeakHRR was obtained on -3 deg CA bTDC due to high premixed combustion.
Indicated thermal e�ciency and emissions were shown in the Fig. 3.2.It shows that, when injection timing was retarded,the indicated thermal e�ciency got drop down because, injection fuel were burn during expansion stroke of piston atwhich temperature and pressure inside cylinder was low and it affects combustion. That cause fuel consumption moreresult in loss in indicated thermal e�ciency. Maximum loss of indicated thermal e�ciency was 2% from base readingwere observed.
Smoke got increased �rst when injection timing retarded up to 5 deg CA bTDC. After that it got reduced and reachedequal to the base reading. Smoke �rst increase due to local air fuel mixture was rich as mixing was not proper when fuelburns close to TDC. As injection retard further ignition delay increase which made fuel well mixed with air result inreduction in smoke. HC and CO emissions did not show much difference. Maximum HC emission was 6 ppm only.Reason for low HC and CO emissions was due to higher air fuel ratio and engine used was air cooled, heat release fromcylinder to atmosphere was low which maintain su�cient temperature inside cylinder. Since, vertical injector was usedwall wetting of fuel was reduced. CO2 emission increased as injection timing was retarded due to higher fuelconsumption. NO emission was reduced as injection retard due to low temperature of combustion. It was proved in manyliteratures.Comparing all the emissions, -3 deg CA bTDC had low NO emission and smoke. Though it had low thermale�ciency, would be increased on dual injection. So, -3 deg CA bTDC was kept as main injection timing for dual injection.
Optimization of pilot injection timing, mass fraction, intake air temperature and fuel injection pressure for LTC operation
Pilot injection timing was retard from base reading injection timing 13 deg. CA bTDC while main injection timing waskept at -3 deg. CA bTDC. Range of pilot injection timings had high thermal e�ciency, low NO emission and low smokethan base readings were found. Where HC and CO emissions did not change much. Pilot injection timings at 7, 5 and 3deg. CA bTDC had best results. So, these three timings were used for further variation of parameters. Likewise massfraction of pilot injection �xed as 0.15, 0.10 and 0.05 for further variation of parameters.
So, this three-pilot injection timing and mass fraction were optimised in further process. The reading was taken for twovariations of parameters. They were fuel injection pressure and intake air temperature by keeping one parameterconstant and vary the other parameter, where intake air pressure was kept constant as 104 kpa. Fuel injection pressure
Page 9/25
was varied as 400, 500 and 600 bar. Where intake air temperature was varied as 310 K, 323 K and 333 K. Fuel injectionpressure was limited to 600 bar because beyond that NO got increased and near to base reading. Likewise, intake airtemperature limited to 333 K because beyond that smoke got increased above base reading.
Indicated Thermal E�ciency Optimization
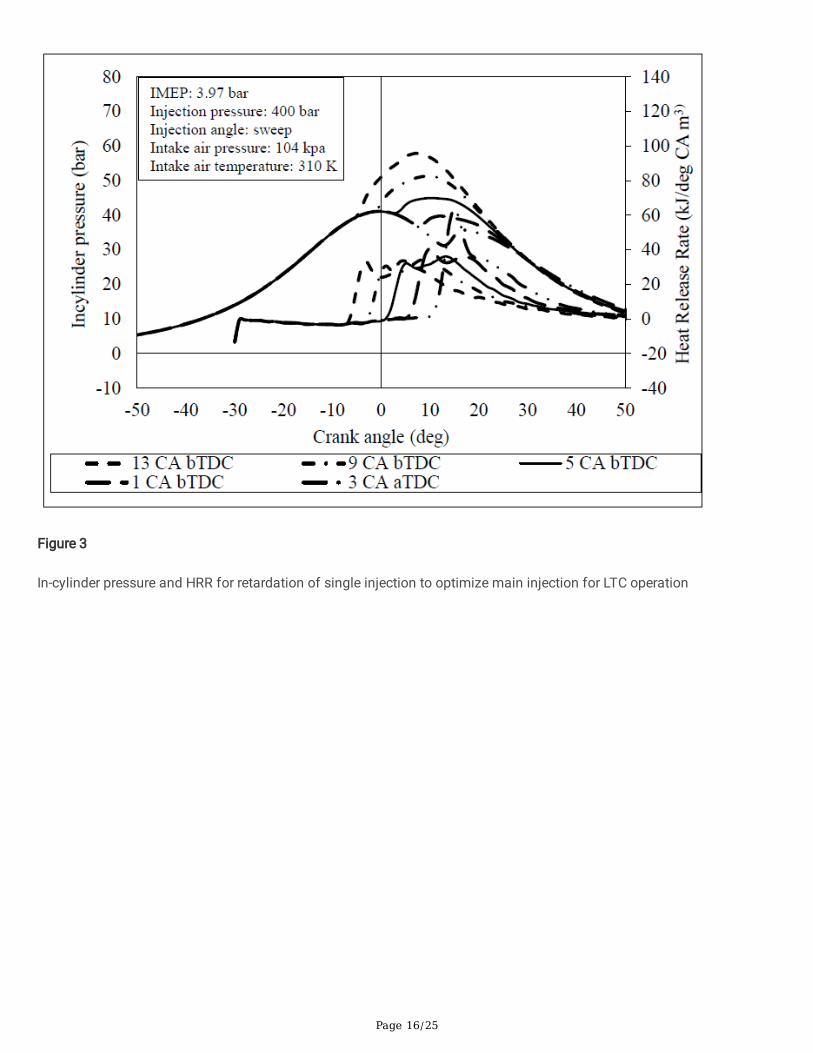
ITE for different injection pressure with respect to sweep in Start of injection angle 1(SOI-1) were shown in the Fig. 3.3. Inthat ITE got increased as fuel injection pressure was increased and also it increased when pilot injection timing retardfrom 7 deg. CA bTDC to 3 deg. CA bTDC. But it reduced as intake air temperature increased. The pilot mass fraction didnot affect more on the ITE. Maximum ITE got increased was 9% higher than the base readings. ITE got increased whenfuel injection pressure increased, due to good atomisation and well mixing of fuel, combustion e�ciency got increasedwhich reduce fuel consumption. It also shown Fig. 3.4, the cylinder pressure and HRR curve got increased as fuelpressure increased. Retard pilot injection timing increased ITE due to reducing the interval between pilot and maininjection timing which did not allow
Pilot injection heat release to waste that was completely used by main injection. So, HRR got increased in second pro�leas pilot injection timing retard, this was shown in Fig. 3.4 ITE got reduced as intake air temperature increased, becauseintake air temperature increase would cause air density to reduce which directly affect the amount oxygen enter into thecombustion chamber. Thus, due to less oxygen content combustion e�ciency got reduced which required more fuel forcombustion to attain same load and speed. This also affects reduction in cylinder pressure and HRR was shown in theFig. 3.4.
Combustion analysis by pilot injection, pilot injection mass, injection pressure, inlet temperature sweep
Cylinder pressure and HRR for pilot injection timing sweep were shown same trends while varying other parameters. So,for example sweep of pilot injection timing was shown in Fig. 3.4by kept all other parameters constant. Normally, HRRhad two curves, one was due to pilot injection and other was due to main injection. Likewise, cylinder pressure had twostep rises in pressure one due to pilot injection and other due to main injection. As pilot injection timing retard, �rst curverises of cylinder pressure reduced but second curve increased after 15 deg. CA aTDC. It also observed in HRR. HRR curvefor pilot injection and main injection was retard as pilot injection timing retard. But main injection HRR curve gotincreased as pilot injection timing got retard. Because interval between two injections was reduced that make maininjection fuel to use completely heat released from pilot injection fuel and made more combustion in main injection.
The pilot injection mass sweep in dual injection strategy keeping another parameter constant is shown in the Fig. 3.5. Itwas similar to pilot injection timing it had two curves in HRR, one due to pilot injection and other due to main injection.Pilot injection and main injection HRR curve increased as mass fraction of pilot injection increased. But start combustionremain constant. Cylinder pressure increased as mass fraction of pilot injection increased. Thus, the pilot injection massfraction increase causes higher temperature and pressure during main injection that increase combustion e�ciency andoverall cylinder pressure.
The intake air temperature sweep in dual injection keeping another parameter constant is shown in the Fig. 3.6. It alsohad two HRR curves. HRR curves decreased as intake temperature increased due to less oxygen. Likewise, cylinderpressure decreased as intake air temperature increased.
Fuel injection pressure sweep while keeping other parameters constant was shown in Fig. 3.7.It also had two HRR curves.Two curves increased as fuel injection pressure increased. Similarly, cylinder pressure increased as fuel injection pressureincreased due to good atomisation of fuel and well mixing. Combustion duration decreased as fuel injection pressureincreased.Emission analysis by pilot injection, pilot injection mass, injection pressure, inlet temperature sweep
Page 10/25
CO emission for varying four parameters pilot injection timing, pilot injection mass fraction, fuel injection pressure andintake air temperature was shown in Fig. 3.8.It clearly shown that CO emission decreased as fuel injection pressureincreased due to full utilisation of oxygen by well mixing. Likewise, CO emission decreased as pilot injection timing retardbut not that much. Pilot injection mass fraction variation did not show any difference in CO emission.
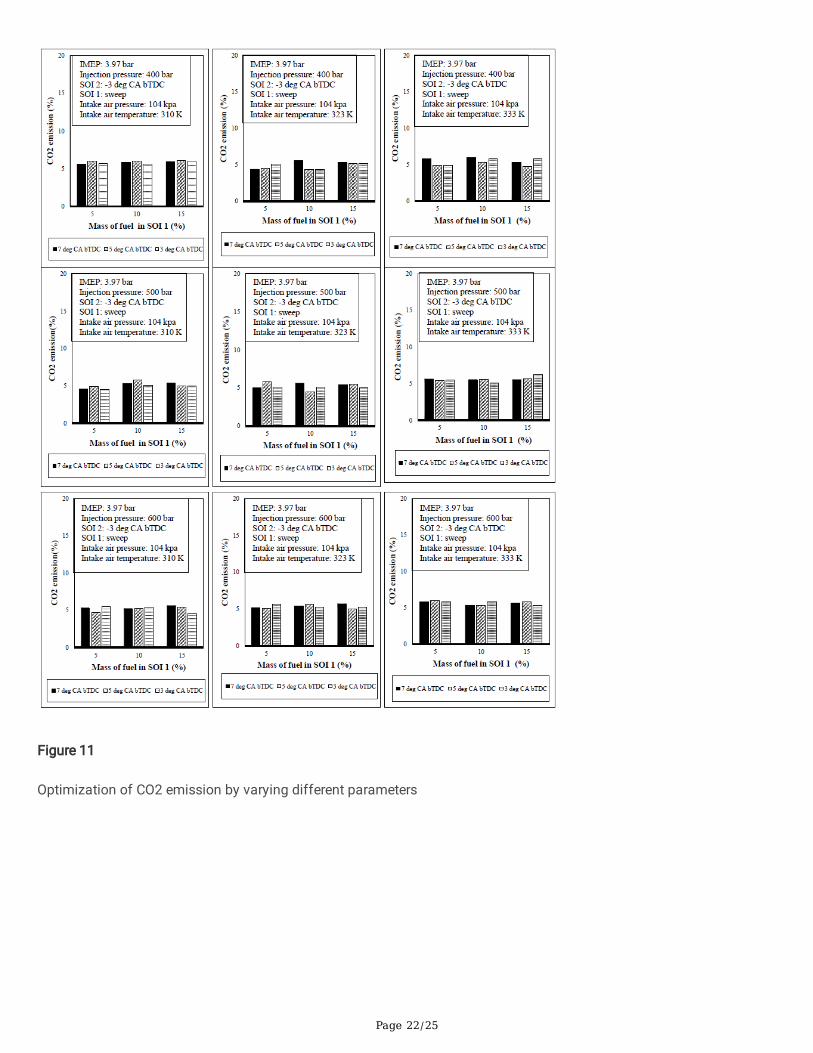
CO2 emission was shown in Fig. 3.9.In all that case did not shown any big difference, because CO2 emission isdepending upon fuel consumption and conversion of CO into CO2. Fuel consumption higher did not increase the CO2
emission. It was tally by CO emissions.
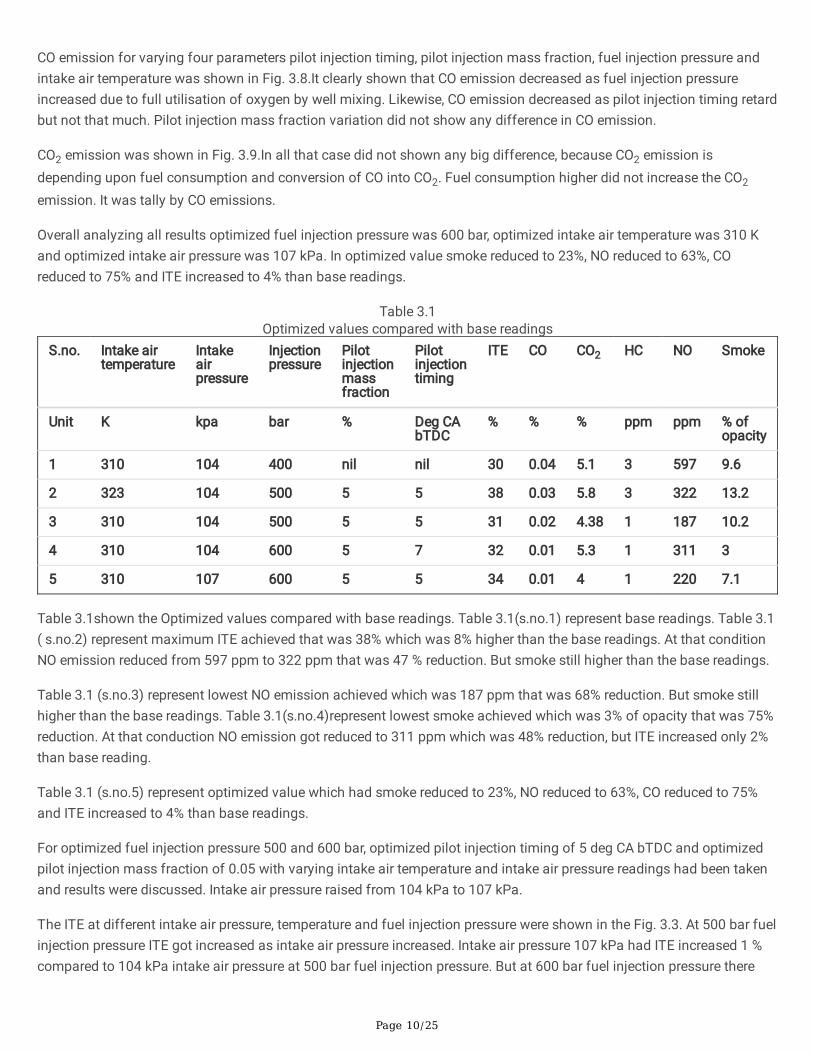
Overall analyzing all results optimized fuel injection pressure was 600 bar, optimized intake air temperature was 310 Kand optimized intake air pressure was 107 kPa. In optimized value smoke reduced to 23%, NO reduced to 63%, COreduced to 75% and ITE increased to 4% than base readings.
Table 3.1Optimized values compared with base readings
S.no. Intake airtemperature
Intakeairpressure
Injectionpressure
Pilotinjectionmassfraction
Pilotinjectiontiming
ITE CO CO2 HC NO Smoke
Unit K kpa bar % Deg CAbTDC
% % % ppm ppm % ofopacity
1 310 104 400 nil nil 30 0.04 5.1 3 597 9.6
2 323 104 500 5 5 38 0.03 5.8 3 322 13.2
3 310 104 500 5 5 31 0.02 4.38 1 187 10.2
4 310 104 600 5 7 32 0.01 5.3 1 311 3
5 310 107 600 5 5 34 0.01 4 1 220 7.1
Table 3.1shown the Optimized values compared with base readings. Table 3.1(s.no.1) represent base readings. Table 3.1( s.no.2) represent maximum ITE achieved that was 38% which was 8% higher than the base readings. At that conditionNO emission reduced from 597 ppm to 322 ppm that was 47 % reduction. But smoke still higher than the base readings.
Table 3.1 (s.no.3) represent lowest NO emission achieved which was 187 ppm that was 68% reduction. But smoke stillhigher than the base readings. Table 3.1(s.no.4)represent lowest smoke achieved which was 3% of opacity that was 75%reduction. At that conduction NO emission got reduced to 311 ppm which was 48% reduction, but ITE increased only 2%than base reading.
Table 3.1 (s.no.5) represent optimized value which had smoke reduced to 23%, NO reduced to 63%, CO reduced to 75%and ITE increased to 4% than base readings.
For optimized fuel injection pressure 500 and 600 bar, optimized pilot injection timing of 5 deg CA bTDC and optimizedpilot injection mass fraction of 0.05 with varying intake air temperature and intake air pressure readings had been takenand results were discussed. Intake air pressure raised from 104 kPa to 107 kPa.
The ITE at different intake air pressure, temperature and fuel injection pressure were shown in the Fig. 3.3. At 500 bar fuelinjection pressure ITE got increased as intake air pressure increased. Intake air pressure 107 kPa had ITE increased 1 %compared to 104 kPa intake air pressure at 500 bar fuel injection pressure. But at 600 bar fuel injection pressure there
Page 11/25
was no change in ITE at different intake air temperature and pressure. Maximum ITE attain was 4% higher than the basereading.
The optimized results for CO emission are shown in the Fig.. 3.8.CO emissions got reduced little when intake air pressureincrease and intake air temperature increased. But their values were very small.
TheCO2 emissions got reduced as intake air pressure got increased. Increase in intake air temperature did not show muchdifference which is shown in the Fig.. 3.9.
Increases in the Intake air pressure would result in decrease of HC emissions and its optimized results are shown inthe Fig.. 3.10. But intake air temperature increased would cause increase of HC emissions due to increases in the leanfront area. HC emissions increase when injection pressure increases at high intake air temperature.
NO emissions got reduced as intake air pressure increased. Because all the fuel got burned later during expansion strokewas observed in heat release rate shown in Fig..3.11. NO emissions were increased as intake air temperature increased.Because NO emission is operated of temperature and element convenience.
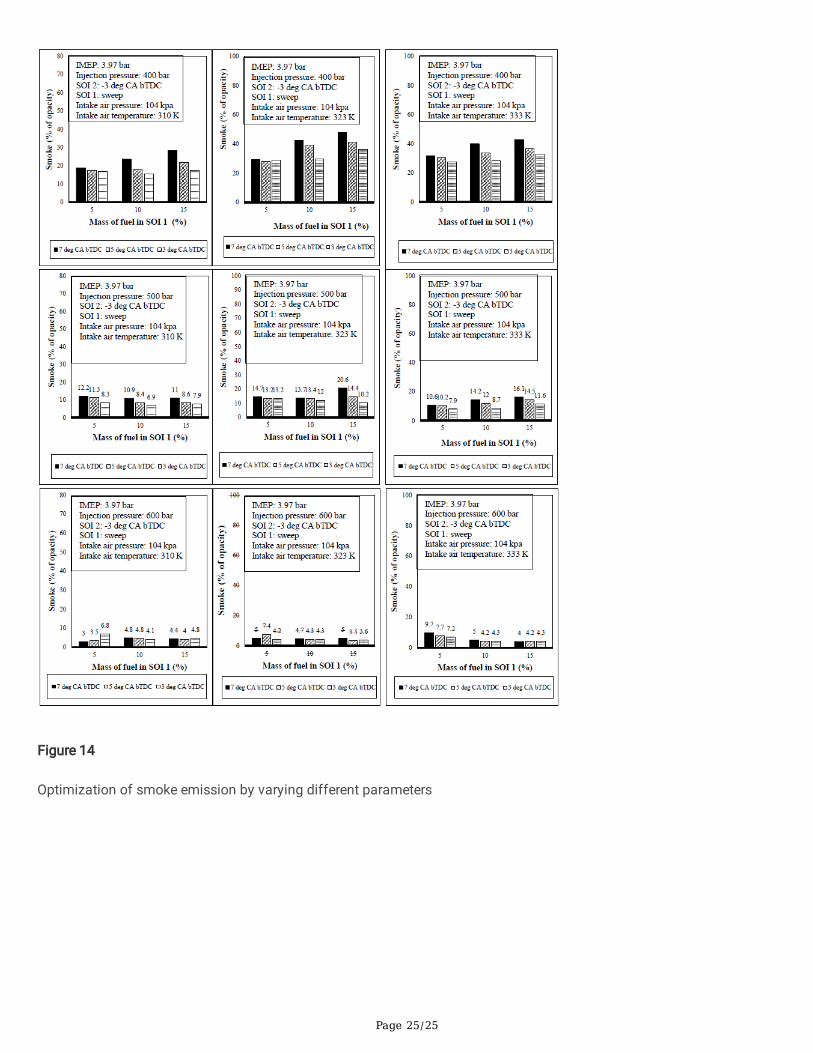
Smoke emission is the one of the key factors in CI engine operation and its optimization procedure is shown in the Fig.3.12. At 500 bar fuel injection pressure smoke was little higher than the base reading. At 600 bar fuel injection pressuresmoke was lower than the base reading. At 500 bar fuel injection pressure Smoke got reduced when intake air pressureincreased due to more oxygen supply. At 600 bar fuel injection pressure smoke got increased as intake air pressureincrease due to wall wetting. As intake air temperature increase smoke got increased.
Overall analyzing all results optimized fuel injection pressure was 600 bar, optimized intake air temperature was 310 Kand optimized intake air pressure was 107 kPa. In optimized value smoke reduced to 23%, NO reduced to 63%, COreduced to 75% and ITE increased to 4% than base readings are shown in the table 3.1.
ConclusionsLTC using diesel fuel worked with late single injection strategy had less ITE compared with base readings. ITE increasedmaximum up to 8% compared to base readings by using late dual injection strategy. In all intake air temperature and fuelinjection pressure, when pilot injection timing was retard from 7 deg. CA bTDC to 3 deg CA bTDC increase ITE, NOemission and decrease smoke. Likewise reducing mass fraction of pilot injection increase ITE, but reduce both NOemission and smoke. In all intake air temperature, if fuel injection pressure increase result in increase of ITE, NO emissionand decrease of smoke, CO and HC emissions. In all intake air temperature and fuel injection pressure, if Intake airpressure increase result in increase of ITE, smoke and decrease of NO, HC and CO emissions. Overall CO and HCemissions did not have much difference than base readings due to air-cooled engine with diesel fuel. It had enoughtemperature and oxygen content. Optimised pilot injection timing was 5 deg. CA bTDC and optimised pilot injection massfraction was 0.05. It was concluded by comparing all the results. Maximum ITE achieved was 38% at fuel injectionpressure 500 bar, intake air temperature 323 K and intake air pressure 104 kPa. At that condition NO emission reducedfrom 597 ppm to 322 ppm, that was 47 % reduction, but smoke still higher than the base readings. Lowest NO emissionachieved was 187 ppm, that was 68% less than base reading at fuel injection pressure 500 bar, intake air temperature310 K and intake air pressure 107 kPa. Lowest smoke achieved was 3% of opacity, that was 75% less than base readingat fuel injection pressure 600 bar, intake air temperature 310 K and intake air pressure 104 kPa. Overall comparing theresults, optimised fuel injection pressure is 600 bar, intake air temperature is 310 K, and intake air pressure is 107 kPa. Atthat condition, smoke reduced to 23%, NO reduced to 63%, CO reduced to 75% and ITE increased to 4% compared to basereadings.

Page 12/25
Scope For The Future WorkThe scope for the future work of this research is given below.
Experiment can be performed beyond 50% load because optimization is very di�cult at higher load engineoperation.
Multiple late injections strategy on LTC can be studied because that helps for regeneration of diesel particulate �lter.
In this research multiple injection strategy performed only for diesel but this can be performed for alternative fuelson dual injection strategy.
In addition to this in-cylinder techniques, after treatment can be studied for the effective reduction of harmfulpollution from the diesel engine.
DeclarationsEthics approval and consent to participate
Not Applicable.
Consent to publication
Not Applicable.
Author’s contributions
Bharathiraja Moorthy handled conceptualization, methodology, and testing as well as data collection. NithyanandhanKamaraj was responsible for experimental setup, testing, writing, reviewing and �nal editing of themanuscript. Somasundaram Periasamy was in responsibility of data collection, data analysis and preliminary paperwriting, while Saji Raveendran Padmavathy was in control of consolidating the results and result interpretation. GauravDwivedi involved in the analysis and editing of the manuscript. The methodology and data gathering were theresponsibility of Ranjithkumar Subramaniam. The �nal manuscript was read and approved by all of the authors.
Funding
There is no �nancial assistance for this article.
Competing interests
The authors declare that they have no competing interests.
Availability of Data and Materials
The data set generated during this work are not publicly available, however they are available upon reasonable request tothe corresponding author.
Acknowledgements
The authors accept the testing and infrastructure facilities provided by Bannari Amman Institute of Technology,Sathyamangalam and Kongu Engineering College, Erode during this work.
References

Page 13/25
1. Canakci M (2008) An experimental study for the effects of boost pressure on the performance and exhaustemissions of a DI-HCCI gasoline engine. Fuel 87:1503–1514. https://doi.org/10.1016/j.fuel.2007.08.002
2. Cinar C, Uyumaz A, Solmaz H et al (2015) Effects of intake air temperature on combustion, performance andemission characteristics of a HCCI engine fueled with the blends of 20% n-heptane and 80% isooctane fuels. FuelProcess Technol 130:275–281. https://doi.org/10.1016/j.fuproc.2014.10.026
3. Das P, Subbarao PMV, Subrahmanyam JP (2015) Effect of main injection timing for controlling the combustionphasing of a homogeneous charge compression ignition engine using a new dual injection strategy. Energy ConversManag 95:248–258. https://doi.org/10.1016/j.enconman.2015.02.018
4. Dec JE (2009) Advanced compression-ignition engines - Understanding the in-cylinder processes. Proc Combust Inst32 II:2727–2742. https://doi.org/10.1016/j.proci.2008.08.008
5. Ganesh D, Nagarajan G, Ganesan S (2014) Experimental investigation of homogeneous charge compression ignitioncombustion of biodiesel fuel with external mixture formation in a CI engine. Environ Sci Technol 48:3039–3046.https://doi.org/10.1021/es403104f
�. Hasan MM, Rahman MM (2016) Homogeneous charge compression ignition combustion: Advantages overcompression ignition combustion, challenges and solutions. Renew Sustain Energy Rev 57:282–291.https://doi.org/10.1016/j.rser.2015.12.157
7. Kim MY, Lee CS (2007) Effect of a narrow fuel spray angle and a dual injection con�guration on the improvement ofexhaust emissions in a HCCI diesel engine. Fuel 86:2871–2880. https://doi.org/10.1016/j.fuel.2007.03.016
�. LEE TYK and SH (2012) Combustion and Emission Characteristics of Wood Pyrolysis Oil-Butanol Blended Fuels in aDi Diesel Engine. Int J … 0. https://doi.org/10.1007/s12239
9. Mathivanan K, Mallikarjuna JM, Ramesh A (2016) In�uence of multiple fuel injection strategies on performance andcombustion characteristics of a diesel fuelled HCCI engine - An experimental investigation. Exp Therm Fluid Sci77:337–346. https://doi.org/10.1016/j.exptherm�usci.2016.05.010
10. Yahya SM (1982) Fundamentals of Compressible Flow
11. Swami Nathan S, Mallikarjuna JM, Ramesh A (2010) Effects of charge temperature and exhaust gas re-circulationon combustion and emission characteristics of an acetylene fuelled HCCI engine. Fuel 89:515–521.https://doi.org/10.1016/j.fuel.2009.08.032
12. Turkcan A, Ozsezen AN, Canakci M (2013) Effects of second injection timing on combustion characteristics of a twostage direct injection gasoline-alcohol HCCI engine. Fuel 111:30–39. https://doi.org/10.1016/j.fuel.2013.04.029
13. Woo C, Kook S, Hawkes ER (2016) Effect of intake air temperature and common-rail pressure on ethanol combustionin a single-cylinder light-duty diesel engine. Fuel 180:9–19. https://doi.org/10.1016/j.fuel.2016.04.005
Figures

Page 14/25
Figure 1
Euro emission norms

Page 15/25
Figure 2
Engine Layout
Page 16/25
Figure 3
In-cylinder pressure and HRR for retardation of single injection to optimize main injection for LTC operation

Page 17/25
Figure 4
Indicated thermal e�ciency and emissions for retardation of single injection timing
Page 18/25
Figure 5
Variation of ITE for dual injection with respect to different injection pressure and SOI-1.

Page 19/25
Figure 6
Cylinder pressure and HRR for dual injection, pilot injection timing sweep
Figure 7
Cylinder pressure and HRR for dual injection for pilot injection mass sweep

Page 20/25
Figure 8
Cylinder pressure and HRR for dual injection, intake air temperature sweep
Figure 9
Cylinder pressure and HRR for dual injection, fuel injection pressure sweep

Page 21/25
Figure 10
Optimization of CO emission with respect to different parameters
Page 22/25
Figure 11
Optimization of CO2 emission by varying different parameters

Page 23/25
Figure 12
Optimization of HC emission by varying different parameters

Page 24/25
Figure 13
Optimization of NO emission by varying different parameters
Page 25/25
Figure 14
Optimization of smoke emission by varying different parameters