
COMPUTED TOMOGRAPHY - Yasser Mostafa Kadah
44
COMPUTED TOMOGRAPHY Prof. Yasser Mostafa Kadah Part 1
-
Upload
khangminh22 -
Category
Documents
-
view
0 -
download
0
Transcript of COMPUTED TOMOGRAPHY - Yasser Mostafa Kadah

COMPUTED TOMOGRAPHY
Prof. Yasser Mostafa Kadah Part 1

Computed Tomography
X-ray based imaging method
Main feature: sectional imaging rather than projection imaging

Computed Tomography Components
Gantry with a central opening, into which the patient is moved during the examination.
X-ray tube, the source of the X-rays that pass through the body situated in the gantry in the form of a series of projections;
Detector array converts the projection values, in the form of radiation intensities, into electrical quantities. Usually, the whole detector array rotates synchronously with the X-ray tube around the test object
Table allows the patient to be maneuvered easily into position
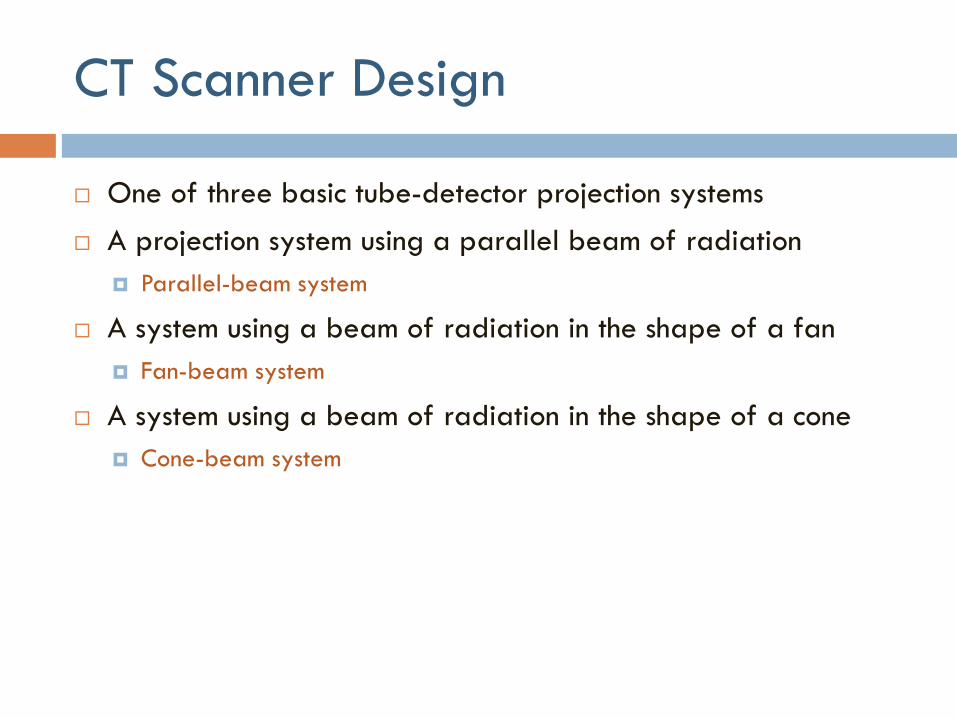
CT Scanner Design
One of three basic tube-detector projection systems
A projection system using a parallel beam of radiation
Parallel-beam system
A system using a beam of radiation in the shape of a fan
Fan-beam system
A system using a beam of radiation in the shape of a cone
Cone-beam system

First-Generation CT Scanners
Pencil beam or translation/rotation single
detector CT scanners
belong to the parallel-beam projection system
Two components to the movement of the
rigidly coupled tube-detector system
lateral movement to make a single projection
circular movement about the central opening in
the gantry to gather all projections necessary
to form the image
Very slow (5 min/slice)

Second-Generation CT Scanners
Partial fan beam or
translation/rotation multiple detector
scanners
3-52 detectors in the array
enable the projections to cover a larger
area of the patient’s body at any one
time
results in reduction of number of
projections needed to reconstruct an
image
Faster!
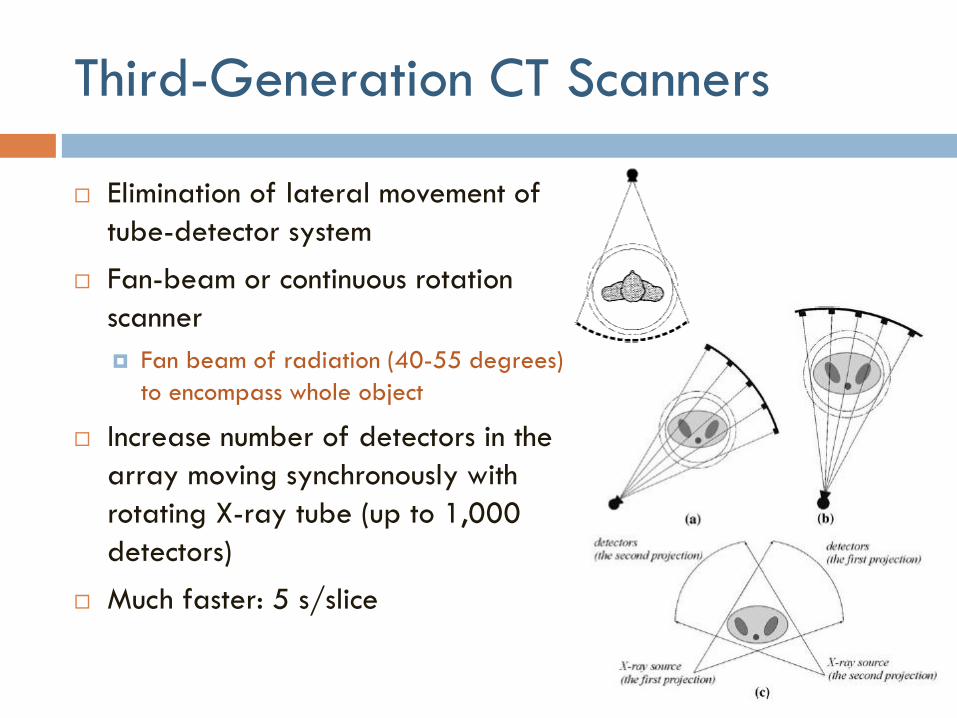
Third-Generation CT Scanners
Elimination of lateral movement of
tube-detector system
Fan-beam or continuous rotation
scanner
Fan beam of radiation (40-55 degrees)
to encompass whole object
Increase number of detectors in the
array moving synchronously with
rotating X-ray tube (up to 1,000
detectors)
Much faster: 5 s/slice

Fourth-Generation CT Scanners
Differ only slightly from the third generation
Rotation of the detector array is eliminated by arranging it on a
stationary ring
“Rotate-fixed” scanner
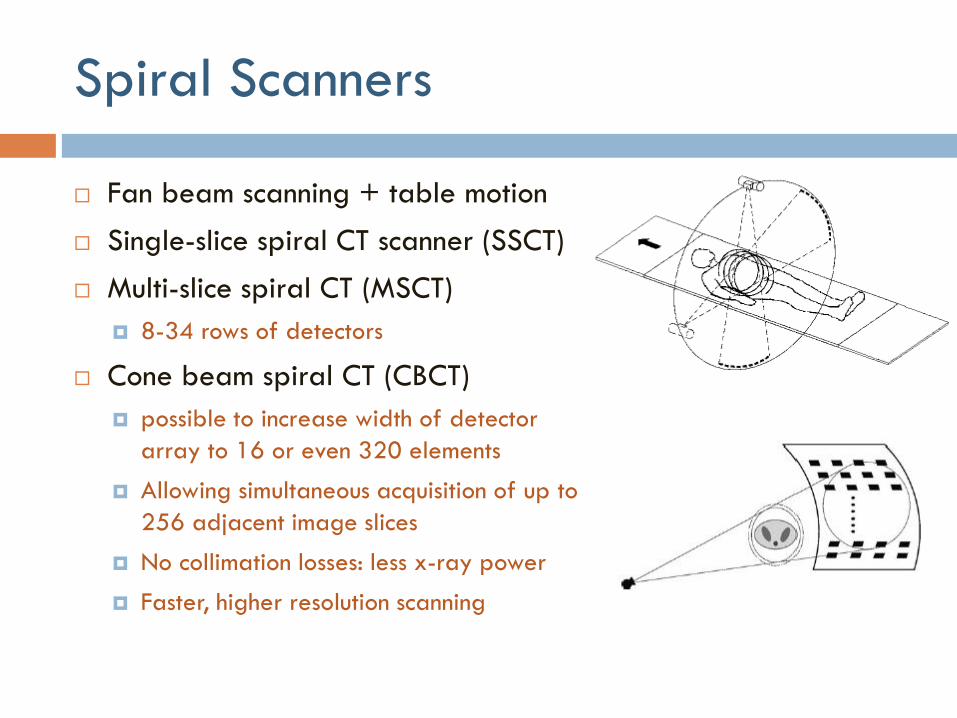
Spiral Scanners
Fan beam scanning + table motion
Single-slice spiral CT scanner (SSCT)
Multi-slice spiral CT (MSCT)
8-34 rows of detectors
Cone beam spiral CT (CBCT)
possible to increase width of detector
array to 16 or even 320 elements
Allowing simultaneous acquisition of up to
256 adjacent image slices
No collimation losses: less x-ray power
Faster, higher resolution scanning

Hounsfield Units
It is common practice in medical applications to use units on the
Hounsfield scale: Hounsfield units (HU) .
Value usually varies in the range -1,000 (air) to 3,000 (bone), making it
necessary to apply a so-called window (center C and width W).
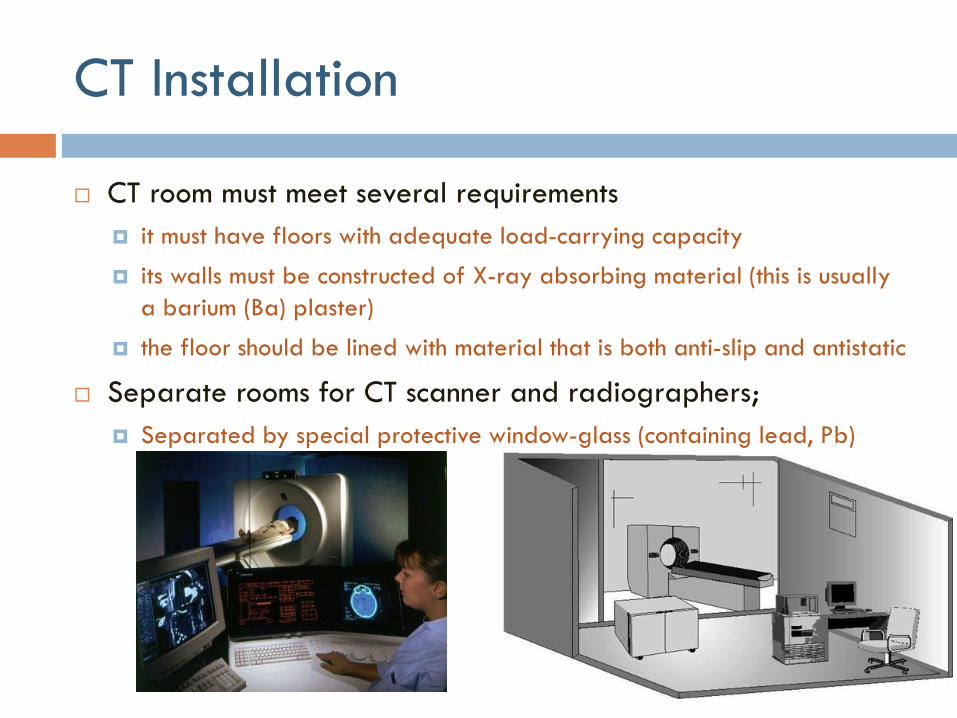
CT Installation
CT room must meet several requirements
it must have floors with adequate load-carrying capacity
its walls must be constructed of X-ray absorbing material (this is usually
a barium (Ba) plaster)
the floor should be lined with material that is both anti-slip and antistatic
Separate rooms for CT scanner and radiographers;
Separated by special protective window-glass (containing lead, Pb)

CT Scanner Physical Elements
A CT scanner consists of the following main elements
a data acquisition system that carries out the X-ray projections
a computer to reconstruct the images from the projections and to assist in
the analysis of the reconstructed images
a variable power supply
a monitor to display the routine operation of the computer system and to
act as an interactive interface in the diagnosis of reconstructed images
a documentation camera to produce an image on film similar to
traditional X-ray images
other data archiving systems, such as tape or disk, collectively referred
to as storage devices

Image Reconstruction Problem
For an NN image, we have N2 unknowns to estimate
Sufficient equations must be available
In most cases the problem can be formulated as a linear system
Simplest case when the acquired data correspond directly to the image
points (i.e., diagonal linear system matrix), e.g., ultrasound imaging.

Conventional Projection Imaging
The image points represents the line integral of the tissue
property along the incident ray
Plain x-ray imaging
Difficulty to discern overlapping structures along projection ray
Question: Can we gain more information by projecting in
different directions?
Different directions provide
different equations about the
different parts of the image
How many directions are needed?
P
Computed Tomography:
Reconstruction from Projections
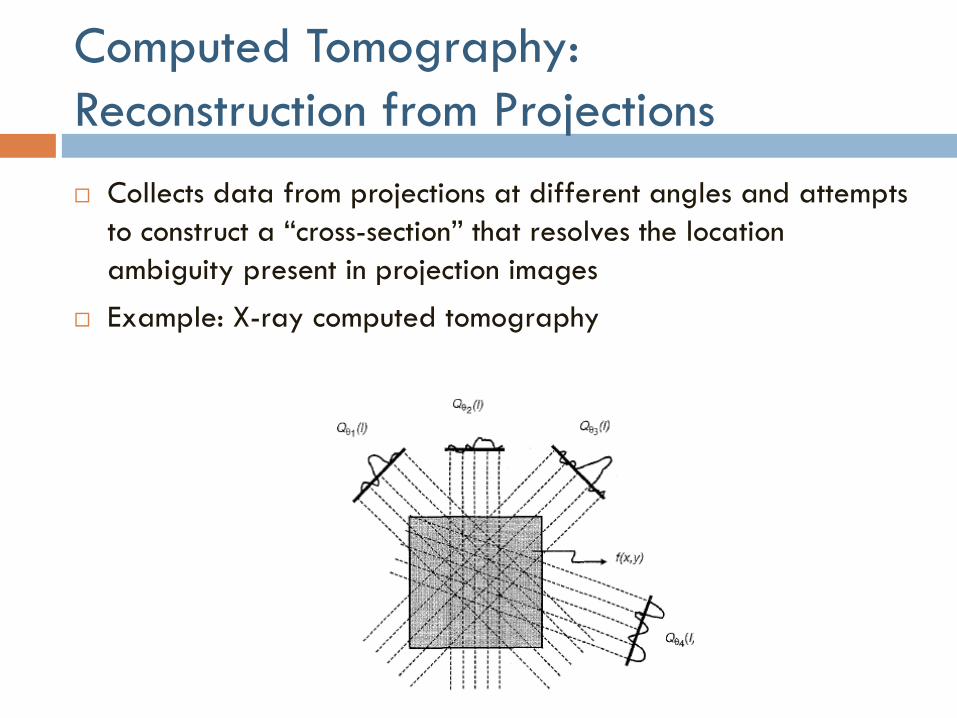
Collects data from projections at different angles and attempts
to construct a “cross-section” that resolves the location
ambiguity present in projection images
Example: X-ray computed tomography
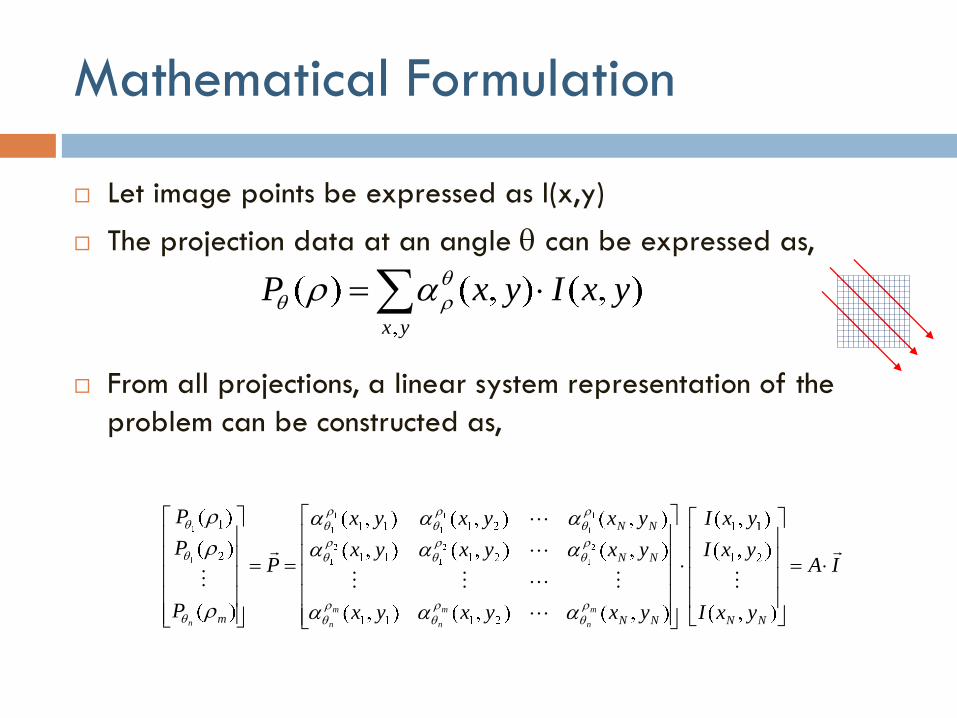
Let image points be expressed as I(x,y)
The projection data at an angle can be expressed as,
From all projections, a linear system representation of the
problem can be constructed as,
Mathematical Formulation
yx
yxIyxP
IA
yxI
yxI
yxI
yxyxyx
yxyxyx
yxyxyx
P
P
P
P
NNNN
NN
NN
mm
n
m
n
m
nn
Back-Projection Method
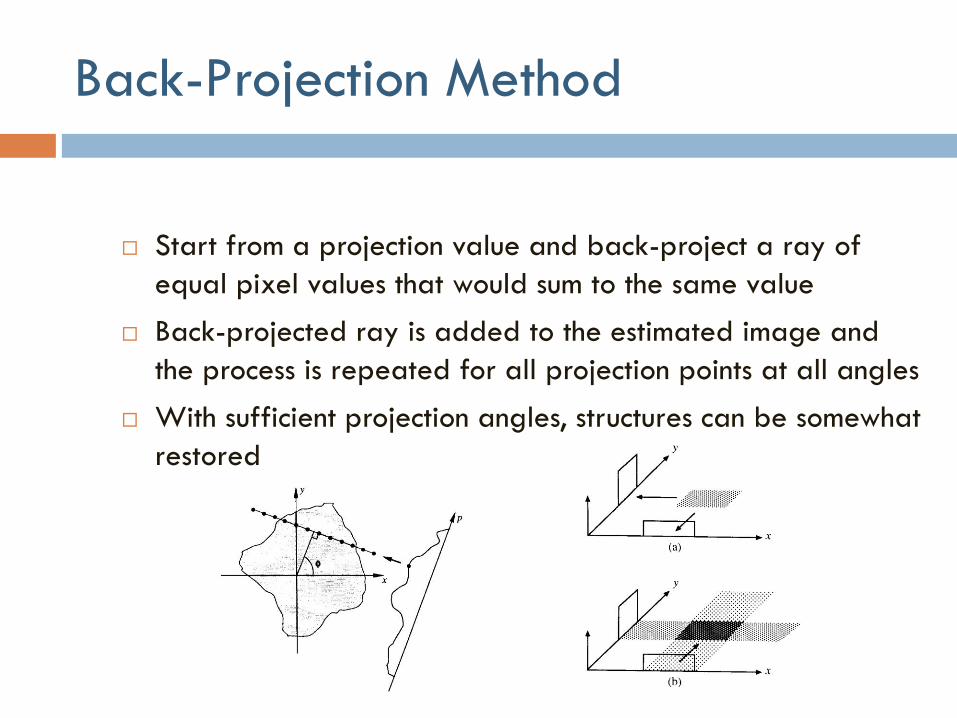
Start from a projection value and back-project a ray of
equal pixel values that would sum to the same value
Back-projected ray is added to the estimated image and
the process is repeated for all projection points at all angles
With sufficient projection angles, structures can be somewhat
restored

0 1 0
0
0
1
1
0
0
0 0 0
0
0
3
0
0
0
0 0 0
0
0
0
0
0
0
0 1 0
1
0
2
1
1
0
0 3 0
0
3
0
0 3
0
1 1 0
1
0
3
1
1
1
True
Image
Projection Data
Initial
Solution Iterate until sufficient accuracy is achieved
Back-Projection Example

Algebraic Reconstruction Technique
(ART)
A low-complexity iterative solver to the algebraic
reconstruction problem
Starts with an initial estimate and tries to push the estimate
closer to the true solution
Instead of back-projecting the average ray value, the error between the
projection computed from current estimate and the true is used
yx
yxIyxPUpdate

ART Example
4 5 6
4
4
5
5
6
6
1 2 3
4
7
5
8
6
9
0 0 0
0
0
0
0
0
0
1 2 3
4
7
5
8
6
9
12 15 18
6
15
24
8 15
12
1 2 3
4
7
5
8
6
9
True
Image
Projection Data
Initial
Solution Iterate until sufficient accuracy is achieved

Problem Extensions: Fan Beam Problem
In newer CT generations, fan beams are used to gain more
efficiency in hardware implementation
Detectors may be aligned on a line or a circular arc
A modification of the algebraic reconstruction method is used
to compute the image
Problem Extensions: Spiral CT
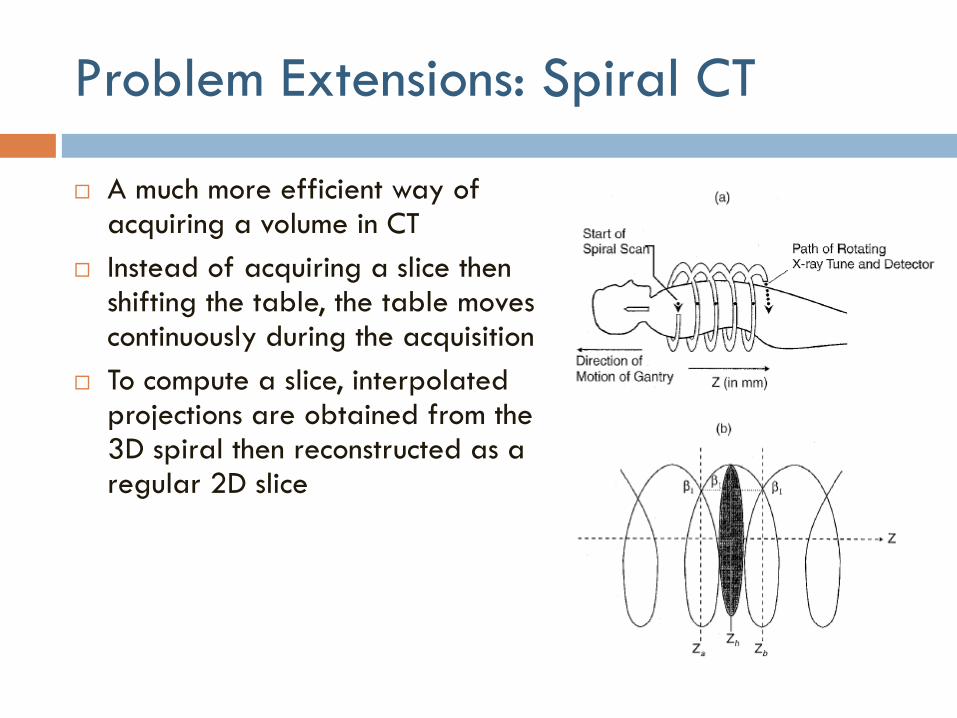
A much more efficient way of acquiring a volume in CT
Instead of acquiring a slice then shifting the table, the table moves continuously during the acquisition
To compute a slice, interpolated projections are obtained from the 3D spiral then reconstructed as a regular 2D slice
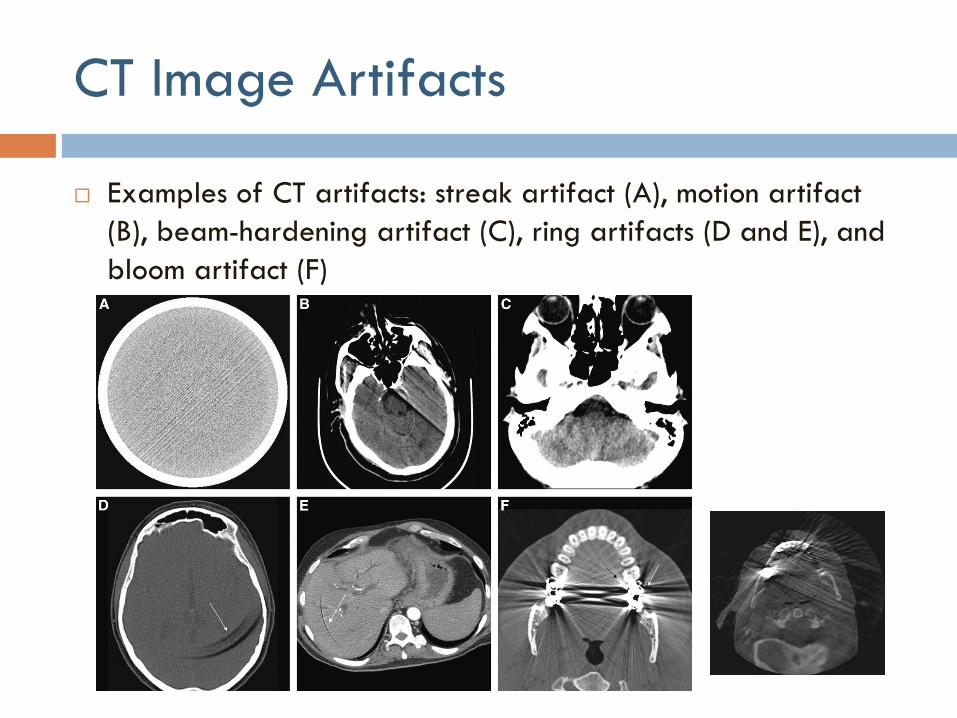
CT Image Artifacts
Examples of CT artifacts: streak artifact (A), motion artifact
(B), beam-hardening artifact (C), ring artifacts (D and E), and
bloom artifact (F)

Evaluation of CT Devices
The final CT image is produced as a result of a whole chain of
processes and is affected by a range of factors
Technical parameters of the scanner
Type of projection system
Type of reconstruction algorithm applied
Assessment of the physical and technical capabilities of CT
scanners is made possible by the establishment of
standardized, quantitative, comparative criteria.

Technical Parameters of CT Devices
Cycle Time: The total time taken to scan and reconstruct the
image
The smaller the cycle time, the greater the chance of avoiding the
creation of artifacts caused by patient movement, including
physiological movements such as the beating heart or chest movements
while breathing

Technical Parameters of CT Devices
Spatial Resolution: The minimum area in the image in which
changes can be detected
This quantity is defined using the transfer function of the scanner G(fx,
fy) (called often the MTF, modulation transfer function)
MTF defines the frequency domain relationship between the original and
the reconstructed image in the presence of noise, and determines the
ability of the scanner to capture rapidly changing attenuation
coefficients in the object
Spatial resolution is most often defined in terms of the cut-off frequency
of the one dimensional transfer function, i.e. the value at which the
function MTF(f) drops to the 50, 10 or 2% level.

Technical Parameters of CT Devices
Low-Contrast Resolution (Contrast Detail): The ability to
detect small differences of attenuation coefficient in tissues.
It is defined as the ratio between the smallest detectable difference of
attenuation coefficient (on the Hounsfield scale) and the average value
within an object of a given size, for a specific radiation dose
This last factor is introduced because low-contrast resolution is proportional to
the radiation dose
Current scanners have a resolution of between 0.3 and 0.4%. This can
be increased by increasing the radiation dose or extending the scanning
time
Technical Parameters of CT Devices
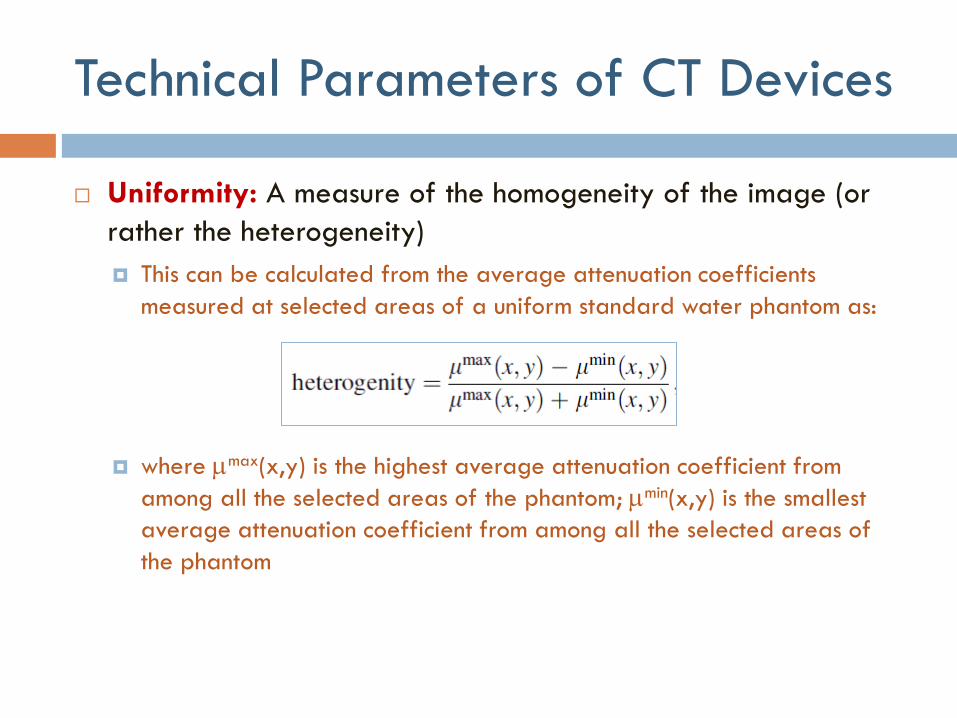
Uniformity: A measure of the homogeneity of the image (or
rather the heterogeneity)
This can be calculated from the average attenuation coefficients
measured at selected areas of a uniform standard water phantom as:
where max(x,y) is the highest average attenuation coefficient from
among all the selected areas of the phantom; min(x,y) is the smallest
average attenuation coefficient from among all the selected areas of
the phantom
Technical Parameters of CT Devices
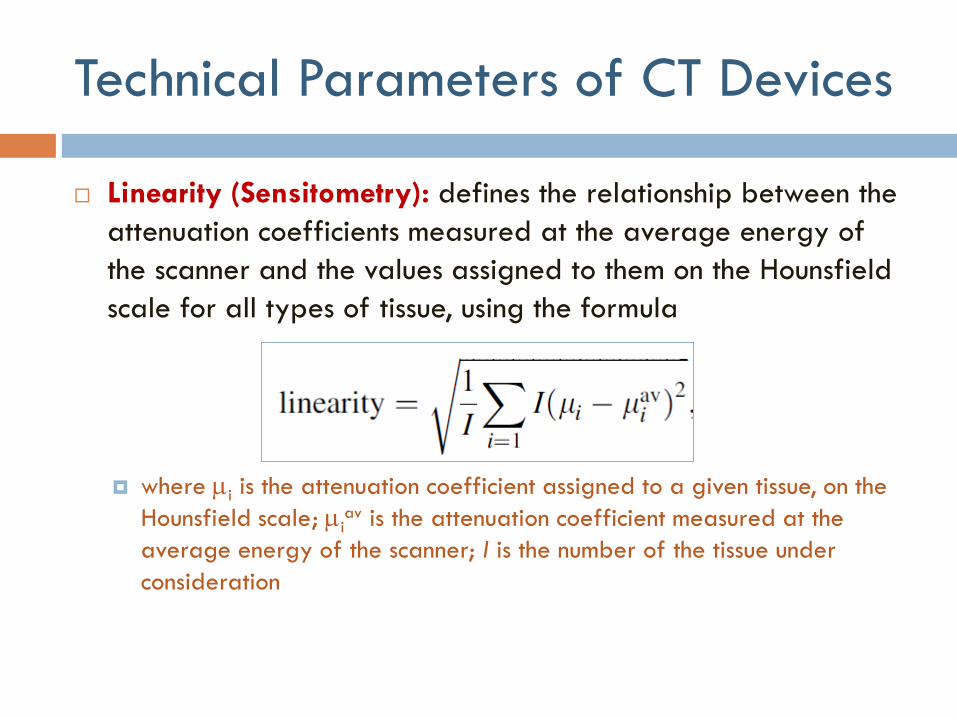
Linearity (Sensitometry): defines the relationship between the
attenuation coefficients measured at the average energy of
the scanner and the values assigned to them on the Hounsfield
scale for all types of tissue, using the formula
where i is the attenuation coefficient assigned to a given tissue, on the
Hounsfield scale; iav is the attenuation coefficient measured at the
average energy of the scanner; I is the number of the tissue under
consideration
Technical Parameters of CT Devices
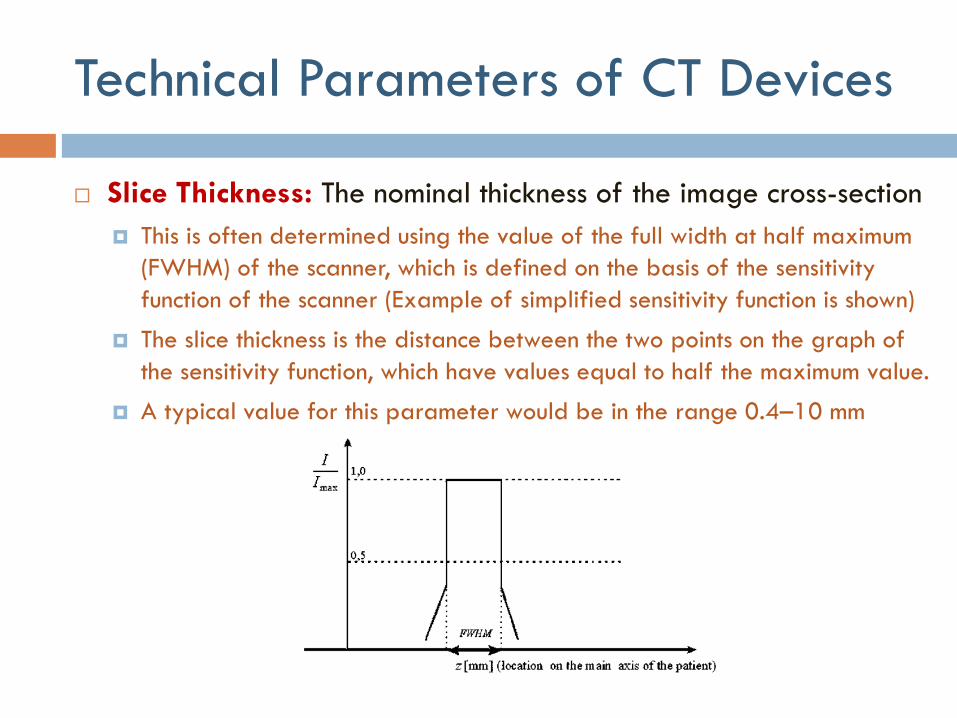
Slice Thickness: The nominal thickness of the image cross-section
This is often determined using the value of the full width at half maximum
(FWHM) of the scanner, which is defined on the basis of the sensitivity
function of the scanner (Example of simplified sensitivity function is shown)
The slice thickness is the distance between the two points on the graph of
the sensitivity function, which have values equal to half the maximum value.
A typical value for this parameter would be in the range 0.4–10 mm

Technical Parameters of CT Devices
Computed Tomography Dose Index (CTDI): This index is
measured in milligrays (mGy) and defines what dose a patient
absorbs when scanned by a particular CT apparatus
CTDI is determined by:
where Dose(z) is the distribution along the z-axis of the dose absorbed
by a phantom during the test; z1, z2 are the start and endpoints on the
z-axis of the measurements made by the dosimeter
Total dose absorbed by the patient should not exceed permissible levels
and consequently, much of the efforts of manufacturers of tomographic
equipment are currently directed towards minimizing this dose.

Technical Parameters of CT Devices
Pitch: The ratio between the displacement of the table with the
patient on it and the thickness of the scanned layer for one
revolution of the scanner
This factor is only relevant to spiral scan systems
where is the relative travel of the spiral described by the tube as it
moves around the test object in (mm/rad); SW is the nominal thickness of
the layer in (mm)

Quality Control Phantoms
ATS Phantom proposed by American Association of Physicists in
Medicine (AAPM)
Designed to test low-contrast resolution
Situated inside the Plexiglas housing of this phantom are rows of circular
inserts with diameters that change from row to row
These inserts have adjustable attenuation coefficient values, expressed
on the Hounsfield scale. The whole of the inside of the phantom is filled
with water

Quality Control Phantoms
Moström’s Phantom
Used to measure the Linearity (sensitometry) or homogeneity of the
image
In the example of the phantom illustrated, the parameter I = 5

Quality Control Phantoms
Low-contrast Resolution Phantom
The earliest design of phantom used to measure low-contrast resolution
The metal rods, shown immersed in water in the diagram, are arranged
in rows, where both the diameter di and the distance between the rods
2di decrease as the index i of the row increases
The low-contrast resolution of the scanner is determined by the smallest
diameter of rod, which is visible as a distinct element in the
reconstructed image

Quality Control Phantoms
Spatial Resolution Phantom
Spatial resolution (units: lp/cm) is determined by the use of a phantom to
measure the point spread function
In this phantom, a length of stainless steel wire is placed perpendicular
to the test cross-section
The MTF, which directly determines the resolution of the scanner, can be
calculated using the Fourier transform of the reconstructed image.
Because the diameter of the wire is small in relation to the size of the
pixels, it can be neglected in the calculation.

Quality Control Phantoms
CT Linearity Phantom
Assess the linearity of the tomographic image (parameter I = 5)
The five materials used here are selected according to the Hounsfield
number assigned to them chosen to cover the widest possible range of
the scale
By drawing a graph of the relationship between the Hounsfield numbers
assigned to these materials and their attenuation coefficients measured
by the scanner (at the average radiation energy), we can establish the
nonlinearity parameter based on its equation

Quality Control Phantoms
Slice Thickness Phantom
This phantom has two aluminum strips of thickness b = 0.6 mm inclined to
the reconstruction plane at a fixed angle (30 or 45 degrees)

Quality Control Phantoms
Phantom Simulating a Skull Bone
Filters are often used in reconstruction algorithms to compensate for the
distortions to the image at boundary between skull and brain.
Use of phantoms described before would cause these filters to have an
adverse effect on reconstructed image in absence of skull bone
For that reason, a Teflon rim, as shown is usually fitted to one of the
phantoms described above to simulate the skull bone

Start-Up and Test Procedures
To ensure reliable operation of CT scanner throughout the whole of its
working life, it is important that all manufacturer’s recommended
procedures for startup and testing are followed
After sliding the table out of the scanner’s gantry (Feed Out), image
quality is tested (Test Image), but without the emission of radiation to
confirm the correct operation of the imaging system
Next step is to prepare x-ray tube for operation by heating it up
(Warm Up).
Next step (Calibration) takes place in the absence of any radiation-
absorbing material in the gantry of scanner.
Measurements made at this time form the basis of the corrections that must be
made to the projections obtained during the routine operation of the scanner
Start-Up and Test Procedures
After calibration, procedures testing operation of CT scanner
are carried out (Quality) and can be divided into two types:
Qualitative tests, performed each day or weekly
Stability tests, performed each month
Annual tests.
Set of daily/weekly tests (performed by technicians) to check
the quality of the reconstructed image might include:
Test to measure the homogeneity of the image
Test of the point spread function
Check of the X-ray tube voltage

Start-Up and Test Procedures
A battery of tests performed by service personnel or technicians on a monthly basis might consist of measuring the following items:
Spatial resolution
Positioning accuracy
Linearity
Slice thickness
Annual tests might be a combination of the following examinations (performed by physicists):
Daily/weekly tests
Index accuracy and table positioning test
Contrast scale test
Distance accuracy test
Patient dose

Start-Up and Test Procedures
In an emergency, if the time needed to perform the entire
start-up procedure could affect the life or health of the
patient, a fast start-up procedure (Quickstart) can be carried
out, which excludes all the points selected in the start-up
window
Appropriate tests should also be carried out on the scanner
after the installation of the equipment and after any routine
maintenance or servicing
Application software installed on the scanner’s computer enables the
results of the tests to be saved, so creating a history of the device for
purposes of comparison.
Covered Material
Parts of chapters 3 and 9 of Cierniak textbook
Parts of chapter 15 of Hendee and Ritenour textbook