Shock Acceleration and Attenuation during Running ... - MDPI
Upload
khangminh22Category
view
0download
0
Dow
nloa
ded
from
http
://jo
urna
ls.tu
ms.
ac.ir
/ on
Sun
day,
Jul
y 15
, 201
2
Review
Article
Computed Tomography Based Attenuation Correction in PET/CT: Principles, Instrumentation, Protocols, Artifacts and Future Trends
Mohammad Reza Ay, PhD1,2,3 and Saeed Sarkar, PhD1,2
1 Department of Medical Physics and Biomedical Engineering, School of Medicine, 2 Research Center for Science and Technology in Medicine, Medical Sciences/University of Tehran, Tehran,
Iran, 3 Division of Nuclear Medicine, Geneva University Hospital, Geneva, Switzerland
(Received 20 June 2007, Revised 15 July 2007, Accepted 25 July 2007)
ABSTRACT
The advent of dual-modality PET/CT imaging has revolutionized the practice of clinical oncology, cardiology and
neurology by improving lesions localization and the possibility of accurate quantitative analysis. In addition, the use
of CT images for CT-based attenuation correction (CTAC) allows to decrease the overall scanning time and to
create a noise-free attenuation map (μmap). The near simultaneous data acquisition in a fixed combination of a PET
and a CT scanner in a hybrid PET/CT imaging system with a common patent table minimizes spatial and temporal
mismatches between the modalities by elimination the need to move the patient in between exams. As PET/CT
technology becomes more widely available, studies are beginning to appear in the literature that document the use of
PET/CT in a variety of different cancers, including lung, thyroid, ovarian, lymphoma, and unknown primary
cancers, and for general oncology, cardiology and neurology applications. Specific applications of PET/CT, such as
those for radiation therapy planning, are also being explored. The purpose of this review paper is to introduce the
principles of PET/CT imaging systems and describe the sources of error and artifact in CT-based attenuation
correction algorithm. This paper also focuses on recent developments and future trends in hybrid imaging and their
areas of application. It should be noted that due to limited space, the references contained herein are for illustrative
purposes and are not inclusive; no implication that those chosen are better than others not mentioned is intended.
Key Words: PET/CT, X-ray CT, Attenuation correction, CTAC, Hybrid imaging, Contrast medium, Artifact.
Iran J Nucl Med 2007; 15(2): 1-29
Corresponding Author: Dr Mohammad Reza Ay, Department of Medical Physics and Biomedical Engineering, School of Medicine, Tehran University of Medical Sciences, Enghelab Ave. Tehran, Iran. E-mail: [email protected]

Dow
nloa
ded
from
http
://jo
urna
ls.tu
ms.
ac.ir
/ on
Sun
day,
Jul
y 15
, 201
2
Ay et al. Sources of Error and Artifact in CTAC in PET/CT
Iran J Nucl Med 2007; Vol 15, No 2 (Serial No 28)
2
(a) (c)(b)(a) (c)(b)(a) (c)(b)
1. Introduction Diagnostic imaging began in the first decade of the
20th century after discovery of x-rays by Professor
Roentgen. The development of radiology as a first
imaging technique grew at a good pace until World
War II. Extensive use of x-ray imaging during the
second World War, and the advent of the digital
computer and new imaging modalities like
ultrasound, magnetic resonance imaging and nuclear
medicine have combined to create an explosion of
diagnostic imaging techniques in the past three
decades [1].
Clinical diagnosis is often supported by several
imaging modalities which provide complementary
information. Generally, this information can be
classified as anatomical and functional. Diagnosis,
staging and re-staging of cancer, as well as the
monitoring and planning of cancer treatment, has
traditionally relied on anatomic imaging like CT and
MRI. One of the disadvantages of anatomical
imaging techniques is their inability to characterize
the tumor. Lesions need to be characterized whether
they are benign or malignant and if malignant it
would be helpful to know whether proliferation is
slow or fast. Necrotic, scar and inflammatory tissue
often cannot be differentiated from malignancy based
on anatomic imaging alone. Anatomical imaging has
high sensitivity for detection of structural changes,
but a low specificity further characterization of these
abnormalities. SPECT and PET are imaging
techniques that provide information on physiology
rather than anatomy. These modalities have been
used for evaluation of tumor metabolism, difference
between tumor recurrence and radiation necrosis,
detection of hypoxic areas of the tumor, and other
functional imaging [2].
There are many instances in which it would be
desirable to integrate the information obtained from
two modalities of the same patient. The poor
anatomical resolution of PET and SPECT images can
be improved by integration with high resolution
images delivered by CT or MRI. The resulting image
could be named as hybrid image. Figure 1 shows a
transaxial slice from human chest acquired with
different modalities, left (CT, anatomical
information), middle (PET, functional information)
and right (PET/CT, fusion of anatomical and
functional information).
Figure 1: Transaxial slice from chest acquired with
different modalities: (a) CT; (b) PET; and (c) hybrid
PET/CT.
Historically, the first dual-modality device was a
combination of SPECT and CT. The pioneering work
by Hasegawa et al.[3] and Lang et al. [4] combined
anatomical and functional images by using a single
detector for both modalities. In addition, the x-ray CT
images were used to provide an attenuation map for
attenuation correction of SPECT data [5]. The first
commercial SPECT/CT produced by GE Healthcare
(Milwaukee, WI) was introduced in 1999 [6].
Although the idea of combining PET and CT
was proposed in 1994, the first prototype dedicated
PET/CT scanner was installed in the University of
Pittsburgh Medical Center in 1998 [7]. The prototype
was developed in collaboration with CTI PET
systems (Knoxville, TN) and the first commercial

Dow
nloa
ded
from
http
://jo
urna
ls.tu
ms.
ac.ir
/ on
Sun
day,
Jul
y 15
, 201
2
Ay et al. Sources of Error and Artifact in CTAC in PET/CT
Iran J Nucl Med 2007; Vol 15, No 2 (Serial No 28)
3
(a) (b)(a) (b)
system approved by FDA was presented at the 2000
Society of Nuclear Medicine meeting in St. Louis.
Thereafter, GE Healthcare (Milwaukee, WI)
introduced a PET/CT system, now named Discovery
LS, at the 2000 Radiological Society of North
America (RSNA) meeting in Chicago and Philips
Medical Systems (Milville, TN) presented their
version of combined PET/CT, the Gemini, at the
RSNA meeting in 2001. Combined PET/CT scanners
have been in production for less than 7 years and the
technology is undergoing rapid evolution. The
introduction of new geometrical designs, scintillator
crystals and fast electronics in PET components and
in parallel increasing the number of detector rows and
reduction of rotation time in CT scanners will
potentially increase the performance of PET/CT
scanners [8].
The advent of PET/CT scanners is considered as
a major advance in medical imaging technology and
health care. PET/CT systems offer significant
advantages over stand alone PET including decreased
overall scanning time and increased accuracy in
lesions localization. As the name implies, PET/CT
combines the information produced by two
sophisticated imaging modalities: the functional
information from PET with the anatomical
information from CT into a single procedure [9]. The
combination of two complementary modalities
significantly increases the diagnostic accuracy
compared to each of the two modalities, as well as
the two imaging modalities viewed side-by-side [10-
14], in addition PET/CT improves disease
localization and facilitates treatment planning for
radiation oncology or surgery [6]. The number of
inconclusive PET findings will be reduced by
accurate identification of the site of the activity
accumulation. This finding may be due to
pathologically increased (tumor) turnover,
pathologically increased turnover in a nonmalignant
process (e.g., inflammation, thyroid nodule), or
increased but physiological uptake in an activated
organ (e.g., fatty tissue, muscle, endocrine gland).
The high-resolution anatomical information from
PET/CT improves the differentiation of physiological
(normal) uptake of 18F-fluorodeoxyglucose (FDG)
and other radiopharmaceuticals from that associated
with disease, and thereby can reduce false positive
errors in comparison to lesion characterization when
PET imaging is used alone [15].
2. PET/CT Physics and Instrumentation In current PET/CT designs, the two scanners (PET
and CT) are physically separate with the CT position
anterior of the PET, in the same cover (Fig. 2). The
advantage of this minimal hardware integration is
that each system can use the latest technology,
independently. In the last seven years, since the
introduction of PET/CT in clinical area, there have
been significant advances in both CT and PET
technology and consequently these advances become
incorporated into current generation PET/CT
scanners [9].
Figure 2: (a) Schematic illustration of a PET/CT scanner. Reprinted with permission from ref. [8] (b) Individual PET and CT modules placed in one cover in a commercial Discovery LS PET/CT scanner. Courtesy of GE Healthcare.

Dow
nloa
ded
from
http
://jo
urna
ls.tu
ms.
ac.ir
/ on
Sun
day,
Jul
y 15
, 201
2
Ay et al. Sources of Error and Artifact in CTAC in PET/CT
Iran J Nucl Med 2007; Vol 15, No 2 (Serial No 28)
4
X-ray computed tomography is an imaging
modality that produces cross-sectional images
representing the x-ray attenuation properties of the
body. Unlike conventional tomography, CT does not
suffer from interference from structures in the patient
outside the slice being imaged. This is achieved by
irradiating only thin slices of the patient.
Compared to planar radiography, CT images
have superior contrast resolution, i.e, they are capable
of distinguishing very small differences between
tissues attenuation. Two steps are necessary to derive
a CT image: firstly, physical measurements of the
attenuation of x-rays traversing the patient in
different directions; and secondly mathematical
calculations of the linear attenuation coefficients, µ,
all over the slice. The patient remains on the
examination table while the x-ray tube rotates in a
circular or spiral orbit around the patient in a plane
perpendicular to the length-axis of the patient. The
data acquisition system is an array of several hundred
small separate detectors placed on the opposite side
of the patient [16].
PET imaging relies on the nature of positron
decay. When a nucleus undergoes positron decay, the
result is a new nuclide with one fewer proton and one
more neutron, as well as the emission of positron and
a neutrino. As positrons pass through matter, they
experience the same interactions as electrons,
including loss of energy through ionization and
excitation of nearby atoms and molecules. After
losing enough energy and travelling a given distance
in matter (depending the initial energy of the
positron), the positron will annihilate with a nearby
electron and two photons in opposite directions are
emitted each with energy of 511 keV. These photons
are the basis of coincidence detection and
coincidence imaging. PET imaging systems detect
annihilation events by means of several rings of
photon detectors that surround the patient. When two
matching photons originating from the same
annihilation event are recorded within nanoseconds
of each other, two opposite detectors register a
coincidence event along the line between both
detectors. The PET system then registers all lines of
response between each detector pair registering a
coincidence event during the scan. At the end of the
acquisition, there will be areas of overlapping lines
which indicate more highly concentrated areas of
radioactivity, according to the tracer distribution
within the patient body. Then the raw data can be
reconstructed to create cross sectional images
representing the radioactivity distribution into the
tissues [17].
3. Attenuation Correction Strategies in PET Several physical factors can degrade image quality
and quantitative accuracy in PET. These factors
include but are not limited to: scattered photons [18],
physiological as well as patient motion [19],
attenuation of photons [20], partial volume effect
[21], parallax effect [22], positron range and non-
collinearity [23]. The most important factor is
attenuation of photons in tissues, which can affect
both visual interpretation and quantitative accuracy of
PET data [20]. Attenuation correction has been
shown to improve image quality, lesion detection,
staging and management of patients in clinical
oncology compared to non-attenuation corrected
images [24].
Reliable attenuation correction methods for PET
require determination of an attenuation map, which
represents the spatial distribution of linear attenuation

Dow
nloa
ded
from
http
://jo
urna
ls.tu
ms.
ac.ir
/ on
Sun
day,
Jul
y 15
, 201
2
Ay et al. Sources of Error and Artifact in CTAC in PET/CT
Iran J Nucl Med 2007; Vol 15, No 2 (Serial No 28)
5
coefficients at 511 keV for the region under study.
After the attenuation map is generated, it can be
incorporated into image reconstruction algorithms to
correct the emission data for errors contributed by
photon attenuation (Fig. 3). The methods for
generating the attenuation maps can be categorized in
two main classes: transmissionless methods and
transmission-based methods [20].
(a) (b) (c)
Figure 3. Illustration of reconstruction artifact resulting from lack of attenuation correction for uniform distribution of activity in a cylindrical phantom. (a) Reconstructed image without attenuation correction. (b) Uniform attenuation map at 511 keV. (c) Same slice as (a) after applying attenuation correction. Reprinted with permission from ref. [20].
Transmissionless correction methods are based
on calculation of boundary and distribution of
attenuation coefficients by means of approximate
mathematical methods, statistical modeling for
simultaneous estimation of attenuation and emission
distribution and consistency conditions criteria. It is
generally difficult to generate accurate attenuation
map using transmissionless methods especially in
whole-body imaging with more complex
juxtapositions of media with different attenuation
properties and irregular contours. Therefore,
transmissionless techniques have limited value for
clinical applications [20].
In clinical applications, in which the attenuation
coefficient distribution is not known a priori, and for
areas of inhomogeneous attenuation such as the chest,
more adequate methods (transmission-based
methods) must be performed to generate the
attenuation map. This includes transmission scanning
using external radionuclide sources, x-ray CT
scanning and segmented MRI data. In stand alone
PET systems, the most widely used attenuation
correction technique is radionuclide transmission
scanning before (pre-injection), during
(simultaneous) or after (post-injection) emission scan
[25]. The use of x-ray CT scans offers the advantage
of higher photon fluence rates and faster transmission
scan, in addition to true anatomic imaging and
localization capability that can not be obtained using
radionuclide transmission scans [20]. The clinical use
of MRI-based attenuation correction techniques
currently is limited to brain imaging. In this method
the T1-weighted MR images are realigned to
preliminary reconstructed PET data using an
automatic algorithm and then segmented to classify
the tissues in different categories depending on their
density and composition. Then the theoretical tissue-
dependent attenuation coefficients are assigned to the
related voxels in order to generate an appropriate
attenuation map [26].
4. CT-Based Attenuation Correction in PET Attenuation maps generated for attenuation
correction have traditionally been obtained using
external radionuclide sources. This process is
identical conceptually to the process of generating
CT images with an x-ray tube that transmits radiation
through the body, with transmitted intensity recorded
by an array of detector elements. The transmission
data can then be reconstructed using a tomographic
algorithm that inherently calculates the attenuation
coefficients at each point in the reconstructed slice.

Dow
nloa
ded
from
http
://jo
urna
ls.tu
ms.
ac.ir
/ on
Sun
day,
Jul
y 15
, 201
2
Ay et al. Sources of Error and Artifact in CTAC in PET/CT
Iran J Nucl Med 2007; Vol 15, No 2 (Serial No 28)
6
The reconstructed CT image contains pixel values
that are related to the linear attenuation coefficient at
that point in the patient, calculated from the effective
CT energy at operational tube voltage of scanner.
However, the attenuation map at 511 keV can be
generated from the CT images to correct the PET
emission data for photon attenuation [20, 27]. CT-
based attenuation correction offers four significant
advantages [28]: first, the CT data will have much
lower statistical noise; second, the CT scan can be
acquired much more quickly than a radionuclide
transmission scan; third is ability to collect
uncontaminated post-injection transmission scan and
forth, using the x-ray transmission scan eliminates the
need for PET transmission hardware and periodic
replacement of 68Ge/68Ga positron sources. A
potential benefit not yet fully explored is the direct
incorporation of anatomical information derived from
the CT data into the PET image reconstruction
process and correction for partial volume effect [29].
As noted above, CT inherently provides a
patient-specific measurement of the linear attenuation
coefficient at each point in the image. However, the
linear attenuation coefficient measured with CT is
calculated at the x-ray energy rather than at the 511
keV. It is therefore necessary to convert the linear
attenuation coefficients obtained from the CT scan to
those corresponding to the 511 keV (Fig. 4). Several
conversion strategies have been developed including
scaling [30], segmentation [28], hybrid
(segmentation/scaling) [31], piece-wise linear scaling
[32], and dual-energy decomposition methods [33].
In the following, a short description of the nominated
methods is presented.
Scaling. The scaling approach estimates the
attenuation image at 511 keV by multiplying the CT
image by the ratio of attenuation coefficients of water
at CT and PET energies. A single effective energy is
chosen to represent the CT spectrum, typically in the
range of 50-80 keV [30].
Segmentation. This method forms the attenuation
image at 511 keV by segmenting the reconstructed
CT image into different tissue types. The CT image
value for each tissue type is then replaced with
appropriate attenuation coefficients at 511 keV.
Typical choices for tissue types are soft tissue, bone,
and lung [28, 35].
Hybrid. This method appears to be the most
promising and is based on a combination of the
scaling and segmentation methods above using the
fact that for most materials except bone, the ratio of
the linear attenuation coefficient at any two photon
energies is essentially constant [31].
Piece-wise linear. In this method, series of CT scans
from a known material (e.g. K2HPO4 solution) with
different concentrations is performed. A calibration
curve is then generated in which the measured CT
number is plotted against the known attenuation
coefficients at 511 keV. The resulting calibration
curve is piece-wise linear and covers the range of
linear attenuation coefficients commonly encountered
in the body. It should be noted that most
commercially available PET/CT scanners use the bi-
linear calibration curve method [32].
Dual-energy decomposition. A technically
challenging approach is to acquire the CT image at
two different photon energies (e.g. 40 keV and 80
keV) and use these data to extract the individual
photoelectric and Compton contributions to linear
attenuation coefficients. The different contributions
can then be scaled separately in energy [33].

Dow
nloa
ded
from
http
://jo
urna
ls.tu
ms.
ac.ir
/ on
Sun
day,
Jul
y 15
, 201
2
Ay et al. Sources of Error and Artifact in CTAC in PET/CT
Iran J Nucl Med 2007; Vol 15, No 2 (Serial No 28)
7
(a) (c)(b)(a) (c)(b)
Figure 4. Principle of CT-based attenuation correction method on commercial PET/CT scanners.
Reprinted with permission from ref. [34].
In addition to the energy conversion, there are
other issues that must be considered in using CT to
generate attenuation maps for correction of emission
data. CT fundamentally has a higher spatial
resolution and is reconstructed in a finer image
matrix than PET. Typically, 512×512 CT images can
be down-sampled to the same image format (e.g.
64×64, 128×128, 256×256) as that used for
reconstruction of PET emission data. CT images also
must be smoothed with a Gaussian filter using an
appropriate kernel to match the spatial resolution of
emission data (Fig. 5) [20].
5. Sources of Error and Artifact in CTAC PET/CT systems offer significant advantages over
stand alone PET including decreased overall scanning
time and increased accuracy in tumor localization and
detectability [6]. However, the use of CT images for
attenuation correction of PET data is known to
generate visible artifacts in the resulting PET images
in some cases [20]. Commercial, CT reconstruction
algorithms cannot account for the presence of metal
implants, such as dental fillings or prostheses
properly.
Figure 5. (a) Original CT image acquired at 120 kVp with matrix size 512×512; (b) the slice in (a) after down-sampling to 128×128 and Gaussian smoothing with FHHM=6 mm. (c) Attenuation map of the slice in (b) at 511 keV converted using a bi-linear calibration curve.
This results in steak artifacts, which are propagated
into PET images by the attenuation correction
process [36-40]. The transformation of attenuation
coefficients at x-ray energies to those at 511 keV
works well for soft tissues, bone, and air, but not for
dense CT contrast agents such as iodine or barium [2,
41-48].

Dow
nloa
ded
from
http
://jo
urna
ls.tu
ms.
ac.ir
/ on
Sun
day,
Jul
y 15
, 201
2
Ay et al. Sources of Error and Artifact in CTAC in PET/CT
Iran J Nucl Med 2007; Vol 15, No 2 (Serial No 28)
8
Figure 6. (a) A normal CT patient couch, the arrow shows couch flex (b) A new designed CT couch for PET/CT in order to remove couch flex. Reprint with permission from ref. [63].
Mismatches due to uncoordinated respiration as well
as patient movement result in incorrect attenuation-
corrected PET images [49-55]. Truncation artifacts
due to limited CT field-of-view are frequently
observed in PET/CT imaging of large patients [34].
These artifacts, however, can be minimized or
avoided by careful acquisition protocols or
appropriate correction schemes [56]. The x-ray tube
settings (kVp and mA) are another important issue
that should be considered during CT examination in
order to have a noise free attenuation map [57, 58]
and decrease patient dose [59-61]. In the following,
an overview of different sources of error and artifact
in CT-based attenuation correction in PET/CT
systems is presented.
5.1. Misalignment between PET and CT Images
The advent of hybrid PET/CT systems has simplified
image registration since the PET and CT data sets are
collected sequentially on the same system without the
need for the patient to move to another scanner. This
removes the image registration problem induced by
different patient set-up positions [62]. Once the CT
scan is complete, the patient couch is moved further
into the gantry to commence the PET scan. The two
data sets can be considered to be inherently
registered; just the distance between the PET and CT
positions needs to be taken into account. Generally,
there are two registration issues that must be
considered; first the misalignment of CT and PET
modules during the installation of the PET/CT
scanner owing to the fact that current PET/CT
systems consists of individual PET and CT systems
adjacent to one another. Second, is the flex of patient
couch. As the couch is moved into the gantry toward
the PET module after CT scanning, more of the
patient’s weight is taken by part of the couch that is
unsupported by the base. For accurate image
registration it is important that the degree of couch
flex does not change as the patient is moved from CT
to PET acquisition position. This would cause
registration problems in PET/CT. More recently with
the advent of pedestal/couch design configurations
the degree of flex keeps constant regardless of how
far the couch is moved into the gantry (Fig. 6). This
ensures that the vertical position of the patient is the
same for the CT and PET acquisitions [63].
5.2. Patient and Respiratory Motion
Mismatches between CT and PET images due to the
physiological motion (respiratory motion) as well as
patient movement have been described as a source of
potential artifacts of PET emission images obtained
using CT-based attenuation correction [19]. Most of

Dow
nloa
ded
from
http
://jo
urna
ls.tu
ms.
ac.ir
/ on
Sun
day,
Jul
y 15
, 201
2
Ay et al. Sources of Error and Artifact in CTAC in PET/CT
Iran J Nucl Med 2007; Vol 15, No 2 (Serial No 28)
9
patient movement and positioning errors in PET/CT
examinations may be overcome using immobilization
tools [12, 56].
Figure 7. Effect of respiratory motion in CT propagates into the emission image through the attenuation correction. (a) CT image using breathhold during thorax scan. (b) PET image using attenuation correction factors from Fig. 7a. (c) CT image of different patient during normal breathing. (d) PET image using attenuation correction factors from Fig. 7c clearly shows an artifact above liver (arrow) caused by the liver dome being mirrored at the right lung base. Reprint with permission from ref. [76].
Respiratory artifacts are particularly severe when
standard breath-hold techniques with maximum
inspiration are transferred directly from clinical CT
standalone protocols to combined PET/CT without
further adaptation. These artifacts are caused by the
mismatches of anatomy of thoracic and abdominal
organs at maximum inspiration in CT images versus
the anatomy when averaging over many respiratory
cycles during the PET study [34]. Qi et al. [64]
studied how the errors from respiratory mismatch
propagate into the PET image through the CT-based
attenuation correction. Goerres et al. [65] have
compared the accuracy of PET/CT image alignment
in the thorax and abdomen. They reported normal
expiration and free breathing to provide the best
match in the thorax area in 53% and 23% of patients,
respectively. The PET and CT alignment in the
abdominal area was satisfactory in both protocols
[66]. However, if the respiratory commands are not
adequately followed by the patient, the reconstruction
of emission data without attenuation correction is
suggested [56]. To account for the internal organ
motion due to respiration, nowadays, 4D-PET/CT
protocol has been developed. Such protocol enables
the PET and CT data to be individually divided into
different phases of the respiratory cycle thus
permitting data from both modalities to be matched at
the same phase. However, the success of such a
method does not depend on the technology alone, but
primarily on the cooperation of the patient, and
his/her ability to maintain a regular breathing pattern
[67-73]. In the absence of necessary hardware for
respiratory gating, several groups have attempted to
minimize the respiratory artifacts using available
hardware [74] or modifying the acquisition protocols
[72]. Beyer et al. [49] shown in whole-body PET/CT
imaging of normally breathing patients, respiration-
induced artifacts are reduced in both magnitude and
prominence for PET/CT systems employing CT
components of six or more detector rows. Pan et al.
[75] have proposed using respiratory-averaged CT
images in order to minimize the respiratory induced
artifact in CTAC. Figure 7 shows the effects of
respiratory motion in an image. The CT in Fig. 7a,
taken during a breath hold at normal expiration, has
no errors and consequently the attenuation-corrected

Dow
nloa
ded
from
http
://jo
urna
ls.tu
ms.
ac.ir
/ on
Sun
day,
Jul
y 15
, 201
2
Ay et al. Sources of Error and Artifact in CTAC in PET/CT
Iran J Nucl Med 2007; Vol 15, No 2 (Serial No 28)
10
PET image (Fig. 7b) has no errors. Figure 7c presents
a CT taken during normal breathing with a liver
artifact and Fig. 7d shows how this error appears in
the attenuation-corrected PET image.
5.3. Truncation
During CT imaging of obese patients and patients
with their arms down, part of the anatomy may
extend beyond the boundaries of the CT field of view
(50 cm) and is not reconstructed in CT. This
truncation artifact will propagate errors to the CT-
based attenuation correction which is based on fully
reconstructed CT images including all anatomies
which appears in PET images. In the presence of
truncation errors in CT images, the reconstructed
emission images appear to be masked by the
truncated CT. The tracer distribution is then only
partially recovered outside the CT field of view as
some bias of the reconstructed activity distribution
inside the field of view is observed (Fig. 8) [77-79].
There are two approaches for truncation artifact
correction. In the software approach, several
algorithms have been suggested to extend the
truncated CT projections to recover truncated parts of
the attenuation map [80]. In the hardware approach,
most manufacturers offer PET/CT scanners with a
patient port of 70 cm for both PET and CT modules
to avoid truncation of CT images for most of the
patients even with arms in down position [8].
5.4. Beam Hardening and X-ray Scattered
Radiation
The polyenergetic x-ray spectra used during CT
imaging makes it subject to beam hardening artifact
cased by the absorption of low energy x-rays as they
pass through the patient’s body. The direct
consequence is that the linear attenuation coefficient
calculated for thick body regions is lower than thin
regions. This effect generates cupping and streak
artifact in the reconstructed CT image and makes it
not acceptable for diagnostic purposes. Furthermore,
the resulting erroneous CT-based attenuation
correction subsequently propagates the error to the
calculated activity concentration in PET images [56].
Although beam hardening effect correction
algorithms [81] implemented as part of CT
reconstruction software, this effect is still visible
when having the patient’s arms in the field-of-view or
for obese patients during CT scanning using standard
whole-body PET/CT protocols [56].
Figure 8. 54-y-old man with history of metastatic melanoma (arrow). CT image appears truncated (left) and biases PET attenuation-corrected image (right). Reprint with permission from ref. [79].
The contamination of CT data with scattered
radiation reduces reconstructed CT numbers and
introduces cupping artifacts in the reconstructed
images. This effect is more pronounced in next
generation of CT scanners with large area flat-panel
detector that seems to be candidates as CT module in
next generation of PET/CT scanners with panel-based
PET module [8].

Dow
nloa
ded
from
http
://jo
urna
ls.tu
ms.
ac.ir
/ on
Sun
day,
Jul
y 15
, 201
2
Ay et al. Sources of Error and Artifact in CTAC in PET/CT
Iran J Nucl Med 2007; Vol 15, No 2 (Serial No 28)
11
Figure 9. Reconstructed images of Monte Carlo simulated emission data corrected for attenuation using from left to right: CAC, CTAC primary, CTAC total fan-beam and CTAC total cone-beam. Reprint with permission from ref. [43].
Ay and Zaidi [43, 82] quantified the contribution
of x-ray scatter during the CTAC procedure for
commercially available multi-slice CT and prototype
large area flat panel detector-based cone-beam CT
scanners using Monte Carlo simulation. They
reported the magnitude of scatter in CT images for
the cone-beam geometry is significant and might
create cupping artifacts in reconstructed PET images
during CTAC; however, its effect is small for current
generation multi-slice fan-beam CT scanners using
septa between detector elements, but should
preferably be corrected during CT reconstruction to
avoid quantification bias. Their results substantiate
the important role of antiscatter collimation and
robust scatter correction algorithms which certainly
will be implemented in future generation flat panel
based PET/CT scanners when used for quantitative
measurements. Figure 9 shows the reconstructed
images of a uniform distributed activity in a
cylindrical water phantom after attenuation correction
of simulated emission data using the ACF sinograms
calculated with different methods including
calculated AC (CAC) based on the theoretical value
of the linear attenuation coefficient of 511 keV
photons in water and the generated μmaps using
CTAC with the simulated CT image including
primary (ideal case), total fan-beam (current multi
slice CT) and total cone-beam (panel base CT) ,
respectively. The underestimation of ACFs will
induce underestimation of activity concentration in
the central area of PET images [43].
5.5. Contrast Medium
Although diagnostic quality CT relies on the
administration of oral or intravenous contrast agents
to allow improved lesion delineation, the presence of
positive contrast agents in dual-modality PET/CT
systems significantly overestimates the attenuation
map in some cases and may generate artifacts during
CTAC [41, 45-47]. This is due to the high attenuation
coefficient of these materials at the low effective
energy of the corresponding x-ray spectra which
results in high CT numbers in the region of contrast
agent accumulation through misclassification with
high density cortical bone [48]. Currently available
algorithms for conversion from CT numbers to linear
attenuation coefficients at 511 keV are based on the
assumption that image contrast in the CT data is
contributed by mixtures of air, soft tissue, and bone
[32]. The presence of contrast medium complicates
this process since two regions that have the same
image contrast may indeed have different
compositions, for example contributed by bone and
soft tissue in one case and iodine/barium contrast and

Dow
nloa
ded
from
http
://jo
urna
ls.tu
ms.
ac.ir
/ on
Sun
day,
Jul
y 15
, 201
2
Ay et al. Sources of Error and Artifact in CTAC in PET/CT
Iran J Nucl Med 2007; Vol 15, No 2 (Serial No 28)
12
soft-tissue in another situation [83]. These artifacts
are most severe in cases where the contrast media is
concentrated, for example in abdominal imaging after
the patient swallows a bolus of oral contrast. In this
case, the higher densities contributed by the oral
contrast media can lead to an overestimation of PET
activity [20]. The issue of whether the use of oral
contrast medium in dual-modality PET/CT scanning
produces medically significant artifacts is still
controversial with some studies corroborating [45,
46, 84-87] and others contradicting [43, 44, 47, 48,
88] the fact that the presence of contrast medium can
be a source of errors and artifact when the CT data
are used for attenuation correction of PET images.
However there are different strategies for correction
of the contrast agent artifact in CTAC. Some
investigators have proposed using separate bi-linear
calibration curves for conversion from CT numbers
to linear attenuation coefficients at 511 keV for bone-
soft tissue and contrast agent-soft tissue combination
[28]. Other groups have proposed using image
segmentation methods of converting CT numbers to
attenuation coefficients that correctly scale contrast
enhanced CT images for intravenous and oral agents
[89]. Other strategies including the acquisition of
both pre-contrast and post-contrast CT scans can be
used to minimize possible artifacts contributed by the
presence of contrast media [8]. threshold conversion
method for whole body imaging and cylindrical
threshold correction and global threshold correction
method for cardiac imaging are alternative methods
[90]. Another well implemented method for
correction of oral and intravenous contrast medium
artifact in CTAC PET images called segmented
contrast correction (SCC) method was proposed by
Nehmeh et al [48]. This method was evaluated using
both phantom and clinical studies and proved to
accurately recover lesion size and uptake. Although
several studies have shown that the SCC algorithm is
efficient but still limited to simple shapes reflecting
the spatial distribution of contrast medium [43, 48].
This limitation makes this efficient algorithm useless
in clinical area, where we are facing with irregular
shapes of regions containing contrast medium usually
found in clinical studies. However, the classification
of regions containing bone and contrast agent
material in contrast enhanced CT images is a
challengious task; due to the fact the CT number of
these regions is similar in the majority of clinical
cases. More recently an automatic segmentation
algorithm has been developed by Bidgoli et al. [91]
and Ay et al. [92] for implementation of SCC
algorithm in clinical area. Figure 10 shows image
artifact in contrast enhanced PET/CT image and
figure 11 shows the accuracy of our newly developed
algorithm for automated segmentation and
classification of regions containing oral contrast
medium in order to correct for artifacts in CT
attenuation-corrected PET images using the
segmented contrast correction (SCC) algorithm [91,
92].
5.6. Metallic Implant
Some candidate patients for PET/CT imaging have
artificial metallic implants, such as artificial joints,
metal braces in the spine, chemotherapy ports, hip
prosthetic material, dental filling, pacemaker and ICD
leads. In standard PET transmission scanning with
radionuclides, metal implants causes a little or no
artifact while these artifact can be significant in CT
energies due to the significantly higher x-ray
absorption of high-Z materials (e.g. metals) compared
to the low-Z materials (e.g. tissues).

Dow
nloa
ded
from
http
://jo
urna
ls.tu
ms.
ac.ir
/ on
Sun
day,
Jul
y 15
, 201
2
Ay et al. Sources of Error and Artifact in CTAC in PET/CT
Iran J Nucl Med 2007; Vol 15, No 2 (Serial No 28)
13
Figure 10. Image artifact in contrast enhanced PET/CT image, (a) Bolus passage of intravenous contrast agent in left subclavian and brachiocephalic veins on CT led to areas of apparently increased glucose metabolism on corrected PET (b). Positive oral contrast agent (barium) in stomach on CT image (c). Area of apparently increased glucose metabolism on PET (d). Reprint with permission from ref. [41].
Figure 11. Original contrast enhanced CT image (a), segmented CT image (b), bone objects (c), contrast agent objects (d), original contrast enhanced CT image after applying SCC to the regions segmented as containing contrast agent (e), generated μmap from original CT (f), and generated μmap after SCC (g). Horizontal profiles (position shown in f-g) through generated attenuation maps before and after applying SCC (h). The presence of streak artifacts caused by metallic
implants in CT images may mislead the diagnosis of
patients in PET/CT images, particularly when lesions
are present in the very vicinity of metallic implants
[56]. Several authors addressed the impact of using
CTAC on quantitative analysis of PET/CT images in
presence of dental metallic implants [40], hip
prosthetic material [38], pacemaker and ICD leads
[36] and metallic DBS leads used for treatment of
Parkinson’s disease [43]. Figure 12 shows the
overestimation of PET activity in presence of
metallic implant.
Dow
nloa
ded
from
http
://jo
urna
ls.tu
ms.
ac.ir
/ on
Sun
day,
Jul
y 15
, 201
2
Ay et al. Sources of Error and Artifact in CTAC in PET/CT
Iran J Nucl Med 2007; Vol 15, No 2 (Serial No 28)
14
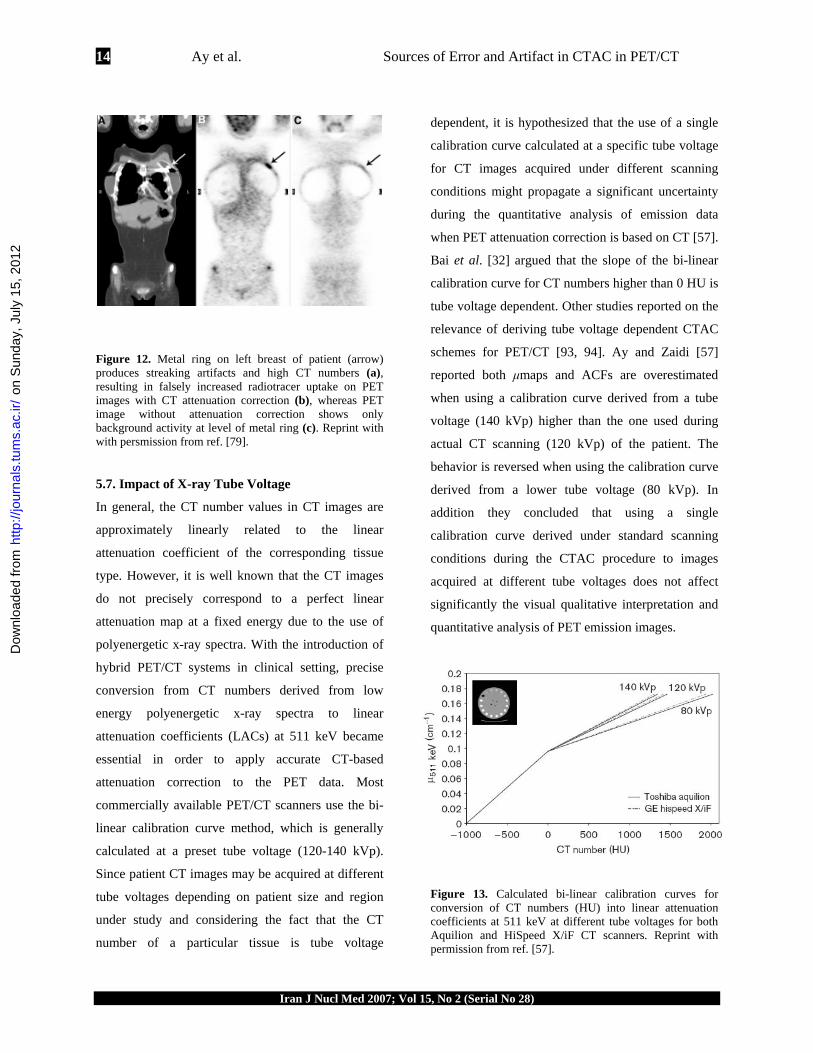
Figure 12. Metal ring on left breast of patient (arrow) produces streaking artifacts and high CT numbers (a), resulting in falsely increased radiotracer uptake on PET images with CT attenuation correction (b), whereas PET image without attenuation correction shows only background activity at level of metal ring (c). Reprint with with persmission from ref. [79]. 5.7. Impact of X-ray Tube Voltage
In general, the CT number values in CT images are
approximately linearly related to the linear
attenuation coefficient of the corresponding tissue
type. However, it is well known that the CT images
do not precisely correspond to a perfect linear
attenuation map at a fixed energy due to the use of
polyenergetic x-ray spectra. With the introduction of
hybrid PET/CT systems in clinical setting, precise
conversion from CT numbers derived from low
energy polyenergetic x-ray spectra to linear
attenuation coefficients (LACs) at 511 keV became
essential in order to apply accurate CT-based
attenuation correction to the PET data. Most
commercially available PET/CT scanners use the bi-
linear calibration curve method, which is generally
calculated at a preset tube voltage (120-140 kVp).
Since patient CT images may be acquired at different
tube voltages depending on patient size and region
under study and considering the fact that the CT
number of a particular tissue is tube voltage
dependent, it is hypothesized that the use of a single
calibration curve calculated at a specific tube voltage
for CT images acquired under different scanning
conditions might propagate a significant uncertainty
during the quantitative analysis of emission data
when PET attenuation correction is based on CT [57].
Bai et al. [32] argued that the slope of the bi-linear
calibration curve for CT numbers higher than 0 HU is
tube voltage dependent. Other studies reported on the
relevance of deriving tube voltage dependent CTAC
schemes for PET/CT [93, 94]. Ay and Zaidi [57]
reported both μmaps and ACFs are overestimated
when using a calibration curve derived from a tube
voltage (140 kVp) higher than the one used during
actual CT scanning (120 kVp) of the patient. The
behavior is reversed when using the calibration curve
derived from a lower tube voltage (80 kVp). In
addition they concluded that using a single
calibration curve derived under standard scanning
conditions during the CTAC procedure to images
acquired at different tube voltages does not affect
significantly the visual qualitative interpretation and
quantitative analysis of PET emission images.
Figure 13. Calculated bi-linear calibration curves for conversion of CT numbers (HU) into linear attenuation coefficients at 511 keV at different tube voltages for both Aquilion and HiSpeed X/iF CT scanners. Reprint with permission from ref. [57].

Dow
nloa
ded
from
http
://jo
urna
ls.tu
ms.
ac.ir
/ on
Sun
day,
Jul
y 15
, 201
2
Ay et al. Sources of Error and Artifact in CTAC in PET/CT
Iran J Nucl Med 2007; Vol 15, No 2 (Serial No 28)
15
The same behavior was observed when calibration
curves are derived at different tube voltages and used
for conversion of CT images acquired at fixed tube
voltage [57]. However, a kVp-dependent calibration
curve for converting CT Hounsfield units into 511
keV linear attenuation values for attenuation
correction in PET/CT studies is highly recommended [57, 93]. Figure 13 shows the calculated bi-linear
calibration curves for two commercial CT scanners at
different tube voltages (80 kVp, 120 kVp and 140
kVp). The XCOM photon cross sections database
[95] was used for calculation of the corresponding
linear attenuation coefficients of the inserted
solutions at 511 keV.
5.8. Impact of X-ray Tube Current
It is well known that a high tube current improves CT
image quality at the expense of increasing patient
dose. It was reported that effective doses of 8.81 mSv
and 18.97 mSv are delivered to the patient for a
whole body CT scan in high-speed and high-quality
mode, respectively [60].
(a) (b)
(c) (d) Figure 14. CT scans through the thorax acquired with 80 mA (a) and 10 mA (b) and corresponding attenuation map at 511 keV calculated using CTAC. Using CT at 80 mA (c), and 10 mA (d). Reprint with permission from ref. [58].
This is in contrast to relatively low effective doses of
0.15 mSv and 0.08 mSv for thoracic and whole-body
transmission scans using positron emitting 68Ga/68Ge
and single-photon emitting 137Cs radionuclide
sources, respectively [20]. With the introduction of
PET/CT systems, several questions had to be
answered, one of them is “to which limit can the CT
tube current be reduced while still yielding adequate
μmaps for attenuation correction of PET data?”.
Kamel et al. [58] investigated the effect of varying
tube current and showed that a low-current CT is
sufficient for CTAC using comparative quantitative
analysis of reconstructed clinical PET images. Ay
and Zaidi concluded that the attenuation map
derivation is independent of tube current due to the
fact the statistical fluctuation of CT numbers in the
low current CT images removes during the down-
sampling and smoothing process in CTAC method
[96]. Likewise, a new pre-processing algorithm was
proposed recently to use a single ultra-low dose CT
scan for both attenuation map construction and lesion
localization [97]. Figure 14 shows the CT scans at 80
and 10 mA, and corresponding attenuation map. The
quality of the CT10 scan is clearly poorer than that of
the CT80 scan. However, following degrading with a
Gaussian filter and down-sampling, the calculate
attenuation map from CT80 and CT10 scans look
similar.
6. 18F-FDG Imaging Protocol The PET/CT scanner combines premier technology
from two imaging modalities, making it possible to
reveal both anatomical and functional information in
a single procedure. Although combination of
anatomical and functional imaging is an obvious

Dow
nloa
ded
from
http
://jo
urna
ls.tu
ms.
ac.ir
/ on
Sun
day,
Jul
y 15
, 201
2
Ay et al. Sources of Error and Artifact in CTAC in PET/CT
Iran J Nucl Med 2007; Vol 15, No 2 (Serial No 28)
16
choice, the design of specific clinical protocols and
flexible workflow utilities is still an active research
arena and open to debate [34, 56, 98-103]. Figure 4
shows a standard PET/CT scanning protocol in
currently available dual-modality systems. The
standard 18F-FDG imaging protocol is divided in
seven different steps: (i) The patient is prepared form
imaging which commonly include administration of
both oral and IV contrast agents [42] and with
typically 10 to 15 mCi 18F-FDG in adults, that should
be questioned independently for allergies to iodine-
based CT contrast agents if these are to be
administered intravenously during the course of a
PET/CT study [34]. Proper patient preparation for
PET studies has been described in detail, for
example by Hamblen and Lowe [104]. (ii) The
patient then is asked to remove all metal objects that
may induce the streak artifact during the CT imaging;
thereafter the patient is positioned on the patent table
of the hybrid PET/CT scanner. (iii) The patient then
undergoes a “topogram” or “scout” scan to identify
the axial extend of CT imaging. (iv) The patient
undergoes a helical CT acquisition with proper scan
pitch and exposure settings in order to minimize the
patient dose [60, 61]. (v) The patient then moves to
the PET module of the PET/CT scanner and
undergoes the emission scan. (vi) The CT and PET
data are reconstructed and registered [105, 106], with
the CT data also used for attenuation correction of
PET data [107]. (vii) The images are reviewed
quantitatively [108-110] and qualitatively [101] by a
physician, who can view the CT, PET and hybrid
images, followed by preparation of the associated
clinical report. Qualitative visual assessment remains
the principal method followed in the interpretation of
routine clinical PET studies. However, visual
interpretation intrinsically bears many important
weaknesses including the need to define a threshold
for judgment of the existing and degree of radiotracer
concentration [101]. Despite of the simplicity of
visual interpretation it has limited application in
research studies where more emphasize is put on
quantitative analysis in order to allow more objective
and reliable assessment [111]. The standard uptake
value (SUV) is the most widely used quantitative
uptake index in clinical PET studies. This parameter
is define as the tissue concentration of tracer within a
lesion divided by tissue density, as measured by PET,
divided by the injected dose normalized to patient
weight multiplied by a decay factor [112]. Since the
weight is not always a good measure of initial tracer
distribution volume, several investigators suggested
variation on the SUV to account for this effect
practically for obese patients. This include SUV
using lean-body mass [113] or body surface area
[114] in place of patient weight.
Generally two approaches can be distinguished
for PET/CT protocols (Table 1). In the first scenario a
high quality diagnostic CT is not needed, due to the
fact the patient had previously undergone a complete
CT examination. The low dose CT examination, as
part of the PET/CT, is used only for generation of
attenuation map for CTAC and also for anatomic
labeling of PET findings. In the second scenario, a
high quality diagnostic CT is clinically indicated.
Typically, the CT, as part of the PET/CT, is acquired
using oral or intravenous contrast agents to maximize
the diagnostic information on anatomy and tumor
vascularization. In addition, the CT is used for CTAC
and anatomic labeling, or referencing of the PET
results [34].
Regarding to the patient positioning, Beyer et al.
[34] reported two main advises based on their
experience on more than 3500 PET/CT studies: (i)

Dow
nloa
ded
from
http
://jo
urna
ls.tu
ms.
ac.ir
/ on
Sun
day,
Jul
y 15
, 201
2
Ay et al. Sources of Error and Artifact in CTAC in PET/CT
Iran J Nucl Med 2007; Vol 15, No 2 (Serial No 28)
17
most patients should be scanned with arms raised and
supported above the head. To facilitate comfortable
positioning of the arms, several low-attenuation CT
positioning devices are available. By raising the arms
for the duration of the whole-body scan and leaving
them outside the measured CT field of view, scatter
artifacts in the body are much reduced and counting
statistics of the corresponding emission scan are
increased. Conversely, for head-and-neck
investigations, the area is scanned with arms down.
(ii) Independent of the coaxial imaging range, all
patients should be supported with a proper knee rest
for the duration of the combined scan. When using
foam pallets or vacuum bags, no artifacts are
typically introduced into the CT transmission scan.
Table 2 summarizes some acquisition parameters in
standard protocols.
7. Current Status and New Horizon in Hybrid
Imaging From advances in x-ray film and cassettes to the
introduction of computers and digital images,
diagnostic imaging has never stopped reinventing its
technology to improve patient care. Today, diagnostic
imaging is one of the cusps of explosive growth in an
arena known as dual-modality imaging. This
technology melds two independent imaging
modalities (PET and CT), typically a procedure that
demonstrates an organ’s function and metabolism
with one that depicts the organ’s anatomy, to produce
a diagnostically and clinically superior study. Until
recently, clinicians had to obtain physiological and
anatomical information on separate machines and use
special registration software to digitally superimpose
the two images. Today, new PET/CT dual-modality
equipments are capable of performing both types of
examinations simultaneously, automatically merging
the data to form a composite image. By uniting
metabolic function with anatomic form, dual-
modality imaging depicts the human body with a
level of precision never achieved before. In addition,
the use of CT images for CT-based attenuation
correction in dual-modality systems allows to
decrease the overall scanning time and to create a
noise free attenuation map [115]. However, still there
are many technical issues that need to be solves
through research [116]. Despite much worthwhile
research performed during the last few years,
artefacts induced by respiratory motion remain
among the most difficult problems to solve [73].
Table 1: Objectives and requirements of clinical PET/CT imaging. Reprint with permission from ref. [34].
Scenario Clinical approach Focus group Demands on CT
Demands on PET
CT for simple anatomic orientation
PET/CT replaces PET CT for fast attenuation correction and general anatomic orientation Mostly whole-body scans
Nuclear medicine
Low
High
CT for state-of- the-art diagnostic information
PET/CT replaces CT, or CT and PET State-of-the art diagnostic CT with contrast agents and standard exposure levels to maximize information on anatomy and tumor vascularization CT for fast attenuation correction Whole-body scans and dedicated protocols
Cross-modality, nuclear
medicine, radiology, oncologist
High
High

Dow
nloa
ded
from
http
://jo
urna
ls.tu
ms.
ac.ir
/ on
Sun
day,
Jul
y 15
, 201
2
Ay et al. Sources of Error and Artifact in CTAC in PET/CT
Iran J Nucl Med 2007; Vol 15, No 2 (Serial No 28)
18
Table 2. Diagnostic PET/CT acquisition parameters for whole-body and combined head/neck–torso protocol. Reprint with permission from ref. [34].
Protocol Standard whole-body Neck–Torso Imaging range Whole-body Torso Neck Topogram 1024 mm 756 mm 256 mm
CT contrast 140 mL: 90 mL at 3 mL/s, 50 mL at 1.5 mL/s
90 mL: 60 mL at 3 mL/s, 30 mL at 1.5 mL/s
60 mL: 60 mL at 3 mL/s
CT scan
Single-spiral 130 kVp, 110 mAs 0.8-s rotation time 5-mm slice width 8-mm table feed
Single-spiral 130 kVp, 100 mAs 0.8-s rotation time 5-mm slice width 8-mm table feed
Single-spiral 130 kVp, 160 mAs 0.8-s rotation time 3-mm slice width 5-mm table feed
Emission scan
3.5 min per bed 2 iterations and 8 subsets on 128 matrix with 5-mm Gaussian
3 min per bed 2 iterations and 8 subsets on 128 matrix with 5-mm Gaussian
4 iterations and 8 subsets on 256 matrix with 3-mm Gaussian, zoom 2
CT postprocessing Lung window Lung window Zoomed head
Another limitation of current PET/CT technology is
that sequential rather than simultaneous data
acquisition is performed [117]. In addition the
optimization of detector material, data acquisition
electronics, geometrical design of detection system
and image reconstruction algorithms are the active
research area in the filed of hybrid imaging [8]. Over
the years, there have been some moments at which
the scientists might have felt that PET technology had
reached its full potential and perhaps the major
innovations were behind, but always some innovation
change this idea [118]. In present and near future
PET/CT is improving through implementation and
optimization of respiratory gating algorithms,
improving the count rates, more precise registration
and the reintroduction of time of flight (TOF).
With a growing focus on cardiology applications,
GE Healthcare strives to enhance image quality
through dynamic, gated PET and volumetric CT (64
slice). The company introduced at the end of 2005 the
Discovery VCT, a system that aims to convey a
clearer view of the heart. The system combines
PET’s dynamic and gating data, acquiring a
comprehensive view of the heart and coronary
arteries with submillimeter resolution in five seconds,
with volumetric CT used to visualize the anatomy of
the heart’s blood vessels. The VCT also features
VUEPoint reconstruction [119], offering fully
iterative reconstruction technology in 2-D and 3-D
acquisition modes (Fig. 15).
Figure 15. Discovery VCT first clinical case. O15 PET perfusion/ CT angiography (CTA).O15 rest perfusion (left), CTA (middle) and O15 stress perfusion (right). Courtesy Turku PET Center.
The angle that Siemens has carved out for
improving PET/CT images is focusing on increased
count rates. Siemens has adopted this approach by
introducing TruePoint technology into its Biograph
system. Designed for nuclear medicine applications
where clinicians require extremely precise and

Dow
nloa
ded
from
http
://jo
urna
ls.tu
ms.
ac.ir
/ on
Sun
day,
Jul
y 15
, 201
2
Ay et al. Sources of Error and Artifact in CTAC in PET/CT
Iran J Nucl Med 2007; Vol 15, No 2 (Serial No 28)
19
detailed images to pinpoint minute lesions and
arteries, True Point reportedly adds 33 percent more
axial volume coverage to its PET/CT scanner,
extending the field of view and improving counts by
more than 78 percent. More recently in the 2007
Society of Nuclear Medicine meeting, Siemens
introduced their dedicated point spread function
(PSF) reconstruction algorithm that called high
definition PET (HD PET) [120]. HD PET
incorporates millions of accurately measured point
spread functions in the reconstruction algorithms.
Using measured PSFs, HD PET effectively positions
the LORs in their actual geometric location, which
dramatically reduces blurring and distortion in the
final image and offer the uniform resolution of almost
2 mm in entire FOV (Fig. 16).
Figure 16. The difference between conventional PET (left) and HD PET (right) image quality. Data courtesy of the University of Erlangen.
Hitachi’s SceptreP3 and GE’s Discovery LS
employ Dual Attenuation Correction (DAC)
technology, which allows the combination of both CT
and sealed source attenuation correction to effectively
image patients with metal implants. In addition, the
Non-Rigid Fusion algorithm provides precise
registration by correcting for respiration differences
between PET and CT acquisitions.
One technology used in PET imaging that has
resurfaced in PET/CT systems is time-of-flight. The
idea of TOF is not a new concept. TOF PET scanners
were developed in the 1980s and at that time were
used chiefly in research [121-123]. In conventional
PET, a valid event is formed when the two coincident
511keV annihilation photons are detected within
some prespecified timing window, typically on the
order of 5–12 ns for detectors based on scintillators.
The two detectors in which interactions are measured
determine a line along which the original annihilation
site must lie. The location of the annihilation site
along that line is unknown and must be recovered by
image reconstruction. In TOF PET, the actual time
difference in the arrival of the two annihilation
photons at the detectors is recorded. The time
difference increases the farther the annihilation site is
from the point midway between the two detectors.
Modern clinical PET scanners typically are capable
of an isotropic spatial resolution in the 4 to 6 mm
range. Therefore, if we wanted to use the TOF effect
to pinpoint the annihilation site to about 5 mm and
completely eliminate the need for image
reconstruction, then the photon arrival times would
need to be recorded with a precision of approximately
30 picoseconds. Detectors and electronics capable of
such a timing resolution are not available; however, a
timing resolution of a few hundred picoseconds is
feasible. This can be used to constrain the
reconstruction algorithm, because it localizes the
annihilation site to within a few centimeters, and thus
the reconstruction of that event can be weighted
accordingly. With currently available electronic the
TOF PET just improves the SNR without any
improvement in spatial resolution (Fig. 17). Last
year, Philips Medical Systems introduced the Gemini
TF PET/CT, which provides what Philips calls
TruFlight, its own version of TOF technology. The
Gemini TF is a high-performance, fully 3-
dimensional, time-of-flight PET scanner combined

Dow
nloa
ded
from
http
://jo
urna
ls.tu
ms.
ac.ir
/ on
Sun
day,
Jul
y 15
, 201
2
Ay et al. Sources of Error and Artifact in CTAC in PET/CT
Iran J Nucl Med 2007; Vol 15, No 2 (Serial No 28)
20
with a Brilliance CT scanner (currently up to 64-
slices). The PET scanner uses lutetiumyttrium
oxyorthosilicate (LYSO) crystals that are placed in an
Anger-logic detector, accomplishing a light spread in
the detector that is uniform. The scanner was
designed by Philips to be used as a high-performance
conventional PET scanner in its own right, as well as
a TOF scanner to provide improved timing resolution
[124].
Not all manufacturers have bought into TOF
because of certain limitations involving system
requirements and respiratory gating, reason why GE
Healthcare is not a proponent of the technology.
Although TOF can improve image quality and reduce
acquisition time, it requires a PET/CT system that has
the highest sensitivity. GE contends that it already
addresses the challenges of imaging bariatric patients
with ViewPoint’s reconstruction and 4-D imaging,
which enhances image quality on patients of all sizes.
Plus, unlike TOF, ViewPoint enables 4-D imaging
for respiratory gating to essentially ‘freeze’ motion.
According to one of its pioneers in the 1980s, a
spokesperson at Siemens says TOF today is a
technology that may be worth adopting in the future
because it can improve PET performance by
enhancing count rates. However, Siemens’ TruePoint
technology is already doing this without TOF [125].
Whether PET/CT’s performance is enhanced through
respiratory gating for PET, better count rates, more
precise registration or the reintroduction of TOF,
each one of these enhancements contributes to faster
image acquisition and better image quality with
bariatric patients. The anatomically guide image
reconstruction [29, 126] , new scatter correction
techniques [18, 127], Spiral PET acquisition [7, 8]
and implementation of partial volume correction
algorithms in clinical area [21, 128, 129] are another
potentials that might be enhanced the PET/CT
imaging in near future. However, to have an idea
about the specification of current PET?CT scanners
some of the key parameters featured in the current
range of PET/CT devices under market from different
vendors are summarized in Table 3 [125].
Figure 17. Reconstructed images for the central slice in the 27-cm phantom. These images are for a fixed count statistics (6.4 Mcts). Moving left to right the images are: 300 ps TOF scanner, 600-ps TOF scanner, 1000-ps TOF scanner, and non-TOF scanner. Same scan times lead to improved image quality in a TOF scanner with better timing resolution. Reprint with permission from ref. [123].

Dow
nloa
ded
from
http
://jo
urna
ls.tu
ms.
ac.ir
/ on
Sun
day,
Jul
y 15
, 201
2
Ay et al. Sources of Error and Artifact in CTAC in PET/CT
Iran J Nucl Med 2007; Vol 15, No 2 (Serial No 28)
21
Table 3. Some of the key parameters featured in the current range of PET/CT devices under market from different vendors (Data were colleted from the official web site of Imaging Technology News [125]).
Product Name GEMINI GXL
GEMINI TF
Biograph TP
Discovery ST
Discovery STE
Discovery RX
Sceptre P3
Company Philips Philips Siemens GE GE GE HitachiFDA-cleared Yes Yes Yes Yes Yes Yes Yes Acquisition modes 3D, 4D 3D, 4D 3D, 4D 2D, 3D, 4D 2D, 3D, 4D 2D, 3D, 4D 3D, 4D Number of crystals
17,864 17,864 32448 (with TrueV)
10,080 13,440 15,120 4,224
Number of image planes
45 or 90 45 or 90 109 with TrueV
47 47 47 47
Crystal material GSO LYSO LSO BGO BGO LYSO LSO Ring diameter, cm 90 90 83 88.6 88.6 88.6 82.4 Axial FOV, cm 18 18 21.6
(with TrueV) 15.7 15.7 15.7 16.2
Crystal size, mm 4 x 6 x 30 4 x 4 x 22 4 x 4 x 20 6.2x 6.2x30 4.7x6.3x30 4.2 x6.3x30 6.45x6.45x25 Transverse resolution @ 1 cm, mm
5.3 (4.5 with LOR)
4.7 (4.3 with LOR)
4.2 (~2 with HD)
6.2 (2D) 6.2 (3D)
5.0 (2D) 5.0 (3D)
4.8 (2D) 4.8 (3D)
6.3
Transverse resolution@10 cm, mm
6.0 5.1 4.8 (~2 with HD)
6.8 (2D) 6.7 (3D)
5.7 (2D) 5.6 (3D)
5.3 (2D) 5.2 (3D)
6.8
System sensitivity - 3D (NEMA 2001)
8.0 cps/kBq 7.2 cps/kBq 7.9 cps/kBq (with TrueV)
9.3 cps/kBq 8.5 cps/kBq 8.0 cps/kBq Unknown
System sensitivity - 2D (NEMA 2001)
NA NA NA 2.0 cps/kBq 2.0 cps/kBq 1.7 cps/kBq NA
Scatter fraction-2D
NA NA NA 19% 19% 17% NA
Scatter fraction-3D
37% 30% 36% 44% 35% 35% 36%
CT Module, Number of slice
6, 16 16, 64 6, 40, 64 4, 8, 16 8, 16, 64 16, 64 16
CT detector material
Solid-State GOS
Solid-State GOS
UltraFast Ceramic
Patented Ceramic
Patented Ceramic
Patented Ceramic
Ceramic
Most current commercial whole body PET/CT
scanners employ conventional detector blocks
consisting of several stacked rings of inorganic
scintillating crystals radially oriented and readout on
the backside by standard photomultiplier tubes
(PMTs) or multi-anode PMTs. Another possible
potential for enhancement of PET/CT’s performance
seems to be new geometrical concept for detection
system. There are several new concepts including
HPD PET [22], Pannel-base PET [8], large axial
FOV PET [118] which are under development and
might be commercially available in near future.
In principle all advantages of a PET/CT scanner
could be replicated by PET/MRI; however, there are
several major problems to combine PET and MRI
technology in an integrated system. One obvious
problem is that the radiation of interest, photons for
PET and radiofrequency in MRI, come from opposite
ends of the electromagnetic spectrum and there is no
single detection system that can be used for both
modalities. Besides putting the two machines in one
cover, similar to the current PET/CT scanners design
is problematic because of the incompatibility of
currently used technologies in PET and MRI [8].
Historically, research on another multimodality
combination, PET/MRI, started at roughly the same
time as PET/CT, in the mid-1990s [130]. The
immediate questions that come to mind regarding

Dow
nloa
ded
from
http
://jo
urna
ls.tu
ms.
ac.ir
/ on
Sun
day,
Jul
y 15
, 201
2
Ay et al. Sources of Error and Artifact in CTAC in PET/CT
Iran J Nucl Med 2007; Vol 15, No 2 (Serial No 28)
22
PET/MRI are whether it is technically possible and
what it will be used for. The earliest motivation for
combined PET/MRI was the fact that strong magnetic
fields can reduce the positron range effect [131].
Although one can debate how PET/MRI might
ultimately be used, there is no doubting the
technologic breakthroughs over the past 2 years that
are now clearly demonstrating that simultaneous
PET/MRI is possible. The earliest attempts at
PET/MRI used optical fiber technology to pipe light
from scintillators in the bore of a magnet to
photomultiplier tubes, with good magnetic field
immunity, in the fringe field outside the bore of the
magnet [132-134]. PET/MR has four main additional
features in comparison with PET/CT. First, for small
animal studies, simultaneous scanning reduces time
under anesthesia and enables scanning under identical
physiological conditions. Second, high-field MRI
generates high resolution anatomical and structural
images offering better soft-tissue contrast resolution
and a large variety of tissue contrasts compared to
CT, and allows for functional MRI, thus enabling
temporal correlation of blood flow with metabolism
or receptor expression in brain studies and, more
importantly, is capable of assessing flow, diffusion,
perfusion, and cardiac motion in one single
examination. Third, MRI can be combined with MRS
to measure spatially matched regional biochemical
content and to assess metabolic status or the presence
of neoplasia and other diseases in specific tissue
regions. Finally, MRI does not use any ionizing
radiation and therefore can be used without
restrictions in serial studies, for pediatric cases, and
in many other situations where radiation exposure is a
concern [135]. “There is no doubt that in order to
assess the need for PET/MR in a clinical setting, such
a hybrid modality should be made available at least
in large research centers. Results from studies
conducted on these systems will then provide the
necessary data to justify their routine clinical use and
eventually convince the medical community about the
merits and cost effectiveness of PET/MR. Until that
happens, I believe that PET/CT will continue to be
the modality of choice in whole body oncological
imaging.” PD. Dr. Habib Zaidi said in the month’s
Point/Counterpoint published in Journal of Medical
Physics [135]. Considering the technology
improvement in recent years the scientists expected
to build the whole-body PET/MRI scanners in far
future (5-10 years from now). Figure 18 shows the
concept of whole-body PET/MRI scanner with large
axial FOV PET [118].
Figure 18. Concept of whole-body PET/MRI scanner, and images that such a system might produce (PET image courtesy of Siemens Medical Solutions; whole-body T1-weighted MR image courtesy of Dr. Heinz-Peter Schlemmer, University of Tubingen).Reprint with permission from ref. [118].
The obvious objection to such a system is one of
expense in a financially restricted health care setting.
To realize such a system in anything other than an
elite medical research environment would require
significant reductions in cost. But putting cost aside,
technically, it is likely that the PET component of
such a system could be built even with current
technology, and as outlined here, the combination of
PET and MRI is looking increasingly feasible. There

Dow
nloa
ded
from
http
://jo
urna
ls.tu
ms.
ac.ir
/ on
Sun
day,
Jul
y 15
, 201
2
Ay et al. Sources of Error and Artifact in CTAC in PET/CT
Iran J Nucl Med 2007; Vol 15, No 2 (Serial No 28)
23
are certainly technologic challenges that would need
to be addressed to fully realize the kinds of gains in
PET that have been suggested. These challenges
include the need to control the contribution of
scattered coincidences (detectors with excellent
energy resolution and perhaps some limited axial
collimation) and random coincidences in a scanner
that encompasses the whole body, the need for high-
speed coincidence electronics to keep up with high
data rates, and the need for fast and accurate iterative
reconstruction algorithms to provide high-quality
images in a reasonable time. But all of these
challenges seem within our grasp [118].
8. Summary PET/CT is the major tool for anato-metabolic
imaging and now is performed routinely using 18F-
FDG to answer important questions including those
in cardiology, neurology, psychiatry and oncology.
The latter application contributed largely to the wide
acceptance of this modality and its use in clinical
diagnosis, staging, and assessment of tumor response
to treatment. The use of CT images for CT-based
attenuation correction in PET/CT allows to decrease
the overall scanning time and to create a noise-free
attenuation map in addition to improvement of lesion
localization. Although the hybrid imaging is an
obvious choice, the way to perform the right imaging
is still an open issue considering the potential
artifacts and errors in CTAC. In addition the tracers
or combination of traces to be used, how the imaging
should be done in presence of contrast agent, what is
the optimum acquisition and processing protocol,
what is the optimum quantitative analysis algorithm,
are all still unanswered questions and need more
research and development. Whether PET/MRI will
succeed to replace PET/CT as the hybrid imaging
platform of choice in future is still a debatable
question that will retain the attention of active
researchers in the filed during the next decade. Future
advances in hybrid imaging instrumentation may
come from unforeseen sources that are unknown yet,
but they will come.
Acknowledgements The authors would like to thanks PD Dr. Habib Zaidi
for his constructive criticisms and suggestions. His
comments have contributed to remarkably improve
the overall quality of this paper. We thank our many
colleagues throughout academia and industry who
have long been helpful and generous, providing
advice, suggestions, guidance, and material support,
in particular, we acknowledge Dr. York Haemisch
from Phllips, Dr. Frederic Schoenahl from Siemens
and Dr. Walter Capece from GE Healthcare. This
work was supported by Medical Sciences/University
of Tehran under grant from 12th Razi International
Festival in Medical Sciences.
References
[1] Van den Elsen PA, Pol ED, and Viergever MA. Medical image matching- A review with classification. IEEE Trans. Eng. Med. Biol. 1993; 12: 26-39.
[2] Ay MR. Monte Carlo and experimental assessment of CT-based attenuation correction in PET. PhD. Thesis, 2005, Department of Radiology, Geneva: University of Geneva.
[3] Hasegawa BH, Stebler B, Rutt BK, Martinez A, Gingold EL, Barker CS, et al. A prototype high-purity germanium detector system with fast photon-counting circuitry for medical imaging. Med. Phys. 1991; 18: 900-909.
[4] Lang TF, Hasegawa BH, Liew SC, Brown JK, Blankespoor SC, Reilly SM, et al. Description of a prototype emission-transmission computed tomography imaging system. J Nucl Med. 1992; 33: 1881-1887.

Dow
nloa
ded
from
http
://jo
urna
ls.tu
ms.
ac.ir
/ on
Sun
day,
Jul
y 15
, 201
2
Ay et al. Sources of Error and Artifact in CTAC in PET/CT
Iran J Nucl Med 2007; Vol 15, No 2 (Serial No 28)
24
[5] Hasegawa BH, Lang TF, Brown JK, Reilly SM, Blankespoor SC, Liew SC, et al. Object-specific attenuation correction of SPECT with correlated dual-energy x-ray CT. IEEE Trans. Nucl. Sci. 1993; 40: 1242-1252.
[6] Hasegawa BH and Zaidi H.Dual-modality imaging: more than the some of its components. in Quantitative analysis in nuclear medicine imaging, Zaidi H, Ed. New York: Springer, 2005; 35-81.
[7] Beyer T, Townsend DW, Brun T, Kinahan PE, Charron M, Roddy R, et al. A combined PET/CT scanner for clinical oncology. J Nucl Med. 2000; 41: 1369-1379.
[8] Townsend DW, Carney JPJ, Yap JT, and Hall NC. PET/CT today and tomorrow. J Nucl Med. 2004; 45: 4S-14S.
[9] Townsend DW, Beyer T, and Blodgett TM. PET/CT scanners: a hardware approach to image fusion. Semin Nucl Med. 2003; 33: 193-204.
[10] Osman MM, Cohade C, Nakamoto Y, Marshall LT, Leal JP, and Wahl RL. Clinically significant inaccurate localization of lesions with PET/CT: frequency in 300 patients. J Nucl Med. 2003; 44: 240-243.
[11] Kinahan PE, Fessler JA, Alessio AM, and Lewellen TK. Quantitative attenuation correction for PET/CT using iterative reconstruction of low-dose dual-energy CT. in Proc. IEEE Nuclear Science Symposium and Medical Imaging Conference., Oct. 19-22, Rome, Italy, 2004; 3285-3289.
[12] Beyer T, Tellmann L, Nickel I, and Pietrzyk U. On the use of positioning aids to reduce misregistration in the head and neck in whole-body PET/CT studies. J Nucl Med. 2005; 46: 596-602.
[13] Czernin J and Schelbert H. PET/CT imaging: facts, opinions, hopes, and questions. J Nucl Med. 2004; 45: 1S-3S.
[14] Vogel WV, Oyen WJ, Barentsz JO, Kaanders JH, and Corstens FH. PET/CT: panacea, redundancy, or something in between? J Nucl Med. 2004; 45 Suppl 1: 15S-24S.
[15] Hany TF, Steinert HC, Goerres GW, Buck A, and von Schulthess GK. PET diagnostic accuracy: improvement with in-line PET-CT system-initial results. Radiology. 2002; 225: 575-581.
[16] Kak AC and Slaney M. Principles of Computerized Tomographic Imaging. Electronic Copy ed., 1999. New York: IEEE PRESS.
[17] Turkington TG. Introduction to PET instrumentation. J. Nuc. Med. Technol. 2001; 29: 1-8.
[18] Zaidi H. Scatter modelling and correction strategies in fully 3D PET. Nucl Med Commun. 2001; 22: 1181-1184.
[19] Osman MM, Cohade C, Nakamoto Y, and Wahl RL. Respiratory motion artifacts on PET emission images obtained using CT attenuation correction on PET-CT. Eur J Nucl Med Mol Imaging. 2003; 30: 603-606.
[20] Zaidi H and Hasegawa BH. Determination of the attenuation map in emission tomography. J Nucl Med. 2003; 44: 291-315.
[21] Rousset OG, Ma Y, and Evans AC. Correction for partial volume effects in PET: principle and validation. J Nucl Med. 1998; 39: 904-911.
[22] Braem A, Llatas MC, Chesi E, Correia JG, Garibaldi F, Joram C, et al. Feasibility of a novel design of high resolution parallax-free compton enhanced PET scanner dedicated to brain research. Phys. Med. Biol. 2004; 49: 2547-2562.
[23] Sanchez-Crespo A, Andreo A, and Larsson SM. Positron flight in human tissues and its influence on PET image spatial resolution. Eur. J. Nucl. Med. 2003; 31: 44-51.
[24] Lonneux M, Borbath I, Bol A, Coppens A, Sibomana M, Bausart R, et al. Attenuation correction in whole-body FDG oncological studies: the role of statistical reconstruction. Eur J Nucl Med. 1999; 26: 591-598.
[25] Bailey DL. Transmission scanning in emission tomography. Eur J Nucl Med. 1998; 25: 774-787.
[26] Zaidi H, Montandon M-L, and Slosman DO. Magnetic resonance imaging-guided attenuation and scatter corrections in three-dimensional brain positron emission tomography. Med Phys. 2003; 30: 937-948.
[27] Zaidi H and Hasegawa B. Determination of the attenuation map in emission tomography. J. Nucl. Med. 2003; 44: 291-315.
[28] Kinahan PE, Hasegawa BH, and Beyer T. X-ray-based attenuation correction for positron emission tomography/computed tomography scanners. Semin Nucl Med. 2003; 33: 166-179.
[29] Comtat C, Kinahan PE, Fessler JA, Beyer T, Townsend DW, Defrise M, et al. Clinically feasible reconstruction of 3D whole-body PET/CT data using blurred anatomical labels. Phys Med Biol. 2002; 47: 1-20.
[30] Beyer T, Kinaham PE, Townsend DW, and Sashin D. The use of X-ray CT for attenuation correction of PET data. in Proc. IEEE Nuclear

Dow
nloa
ded
from
http
://jo
urna
ls.tu
ms.
ac.ir
/ on
Sun
day,
Jul
y 15
, 201
2
Ay et al. Sources of Error and Artifact in CTAC in PET/CT
Iran J Nucl Med 2007; Vol 15, No 2 (Serial No 28)
25
Science Symposium and Medical Imaging Conference., Rome, Italy, 1995; 1573 - 1577.
[31] Kinahan PE, Townsend DW, Beyer T, and Sashin D. Attenuation correction for a combined 3D PET/CT scanner. Med Phys. 1998; 25: 2046-2053.
[32] Bai C, Shao L, Da Silva AJ, and Zhao Z. A generalized model for the conversion from CT numbers to linear attenuation coefficients. IEEE Trans Nucl Sci. 2003; 50: 1510-1515.
[33] Guy MJ, Castellano-Smith IA, Flower MA, Flux GD, Ott RJ, and Visvikis D. DETECT-dual energy transmission estimation CT-for improved attenuation correction in SPECT and PET. IEEE Trans Nucl Sci. 1998; 45: 1261 -1267.
[34] Beyer T, Antoch G, Muller SP, Egelhof T, Freudenberg LS, Debatin JF, et al. Acquisition protocol considerations for combined PET/CT Imaging. J Nucl Med. 2004; 45: 25s-35s.
[35] Kinahan PE, Hasegawa B, and Beyer T. X-ray-based attenuation correction for positron emission tomography/computed tomography scanners. Semin. Nucl. Med. 2003; 34: 166-179.
[36] DiFilippo FP and Brunken RC. Do implanted pacemaker leads and ICD leads cause metal-related artifact in cardiac PET/CT? J Nucl Med. 2005; 46: 436-443.
[37] Goerres GW, Hany TF, Kamel E, von Schulthess GK, and Buck A. Head and neck imaging with PET and PET/CT: artifacts from dental metallic implants. Eur J Nucl Med Mol Imaging. 2002; 29: 367-370.
[38] Goerres GW, Ziegler SI, Burger C, Berthold T, Von Schulthess GK, and Buck A. Artifacts at PET and PET/CT caused by metallic hip prosthetic material. Radiology. 2003; 226: 577-584.
[39] Heiba SI, Luo J, Sadek S, Macalental E, Cacavio A, Rosen G, et al. Attenuation-correction induced artifact in F-18 FDG PET imaging following total knee replacement. Clin Positron Imaging. 2000; 3: 237-239.
[40] Kamel EM, Burger C, Buck A, von Schulthess GK, and Goerres GW. Impact of metallic dental implants on CT-based attenuation correction in a combined PET/CT scanner. Eur Radiol. 2003; 13: 724-728.
[41] Antoch G, Freudenberg LS, Beyer T, Bockisch A, and Debatin JF. To enhance or not to enhance? 18F-FDG and CT contrast agents in dual-modality 18F-FDG PET/CT. J Nucl Med. 2004; 45 Suppl 1: 56S-65S.
[42] Antoch G, Freudenberg LS, Stattaus J, Jentzen W, Mueller SP, Debatin JF, et al. Whole-body
positron emission tomography-CT: optimized CT using oral and IV contrast materials. AJR Am J Roentgenol. 2002; 179: 1555-1560.
[43] Ay MR and Zaidi H. Assessment of errors caused by x-ray scatter and use of contrast medium when using CT-based attenuation correction in PET. Eur J Nucl Med Mol Imaging. 2006; 33: 1301-1313.
[44] Ay MR and Zaidi H. Simulation-based assessment of the impact of contrast medium on CT-based attenuation correction in PET. in Proceedings of IEEE Nuclear Science Symposium & Medical Imaging Conference, San Diego, USA, 2006; 3326-3330.
[45] Dizendorf E, Hany TF, Buck A, von Schulthess GK, and Burger C. Cause and magnitude of the error induced by oral CT contrast agent in CT-based attenuation correction of PET emission studies. J Nucl Med. 2003; 44: 732-738.
[46] Dizendorf EV, Treyer V, Von Schulthess GK, and Hany TF. Application of oral contrast media in coregistered positron emission tomography-CT. AJR Am J Roentgenol. 2002; 179: 477-481.
[47] Nakamoto Y, Chin BB, Kraitchman DL, Lawler LP, Marshall LT, and Wahl RL. Effects of nonionic intravenous contrast agents at PET/CT imaging: phantom and canine studies. Radiology. 2003; 227: 817-824.
[48] Nehmeh SA, Erdi YE, Kalaigian H, Kolbert KS, Pan T, Yeung H, et al. Correction for oral contrast artifacts in CT attenuation-corrected PET images obtained by combined PET/CT. J Nucl Med. 2003; 44: 1940-1944.
[49] Beyer T, Rosenbaum S, Veit P, Stattaus J, Muller SP, Difilippo FP, et al. Respiration artifacts in whole-body (18)F-FDG PET/CT studies with combined PET/CT tomographs employing spiral CT technology with 1 to 16 detector rows. Eur J Nucl Med Mol Imaging. 2005; 32: 1429-1439.
[50] Erdi YE, Nehmeh SA, Pan T, Pevsner A, Rosenzweig KE, Mageras G, et al. The CT motion quantitation of lung lesions and its impact on PET-measured SUVs. J Nucl Med. 2004; 45: 1287-1292.
[51] Goerres GW, Kamel E, Seifert B, Burger C, Buck A, Hany TF, et al. Accuracy of image coregistration of pulmonary lesions in patients with non-small cell lung cancer using an integrated PET/CT system. J Nucl Med. 2002; 43: 1469-1475.
[52] Goerres GW, Schmid DT, and Eyrich GK. Do hardware artifacts influence the performance of head and neck PET scans in patients with oral

Dow
nloa
ded
from
http
://jo
urna
ls.tu
ms.
ac.ir
/ on
Sun
day,
Jul
y 15
, 201
2
Ay et al. Sources of Error and Artifact in CTAC in PET/CT
Iran J Nucl Med 2007; Vol 15, No 2 (Serial No 28)
26
cavity squamous cell cancer? Dentomaxillofac Radiol. 2003; 32: 365-371.
[53] Nehmeh SA, Erdi YE, Ling CC, Rosenzweig KE, Squire OD, Braban LE, et al. Effect of respiratory gating on reducing lung motion artifacts in PET imaging of lung cancer. Med Phys. 2002; 29: 366-371.
[54] Nehmeh SA, Erdi YE, Meirelles GS, Squire O, Larson SM, Humm JL, et al. Deep-inspiration breath-hold PET/CT of the thorax. J Nucl Med. 2007; 48: 22-26.
[55] Nehmeh SA, Erdi YE, Pan T, Pevsner A, Rosenzweig KE, Yorke E, et al. Four-dimensional (4D) PET/CT imaging of the thorax. Med Phys. 2004; 31: 3179-3186.
[56] Bockisch A, Beyer T, Antoch G, Freudenberg LS, Kuhl H, Debatin JF, et al. Positron emission tomography / computed tomography-Imaging protocols, artifacts, and pitfalls. Mol. Imag. Biol. 2004; 6: 188-199.
[57] Ay MR and Zaidi H. Computed Tomography-based attenuation correction in neurological positron emission tomography: evaluation of the effect of x-ray tube voltage on quantitative analysis. Nucl Med Commun. 2006; 27: 339-346.
[58] Kamel E, Hany TF, Burger C, Treyer V, Lonn AH, von Schulthess GK, et al. CT vs 68Ge attenuation correction in a combined PET/CT system: evaluation of the effect of lowering the CT tube current. Eur J Nucl Med Mol Imaging. 2002; 29: 346-350.
[59] Schaefer A, Seifert H, Donsch P, and Kirsch CM. Radiation exposure to patients caused by single-photon transmission measurement in PET. [German]. Nuklearmedizin. 2000; 39: 204-208.
[60] Wu T-H, Huang Y-H, Lee JS, Wang S-Y, Wang S-C, Su C-T, et al. Radiation exposure during transmission measurements: comparison between CT- and germanium-based techniques with a current PET scanner. Eur J Nucl Med Mol Imaging. 2004; 31: 38-43.
[61] Brix G, Lechel U, Glatting G, Ziegler SI, Munzing W, Muller SP, et al. Radiation exposure of patients undergoing whole-body dual-modality 18F-FDG PET/CT examinations. J Nucl Med. 2005; 46: 608-613.
[62] Krishnasetty V, Fischman AJ, Halpern EL, and Aquino SL. Comparison of alignment of computer-registered data sets: combined PET/CT versus independent PET and CT of the thorax. Radiology. 2005; 237: 635-639.
[63] Platten D. CT issues in PET/CT scanning. Medicines and Healthcare product Regulatory Agency (MHRA), London 2004.
[64] Qi J, Huesman R, and Reutter BW. Comparison of different CT-based attenuation correction schemes for PET with respiratory motion [abstract]. J Nucl Med. 2003; 44: 121.
[65] Goerres GW, Kamel E, Heidelberg TN, Schwitter MR, Burger C, and von Schulthess GK. PET-CT image co-registration in the thorax: influence of respiration. Eur J Nucl Med Mol Imaging. 2002; 29: 351-360.
[66] Goerres GW, Burger C, Schwitter MR, Heidelberg TN, Seifert B, and von Schulthess GK. PET/CT of the abdomen: optimizing the patient breathing pattern. Eur. Radiol. 2003; 13: 734-9.
[67] Nehmeh SA, Erdi YE, Pan T, Yorke E, Mageras GS, Rosenzweig KE, et al. Quantitation of respiratory motion during 4D-PET/CT acquisition. Med Phys. 2004; 31: 1333-1338.
[68] Nehmeh SA, Erdi YE, Rosenzweig KE, Schoder H, Larson SM, Squire OD, et al. Reduction of respiratory motion artifacts in PET imaging of lung cancer by respiratory correlated dynamic PET: methodology and comparison with respiratory gated PET. J Nucl Med. 2003; 44: 1644-1648.
[69] Pan T, Lee TY, Rietzel E, and Chen GT. 4D-CT imaging of a volume influenced by respiratory motion on multi-slice CT. Med Phys. 2004; 31: 333-340.
[70] Boucher L, Rodrigue S, Lecomte R, and Benard F. Respiratory gating for 3-dimensional PET of the thorax: feasibility and initial results. J Nucl Med. 2004; 45: 214-219.
[71] McClelland JR, Blackall JM, Tarte S, Chandler AC, Hughes S, Ahmad S, et al. A continuous 4D motion model from multiple respiratory cycles for use in lung radiotherapy. Med Phys. 2006; 33: 3348-3358.
[72] Nye JA, Esteves F, and Votaw JR. Minimizing artifacts resulting from respiratory and cardiac motion by optimization of the transmission scan in cardiac PET/CT. Med Phys. 2007; 34: 1901-1906.
[73] Visvikis D, Lamare F, Bruyant P, Boussion N, Turzo A, Bizais Y, et al. Respiratory motion in positron emission tomography for oncology applications: Problems and solutions. Nucl Instr Meth A. 2006; 569: 453-457.
[74] Beyer T, Antoch G, Blodgett T, Freudenberg LF, Akhurst T, and Mueller S. Dual-modality PET/CT imaging: the effect of respiratory motion on combined image quality in clinical
Dow
nloa
ded
from
http
://jo
urna
ls.tu
ms.
ac.ir
/ on
Sun
day,
Jul
y 15
, 201
2
Ay et al. Sources of Error and Artifact in CTAC in PET/CT
Iran J Nucl Med 2007; Vol 15, No 2 (Serial No 28)
27
oncology. Eur J Nucl Med Mol Imaging. 2003; 30: 588-596.
[75] Pan T, Mawlawi O, Nehmeh SA, Erdi YE, Luo D, Liu HH, et al. Attenuation correction of PET images with respiration-averaged CT images in PET/CT. J Nucl Med. 2005; 46: 1481-1487.
[76] Alessio AM, Kinahan PE, Cheng PM, H. V, and Karp JS. PET/CT scanner instrumentation, challenges, and solutions. Radiol Clin North Am. 2004; 42: 1017-1032.
[77] Beyer T, Bockisch A, Kuhl H, and Martinez MJ. Whole-body 18F-FDG PET/CT in the presence of truncation artifacts. J Nucl Med. 2006; 47: 91-99.
[78] Mawlawi O, Erasmus JJ, Pan T, Cody DD, Campbell R, Lonn AH, et al. Truncation artifact on PET/CT: impact on measurements of activity concentration and assessment of a correction algorithm. AJR Am J Roentgenol. 2006; 186: 1458-1667.
[79] Sureshbabu W and Mawlawi O. PET/CT imaging artifacts. J Nucl Med Technol. 2005; 33: 156-161.
[80] Carney JP, Townsend DW, Kinahan PE, Beyer T, Kachelriess K, De Man B, et al. CT-based attenuation correction: the effect of imaging with the arms in the field-of-view. J. Nucl. Med. 2001; 42: 56P-57P.
[81] Joseph PM and Ruth C. A method for simultaneous correction of spectrum hardening artifact in CT images containing both bone and iodine. Med. Phys. 1997; 24: 100-108.
[82] Zaidi H and Ay MR. Impact of x-ray scatter when using CT-based attenuation correction in PET: A Monte Carlo investigation. in Proceedings of IEEE Nuclear Science Symposium & Medical Imaging Conference, San Diego, USA, 2006; 2161-2165.
[83] Hasegawa BH, Iwata K, Wong KH, Wu MC, Da Silva AJ, Tang HR, et al. Dual-modality imaging of function and physiology. Acad Radiol. 2002; 9: 1305-1321.
[84] Antoch G, Kuehl H, Kanja J, Lauenstein TC, Schneemann H, Hauth E, et al. Dual-modality PET/CT scanning with negative oral contrast agent to avoid artifacts: introduction and evaluation. Radiology. 2004; 230: 879-885.
[85] Antoch G, Saoudi N, Kuehl H, Dahmen G, Mueller SP, Beyer T, et al. Accuracy of whole-body dual-modality fluorine-18-2-fluoro-2-deoxy-D-glucose positron emission tomography and computed tomography (FDG-PET/CT) for tumor staging in solid tumors: comparison with CT and PET. J Clin Oncol. 2004; 22: 4357-4368.
[86] Groves AM, Kayani I, Dickson JC, Townsend C, Croasdale I, Syed R, et al. Oral contrast medium in PET/CT: should you or shouldn't you? Eur J Nucl Med Mol Imaging. 2005; 32: 1160-1166.
[87] Yau Y-Y, Chan W-S, Tam Y-M, Vernon P, Wong S, Coel M, et al. Application of intravenous contrast in PET/CT: does it really introduce significant attenuation correction error? J Nucl Med. 2005; 46: 283-291.
[88] Berthelsen AK, Holm S, Loft A, Klausen TL, Andersen F, and Hojgaard L. PET/CT with intravenous contrast can be used for PET attenuation correction in cancer patients. Eur J Nucl Med Mol Imaging. 2005; 32: 1167-1175.
[89] Tang HR, Brown JK, Da Silva AJ, Matthay KK, Price DC, Huberty JP, et al. Implementation of a combined X-ray CT-scintillation camera imaging system for localizing and measuring radionuclide uptake: experiments in phantoms and patients. IEEE Trans Nucl Sci. 1999; 46: 551-557.
[90] Buther F, Stegger L, Dawood M, Range F, Schafers M, Fischbach R, et al. Effective methods to correct contrast agent-induced errors in PET quantification in cardiac PET/CT. J Nucl Med. 2007; 48: 1060-1068.
[91] Bidgoli J, Ay M, Sarkar S, Ahmadian A, and Zaidi H. Correction of oral contrast artifacts in CT-based attenuation correction of PET images using an automated segmentation algorithm. in Proceedings of IEEE Nuclear Science Symposium & Medical Imaging Conference, Hawaii, USA, 2007; in press.
[92] Ay MR, Bidgoli JH, Sarkar S, and Ahmadian A. Automatic segmentation of oral contrast enhanced CT images for artifact free attenuation correction in PET/CT. in Annual Congress of the European Association of Nuclear Medicine Copenhagen, Denmark, 2007.
[93] Carney JP, Townsend DW, Rappoport V, and Bendriem B. Method for transforming CT images for attenuation correction in PET/CT imaging. Med Phys. 2006; 33: 976-983.
[94] Rappoport V, Carnry JPJ, and Townsend DW. CT tube-voltage dependent attenuation correction scheme for PET/CT scanners. in IEEE Nuclear Science Symposium and Medical Imaging Conference, Oct. 19-22, Rome, Italy, 2004; 3853-3857.
[95] Berger MJ and Hubbell JH. XCOM: Photon cross sections on a personal computer. National Bureau of Standards (US), Gaithersburg, MD NBSIR 87-3597, 1987.

Dow
nloa
ded
from
http
://jo
urna
ls.tu
ms.
ac.ir
/ on
Sun
day,
Jul
y 15
, 201
2
Ay et al. Sources of Error and Artifact in CTAC in PET/CT
Iran J Nucl Med 2007; Vol 15, No 2 (Serial No 28)
28
[96] Ay MR and Zaidi H. Impact of x-ray tube settings and metallic leads on neurological PET imaging when using CT-based attenuation correction. Nucl Instr Meth A. 2006; 571: 411-417.
[97] Li J, Hsieh J, Colsher J, Stearns C, and Lonn AHR. Towards single ultra-low dose CT scan for both attenuation map creation and localization in PET-CT application. in Proc. IEEE Nuclear Science Symposium and Medical Imaging Conference, Oct. 19-22, Rome, Italy, 2004; 2396-2398.
[98] Brechtel K, Klein M, Vogel M, Mueller M, Aschoff P, Beyer T, et al. Optimized contrast-enhanced CT protocols for diagnostic whole-body 18F-FDG PET/CT: technical aspects of single-phase versus multiphase CT imaging. J Nucl Med. 2006; 47: 470-476.
[99] Wu TH, Chu TC, Huang YH, Chen LK, Mok SP, Lee JK, et al. A positron emission tomography/computed tomography (PET/CT) acquisition protocol for CT radiation dose optimization. Nucl Med Commun. 2005; 26: 323-330.
[100] Blodgett TM, McCook BM, and Federle MP. Positron emission tomography/computed tomography: protocol issues and options. Semin Nucl Med. 2006; 36: 157-168.
[101] Zaidi H. Optimization of whole-body PET/CT scanning protocols. Biomed Imaging Interv J. 2007; 3: in press.
[102] Pfannenberg AC, Aschoff P, Brechtel K, Muller M, Bares R, Paulsen F, et al. Low dose non-enhanced CT versus standard dose contrast-enhanced CT in combined PET/CT protocols for staging and therapy planning in non-small cell lung cancer. Eur J Nuc Med Mol Imaging. 2007; V34: 36-44.
[103] Gilman MD, Fischman AJ, Krishnasetty V, Halpern EF, and Aquino SL. Optimal CT breathing protocol for combined thoracic PET/CT. AJR Am J Roentgenol. 2006; 187: 1357-1360.
[104] Hamblen B and Lowe VJ. Clinical 18F-FDG oncology patient preparation techniques. J Nucl Med Technol. 2003; 31: 3-10.
[105] Landmann M and Glatting G. Quantitative image reconstruction in PET from emission data only using cluster analysis. Z Med Phys. 2003; 13: 269-274.
[106] Mesina CT, Boellaard R, Jongbloed G, van der Vaart AW, and Lammertsma AA. Experimental evaluation of iterative reconstruction versus filtered backprojection for 3D [15O]water PET activation studies using
statistical parametric mapping analysis. Neuroimage. 2003; 1: 1170-1179.
[107] Visvikis D, Costa DC, Croasdale I, Lonn AHR, Bomanji J, Gacinovic S, et al. CT-based attenuation correction in the calculation of semi-quantitative indices of [18F]-FDG uptake in PET. Eur J Nucl Med. 2003; 30: 344-353.
[108] Eckelman W, Tatum J, Kurdziel K, and Croft Y. Quantitative analysis of tumor biochemistry using PET and SPECT. Nucl Med Biol. 2000; 27: 633-635.
[109] Bailey DL.Quantitative procedures in 3D PET. in The theory and practice of 3D PET., Bendriem B and Townsend DW, Eds. Dordrecht, The Netherlands: Kluwer Academic Publishers, 1998; 55-109.
[110] Montandon M-L and Zaidi H. Quantitative analysis of template-based attenuation compensation in 3D brain PET. Comput Med Imaging Graph. 2007; 31: 28-38.
[111] Acton PD, Zhuang H, and Alavi A. Quantification in PET. Radiol Clin North Am. 2004; 42: 1055-1062.
[112] Thie JA. Understanding the standardised uptake value, its method, and implications for usage. J Nucl Med. 2004; 45: 1431-1434.
[113] Zasadny KR and Wahl R. Standardized uptake values of normal tissues at PET with 2-[fluorine-18]-fluoro-2-deoxy-D-glucose: variations with body weight and a method for correction. Radiology. 1993; 189: 847-850.
[114] Kim CK and Gupta NC. Dependency of standardized uptake values of fluorine-18 fluorodeoxyglucose on body size: comparison of body surface area correction and lean body mass correction. Nucl Med Comm. 1996; 17: 890-894.
[115] Alavi A, Lakhani P, Mavi A, Kung JW, and Zhuang H. PET: a revolution in medical imaging. Radiol Clin North Am. 2004; 42: 983-1001.
[116] Zaidi H. The quest for the ideal anato-molcular imaging fusion tool. Biomed Imaging Interv J. 2006; 2: e47.
[117] Alavi A, Mavi A, Basu S, and Fischman A. Is PET-CT the only option? Eur J Nuc Med Mol Imaging. 2007; 34: 819-821.
[118] Cherry SR. The 2006 Henry N. Wagner Lecture: Of Mice and Men (and Positrons)—Advances in PET Imaging Technology. J Nucl Med. 2006; 47: 1735-1745.
[119] Vernon P. VUE Point:bringing accuracy to PET reconstruction. GE Healthcare, Waukesha, USA 2005.

Dow
nloa
ded
from
http
://jo
urna
ls.tu
ms.
ac.ir
/ on
Sun
day,
Jul
y 15
, 201
2
Ay et al. Sources of Error and Artifact in CTAC in PET/CT
Iran J Nucl Med 2007; Vol 15, No 2 (Serial No 28)
29
[120] Casey ME. Point spread function reconstruction in PET. Siemens Medical Solution, Knoxville, USA 2007.
[121] Lewellen TK. Time-of-flight PET. Semin Nucl Med. 1998; 28: 268-275.
[122] Moses WW. Time of flight in PET revisited. IEEE Trans Nucl Sci. 2003; 50: 1325-1330.
[123] Surti S, Karp JS, Popescu LM, Daube-Witherspoon M, and Werner M. Investigation of Time-of-Flight benefit for fully 3-D PET. IEEE Trans Med Imaging. 2006; 25: 529-538.
[124] Surti S, Kuhn A, Werner M, Perkins AE, Kolthammer J, and Karp JS. Performance of Philips Gemini TF PET/CT scanner with special consideration for its time-of-flight imaging capabilities. J Nucl Med. 2007; 48: 471-480.
[125] Imaging Technology News. http://www.itnonline.net, 2007.
[126] Delbeke D, Martin WH, Patton JA, and Sandler MP. Value of iterative reconstruction, attenuation correction, and image fusion in the interpretation of FDG PET images with an integrated dual-head coincidence camera and X-ray-based attenuation maps. Radiology. 2001; 218: 163-171.
[127] Watson CC. New, faster, image-based scatter correction for 3D PET. IEEE Trans Nucl Sci. 2000; 47: 1587-1594.
[128] Meltzer CC, Kinahan PE, Greer PJ, Nichols TE, Comtat C, Cantwell MN, et al. Comparative evaluation of MR-based partial-volume correction schemes for PET. J Nucl Med. 1999; 40: 2053-2065.
[129] Pretorius PH, King MA, and Bruvant PP. Influence of mismatched CT anatomy on the accuracy of partial volume compensation in cardiac SPECT perfusion imaging. in Nuclear Science Symposium Conference Record, 2004 IEEE, 2004; 3213-3216.
[130] Shao Y, Cherry SR, Farahani K, Meadors K, Siegel S, Silverman RW, et al. Simultaneous PET and MR imaging. Phys Med Biol. 1997; 10: 1965-1970.
[131] Raylman RR, Hammer BE, and Christensen NL. Combined MRI-PET scanner: a Monte-Carlo evaluation of the improvements in PET resolution due to the effects of a static homogeneous magnetic field. IEEE Trans Nucl Sci. 1996; 43: 2406-2412.
[132] Seemann MD. Whole-body PET/MRI: the future in oncological imaging. Technol Cancer Res Treat. 2005; 4: 577-582.
[133] Pichler BJ, Judenhofer MS, Catana C, Walton JH, Kneilling M, Nutt RE, et al. Performance test of an LSO-APD detector in a
7-T MRI scanner for simultaneous PET/MRI. J Nucl Med. 2006; 47: 639-647.
[134] Gaa J, Rummeny EJ, and Seemann MD. Whole-body imaging with PET/MRI. Eur J Med Res. 2004; 30: 309-312.
[135] Zaidi H and Mawlawi O. Simultaneous PET/MR will replace PET/CT as the molecular multimodality imaging platform of choice. Med Phys. 2007; 34: 1525-1528.
Copyright © 2022 FDOKUMEN