Multidetector Computed Tomography Myocardial Perfusion Imaging During Adenosine Stress
8
Multidetector Computed Tomography Myocardial Perfusion Imaging During Adenosine Stress Richard T. George, MD,* Caterina Silva, MD,* Marco A. S. Cordeiro, MD, PHD,* Anthony DiPaula, BS,* Douglas R. Thompson, PHD, William F. McCarthy, PHD, Takashi Ichihara, PHD,¶ Joao A. C. Lima, MD, FACC,*§ Albert C. Lardo, PHD, FAHA*†‡§ Baltimore, Maryland; and Otawara, Japan OBJECTIVES The purpose of this study is to validate the accuracy of multidetector computed tomography (MDCT) to measure differences in regional myocardial perfusion during adenosine stress in a canine model of left anterior descending (LAD) artery stenosis, during first-pass, contrast-enhanced helical MDCT. BACKGROUND Myocardial perfusion imaging by MDCT may have significant implications in the diagnosis and treatment of coronary artery disease. METHODS Eight dogs were prepared with a LAD stenosis, and contrast-enhanced MDCT imaging was performed 5 min into adenosine infusion (0.14 to 0.21 mg/kg/min). Images were analyzed using a semiautomated approach to define the regional signal density (SD) ratio (myocardial SD/left ventricular blood pool SD) in stenosed and remote territories, and then compared with microsphere myocardial blood flow (MBF) measurements. RESULTS Mean MBF in stenosed versus remote territories was 1.37 0.46 ml/g/min and 1.29 0.48 ml/g/min at baseline (p NS) and 2.54 0.93 ml/g/min and 8.94 5.74 ml/g/min during adenosine infusion, respectively (p 0.05). Myocardial SD was 92.3 39.5 HU in stenosed versus 180.4 41.9 HU in remote territories (p 0.001). There was a significant linear association of the SD ratio with MBF in the stenosed territory (R 0.98, p 0.001) and between regional myocardial SD ratio and MBF 8 ml/g/min, slope 0.035, SE 0.007, p 0.0001. Overall, there was a significant non-linear relationship over the range of flows studied (LR chi-square [2 degrees of freedom] 31.8, p 0.0001). CONCLUSIONS Adenosine-augmented MDCT myocardial perfusion imaging provides semiquantitative measurements of myocardial perfusion during first-pass MDCT imaging in a canine model of LAD stenosis. (J Am Coll Cardiol 2006;48:153– 60) © 2006 by the American College of Cardiology Foundation Myocardial perfusion imaging (MPI) has proven to be a useful and reliable tool in the diagnosis and prognosis of patients with coronary artery disease (CAD) (1). Pharmacologic-induced coronary vasodilation with dipyri- damole or adenosine during the infusion of radionuclide tracers (Tl-201 or Tc-99m-sestamibi) has been shown to be as accurate as exercise stress testing with single-photon emission tomography in diagnosing coronary disease (2–6). In addition, MPI can assess the physiologic significance of a stenosis and appropriately risk stratify patients with intermediate stenoses (7). Multidetector computed tomography (MDCT) is a rapidly evolving technology with growing application in the noninva- sive diagnosis of CAD. The rapid advancement of MDCT technology over the past 5 years has greatly improved its spatial/temporal resolution and has expanded its application beyond coronary angiography towards a more comprehen- sive evaluation of cardiovascular disease, including function, viability, and perfusion (8 –10). In its current form, nonin- vasive coronary angiography by MDCT lacks nuclear stress testing’s ability to assess the functional significance of coronary lesions as supported by a recent study (11). In light of these observations, a novel method to assess myocardial perfusion during first-pass, contrast-enhanced MDCT would be of great value in the diagnosis and treatment of CAD. The purpose of this study is two-fold: 1) to validate the ability of MDCT to detect a reduction in perfusion in a myocardial territory supplied by a stenosed vessel during adenosine stress; and 2) to correlate MDCT-derived myocardial signal density (SD) with myocardial blood flow (MBF) measurements determined by microspheres. METHODS Animal preparation. The Animal Care and Use Commit- tee of the Johns Hopkins University School of Medicine approved all procedures. A total of 8 mongrel dogs (24.5 to 29.5 kg) were anesthetized with intravenous thiopental, intubated, and mechanically ventilated with isoflurane an- esthesia during preparation and MDCT scanning. After femoral cut downs, 8-F sheaths were placed in both femoral veins, right femoral artery, and the right internal jugular From the *Department of Medicine, Division of Cardiology, †Department of Biomedical Engineering, ‡Department of Surgery, and the §Department of Radiol- ogy, Johns Hopkins University School of Medicine, Baltimore, Maryland; Maryland Medical Research Institute, Baltimore, Maryland; and the ¶Toshiba Medical Systems Corporation, Otawara, Japan. Dr. Ichihara is an employee of Toshiba American Medical Systems, Inc. Drs. Lardo and Lima are, in part, funded by a research grant from Toshiba American Medical Systems, Inc. The terms of this arrangement are being managed by Johns Hopkins University in accordance with its conflict of interest policies. Research support: Donald W. Reynolds Foundation, Las Vegas, Nevada; Toshiba American Medical Systems, Tufton, California. Markus Schwaiger, MD, acted as Guest Editor for this paper. Manuscript received November 9, 2005; revised manuscript received February 28, 2006, accepted March 8, 2006. Journal of the American College of Cardiology Vol. 48, No. 1, 2006 © 2006 by the American College of Cardiology Foundation ISSN 0735-1097/06/$32.00 Published by Elsevier Inc. doi:10.1016/j.jacc.2006.04.014
-
Upload
independent -
Category
Documents
-
view
4 -
download
0
Transcript of Multidetector Computed Tomography Myocardial Perfusion Imaging During Adenosine Stress
MMRDJB
MuoPdtaeIai
est
BoMCMfbpTa
2
Journal of the American College of Cardiology Vol. 48, No. 1, 2006© 2006 by the American College of Cardiology Foundation ISSN 0735-1097/06/$32.00P
ultidetector Computed Tomographyyocardial Perfusion Imaging During Adenosine Stress
ichard T. George, MD,* Caterina Silva, MD,* Marco A. S. Cordeiro, MD, PHD,* Anthony DiPaula, BS,*ouglas R. Thompson, PHD,� William F. McCarthy, PHD,� Takashi Ichihara, PHD,¶
oao A. C. Lima, MD, FACC,*§ Albert C. Lardo, PHD, FAHA*†‡§altimore, Maryland; and Otawara, Japan
OBJECTIVES The purpose of this study is to validate the accuracy of multidetector computed tomography(MDCT) to measure differences in regional myocardial perfusion during adenosine stress ina canine model of left anterior descending (LAD) artery stenosis, during first-pass,contrast-enhanced helical MDCT.
BACKGROUND Myocardial perfusion imaging by MDCT may have significant implications in the diagnosisand treatment of coronary artery disease.
METHODS Eight dogs were prepared with a LAD stenosis, and contrast-enhanced MDCT imaging wasperformed 5 min into adenosine infusion (0.14 to 0.21 mg/kg/min). Images were analyzedusing a semiautomated approach to define the regional signal density (SD) ratio (myocardialSD/left ventricular blood pool SD) in stenosed and remote territories, and then comparedwith microsphere myocardial blood flow (MBF) measurements.
RESULTS Mean MBF in stenosed versus remote territories was 1.37 � 0.46 ml/g/min and 1.29 � 0.48ml/g/min at baseline (p � NS) and 2.54 � 0.93 ml/g/min and 8.94 � 5.74 ml/g/min duringadenosine infusion, respectively (p � 0.05). Myocardial SD was 92.3 � 39.5 HU in stenosedversus 180.4 � 41.9 HU in remote territories (p � 0.001). There was a significant linearassociation of the SD ratio with MBF in the stenosed territory (R � 0.98, p � 0.001) andbetween regional myocardial SD ratio and MBF �8 ml/g/min, slope � 0.035, SE � 0.007,p � 0.0001. Overall, there was a significant non-linear relationship over the range of flowsstudied (LR chi-square [2 degrees of freedom] � 31.8, p � 0.0001).
CONCLUSIONS Adenosine-augmented MDCT myocardial perfusion imaging provides semiquantitativemeasurements of myocardial perfusion during first-pass MDCT imaging in a canine modelof LAD stenosis. (J Am Coll Cardiol 2006;48:153–60) © 2006 by the American College
ublished by Elsevier Inc. doi:10.1016/j.jacc.2006.04.014
of Cardiology Foundation
sbsvvtc
mMt1pdm(
M
Ata2ief
yocardial perfusion imaging (MPI) has proven to be aseful and reliable tool in the diagnosis and prognosisf patients with coronary artery disease (CAD) (1).harmacologic-induced coronary vasodilation with dipyri-amole or adenosine during the infusion of radionuclideracers (Tl-201 or Tc-99m-sestamibi) has been shown to bes accurate as exercise stress testing with single-photonmission tomography in diagnosing coronary disease (2–6).n addition, MPI can assess the physiologic significance of
stenosis and appropriately risk stratify patients withntermediate stenoses (7).
Multidetector computed tomography (MDCT) is a rapidlyvolving technology with growing application in the noninva-ive diagnosis of CAD. The rapid advancement of MDCTechnology over the past 5 years has greatly improved its
From the *Department of Medicine, Division of Cardiology, †Department ofiomedical Engineering, ‡Department of Surgery, and the §Department of Radiol-gy, Johns Hopkins University School of Medicine, Baltimore, Maryland; �Marylandedical Research Institute, Baltimore, Maryland; and the ¶Toshiba Medical Systemsorporation, Otawara, Japan. Dr. Ichihara is an employee of Toshiba Americanedical Systems, Inc. Drs. Lardo and Lima are, in part, funded by a research grant
rom Toshiba American Medical Systems, Inc. The terms of this arrangement areeing managed by Johns Hopkins University in accordance with its conflict of interestolicies. Research support: Donald W. Reynolds Foundation, Las Vegas, Nevada;oshiba American Medical Systems, Tufton, California. Markus Schwaiger, MD,
cted as Guest Editor for this paper.
vManuscript received November 9, 2005; revised manuscript received February 28,
006, accepted March 8, 2006.
patial/temporal resolution and has expanded its applicationeyond coronary angiography towards a more comprehen-ive evaluation of cardiovascular disease, including function,iability, and perfusion (8–10). In its current form, nonin-asive coronary angiography by MDCT lacks nuclear stressesting’s ability to assess the functional significance oforonary lesions as supported by a recent study (11).
In light of these observations, a novel method to assessyocardial perfusion during first-pass, contrast-enhancedDCT would be of great value in the diagnosis and
reatment of CAD. The purpose of this study is two-fold:) to validate the ability of MDCT to detect a reduction inerfusion in a myocardial territory supplied by a stenosed vesseluring adenosine stress; and 2) to correlate MDCT-derivedyocardial signal density (SD) with myocardial blood flow
MBF) measurements determined by microspheres.
ETHODS
nimal preparation. The Animal Care and Use Commit-ee of the Johns Hopkins University School of Medicinepproved all procedures. A total of 8 mongrel dogs (24.5 to9.5 kg) were anesthetized with intravenous thiopental,ntubated, and mechanically ventilated with isoflurane an-sthesia during preparation and MDCT scanning. Afteremoral cut downs, 8-F sheaths were placed in both femoral
eins, right femoral artery, and the right internal jugular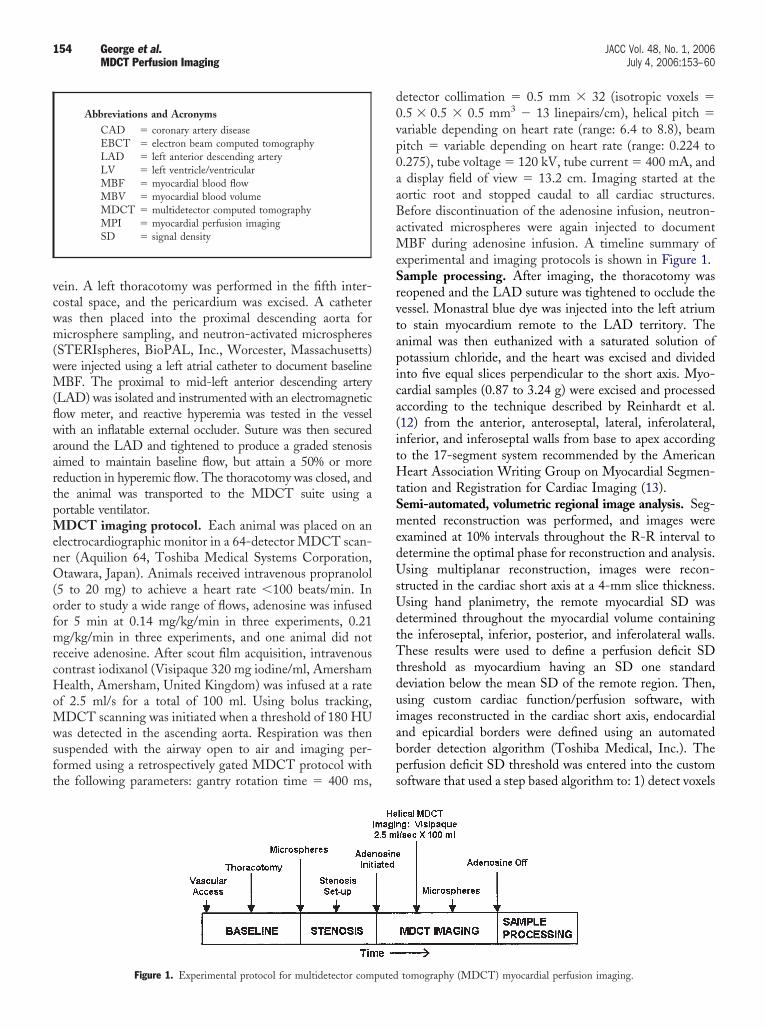
vcwm(wM(flwaartpMenO(ofmrcHoMwsft
d0vp0aaBaMeSrvtapica(itHtSmedUsUdtTtduiabps
154 George et al. JACC Vol. 48, No. 1, 2006MDCT Perfusion Imaging July 4, 2006:153–60
ein. A left thoracotomy was performed in the fifth inter-ostal space, and the pericardium was excised. A catheteras then placed into the proximal descending aorta foricrosphere sampling, and neutron-activated microspheres
STERIspheres, BioPAL, Inc., Worcester, Massachusetts)ere injected using a left atrial catheter to document baselineBF. The proximal to mid-left anterior descending artery
LAD) was isolated and instrumented with an electromagneticow meter, and reactive hyperemia was tested in the vesselith an inflatable external occluder. Suture was then secured
round the LAD and tightened to produce a graded stenosisimed to maintain baseline flow, but attain a 50% or moreeduction in hyperemic flow. The thoracotomy was closed, andhe animal was transported to the MDCT suite using aortable ventilator.
DCT imaging protocol. Each animal was placed on anlectrocardiographic monitor in a 64-detector MDCT scan-er (Aquilion 64, Toshiba Medical Systems Corporation,tawara, Japan). Animals received intravenous propranolol
5 to 20 mg) to achieve a heart rate �100 beats/min. Inrder to study a wide range of flows, adenosine was infusedor 5 min at 0.14 mg/kg/min in three experiments, 0.21g/kg/min in three experiments, and one animal did not
eceive adenosine. After scout film acquisition, intravenousontrast iodixanol (Visipaque 320 mg iodine/ml, Amershamealth, Amersham, United Kingdom) was infused at a rate
f 2.5 ml/s for a total of 100 ml. Using bolus tracking,DCT scanning was initiated when a threshold of 180 HU
as detected in the ascending aorta. Respiration was thenuspended with the airway open to air and imaging per-ormed using a retrospectively gated MDCT protocol withhe following parameters: gantry rotation time � 400 ms,
Abbreviations and AcronymsCAD � coronary artery diseaseEBCT � electron beam computed tomographyLAD � left anterior descending arteryLV � left ventricle/ventricularMBF � myocardial blood flowMBV � myocardial blood volumeMDCT � multidetector computed tomographyMPI � myocardial perfusion imagingSD � signal density
Figure 1. Experimental protocol for multidetector computed
etector collimation � 0.5 mm � 32 (isotropic voxels �.5 � 0.5 � 0.5 mm3 � 13 linepairs/cm), helical pitch �ariable depending on heart rate (range: 6.4 to 8.8), beamitch � variable depending on heart rate (range: 0.224 to.275), tube voltage � 120 kV, tube current � 400 mA, anddisplay field of view � 13.2 cm. Imaging started at the
ortic root and stopped caudal to all cardiac structures.efore discontinuation of the adenosine infusion, neutron-ctivated microspheres were again injected to document
BF during adenosine infusion. A timeline summary ofxperimental and imaging protocols is shown in Figure 1.ample processing. After imaging, the thoracotomy waseopened and the LAD suture was tightened to occlude theessel. Monastral blue dye was injected into the left atriumo stain myocardium remote to the LAD territory. Thenimal was then euthanized with a saturated solution ofotassium chloride, and the heart was excised and dividednto five equal slices perpendicular to the short axis. Myo-ardial samples (0.87 to 3.24 g) were excised and processedccording to the technique described by Reinhardt et al.12) from the anterior, anteroseptal, lateral, inferolateral,nferior, and inferoseptal walls from base to apex accordingo the 17-segment system recommended by the American
eart Association Writing Group on Myocardial Segmen-ation and Registration for Cardiac Imaging (13).emi-automated, volumetric regional image analysis. Seg-ented reconstruction was performed, and images were
xamined at 10% intervals throughout the R-R interval toetermine the optimal phase for reconstruction and analysis.sing multiplanar reconstruction, images were recon-
tructed in the cardiac short axis at a 4-mm slice thickness.sing hand planimetry, the remote myocardial SD wasetermined throughout the myocardial volume containinghe inferoseptal, inferior, posterior, and inferolateral walls.hese results were used to define a perfusion deficit SD
hreshold as myocardium having an SD one standardeviation below the mean SD of the remote region. Then,sing custom cardiac function/perfusion software, withmages reconstructed in the cardiac short axis, endocardialnd epicardial borders were defined using an automatedorder detection algorithm (Toshiba Medical, Inc.). Theerfusion deficit SD threshold was entered into the customoftware that used a step based algorithm to: 1) detect voxels
tomography (MDCT) myocardial perfusion imaging.
witpmpLccMn
wp
wamMSsaoiwvsatb(mm
SSmaptMtammmstmtstaI
R
OnairM8PcM9re
Fsf
155JACC Vol. 48, No. 1, 2006 George et al.July 4, 2006:153–60 MDCT Perfusion Imaging
ithin the defined SD range; 2) check for voxel continuityn the X, Y, and Z directions; 3) generate clusters of voxelshat meet the perfusion deficit definition; and 4) define theerfusion deficit as the largest cluster detected. Using thisethod, the software determined the mean SD of the
erfusion defect in HU and calculated its volume and mass.eft ventricular (LV) blood pool SD was determined byalculating the mean SD of the entire LV cavity. In order toompare myocardial SD measurements with microsphere
BF measurements, all myocardial signal intensities wereormalized as follows:
Myocardial SD Ratio �MeanMYOSD
MeanLVSD
here MYOSD � myocardial SD and LVSD � LV bloodool SD.Myocardial SD ratio determined in the perfusion deficit
as compared with microsphere-derived MBF. Addition-lly, myocardial SD ratio of the perfusion deficit and remoteyocardium were compared with microsphere-derivedBF over the range of flows studied.
lice-by-slice image analysis. Using segmented recon-truction described above, images were reconstructed in thexial plane with a 4-mm slice thickness and a cardiac phasef 80%. Using hand planimetry, regions of interest were drawnn the stenosed and remote territories for each slice, and the SDas determined. In order to determine if there was SDariation from base to apex secondary to the time the axiallice was acquired, SD for each slice from the base to LVpex was examined to verify that SD did not vary beyondhe signal noise (standard deviation) for each slice. Slice-y-slice SD was then normalized to the LV blood pool SDmyocardial SD ratio) as described above. Slice-by-sliceyocardial SD ratio was then compared with slice-by-sliceicrosphere-derived MBF.
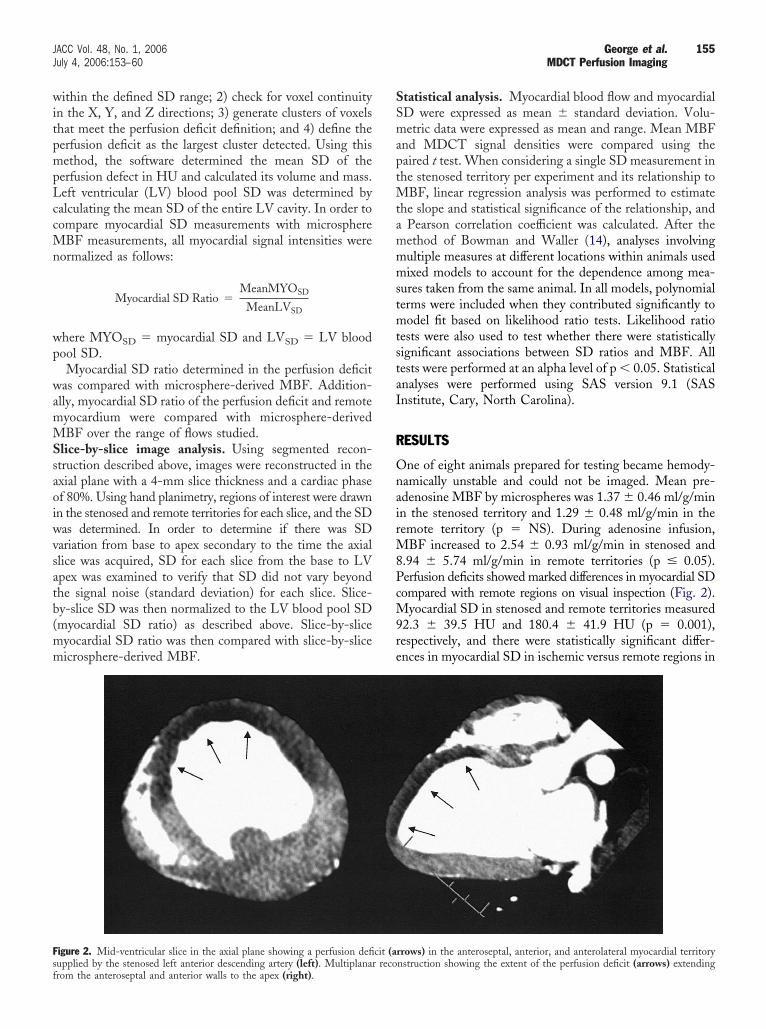
igure 2. Mid-ventricular slice in the axial plane showing a perfusion defi
upplied by the stenosed left anterior descending artery (left). Multiplanar recorom the anteroseptal and anterior walls to the apex (right).tatistical analysis. Myocardial blood flow and myocardialD were expressed as mean � standard deviation. Volu-etric data were expressed as mean and range. Mean MBF
nd MDCT signal densities were compared using theaired t test. When considering a single SD measurement inhe stenosed territory per experiment and its relationship to
BF, linear regression analysis was performed to estimatehe slope and statistical significance of the relationship, and
Pearson correlation coefficient was calculated. After theethod of Bowman and Waller (14), analyses involvingultiple measures at different locations within animals usedixed models to account for the dependence among mea-
ures taken from the same animal. In all models, polynomialerms were included when they contributed significantly toodel fit based on likelihood ratio tests. Likelihood ratio
ests were also used to test whether there were statisticallyignificant associations between SD ratios and MBF. Allests were performed at an alpha level of p � 0.05. Statisticalnalyses were performed using SAS version 9.1 (SASnstitute, Cary, North Carolina).
ESULTS
ne of eight animals prepared for testing became hemody-amically unstable and could not be imaged. Mean pre-denosine MBF by microspheres was 1.37 � 0.46 ml/g/minn the stenosed territory and 1.29 � 0.48 ml/g/min in theemote territory (p � NS). During adenosine infusion,
BF increased to 2.54 � 0.93 ml/g/min in stenosed and.94 � 5.74 ml/g/min in remote territories (p � 0.05).erfusion deficits showed marked differences in myocardial SDompared with remote regions on visual inspection (Fig. 2).
yocardial SD in stenosed and remote territories measured2.3 � 39.5 HU and 180.4 � 41.9 HU (p � 0.001),espectively, and there were statistically significant differ-nces in myocardial SD in ischemic versus remote regions in
rrows) in the anteroseptal, anterior, and anterolateral myocardial territory
cit (a nstruction showing the extent of the perfusion deficit (arrows) extending
eada��bs0ataacd
0ibMe([wFS0
vaofl
Ft(6c
Fafm
FldddoR0
156 George et al. JACC Vol. 48, No. 1, 2006MDCT Perfusion Imaging July 4, 2006:153–60
ach experiment (Fig. 3). The defect relative mass was onverage 14.7% (range 4.1% to 30.0%) of the LV myocar-ium. Flow reserve, calculated by dividing flow duringdenosine infusion by that territory’s baseline flow, was 1.9
0.6 in stenosed versus 7.3 � 4.7 in remote territories (p0.05). The ratio of the myocardial SD and the LV cavity
lood pool SD (MYOSD/LVSD) was 0.17 � 0.07 fortenosed versus 0.33 � 0.08 for remote territories (p �.01). The semiautomated volumetric analysis algorithmccurately identified the location of the perfusion defect inhe myocardial territory supplied by the stenosed LAD in allnimals during adenosine infusion (Fig. 4). For the semi-utomatic volumetric analysis method, there was a signifi-ant linear association of MYOSD/LVSD and microsphere-erived MBF in the stenosed territory, slope � 0.070, SE �
igure 3. Differences in myocardial signal density measured in myocardialerritories supplied by a stenosed left anterior descending coronary arteryopen bars) versus remote territories (solid bars) in experiments 1 through
receiving adenosine (p � 0.05). No significant difference noted in theontrol.
igure 4. (A) Shows a mid-ventricular slice of myocardium clearly shownterior descending coronary artery territory. (B) Shows the correspon
unction/perfusion software (Toshiba, Inc.), myocardium meeting the perfusion dyocardial signal density is designated in blue..007, p � 0.0001 (Pearson R � 0.98, p � 0.001) as shownn Figure 5. There was a significant non-linear relationshipetween regional SD ratio (MYOSD/LVSD) and absoluteBF in both the ischemic and remote regions over the
ntire range of flows studied and is shown in Figure 6Ay � �0.00168x2 � 0.04701x � 0.07604, LR chi-square2 degrees of freedom] � 31.8, p � 0.0001). However,hen considering absolute MBF �8 ml/g/min, as shown inigure 6B, there was a significant linear association betweenD ratio and MBF (slope � 0.035, SE � 0.007, p �.0001).A slice-by-slice analysis showed there was no significant
ariation in SD from slice to slice from the base to the LVpex when restricting the analysis within the remote portionf the myocardial wall. The relationship of SD ratio versusow in the slice-by-slice analysis was non-linear over the
mote territories stained with Monastral blue dye and the unstained leftmultiplanar reconstructed image in short axis. Using semiautomated
igure 5. Perfusion deficit myocardial signal density (SD) divided by theeft ventricular (LV) blood pool signal density (y-axis) versus microsphere-erived myocardial blood flow (x-axis) in the stenosed left anteriorescending artery territory determined by a semiautomated approach thatefines the perfusion deficit as one standard deviation below the mean SDf the remote myocardial territory. (y � 0.07037x � 0.00681, Pearson� 0.98, p � 0.001; LR chi-square [1 degree of freedom] � 19.21, SE �
.007, p � 0.0001) (n � 6).
ing reding
eficit signal density threshold of one standard deviation below the remote
r00
D
M1dadMdpualcs
wcbheb6Dsistapwitddtotmgv
mcomhmtaco
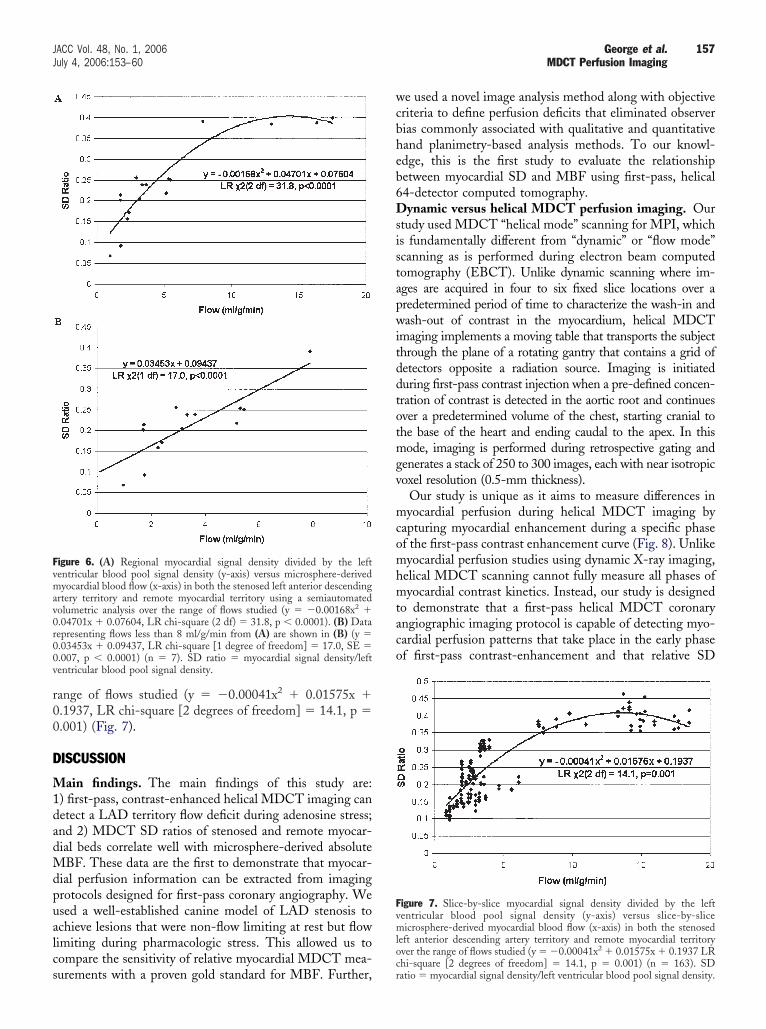
Fvmav0r00v
Fvmlo
157JACC Vol. 48, No. 1, 2006 George et al.July 4, 2006:153–60 MDCT Perfusion Imaging
ange of flows studied (y � �0.00041x2 � 0.01575x �.1937, LR chi-square [2 degrees of freedom] � 14.1, p �.001) (Fig. 7).
ISCUSSION
ain findings. The main findings of this study are:) first-pass, contrast-enhanced helical MDCT imaging canetect a LAD territory flow deficit during adenosine stress;nd 2) MDCT SD ratios of stenosed and remote myocar-ial beds correlate well with microsphere-derived absoluteBF. These data are the first to demonstrate that myocar-
ial perfusion information can be extracted from imagingrotocols designed for first-pass coronary angiography. Wesed a well-established canine model of LAD stenosis tochieve lesions that were non-flow limiting at rest but flowimiting during pharmacologic stress. This allowed us toompare the sensitivity of relative myocardial MDCT mea-
igure 6. (A) Regional myocardial signal density divided by the leftentricular blood pool signal density (y-axis) versus microsphere-derivedyocardial blood flow (x-axis) in both the stenosed left anterior descending
rtery territory and remote myocardial territory using a semiautomatedolumetric analysis over the range of flows studied (y � �0.00168x2 �.04701x � 0.07604, LR chi-square (2 df) � 31.8, p � 0.0001). (B) Dataepresenting flows less than 8 ml/g/min from (A) are shown in (B) (y �.03453x � 0.09437, LR chi-square [1 degree of freedom] � 17.0, SE �.007, p � 0.0001) (n � 7). SD ratio � myocardial signal density/leftentricular blood pool signal density.
urements with a proven gold standard for MBF. Further,cr
e used a novel image analysis method along with objectiveriteria to define perfusion deficits that eliminated observerias commonly associated with qualitative and quantitativeand planimetry-based analysis methods. To our knowl-dge, this is the first study to evaluate the relationshipetween myocardial SD and MBF using first-pass, helical4-detector computed tomography.ynamic versus helical MDCT perfusion imaging. Our
tudy used MDCT “helical mode” scanning for MPI, whichs fundamentally different from “dynamic” or “flow mode”canning as is performed during electron beam computedomography (EBCT). Unlike dynamic scanning where im-ges are acquired in four to six fixed slice locations over aredetermined period of time to characterize the wash-in andash-out of contrast in the myocardium, helical MDCT
maging implements a moving table that transports the subjecthrough the plane of a rotating gantry that contains a grid ofetectors opposite a radiation source. Imaging is initiateduring first-pass contrast injection when a pre-defined concen-ration of contrast is detected in the aortic root and continuesver a predetermined volume of the chest, starting cranial tohe base of the heart and ending caudal to the apex. In thisode, imaging is performed during retrospective gating and
enerates a stack of 250 to 300 images, each with near isotropicoxel resolution (0.5-mm thickness).
Our study is unique as it aims to measure differences inyocardial perfusion during helical MDCT imaging by
apturing myocardial enhancement during a specific phasef the first-pass contrast enhancement curve (Fig. 8). Unlikeyocardial perfusion studies using dynamic X-ray imaging,
elical MDCT scanning cannot fully measure all phases ofyocardial contrast kinetics. Instead, our study is designed
o demonstrate that a first-pass helical MDCT coronaryngiographic imaging protocol is capable of detecting myo-ardial perfusion patterns that take place in the early phasef first-pass contrast-enhancement and that relative SD
igure 7. Slice-by-slice myocardial signal density divided by the leftentricular blood pool signal density (y-axis) versus slice-by-sliceicrosphere-derived myocardial blood flow (x-axis) in both the stenosed
eft anterior descending artery territory and remote myocardial territoryver the range of flows studied (y � �0.00041x2 � 0.01575x � 0.1937 LR
hi-square [2 degrees of freedom] � 14.1, p � 0.001) (n � 163). SDatio � myocardial signal density/left ventricular blood pool signal density.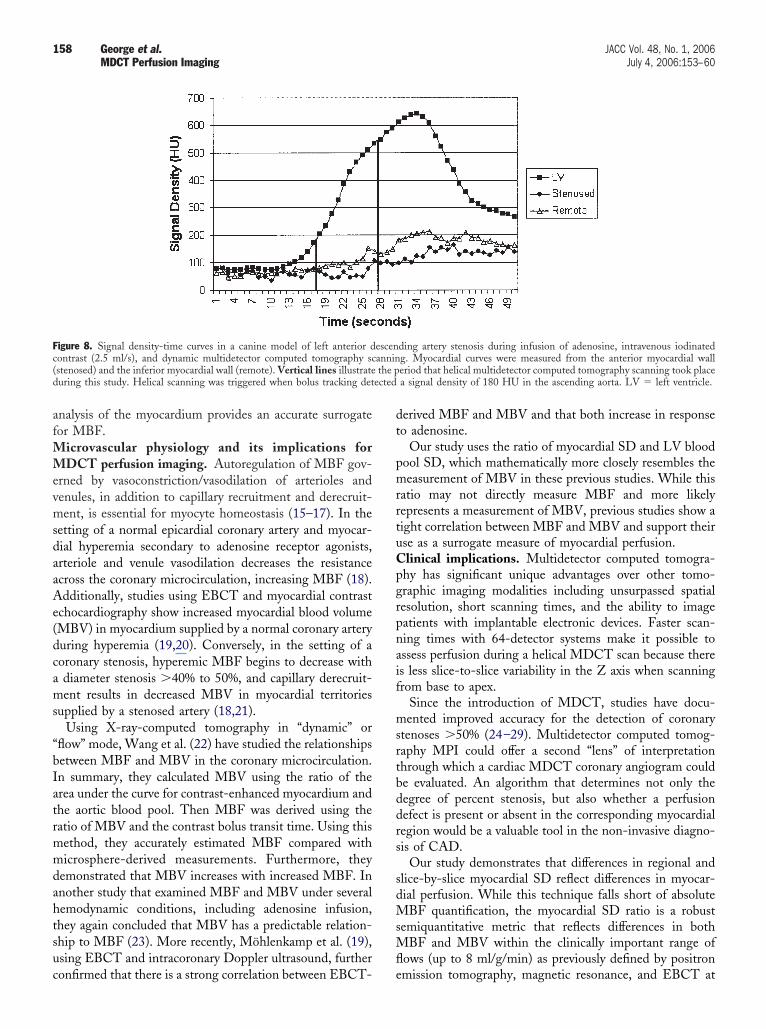
afMMevmsdaaAe(dcams
“bIatrmmdahtsuc
dt
pmrrtuCpgrpnaif
msrtbddrs
sdMsMfl
Fc( the pd ected
158 George et al. JACC Vol. 48, No. 1, 2006MDCT Perfusion Imaging July 4, 2006:153–60
nalysis of the myocardium provides an accurate surrogateor MBF.
icrovascular physiology and its implications forDCT perfusion imaging. Autoregulation of MBF gov-
rned by vasoconstriction/vasodilation of arterioles andenules, in addition to capillary recruitment and derecruit-ent, is essential for myocyte homeostasis (15–17). In the
etting of a normal epicardial coronary artery and myocar-ial hyperemia secondary to adenosine receptor agonists,rteriole and venule vasodilation decreases the resistancecross the coronary microcirculation, increasing MBF (18).dditionally, studies using EBCT and myocardial contrast
chocardiography show increased myocardial blood volumeMBV) in myocardium supplied by a normal coronary arteryuring hyperemia (19,20). Conversely, in the setting of aoronary stenosis, hyperemic MBF begins to decrease withdiameter stenosis �40% to 50%, and capillary derecruit-ent results in decreased MBV in myocardial territories
upplied by a stenosed artery (18,21).Using X-ray-computed tomography in “dynamic” or
flow” mode, Wang et al. (22) have studied the relationshipsetween MBF and MBV in the coronary microcirculation.n summary, they calculated MBV using the ratio of therea under the curve for contrast-enhanced myocardium andhe aortic blood pool. Then MBF was derived using theatio of MBV and the contrast bolus transit time. Using thisethod, they accurately estimated MBF compared withicrosphere-derived measurements. Furthermore, they
emonstrated that MBV increases with increased MBF. Innother study that examined MBF and MBV under severalemodynamic conditions, including adenosine infusion,hey again concluded that MBV has a predictable relation-hip to MBF (23). More recently, Möhlenkamp et al. (19),sing EBCT and intracoronary Doppler ultrasound, further
igure 8. Signal density-time curves in a canine model of left anterior dontrast (2.5 ml/s), and dynamic multidetector computed tomography scstenosed) and the inferior myocardial wall (remote). Vertical lines illustrateuring this study. Helical scanning was triggered when bolus tracking det
onfirmed that there is a strong correlation between EBCT- e
erived MBF and MBV and that both increase in responseo adenosine.
Our study uses the ratio of myocardial SD and LV bloodool SD, which mathematically more closely resembles theeasurement of MBV in these previous studies. While this
atio may not directly measure MBF and more likelyepresents a measurement of MBV, previous studies show aight correlation between MBF and MBV and support theirse as a surrogate measure of myocardial perfusion.linical implications. Multidetector computed tomogra-hy has significant unique advantages over other tomo-raphic imaging modalities including unsurpassed spatialesolution, short scanning times, and the ability to imageatients with implantable electronic devices. Faster scan-ing times with 64-detector systems make it possible tossess perfusion during a helical MDCT scan because theres less slice-to-slice variability in the Z axis when scanningrom base to apex.
Since the introduction of MDCT, studies have docu-ented improved accuracy for the detection of coronary
tenoses �50% (24–29). Multidetector computed tomog-aphy MPI could offer a second “lens” of interpretationhrough which a cardiac MDCT coronary angiogram coulde evaluated. An algorithm that determines not only theegree of percent stenosis, but also whether a perfusionefect is present or absent in the corresponding myocardialegion would be a valuable tool in the non-invasive diagno-is of CAD.
Our study demonstrates that differences in regional andlice-by-slice myocardial SD reflect differences in myocar-ial perfusion. While this technique falls short of absoluteBF quantification, the myocardial SD ratio is a robust
emiquantitative metric that reflects differences in bothBF and MBV within the clinically important range of
ows (up to 8 ml/g/min) as previously defined by positron
ding artery stenosis during infusion of adenosine, intravenous iodinatedg. Myocardial curves were measured from the anterior myocardial walleriod that helical multidetector computed tomography scanning took placea signal density of 180 HU in the ascending aorta. LV � left ventricle.
escenannin
mission tomography, magnetic resonance, and EBCT at

bcMcSstiuMshe
meup
mdHacb
sIdsmsdCsuPdlpsp
ATt
RJR2
R
FmisPpUtbBc(Mr
159JACC Vol. 48, No. 1, 2006 George et al.July 4, 2006:153–60 MDCT Perfusion Imaging
aseline and during hyperemia (30–32). Clinical studiesurrently underway at our institution will determine if
DCT can reliably predict the physiological significance oforonary stenoses in patients (Fig. 9).tudy limitations. A potential limitation of using adeno-ine for stress MDCT MPI is tachycardia and arrhythmiashat can significantly degrade the quality of MDCT imag-ng. To offset the tachycardic effect, beta-blockers weresed, which, in turn, have been shown to increase hyperemicBF, and this may be more pronounced in ischemic
egments (33,34). Although this effect predisposed ourypothesis to failure, significant differences between isch-mic and remote myocardial segments were still detected.
Our study demonstrates the feasibility of evaluatingyocardial perfusion in a single scan in the setting of an
xperimental stenosis in the LAD territory only. It isnclear whether we would obtain the same results in
igure 9. First-pass, adenosine-augmented multidetector computed to-ography (MDCT) myocardial perfusion imaging in a patient referred for
nvasive angiography after single-photon emission computed tomographyhowed a fixed perfusion deficit in the inferior and inferolateral territories.anels A and C demonstrate an inferior and inferolateral subendocardialerfusion deficit in the mid and distal left ventricle, respectively (arrows).sing semi-automated function/perfusion software, myocardium meeting
he perfusion deficit signal density threshold of one standard deviationelow the remote myocardial signal density is designated in blue in panels
and D. Invasive angiography shows a chronically occluded distal rightoronary artery with left to right collaterals filling the posterior descendingarrows) and posterolateral branches (E). (F) 17-segment polar plot of
DCT-derived myocardial signal densities. Note the hypoperfused infe-ior and inferolateral regions displayed in blue.
atients with stenoses in other territories or who may have
ultiple stenoses making it difficult to define perfusioneficits indexed or normalized to normal myocardium.uman studies may require either a rest and stress scan or,
lternatively, may require defining normal values forontrast-enhanced myocardium normalized to the LVlood pool SD.Lastly, beam-hardening artifacts can have an MDCT
ignal appearance that closely resembles a perfusion deficit.n the current study, beam hardening artifacts were easilyistinguishable from perfusion deficits because they hadeveral unique characteristics including a triangular, trans-ural, and hypoenhanced appearance emanating from a
tructure with a high SD, and they did not follow theistribution of a coronary vascular bed.onclusions. Adenosine-augmented MDCT MPI can be
uccessfully performed in a canine model of LAD stenosissing first-pass, contrast-enhanced helical MDCT imaging.erfusion deficits can be detected visually, and the myocar-ial SD ratio provides a semiquantitative metric that corre-
ates well with microsphere-derived MBF. The ability toerform MPI during MDCT coronary imaging could haveignificant implications in the diagnosis and treatment ofatients with CAD.
cknowledgmenthe authors thank Jorge Guzman for his technical assis-
ance in this project.
eprint requests and correspondence: Dr. Albert C. Lardo,ohns Hopkins School of Medicine, Division of Cardiology, 720utland Avenue, 1042 Ross Building, Baltimore, Maryland1205. E-mail: [email protected].
EFERENCES
1. Klocke FJ, Baird MG, Lorell BH, et al. ACC/AHA/ASNC guide-lines for the clinical use of cardiac radionuclide imaging—executivesummary: a report of the American College of Cardiology/AmericanHeart Association Task Force on Practice Guidelines (ACC/AHA/ASNC Committee to Revise the 1995 Guidelines for the ClinicalUse of Cardiac Radionuclide Imaging). J Am Coll Cardiol 2003;42:1318 –33.
2. Nguyen T, Heo J, Ogilby JD, Iskandrian AS. Single photon emissioncomputed tomography with thallium-201 during adenosine-inducedcoronary hyperemia: correlation with coronary arteriography, exercisethallium imaging and two-dimensional echocardiography. J Am CollCardiol 1990;16:1375–83.
3. Parodi O, Marcassa C, Casucci R, et al. Accuracy and safety oftechnetium-99m hexakis 2-methoxy-2-isobutyl isonitrile (sestamibi)myocardial scintigraphy with high dose dipyridamole test in patientswith effort angina pectoris: a multicenter study. Italian Group ofNuclear Cardiology. J Am Coll Cardiol 1991;18:1439–44.
4. Coyne EP, Belvedere DA, Vande Streek PR, Weiland FL, Evans RB,Spaccavento LJ. Thallium-201 scintigraphy after intravenous infusionof adenosine compared with exercise thallium testing in the diagnosisof coronary artery disease. J Am Coll Cardiol 1991;17:1289–94.
5. Nishimura S, Mahmarian JJ, Boyce TM, Verani MS. Equivalencebetween adenosine and exercise thallium-201 myocardial tomography:a multicenter, prospective, crossover trial. J Am Coll Cardiol 1992;20:265–75.
6. Gupta NC, Esterbrooks DJ, Hilleman DE, Mohiuddin SM. Com-
parison of adenosine and exercise thallium-201 single-photon emissioncomputed tomography (SPECT) myocardial perfusion imaging. The
1
1
1
1
1
1
1
1
1
1
2
2
2
2
2
2
2
2
2
2
3
3
3
3
3
160 George et al. JACC Vol. 48, No. 1, 2006MDCT Perfusion Imaging July 4, 2006:153–60
GE SPECT Multicenter Adenosine Study Group. J Am Coll Cardiol1992;19:248–57.
7. Miller DD, Donohue TJ, Younis LT, et al. Correlation of pharma-cological 99mTc-sestamibi myocardial perfusion imaging with post-stenotic coronary flow reserve in patients with angiographically inter-mediate coronary artery stenoses. Circulation 1994;89:2150–60.
8. Hoffmann U, Millea R, Enzweiler C, et al. Acute myocardial infarc-tion: contrast-enhanced multi-detector row CT in a porcine model.Radiology 2004;231:697–701.
9. Mahnken AH, Koos R, Katoh M, et al. Assessment of myocardialviability in reperfused acute myocardial infarction using 16-slicecomputed tomography in comparison to magnetic resonance imaging.J Am Coll Cardiol 2005;45:2042–7.
0. Lardo AC, Cordeiro MA, Silva C, et al. Contrast enhanced multi-detector computed tomography viability imaging following myocardialinfarction: characterization of myocyte death, microvascular obstruc-tion and chronic scar. Circulation 2006;113:394–404.
1. Hacker M, Jakobs T, Matthiesen F, et al. Comparison of spiralmultidetector CT angiography and myocardial perfusion imaging inthe noninvasive detection of functionally relevant coronary arterylesions: first clinical experiences. J Nucl Med 2005;46:1294–300.
2. Reinhardt CP, Dalhberg S, Tries MA, Marcel R, Leppo JA. Stablelabeled microspheres to measure perfusion: validation of a neutronactivation assay technique. Am J Physiol Heart Circ Physiol 2001;280:H108–16.
3. Cerqueira MD, Weissman NJ, Dilsizian V, et al. Standardizedmyocardial segmentation and nomenclature for tomographic imagingof the heart: a statement for healthcare professionals from the CardiacImaging Committee of the Council on Clinical Cardiology of theAmerican Heart Association. Circulation 2002;105:539–42.
4. Bowman FD, Waller LA. Modelling of cardiac imaging data withspatial correlation. Stat Med 2004;23:965–85.
5. Habazettl H, Vollmar B, Christ M, Baier H, Conzen PF, Peter K.Heterogeneous microvascular coronary vasodilation by adenosine andnitroglycerin in dogs. J Appl Physiol 1994;76:1951–60.
6. House SD, Johnson PC. Diameter and blood flow of skeletal musclevenules during local flow regulation. Am J Physiol 1986;250:H828 –37.
7. Jarhult J, Mellander S. Autoregulation of capillary hydrostatic pressurein skeletal muscle during regional arterial hypo- and hypertension.Acta Physiol Scand 1974;91:32–41.
8. Jayaweera AR, Wei K, Coggins M, Bin JP, Goodman C, Kaul S. Roleof capillaries in determining CBF reserve: new insights using myocar-dial contrast echocardiography. Am J Physiol 1999;277:H2363–72.
9. Möhlenkamp S, Behrenbeck TR, Lerman A, et al. Coronary micro-vascular functional reserve: quantification of long-term changes withelectron-beam CT preliminary results in a porcine model. Radiology2001;221:229–36.
0. Bin JP, Le E, Pelberg RA, Coggins MP, Wei K, Kaul S. Mechanismof inducible regional dysfunction during dipyridamole stress. Circula-
tion 2002;106:112–7.1. Uren NG, Melin JA, De Bruyne B, Wijns W, Baudhuin T, CamiciPG. Relation between myocardial blood flow and the severity ofcoronary-artery stenosis. N Engl J Med 1994;330:1782–8.
2. Wang T, Wu X-S, Chung N, et al. Myocardial blood flow estimatedby synchronous multislice, high-speed computed tomography. IEEETrans Med Imaging 1989;8:70–7.
3. Wu X-S, Ewert DL, Liu YH, Ritman EL. In vivo relation ofintramyocardial blood volume to myocardial perfusion. Evidencesupporting microvascular site for autoregulation. Circulation 1992;85:730–7.
4. Kuettner A, Beck T, Drosch T, et al. Diagnostic accuracy ofnoninvasive coronary imaging using 16-detector slice spiral computedtomography with 188 ms temporal resolution. J Am Coll Cardiol2005;45:123–7.
5. Nieman K, Cademartiri F, Lemos PA, Raaijmakers R, PattynamaPM, de Feyter PJ. Reliable noninvasive coronary angiography with fastsubmillimeter multislice spiral computed tomography. Circulation2002;106:2051–4.
6. Ropers D, Baum U, Pohle K, et al. Detection of coronary arterystenoses with thin-slice multi-detector row spiral computed tomogra-phy and multiplanar reconstruction. Circulation 2003;107:664–6.
7. Leber AW, Knez A, von Ziegler F, et al. Quantification of obstructiveand nonobstructive coronary lesions by 64-slice computed tomogra-phy: a comparative study with quantitative coronary angiography andintravascular ultrasound. J Am Coll Cardiol 2005;46:147–54.
8. Leschka S, Alkadhi H, Plass A, et al. Accuracy of MSCT coronaryangiography with 64-slice technology: first experience. Eur Heart J2005;26:1482–7.
9. Raff GL, Gallagher MJ, O’Neill WW, Goldstein JA. Diagnosticaccuracy of noninvasive coronary angiography using 64-slice spiralcomputed tomography. J Am Coll Cardiol 2005;46:552–7.
0. Bell MR, Lerman LO, Rumberger JA. Validation of minimallyinvasive measurement of myocardial perfusion using electron beamcomputed tomography and application in human volunteers. Heart1999;81:628–35.
1. Muehling OM, Jerosch-Herold M, Panse P, et al. Regional hetero-geneity of myocardial perfusion in healthy human myocardium:assessment with magnetic resonance perfusion imaging. J CardiovascMagn Reson 2004;6:499–507.
2. Krivokapich J, Smith GT, Huang SC, et al. 13N ammonia myocardialimaging at rest and with exercise in normal volunteers. Quantificationof absolute myocardial perfusion with dynamic positron emissiontomography. Circulation 1989;80:1328–37.
3. Bottcher M, Czernin J, Sun K, Phelps ME, Schelbert HR. Effect ofbeta 1 adrenergic receptor blockade on myocardial blood flow andvasodilatory capacity. J Nucl Med 1997;38:442–6.
4. Koepfli P, Wyss CA, Namdar M, et al. Beta-adrenergic blockade andmyocardial perfusion in coronary artery disease: differential effects instenotic versus remote myocardial segments. J Nucl Med 2004;45:
1626–31.