
From Anatomic Standardization Analysis of Perfusion SPECT Data to Perfusion Pattern Modeling
12
From Anatomic Standardization Analysis of Perfusion SPECT Data to Perfusion Pattern Modeling: Evidence of Functional Networks in Healthy Subjects and Temporal Lobe Epilepsy Patients 1 Christophe Grova, PhD, Pierre Jannin, PhD, Irène Buvat, PhD, Habib Benali, PhD, Jean-Yves Bansard, PhD, Arnaud Biraben, MD, Bernard Gibaud, PhD Rationale and Objectives. In the general context of perfusion pattern modeling from single-photon emission computed tomographic (SPECT) data, the purpose of this study is to characterize interindividual functional variability and functional connectivity between anatomic structures in a set of SPECT data acquired from a homogeneous population of subjects. Materials and Methods. From volume of interest (VOI)-perfusion measurements performed on anatomically standardized SPECT data, we proposed to use correspondence analysis (CA) and hierarchical clustering (HC) to explore the structure of statistical dependencies among these measurements. The method was applied to study the perfusion pattern in two pop- ulations of subjects; namely, SPECT data from 27 healthy subjects and ictal SPECT data from 10 patients with mesio– temporal lobe epilepsy (MTLE). Results. For healthy subjects, anatomic structures showing statistically dependent perfusion patterns were classified into four groups; namely, temporomesial structures, internal structures, posterior structures, and remaining cortex. For patients with MTLE, they were classified as temporomesial structures, surrounding temporal structures, internal structures, and re- maining cortex. Anatomic structures of each group showed similar perfusion behavior so that they may be functionally connected and may belong to the same network. Our main result is that the temporal pole and lenticular nucleus seemed to be highly relevant to characterize ictal perfusion in patients with MTLE. This exploratory analysis suggests that a network in- volving temporal structures, lenticular nucleus, brainstem, and cerebellum seems to be involved during MTLE seizures. Conclusion. CA followed by HC is a promising approach to explore brain perfusion patterns from SPECT VOI measure- ments. Key Words. Functional variability; single-photon emission computed tomography (SPECT); correspondence analysis (CA); hierarchical clustering (HC); mesio–temporal lobe epilepsy; ictal perfusion. © AUR, 2005 Single-photon emission computed tomography (SPECT) using technetium 99m ( 99m Tc)- hexylmethyl-propylene- amine oxime (HMPAO) or 99m Tc-ethylcysteinatedimer (ECD) as a radiotracer is the most widely applied technique to study cerebral blood flow (1). Ictal SPECT is a high-sen- sitive technique for imaging extreme perfusion changes oc- curring during an epileptic seizure (2). It provides valuable information for the presurgical investigation of epilepsy. A perfusion pattern is defined as a typical spatial organization of brain perfusion in a homogeneous set of SPECT data. Perfusion patterns may be used to characterize subtypes of a pathological state, for example, in temporal lobe epilepsy Acad Radiol 2005; 12:554 –565 1 From Laboratoire IDM Medical School, University of Rennes 1, 35043 Rennes Cedex, France (C.G., P.J., A.B., B.G.) and INSERM U642, University of Rennes 1, 35043 Rennes Cedex (J.-Y.B.); UMR 678 INSERM/UPMC, Laboratoire d’Imagerie Fonctionelle, Pitié Salpêtrière, Paris, France (I.B., H.B.). Re- ceived July 24, 2004; Accepted August 17. This work was supported in part by a grant from the Conseil Régional de Bretagne. Address corre- spondence to: C.G. 2 Current address: Montreal Neurological Institute, McGill University, Montreal, 3801 University Street, EEG department, Room 028, Montreal, Quebec, Canada, H3A 2B4. e-mail: [email protected] © AUR, 2005 doi:10.1016/j.acra.2004.08.014 554
-
Upload
univ-rennes1 -
Category
Documents
-
view
0 -
download
0
Transcript of From Anatomic Standardization Analysis of Perfusion SPECT Data to Perfusion Pattern Modeling

From Anatomic Standardization Analysis of
Perfusion SPECT Data to Perfusion PatternModeling:Evidence of Functional Networks in Healthy Subjects and Temporal Lobe
Epilepsy Patients1
Christophe Grova, PhD, Pierre Jannin, PhD, Irène Buvat, PhD, Habib Benali, PhD, Jean-Yves Bansard, PhD,Arnaud Biraben, MD, Bernard Gibaud, PhD
Rationale and Objectives. In the general context of perfusion pattern modeling from single-photon emission computedtomographic (SPECT) data, the purpose of this study is to characterize interindividual functional variability and functionalconnectivity between anatomic structures in a set of SPECT data acquired from a homogeneous population of subjects.Materials and Methods. From volume of interest (VOI)-perfusion measurements performed on anatomically standardizedSPECT data, we proposed to use correspondence analysis (CA) and hierarchical clustering (HC) to explore the structureof statistical dependencies among these measurements. The method was applied to study the perfusion pattern in two pop-ulations of subjects; namely, SPECT data from 27 healthy subjects and ictal SPECT data from 10 patients with mesio–temporal lobe epilepsy (MTLE).Results. For healthy subjects, anatomic structures showing statistically dependent perfusion patterns were classified intofour groups; namely, temporomesial structures, internal structures, posterior structures, and remaining cortex. For patientswith MTLE, they were classified as temporomesial structures, surrounding temporal structures, internal structures, and re-maining cortex. Anatomic structures of each group showed similar perfusion behavior so that they may be functionallyconnected and may belong to the same network. Our main result is that the temporal pole and lenticular nucleus seemed to behighly relevant to characterize ictal perfusion in patients with MTLE. This exploratory analysis suggests that a network in-volving temporal structures, lenticular nucleus, brainstem, and cerebellum seems to be involved during MTLE seizures.Conclusion. CA followed by HC is a promising approach to explore brain perfusion patterns from SPECT VOI measure-ments.Key Words. Functional variability; single-photon emission computed tomography (SPECT); correspondence analysis(CA); hierarchical clustering (HC); mesio–temporal lobe epilepsy; ictal perfusion.
© AUR, 2005
Acad Radiol 2005; 12:554–565
1 From Laboratoire IDM Medical School, University of Rennes 1, 35043 RennesCedex, France (C.G., P.J., A.B., B.G.) and INSERM U642, University of Rennes1, 35043 Rennes Cedex (J.-Y.B.); UMR 678 INSERM/UPMC, Laboratoired’Imagerie Fonctionelle, Pitié Salpêtrière, Paris, France (I.B., H.B.). Re-ceived July 24, 2004; Accepted August 17. This work was supported inpart by a grant from the Conseil Régional de Bretagne. Address corre-spondence to: C.G. 2Current address: Montreal Neurological Institute,McGill University, Montreal, 3801 University Street, EEG department, Room028, Montreal, Quebec, Canada, H3A 2B4. e-mail:[email protected]
©
AUR, 2005doi:10.1016/j.acra.2004.08.014554
Single-photon emission computed tomography (SPECT)using technetium 99m (99mTc)- hexylmethyl-propylene-amine oxime (HMPAO) or 99mTc-ethylcysteinatedimer(ECD) as a radiotracer is the most widely applied techniqueto study cerebral blood flow (1). Ictal SPECT is a high-sen-sitive technique for imaging extreme perfusion changes oc-curring during an epileptic seizure (2). It provides valuableinformation for the presurgical investigation of epilepsy. Aperfusion pattern is defined as a typical spatial organizationof brain perfusion in a homogeneous set of SPECT data.Perfusion patterns may be used to characterize subtypes of a
pathological state, for example, in temporal lobe epilepsy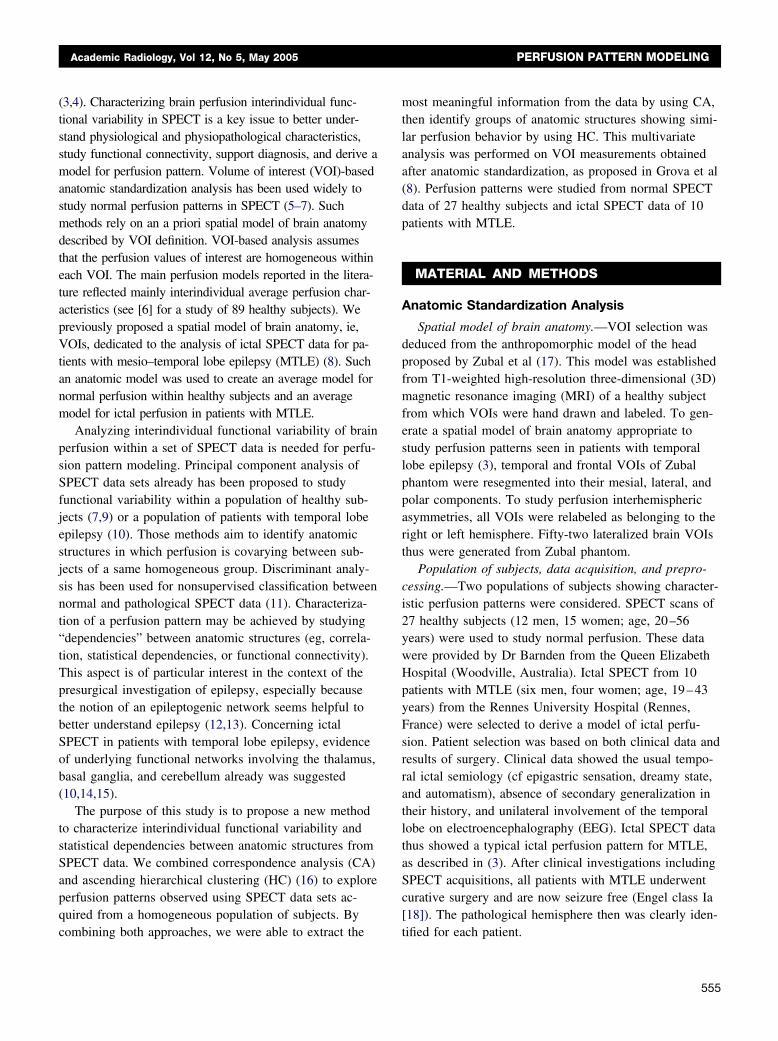
Academic Radiology, Vol 12, No 5, May 2005 PERFUSION PATTERN MODELING
(3,4). Characterizing brain perfusion interindividual func-tional variability in SPECT is a key issue to better under-stand physiological and physiopathological characteristics,study functional connectivity, support diagnosis, and derive amodel for perfusion pattern. Volume of interest (VOI)-basedanatomic standardization analysis has been used widely tostudy normal perfusion patterns in SPECT (5–7). Suchmethods rely on an a priori spatial model of brain anatomydescribed by VOI definition. VOI-based analysis assumesthat the perfusion values of interest are homogeneous withineach VOI. The main perfusion models reported in the litera-ture reflected mainly interindividual average perfusion char-acteristics (see [6] for a study of 89 healthy subjects). Wepreviously proposed a spatial model of brain anatomy, ie,VOIs, dedicated to the analysis of ictal SPECT data for pa-tients with mesio–temporal lobe epilepsy (MTLE) (8). Suchan anatomic model was used to create an average model fornormal perfusion within healthy subjects and an averagemodel for ictal perfusion in patients with MTLE.
Analyzing interindividual functional variability of brainperfusion within a set of SPECT data is needed for perfu-sion pattern modeling. Principal component analysis ofSPECT data sets already has been proposed to studyfunctional variability within a population of healthy sub-jects (7,9) or a population of patients with temporal lobeepilepsy (10). Those methods aim to identify anatomicstructures in which perfusion is covarying between sub-jects of a same homogeneous group. Discriminant analy-sis has been used for nonsupervised classification betweennormal and pathological SPECT data (11). Characteriza-tion of a perfusion pattern may be achieved by studying“dependencies” between anatomic structures (eg, correla-tion, statistical dependencies, or functional connectivity).This aspect is of particular interest in the context of thepresurgical investigation of epilepsy, especially becausethe notion of an epileptogenic network seems helpful tobetter understand epilepsy (12,13). Concerning ictalSPECT in patients with temporal lobe epilepsy, evidenceof underlying functional networks involving the thalamus,basal ganglia, and cerebellum already was suggested(10,14,15).
The purpose of this study is to propose a new methodto characterize interindividual functional variability andstatistical dependencies between anatomic structures fromSPECT data. We combined correspondence analysis (CA)and ascending hierarchical clustering (HC) (16) to exploreperfusion patterns observed using SPECT data sets ac-quired from a homogeneous population of subjects. By
combining both approaches, we were able to extract themost meaningful information from the data by using CA,then identify groups of anatomic structures showing simi-lar perfusion behavior by using HC. This multivariateanalysis was performed on VOI measurements obtainedafter anatomic standardization, as proposed in Grova et al(8). Perfusion patterns were studied from normal SPECTdata of 27 healthy subjects and ictal SPECT data of 10patients with MTLE.
MATERIAL AND METHODS
Anatomic Standardization Analysis
Spatial model of brain anatomy.—VOI selection wasdeduced from the anthropomorphic model of the headproposed by Zubal et al (17). This model was establishedfrom T1-weighted high-resolution three-dimensional (3D)magnetic resonance imaging (MRI) of a healthy subjectfrom which VOIs were hand drawn and labeled. To gen-erate a spatial model of brain anatomy appropriate tostudy perfusion patterns seen in patients with temporallobe epilepsy (3), temporal and frontal VOIs of Zubalphantom were resegmented into their mesial, lateral, andpolar components. To study perfusion interhemisphericasymmetries, all VOIs were relabeled as belonging to theright or left hemisphere. Fifty-two lateralized brain VOIsthus were generated from Zubal phantom.
Population of subjects, data acquisition, and prepro-cessing.—Two populations of subjects showing character-istic perfusion patterns were considered. SPECT scans of27 healthy subjects (12 men, 15 women; age, 20–56years) were used to study normal perfusion. These datawere provided by Dr Barnden from the Queen ElizabethHospital (Woodville, Australia). Ictal SPECT from 10patients with MTLE (six men, four women; age, 19–43years) from the Rennes University Hospital (Rennes,France) were selected to derive a model of ictal perfu-sion. Patient selection was based on both clinical data andresults of surgery. Clinical data showed the usual tempo-ral ictal semiology (cf epigastric sensation, dreamy state,and automatism), absence of secondary generalization intheir history, and unilateral involvement of the temporallobe on electroencephalography (EEG). Ictal SPECT datathus showed a typical ictal perfusion pattern for MTLE,as described in (3). After clinical investigations includingSPECT acquisitions, all patients with MTLE underwentcurative surgery and are now seizure free (Engel class Ia[18]). The pathological hemisphere then was clearly iden-
tified for each patient.555

GROVA ET AL Academic Radiology, Vol 12, No 5, May 2005
For 27 healthy subjects, SPECT images were acquiredby using a three-head gamma camera equipped with ultra-high-resolution parallel collimators (IRIX; Philips MedicalSystems, Cleveland, OH) after injection of 500 MBq of99mTc-HMPAO (120 projections over 360°; 128 � 128matrix; pixel size, 3.59 mm). For 10 patients with MTLE,ictal SPECT images were acquired by using a two-headDST-XL camera (General Electric Medical Systems, Buc,France) equipped with fan beam or parallel ultrahigh-resolution collimators (64 projections over 360°; 128 �128 matrix; pixel size, 4.51 mm). 99mTc-HMPAO, 740MBq, was injected 52 � 15.3 (SD) seconds after the on-set of the seizure, relying on EEG measurements (seizureduration, 92 � 23.3 seconds).
All SPECT data were reconstructed by using filteredback-projection with a ramp filter (Nyquist frequency cut-off). Reconstructed data were postfiltered with an 8-mmfull-width at half-maximum (FWHM) 3D Gaussian filter.Spatial resolution was FWHM of 12.2 mm for all recon-structed images. Scatter correction was performed onlyfor healthy subjects using the method of Jaszczak et al(19) by subtracting projections corresponding to a simul-taneous acquired Compton window. No simultaneous ac-quisition in a Compton window was available for retro-spective ictal SPECT data. Assuming uniform attenuationin the head, first-order Chang (20) attenuation correctionwas performed, with attenuation coefficients of � � 0.15cm�1 for scatter-corrected data and � � 0.12 cm�1 foruncorrected data (19).
Spatial normalization.—To perform SPECT measure-ments in VOIs of the spatial model (see Spatial model ofbrain anatomy), we used the spatial normalization methoddescribed by Friston et al (21) and implemented in theStatistical Parametric Mapping (SPM99; http://www.fil.ion.ucl.ac.uk/spm/) software. SPECT data and VOIs ofthe spatial model were both spatially normalized to amean anatomic reference volume, represented by the T1template provided by SPM, as follows:
1. A nonlinear geometric transformation was estimatedto match the 3D T1-weighted MRI of the Zubalphantom, and thus VOIs, on the T1 SPM template.
2. For 27 healthy subjects, SPECT images were spa-tially normalized to the SPECT template providedby SPM by using an affine geometric transforma-tion, as recommended by Acton and Friston (22);the SPECT SPM template is by construction in thesame referential as the T1 SPM template.
3. For 10 patients with MTLE, a two-step approach
556
was used to achieve spatial normalization of ictalSPECT data, which showed large hyperperfusedareas. First, an intermodality/intrapatient rigid regis-tration was performed between each patient’s ictalSPECT and MRI data by maximization of mutualinformation (23). Each subject’s 3D T1-weightedMRI then was spatially normalized to the T1 SPMtemplate by using a nonlinear geometrictransformation.
All these linear or nonlinear geometric transformationsallowed resampling of the SPECT data and VOIs in theunique mean anatomic reference, ie, the T1 SPM tem-plate, by using trilinear interpolation. Spatial normaliza-tion was checked visually by a neurosurgeon by superim-posing each SPECT, MRI, and VOI resampled in thismean anatomic reference volume (Figure 1). No signifi-cant deformation errors were detected visually.
Perfusion measurements and intensity normalization.—For each VOI j and each SPECT data set i, a perfusionmeasurement consisted of the estimation of the meanSPECT intensity xij within the VOI. To remove the con-founding effect of global interacquisition changes inSPECT, each measurement was normalized in intensity sothat mean voxel count throughout the brain was approxi-mately 50 counts/voxel.
Perfusion Pattern ModelingWhereas average perfusion models deduced from those
VOI measurements were proposed in (8), the purpose ofthis study is to provide a more detailed analysis of theunderlying distribution of those perfusion measurements.Functional variability was explored by analyzing thestructure of statistical dependencies between perfusionmeasurements. Considering VOIs and SPECT data sets astwo qualitative variables, we applied CA followed by HCto study statistical dependencies between those variables(16).
Correspondence Analysis (CA) and AscendingHierarchical Clustering (HC)
Generation of the contingency table.—CA relies on theanalysis of a contingency table N, where each element nij
describes the number of observed individuals partitionedamong the modalities i and j of two qualitative variables.In our study, the two qualitative variables were the ana-tomical entities, ie, VOIs, and SPECT data sets. More
precisely, to emphasize interhemispheric asymmetries dur-
atien
Academic Radiology, Vol 12, No 5, May 2005 PERFUSION PATTERN MODELING
ing the analysis, we considered measurements from bothhemispheres as two realizations of the same qualitativevariable. The variable VOInonlat thus described the name ofthe nonlateralized VOIs of our spatial model, whereas thevariable SubjectHem characterized the “name” of the mea-sured hemisphere of each subject. We distinguished leftversus right hemispheres for healthy subjects and ipsilat-eral versus contralateral hemispheres with respect to theepileptogenic focus for patients with MTLE. The variableSubjectHem is described by m1 � 2 � 27 � 54 modalitiesfor healthy subjects (m1 � 2 � 10 � 20 modalities forMTLE patients). VOInonlat is described by m2 � 52/2 �26 anatomical entities. A contingency table N was gener-ated by assigning the corresponding measurement xi=j= (cfPerfusion measurements and intensity normalization) toeach pair of SubjectHem and VOInonlat modalities.
Basics of CA estimates.—From a contingency table Ndescribed by m1 rows and m2 columns, CA estimatesrelationships between distribution profiles; namely, rela-tionships between row profiles or column profiles. A rowprofile i is defined by ni j /ni. for: j � �1,m2� where ni. isthe ith row sum. It represents the percentage of perfusionvalue stored in each VOInonlat for a particular SubjectHem.A row profile also may be considered as an individual (ie,
Figure 1. Multimodal data fusion for SPECT anatomic standardizon its MRI, both spatially normalized to the SPM T1 template; andperimposed on the spatially normalized ictal SPECT of the same p
a modality of SubjectHem) described by m2 variables (ie,
modalities of VOInonlat). Similarly, a column profile j de-fined by nij /n. j for: i � �1,m1� n. j being the jth columnsum, is the percentage of perfusion value stored in eachSubjectHem for a particular VOInonlat.
CA provides a multivariate analysis of the distributionshapes of those profiles (row or column) independentfrom the intensity of perfusion values. Similarities be-tween profiles are taken into account by using a �2 met-ric. The �2-distance between two row profiles i and i= isdefined by:
d�i, i′�2� �
j�1
m2 1
n. j�nij
ni.
�ni′j
ni′.�2
(3)
The �2-distance between two column profiles is de-fined similarly. CA may then be interpreted as a principalcomponent analysis (PCA) of those row profiles (or col-umn profiles) by using the �2 distance as a metric. The �2
distance is a well-known similarity measure of statisticaldependence between qualitative variables. Such metricmakes it possible to compare shapes of distribution pro-files, providing an analysis of the underlying structure ofstatistical dependencies among modalities of VOInonlat and
analysis: (a) ictal SPECT of a patient with epilepsy superimposedontal, temporal, and some internal VOIs of the spatial model su-t.
ation(b) fr
SubjectHem.
557
GROVA ET AL Academic Radiology, Vol 12, No 5, May 2005
A threshold on the decreasing eigenvalues resultingfrom CA is applied to select the subspace containing themost meaningful information. Variables, ie, column pro-files VOInonlat, and individuals, ie, row profiles SubjectHem,then were represented by their projections on the firstprincipal components.
Interpretation of results of CA using HC.—Within thesubspace selected by CA associated with the Euclidiandistance, we applied ascending HC on CA principal com-ponents to extract groups of variables VOInonlat or individ-uals SubjectHem considered as neighbors. Using the Wardcriterion to aggregate similar clusters at each level of HC(16), we obtained a classification tree of neighbor“points,” ie, variables or individuals. “Cutting” the treethen provided classification of those points. Points be-longing to the same cluster were considered statisticallydependent. Conversely, points located in different clusterswere considered closer to independence.
To help interpretation, the center of mass of each clus-ter of anatomic structures VOInonlat was projected on thetwo first principal components. The square cosine of theangle between each center of mass and its projection oneach principal component was assessed to evaluate thequality of the representation. All statistical analyses wereperformed using R software (http://www.r-project.org/).
RESULTS
Analysis of Perfusion Measurements in HealthySubjects
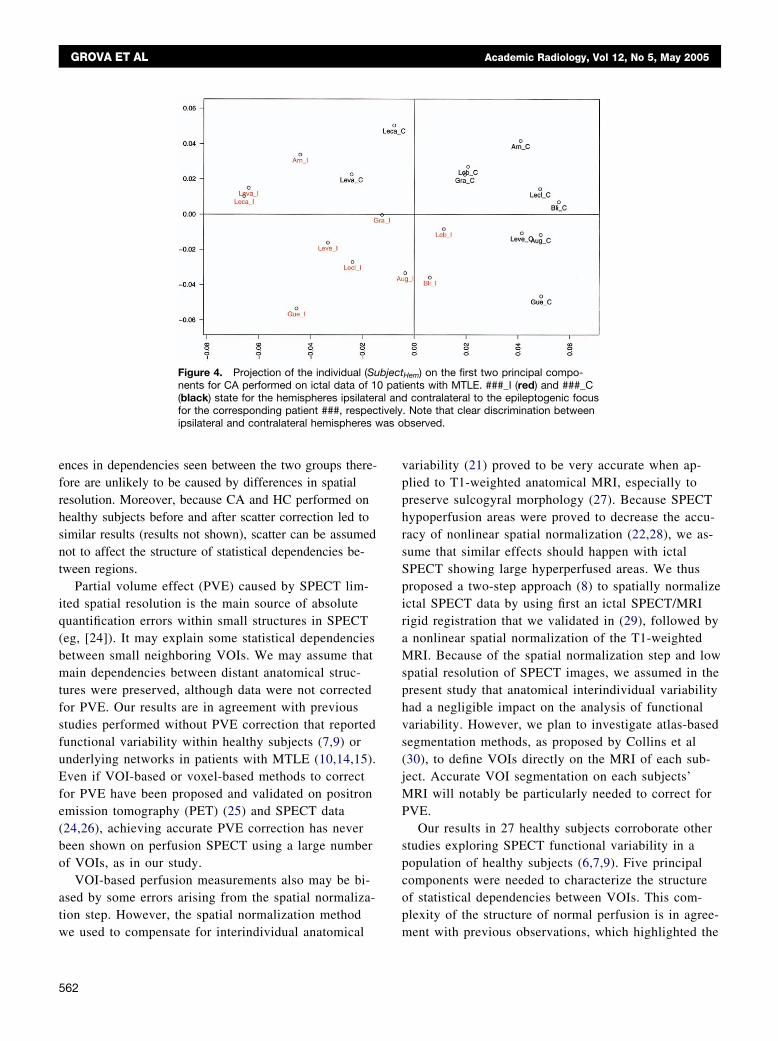
Projection of variables on the first two principal com-ponents is shown in Figure 2a. The first two principalcomponents corresponded to 34.3% of global inertia. ForHC, we selected the first five principal components, ac-counting for 67.5% of global inertia. By cutting the clas-sification tree presented in Figure 2b, HC allowed us todistinguish four groups of anatomic structures:
1. Internal structures: thalamus (contribution of 30.1%to the second principal component), caudate nucleus(contribution of 16.8% to the second principal com-ponent), basal ganglia (contribution of 12.5% to thesecond principal component), and lenticular nucleus
2. Temporomesial structures: amygdala (contributionof 49.7% to the first principal component and12.4% to the second), hippocampus, and temporalpole
3. Posterior structures: inside (occipital, occipitolateral,
558
and occipitomesial) and outside the cerebral cortex(cerebellum and brainstem)
4. Remaining cortex.
In each case, we indicated the structures presenting thegreatest contributions to the inertia projected on the firsttwo principal components. This analysis showed that thestructure of statistical dependencies between anatomicstructures for normal perfusion was complex because itclearly required more than two principal components tobe characterized accurately. Projections on the first twoprincipal components presented in Figure 2a thus may bemisleading. For all clusters except the posterior structureone, the center of mass of the cluster was representedaccurately on the first two principal components, showinghigh square cosines (Table 1). The cluster posterior struc-tures was represented better on the third and fourth prin-cipal components, and its projection close to the clusterremaining cortex on the first two principal components (cfFigure 2a) is misleading. These four groups of statisti-cally dependent anatomic structures, extracted by meansof HC by using five principal components, seemed highlyrelevant to characterize the normal perfusion pattern.Conversely, analysis of the individuals SubjectHem was notreally informative on this population (results not shown).
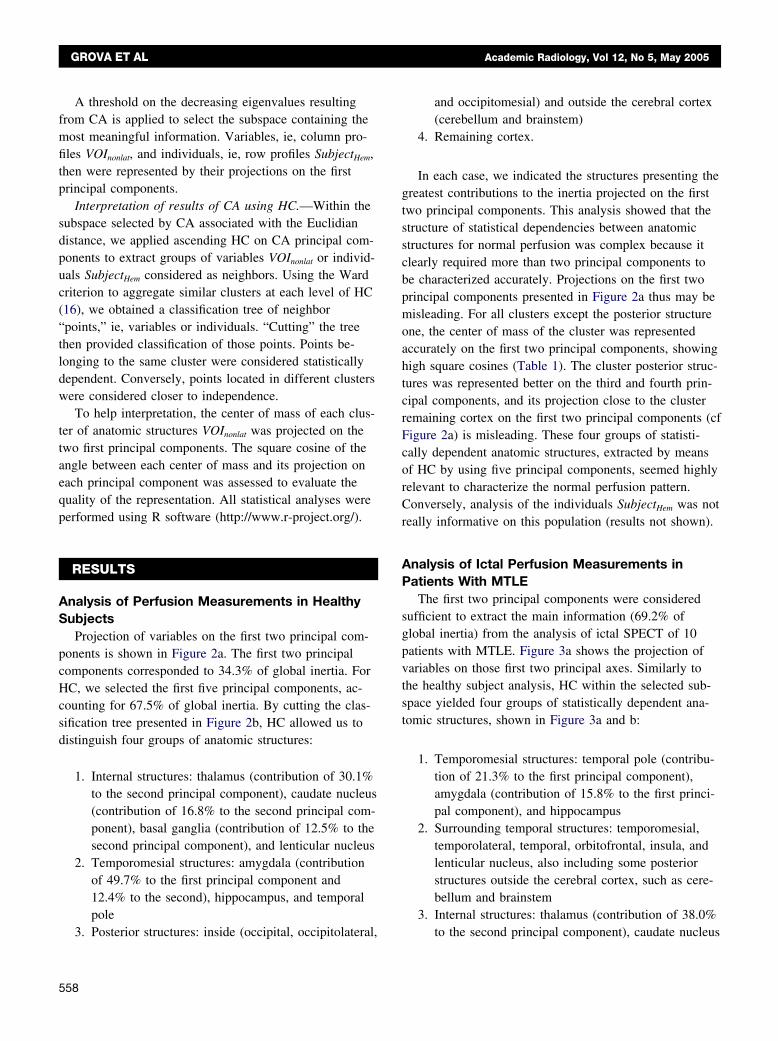
Analysis of Ictal Perfusion Measurements inPatients With MTLE
The first two principal components were consideredsufficient to extract the main information (69.2% ofglobal inertia) from the analysis of ictal SPECT of 10patients with MTLE. Figure 3a shows the projection ofvariables on those first two principal axes. Similarly tothe healthy subject analysis, HC within the selected sub-space yielded four groups of statistically dependent ana-tomic structures, shown in Figure 3a and b:
1. Temporomesial structures: temporal pole (contribu-tion of 21.3% to the first principal component),amygdala (contribution of 15.8% to the first princi-pal component), and hippocampus
2. Surrounding temporal structures: temporomesial,temporolateral, temporal, orbitofrontal, insula, andlenticular nucleus, also including some posteriorstructures outside the cerebral cortex, such as cere-bellum and brainstem
3. Internal structures: thalamus (contribution of 38.0%
to the second principal component), caudate nucleus
Academic Radiology, Vol 12, No 5, May 2005 PERFUSION PATTERN MODELING
Figure 2. Analysis of SPECT data from 27 healthy subjects: (a) projection of variables (VOInonlat) on the first two principal componentsand (b) classification tree obtained by means of HC after CA using five components. Several clusters of anatomical structures were ex-tracted from HC and are indicated on the dendrograms (b); namely, temporomesial structures (red o), internal structures (blue �), poste-rior structures (green �), and remaining cortex (black �). The center of mass of each cluster (*) was projected on the first two principalcomponents, and the corresponding name of the cluster is shown using the same color code and italic font. Note that better discrimina-tion between posterior structures and the remaining cortex clusters in (a) was observed on the third principal component. CORT, cortex;WM, white matter; AMYG, amygdala; HIPP, hippocampus; NCAU, caudate nucleus; BG, basal ganglia; NLEN, lenticular nucleus; THAL,thalamus; INS, insula; T, temporal; TPOL, temporal pole; TM, temporal mesial; TL, temporal lateral; TPOST, temporal posterior; F, frontal;FP, frontal pole; FO, orbito frontal; FM, frontal mesial; FL, frontal lateral; OCC, occipital; OCCM, occipital mesial; OCCL, occipital lateral;
PAR, parietal; CER, cerebellum; PONS, brainstem.559

GROVA ET AL Academic Radiology, Vol 12, No 5, May 2005
(contribution of 21.7% to the second principal com-ponent), and basal ganglia
4. Remaining cortex.
The centers of mass of all those clusters were repre-sented accurately on the first two principal components,showing high square cosines (Table 1). The first principalcomponent represented mainly the temporomesial versusremaining cortex clusters, whereas the second principalcomponent represented mainly the surrounding temporalversus internal structure clusters. Compared with the anal-ysis of healthy subjects, we observed a similar distinctionbetween temporomesial structures, internal structures, andremaining cortex. Nevertheless, some differences betweennormal and ictal perfusion patterns were observed. Thelenticular nucleus VOI belonging to the group of internalstructures for the healthy subject analysis was assigned tothe group of surrounding temporal structures, ie, close tothe pathological area. Although the temporal-pole VOIwas classified within the temporomesial cluster for bothanalyses, it has greater influence on the ictal perfusionpattern, showing a greater contribution to the first princi-pal component (21.1%). The anatomic structures temporalpole and lenticular nucleus thus seemed very relevant todescribe the ictal perfusion pattern seen during MTLE
Table 1Square Cosines of the Angle Between the Center of Mass ofEach Cluster of VOInonlat and Its Projection on the SelectedPrincipal Components
HC performed on healthy subjects
Cluster name Principal component
1st 2nd 3rd 4th 5th[Internal structures] 0.18 0.76 0.02 0.01 0.00[Temporo-mesial] 0.41 0.30 0.10 0.07 0.06[Posterior] 0.02 0.14 0.45 0.24 0.02[Remaining cortex] 0.63 0.02 0.02 0.10 0.00
HC performed on MTLE patients
1st 2nd[Internal structures] 0.11 0.87[Temporo-mesial] 0.92 0.04[Surrounding temporal] 0.14 0.69[Remaining cortex] 0.98 0.00
Note. Principal components on which clusters were better rep-resented (ie, smallest angles or highest square cosines) are pre-sented in bold.
HC, hierarchical clustering; MTLE, mesio–temporal lobe epi-
lepsy.560
seizures. Note that the cerebellum and brainstem alsowere associated with the surrounding temporal cluster,whereas occipital areas now were classified within theremaining cortex group. The dual representation showingthe projection of individuals on the first two principalcomponents, shown in Figure 4, highlights a relevant dis-crimination between hemispheres ipsilateral and contralat-eral to the epileptogenic focus.
DISCUSSION
We proposed to combine CA and ascending HC toexplore statistical dependencies among perfusion measure-ments performed using VOIs applied on anatomicallystandardized SPECT data. The method was used to studynormal perfusion measured in 27 healthy subjects andictal perfusion as seen in 10 patients with MTLE. Forboth groups, we found relevant structures of statisticaldependencies between perfusion measurements, suggest-ing that CA associated with HC is a promising approachto characterize functional variability among SPECT datasets acquired from a homogeneous population. By usingCA, our approach differed from previously reported stud-ies using PCA (7,9,10). CA theoretically extracts moregeneral links between variables than PCA because it ex-plores statistical dependencies between the shapes of per-fusion measurement profiles by using the �2 metric,whereas PCA assumes that distributions of perfusion mea-surements are Gaussian and explores correlations betweenthe intensity of perfusion values. Moreover, whereas bothCA and PCA aim at extracting the most meaningful infor-mation from the data and removing the noise, our maincontribution was to use HC to assist the interpretation ofresults of CA and find some features that can characterizethe perfusion pattern. HC performed on the subspace se-lected by CA allowed us to identify groups of anatomicalstructures “statistically dependent,” ie, showing similarperfusion behavior within the population. HC particularlywas needed when characterizing complex statistical de-pendencies, which requires more than two principal com-ponents. For example, in the case of the normal perfusionpattern, five principal components were necessary to de-scribe the pattern.
Although groups of statistically dependent anatomicalstructures were clearly shown from the analysis of bothhealthy subjects and patients with MTLE, our resultsshould be interpreted with caution, especially because of
the limited number of SPECT studies. In addition, the
revia
Academic Radiology, Vol 12, No 5, May 2005 PERFUSION PATTERN MODELING
proposed analysis may be spoiled by quantification errorscaused by the spatial normalization step or perfusion mea-surement step. Those errors thus may artificially generate
Figure 3. Analysis of ictal SPECT data frthe variables (VOInonlat) on the first two priobtained by means of HC after CA usingstructures were extracted from HC and artemporomesial structures (red o), surrounstructures (blue �), and remaining cortex(*) was projected on the first two principalthe cluster is shown using the same colorpole VOI is highly relevant to characterizeof the lenticular nucleus, brainstem, and ctemporal cluster. Anatomical structure abb
statistical dependencies between some perfusion measure-
ments. Because spatial resolution greatly affects the spa-tial range of statistical dependency between neighboringregions, we only considered reconstructed images with
0 patients with MTLE: (a) projection ofl components and (b) classification treeponents. Several clusters of anatomical
icated on the dendrograms (b); namely,temporal structures (green �), internalk �). The center of mass of each clusterponents, and the corresponding name of
and italic font. Note that the temporalemporomesial cluster, whereas perfusionellum is associated with the surroundingtions in Figure 2.
om 1ncipa2 come indding(blaccomcodethe tereb
similar spatial resolution (ie, FWHM � 12.2 mm). Differ-
561
as o
GROVA ET AL Academic Radiology, Vol 12, No 5, May 2005
ences in dependencies seen between the two groups there-fore are unlikely to be caused by differences in spatialresolution. Moreover, because CA and HC performed onhealthy subjects before and after scatter correction led tosimilar results (results not shown), scatter can be assumednot to affect the structure of statistical dependencies be-tween regions.
Partial volume effect (PVE) caused by SPECT lim-ited spatial resolution is the main source of absolutequantification errors within small structures in SPECT(eg, [24]). It may explain some statistical dependenciesbetween small neighboring VOIs. We may assume thatmain dependencies between distant anatomical struc-tures were preserved, although data were not correctedfor PVE. Our results are in agreement with previousstudies performed without PVE correction that reportedfunctional variability within healthy subjects (7,9) orunderlying networks in patients with MTLE (10,14,15).Even if VOI-based or voxel-based methods to correctfor PVE have been proposed and validated on positronemission tomography (PET) (25) and SPECT data(24,26), achieving accurate PVE correction has neverbeen shown on perfusion SPECT using a large numberof VOIs, as in our study.
VOI-based perfusion measurements also may be bi-ased by some errors arising from the spatial normaliza-tion step. However, the spatial normalization method
Figure 4. Projection of the individual (Sunents for CA performed on ictal data of 10(black) state for the hemispheres ipsilaterfor the corresponding patient ###, respecipsilateral and contralateral hemispheres w
we used to compensate for interindividual anatomical
562
variability (21) proved to be very accurate when ap-plied to T1-weighted anatomical MRI, especially topreserve sulcogyral morphology (27). Because SPECThypoperfusion areas were proved to decrease the accu-racy of nonlinear spatial normalization (22,28), we as-sume that similar effects should happen with ictalSPECT showing large hyperperfused areas. We thusproposed a two-step approach (8) to spatially normalizeictal SPECT data by using first an ictal SPECT/MRIrigid registration that we validated in (29), followed bya nonlinear spatial normalization of the T1-weightedMRI. Because of the spatial normalization step and lowspatial resolution of SPECT images, we assumed in thepresent study that anatomical interindividual variabilityhad a negligible impact on the analysis of functionalvariability. However, we plan to investigate atlas-basedsegmentation methods, as proposed by Collins et al(30), to define VOIs directly on the MRI of each sub-ject. Accurate VOI segmentation on each subjects’MRI will notably be particularly needed to correct forPVE.
Our results in 27 healthy subjects corroborate otherstudies exploring SPECT functional variability in apopulation of healthy subjects (6,7,9). Five principalcomponents were needed to characterize the structureof statistical dependencies between VOIs. This com-plexity of the structure of normal perfusion is in agree-
Hem) on the first two principal compo-ients with MTLE. ###_I (red) and ###_C
contralateral to the epileptogenic focus. Note that clear discrimination betweenbserved.
bjectpat
al andtively
ment with previous observations, which highlighted the

Academic Radiology, Vol 12, No 5, May 2005 PERFUSION PATTERN MODELING
significant effect of various parameters (eg, age, sex,laterality) on perfusion values (6,7). HC allowed us toselect four groups of structures considered relevant todescribe normal perfusion patterns; namely, internalstructures, temporomesial structures, posterior struc-tures, and remaining cortex. Perfusion within the poste-rior structure cluster, constituted by regions locatedboth in (ie, occipital cortex) and outside (ie, brainstemand cerebellum) the cerebral cortex, thus was found tobe relatively independent from the other clusters. Simi-lar clusters of correlated anatomical structures alreadywere reported by Pagani et al (7) by applying PCA onVOI-based perfusion measurements from 50 healthysubjects. However, 12 principal components were con-sidered in (7) to explain 81% of the variance, whereasin our data, a similar percentage of global inertia couldbe explained by using eight principal components. Dif-ferences between these two studies may be explainedin part by different acquisition and postprocessing pro-tocols and the choice of the population of healthy sub-jects. Special attention must be given regarding selec-tion of the population of healthy subjects when study-ing normal perfusion in SPECT (6).
Ictal SPECT data selected for this study were cho-sen to show a characteristic ictal perfusion pattern, asseen in patients with MTLE (3). Because of extremeperfusion changes caused by epileptic seizure, CA andHC show, as expected, clear discrimination betweenhemispheres ipsilateral and contralateral to the epilep-togenic focus. The structure of statistical dependenciesin ictal perfusion measurements was described com-pletely by only the first two principal components,therefore being described more easily by our analysisthan the normal perfusion pattern. The overall structureof statistical dependencies was concordant between ic-tal and normal perfusion measurements because similarclusters were identified by using HC. However, therewas some difference because we identified no posteriorstructure group, but rather a surrounding temporalstructure group that included some temporal structures,as well as orbitofrontal, insula, lenticular nucleus, cere-bellum, and brainstem structures. Compared with thenormal perfusion pattern, the VOIs temporal pole andlenticular nucleus were found to be highly relevant tocharacterize this ictal perfusion pattern. Using PCA onVOI measurements on ictal SPECT, Blumenfeld et al(10) found some correlations between similar anatomi-cal structures in patients with temporal lobe epilepsy
and proposed a model of the underlying network. Us-ing HC, we propose a quantitative method to extractsuch a network from results of most significant depen-dencies selected by CA or PCA.
Other SPECT studies showed the implication of basalganglia or cerebellum in ictal perfusion of patients withMTLE (10,14,15,31). These results and ours suggest theexistence of an underlying network involving temporal struc-tures, internal structures, brainstem, and the cerebellum dur-ing a seizure assessed by means of ictal SPECT. Evidenceof such networks also was found in other functional studies.In interictal fluorodeoxyglucose (FDG) PET of patients withtemporal lobe epilepsy, four hypometabolism patterns werefound and confirmed by electrophysiological results (surfaceor depth recordings) (4). Basal ganglia, as well as the insula,were involved in those patterns, suggesting that interictalhypometabolism may be related to the ictal discharge gener-ation and some spreading pathways. PET hypometabolism inbasal ganglia, including lenticular nucleus, also was associ-ated with the generation of dystonic postures occurring dur-ing a temporal seizure (32). Conversely, dystonia was asso-ciated with ictal SPECT hyperperfusion in the same struc-tures (31). Finally, good agreement between metabolicpatterns in FDG PET and ictal perfusion patterns in SPECTin patients with temporal lobe epilepsy was reported in (33),emphasizing the key role of the temporal pole. In structuralimage study and EEG, the role of the temporal pole in pa-tients with MTLE is an interesting open question (cf a spe-cial issue of Epileptic Disorders [34]). MRI findings of morediffuse temporal lobe atrophy including the temporal poles(35), as well as depth EEG abnormalities arising from theseregions (36), suggest that the temporal pole is clearly in-volved in MTLE seizures.
The existence of anatomical pathways involving temporallobes and subcortical structures is well known, and epilepticseizures may involve widespread network interactions be-tween cortical and subcortical structures (10,37). Although itmay be more difficult to electrophysiologically implicate thecerebellum with seizures, there is no doubt regarding itspathological involvement in epilepsy. Whether it is affectedsecondarily by the seizures themselves, by the antiepilepticdrug used, or by the underlying epileptogenicity remainsunclear. According to our results, CA and HC thus seem tobe a promising approach to explore statistical dependenciesamong temporal, internal, and posterior structures in largergroups of patients. We plan to use CA and HC to furtherinvestigate such perfusion patterns on both ictal and interic-tal SPECT data. Our method also could be applied to the
analysis of other imaging modalities, such as FDG PET.563

GROVA ET AL Academic Radiology, Vol 12, No 5, May 2005
CONCLUSION
We propose a method to study the spatial statistical de-pendencies seen in SPECT brain perfusion data sets acquiredfrom a homogeneous population of subjects. The methodcombines anatomical standardization analysis with corre-spondence analysis and ascending hierarchical clustering toexplore relationships between perfusion profiles. We appliedthe method to normal SPECT images acquired from healthysubjects and ictal SPECT images acquired from patientswith MTLE. Our results gave evidence of structured perfu-sion patterns involving four groups of anatomical regions:temporomesial structures, internal structures, posterior struc-tures, and remaining cortex. Moreover, the temporal poleand lenticular nucleus seemed to be highly relevant to char-acterize ictal perfusion in patients with MTLE. The under-standing of such spatial statistical dependency will certainlyprovide information regarding the underlying epileptogenicnetwork.
ACKNOWLEDGMENT
The authors thank Dr Leighton Barnden (Woodville,Australia) for providing normal SPECT data and Dr Eli-ane Kobayashi (Montreal Neurological Institute, Canada)for fruitful discussion concerning the interpretation ofresults in the context of temporal lobe epilepsy.
REFERENCES
1. Patterson J, Wyper DJ. Basics of SPECT. In: Duncan R, ed. SPECTImaging of the Brain. Dordrecht, The Netherlands: Kluwer Academic,1997; 1–42.
2. Devous MD, Thisted RA, Morgan GF, Leroy RF, Rowe CC. SPECTbrain imaging in epilepsy: a meta-analysis. J Nucl Med 1998; 39:285–293.
3. Ho SS, Berkovic SF, McKay WJ, Kalnins RM, Bladin PF. Temporal lobeepilepsy subtypes: differential patterns of cerebral perfusion on ictalSPECT. Epilepsia 1996; 37:788–795.
4. Chassoux F, Semah F, Bouilleret V, et al. Metabolic changes and elec-tro-clinical patterns in mesiotemporal lobe epilepsy: a correlative study.Brain 2004; 127:1–11.
5. Lobaugh NJ, Caldwell CB, Black SE, Leibovitch FS, Swartz SH. Threebrain SPECT region-of-interest templates in elderly people: normativevalues, hemispheric asymmetries, and a comparison of single- andmultihead cameras. J Nucl Med 2000; 41:45–56.
6. Van Laere K, Versijpt J, Audenauert K, et al. 99mTc-ECD brain perfusionSPET: variability, asymmetry and effect of age and gender in healthyadults. Eur J Nucl Med 2001; 28:873–887.
7. Pagani M, Salmaso D, Jonsson C, et al. Regional cerebral blood flowassessment by principal component analysis and 99mTc-HMPAO SPETin healthy subjects at rest: normal distribution and effect of age andgender. Eur J Nucl Med 2002; 29:67–75.
8. Grova C, Jannin P, Biraben A, et al. A methodology for generating nor-mal and pathological brain perfusion SPECT images for evaluation ofMRI/SPECT fusion methods: application in epilepsy. Phys Med Biol
2003; 48:4023–4043.564
9. Houston AS, Kemp PM, Macleod MA. A method for assessing the sig-nificance of abnormalities in HMPAO brain SPECT images. J Nucl Med1994; 35:239–244.
10. Blumenfeld H, McNally KA, Vanderhill SD, et al. Positive and negativenetwork correlations in temporal lobe epilepsy. Cerebr Cortex 2004;14:892–902.
11. Stoeckel J, Malandain G, Migneco O, et al. Classification of SPECTimages of normal subjects versus image of Alzheimer’s disease pa-tients. In: Lecture Notes in Computer Science (MICCAI 2001, Utrecht).New York: Springer, 2001; 666–674.
12. Chauvel P, Vignal JP, Biraben A, Badier JM, Scarabin JM. Stereoen-cephalography. In: Pawlik G, Stefan H, eds. Multimethodological As-sessment of the Epileptic Forms. New York: Springer-Verlag, 1996;80–108.
13. Spencer SS. Neural networks in human epilepsy: evidence of and im-plications for treatment. Epilepsia 2002; 43:219–227.
14. Shin WC, Hong SB, Tae WS, Seo DW, Kim SE. Ictal hyperperfusion ofcerebellum and basal ganglia in temporal lobe epilepsy: SPECT sub-traction with MRI coregistration. J Nucl Med 2001; 42:853–858.
15. Sojkova J, Lewis PJ, Siegel AH, et al. Does asymmetric basal gangliaor thalamic activation aid in seizure foci lateralization on ictal SPECTstudies? J Nucl Med 2003; 44:1379–1386.
16. Lebart L, Morineau A, Warwick KM. Multivariate Descriptive StatisticalAnalysis. Series in Probability and Mathematical Statistics. New York:Wiley, 1984.
17. Zubal IG, Harrell CR, Smith EO, Rattner Z, Gindi GR, Hoffer PB. Com-puterized three-dimensional segmented human anatomy. Med Phys1994; 21:299–302.
18. Engel J. Surgical Treatment of the Epilepsies, volume 1. New York:Raven Press, 1987.
19. Jaszczak RJ, Floyd CE, Coleman RE. Scatter compensations tech-niques for SPECT. IEEE Trans Nucl Sci 1985; 32:786–793.
20. Chang L-T. A method for attenuation correction in radionucleide com-puted tomography. IEEE Trans Nucl Sci 1978; NS-25:638–643.
21. Friston KJ, Ashburner J, Poline JB, Frith CD, Heather JD, FrackowiakRSJ. Spatial registration and normalization of images. Hum Brain Mapp1995; 2:165–189.
22. Acton PD, Friston KJ. Statistical parametric mapping in functionalneuroimaging: beyond PET and fMRI activation studies. Eur J NuclMed 1998; 25:663–667.
23. Maes F, Collignon A, Vandermeulen D, Marchal G, Suetens P. Multimo-dality image registration by maximization of mutual information. IEEETrans Med Imaging 1997; 16:187–198.
24. Soret M, Koulibaly PM, Darcourt J, Hapdey S, Buvat I. Quantitative ac-curacy of dopaminergic neurotransmission imaging with 123I SPECT.J Nucl Med 2003; 44:1184–1193.
25. Frouin V, Comtat C, Reilhac A, Grégoire M-C. Correction of partial-vol-ume effect for PET striatal imaging: fast implementation and study ofrobustness. J Nucl Med 2002; 43:1715–1726.
26. Matsuda H, Ohnishi T, Asada T, et al. Correction for partial-volume ef-fects on brain perfusion SPECT in healthy men. J Nucl Med 2003; 44:1243–1252.
27. Hellier P, Ashburner J, Corouge I, Barillot C, Friston KJ. Inter-subjectregistration of functional and anatomical data using SPM. In LectureNotes in Computer Science (MICCAI 2002, Tokyo). Berlin: Springer-Verlag, 2002; 590–597.
28. Stamatakis EA, Wilson JTL, Wyper DJ. Spatial normalization of le-sioned HMPAO SPECT images. Neuroimage 2001; 14:844–852.
29. Grova C, Jannin P, Buvat I, Benali H, Gibaud B. Evaluation of registra-tion of ictal SPECT/MRI data using statistical similarity methods. In:Lecture Notes in Computer Science: MICCAI 2004, Saint Malo, volume3216. New York: Springer, 2004; 687–695.
30. Collins DL, Zijdenbos AP, Baaré WF, Evans AC. ANIMAL� INSECT:Improved cortical structure segmentation. In: Proceedings of Informa-tion Processing in Medical Imaging IPMI’99. Berlin:Springer-VerlagGmbH, 1999; 210–223.
31. Newton MR, Berkovic SF, Austin MC, Reutens DC, McKay WJ, BladinPF. Dystonia, clinical lateralization, and regional blood flow changes in
temporal lobe seizures. Neurology 1992; 42:371–377.
Academic Radiology, Vol 12, No 5, May 2005 PERFUSION PATTERN MODELING
32. Dupont S, Semah F, Baulac M, Samson Y. The underlying pathophysi-ology of ictal dystonia in temporal lobe epilepsy: an FDG-PET study.Neurology 1998; 51:1289–1292.
33. Bouilleret V, Valenti MP, Hirsch E, Semah F, Namer IJ. Correlation be-tween PET and SISCOM in temporal lobe epilepsy. J Nucl Med 2002;43:991–998.
34. Ryvlin P, Kahane P, Arzimanoglou A, Andermann F, eds. Epileptic
Disorders: Temporal Pole and Mesiotemporal Epilepsy, volume 4(Suppl 1). John Libbey Eurotext, 2002.35. Coste S, Ryvlin P, Hermier M, et al. Temporopolar changes in temporallobe epilepsy: a quantitative MRI-based study. Neurology 2002; 59:855–861.
36. Bartolomei F, Wendling F, Vignal J-P, et al. Seizures of temporallobe epilepsy: identification of subtypes by coherence analysis usingstereo-electro-encephalography. Clin Neurophysiol 1999; 110:1741–1754.
37. Norden AD, Blumenfeld H. The role of subcortical structures in human
epilepsy. Epilepsy Behav 2002; 3:219–231.565