Post traumatic brain perfusion SPECT analysis using reconstructed ROI maps of radioactive...
11
BioMed Central Page 1 of 11 (page number not for citation purposes) BMC Medical Imaging Open Access Research article Post traumatic brain perfusion SPECT analysis using reconstructed ROI maps of radioactive microsphere derived cerebral blood flow and statistical parametric mapping Anthony J McGoron* 1 , Michael Capille 1 , Michael F Georgiou 2 , Pablo Sanchez 2 , Juan Solano 3 , Manuel Gonzalez-Brito 3 and John W Kuluz 3 Address: 1 Department of Biomedical Engineering, Florida International University, 10555 West Flagler Street, EC 2671, Miami FL, 33199, USA, 2 Department of Radiology, Division of Nuclear Medicine (D57), University of Miami, P.O Box 016960, Miami, FL 33101, USA and 3 Department of Pediatrics, Division of Critical Care Medicine (R-131), University of Miami, P.O Box 016960, Miami, FL 33101, USA Email: Anthony J McGoron* - [email protected]; Michael Capille - [email protected]; Michael F Georgiou - [email protected]; Pablo Sanchez - [email protected]; Juan Solano - [email protected]; Manuel Gonzalez-Brito - [email protected]; John W Kuluz - [email protected] * Corresponding author Abstract Background: Assessment of cerebral blood flow (CBF) by SPECT could be important in the management of patients with severe traumatic brain injury (TBI) because changes in regional CBF can affect outcome by promoting edema formation and intracranial pressure elevation (with cerebral hyperemia), or by causing secondary ischemic injury including post-traumatic stroke. The purpose of this study was to establish an improved method for evaluating regional CBF changes after TBI in piglets. Methods: The focal effects of moderate traumatic brain injury (TBI) on cerebral blood flow (CBF) by SPECT cerebral blood perfusion (CBP) imaging in an animal model were investigated by parallelized statistical techniques. Regional CBF was measured by radioactive microspheres and by SPECT 2 hours after injury in sham-operated piglets versus those receiving severe TBI by fluid- percussion injury to the left parietal lobe. Qualitative SPECT CBP accuracy was assessed against reference radioactive microsphere regional CBF measurements by map reconstruction, registration and smoothing. Cerebral hypoperfusion in the test group was identified at the voxel level using statistical parametric mapping (SPM). Results: A significant area of hypoperfusion (P < 0.01) was found as a response to the TBI. Statistical mapping of the reference microsphere CBF data confirms a focal decrease found with SPECT and SPM. Conclusion: The suitability of SPM for application to the experimental model and ability to provide insight into CBF changes in response to traumatic injury was validated by the SPECT SPM result of a decrease in CBP at the left parietal region injury area of the test group. Further study and correlation of this characteristic lesion with long-term outcomes and auxiliary diagnostic modalities is critical to developing more effective critical care treatment guidelines and automated medical imaging processing techniques. Published: 29 February 2008 BMC Medical Imaging 2008, 8:4 doi:10.1186/1471-2342-8-4 Received: 18 July 2007 Accepted: 29 February 2008 This article is available from: http://www.biomedcentral.com/1471-2342/8/4 © 2008 McGoron et al; licensee BioMed Central Ltd. This is an Open Access article distributed under the terms of the Creative Commons Attribution License (http://creativecommons.org/licenses/by/2.0 ), which permits unrestricted use, distribution, and reproduction in any medium, provided the original work is properly cited.
-
Upload
itzacatepec -
Category
Documents
-
view
1 -
download
0
Transcript of Post traumatic brain perfusion SPECT analysis using reconstructed ROI maps of radioactive...

BioMed CentralBMC Medical Imaging
ss
Open AcceResearch articlePost traumatic brain perfusion SPECT analysis using reconstructed ROI maps of radioactive microsphere derived cerebral blood flow and statistical parametric mappingAnthony J McGoron*1, Michael Capille1, Michael F Georgiou2, Pablo Sanchez2, Juan Solano3, Manuel Gonzalez-Brito3 and John W Kuluz3Address: 1Department of Biomedical Engineering, Florida International University, 10555 West Flagler Street, EC 2671, Miami FL, 33199, USA, 2Department of Radiology, Division of Nuclear Medicine (D57), University of Miami, P.O Box 016960, Miami, FL 33101, USA and 3Department of Pediatrics, Division of Critical Care Medicine (R-131), University of Miami, P.O Box 016960, Miami, FL 33101, USA
Email: Anthony J McGoron* - [email protected]; Michael Capille - [email protected]; Michael F Georgiou - [email protected]; Pablo Sanchez - [email protected]; Juan Solano - [email protected]; Manuel Gonzalez-Brito - [email protected]; John W Kuluz - [email protected]
* Corresponding author
AbstractBackground: Assessment of cerebral blood flow (CBF) by SPECT could be important in themanagement of patients with severe traumatic brain injury (TBI) because changes in regional CBFcan affect outcome by promoting edema formation and intracranial pressure elevation (withcerebral hyperemia), or by causing secondary ischemic injury including post-traumatic stroke. Thepurpose of this study was to establish an improved method for evaluating regional CBF changesafter TBI in piglets.
Methods: The focal effects of moderate traumatic brain injury (TBI) on cerebral blood flow (CBF)by SPECT cerebral blood perfusion (CBP) imaging in an animal model were investigated byparallelized statistical techniques. Regional CBF was measured by radioactive microspheres and bySPECT 2 hours after injury in sham-operated piglets versus those receiving severe TBI by fluid-percussion injury to the left parietal lobe. Qualitative SPECT CBP accuracy was assessed againstreference radioactive microsphere regional CBF measurements by map reconstruction,registration and smoothing. Cerebral hypoperfusion in the test group was identified at the voxellevel using statistical parametric mapping (SPM).
Results: A significant area of hypoperfusion (P < 0.01) was found as a response to the TBI.Statistical mapping of the reference microsphere CBF data confirms a focal decrease found withSPECT and SPM.
Conclusion: The suitability of SPM for application to the experimental model and ability toprovide insight into CBF changes in response to traumatic injury was validated by the SPECT SPMresult of a decrease in CBP at the left parietal region injury area of the test group. Further studyand correlation of this characteristic lesion with long-term outcomes and auxiliary diagnosticmodalities is critical to developing more effective critical care treatment guidelines and automatedmedical imaging processing techniques.
Published: 29 February 2008
BMC Medical Imaging 2008, 8:4 doi:10.1186/1471-2342-8-4
Received: 18 July 2007Accepted: 29 February 2008
This article is available from: http://www.biomedcentral.com/1471-2342/8/4
© 2008 McGoron et al; licensee BioMed Central Ltd. This is an Open Access article distributed under the terms of the Creative Commons Attribution License (http://creativecommons.org/licenses/by/2.0), which permits unrestricted use, distribution, and reproduction in any medium, provided the original work is properly cited.
Page 1 of 11(page number not for citation purposes)

BMC Medical Imaging 2008, 8:4 http://www.biomedcentral.com/1471-2342/8/4
BackgroundAcute traumatic brain injury (TBI) is a leading cause ofdeath and disability in children in the United States andrepresents a widespread clinical as well as socioeconomicproblem [1]. Effective management of patients with TBI isbased in large part on accurate assessment of the severityof brain injury both in the trauma center and after admis-sion to the intensive care unit. Advanced diagnostic tech-niques, such as nuclear medicine imaging, can detect focalchanges in cerebral blood flow (CBF) after TBI [2]. If focalchanges in CBF after TBI can be detected and acted uponin time to prevent their deleterious effects which lead toworsening of the primary injury, then long-term outcomecould be improved. The purpose of this study was toestablish an improved method for evaluating regionalCBF (rCBF) changes after traumatic brain injury (TBI) inpiglets.
Many nuclear medicine studies designed to assess the cor-relation between CBF and severity of TBI are based on Sin-gle Photon Emission Computed Tomography (SPECT)cerebral blood perfusion (CBP) imaging [2]. SPECT is awidely used clinical tool that has proven to be useful notonly for TBI but also in additional applications includingdetection of intracerebral hematomas due to stroke [3]and movement disorders due to closed head injury [4].This work centers on SPECT CBP based detection focalchanges in CBF in a pediatric model of severe TBI in pig-lets and the various computational and statistical meth-ods developed to validate the approach. Alternativemodalities such as MR and CT reveal anatomical changes(i.e. swelling) of the cortex at the TBI site, however dam-age at the site is not always accompanied by morphologi-cal changes. The radioactive microspheres technique(RMT) is the gold standard for measuring CBF. Both RMTand SPECT methods were carried out simultaneously,with SPECT CBP findings validated based on measure-ments derived from RMT.
Validation of SPECT measurements requires a method tomatch, or register, the location of the tissue samplesremoved for microsphere analysis with their correspond-ing location in the SPECT volume [5]. Fundamental to theRMT is the explicit design of a map of tissue areas whereblood flow is measured. These areas being studied arereferred to as regions of interest (ROIs) with a largenumber of contiguous ROIs comprising an ROI map. Inthis work methods were developed to digitize and recon-struct subject specific ROI maps into volume-of-interest(VOI) maps and then perform manual 3-D registration ofthe digitized VOI maps to the SPECT images. Here, ROIwill be used in reference to RMT measured rCBF and VOIwill be used to refer to SPECT data and the regions drawnduring brain dissection. Accurate registration of the VOImaps allowed both the validation of SPECT data and
detection of focal lesions by observing SPECT VOIs with amarked decrease in perfusion. Intrasubject lesion severitywas determined by comparing its flow with the homolo-gous region in the contralateral hemisphere of the brainand calculating the percent decrease, similar to the asym-metry index employed by Rousseaux et al. [3]. A voxel, asopposed to VOI level approach suitable for SPECT CBPimage interpretation is statistical parametric mapping(SPM), which is considered part of the broader field of sta-tistical neuroimaging [6,7]. The SPM methodology hasbeen applied successfully to a range of clinical functionalbrain studies including head injury [8], cognitive rehabil-itation therapy [9] and executive brain area functioningafter TBI [10]. Detection of focal hypoperfusion requires astatistical model implementation to operate on homolo-gous voxels within and between experimental groups toidentify significant differences. Inferences are then madefrom the test statistics associated with each voxel. In thiswork, SPM analysis was performed to detect and charac-terize CBP at the maximum precision afforded by theSPECT machinery and experimental conditions.
MethodsMale piglets weighing 4.1 – 11.2 kg were randomlyassigned to either a test (n = 11) or control (n = 8) group.All were pre-anesthetized with an intraperitoneal injec-tion of 40 mg/kg pentobarbital followed by intravenousadministration of 5 μg/kg/hr fentanyl anesthetic and 0.2mg/kg/hr pancurioum paralytic. Intracranial pressure,aortic pressure, end tidal respiratory CO2 concentrationand body temperature were continuously monitored.Lines were inserted for injection of radiopharmaceuticalsand microspheres, sampling of arterial and venous bloodcomposition and reference organ withdrawal. Bothgroups received reflection of the scalp, a 1.3 cm craniot-omy over the left parietal cortex and removal of the duramater. TBI was simulated on test subjects by fluid percus-sion injury (FPI) at the exposed cortex. Following injurythe animal was transported to the Nuclear MedicineDepartment at Jackson Memorial Hospital while placedon a ventilator to maintain blood gas and end tidal CO2concentrations at normal levels. Upon arrival the standardmonitoring devices were reconnected. SPECT imagingbegan approximately 2 hours post injury with the micro-sphere injection for RMT immediately after. Identical pro-tocols were followed for control and test subjects exceptthat test subjects received TBI.
Nuclear medicine SPECTThe SPECT camera used is a Philips-ADAC Vertex PlusHybrid PET/SPECT (ADAC Laboratories, Milpitas, CA)with two 180° opposed rotating detectors with low energyhigh-resolution collimators and a 5/8" NaI scintillationcrystal. The software and hardware for image reconstruc-tion was a Philips-ADAC Pegasys (Sun OS) processing
Page 2 of 11(page number not for citation purposes)
BMC Medical Imaging 2008, 8:4 http://www.biomedcentral.com/1471-2342/8/4
workstation for reconstruction of the SPECT image data.Approximately two hours after TBI, before injection ofpost-injury microspheres, brain blood perfusion SPECTimaging was performed using 99mTc-ECD. Scanning wasinitiated ten minutes after 5 mCi intravenous injection.Projections were collected over 24 minutes with eachdetector rotating 180° to make a complete 360° revolu-tion in an elliptical orbit with the piglet placed in thesupine position. Image volumes were reconstructed usingthe Philips-ADAC filtered backprojection algorithm withaxial smoothing and a Butterworth filter with an order offive and cutoff of 0.45. Image volumes consisted of 64 ×64 × 64 voxels each measuring 4.38 mm3. The detectordistance ranged from 14 cm to 20 cm during rotationresulting in a spatial resolution FWHM (full width at half-max) of approximately 12 mm [11].
Ex-vivo RMT rCBF and in-vivo SPECT CBP registrationRadioactive microspheres are small (15 μm) radiolabeledlatex beads that lodge in the capillaries as they pass
through the organ tissue [12]. Blood flow in any particulartissue is proportional to the radioactivity emitted from themicrospheres trapped in the specimen. A 100 μCi micro-sphere solution (either Cerium, Scandium, Niobium orStrontium) was injected immediately after SPECT. Bloodwithdrawal was performed for 1.5 min at a rate of 1.9 mL/min from the arterial line by a syringe pump (HarvardApparatus, Holliston, MA). Approximately five hours afterinjury the subject was euthanized with an intravenousinjection of KCl (4 m Eq/kg). The brain was removed andpreserved in formalin allowing for the decay of the 99mTc-ECD radiopharmaceutical used during the SPECT study.
A hierarchical dissection scheme, similar to that describedby Gross et al [13], for the brain is shown in Figure 1. Theright and left hemispheres were each carefully dissectedinto 47 regions of interest according to a standard grid(Figure 1). The cerebellum and hippocampus were notincluded in the analysis. Brain tissue samples weighedbetween 0.2 and 0.5 grams to ensure sufficient numbers
Brain picture (left panel) and hierarchical dissection scheme example displayed as a CBF ROI Map (right panel)Figure 1Brain picture (left panel) and hierarchical dissection scheme example displayed as a CBF ROI Map (right panel). A tracing was generated for each brain. The specific map for subject 10 is shown dissected according to the ROI tem-plate consisting of nine slices with 94 ROIs. Each slice is cut symmetrically left to right. The hippocampus (45, 92) and cerebel-lum (46, 47, 93, 94) are shown but were not included in the analysis. The remaining 88 ROI's were used in the analysis. The "core injury" region was identified as ROI's 25–27 based on visual examination after removal of the brain. The injury "penum-bra" extended anterior and posterior to the core injury region as identified in the tracing.
Page 3 of 11(page number not for citation purposes)
BMC Medical Imaging 2008, 8:4 http://www.biomedcentral.com/1471-2342/8/4
of microspheres in each tissue sample. Generally, the dis-section scheme can be thought of as a brain mapping tem-plate for each subject and will be referred to here as eitherthe ROI template map, or template map. The ROI tem-plate map defined the number of serial slices and a seriesof samples contained within each slice. Two importantfeatures of the template map were: 1) minimal ROI size inorder to detect sharp changes in rCBF and 2) ROI symme-try from the left to right hemisphere facilitating compari-son of the injury site to the homologous region on thecontralateral side. Dissection was performed manually,guided by the ROI template map resulting in a subject spe-cific ROI map. Serial slices were made perpendicular tothe longitudinal fissure and resulted in an average slicethickness of between 6 and 7 mm. Slices were then placedon heavy weight loose-leaf paper and further cut into sym-metrical, left-right, samples following the map specifica-tion. After cutting, the outline of each sample was tracedwhile in its natural position within the serial section.Finally, each sample was weighed and its radioactivitymeasured by a gamma-well counter (Packard, MinaxiAutogamma 5000).
Microsphere brain samples, similar to histological sam-ples, are obtained by first fixing the specimen in tissueprotecting alginate embedding material followed by slic-ing serial sections using a microtome. Successful recon-struction requires that the serial slices be realigned.Microsphere methods typically result in a relatively smallnumber of slices whose manual realignment does notpresent such an onerous task. In this study, only nineslices were generated for each subject. Although theamount of realignment required was minimal, the smallnumber of slices caused a loss of alignment informationalong the long axis of the brain. Registration of ROI mapslices to target SPECT volume slices was achieved throughvisually guided manual placement in PMOD (PMODTechnologies, Ltd., Zurich, Switzerland) imaging soft-ware. The SPECT volume was translated, rotated andscaled in 3D space until a valid intermodality match wasfound for all slices in all dimensions. The piglet cerebrumwas clearly located in the context of the head profile andreference anatomy points observable in the CBP image.
Image volume manipulation and analysisThe PMOD (PMOD Technologies, Ltd., Zurich, Switzer-land) medical imaging software, developed specificallyfor nuclear medicine studies was used. PMOD is a generaltool for quantitative nuclear medicine image analysis andprocessing, and modeling of function and kinetics.Requirements for image volume viewing and manipula-tion and registration include volume loading, navigationand transformation. Viewing (PGATE) and VOI analysis(PVOI) tools are distinct modules operating under themain PMOD application. The PGATE viewer provided
volume navigation simultaneously through the coronal,sagittal and transverse planes, or views. This method fordisplaying the brain slice images, orthogonal view, isessential for analyzing image volume data and is standardclinical practice. Orthogonal navigation works by firstchoosing a 2D location in one plane (e.g. transverse) andthen displaying the orthogonal planes in the remainingviews (e.g. coronal and sagittal). Affine geometric trans-formations were required to scale, rotate and translate theimage volume for the ROI map registration process.PMOD applies the scaling transformation first followedby translation. Trilinear interpolation is used to interpo-late pixel values when applying spatial transformations.Each subject image volume was spatially normalized to atarget volume to ensure that the voxel intensity measure-ments originate from homologous locations in the differ-ent brains. Implementing spatial normalization requiresconsiderations for resampling, smoothing, and geometrictransformation.
Statistical parametric mappingVOI maps of SPECT perfusion cannot be statistically ana-lyzed in a similar manner as the rCBF data (obtained fromthe RMT) due to the highly correlated nature of the meas-urements between adjacent SPECT VOIs. In order to ana-lyze the injury groups for significant changes in rCBF adifferent strategy must be taken. As in ROI statistical map-ping, a univariate test is performed at each data location,which is now an image voxel (counts) rather than an ROIregion rCBF (mL/100 g/min). Simple correction methodsfor multiple comparisons between locations assume inde-pendence of the counts data at each voxel. As a result thecorrection is often too severe and statistically significantvoxels are lost. The statistical parametric mapping tech-nique as implemented by SPM2 (Wellcome Departmentof Imaging Neuroscience, UCL, UK) analyzes volumes forgroup effects at the voxel level and uses statistical theoryto derive accurate estimates of data independence. Per-forming a statistical parametric mapping analysis requiresthree major stages: spatial image transformation, statisti-cal model design, and setting parameters for making infer-ences on the model output.
Focal TBI lesion detectionThe methods outlined above were implemented to pro-vide a framework for detecting focal TBI by measuring thespatial extent and magnitude of rCBF and CBP changes incontrol and injury groups. Initially, VOI maps were recon-structed from ROI maps to validate the accuracy of theSPECT CBP studies, demonstrating that CBP changes werecorrelated with, but not necessarily equal to, the locationand magnitude of changes in the gold standard rCBF. Sta-tistical parametric mapping was implemented to auto-matically detect focal changes in CBP based on differencesbetween the groups and not a priori ROI definitions. Sta-
Page 4 of 11(page number not for citation purposes)
BMC Medical Imaging 2008, 8:4 http://www.biomedcentral.com/1471-2342/8/4
tistical ROI maps were created apart from SPM to validatethe results. Computational tools used to perform the anal-yses were based on a combination of custom Matlab(Mathworks, Natick, MA) programming and imagemanipulation in PMOD. Statistical parametric mappinganalysis was implemented through the SPM2 toolbox forMatlab.
SPECT CBP: VOI map construction from ROI mapsROI map slices were initially contrast enhanced, digitizedand stored as jpeg image files. Digitization was performedby an HP Scanjet 3507c and HP Scanning software v1.0.Each serial section was scanned at a resolution of 100 dpiproviding for both detailed resolution of ROI boundariesand a small file size. Output files were 276 × 276 pixelswith 256 gray shades resulting in file sizes less than 100KB. A total of nine jpeg files were created for each brain,one for each serial slice in the ROI map as in Figure 1.ROIs from the subject ROI maps, each with volume v andrCBF x, were reconstructed as volume-of-interest (VOI)maps with volume v and counts y (Ri(v, x) → Vi(v, y) i =
1.88) in 3-D space using the biomedical imaging softwarePMOD v2.5 (PMOD Technologies, Inc). Both the Gate-way (PGATE) and VOI (PVOI) modules of PMOD wereused extensively during reconstruction for affine imagetransformation and creation of VOIs, respectively.
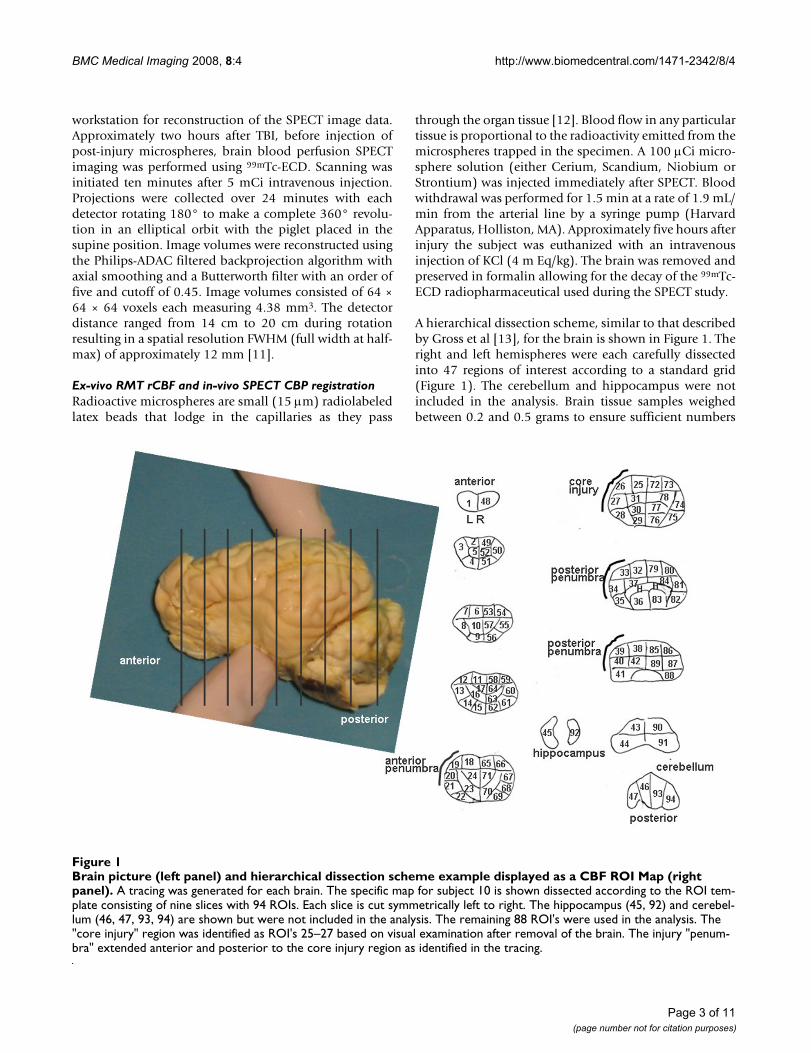
Each ROI map slice was loaded (opened) as an image intoPGATE as the first slice in a 276 × 276 × 64 image volumeresulting in 63 blank slices plus the ROI map slice image.A flowchart (Figure 2) describes the procedure. This load-ing strategy allowed the slice to be translated and rotated1) independent of the other ROI map slice images for thesame brain and 2) in the same physical space as the SPECTvolume. Each slice was loaded into PGATE individuallyand then the entire volume registration was verified. ROImap slice volumes were transformed to the same physicalspace as SPECT volumes by specifying the voxel dimen-sions as 1.02 mm × 1.02 mm × 4.38 mm and the origincoordinates. After loading, ROI slice image volumes weretransformed to a common space. First, a scale factor of0.37 was applied in the x and y dimensions to match the
Spatial 3-D reconstruction and registration to SPECT of the piglet brain ROI Maps were accomplished through the above proc-ess moving left to right in four phases and downward within each phaseFigure 2Spatial 3-D reconstruction and registration to SPECT of the piglet brain ROI Maps were accomplished through the above process moving left to right in four phases and downward within each phase. Each piglet brain consisted of nine slices and was processed individually.
Page 5 of 11(page number not for citation purposes)
BMC Medical Imaging 2008, 8:4 http://www.biomedcentral.com/1471-2342/8/4
scaling of the SPECT volume. Next the slice was rotated180° to match the supine positioning of the animal. EachROI map slice image was then translated to a pre-specifiedz coordinate for that particular slice image. Any slices thatwere not originally drawn with midlines parallel to the xand y axes were corrected by rotation about its center. Fol-lowing registration of each slice image volume to the com-mon space, the volume was exported to PVOI for furtherprocessing. VOI slices were created by manually tracingindividual ROI boundaries in the slice image. ROIs takenfrom the right hemisphere of the brain were traced first innumerical order and the process then repeated for the lefthemisphere. After a VOI slice was created it was exportedto a VOI definition file for later registration to the SPECTimage volume.
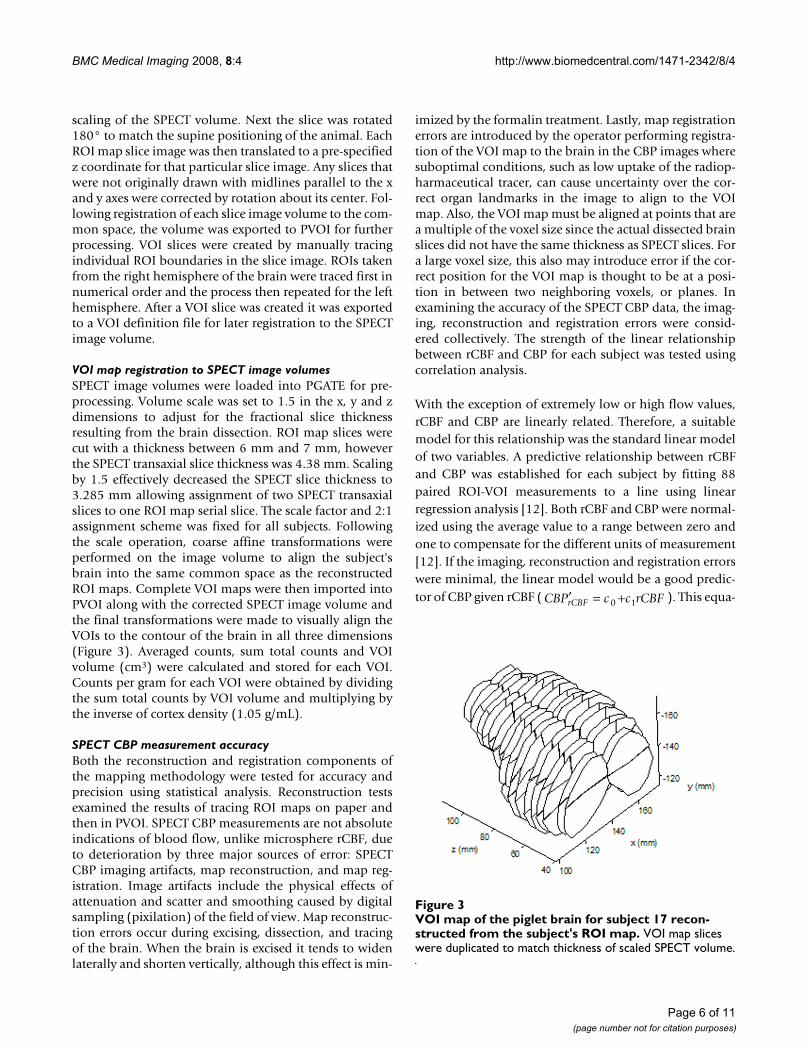
VOI map registration to SPECT image volumesSPECT image volumes were loaded into PGATE for pre-processing. Volume scale was set to 1.5 in the x, y and zdimensions to adjust for the fractional slice thicknessresulting from the brain dissection. ROI map slices werecut with a thickness between 6 mm and 7 mm, howeverthe SPECT transaxial slice thickness was 4.38 mm. Scalingby 1.5 effectively decreased the SPECT slice thickness to3.285 mm allowing assignment of two SPECT transaxialslices to one ROI map serial slice. The scale factor and 2:1assignment scheme was fixed for all subjects. Followingthe scale operation, coarse affine transformations wereperformed on the image volume to align the subject'sbrain into the same common space as the reconstructedROI maps. Complete VOI maps were then imported intoPVOI along with the corrected SPECT image volume andthe final transformations were made to visually align theVOIs to the contour of the brain in all three dimensions(Figure 3). Averaged counts, sum total counts and VOIvolume (cm3) were calculated and stored for each VOI.Counts per gram for each VOI were obtained by dividingthe sum total counts by VOI volume and multiplying bythe inverse of cortex density (1.05 g/mL).
SPECT CBP measurement accuracyBoth the reconstruction and registration components ofthe mapping methodology were tested for accuracy andprecision using statistical analysis. Reconstruction testsexamined the results of tracing ROI maps on paper andthen in PVOI. SPECT CBP measurements are not absoluteindications of blood flow, unlike microsphere rCBF, dueto deterioration by three major sources of error: SPECTCBP imaging artifacts, map reconstruction, and map reg-istration. Image artifacts include the physical effects ofattenuation and scatter and smoothing caused by digitalsampling (pixilation) of the field of view. Map reconstruc-tion errors occur during excising, dissection, and tracingof the brain. When the brain is excised it tends to widenlaterally and shorten vertically, although this effect is min-
imized by the formalin treatment. Lastly, map registrationerrors are introduced by the operator performing registra-tion of the VOI map to the brain in the CBP images wheresuboptimal conditions, such as low uptake of the radiop-harmaceutical tracer, can cause uncertainty over the cor-rect organ landmarks in the image to align to the VOImap. Also, the VOI map must be aligned at points that area multiple of the voxel size since the actual dissected brainslices did not have the same thickness as SPECT slices. Fora large voxel size, this also may introduce error if the cor-rect position for the VOI map is thought to be at a posi-tion in between two neighboring voxels, or planes. Inexamining the accuracy of the SPECT CBP data, the imag-ing, reconstruction and registration errors were consid-ered collectively. The strength of the linear relationshipbetween rCBF and CBP for each subject was tested usingcorrelation analysis.
With the exception of extremely low or high flow values,rCBF and CBP are linearly related. Therefore, a suitablemodel for this relationship was the standard linear modelof two variables. A predictive relationship between rCBFand CBP was established for each subject by fitting 88paired ROI-VOI measurements to a line using linearregression analysis [12]. Both rCBF and CBP were normal-ized using the average value to a range between zero andone to compensate for the different units of measurement[12]. If the imaging, reconstruction and registration errorswere minimal, the linear model would be a good predic-tor of CBP given rCBF ( ). This equa-CBP c c rCBFrCBF′ = +0 1
VOI map of the piglet brain for subject 17 reconstructed from the subject's ROI mapFigure 3VOI map of the piglet brain for subject 17 recon-structed from the subject's ROI map. VOI map slices were duplicated to match thickness of scaled SPECT volume.
Page 6 of 11(page number not for citation purposes)
BMC Medical Imaging 2008, 8:4 http://www.biomedcentral.com/1471-2342/8/4
tion is used to compute predicted values of CBP, CBP',given an independent value of rCBF and slope, c1, and
intercept, c0. Values for c1 and c0 are derived using the
experimental paired data points at each CBP-VOI andrCBF-ROI pair according to the standard least squares nor-mal equations. From these linear regression calculationstwo important indicators of the rCBF and CBP relation-ship are obtained. A slope, c1, of 1 coupled with an inter-
cept,c0, of 0 represents perfect agreement between rCBF
and CBP values. Normally, these values will be less thanoptimal. The correlation coefficient, r, measures thedegree to which there is a linear relationship between thetwo variables and always falls between – 1 and 1. Linearmodels and correlation coefficients were calculated foreach subject and the entire population using the regressand corr2 functions in Matlab.
Injury group lesion effect detection with SPM2In the previous section the ROI Maps of rCBF values wereanalyzed for significant changes in rCBF due to TBI. Thesame analysis cannot be performed on the VOI mapsderived from SPECT images because the CBP measure-ments are not independent and therefore no simple algo-rithm is available for adjusting the p value at each VOI formultiple comparisons. A statistical parametric mappinganalysis, through SPM2, was employed to ultimately pro-vide reliable estimates of independence and guidelines forinferring significant effects. Image volumes generated bythe hybrid PET/SPECT camera stored in the raw data fileformat required conversion to the Analyze image file for-mat for importation to SPM2. Subject 17 served as a tem-plate, or target, image to which all other subjects werespatially normalized. This particular subject was chosenbecause it was a control, had good contrast (high countsrelative to background) and was ideally positioned in thegantry during the scanning process. Also, for optimalresults the normalization algorithm requires that theselected template image have similar contrast to the imagefrom which the parameters are to be determined. The con-trast should be similar so that the normalization algo-rithm can reliably register the SPECT volumes based onperfusion values at each voxel.
The statistical model for comparing injured and shamgroups was implemented as the predefined SPM SPECTmodel "Compare Populations 1 scan/subject ANCoVA". Thismodel performs voxel-wise unpaired t-tests between thecontrol and test groups while taking the global CBP con-founding effect into account using ANCOVA. Details ofthe SPM2 methods are described elsewhere [14]. The con-founding effect, or nuisance variable in SPM2 parlance, isthe background level of perfusion (counts/pixel) in the
brain. The background level of perfusion was calculated asthe right hemisphere average similarly to the ROI mapanalysis. All normalized images were loaded into SPM2 asbelonging to either the test or control group. Each calcu-lated subject covariate was entered as a single nuisancevariable. ANCOVA was selected as the grand mean scalingmethod and no further grand mean scaling was used. Thethreshold for determining brain activity was relative andset, relying on general knowledge of the images, to 0.5. Nosphericity correction was applied. Using the contrast man-ager GUI a contrast was implemented to specify the effectof interest as any significant decrease in the test group
compared to the control group. = (-1, 1). No Family-
Wise Error (FWE) correction was applied in addition tothe Gaussian random field correction due to the relativelysmall number of voxels being studied coupled with thelow resolution of the SPECT CBP images. The uncorrectedp-value voxel level threshold was set at 0.01 [15,16]. Theextent threshold was set to three, thus avoiding spike acti-vations, due to the small size of the brain and to moreclosely match the cluster size with the resolution of theSPECT camera,. This level is comparable to 5 reported inother studies using SPECT and fMRI [16,17].
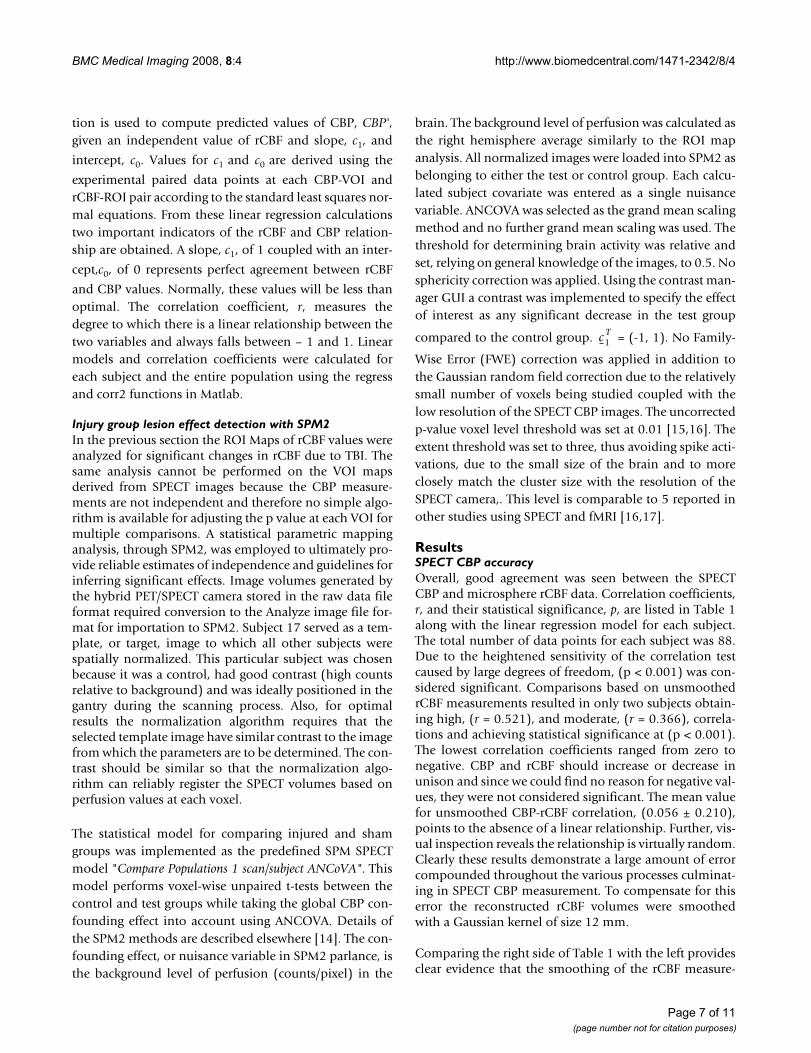
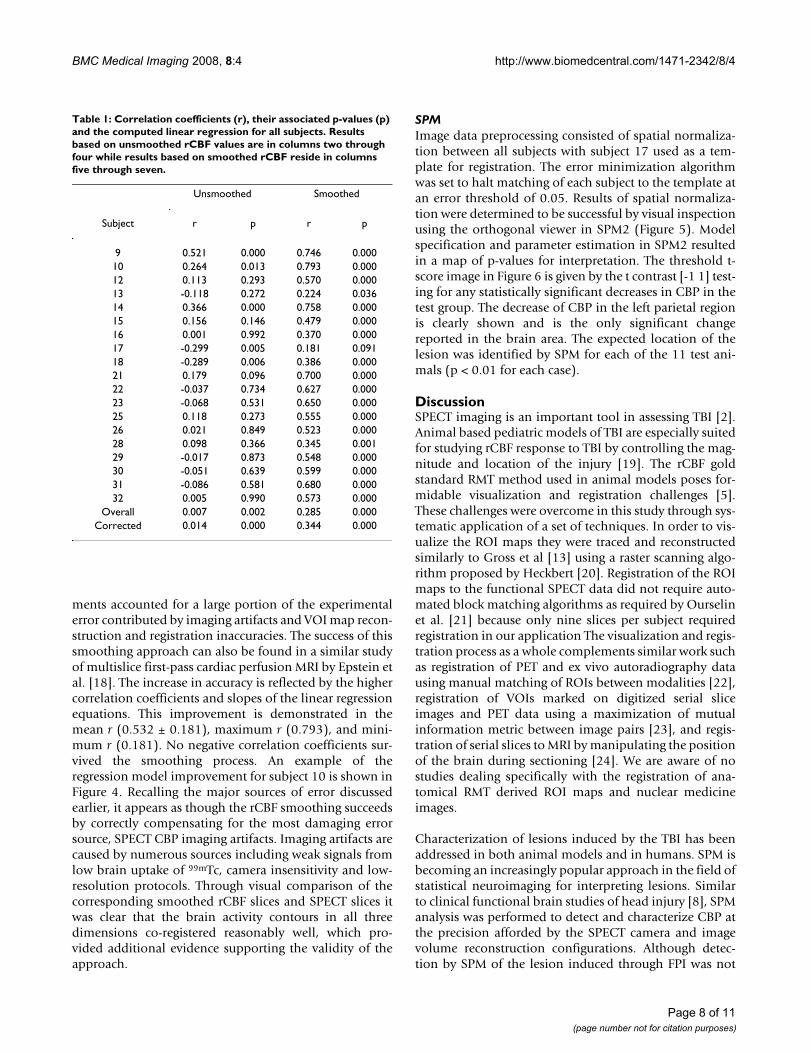
ResultsSPECT CBP accuracyOverall, good agreement was seen between the SPECTCBP and microsphere rCBF data. Correlation coefficients,r, and their statistical significance, p, are listed in Table 1along with the linear regression model for each subject.The total number of data points for each subject was 88.Due to the heightened sensitivity of the correlation testcaused by large degrees of freedom, (p < 0.001) was con-sidered significant. Comparisons based on unsmoothedrCBF measurements resulted in only two subjects obtain-ing high, (r = 0.521), and moderate, (r = 0.366), correla-tions and achieving statistical significance at (p < 0.001).The lowest correlation coefficients ranged from zero tonegative. CBP and rCBF should increase or decrease inunison and since we could find no reason for negative val-ues, they were not considered significant. The mean valuefor unsmoothed CBP-rCBF correlation, (0.056 ± 0.210),points to the absence of a linear relationship. Further, vis-ual inspection reveals the relationship is virtually random.Clearly these results demonstrate a large amount of errorcompounded throughout the various processes culminat-ing in SPECT CBP measurement. To compensate for thiserror the reconstructed rCBF volumes were smoothedwith a Gaussian kernel of size 12 mm.
Comparing the right side of Table 1 with the left providesclear evidence that the smoothing of the rCBF measure-
c T1
Page 7 of 11(page number not for citation purposes)
BMC Medical Imaging 2008, 8:4 http://www.biomedcentral.com/1471-2342/8/4
ments accounted for a large portion of the experimentalerror contributed by imaging artifacts and VOI map recon-struction and registration inaccuracies. The success of thissmoothing approach can also be found in a similar studyof multislice first-pass cardiac perfusion MRI by Epstein etal. [18]. The increase in accuracy is reflected by the highercorrelation coefficients and slopes of the linear regressionequations. This improvement is demonstrated in themean r (0.532 ± 0.181), maximum r (0.793), and mini-mum r (0.181). No negative correlation coefficients sur-vived the smoothing process. An example of theregression model improvement for subject 10 is shown inFigure 4. Recalling the major sources of error discussedearlier, it appears as though the rCBF smoothing succeedsby correctly compensating for the most damaging errorsource, SPECT CBP imaging artifacts. Imaging artifacts arecaused by numerous sources including weak signals fromlow brain uptake of 99mTc, camera insensitivity and low-resolution protocols. Through visual comparison of thecorresponding smoothed rCBF slices and SPECT slices itwas clear that the brain activity contours in all threedimensions co-registered reasonably well, which pro-vided additional evidence supporting the validity of theapproach.
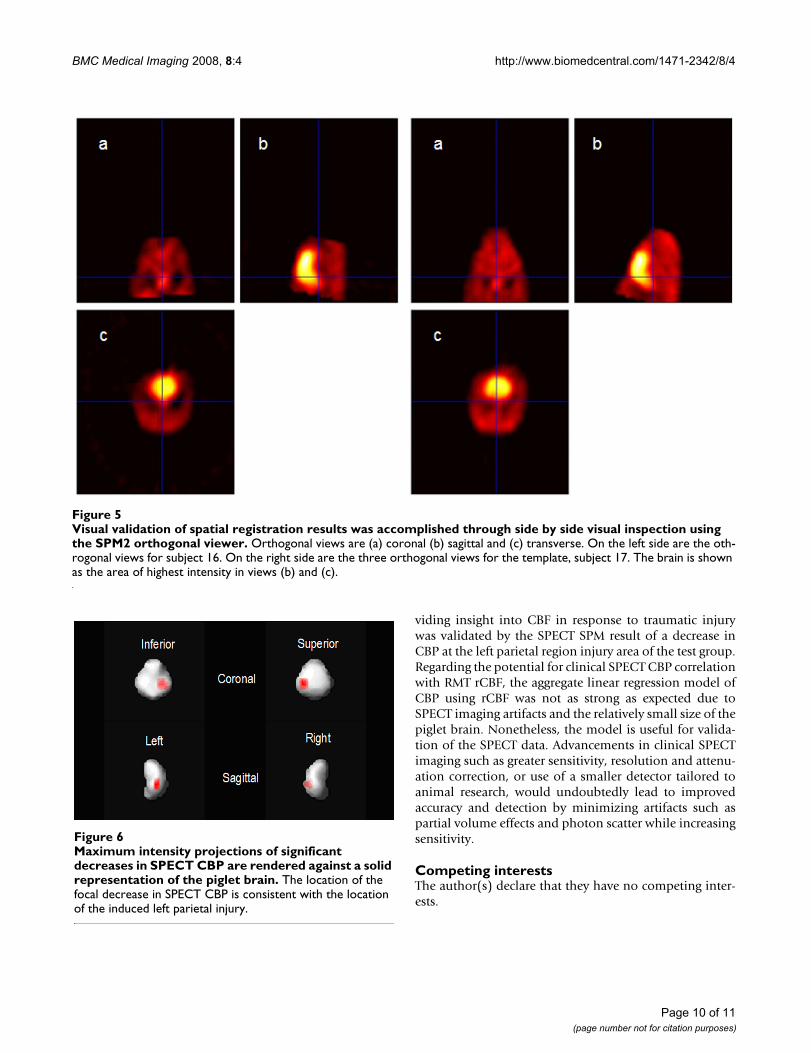
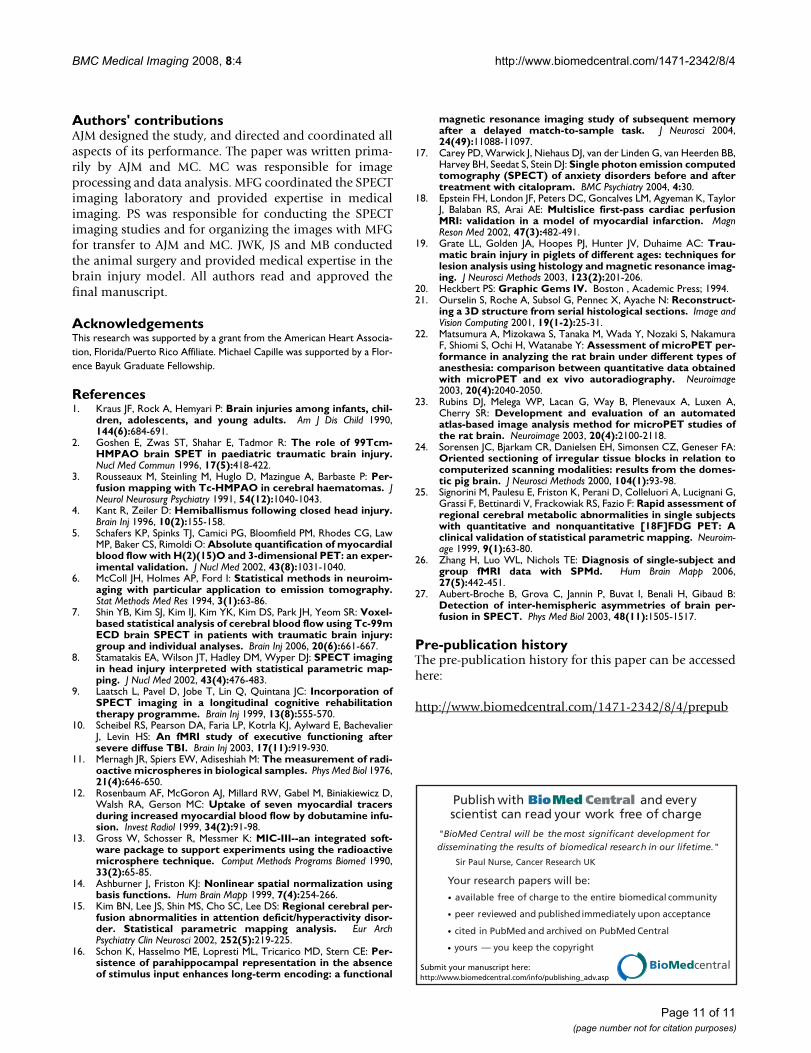
SPMImage data preprocessing consisted of spatial normaliza-tion between all subjects with subject 17 used as a tem-plate for registration. The error minimization algorithmwas set to halt matching of each subject to the template atan error threshold of 0.05. Results of spatial normaliza-tion were determined to be successful by visual inspectionusing the orthogonal viewer in SPM2 (Figure 5). Modelspecification and parameter estimation in SPM2 resultedin a map of p-values for interpretation. The threshold t-score image in Figure 6 is given by the t contrast [-1 1] test-ing for any statistically significant decreases in CBP in thetest group. The decrease of CBP in the left parietal regionis clearly shown and is the only significant changereported in the brain area. The expected location of thelesion was identified by SPM for each of the 11 test ani-mals (p < 0.01 for each case).
DiscussionSPECT imaging is an important tool in assessing TBI [2].Animal based pediatric models of TBI are especially suitedfor studying rCBF response to TBI by controlling the mag-nitude and location of the injury [19]. The rCBF goldstandard RMT method used in animal models poses for-midable visualization and registration challenges [5].These challenges were overcome in this study through sys-tematic application of a set of techniques. In order to vis-ualize the ROI maps they were traced and reconstructedsimilarly to Gross et al [13] using a raster scanning algo-rithm proposed by Heckbert [20]. Registration of the ROImaps to the functional SPECT data did not require auto-mated block matching algorithms as required by Ourselinet al. [21] because only nine slices per subject requiredregistration in our application The visualization and regis-tration process as a whole complements similar work suchas registration of PET and ex vivo autoradiography datausing manual matching of ROIs between modalities [22],registration of VOIs marked on digitized serial sliceimages and PET data using a maximization of mutualinformation metric between image pairs [23], and regis-tration of serial slices to MRI by manipulating the positionof the brain during sectioning [24]. We are aware of nostudies dealing specifically with the registration of ana-tomical RMT derived ROI maps and nuclear medicineimages.
Characterization of lesions induced by the TBI has beenaddressed in both animal models and in humans. SPM isbecoming an increasingly popular approach in the field ofstatistical neuroimaging for interpreting lesions. Similarto clinical functional brain studies of head injury [8], SPManalysis was performed to detect and characterize CBP atthe precision afforded by the SPECT camera and imagevolume reconstruction configurations. Although detec-tion by SPM of the lesion induced through FPI was not
Table 1: Correlation coefficients (r), their associated p-values (p) and the computed linear regression for all subjects. Results based on unsmoothed rCBF values are in columns two through four while results based on smoothed rCBF reside in columns five through seven.
Unsmoothed Smoothed
Subject r p r p
9 0.521 0.000 0.746 0.00010 0.264 0.013 0.793 0.00012 0.113 0.293 0.570 0.00013 -0.118 0.272 0.224 0.03614 0.366 0.000 0.758 0.00015 0.156 0.146 0.479 0.00016 0.001 0.992 0.370 0.00017 -0.299 0.005 0.181 0.09118 -0.289 0.006 0.386 0.00021 0.179 0.096 0.700 0.00022 -0.037 0.734 0.627 0.00023 -0.068 0.531 0.650 0.00025 0.118 0.273 0.555 0.00026 0.021 0.849 0.523 0.00028 0.098 0.366 0.345 0.00129 -0.017 0.873 0.548 0.00030 -0.051 0.639 0.599 0.00031 -0.086 0.581 0.680 0.00032 0.005 0.990 0.573 0.000
Overall 0.007 0.002 0.285 0.000Corrected 0.014 0.000 0.344 0.000
Page 8 of 11(page number not for citation purposes)
BMC Medical Imaging 2008, 8:4 http://www.biomedcentral.com/1471-2342/8/4
surprising, valuable information was gained as to its spa-tial extent and relative magnitude. A drawback of the SPMapproach to lesion detection is that multiple subjects foreach treatment (i.e. injury) should be used in order toreach statistically significant areas of the image (e.g. alesion). If the method were to be used in a clinical settingadditional research may be needed to achieve high statis-tical power using a single subject. One approach toimproving statistical power using a single patient is tocompare a patient to a control group [8,25,26]. Statisticalconfidence can be improved by a large control group.
Characteristics of the lesion could be used to help buildautomated algorithms for the detection of TBI in pediatricpatients. Existing algorithms designed to detect SPECTCBP asymmetries in a single adult subject use statisticaltechniques coupled with threshold comparison betweenthe two hemispheres of the brain [27]. These algorithmsare generally successful at finding asymmetries in thebrain. However, whether the lesion is pathological innature must be further studied by a clinician. Combiningknowledge of the characteristics of this lesion from thestudy with automated searching could lead to a morepowerful and useful medical image processing algorithm.Clinical applications notwithstanding, the SPM method-ology as implemented here is unique in that no otherstudies using SPM to study functional data in an animalmodel were found to have been reported. The reconstruc-
tion, registration and smoothing techniques used to createthe aggregate CBP-rCBF linear regression models can alsobe used for fluorescent microspheres studies such as bythe one by Epstein et al. [18] and for arbitrary specimens,or organs. Future work needs to be done to automate thereconstruction and registration processes. It is anticipatedthat the tools developed here can be useful to othergroups performing TBI research in animal models, or evenmore generally in research requiring map definition, reg-istration and analysis. The linear regression of CBP withrCBF was not as strong as expected due to imaging artifactslargely because of the low resolution of the camera cou-pled with the small size of the piglet brain. Nonetheless,the model is useful for validation of the SPECT data. Alimitation of this study is that the specific camera used isa hybrid for both SPECT and PET and is not optimized foreither. Therefore, the spatial resolution is poorer thandesired. Advancements in clinical SPECT imaging such asgreater sensitivity, better spatial resolution and attenua-tion correction, may improve accuracy and detection byreducing partial volume effects and photon scatter.
ConclusionThe objective of this work was to study the suitability ofthe application of SPM to an animal model of TBI andevaluate the correlation between the SPECT CBP andreconstructed RMT rCBF data. The suitability of SPM forapplication to the experimental model and ability to pro-
Correlation data showing the effect of smoothing of the rCBF data for subject 10Figure 4Correlation data showing the effect of smoothing of the rCBF data for subject 10. Smoothing accounts for a large portion of the major source of experimental error introduced by imaging artifacts and to a lesser degree by erroneous recon-struction and misregistration.
Page 9 of 11(page number not for citation purposes)
BMC Medical Imaging 2008, 8:4 http://www.biomedcentral.com/1471-2342/8/4
viding insight into CBF in response to traumatic injurywas validated by the SPECT SPM result of a decrease inCBP at the left parietal region injury area of the test group.Regarding the potential for clinical SPECT CBP correlationwith RMT rCBF, the aggregate linear regression model ofCBP using rCBF was not as strong as expected due toSPECT imaging artifacts and the relatively small size of thepiglet brain. Nonetheless, the model is useful for valida-tion of the SPECT data. Advancements in clinical SPECTimaging such as greater sensitivity, resolution and attenu-ation correction, or use of a smaller detector tailored toanimal research, would undoubtedly lead to improvedaccuracy and detection by minimizing artifacts such aspartial volume effects and photon scatter while increasingsensitivity.
Competing interestsThe author(s) declare that they have no competing inter-ests.
Visual validation of spatial registration results was accomplished through side by side visual inspection using the SPM2 orthogo-nal viewerFigure 5Visual validation of spatial registration results was accomplished through side by side visual inspection using the SPM2 orthogonal viewer. Orthogonal views are (a) coronal (b) sagittal and (c) transverse. On the left side are the oth-rogonal views for subject 16. On the right side are the three orthogonal views for the template, subject 17. The brain is shown as the area of highest intensity in views (b) and (c).
Maximum intensity projections of significant decreases in SPECT CBP are rendered against a solid representation of the piglet brainFigure 6Maximum intensity projections of significant decreases in SPECT CBP are rendered against a solid representation of the piglet brain. The location of the focal decrease in SPECT CBP is consistent with the location of the induced left parietal injury.
Page 10 of 11(page number not for citation purposes)
BMC Medical Imaging 2008, 8:4 http://www.biomedcentral.com/1471-2342/8/4
Publish with BioMed Central and every scientist can read your work free of charge
"BioMed Central will be the most significant development for disseminating the results of biomedical research in our lifetime."
Sir Paul Nurse, Cancer Research UK
Your research papers will be:
available free of charge to the entire biomedical community
peer reviewed and published immediately upon acceptance
cited in PubMed and archived on PubMed Central
yours — you keep the copyright
Submit your manuscript here:http://www.biomedcentral.com/info/publishing_adv.asp
BioMedcentral
Authors' contributionsAJM designed the study, and directed and coordinated allaspects of its performance. The paper was written prima-rily by AJM and MC. MC was responsible for imageprocessing and data analysis. MFG coordinated the SPECTimaging laboratory and provided expertise in medicalimaging. PS was responsible for conducting the SPECTimaging studies and for organizing the images with MFGfor transfer to AJM and MC. JWK, JS and MB conductedthe animal surgery and provided medical expertise in thebrain injury model. All authors read and approved thefinal manuscript.
AcknowledgementsThis research was supported by a grant from the American Heart Associa-tion, Florida/Puerto Rico Affiliate. Michael Capille was supported by a Flor-ence Bayuk Graduate Fellowship.
References1. Kraus JF, Rock A, Hemyari P: Brain injuries among infants, chil-
dren, adolescents, and young adults. Am J Dis Child 1990,144(6):684-691.
2. Goshen E, Zwas ST, Shahar E, Tadmor R: The role of 99Tcm-HMPAO brain SPET in paediatric traumatic brain injury.Nucl Med Commun 1996, 17(5):418-422.
3. Rousseaux M, Steinling M, Huglo D, Mazingue A, Barbaste P: Per-fusion mapping with Tc-HMPAO in cerebral haematomas. JNeurol Neurosurg Psychiatry 1991, 54(12):1040-1043.
4. Kant R, Zeiler D: Hemiballismus following closed head injury.Brain Inj 1996, 10(2):155-158.
5. Schafers KP, Spinks TJ, Camici PG, Bloomfield PM, Rhodes CG, LawMP, Baker CS, Rimoldi O: Absolute quantification of myocardialblood flow with H(2)(15)O and 3-dimensional PET: an exper-imental validation. J Nucl Med 2002, 43(8):1031-1040.
6. McColl JH, Holmes AP, Ford I: Statistical methods in neuroim-aging with particular application to emission tomography.Stat Methods Med Res 1994, 3(1):63-86.
7. Shin YB, Kim SJ, Kim IJ, Kim YK, Kim DS, Park JH, Yeom SR: Voxel-based statistical analysis of cerebral blood flow using Tc-99mECD brain SPECT in patients with traumatic brain injury:group and individual analyses. Brain Inj 2006, 20(6):661-667.
8. Stamatakis EA, Wilson JT, Hadley DM, Wyper DJ: SPECT imagingin head injury interpreted with statistical parametric map-ping. J Nucl Med 2002, 43(4):476-483.
9. Laatsch L, Pavel D, Jobe T, Lin Q, Quintana JC: Incorporation ofSPECT imaging in a longitudinal cognitive rehabilitationtherapy programme. Brain Inj 1999, 13(8):555-570.
10. Scheibel RS, Pearson DA, Faria LP, Kotrla KJ, Aylward E, BachevalierJ, Levin HS: An fMRI study of executive functioning aftersevere diffuse TBI. Brain Inj 2003, 17(11):919-930.
11. Mernagh JR, Spiers EW, Adiseshiah M: The measurement of radi-oactive microspheres in biological samples. Phys Med Biol 1976,21(4):646-650.
12. Rosenbaum AF, McGoron AJ, Millard RW, Gabel M, Biniakiewicz D,Walsh RA, Gerson MC: Uptake of seven myocardial tracersduring increased myocardial blood flow by dobutamine infu-sion. Invest Radiol 1999, 34(2):91-98.
13. Gross W, Schosser R, Messmer K: MIC-III--an integrated soft-ware package to support experiments using the radioactivemicrosphere technique. Comput Methods Programs Biomed 1990,33(2):65-85.
14. Ashburner J, Friston KJ: Nonlinear spatial normalization usingbasis functions. Hum Brain Mapp 1999, 7(4):254-266.
15. Kim BN, Lee JS, Shin MS, Cho SC, Lee DS: Regional cerebral per-fusion abnormalities in attention deficit/hyperactivity disor-der. Statistical parametric mapping analysis. Eur ArchPsychiatry Clin Neurosci 2002, 252(5):219-225.
16. Schon K, Hasselmo ME, Lopresti ML, Tricarico MD, Stern CE: Per-sistence of parahippocampal representation in the absenceof stimulus input enhances long-term encoding: a functional
magnetic resonance imaging study of subsequent memoryafter a delayed match-to-sample task. J Neurosci 2004,24(49):11088-11097.
17. Carey PD, Warwick J, Niehaus DJ, van der Linden G, van Heerden BB,Harvey BH, Seedat S, Stein DJ: Single photon emission computedtomography (SPECT) of anxiety disorders before and aftertreatment with citalopram. BMC Psychiatry 2004, 4:30.
18. Epstein FH, London JF, Peters DC, Goncalves LM, Agyeman K, TaylorJ, Balaban RS, Arai AE: Multislice first-pass cardiac perfusionMRI: validation in a model of myocardial infarction. MagnReson Med 2002, 47(3):482-491.
19. Grate LL, Golden JA, Hoopes PJ, Hunter JV, Duhaime AC: Trau-matic brain injury in piglets of different ages: techniques forlesion analysis using histology and magnetic resonance imag-ing. J Neurosci Methods 2003, 123(2):201-206.
20. Heckbert PS: Graphic Gems IV. Boston , Academic Press; 1994. 21. Ourselin S, Roche A, Subsol G, Pennec X, Ayache N: Reconstruct-
ing a 3D structure from serial histological sections. Image andVision Computing 2001, 19(1-2):25-31.
22. Matsumura A, Mizokawa S, Tanaka M, Wada Y, Nozaki S, NakamuraF, Shiomi S, Ochi H, Watanabe Y: Assessment of microPET per-formance in analyzing the rat brain under different types ofanesthesia: comparison between quantitative data obtainedwith microPET and ex vivo autoradiography. Neuroimage2003, 20(4):2040-2050.
23. Rubins DJ, Melega WP, Lacan G, Way B, Plenevaux A, Luxen A,Cherry SR: Development and evaluation of an automatedatlas-based image analysis method for microPET studies ofthe rat brain. Neuroimage 2003, 20(4):2100-2118.
24. Sorensen JC, Bjarkam CR, Danielsen EH, Simonsen CZ, Geneser FA:Oriented sectioning of irregular tissue blocks in relation tocomputerized scanning modalities: results from the domes-tic pig brain. J Neurosci Methods 2000, 104(1):93-98.
25. Signorini M, Paulesu E, Friston K, Perani D, Colleluori A, Lucignani G,Grassi F, Bettinardi V, Frackowiak RS, Fazio F: Rapid assessment ofregional cerebral metabolic abnormalities in single subjectswith quantitative and nonquantitative [18F]FDG PET: Aclinical validation of statistical parametric mapping. Neuroim-age 1999, 9(1):63-80.
26. Zhang H, Luo WL, Nichols TE: Diagnosis of single-subject andgroup fMRI data with SPMd. Hum Brain Mapp 2006,27(5):442-451.
27. Aubert-Broche B, Grova C, Jannin P, Buvat I, Benali H, Gibaud B:Detection of inter-hemispheric asymmetries of brain per-fusion in SPECT. Phys Med Biol 2003, 48(11):1505-1517.
Pre-publication historyThe pre-publication history for this paper can be accessedhere:
http://www.biomedcentral.com/1471-2342/8/4/prepub
Page 11 of 11(page number not for citation purposes)
http://www.ncbi.nlm.nih.gov/entrez/query.fcgi?cmd=Retrieve&db=PubMed&dopt=Abstract&list_uids=2346150
http://www.ncbi.nlm.nih.gov/entrez/query.fcgi?cmd=Retrieve&db=PubMed&dopt=Abstract&list_uids=2346150
http://www.ncbi.nlm.nih.gov/entrez/query.fcgi?cmd=Retrieve&db=PubMed&dopt=Abstract&list_uids=8736519
http://www.ncbi.nlm.nih.gov/entrez/query.fcgi?cmd=Retrieve&db=PubMed&dopt=Abstract&list_uids=8736519
http://www.ncbi.nlm.nih.gov/entrez/query.fcgi?cmd=Retrieve&db=PubMed&dopt=Abstract&list_uids=1783913
http://www.ncbi.nlm.nih.gov/entrez/query.fcgi?cmd=Retrieve&db=PubMed&dopt=Abstract&list_uids=1783913
http://www.ncbi.nlm.nih.gov/entrez/query.fcgi?cmd=Retrieve&db=PubMed&dopt=Abstract&list_uids=8696317
http://www.ncbi.nlm.nih.gov/entrez/query.fcgi?cmd=Retrieve&db=PubMed&dopt=Abstract&list_uids=8044354
http://www.ncbi.nlm.nih.gov/entrez/query.fcgi?cmd=Retrieve&db=PubMed&dopt=Abstract&list_uids=8044354
http://www.ncbi.nlm.nih.gov/entrez/query.fcgi?cmd=Retrieve&db=PubMed&dopt=Abstract&list_uids=9951788
http://www.ncbi.nlm.nih.gov/entrez/query.fcgi?cmd=Retrieve&db=PubMed&dopt=Abstract&list_uids=9951788
http://www.ncbi.nlm.nih.gov/entrez/query.fcgi?cmd=Retrieve&db=PubMed&dopt=Abstract&list_uids=9951788
http://www.ncbi.nlm.nih.gov/entrez/query.fcgi?cmd=Retrieve&db=PubMed&dopt=Abstract&list_uids=2289384
http://www.ncbi.nlm.nih.gov/entrez/query.fcgi?cmd=Retrieve&db=PubMed&dopt=Abstract&list_uids=2289384
http://www.ncbi.nlm.nih.gov/entrez/query.fcgi?cmd=Retrieve&db=PubMed&dopt=Abstract&list_uids=2289384
http://www.ncbi.nlm.nih.gov/entrez/query.fcgi?cmd=Retrieve&db=PubMed&dopt=Abstract&list_uids=8002685
http://www.ncbi.nlm.nih.gov/entrez/query.fcgi?cmd=Retrieve&db=PubMed&dopt=Abstract&list_uids=9918728
http://www.ncbi.nlm.nih.gov/entrez/query.fcgi?cmd=Retrieve&db=PubMed&dopt=Abstract&list_uids=9918728