
Scatter and attenuation correction in technetium-99m brain SPECT
Upload
khangminh22Category
view
1download
0
Radiolabelled Molecules for Brain Im
aging with PET and SPECT • Peter Brust
Radiolabelled Molecules for Brain Imaging with PET and SPECT
Printed Edition of the Special Issue Published in Molecules
www.mdpi.com/journal/molecules
Peter BrustEdited by

Radiolabelled Molecules for BrainImaging with PET and SPECT


Radiolabelled Molecules for BrainImaging with PET and SPECT
Editor
Peter Brust
MDPI • Basel • Beijing • Wuhan • Barcelona • Belgrade • Manchester • Tokyo • Cluj • Tianjin

Editor
Peter Brust
Department of Neuroradiopharmaceuticals,
Institute of Radiopharmaceutical Cancer Research, Helmholtz-Zentrum Dresden-Rossendorf
Germany
Editorial Office
MDPI
St. Alban-Anlage 66
4052 Basel, Switzerland
This is a reprint of articles from the Special Issue published online in the open access journal Molecules
(ISSN 1420-3049) (available at: https://www.mdpi.com/journal/molecules/special issues/PET
SPECT).
For citation purposes, cite each article independently as indicated on the article page online and as
indicated below:
LastName, A.A.; LastName, B.B.; LastName, C.C. Article Title. Journal Name Year, Article Number,
Page Range.
ISBN 978-3-03936-720-7 (Hbk)
ISBN 978-3-03936-721-4 (PDF)
c© 2020 by the authors. Articles in this book are Open Access and distributed under the Creative
Commons Attribution (CC BY) license, which allows users to download, copy and build upon
published articles, as long as the author and publisher are properly credited, which ensures maximum
dissemination and a wider impact of our publications.
The book as a whole is distributed by MDPI under the terms and conditions of the Creative Commons
license CC BY-NC-ND.
Contents
About the Editor . . . . . . . . . . . . . . . . . . . . . . . . . . . . . . . . . . . . . . . . . . . . . . vii
Preface to ”Radiolabelled Molecules for Brain Imaging with PET and SPECT” . . . . . . . . . ix
Bright Chukwunwike Uzuegbunam, Damiano Librizzi and Behrooz Hooshyar Yousefi
PET Radiopharmaceuticals for Alzheimer’s Disease and Parkinson’s Disease Diagnosis, theCurrent and Future LandscapeReprinted from: Molecules 2020, 25, 977, doi:10.3390/molecules25040977 . . . . . . . . . . . . . . 1
Liqun Kuang, Deyu Zhao, Jiacheng Xing, Zhongyu Chen, Fengguang Xiong and Xie Han
Metabolic Brain Network Analysis of FDG-PET in Alzheimer’s Disease Using Kernel-BasedPersistent FeaturesReprinted from: Molecules 2019, 24, 2301, doi:10.3390/molecules24122301 . . . . . . . . . . . . . 37
Maria Elisa Serrano, Guillaume Becker, Mohamed Ali Bahri, Alain Seret, Nathalie Mestdagh, Joel Mercier, Frederic Mievis, Fabrice Giacomelli, Christian Lemaire, Eric Salmon, Andre Luxen and Alain Plenevaux
Evaluating the In Vivo Specificity of [18F]UCB-H for the SV2A Protein, Compared with SV2B and SV2C in Rats Using microPETReprinted from: Molecules 2019, 24, 1705, doi:10.3390/molecules24091705 . . . . . . . . . . . . . . 51
Cornelius K. Donat, Henrik H. Hansen, Hanne D. Hansen, Ronnie C. Mease, Andrew G. Horti, Martin G. Pomper, Elina T. L’Estrade, Matthias M. Herth, Dan Peters, Gitte M. Knudsen and Jens D. Mikkelsen
In Vitro and In Vivo Characterization of Dibenzothiophene Derivatives [125I]Iodo-ASEM and [18F]ASEM as Radiotracers of Homo- and Heteromeric α7 Nicotinic Acetylcholine ReceptorsReprinted from: Molecules 2020, 25, 1425, doi:10.3390/molecules25061425 . . . . . . . . . . . . . 63
Ping Bai, Sha Bai, Michael S. Placzek, Xiaoxia Lu, Stephanie A. Fiedler, Brenda Ntaganda,
Hsiao-Ying Wey and Changning Wang
A New Positron Emission Tomography Probe for Orexin Receptors NeuroimagingReprinted from: Molecules 2020, 25, 1018, doi:10.3390/molecules25051018 . . . . . . . . . . . . . . 83
Susann Schroder, Thu Hang Lai, Magali Toussaint, Mathias Kranz, Alexandra Chovsepian, Qi Shang, Sladjana Dukic-Stefanovic, Winnie Deuther-Conrad, Rodrigo Teodoro, Barbara Wenzel, Rares-Petru Moldovan, Francisco Pan-Montojo and Peter Brust
PET Imaging of the Adenosine A2A Receptor in the Rotenone-Based Mouse Model of Parkinson’s Disease with [18F]FESCH Synthesized by a Simplified Two-Step One-Pot Radiolabeling StrategyReprinted from: Molecules 2020, 25, 1633, doi:10.3390/molecules25071633 . . . . . . . . . . . . . . 93
Rien Ritawidya, Friedrich-Alexander Ludwig, Detlef Briel, Peter Brust and Matthias Scheunemann
Synthesis and In Vitro Evaluation of 8-Pyridinyl-SubstitutedBenzo[e]imidazo[2,1-c][1,2,4]triazines as Phosphodiesterase 2A InhibitorsReprinted from: Molecules 2019, 24, 2791, doi:10.3390/molecules24152791 . . . . . . . . . . . . . 109
v

Rien Ritawidya, Barbara Wenzel, Rodrigo Teodoro, Magali Toussaint, Mathias Kranz, Winnie Deuther-Conrad, Sladjana Dukic-Stefanovic, Friedrich-Alexander Ludwig, Matthias Scheunemann and Peter Brust
Radiosynthesis and Biological Investigation of a Novel Fluorine-18 Labeled Benzoimidazotriazine-Based Radioligand for the Imaging of Phosphodiesterase 2A with Positron Emission TomographyReprinted from: Molecules 2019, 24, 4149, doi:10.3390/molecules24224149 . . . . . . . . . . . . . . 131
Paul Cumming, Janos Marton, Tuomas O. Lilius, Dag Erlend Olberg and Axel Rominger
A Survey of Molecular Imaging of Opioid ReceptorsReprinted from: Molecules 2019, 24, 4190, doi:10.3390/molecules24224190 . . . . . . . . . . . . . . 149
Jan-Michael Werner, Philipp Lohmann, Gereon R. Fink, Karl-Josef Langen and Norbert Galldiks
Current Landscape and Emerging Fields of PET Imaging in Patients with Brain TumorsReprinted from: Molecules 2020, 25, 1471, doi:10.3390/molecules25061471 . . . . . . . . . . . . . 185
Lindsey R. Drake, Ansel T. Hillmer and Zhengxin Cai
Approaches to PET Imaging of GlioblastomaReprinted from: Molecules 2020, 25, 568, doi:10.3390/molecules25030568 . . . . . . . . . . . . . . 211
vi
About the Editor
Peter Brust Prof., Dr., is a biologist. He received his M.S. in Immunology in 1981 and his
Ph.D. in Neuroscience from Leipzig University in 1986. He worked as a postdoctoral fellow at
Montreal Neurological Institute and Johns Hopkins University, Baltimore, from 1990 to 1991. He
joined the Research Center Rossendorf (now known as Helmholtz-Zentrum Dresden-Rossendorf,
HZDR) in 1992 and headed the Department of Biochemistry. Since 2002, he has been working in
Leipzig, first at the Institute of Interdisciplinary Isotope Research and, after an operational transfer in
2010, again at the HZDR, where he leads the Department of Neuroradiopharmaceuticals. His main
research interest is in radiotracer development for brain imaging with positron emission tomography,
including brain tumor imaging (glioblastoma, brain metastases), imaging of blood–brain barrier
transport of radiopharmaceuticals, and neuroimaging of the cholinergic system, second-messenger
systems, and neuromodulatory processes. He has authored around 300 peer-reviewed publications
and is the owner of numerous patents.
vii


Preface to ”Radiolabelled Molecules for Brain
Imaging with PET and SPECT”
Positron emission tomography (PET) and single-photon emission computed tomography (SPECT) are in vivo molecular imaging methods which are widely used in nuclear medicine for diagnosis and treatment follow-up of many major diseases. These methods use target-specific molecules as probes, which are labeled with radionuclides of short half-lives that are synthesized prior to the imaging studies. These probes are called radiopharmaceuticals. Their design and development is a rather interdisciplinary process covering many different disciplines of natural sciences and medicine. In addition to their diagnostic and therapeutic applications in the field of nuclear medicine, radiopharmaceuticals are powerful tools for in vivo pharmacology during the process of preclinical drug development to identify new drug targets, investigate pathophysiology, discover potential drug candidates, and evaluate the in vivo pharmacokinetics and pharmacodynamics of drugs.
The use of PET and SPECT for brain imaging is of special significance since the brain controls all the body’s functions by processing information from the whole body and the outside world. It is the source of thoughts, intelligence, memory, speech, creativity, emotion, sensory functions, motion control and other important body functions. Protected by the skull and the blood–brain barrier, the brain is somehow a privileged organ with regard to nutrient supply, immune response, and accessibility for diagnostic and therapeutic measures. Invasive procedures are rather limited for the latter purposes. Therefore, noninvasive imaging with PET and SPECT has gained high importance for a great variety of brain diseases, including neurodegenerative diseases, motor dysfunctions, stroke, epilepsy, psychiatric diseases, and brain tumors. This Special Issue focuses on radiolabeled molecules that are used for these purposes, with special emphasis on neurodegenerative diseases and brain tumors.
Molecular imaging of neurodegeneration has become a useful noninvasive clinical tool to early detect pathophysiological changes in the brain and is regarded to be of special importance for prognostic purposes, therapeutic decision making, and therapy follow-up. Alzheimer’s disease (AD) and Parkinson’s disease (PD) are regarded as the most common and known neurodegenerative disorders, with a growing impact especially in countries with rapidly increased life expectancies during the last decades. Misfolded proteins such as β-amyloid, τ -protein, α-synuclein together with neuronal dystrophy characterize the main pathology of these diseases. Furthermore, multiple neurotransmitter systems are affected and involved in the cellular pathology.
The initial review written by Uzuegbunam, Librizzi, and Yousefi provides an overview of the currently available PET radiopharmaceuticals, examining the timeline and important moments that led to the development of these tracers and offering an outlook that is especially focused on the design of α-synuclein-targeting radiotracers.
This review is followed by a number of articles describing other potential targets for diagnostic and/or therapeutic approaches towards AD and PD. Neuronal dystrophy in AD is accompanied by a reduced glucose metabolism, which can be measured with PET using the radiopharmaceutical 2-
deoxy-2-[18F]fluoroglucose ([18F]FDG). However, at the time at which significant reductions of [18F]FDG accumulation in brain regions become evident, AD has usually progressed into the clinical stage. In order to prevent and/or start early treatment of AD, disease diagnosis during the preclinical stage is needed. To address this issue, a novel metabolic brain network analysis of FDG-PET using
ix

kernel-based persistent features was proposed by Kuang et al. The FDG imaging data from 140 subjects with AD, 280 subjects with mild cognitive impairment, and 280 healthy normal controls suggest that the approach has the potential of an effective preclinical AD imaging biomarker.
Synaptic loss is well established as the major structural correlate of cognitive impairment in AD. The ability to measure in vivo synaptic density could accelerate the development of disease-modifying treatments for AD. The synaptic vesicle protein 2 (SV2) is involved in synaptic vesicle tracking and regarded as a potential biomarker for the measurement of synaptic density. It consists of the three isoforms, A, B, and C, whereby SV2A, in particular, has been closely related to AD. Therefore, the selectivity of a radiopharmaceutical towards these different isoforms is an important issue. The article of Serrano et al. evaluates the in vivo specificity of [18F]UCB-H, a radiotracer with nanomolar affinity for human SVA2, by comparing the SV2A protein with SV2B and SV2C using microPET in rats.
The potential of nicotinic acetylcholine receptors (nAchRs), as indicators of cholinergic neuronal functions, has previously been reported by a variety of papers, including those of our group, to be reduced in AD and PD. In this Special Issue, the dibenzothiophene derivatives [125I]Iodo-ASEM and [18F]ASEM, isomers of our own ligand [18F]DBT10 (previously published in Molecules 20, 18387-421, 2015), were preclinically characterized in pigs as suitable radiotracers for the imaging of homo- and heteromeric α7 nAchRs with PET and SPECT.
The sleep–wake cycle in patients with AD has been associated with τ pathology and the dysregulation of the neuropeptide orexin, which exerts its action by binding to orexin receptors 1 and 2. There is evidence that the OX2R gene’s rs2653349 and rs2292041 polymorphisms may be associated with AD. The FDA has approved orexin as a drug to treat insomnia. For these and other reasons, imaging of the orexin receptor status with PET and/or SPECT appears to be highly impactful. Bai et al. report a new PET radiotracer for orexin receptors neuroimaging which was preclinically used for PET investigations in mice and monkeys.
The following article deals with the adenosine A2A receptor (A2AR), which is regarded as a particularly appropriate target for the non-dopaminergic treatment of PD. Schroder et al. selected the known A2AR-specific radiotracer [18F]FESCH and developed a simplified two-step one-pot radiosynthesis, in order to promote its clinical applicability. The radiotracer was used to investigate the suitability of rotenone-treated mice as an animal model of PD.
In a previous issue (Molecules 21, 650, 2016), the development of 18F-labelled PET ligands for the molecular imaging of the cyclic nucleotide phosphodiesterase 2A, a key enzyme in the cellular metabolism of the second messengers cAMP and cGMP, was reviewed, and PDE2 was proposed as a viable target for future drug development for AD, PD, Huntington’s chorea and psychiatric diseases. Two articles by Ritawidya et al. dealing with fluorine-containing benzoimidazotriazine-based PDE2A-selective ligands for potential PET imaging are included in this Special Issue—the first describes the synthesis and in vitro evaluation of 8-pyridinyl-substituted benzo[e]imidazo[2,1-c]
[1,2,4]triazines as selective PDE2A inhibitors, and the second describes the radiosynthesis and biological evaluation of [18F]BIT1, the best candidate among this series.
Usually, it is broad basic and clinical research on the involvement of potential imaging targets in brain diseases that strongly support the development of related PET/SPECT radiotracers. However, the review of Cummings et al. about the molecular imaging of opioid receptors (ORs) and opioid-receptor-like receptors (ORL) concludes that, in this field, it applies only to μOR, while there is scant documentation of δOR, κOR or ORL1 receptors in healthy human brain or in neurological
x
and psychiatric disorders. Here, clinical PET research must catch up with the recent progress in radiopharmaceutical chemistry.
With the development of radiolabeled amino acids for PET and SPECT imaging, a completely different set of targets for molecular brain imaging was facilitated: brain tumors. The identification of LATI, the sodium- independent L-type amino acid transporter 1, as a light chain of the CD98 heterodimer which is strongly overexpressed in C6 glioma cells, stimulated the radiolabeling of a great variety of amino acids for the purpose of brain tumor imaging. The review by Werner et al. summarizes the clinical value of a variety of tracers that have been used in recent years, for the following indications: the delineation of tumor extent (e.g., for planning of resection or radiotherapy), the assessment of treatment response to systemic treatment options such as alkylating chemotherapy, and the differentiation of treatment-related changes (e.g., pseudoprogression or radiation necrosis) from tumor progression. It also provides an overview of promising newer tracers for the investigation of these questions. The authors conclude that currently, the best-established PET tracers in neuro-oncology are radiolabeled amino acids targeting L-system transporters.
A thematically related review by Drake et al. on brain tumor imaging by PET is focused on glioblastoma. It includes most recent experimental approaches such as sigma receptor imaging, as well as PET imaging of the programmed death ligand 1 (PD-L1), the ADP-ribose polymerase (PARP) and the mutated form of isocitrate dehydrogenase (IDH). The authors conclude that these new PET imaging targets have the potential to enhance diagnosis, staging, and treatment approaches for glioblastoma.
In summary, I regard this to be an interesting collection of papers to get an overview on radiolabeled molecules which are preclinically and clinically used for molecular brain imaging. Future perspectives are also considered, particularly for neurodegenerative diseases and brain cancer.
Peter Brust
Editor
xi


molecules
Review
PET Radiopharmaceuticals for Alzheimer’s Diseaseand Parkinson’s Disease Diagnosis, the Current andFuture Landscape
Bright Chukwunwike Uzuegbunam 1, Damiano Librizzi 2 and Behrooz Hooshyar Yousefi 1,2,*
1 Nuclear Medicine Department, and Neuroimaging Center, Technical University of Munich,81675 Munich, Germany; [email protected]
2 Department of Nuclear Medicine, Philipps-University of Marburg, 35043 Marburg, Germany;[email protected]
* Correspondence: [email protected] or [email protected]; Tel.: +49-6421-586-5806
Academic Editor: Peter BrustReceived: 5 January 2020; Accepted: 17 February 2020; Published: 21 February 2020
Abstract: Ironically, population aging which is considered a public health success has beenaccompanied by a myriad of new health challenges, which include neurodegenerative disorders(NDDs), the incidence of which increases proportionally to age. Among them, Alzheimer’s disease(AD) and Parkinson’s disease (PD) are the most common, with the misfolding and the aggregation ofproteins being common and causal in the pathogenesis of both diseases. AD is characterized by thepresence of hyperphosphorylated τ protein (tau), which is the main component of neurofibrillarytangles (NFTs), and senile plaques the main component of which is β-amyloid peptide aggregates(Aβ). The neuropathological hallmark of PD is α-synuclein aggregates (α-syn), which are present asinsoluble fibrils, the primary structural component of Lewy body (LB) and neurites (LN). An increasingnumber of non-invasive PET examinations have been used for AD, to monitor the pathologicalprogress (hallmarks) of disease. Notwithstanding, still the need for the development of novel detectiontools for other proteinopathies still remains. This review, although not exhaustively, looks at thetimeline of the development of existing tracers used in the imaging of Aβ and important momentsthat led to the development of these tracers.
Keywords: Alzheimer’s disease; Parkinson’s disease; β-amyloid plaques; neurofibrillary tangles;α-synucleinopathy; positron emission tomography (PET); diagnostic imaging probes
1. Introduction
Of all the causes of dementia, AD stands in first place and makes up the largest part—abouttwo-thirds—of all differential diagnoses [1–3], and it is the most common form of dementia in personsolder than 65 years [4]. Others have vascular dementia, mixed dementia, PD, Lewy body dementia(LBD) or frontotemporal degeneration (FTD) [2]. Although AD and PD present markedly differentclinical and pathological features, many mechanisms involved in AD and PD may be the same, suchas mutation in genes, the roles of α-synuclein and tau protein aggregates in oxidative stress andmitochondrial dysfunction, dysregulation in the brain homeostasis of iron [5].
The WHO in 2012 named the prevention and control of neurocognitive disorders (mild cognitiveimpairment (MCI) or Alzheimer’s type dementia) a global public health priority. As of 2012, it wasestimated that worldwide 35.6 million people are living with dementia. By 2030 this number willdouble and by 2050 triple [3]. The World Alzheimer Report also in 2018 estimated that there are50 million people in the world with dementia. This number by 2050 is likely to rise to about 152 millionpeople [2] a projection not far from that made by the WHO way back in 2012.
Molecules 2020, 25, 977; doi:10.3390/molecules25040977 www.mdpi.com/journal/molecules1

Molecules 2020, 25, 977
In the pathogenesis of AD two proteins are implicated β-amyloid peptide aggregates (Aβ) andtau. Based on several scientific evidences, AD is histopathologically characterized by the progressivedeposition of Aβ peptides into the interneuronal space [2,6,7]. The pathogenic pathways leading to ADinvolve several mechanisms which include the dysfunction of cholinergic neurons and the aggregationof tau, however, it has been shown that the amyloid cascade plays a significant role.
The amyloid cascade assumes that the pathogenesis of AD is as a result of a dysfunction inthe synthesis and the secretion of the amyloid precursor protein (APP), usually cleaved by theproteases in the secretase family. Normally, the cleavage of APP by α-secretase within the Aβ domainreleases soluble APP-α which is non-pathologic, whereas, in pathology, Aβ is generated from APP viasuccessional cleavages by β-secretase followed by the γ-secretase complex, which cuts the γ-site ofthe carboxyl-terminal fragment of APP producing two major Aβ isoforms: Aβ1-42 and Aβ1-40, whichsubsequently aggregate to form β-amyloid plaques [8,9]. Aβ1-42 comprises a major part of amyloidplaques owing to its low solubility and tendency to form aggregates with β-pleated sheet structure [9].
Neurodegeneration and neuronal dysfunction are caused by the binding of extracellular Aβ
oligomers to the neuronal surface, leading to functional disruption of a number of receptors, finallyculminating in dysfunction and neurodegeneration [2,10]. The accumulation of hyperphosphorylatedtau protein in neurons, which normally is a microtubule-associated protein (MAP) abundantlyexpressed in the central nervous system, is another key player in the pathogenesis of AD. As a resultof abnormal hyperphosphorylation the protein self-aggregates and forms paired helical filaments(PHF), which leads to the formation of intracellular neurofibrillary tangles, which ultimately block theneuronal transport system [2,11,12].
A definitive diagnosis of AD still requires a histological examination of post-mortem brainsample [13–15]. However, in living patient’s cerebrospinal fluid (CSF) biomarkers and positronemission tomography (PET), in combination with several new clinical criteria can assist in thediagnosis [16,17], and for symptomatic patients with familial early-onset AD, it is recommended toundergo clinical genetic testing together with their asymptomatic relatives [18–20].
The European Medicines Agency has presented the measurement of Aβ peptides and total tauprotein levels in the CSF as a complementary usable tool in the diagnosis and monitoring of AD [21,22].Albeit a less expensive method of evaluation, the method is invasive and carries the risks of adverseeffects and discomfiture associated with a lumbar puncture [23–25].
Non-invasive modern imaging techniques allow to identify either patients who are at risk ofdeveloping AD, and also to monitor disease progression or both [26–28]. Positron emission tomography(PET) imaging especially, which is superior to other imaging techniques in terms of sensitivity, sinceonly picomolar concentrations of the radiotracers are required allows to visualize, characterize andquantify physiological activities at molecular and cellular levels [29,30]. Hence, it may serve as animportant diagnostic tool in the field of drug discovery and development, in order to monitor diseaseprogression and the interaction of ligands with their targets.
Aβ is the most studied and first target for the neuroimaging of AD [31], hence it is no surprisethat there are already selective PET radiotracers for its imaging. In 2003, Mathis et al. reported thecarbon-11 labeled Pittsburgh compound B ([11C]PiB), and the first successful Aβ-selective PET radioligand,which is a derivative of thioflavin (Th-T) an amyloid-binding histological fluorescent dye [32,33].
The discovery of [11C]PiB led to further tracer development of other Aβ tracers. Three of whichare already FDA approved and are 18F-labeled [27] (a radioisotope with a relatively longer half-life of109.7 min [34], in comparison to carbon-11 with a shorter half-life of 20.3 min, a property that logisticallylimits its use to centers with cyclotron on-site [35]): [18F]florbetaben (Neuraceq) [36]; [18F]florbetapir(Amyvid) [37]; [18F]flutemetamol (Vizamyl) [38].
So far, there are other findings that the density and neocortical spread of NFTs correlate better withneurodegeneration and cognitive decline in AD patients [39–42], in spite of Aβ pathology temporarilypreceding tau pathology [27]. Recent evidence further corroborates initial findings of the dominant role
2

Molecules 2020, 25, 977
of tau in the pathogenesis of AD [39,43,44], backing this protein as a diagnostic as well as a therapeutictarget [45].
Moreover, since apart from AD there are other NDD associated with amyloid pathology, amyloidimaging is not enough to differentiate dementia subtypes [27]. Nevertheless, NFTs are also present inother dementias, like FTD, some neurodegenerative movement disorders like corticobasal degeneration(CBD) and progressive supranuclear palsy (PSP) [45]. More recently, Vanhaute et al. reported that theloss of synaptic density in the medial temporal lobe is linked to an increased tau deposition in AD [46,47].Hence, a radiotracer, that could quantify NFTs would help to understand the pathophysiology andclinical management not only of AD, but these other NDD. Furthermore, when done in conjunctionwith amyloid diagnosis, PET imaging of NFTs might provide a way to distinguish between ADdementia (when there are NFTs and Aβ present) and non-AD dementia (when NFTs and Aβ are absent).Furthermore, the application of Aβ imaging is just approved for the exclusion of AD in patients withcognitive impairment but amyloid PET-negative [48]. Also, it is being evaluated as a diagnostic toolfor the definition of the preclinical stages of AD [49]. Due to the abovementioned reasons, severalacademic and industrial groups are currently making efforts to develop tau aggregate tracers, whichare not only selective, but also with minimal or no off-target binding [50–53].
The α-synucleinopathies: PD, LBD, multiple system atrophy (MSA) have their pathological hallmarkas α-syn aggregates included in Lewy body (LB), Lewy neurites (LN), and glial cytoplasmic inclusions(GCI) in MSA [54–57]. α-Synuclein is a small (140 amino acid residues) highly soluble presynaptic proteinthat normally exists in a native unfolded state. In PD, there is formation of highly ordered insolubleaggregates known as α-syn fibrils, which are stabilized by β-sheet protein structure [58–61].
The identification of point mutations in the SNCA gene in familial cases of PD nearly 23 yearsago first linked α-syn to PD [62], and this was corroborated by the additional discovery that increasedgenetic copies of α-synuclein in the form of duplications and triplications of the SNCA gene areenough to cause PD; the higher gene copy, the earlier the age of disease onset and the more severe thedisease [63–65]. More recently, further investigation into the genetic aspects of the disease culminatedin genome-wide association studies (GWAS), and candidate gene association studies which haverepeatedly validated that statistically relevant signals linked to PD are common variants near theSNCA, LRRK2, MAPT and low-frequency coding variants in GBA (glucocerebrosidase) genes [66].Moreover, in GWAS so far, not less than 41 risk loci for PD have been identified [67,68]. Even inthe sporadic forms of the disease, α-syn as a candidate risk gene has shown significant associationsbetween variation within the SNCA gene and a higher risk of developing PD [69].
It has been known for some time now based on fairly strong evidence that the motor phase ofclassical PD occurs after a premotor period that could last for a considerable number of years if notdecades [70]. Before the appearance of motor symptoms, at least 50% of substantia nigra (stage 3 of theBraak staging) cells have to be lost [71,72] and likely a loss of a higher percentage of dopaminergicnerve endings in the putamen [73]. Based on the findings of Braak et al., there are 6 stages in which thedeposition of α-syn in LBs and LNs occurs sequentially and additively [74]. Overall, it is evident thatpathophysiological changes in the central nervous system in PD involves the abnormal depositionof α-syn occurs early in PD, hence the earliest definition and most precise detection of premotor PDshould be based on the imaging of aggregate α-syn, not dopaminergic alterations.
Despite the high abundance of α-syn in the nervous system, where it constitutes 1% of all cytosolicproteins [75], the amount of α-syn aggregates, however, in LBD and MSA brain is 10-fold or lower thanthat of Aβ in AD brain, and in advanced cases in the range of 50–200 nM in brainstem and subcorticalregions, and moreover, they typically have a small size, which complicates detections [76,77].
Unlike Aβ, but similar to NFTs, LBs are intraneuronal and GCI are intraglial, hence any tracer forthe detection α-syn must readily pass through the blood-brain barrier (BBB), and subsequently the cellmembrane to access its target [77,78]. Unfortunately, due to the structural similarity of β-pleated sheetsamongst different species of amyloid fibrils, and the colocalization of α-syn aggregates with otheraggregating amyloid proteins like Aβ plaque and tau fibrils tracer, selectivity for α-syn aggregates
3

Molecules 2020, 25, 977
over the others is a desired quality. This explains why non-selective ligands are more common thanselective tracers [79–82].
Generally, good PET radiotracers for brain amyloid imaging should have the qualities prerequisitefor successful central nervous system ligands [83,84]. A good brain penetration via passive diffusion,relatively small molecular weight (< 700 Da), moderate lipophilicity 1–3 at physiological pH (7.4), lackof P-glycoprotein substrate activity, lack of BBB permeable radioactive metabolites or intracerebralradiometabolites, etc. Most importantly, they should with high affinity selectively and reversibly bindto targets in the brain. Target selectivity an important trait depends on factors such as the relativeaffinities of the tracer to target (specific binding) and non-target (non-specific binding) sites, its braindistribution and the relative concentration of the binding sites. Both target and non-target bindingsites should be considered when developing a brain tracer [77,81,82,85,86].
Additionally, a slow and reversible off-rates coupled (koff) with relatively high on-rates (kon),which is reflected by an equilibrium dissociation constant (Kd) in the range of 1 nM. A low Kd
value in the nanomolar (nM) range could guarantee that the radioligand-amyloid complex remainsintact long enough for a washout of non-specifically bound tracers to occur, hence allowing goodsignal-to-noise contrast. It is also needed especially when dealing with short-lived PET radioisotopeslike 11C with a half-life of 20.3 min and 18F half-life 109.8 min. A standard uptake value (SUV) in thebrain > 1.0 within a few min of intravenous injection is also required. Large molecules, antibodies,and nanobodies can cross the BBB, however they are unable to attain an SUV value > 1.0 a few minpost-injection (p.i), and this has been a disqualifying criterion for large ligands labeled with short-livedradioisotopes [81,85,86].
2. PET Imaging Agents for the Diagnosis AD and PD
2.1. PET-Tracers for the Imaging of Aβ Plaques
2.1.1. First Generation of Aβ PET Tracers
Benzothiazole (BTA) Derivatives
The development of amyloid-specific imaging compounds is based mostly on conjugated dyeslike Th-T (Figure 1) and Congo red, that are used in postmortem AD brain sections for the stainingof plaques and tangles [87–90]. The synthesis of the hundreds of the derivatives of the latter by thePittsburgh group gave rise to a series of pan-amyloid imaging agents that showed nanomolar bindingaffinities for Aβ, tau, α-syn, and prion aggregates. Notwithstanding, a number of these compoundsionize at physiological pH, and for this reason did not achieve high brain uptake ( > 1 SUV) a few minpost intravenous injection [32,91].
Figure 1. Structures of thioflavin-T, [11C]PiB, and the FDA approved Aβ-PET tracers: [18F]florbetaben,[18F]florbetapir, and [18F]flutemetamol.
4

Molecules 2020, 25, 977
The examination of the derivatives of Th-T derivatives followed: making the dye neutral by theremoval of the methyl group attached to the benzothiazole ring via the nitrogen atom of the ring,hence the positive charge on the benzothiazole ring gave rise to compounds (known as benzothiazoleanilines or BTAs) with improved lipophilicity, [11C]6-Me-BTA-1 (Figure 2) being the best in the series.It was 6-fold more lipophilic, and readily crossed the BBB in brains of rodents, and showed 44-foldmore affinity for synthetic Aβ fibrils (Table 1) than did Th-T [92,93].
Figure 2. Structures of the predecessors of FDA approved Aβ-PET tracers: [11C]6-Me-BTA-1, [11C]SB-13,[18F]FMAPO.
Further manipulation of the benzothiazole ring by derivatizing the C-6 position and varying thedegree of methylation of the aniline nitrogen gave a series of ligands with high affinity for Aβ fibrils.Of these radiotracers, the monomethylated-aniline derivative ([11C]PiB [11C]6-OH-BTA-1 (Figure 1),was selected (which will be referred to as just PiB throughout the paper). It showed a combination offavorable pharmacokinetics as PiB, the highest brain clearance 5 times faster than at 30 min and a highbinding affinity to Aβ plaques approximately 207-fold than Th-T [94] (Table 1), with a very low bindingaffinity to aggregated tau, with a ratio of tau-to-Aβ ((Kitau/KiAβ) greater than 100-fold [33,95–97].
Clinical study with PiB showed that AD patients retained PiB in areas of association cortex knownto contain large amounts of amyloid deposits [33]. Further clinical studies to confirm if there is abnormalbinding of PiB in clinically healthy individuals showed that PiB-PET not only was able to detectAβ deposits in AD patients but also in some nondemented patients, hence suggesting that amyloidimaging might be useful in the detection AD in its preclinical stages [98]. Additionally, it was confirmedthat there is a direct correlation of the retention of PiB in vivo with region-matched quantitativeanalyses of Aβ plaques in the same patient, upon post-mortem examination of clinically diagnosedand autopsy-confirmed AD subjects [99]. This too additionally validated PiB-PET as a method forevaluating the amyloid plaque burden in AD subjects [33].
In an experiment carried out by Serdons et al. it was discovered that more than 80% of thetracer remains intact 60 min p.i [100,101]. The radiometabolites of PiB found in animal and humanblood, due to their high polarity did not easily pass through the BBB [94,100]. One of the identifiedradiometabolites 6-sulfato-O-PiB, and others produced in rat brain, built up over time and complicatedpharmacokinetic analyses [95,102]. Fortunately, the intracerebral metabolism of PiB is limited only torats and was not observed in mice, humans, and other nonhuman primates [95].
The success of PiB for in vivo imaging of Aβ plaque deposition led to the development of an 18Fanalog, which would perform similarly. The development of 18F-labeled radiotracers for the imagingof amyloid deposits in AD was on the basis that, as previously mentioned, carbon-11 with which PiBwas labeled has a half-life 20.3 min, and this limits its use to PET centers with cyclotron on-site andwith experience in 11C-radiochemistry [33,36].
A variety of structural analogs were developed and evaluated both in vitro [103] and preclinically,out of which flutemetamol also known as [18F]GE067 ([18F]3′F-PiB) (Figure 1) was selected [104].In vivo studies in rats and mice showed that it has similar pharmacokinetics as PiB. They both readilyentered the brain, however, flutemetamol which is more lipophilic was washed out more slowly fromthe brain approximately 1.4 times slower (Table 1), especially from the white matter [105].
Initial human studies, in which flutemetamol and PiB were compared in AD and control subjects,the former showed similar uptake and specific binding attributes as PiB [104]. A phase-III trial
5

Molecules 2020, 25, 977
demonstrated that it is safe with high specificity and sensitivity for the in vivo detection of brain Aβ
density [106,107]. It was approved by the FDA in 2013 [108].
The Stilbene and Styrylpyridine Derivatives
The discovery of [3H]SB-13, a stilbene derivative which showed a high binding affinity topostmortem AD brain homogenates [109], led to subsequent labeling with carbon-11 to afford[11C]SB-13 (4 methylamino-4′-hydroxystilbene) (Figure 2). The tracer displayed a good brain uptakeand brain clearance (Table 1) [110]. In vivo human PET-imaging it displayed properties similar to PiBin discriminating between AD and non-AD patients [111].
The similarities between PiB and SB-13 in addition to their similar biological properties are also intheir chemical structures: the presence of a highly conjugated aromatic ring with an electron-donatinggroup (N-methylamine (-NHCH3) or hydroxyl (-OH)) at the end of the molecule and the relativeplanarity of both ligands [90].
Early attempts at the development of 18F-labeled SB-13 was unsuccessful, due to the highlipophilicity and high nonspecific binding in the brain shown by [18F]SB-13 derivatives with a fluoroalkylgroup on either ends of their structures. In order to reduce the lipophilicity of the ligands, the stilbenescaffold was further modified by the introduction of different functional groups. Based on in vitro andin vivo biological assays a NH-CH3 derivative [18F]FMAPO, with a 2-fluoromethyl-1,3-propylenediolgroup tethered to the phenol end of molecule (Figure 2) was selected for not only exhibiting a selectivityand specific binding to Aβ plaques in AD brain homogenate binding studies but also for showing ahigher brain penetration in 2 min, which was nearly three times higher than that of flutemetamol in5 min (Table 1). Although it displayed a slower washout than the latter, at 60 min p.i. the concentrationin the brain was less than 1%ID/g [103,112].
In order to circumvent the complication of in vivo metabolism, which might result due to thepresence of a chiral center in the fluorine containing side chain, another series of stilbene derivativeswere synthesized with polyethylene glycol (PEG) units of different lengths (n = 2–12) tethered to the4′-OH group, with 18F attached at the end of PEG side-chain. This also provided a way to maintaina small molecular weight, adjust lipophilicity and facilitate a simple 18F-labeling by nucleophilicsubstitution. Structure-activity relationship (SAR) studies showed that high binding affinity wasmaintained when n < 8, and from 8 and above there was a significant reduction in binding affinity.There was a noticeable decrease in brain penetration as shown by in vivo biodistribution studies whenn > 5 [113–115], perhaps partly due to increased molecular weight and total polar surface area (tPSA).
Of the four ligands which performed well in in vitro and in vivo assays, florbetaben (Figure 1) alsoknown as AV-1, or BAY94-9172 with n = 3, was selected. Although the tracer did not have the highestaffinity for Aβ in comparison with its structural analogs or the fastest washout rate (Table 1) from thebrain of healthy mice [114], it, however, showed selectivity for Aβ and non-appreciable binding toNFTs, Pick bodies, LBs and GCIs [112]. Furthermore, binding to postmortem cortex of subjects withFTD or postmortem brain tissue from other NDDs like tauopathies and α-synucleinopathies was notobserved [114]. With no observable effects at 100x the expected human dose in preclinical toxicitystudies in a different animal species, florbetaben was deemed suitable for human studies [116]. In 2014,it was approved by the FDA [117].
In order to obtain an Aβ tracer with improved in vivo biological properties of targeting Aβ
plaques, so that a high signal to noise ratio is quickly and more efficiently achieved, some critical andcompeting factors were taken into consideration: initial brain uptake, washout from non-afflicted brainregions, in vivo metabolism, and optimal time in the accomplishment of the highest target-to-non-targetratio. For this reason, the stilbene ring was further explored. The fluoropegylation discussed abovewas extended from stilbene to styrylpyridine series. This was achieved by exchanging one of thestilbene benzene rings for a pyridine ring. This led to the development of florbetapir also known as[18F]AV45 [118]. It displayed 2-fold more binding affinity to Aβ in postmortem AD brain homogenates
6

Molecules 2020, 25, 977
than florbetaben. Nevertheless, it showed a slightly lower initial uptake and washout rate from thebrain of healthy mice than florbetaben (Table 1) [114,119].
An initial clinical trial with a tertiary amine derivative, which was similar to florbetapir but forthe dimethylation of the aniline nitrogen suggested lower than expected brain uptake, probably due toa fast in vivo metabolism by N-demethylation. Of all the evaluated ligands, faster brain kinetics wasexhibited more by florbetapir, and it also displayed an excellent brain uptake and washout in humans.The signal to noise ratio in the brain approaches an optimal level in 40–60 min post intravenousinjection. In vitro metabolic stability assay also demonstrated that it is more stable towards microsomaldegradation than florbetaben [115,118].
In AD patients, florbetapir from 30 min p.i. showed a clear separation between corticaland cerebellar activity, hence making it possible to start brain PET scan 30–50 min p.i. [120].Significant elevations of tracer uptake in several brain regions of AD patients in comparison with controlswere observed upon visual evaluation and analysis using semiquantitative methods. Results fromphase III clinical trial showed a distinct correlation between the distribution of Aβ and florbetapir PETimages at postmortem examination. Furthermore, no serious side effects were recorded in any of theclinical trials of the tracer [121]. It was approved by FDA in 2012 [31,122].
2.1.2. Second Generation of Aβ PET Tracers
Benzofuran, Benzoxazole and Imidazobenzothiazole Derivatives
Other notable Aβ tracers include flutafuranol, also known as [18F]AZD4694 ([18F]NAV4694)(Figure 3) a benzofuran derivative, developed by researchers at AstraZeneca in Sweden [123].Its development, amongst other second generation of 18F-labeled Aβ imaging agents [124] wasspurred by the report that flutemetamol and florbetaben, have high level of non-specific white matterretention [116,125,126], which could be a limitation in situations when insoluble Aβ levels are low,due to a spillover effect of radioactivity to adjacent cortical regions from nonspecific binding in whitematter. Hence, they may not be useful for correct mapping of Aβ plaque load in low-density regionsand in prodromal phases of AD.
Figure 3. Structures of second generation Aβ-PET tracers: [18F]AZD4694, [18F]MK-3328, [18F]AD-269,[18F]FIBT.
Using the intravenous cassette dosing technique to compare the pharmacokinetics of flutafuranoland flutemetamol, it was seen that they were both readily taken up in the brain tissue and washed outof the brain normal rats between 2 and 30 min, but with less than 10% of concentration of flutafuranolat 2 min remaining at 30 min, a time point at which flutemetamol still had up to 28% of the initialconcentration at 2 min (Table 1) [103]. With its fast binding kinetics, it could perform better than otherAβ tracers, like PiB, which display, based on time-activity curves, slower kinetics with a blunt peak ofspecific binding accompanied by a slower decline [95,127]. Consequently, its rapid binding kineticsmakes quantification using data based on short acquisition possible. Furthermore, using the cerebellum
7

Molecules 2020, 25, 977
as a reference region in approaches like reference Logan, valid estimates of Aβ binding could be easilyacquired [128]. It is presently in its phase III of clinical trial for the evaluation of its efficacy and safetyfor the detection of cerebral Aβ in comparison with postmortem histopathology [129,130].
A benzoxazole derivative [18F]MK-3328 (Figure 3), which was selected amongst four otherfluoroazabenzoxazoles owing to its favorable kinetic profile, shown in rhesus monkey PET studies,a relatively low binding potential in white matter and cortical grey matter, which is approximately2× lower than that of florbetapir, a relatively lower lipophilicity at log D 2.91, in comparison with ananalog [18F]AD-269 with similar properties, but more (1.21 fold) lipophilic (Table 1).
In autoradiography studies, it was observed that in an AD patient brain slice that MK-3328 showedpunctuate, displaceable binding in the cortical gray matter, with no noticeable binding in thecerebellum [131]. Investigation of the tracer in healthy human volunteers and AD subjects wasalso being carried out at the time until the premature termination of the clinical trial after thecompletion of phase 1 of its clinical trial [132].
The best imidazobenzothiazole derivative [18F]FIBT (Figure 3) was reported by the Yousefi etal. group and it was described as the first high-contrast Aβ-imaging agent on par with florbetaben(Figure 4). It also displayed excellent pharmacokinetics, selectivity and high binding affinity to Aβ
fibrils in vitro and in vivo comparable to the gold standard PiB [133–135].Their results also showed that FIBT has a better pharmacokinetic profile and specific binding
affinity to Aβ than florbetaben in transgenic mice. This could be expected from a tracer with >300-foldselectivity for Aβ in comparison to the other amyloid protein aggregates a Ki >> 1000 nM to recombinanttau and Ki >> 1000 nM to α-syn aggregates [114,136]. Further investigations of the tracer in humansubjects are however yet to be carried out [133,135].
Figure 4. Exemplary sagittal PET images of the FDA approved Aβ PET-tracers of Alzheimer’sdisease patients with other select featured tracers, [11C]PiB, [18F]Florbetaben, [18F]Flutemetamol,[18F]Florbetapir, [18F]Flutafuranol, and [18F]FIBT (reproduced with permission as agreed by NewlandsPress Ltd. [135]).
8

Molecules 2020, 25, 977
Ta
ble
1.
Bind
ing
affini
ties
and
Phar
mac
okin
etic
sof
feat
ured
Aβ
PET-
trac
ers.
Tra
cer
Lo
gP
Aβ
(1-4
0)
fib
rils
,[n
M]
Aβ
(1-4
2)
Fib
rils
,[n
M]
Aβ
pla
qu
es
inB
rain
Ho
mo
ge
na
tes,
[nM
]
Bra
inU
pta
ke
[%ID/g
](2
min
p.i
.)
Bra
inC
lea
ran
ce[%
ID/g
](3
0m
inp
.i.)
Ki
Kd
Ki
Kd
Ki
Kd
Th-T
[92,
96]
0.57
890
580
NA
NA
NA
NA
NA
NA
NA
[11C
]PiB
[91,
94][
105,
131]
1.2
2.23
4.3
4.7
NA
NA
IC50
:2.
31.
40.
21%
ID-k
g/g
1
1.50
(5m
inp.
i.)
0.01
8%ID
-kg/
g1
0.31
[18F]
Flor
beta
ben
[114
,119
]2.
41N
AN
AN
AN
A6.
72.
22N
A7.
771.
59
[18F]
Flor
beta
pir
[119
]N
AN
AN
AN
AN
A2.
873.
727.
331.
88(6
0m
inp.
i.)
[18F]
Flut
emet
amol
[103
,105
]3.
22
15.3
1.6
NA
NA
NA
NA
3505
nM98
0nM
NA
NA
NA
NA
NA
NA
NA
3.67
(5m
inp.
i.)0.
42
[11C
]6-M
e-BT
A-1
[92,
94,9
6]3.
3620
.210
NA
NA
NA
NA
NA
7.61
0.22
3%ID
-kg/
g1
2.76
0.08
3%ID
-kg/
g1
[11C
]SB-
13[1
10,1
12]
2.36
6.0
NA
NA
NA
1.2
NA
1.15
(cor
tex)
1.15
(cer
ebel
lum
)0.
42(c
orte
x)0.
41(c
ereb
ellu
m)
[18F]
FMA
PO[1
12,1
14]
2.95
NA
NA
NA
NA
5.0
NA
9.75
1.70
[18F]
Flut
afur
anol
[18F]
AZ
D46
94[1
03]
2.8
218
.52.
3N
AN
AN
AN
A15
50nM
154
nM
[18F]
MK
-332
8[1
31]
2.91
NA
NA
NA
NA
IC50
:10
.5N
AN
AN
A
[18F]
AD
-269
[131
]3.
42N
AN
AN
AN
AIC
50:
8.0
NA
NA
NA
[18F]
FIBT
[133
,134
]1.
922.
1N
AN
AN
AN
A0.
7~7
.33
~1.2
53
The
log
Pva
lues
are
the
part
ition
coeffi
cien
t(oc
tano
l/wat
er)o
rlo
gD
part
ition
coeffi
cien
t(oc
tano
l/PBS
)rep
orte
din
the
resp
ectiv
epu
blic
atio
ns.1
The
sam
ples
wer
ew
eigh
edto
dete
rmin
eth
epe
rcen
tinj
ecte
ddo
sepe
rgr
amti
ssue
(%ID/g
),an
dth
isva
lue
was
mul
tipl
ied
byth
ew
hole
-bod
yw
eigh
t(in
kg)t
ode
term
ine
body
-wei
ghtn
orm
aliz
edra
dioa
ctiv
ity
conc
entr
atio
n[(
%ID
-kg/
g)]v
alue
s.2
Elog
Doc
t.3
The
valu
esw
ere
esti
mat
edfr
omba
r-ch
arts
pres
ente
din
the
publ
icat
ion.
NA
:dat
ano
tava
ilabl
e.
9

Molecules 2020, 25, 977
2.1.3. The Clinical Utility and Consequences of Clinically Approved PET-Aβ Radiotracers
Since the clinical approval of the abovementioned three FDA approved PET-Aβ tracers asdiagnostic tools for the detection of neuritic (Aβ) plaques in live patients, there have been studies todetermine their clinical usefulness in the diagnosis AD. These studies have been subsequently andspecifically well-reviewed by Kim et al. [137], Barthel et al. [138], Chiotis et al. [139].
In general, the studies have showed that the use of the Aβ-PET tracers led to a moderate tosignificant change in diagnosis, diagnostic confidence [140–145], and had a substantial impact onchange in the treatment and management plan of AD [137,144,146]. It is likely that the new generationof Aβ-PET tracers with improved pharmacokinetics will allow for improved signal-to-noise ratio,hence will be more suitable for the quantification of disease progression and therapeutic monitoring.
2.2. PET-Tracers for the Imaging of Tau Aggregates
As mentioned earlier, the tau protein plays a key role in the pathogenesis of AD [2,6,11,12].The predominant aggregation of certain MAPT (tau gene) isoforms, either the 4-repeat (4R tau) orthe 3-repeat (3R tau) isoforms have been widely described in tauopathies. So, in addition to thealready mentioned properties every CNS tracer should possess [65,67,68,73,74], tau tracers must alsoaddress 3R and 4R tau deposits. 3R and 4R tau proteins are the classifications of the 6 tau isoformsaccording to their tubulin-binding domains [147,148]. In a normal brain, there are equal amountsof the 3R and 4R tau proteins, as well as in AD. An imbalance in tau ratio can lead to abnormal tauaccumulation and lead to NDD as in tauopathies. For instance, there is an ample amount 4R tau in PSP,CBD, and argyrophilic grain disease, in contrast, there is an abundance of the 3R tau in Pick’s disease(PiD) [149]. Furthermore, tau tracers should also be able to bind to different tau folds, all of which willfacilitate the detection of tau pathology in both AD and non-AD tauopathies [150,151].
The identification of lead compounds for the imaging of Aβ proteinopathies has been relativelyeasier since most β-sheet binding ligands have a high affinity for Aβ fibrils, with which NFTs coexist inAD and both are colocalized in the gray matter structures [42,152]. In spite of controversy surroundingthe subject, PHFs predominantly found in NFTs in in vitro experiments suggest a β-sheet structuredcore similar to that characteristic of Aβ and α-syn fibrillar aggregates [42]. There are recent reportsthat there are α-syn containing aggregates present in AD [79,153]. Therefore, tau PET tracers should beselective for tau aggregates over these aggregates as well.
In AD, there is a distinct difference in the concentration of Aβ relative to tau aggregates.The concentration of Aβ is approximately 5–20 times higher than that of tau aggregates [154]. In spite ofthis inequality in quantity, there is however a clear-cut regional pattern of Aβ and tau deposition in theneocortex. The frontal cortex has the highest concentration of Aβ aggregates, while the temporoparietalcortices have the highest concentrations of tau aggregates. Different distributions of tau aggregates arealso found in the different phenotypes. Although this has its own merits as it will facilitate differentialdiagnosis of tauopathies, it means that it is unlikely a single tau PET tracer could bind to the wholespectrum of tau polymorphism [42]. In this review, some select selective tau tracers already evaluatedin human subjects will be examined, together with other notable tau tracers.
2.2.1. First Generation of Tau-PET Tracers
The Arylquinolines
The THK-compounds (Figure 5) were as a result of the structural modification of the leadcompounds BF-158 and BF-170, arylquinoline derivatives. Even though in vitro fluorescence bindingaffinity assay data and neuropathological suggested that they are good tau ligands, they showed poorselectivity over amyloid plaques, and furthermore were unable to bind to tau present in non-ADtauopathies. However, autoradiographic studies in AD brain section showed an uptake BF-158 inbrain regions which were NFT-rich. Biodistribution studies, analyzed using HPLC with a fluorescencedetector, showed a good uptake BF-158 (11.3% ID/g at 2 min p.i.) of BF-158 in the brain of normal
10

Molecules 2020, 25, 977
mice but a slow washout with only 27.4% of the concentration at 2 min washed out at 30 min, whichsuggested a high unspecific binding (Table 2). In contrast BF-170 performed better in the biodistributionstudies with good brain uptake, as well as a faster washout at 30 min than BF-158 [155] (Table 2).
Figure 5. Structures of the first generation tau-PET tracers: BF-158, BF-170, [18F]THK-523,[18F]THK-5105, [18F]THK-5117, [18F]THK-5317(17), (S)-[18F]THK-5117 ([18F]THK-5351), [11C]PBB3,[18F]Flortaucipir (AV-1451, [18F]T807), [18F]T808.
Structural modification of BF-170 led to the development of [18F]THK-523 (Figure 5) a[18F]fluoroethoxy derivative. The introduction of an alkylether in the C6 position of thearylquinoline structure improved its affinity and selectivity for tau aggregates relative to BF-170 [156].However, competition studies showed that it has a relatively low affinity for recombinant tau fibrils (Ki
59.3 nM) and even lower for PHF in AD brain homogenates (Kd 86.5 nM) than synthetic heparin-inducedtau polymers (HITP) Kd 1.67 nM (Table 2), an evidence of the inadequacies of synthetic tau preparations,which fails to completely replicate native tau aggregates in vivo [156,157].
Notwithstanding, it performed better in vivo than it did in vitro. In comparison to healthy controls,it showed higher cortical retention in AD subjects and was distributed in the brain in accordance withreported histopathological brain distribution of PHF in AD. Unfortunately, due to its high white matterretention, a clear visualization of PET scans was not possible, and for this reason, it was not furtherdeveloped [158].
11
Molecules 2020, 25, 977
Introduction of a secondary alcohol in the fluoroethoxy chain in BF-170 and the monomethylation[18F]THK-5117 and dimethylation [18F]THK-5105 (Figure 5) of the aniline moiety gave tracers withhigher in vitro affinities (Kd) for both synthetic HITP tau fibrils and for human AD-PHF tau aggregatesthan [18F]THK-523: they showed a 16-fold and 32-fold increase in affinity for human AD-PHFtau aggregates in comparison to their direct predecessor [18F]THK-523, a higher in vitro selectivityfor tau versus Aβ; a coincidence with Gallyas-Braak staining and immunoreactive tau staining inautoradiography staining of human AD brain sections but not with the distribution of PiB and an goodinitial brain uptake and washout in normal mice than [18F]THK-523 [157] (Table 2).
An improved selectivity could be due to the secondary alcohol present, a polar terminus inthe molecules. Likewise the presence of a secondary amine in [18F]THK-5117 and a tertiary aminein [18F]THK-5105 seemed to be behind the enhancement of tau affinity and better pharmacokineticprofile [35].
However, the N-dimethylation of [18F]THK-5105 appeared to be its undoing: due to itsrelatively higher lipophilicity (1.3x) than [18F]THK-5117 (Table 2), it showed in vivo nonspecificbinding in the brainstem, thalamus and subcortical white matter, which hinders interpretation.Notwithstanding, it was still able to differentiate between AD patients and healthy control in itsfirst-in-human PET studies. Its distribution in the mesial and lateral lobes of AD patients is inaccordance with the reported NFT distribution in AD brain. Nevertheless, due to its inadequacies incomparison to other known tau-PET tracers, it was not used further [159,160].
On the other hand, first human PET studies with [18F]THK-5117, demonstrated that it has fasterkinetics and better signal to noise ratio than seen in [18F]THK-5105, in comparison to which it is lesslipophilic. Clinical studies have been conducted with the (S)-enantiomer [18F]THK-5317, owing toits better signal-to-noise ratio and pharmacokinetics than the (R)-enantiomer, a trait observed in thequinoline derivatives [159,161–163]. One of the shortcomings of [18F]THK-5117 and its S-enantiomer[18F]THK-5317 is their significant white matter binding, which might be owing to binding to β-sheetstructures of myelin basic protein [164].
In order to reduce white matter binding a feature common among 18F-labeled amyloid tracers,a structural modified (S)-[18F]THK-5117 was developed, the phenyl ring was replaced with a pyridinylring, which made [18F]THK-5351 more hydrophilic [164]. It not only displayed a quicker white matterwashout (lower white matter retention) and higher specific binding to AD tau-associated regions ofinterest than [18F]THK-5317, but also its retention correlated with extra-hippocampal sub-regionalatrophy rather than hippocampal subfields, proffering hence different underlying mechanisms ofatrophy in early AD. Another remarkable advantage it has over other tau tracers was the lack ofsignificant retention in the choroid plexus or venous sinus, which could probably lead to a spill-in oftracer signals into the brain [165,166].
Unfortunately, it has been reported to have high affinity to monoamine oxidase-B (MAO-B) (anisoform of monoamine oxidase whose function is to catalyze the oxidation of monoamines [167,168])in contrast with [18F]THK-5117, and also showed a greater off-target binding in the midbrain, thalamusand the basal ganglia [169,170].
The Phenylbutadienylbenzothiazoles (PBB)
Following the observation that ligands with a π-electron-conjugated backbone longer than 13Åshowed affinities for pathological inclusions in a several tauopathies Maruyama et al. investigatedthe affinities of a series of compounds with a different structural dimension to tau aggregatesand concluded that a core structure with specific distance from 13–19 Å contributes to affinity fornon-AD inclusions. Additionally, since ligands with a slender and flat backbone have the abilityto transverse and attach to channel-like channels in β-pleated sheets they developed a class ofcompounds phenyl/pyridinyl-butadienyl-benzothiazoles/benzothiazoliums (PBBs) [171]. They arestructural analogs of fluorescent amyloid dye Th-T, with an all-trans butadiene bridge between the
12

Molecules 2020, 25, 977
aniline and benzothiazolium moieties. Interestingly the resulting tracers were also able to detect tauinclusions in non-AD tauopathies like CBD, Pick’s disease and PSP [172].
Amongst a series of analogs, [11C]PBB3 (Figure 5) was selected as the best candidate with anaffinity Kd for HITP 2.55 nM and nearly 50 folds selectivity for tau versus Aβ fibrils [35,172] (Table 2).Based on preclinical findings in mice, the tracer was further evaluated in humans. It showed incomparison with control accumulation in the medial temporal region of AD subjects. Its distributionin AD human brains differed from that of PiB, suggesting minimal nonspecific binding to white matter,although in both controls and AD brains it accumulated in dural venous sinuses. The use of thetracer in a CBD patient showed its retention in the basal ganglia, hinting that it could be useful for theimaging non-AD tauopathies additionally [172].
The compound although it seemed to be a likely candidate for the in vivo imaging of tau pathology,regrettably had some in vitro and in vivo instability problems. The in vitro instability was due toits photoisomerization tendencies: the quick interconversion of E/Z isomers in the presence of light.Although, this can be suppressed by shielding it from light during radio- and chemical synthesis itstill is an inconvenience. In vivo, it gets quickly metabolized in mice and humans, with 2% remainingunchanged in mice at 1 min p.i. and 8% at 3 min p.i. in humans. Although this radiometabolite ispolar, in mice it still made image analysis difficult [173]. It also displayed off-target binding in thebasal ganglia, the choroid plexus and the longitudinal sinus [172]. Nevertheless, a new fluorinatedPBB compound [18F]PM-PBB3 (Figure 6) has been developed and is being clinically investigated tofind out if there would be an improvement in the shortcomings of [11C]PBB3 [51].
Figure 6. Structures of the selected second-generation tau-PET tracers. [18F]GTP1, [18F]PM-PBB3(APN-1607), *9, [18F]MK-6240, *12, [18F]RO-948 (RO6958948), [18F]PI-2620, [18F]JNJ64349311(JNJ311).
13

Molecules 2020, 25, 977
Interestingly, in in vitro fluorescent study using postmortem DLB and MSA brain sectionsPBB3 was colocalized on α-syn in LBs, LNs, and GCIs. In contrast, autoradiographic labeling with[11C]PBB3 at 10 nM only showed significant binding in MSA cases in regions with a high density ofGCIs in the absence of tau or iron deposits. Since the maximum concentration of [11C]PBB3 in humanPET scans is roughly 10 nM as presented by Koga et al., it means that α-syn is only detectable by[11C]PBB3 in MSA patients with a high density of GCIs [174]. A later in vivo human PET study onMSA patients by Perez-Soriano et al. was consistent with the work carried out by Koga et al., that[11C]PBB3 binds to α-syn [175,176].
The Carbazole and Benzimidazole Derivatives
A screening campaign at Siemens MI Biomarker Research led to the discovery of these classes oflead series [177]. Further optimization led to the development of flortaucipir (AV-1451, [18F]T807) and[18F]T808 (AV-680) (Figure 5). They both have sufficient affinity for tau (AD-PHF) 14.6 nM and 22nMbased on a Scatchard analysis of autoradiography staining of human PHF-AD brain sections, withKd(Aβ)/Kd(tau) 25 and 27 respectively, meaning a higher selectivity of tau aggregates over Aβ fibrils(Table 2). The binding of [18F]T808 to only one type of binding site of the tau aggregates as seen fromthe degree of linearity in its Scatchard plot further confirmed its selectivity for tau aggregates overAβ. Most importantly, they have minimal white matter binding and a good pharmacokinetic profile(Table 2) [178,179].
Initial PET scans of flortaucipir in controls and subjects with AD and mild cognitive impairmentdemonstrated an accumulation of the tracer with a distinct increasing neocortical distribution intandem with the severity of dementia [180] according to the known mode of spread of PHF in thebrain in agreement with Braak’s staging [181]. In other tauopathies such as PSP and CBD, it wasshown in a head-to-head comparison of [11C]PBB3 and flortaucipir, that the former binds moreavidly to neuronal and glial tau lesions relative to the vague binding of flortaucipir [182]. Similar to[11C]PBB3, it is suspected that flortaucipir significantly binds to α-syn in the posterior putamen MSApatients. This, however, is not consistent with in vitro autoradiography results, which so far has provenotherwise [183,184].
First-in-human PET studies with [18F]T808 showed similar results as flortaucipir, but with morerapid kinetics. As early as 30 min p.i. [18F]T808 images stabilized, but flortaucipir SUVR valuesafter 80 min still fluctuated. Notwithstanding, flortaucipir was selected over [18F]T808 for clinicaldevelopment, because of the metabolic defluorination observed in some cases, and the significantaccumulation of fluorine-18 in the skull especially in late time points, that could confound PET images.This prevented further in vivo use of the tracer [185].
Off-target binding has been seen in flortaucipir PET studies in the meninges, striatum, choroidplexus and midbrain. In the analysis of autopsy brain samples, it was found out that flortaucipir alsobinds to vessels, iron-associated regions, substantia nigra, the leptomeningeal melanin and calcificationsin the choroid plexus [186]. Another important off-target of flortaucipir is to both isoforms of the MAOenzyme [167,168,187,188]. Furthermore, there was difficulty in quantification due to the fact that itdoes not reach a steady-state during a typical imaging duration [189,190].
14

Molecules 2020, 25, 977
Ta
ble
2.
Bind
ing
affini
ties
and
Phar
mac
okin
etic
sof
feat
ured
first
-gen
erat
ion
tau
PET-
trac
ers.
Tra
cer
Lo
gP
Ta
uAffi
nit
y[n
M]
Se
lect
ivit
yta
u/A
βAβ
Affi
nit
y(n
M)
Bra
inU
pta
ke
[%ID/g
]B
rain
Cle
ara
nce
[%ID/g
]
HIT
PA
D-P
HF,
Kd
[nM
]2
min
p.i
.3
0m
inp
.i.
BF-1
58[1
55]
1.67
EC50
:399
NA
1.60
1K
i:>
5000
11.3
3.1
BF-1
70[1
55]
1.85
EC50
:221
NA
3.50
1K
i:>
5000
9.1
0.25
[18F]
THK
-523
[156
,157
]2.
40K
d1:1
.67
Kd2
:21.
74K
i:59
.30
86.5
010
2K
d1(A
βfib
rils
):20
.72.
751.
47[18
F]TH
K-5
105
[157
]3.
03K
d1:1
.45
Kd2
:7.4
0K
i:7.
802.
6325
2K
d1(A
βfib
rils
):35
.99.
203.
61[18
F]TH
K-5
117
[157
]2.
3210
.50
5.19
302
NA
6.06
0.59
[18F]
THK
-535
1[1
64]
1.5
NA
2.9
NA
NA
NA
NA
[11C
]PBB
3[1
72,1
73]
3.3
NA
Kd
:2.5
53
482
Kd
:114
31.
92(1
min
p.i.)
0.11
[18F]
Flor
tauc
ipir
(AV
-145
1,[18
F]T8
07)[
178,
191]
1.67
NA
14.6
325
2N
A4.
43(5
min
p.i.)
7.5
0.62
0.8
[18F]
T808
[179
,191
]N
AN
A22
272
NA
4.9
0.4
The
log
Pva
lues
are
the
part
ition
coeffi
cien
t(oc
tano
l/wat
er)o
rlo
gD
part
ition
coeffi
cien
t(oc
tano
l/PBS
)rep
orte
din
the
resp
ectiv
epu
blic
atio
ns.S
elec
tivity
tau
vsAβ
:1EC
50(A
β)/
EC50
(tau
),2
Kd(
Aβ
)/K
d(ta
u).N
A:d
ata
nota
vaila
ble.
3A
utor
adio
grap
hic
bind
ing
topl
aque
-and
tang
le-r
ich
regi
ons
inA
Dbr
ains
.
15

Molecules 2020, 25, 977
2.2.2. Second Generation of Selective Tau Tracers
Even though several goals were achieved with the first-generation selective tau tracerslike improvement in affinity to both 3R and 4R tau deposits, selectivity of the tracers totau aggregates versus Aβ plaques, and pharmacokinetics, there remains still the problem oflack of selectivity over other protein aggregates, and brain contents: subcortical white matteraccumulation, in conjunction with off-target binding especially to MAO-B enzyme in the basalganglia. Findings in which the THK-radiotracers and flortaucipir have been implicated followingin vitro assessments [169,170,184,188]. Clinical validity could be limited in tauopathies where theaccumulation of tau is expected in regions with a high concentration of MAO-B, like in PSP and CBS.
There has, furthermore, also been mounting evidence that the binding of certain tracers suchas flortaucipir and 18F-labeled THK tracers is not only limited to tau deposits but to other proteindeposits, like TDP-43 (transactive response DNA binding protein 43 kDa) predominantly present inpatients with semantic dementia. Flortaucipir as well as [11C]PBB3 showed in vivo binding in patientsexpected to have α-synuclein deposits [174–176,183,184].
Consequently, efforts are being made by various pharmaceutical companies and research institutesto optimize the binding selectivity and enhance the pharmacokinetic profile of tau PET tracers.Hence, more focus will be paid in this section to improvements in the pharmacokinetic profile andspecificity of the new tracers in comparison to their predecessors.
Optimized First Generation Tau Tracers
As mentioned earlier [185], [18F]T808 had a propensity to metabolic defluorination, which led to theselection of flortaucipir (AV-1451, [18F]T807) over it, despite its faster kinetics (Table 2). For this reason,it was deuterated to improve its in vivo stability to defluorination, which resulted in the development of[18F]GTP1 (Figure 5). This modification prevented the accumulation of free 18F-flouride in the skull inclinical PET study, in which it also distinctly differentiated AD subjects from healthy controls [189,192,193].
In addition to its low nanomolar affinity to tau aggregates and excellent selectivity to Aβ plaque(Table 3), it was reported to bind to non-AD tau aggregates. It also showed no off-target bindingespecially to MAO-B. Both preclinical and clinical in vivo kinetic studies showed that the tracer has agood pharmacokinetic profile which allows imaging some minutes earlier than flortaucipir [190,194].Further investigations however still need to be carried out to properly compare these two tracers [193].
An introduction of fluorine-18 in the structure of the first-generation tracer [11C]PBB3 gave riseto [18F]PM-PBB3 (APN-1607) (Figure 6). In human subjects, it showed in less than 5 min a peak ~2.5[18F]PM-PBB3 SUV in the brain. It has less off-target signals in the basal ganglia than [11C]PBB3, and agreater signal-to-background ratio. It showed no significant off-target binding in the basal gangliaand thalamus. Furthermore, it did not show radiometabolites in the brain as did its predecessor[11C]PBB3 [192,195]. Phase 0 of its clinical evaluation was completed not so long ago in 2018 [196].
A structurally modified version of flortaucipir whose inadequacies were alreadydiscussed [186,187,197], [18F]RO-948 (RO69558948) (Figure 6) was developed and selected fromthree lead compounds. Of the selected three which also displayed good brain uptake, fast brainclearance, high affinity for NFT (Table 3) and excellent selectivity against Aβ plaques in AD brain tissue,lower affinity for MAO-A and MAO-B in comparison to [18F]T807 and [18F]THK-5351, and basedon preclinical binding study RO-948 was selected for further development. This was because incomparison to the other analogs it displayed better pharmacokinetics and metabolic properties bothin mice and non-human primates. Moreover, it showed a better signal-to-background ratio than theothers in AD patients. Notwithstanding, three of them gave results from their first-in-human study,which were consistent with preclinical data [198–200].
Upon the discovery that affinity for MAO-A is significantly attenuated and high affinity foraggregated tau improved in the presence of pyrrolo[2,3-b:4,5-c’]dipyridine core structures in comparisonto pyrido[4,3-b]indole core structure a series of fluoropyridine regioisomers were developed from whichthe 4-pyridine regioisomer [18F]PI-2620 (Figure 6) a regioisomer of RO-948 was selected. In AD brain
16

Molecules 2020, 25, 977
homogenate competition assays, it demonstrated a high affinity for tau deposits pIC50 8.4 nM (Table 3),and a superior binding to both 3R and 4R tau aggregate folds in self-competition experiments usingrecombinant K18 fibrils (representing 4R tau pathology) as well as human PSP and PiD brain homogenates.
Besides, it is selective over Aβ and has no off-target binding towards either MAO-A as[18F]RO-948 or MAO-B as flortaucipir, and furthermore showed low off binding in brains ofnon-demented controls, with rapid and complete washout. It also showed selective binding topathological tau present in Braak I, III and V human brain sections in autoradiography experiments.In autoradiography studies it also showed to tau aggregates/folds in PSP brain sections, which ofcourse has been controversial, since many tau tracers has been reported not to be bind to tau deposits inPSP in autoradiography experiments. However, off-target binding was observed in the pars compactaportion of the substantia nigra in human brain sections, consistent with the affinity of some tau tracerslike flortaucipir, [18F]MK-6240 to melanin-containing cells [52,53,201].
Clinical data are needed to confirm the usefulness of [18F]PI-2620 in non-AD patients.Nonetheless, it is presently being examined in several clinical trials in order to establish itspharmacokinetic profile in humans, and decide its application in in vivo PET-imaging of tauaggregates/folds both in non-AD and AD tauopathies [53].
The Azaindole-Isoquinoline and Naphthyridine Derivatives
Following an SAR study, an azaindole-isoquinoline derivative was developed. The study showedthat the azaindole core (*9) (Figure 6) with a 2,4-substituted pyridine shown below was the minimumpharmacophore needed for a high binding affinity to NFTs. The insertion of fluorine in the minimalpharmacophore led to a loss in affinity by >10 fold. This was also observed when either pyridinyl ringswere fluorinated. A phenomenon, which hinted at a specific electronic contribution of the basic nitrogento NFT binding. In [18F]MK-6240 there is a minimum effect of fluorine on the basicity of the heterocyclicnitrogen in the isoquinoline ring and the presence of a primary amine, an additional stronger basiccenter, must have improved its affinity to NFTs, Kd 0.36, in comparison to the 1,6-naphthyridinederivative (*12), with both basic centers in the ring, with affinity to NFTs, Kd 52.6 [202] (Table 3)
It exhibited favorable pharmacokinetics, with a fast brain uptake and clearance (Table 3). Uptake washigher in AD subjects and was considerably higher in brain regions expected to have NFT like in thehippocampus, but very low uptake in the cerebellar gray matter suggests a potential use of the cerebellargray matter as a reference region. Based on reliability analysis simplified quantitative approaches couldoffer informed estimates of NFT load [203]. Furthermore, the spatial patterns of binding of the tracer werein accordance with the neuropathological staging of NFT, as reported from recent clinical studies [204].
Preclinical findings confirmed a lack of binding to MAO-A and MAO-B [203]. Unlike flortaucipirand [18F]THK-5351 off-target binding was not seen in the choroid plexus and basal ganglia [204], but likeflortaucipir and various tau PET tracers, off-target binding to neuromelanin- and melanin containingcells like the pigmented neurons in the substantia nigra, and meninges was observed [52,187,201].To confirm initial observations, there are ongoing clinical trials on non-AD patients. The phase I of itsclinical trial was completed in 2016 [205].
A 1,5-napthyridine derivative, [18F]JNJ64349311(JNJ311) (Figure 6) was also reported. It showedmoderate initial brain uptake but a fast brain clearance in biodistribution assay using wild-type mice(Table 3). It is quickly metabolized as was seen in NMRI mice and a rhesus monkey 30 min afterintravenous injection, where only 22% and 35% respectively of the recovered activity was the intactradioligand. However, all the detected radiometabolites were more polar than the tracer, and nonewas found in the brain even at 60 min after injection. Furthermore, no bone uptake was detected ina rhesus monkey during a 120 min scan, in the duration of a microPET scan, which also showed amoderate initial brain uptake (SUV of 1.9 at 1 min p.i.) with a rapid wash-out.
17

Molecules 2020, 25, 977
Ta
ble
3.
Bind
ing
affini
ties
and
Phar
mac
okin
etic
sof
feat
ured
tau
PET-
trac
ers.
Tra
cer
Lo
gP
Tau
affi
nit
y[n
M]
Sele
ctiv
ity,
tau/A
β
Ki,
Aβ
fib
rils
(nM
)B
rain
Up
tak
e[%
ID/g
]B
rain
Cle
ara
nce
[%ID/g
]
HIT
PA
D-P
HF
2m
inp
.i.
30
min
p.i
.
[18F]
GTP
1[1
93]
NA
NA
Kd
:10.
8N
AN
AN
AN
A[18
F]PM
-PBB
3(A
PN-1
607)
NA
NA
NA
NA
NA
NA
NA
(*9)
[202
]N
AN
AK
i:8.
8>
1136
1>
1000
0N
AN
A[18
F]M
K-6
240
[202
]3.
32N
AK
i:0.
36>
2777
71>
1000
0N
AN
A(*
12)[
202]
2.90
NA
Ki:
52.6
>19
0>
1000
0N
AN
A
[18F]
RO
-948
(RO
6958
948)
[53]
[199
]3.
22N
A44
%2
pIC
50:3
8.4
NA
pIC
50:<
64
5.7
510
.96
[18F]
PI-2
620
[53]
NA
NA
pIC
50:8
.57
NA
pIC
50:<
64
5.9
516
.66
[18F]
JNJ6
4349
311
(JN
J311
)[20
6]2.
2N
AK
i:8
8>
500
>43
989
IC50
:<5
91.
910
0.3
10
The
log
Pva
lues
are
the
part
itio
nco
effici
ent(
octa
nol/w
ater
)or
log
Dpa
rtit
ion
coeffi
cien
t(oc
tano
l/PB
S)re
port
edin
the
resp
ecti
vepu
blic
atio
ns.S
elec
tivi
tyta
uvs
Aβ
:1K
i(Aβ
)/K
i(ta
u).
2%
inhi
biti
onof
10nM
of[3 H
]T80
8on
fres
hfr
ozen
hum
anbr
ain
sect
ions
der
ived
from
AD
case
s.3
Self
-com
peti
tion
.4In
com
peti
tion
wit
h[3 H
]PiB
.5Pe
akup
take
(inj
ecte
dd
ose
per
gram
brai
n;ID/g
);6
ratio
ofpe
akup
take
divi
ded
bype
akat
30m
in.7
Inco
mpe
titio
nw
ith[18
F]R
O-9
48.8
[3 H]A
V68
0as
com
petit
or.9
[3 H]F
lorb
etap
iras
com
petit
or.10
Dat
aar
eex
pres
sed
asSU
Vm
ean.
NA
:dat
ano
tava
ilabl
e.*n
umbe
rsgi
ven
toth
etr
acer
sin
the
resp
ecti
vepu
blic
atio
ns.
18

Molecules 2020, 25, 977
Semi-quantitative autoradiography studies on post-mortem tissue sections of human AD brainsdisplayed highly displaceable binding to NFT-rich regions, but it showed no specific binding to humanPSP and CBD brain slices. Based on its in vitro and in vivo preclinical profiling, it was deemed apromising candidate for quantitative tau PET imaging in AD [206]. There is presently no in vivohuman data for the tracers of the JNJ series.
2.3. Selective PET-Tracers for the Imaging of α-syn
Most of the PET/SPECT tracers developed and approved so far for the differential differentialdiagnosis of PD have been geared towards the evaluation of the function of the dopaminergicsystem [207]. As was mentioned earlier, 50% of substantia nigra cells (stage III of the Braak staging)and a probable loss of a higher percentage of dopaminergic nerve endings in the putamen have to belost before the appearance of motor symptoms [71–73], in contrast, based on the findings of Braak etal., there is deposition of α-syn in LBs and LNs, which occurs sequentially and additively throughoutthe VI stages of disease progression [74], therefore the most accurate and earliest detection of premotorPD should be based on imaging α-syn instead of dopaminergic changes [208].
The development of α-syn PET tracers is still an unmet need and in its early stages.Regardless, efforts have been made in the past decades and are still being presently made to developtracers with a high affinity and selectivity for α-syn over Aβ and tau aggregates.
2.3.1. The Phenothiazine Derivatives
In 2011, to discover selective α-syn tracers Yu et al. synthesized a series of phenothiazinederivatives. Three of the tricyclic compounds (Figure 7) based on in vitro Th-T competition assay torecombinant α-syn fibrils were selected: [11C]SIL5, [125I]SIL23, and [18F]SIL26 based on the fact thatthey displayed an affinity (Ki) to the α-syn fibrils less than 60 nM [209] (Table 4).
In further tests, [125I]SIL23 with a ki of 57.9 nM [209] was able to bind to α-syn fibrils inpostmortem PD brain homogenates, which indicated that the tracer binding affinity in PD brainsamples is comparable to its affinity to recombinant α-syn fibrils. It also displayed 5-fold and 2-foldless affinity for Aβ1-42 and tau aggregates respectively in comparison to α-syn fibrils, however thisselectivity was insufficient for in vivo imaging. Moreover, a high nonspecific binding in white matterseems to limit autoradiography with the tracer initial experiments. Furthermore, its affinity for α-synfibrils Kd 148 nM, is also not optimal for the in vivo imaging of α-syn fibrils [210].
[11C]SIL5 and [18F]SIL26 with binding affinities (Ki) 1.8× and 1.2× more than that of[125I]SIL23 respectively, showed a low initial brain uptake in healthy Sprague-Dawley rats 5 min p.i.0.953%ID/g and 0.758%ID/g respectively, and slow washout with [18F]SIL26 performing poorer ofthe 2 tracers with not less than 50% of the initial brain concentration at 5 min remaining at 60 min.[11C]SIL5 still had at 60 min 16.57% of its initial brain uptake at 2 min, which suggested a slow washoutof the tracer or a lot of unspecific binding (Table 4).
In vivo microPET imaging in a healthy cynomolgus macaque confirmed that [11C]SIL5, witha faster washout kinetics of the two was able to penetrate the BBB into the brain, and also has ahomogeneous distribution and fast washout kinetics. The authors believe that both compounds requirefurther structural optimization in order to make them a more suitable α-syn tracer [211].
19

Molecules 2020, 25, 977
Figure 7. Structures of selective α-syn-PET tracers: [11C]SIL5, [125I]SIL23, [18F]SIL26, *6a, *14, *20,*46a, *11a, *11b, [125I]IDP-4, [18F]FS3-1 ([18F]DABTA-11). *numbers given to the tracers in theirrespective publications.
2.3.2. The Indolinone and Indolinonediene Derivatives
An SAR study by structural modifications of an indolinone derivative *6a [212] (Figure 7),by the introduction of different alkyl and arylalkyl groups substituted at the indolinone nitrogenled to the identification of an aza-analog-*14 (Figure 7), which was the most successful in this series(Table 3). With a binding affinity Ki 79 nM to recombinant α-syn fibrils less than that of the select3 phenothiazine tracers [209,213], with 1,4- and 11-fold selectivity over recombinant Aβ and tauaggregates. Another major limitation of the series was the presence of E/Z isomers, which re-equilibrateafter separation.
A homologation of the double bond in *6a by the addition of an additional double (to formdiene group) bond, in order to increase affinity to α-syn fibrils over the other aggregates gave aseries of compounds, which were a mixture of stereoisomers with either an E,E or Z,E configuration,which quickly re-equilibrated after chromatographic purification. *20 (Figure 7) was however selectedfrom the series based on its improved affinity (Ki) for recombinant α-syn fibrils 1.9×more than *14,but unfortunately affinity Ki 27.6 nM for Aβ increased as well, with 1.3-fold selectivity over tauaggregates (Table 4). However, its strong fluorescent attributes allowed for a performance of fluorescentmicroscopy studies of postmortem AD and PD brain samples. Results showed that it labels both LB
20

Molecules 2020, 25, 977
and Aβ plaques. Regardless, this showed that indolinonediene derivatives can label α-syn fibrilsin LBs.
Introduction of a para nitro group into the pendant benzene ring of the diene moiety made itpossible to isolate both the E,E and Z,E stereoisomers, and further explore their in vitro properties.The Z,E regioisomers were generally more active than the corresponding E,E configuration in terms ofhigher affinity for α-syn over Aβ and tau fibrils. The best in this series was [18F]46a with the highestaffinity (Ki) for α-syn fibrils 2 nM, 70-fold and 40-fold less affinity for Aβ and tau fibrils respectively(Table 4).
Unfortunately, due to its high lipophilicity log D 4.18, which prevented obtaining a reliable andreproducible results from binding assays to insoluble α-syn acquired from PD brain and the possiblereduction of the nitro group to an amino group in vivo makes it an unsuitable PET probe for imaging LBand LN in PD subjects. In spite of the shortcomings of the compound it showed interesting selectivityfor α-syn fibrils over Aβ and tau, and could serve as a good lead for further development of α-synfibril tracers [213].
2.3.3. Chalcone Derivatives and Structural Cogeners
Hsieh et al. went further to investigate a series of chalcone derivatives, whose enone moiety servesas an isosteric replacement of the diene group in the indolinonediene derivatives while precludingthe E,E and Z,E isomerization problem. The indole ring was further replaced with a benzothiazolering system, based on a previous SAR study, which revealed that an electron-deficient ring like theaza-indole system has a higher affinity for α-syn fibrils relative to the indole ring system and to preventthe Michael-acceptor properties associated with the chalcone system they replaced the enone moietywith an isoxazole and a pyrazole ring system. The results of a competition in vitro binding studieswith Th-T led to the identification of a compound *11a,b (37 a,b) (Figure 7), isoxazole derivatives witha modest affinity in comparison to [18F]46a (36) for α-syn at Ki 18.5 nM over Aβ and tau fibrils with5-fold and over 54-fold less affinity respectively (Table 4). Although the compounds described intheir report have modest affinity to serve as a PET radiotracer for in vivo imaging studies, they could,however could be used for further SAR studies [214].
Based on previous research, it was discovered that flavonoids could inhibit not only the formationof Aβ [215–217] but also of α-syn [218–220] aggregates, an indication that they could also bind withα-syn aggregates. With this in mind, Ono et al. developed some α-syn imaging tracers based onthe chalcone scaffold: they developed four prospective chalcone derivatives (IDP compounds) withvarying molecular lengths made possible by conjugated double bonds. A longer molecular length anda long conjugated π system were believed to lead to increased affinity of probes to Aβ [221], and tauaggregates as was seen in the PBB compounds [172,222].
All the IDP-compounds, unfortunately, displayed almost as much affinity for Aβ as they displayedfor α-syn (Table 4), with affinity for α-syn increasing proportionately to molecular length, with notreally much change in the selectivity to Aβ, which means that [125I]IDP-4 with a tetraene structurewas the best in this regard. It had a high binding affinity to α-syn Kd of 5.4 nM and 3-fold selectivityto recombinant Aβ fibrils, which nevertheless was not as high as [18F]46a, which the authors believecould be attributed to different binding assay conditions.
[125I]IDP-4 (Figure 7) in vivo biodistribution in normal mice performed poorer than the otherIDP-compounds, with a brain uptake of 0.45%ID/g at 2 min p.i. and a low brain clearance, 93.3% of theconcentration at 2 min still remaining at 60 min (Table 4). The suboptimal pharmacokinetics could bedue to the lipophilicity, high molecular weight and chemical structure of the tracer. In any case, thisproperty makes it an unlikely tracer for in vivo imaging of α-syn aggregates. Still, it could be a usefulprobe for in vitro screening of compounds for affinity to α-syn and Aβ fibrils in vitro [222].
21

Molecules 2020, 25, 977
Ta
ble
4.
Bind
ing
affini
ties
and
Phar
mac
okin
etic
sof
feat
ured
α-s
ynPE
T-tr
acer
s.
Tra
cer
Lo
gD
α-s
yn
Affi
nit
y[n
M]
Aβ
Fib
rils
Affi
nit
y[n
M]
Ta
uF
ibri
lsAffi
nit
y[n
M]
Bra
inU
pta
ke
[%ID/g
]B
rain
Cle
ara
nce
[%ID/g
]
Ki
Kd
Ki
Kd
Ki
Kd
5m
inp
.i.
60
min
p.i
.α
-sy
nF
ibri
lsH
um
an
PD
Ho
mo
ge
na
te
[11C
]SIL
5[2
09–2
11]
3.79
32.1
.66.
2.83
.1N
A11
0N
A13
6N
A0.
953
0.15
8[12
5 I]SI
L23
[209
,210
]5.
7257
.9N
A14
8N
A63
5N
A23
0N
AN
A[18
F]SI
L26
[209
–211
]4.
0249
.015
.5.
33.5
NA
103
NA
125
NA
0.75
80.
410
*14
[[21
3]4.
21
79.5
NA
NA
113.
3N
A85
3.5
NA
NA
NA
*20
[213
]3.
52
40.7
NA
NA
27.6
NA
53.7
NA
NA
NA
[18F]
46a
[213
]4.
182.
1N
A8.
914
2.4
NA
80.1
NA
NA
NA
*11a
,b[2
14]
3.54
318
.5N
AN
A91
.5N
A>
1000
NA
NA
NA
[125 I]
IDP-
4[2
22]
NA
NA
NA
5.4
NA
16.2
4N
AN
A0.
45(2
min
p.i.)
0.42
1,2
and
3C
alcu
late
dby
Che
mD
raw
Ult
ra13
.0an
dPr
ofes
sion
al15
.1re
spec
tive
ly.*
num
bers
give
nto
the
trac
ers
inth
eir
resp
ecti
vepu
blic
atio
ns.N
A:d
ata
nota
vaila
ble.
22

Molecules 2020, 25, 977
2.3.4. Diarybisthiazole Compounds
More recently, highly innovative small molecules utilized as diagnostic probes, based on4,4’-diaryl-2,2’-bithiazole, called DABTAs were developed by Yousefi et al. as sensitive, selectiveand specific tracers. According to pilot data these compounds suitable for the visualization andquantification of α-syn pathology by nuclear medicine imaging. With the help of these newlydeveloped ligands, the presence, distribution and progression pattern of α-syn can be investigatedin the living brain, reflecting the disease entity and stage. Preliminary results with the [18F]FS3-1([18F]DABTA-11) (Figure 7) in a rat model overexpressing human E46K mutated α-syn are promisingregarding sensitivity [223,224]. In addition, in vivo imaging of the progression and spreading ofα-synuclein pathology over time with the tracer greatly motivates the authors to develop tracers foraggregated α-syn in PD, DLB or MSA.
3. Conclusions
Several Aβ PET tracers have been developed and promoted discussion on their clinical values.Among these three tracers have been already approved by the FDA and EMA. Research on tau PETyielded several tau-tracers already entered into clinical investigations, however, still inherent arechallenges in selective tau imaging. The lack of any consented and approved tracer for aggregatedα-syn greatly motivated scientists in the field to develop tracer for aggregated α-syn in PD, DLB orMSA. Remarkable progress has been made so far in order to fulfill the unmet need for α-syn PET tracerswith suitable pharmacokinetics, binding affinity and selectivity. Lately, innovative small moleculeshave been identified with excellent binding affinity and selectivity for α-syn fibrils relative to Aβ andtau aggregates. Utilizing high-throughput binding assays, in-silico design in the conventional tracerdevelopment may accelerate the identification of new leads for a specific α-syn PET imaging.
Funding: The APC was funded by Technical University of Munich, University Library Open Access PublishingFund. BCU gratefully acknowledge the funding received towards his PhD from the German Academic ExchangeService (DAAD).
Conflicts of Interest: The authors declare no conflict of interest.
References
1. Alzheimer’s Disease International. The Global Impact of Dementia: An Analysis of Prevalence, Incidence, Cost andTrends; World Alzheimer Report 2015; Alzheimer’s Disease International: London, UK, 2015.
2. Alzheimer’s Disease International. World Alzheimer Report 2018—The State of the Art of Dementia Research:New Frontiers; Alzheimer’s Disease International: London, UK, 2018.
3. World Health Organisation-Alzheimer’s Disease International. Dementia: A Public Health Priority;WHO: Geneva, Switzerland, 2012.
4. Trevisan, K.; Cristina-Pereira, R.; Silva-Amaral, D.; Aversi-Ferreira, T.A. Theories of Aging and the Prevalenceof Alzheimer’s Disease. Biomed. Res. Int. 2019, 1–9. [CrossRef]
5. Xie, A.; Gao, J.; Xu, L.; Meng, D. Shared mechanisms of neurodegeneration in Alzheimer’s disease andParkinson’s disease. Biomed. Res. Int. 2014, 2014, 648740. [CrossRef]
6. Murphy, M.P.; LeVine, H. Alzheimer’s disease and the amyloid-beta peptide. J. Alzheimers Dis. 2010, 19,311–323. [CrossRef]
7. Alzheimer’s Association 2018 Alzheimer’s disease facts and figures. Alzheimer’s Dement. 2018, 14, 367–429.[CrossRef]
8. Zhang, Y.; Thompson, R.; Zhang, H.; Xu, H. APP processing in Alzheimer’s disease. Mol. Brain 2011, 4, 3.[CrossRef] [PubMed]
9. Gu, L.; Guo, Z. Alzheimer’s Aβ42 and Aβ40 peptides form interlaced amyloid fibrils. J. Neurochem. 2013,126, 305–311. [CrossRef] [PubMed]
10. Kayed, R.; Lasagna-Reeves, C.A. Molecular mechanisms of amyloid oligomers toxicity. J. Alzheimers Dis.2013, 33 (Suppl. 1), S67–78. [CrossRef]
23

Molecules 2020, 25, 977
11. Trojanowski, J.Q.; Clark, C.M.; Schmidt, M.L.; Arnold, S.E.; Lee, V.M. Strategies for Improving the PostmortemNeuropathological Diagnosis of Alzheimer’s Disease. Neurobiol. Aging 1997, 18, S75–S79. [CrossRef]
12. Dubois, B.; Hampel, H.; Feldman, H.H.; Scheltens, P.; Aisen, P.; Andrieu, S.; Bakardjian, H.; Benali, H.;Bertram, L.; Blennow, K.; et al. Preclinical Alzheimer’s disease: Definition, natural history, and diagnosticcriteria. Alzheimers Dement. 2016, 12, 292–323. [CrossRef]
13. Delacourte, A. Les diagnostics de la maladie d’Alzheimer. Ann. Biol. Clin. (Paris) 1998, 56, 133–142.14. Takizawa, C.; Thompson, P.L.; van Walsem, A.; Faure, C.; Maier, W.C. Epidemiological and economic burden
of Alzheimer’s disease: A systematic literature review of data across Europe and the United States ofAmerica. J. Alzheimers Dis. 2015, 43, 1271–1284. [CrossRef] [PubMed]
15. Johnson, K.A.; Fox, N.C.; Sperling, R.A.; Klunk, W.E. Brain imaging in Alzheimer disease. Cold Spring Harb.Perspect. Med. 2012, 2, a006213. [CrossRef] [PubMed]
16. Budson, A.E.; Solomon, P.R. New criteria for Alzheimer disease and mild cognitive impairment: implicationsfor the practicing clinician. Neurologist 2012, 18, 356–363. [CrossRef] [PubMed]
17. Jack, C.R.; Bennett, D.A.; Blennow, K.; Carrillo, M.C.; Dunn, B.; Haeberlein, S.B.; Holtzman, D.M.; Jagust, W.;Jessen, F.; Karlawish, J.; et al. NIA-AA Research Framework: Toward a biological definition of Alzheimer’sdisease. Alzheimers Dement. 2018, 14, 535–562. [CrossRef] [PubMed]
18. Bekris, L.M.; Yu, C.-E.; Bird, T.D.; Tsuang, D.W. Genetics of Alzheimer disease. J. Geriatr. Psychiatry Neurol.2010, 23, 213–227. [CrossRef] [PubMed]
19. Freudenberg-Hua, Y.; Li, W.; Davies, P. The Role of Genetics in Advancing Precision Medicine for Alzheimer’sDisease-A Narrative Review. Front. Med. (Lausanne) 2018, 5, 108. [CrossRef]
20. Williamson, J.; Goldman, J.; Marder, K.S. Genetic aspects of Alzheimer disease. Neurologist 2009, 15, 80–86.[CrossRef]
21. Isaac, M.; Vamvakas, S.; Abadie, E.; Jonsson, B.; Gispen, C.; Pani, L. Qualification opinion of novelmethodologies in the predementia stage of Alzheimer’s disease: Cerebro-spinal-fluid related biomarkers fordrugs affecting amyloid burden—Regulatory considerations by European Medicines Agency focusing inimproving benefit/risk in regulatory trials. Eur. Neuropsychopharmacol. 2011, 21, 781–788. [CrossRef]
22. Blennow, K.; Hampel, H.; Zetterberg, H. Biomarkers in amyloid-β immunotherapy trials in Alzheimer’sdisease. Neuropsychopharmacology 2014, 39, 189–201. [CrossRef]
23. Palmqvist, S.; Zetterberg, H.; Mattsson, N.; Johansson, P.; Minthon, L.; Blennow, K.; Olsson, M.; Hansson, O.Detailed comparison of amyloid PET and CSF biomarkers for identifying early Alzheimer disease. Neurology2015, 85, 1240–1249. [CrossRef]
24. Hampel, H.; Bürger, K.; Teipel, S.J.; Bokde, A.L.W.; Zetterberg, H.; Blennow, K. Core candidate neurochemicaland imaging biomarkers of Alzheimer’s disease. Alzheimers Dement. 2008, 4, 38–48. [CrossRef] [PubMed]
25. Zetterberg, H.; Tullhög, K.; Hansson, O.; Minthon, L.; Londos, E.; Blennow, K. Low incidence of post-lumbarpuncture headache in 1,089 consecutive memory clinic patients. Eur. Neurol. 2010, 63, 326–330. [CrossRef][PubMed]
26. Reiman, E.M.; Jagust, W.J. Brain imaging in the study of Alzheimer’s disease. Neuroimage 2012, 61, 505–516.[CrossRef] [PubMed]
27. Fawaz, M.V.; Brooks, A.F.; Rodnick, M.E.; Carpenter, G.M.; Shao, X.; Desmond, T.J.; Sherman, P.; Quesada, C.A.;Hockley, B.G.; Kilbourn, M.R.; et al. High Affinity Radiopharmaceuticals Based Upon Lansoprazole forPET Imaging of Aggregated Tau in Alzheimer’s Disease and Progressive Supranuclear Palsy: Synthesis,Preclinical Evaluation, and Lead Selection. ACS Chem. Neurosci. 2014, 5, 718–730. [CrossRef]
28. DeKosky, S.T.; Marek, K. Looking backward to move forward: early detection of neurodegenerative disorders.Science 2003, 302, 830–834. [CrossRef]
29. Bailey, D.L.; Maisey, M.N.; Townsend, D.W.; Valk, P.E. Positron Emission Tomography. Basic Sciences;Springer-Verlag London Limited: London, UK, 2005; ISBN 9781852337988.
30. van der Born, D.; Pees, A.; Poot, A.J.; Orru, R.V.A.; Windhorst, A.D.; Vugts, D.J. Fluorine-18 labelled buildingblocks for PET tracer synthesis. Chem. Soc. Rev. 2017, 46, 4709–4773. [CrossRef]
31. Filippi, L.; Chiaravalloti, A.; Bagni, O.; Schillaci, O. 18F-labeled radiopharmaceuticals for the molecularneuroimaging of amyloid plaques in Alzheimer’s disease. Am. J. Nucl. Med. Mol. Imaging 2018, 8, 268–281.
32. Mathis, C.A.; Wang, Y.; Klunk, W.E. Imaging beta-amyloid plaques and neurofibrillary tangles in the aginghuman brain. Curr. Pharm. Des. 2004, 10, 1469–1492. [CrossRef]
24

Molecules 2020, 25, 977
33. Klunk, W.E.; Engler, H.; Nordberg, A.; Wang, Y.; Blomqvist, G.; Holt, D.P.; Bergström, M.; Savitcheva, I.;Huang, G.-f.; Estrada, S.; et al. Imaging brain amyloid in Alzheimer’s disease with Pittsburgh Compound-B.Ann. Neurol. 2004, 55, 306–319. [CrossRef]
34. Jacobson, O.; Kiesewetter, D.O.; Chen, X. Fluorine-18 radiochemistry, labeling strategies and synthetic routes.Bioconjug. Chem. 2015, 26, 1–18. [CrossRef]
35. Ariza, M.; Kolb, H.C.; Moechars, D.; Rombouts, F.; Andrés, J.I. Tau Positron Emission Tomography (PET)Imaging: Past, Present, and Future. J. Med. Chem. 2015, 58, 4365–4382. [CrossRef] [PubMed]
36. Barthel, H.; Sabri, O. Florbetaben to trace amyloid-β in the Alzheimer brain by means of PET. J. Alzheimers Dis.2011, 26 (Suppl. 3), 117–121. [CrossRef]
37. Johnson, K.A.; Sperling, R.A.; Gidicsin, C.M.; Carmasin, J.S.; Maye, J.E.; Coleman, R.E.; Reiman, E.M.;Sabbagh, M.N.; Sadowsky, C.H.; Fleisher, A.S.; et al. Florbetapir (F18-AV-45) PET to assess amyloid burdenin Alzheimer’s disease dementia, mild cognitive impairment, and normal aging. Alzheimers Dement. 2013, 9,S72–S83. [CrossRef] [PubMed]
38. Hatashita, S.; Yamasaki, H.; Suzuki, Y.; Tanaka, K.; Wakebe, D.; Hayakawa, H. 18FFlutemetamol amyloid-betaPET imaging compared with 11CPIB across the spectrum of Alzheimer’s disease. Eur. J. Nucl. Med.Mol. Imaging 2014, 41, 290–300. [CrossRef] [PubMed]
39. Arriagada, P.V.; Growdon, J.H.; Hedley-Whyte, E.T.; Hyman, B.T. Neurofibrillary tangles but not senileplaques parallel duration and severity of Alzheimer’s disease. Neurology 1992, 42, 631–639. [CrossRef][PubMed]
40. Maccioni, R.B.; Farías, G.; Morales, I.; Navarrete, L. The revitalized tau hypothesis on Alzheimer’s disease.Arch. Med. Res. 2010, 41, 226–231. [CrossRef]
41. Jack, C.R.; Knopman, D.S.; Jagust, W.J.; Petersen, R.C.; Weiner, M.W.; Aisen, P.S.; Shaw, L.M.; Vemuri, P.;Wiste, H.J.; Weigand, S.D.; et al. Tracking pathophysiological processes in Alzheimer’s disease: An updatedhypothetical model of dynamic biomarkers. Lancet Neurol. 2013, 12, 207–216. [CrossRef]
42. Villemagne, V.L.; Furumoto, S.; Fodero-Tavoletti, M.; Harada, R.; Mulligan, R.S.; Kudo, Y.; Masters, C.L.;Yanai, K.; Rowe, C.C.; Okamura, N. The challenges of tau imaging. Future Neurol. 2012, 7, 409–421. [CrossRef]
43. Ke, Y.D.; Suchowerska, A.K.; van der Hoven, J.; de Silva, D.M.; Wu, C.W.; van Eersel, J.; Ittner, A.; Ittner, L.M.Lessons from tau-deficient mice. Int. J. Alzheimers Dis. 2012, 2012, 873270. [CrossRef]
44. Ludolph, A.C.; Kassubek, J.; Landwehrmeyer, B.G.; Mandelkow, E.; Mandelkow, E.-M.; Burn, D.J.;Caparros-Lefebvre, D.; Frey, K.A.; de Yebenes, J.G.; Gasser, T.; et al. Tauopathies with parkinsonism:clinical spectrum, neuropathologic basis, biological markers, and treatment options. Eur. J. Neurol. 2009, 16,297–309. [CrossRef]
45. Medeiros, R.; Baglietto-Vargas, D.; LaFerla, F.M. The role of tau in Alzheimer’s disease and related disorders.CNS Neurosci. Ther. 2011, 17, 514–524. [CrossRef] [PubMed]
46. Winners. Available online: https://www.eanm.org/congresses-events/awards-grants/winners/ (accessed on22 December 2019).
47. Vanhaute, H.; Ceccarini, J.; Michiels, L.; Koole, M.; Emsell, L.; Lemmens, R.; Vandenbulcke, M.; vanLaere, K. PET-MR Imaging of Tau and Synaptic Density in Prodromal Alzheimer’s Disease; Alzheimer’s DiseaseInternational: London, UK, 2019.
48. U.S. Food and Drug Administration. Available online: https://www.fda.gov/ (accessed on 20 November 2019).49. Sperling, R.A.; Aisen, P.S.; Beckett, L.A.; Bennett, D.A.; Craft, S.; Fagan, A.M.; Iwatsubo, T.; Jack, C.R.; Kaye, J.;
Montine, T.J.; et al. Toward defining the preclinical stages of Alzheimer’s disease: recommendations from theNational Institute on Aging-Alzheimer’s Association workgroups on diagnostic guidelines for Alzheimer’sdisease. Alzheimers Dement. 2011, 7, 280–292. [CrossRef] [PubMed]
50. Villemagne, V.L.; Okamura, N. In vivo tau imaging: obstacles and progress. Alzheimers Dement. 2014, 10,S254–S264. [CrossRef] [PubMed]
51. Okamura, N.; Harada, R.; Ishiki, A.; Kikuchi, A.; Nakamura, T.; Kudo, Y. The development and validationof tau PET tracers: current status and future directions. Clin. Transl. Imaging 2018, 6, 305–316. [CrossRef][PubMed]
52. Aguero, C.; Dhaynaut, M.; Normandin, M.D.; Amaral, A.C.; Guehl, N.J.; Neelamegam, R.; Marquie, M.;Johnson, K.A.; El Fakhri, G.; Frosch, M.P.; et al. Autoradiography validation of novel tau PET tracerF-18-MK-6240 on human postmortem brain tissue. Acta Neuropathol. Commun. 2019, 7, 37. [CrossRef][PubMed]
25

Molecules 2020, 25, 977
53. Kroth, H.; Oden, F.; Molette, J.; Schieferstein, H.; Capotosti, F.; Mueller, A.; Berndt, M.; Schmitt-Willich, H.;Darmency, V.; Gabellieri, E.; et al. Discovery and preclinical characterization of 18FPI-2620, a next-generationtau PET tracer for the assessment of tau pathology in Alzheimer’s disease and other tauopathies. Eur. J.Nucl. Med. Mol. Imaging 2019, 46, 2178–2189. [CrossRef] [PubMed]
54. Spillantini, M.G.; Goedert, M. The alpha-synucleinopathies: Parkinson’s disease, dementia with Lewy bodies,and multiple system atrophy. Ann. N. Y. Acad. Sci. 2000, 920, 16–27. [CrossRef]
55. Wakabayashi, K.; Yoshimoto, M.; Tsuji, S.; Takahashi, H. α-Synuclein immunoreactivity in glial cytoplasmicinclusions in multiple system atrophy. Neuroscience Letters 1998, 249, 180–182. [CrossRef]
56. Tu, P.H.; Galvin, J.E.; Baba, M.; Giasson, B.; Tomita, T.; Leight, S.; Nakajo, S.; Iwatsubo, T.; Trojanowski, J.Q.;Lee, V.M. Glial cytoplasmic inclusions in white matter oligodendrocytes of multiple system atrophy brainscontain insoluble alpha-synuclein. Ann. Neurol. 1998, 44, 415–422. [CrossRef]
57. Burré, J.; Sharma, M.; Tsetsenis, T.; Buchman, V.; Etherton, M.R.; Südhof, T.C. Alpha-synuclein promotesSNARE-complex assembly in vivo and in vitro. Science 2010, 329, 1663–1667. [CrossRef]
58. Vilar, M.; Chou, H.-T.; Lührs, T.; Maji, S.K.; Riek-Loher, D.; Verel, R.; Manning, G.; Stahlberg, H.; Riek, R.The fold of alpha-synuclein fibrils. Proc. Natl. Acad. Sci. USA 2008, 105, 8637–8642. [CrossRef] [PubMed]
59. Spillantini, M.G.; Crowther, R.A.; Jakes, R.; Hasegawa, M.; Goedert, M. alpha-Synuclein in filamentousinclusions of Lewy bodies from Parkinson’s disease and dementia with lewy bodies. Proc. Natl. Acad.Sci. USA 1998, 95, 6469–6473. [CrossRef] [PubMed]
60. Uéda, K.; Fukushima, H.; Masliah, E.; Xia, Y.; Iwai, A.; Yoshimoto, M.; Otero, D.A.; Kondo, J.; Ihara, Y.;Saitoh, T. Molecular cloning of cDNA encoding an unrecognized component of amyloid in Alzheimer disease.Proc. Natl. Acad. Sci. USA 1993, 90, 11282–11286. [CrossRef] [PubMed]
61. Clayton, D.F.; George, J.M. Synucleins in synaptic plasticity and neurodegenerative disorders. J. Neurosci. Res.1999, 58, 120–129. [CrossRef]
62. Polymeropoulos, M.H.; Lavedan, C.; Leroy, E.; Ide, S.E.; Dehejia, A.; Dutra, A.; Pike, B.; Root, H.; Rubenstein, J.;Boyer, R.; et al. Mutation in the alpha-synuclein gene identified in families with Parkinson’s disease. Science1997, 276, 2045–2047. [CrossRef] [PubMed]
63. Chartier-Harlin, M.-C.; Kachergus, J.; Roumier, C.; Mouroux, V.; Douay, X.; Lincoln, S.; Levecque, C.;Larvor, L.; Andrieux, J.; Hulihan, M.; et al. α-synuclein locus duplication as a cause of familial Parkinson’sdisease. Lancet 2004, 364, 1167–1169. [CrossRef]
64. Singleton, A.B.; Farrer, M.; Johnson, J.; Singleton, A.; Hague, S.; Kachergus, J.; Hulihan, M.; Peuralinna, T.;Dutra, A.; Nussbaum, R.; et al. alpha-Synuclein locus triplication causes Parkinson’s disease. Science 2003,302, 841. [CrossRef]
65. Ibáñez, P.; Bonnet, A.-M.; Débarges, B.; Lohmann, E.; Tison, F.; Agid, Y.; Dürr, A.; Brice, A.; Pollak, P.Causal relation between α-synuclein locus duplication as a cause of familial Parkinson’s disease. Lancet 2004,364, 1169–1171. [CrossRef]
66. Billingsley, K.J.; Bandres-Ciga, S.; Saez-Atienzar, S.; Singleton, A.B. Genetic risk factors in Parkinson’s disease.Cell Tissue Res. 2018, 373, 9–20. [CrossRef]
67. Chang, D.; Nalls, M.A.; Hallgrímsdóttir, I.B.; Hunkapiller, J.; van der Brug, M.; Cai, F.; Kerchner, G.A.;Ayalon, G.; Bingol, B.; Sheng, M.; et al. A meta-analysis of genome-wide association studies identifies 17 newParkinson’s disease risk loci. Nat. Genet. 2017, 49, 1511–1516. [CrossRef]
68. Nalls, M.; Blauwendraat, C.; Vallerga, C.L.; Heilbron, K.; Bandres-Ciga, S.; Chang, D.; Tan, M.; Kia, D.A.;Noyce, A.J.; Xue, A.; et al. Parkinson’s disease genetics: Novel risk loci, genomic context, causal insights andheritable risk. BiorRxiv 2018. [CrossRef]
69. Vernon, A.C.; Ballard, C.; Modo, M. Neuroimaging for Lewy body disease: is the in vivo molecular imagingof α-synuclein neuropathology required and feasible? Brain Res. Rev. 2010, 65, 28–55. [CrossRef] [PubMed]
70. Hawkes, C.H. The prodromal phase of sporadic Parkinson’s disease: does it exist and if so how long is it?Mov. Disord. 2008, 23, 1799–1807. [CrossRef] [PubMed]
71. Ross, G.W.; Petrovitch, H.; Abbott, R.D.; Nelson, J.; Markesbery, W.; Davis, D.; Hardman, J.; Launer, L.;Masaki, K.; Tanner, C.M.; et al. Parkinsonian signs and substantia nigra neuron density in decendents elderswithout PD. Ann. Neurol. 2004, 56, 532–539. [CrossRef] [PubMed]
72. Fearnley, J.M.; Lees, A.J. Ageing and Parkinson’s disease: substantia nigra regional selectivity. Brain 1991,114, 2283–2301. [CrossRef] [PubMed]
26

Molecules 2020, 25, 977
73. Riederer, P.; Wuketich, S. Time course of nigrostriatal degeneration in parkinson’s disease. A detailedstudy of influential factors in human brain amine analysis. J. Neural Transm. 1976, 38, 277–301. [CrossRef][PubMed]
74. Braak, H.; Tredici, K.D.; Rüb, U.; de Vos, R.A.I.; Jansen Steur, E.N.H.; Braak, E. Staging of brain pathologyrelated to sporadic Parkinson’s disease. Neurobiol. Aging 2003, 24, 197–211. [CrossRef]
75. Stefanis, L. α-Synuclein in Parkinson’s disease. Cold Spring Harb. Perspect. Med. 2012, 2, a009399. [CrossRef]76. Deramecourt, V.; Bombois, S.; Maurage, C.-A.; Ghestem, A.; Drobecq, H.; Vanmechelen, E.; Lebert, F.;
Pasquier, F.; Delacourte, A. Biochemical staging of synucleinopathy and amyloid deposition in dementiawith Lewy bodies. J. Neuropathol. Exp. Neurol. 2006, 65, 278–288. [CrossRef]
77. Shah, M.; Seibyl, J.; Cartier, A.; Bhatt, R.; Catafau, A.M. Molecular imaging insights into neurodegeneration:focus on α-synuclein radiotracers. J. Nucl. Med. 2014, 55, 1397–1400. [CrossRef]
78. Barrett, P.J.; Timothy Greenamyre, J. Post-translational modification of α-synuclein in Parkinson’s disease.Brain Res. 2015, 1628, 247–253. [CrossRef] [PubMed]
79. Irwin, D.J.; Lee, V.M.-Y.; Trojanowski, J.Q. Parkinson’s disease dementia: convergence of α-synuclein, tau andamyloid-β pathologies. Nat. Rev. Neurosci. 2013, 14, 626–636. [CrossRef] [PubMed]
80. Kotzbauer, P.T.; Cairns, N.J.; Campbell, M.C.; Willis, A.W.; Racette, B.A.; Tabbal, S.D.; Perlmutter, J.S.Pathologic accumulation of α-synuclein and Aβ in Parkinson disease patients with dementia. Arch. Neurol.2012, 69, 1326–1331. [CrossRef] [PubMed]
81. Mathis, C.A.; Lopresti, B.J.; Ikonomovic, M.D.; Klunk, W.E. Small-molecule PET Tracers for ImagingProteinopathies. Semin. Nucl. Med. 2017, 47, 553–575. [CrossRef]
82. Kotzbauer, P.T.; Tu, Z.; Mach, R.H. Current status of the development of PET radiotracers for imaging alphasynuclein aggregates in Lewy bodies and Lewy neurites. Clin. Transl. Imaging 2017, 5, 3–14. [CrossRef]
83. Pike, V.W. Considerations in the Development of Reversibly Binding PET Radioligands for Brain Imaging.Curr. Med. Chem. 2016, 23, 1818–1869. [CrossRef]
84. Laruelle, M.; Slifstein, M.; Huang, Y. Relationships between radiotracer properties and image quality inmolecular imaging of the brain with positron emission tomography. Mol. Imaging Biol. 2003, 5, 363–375.[CrossRef]
85. Zhang, L.; Villalobos, A. Strategies to facilitate the discovery of novel CNS PET ligands.EJNMMI Radiopharm. Chem. 2017, 1, 13. [CrossRef]
86. van de Bittner, G.C.; Ricq, E.L.; Hooker, J.M. A philosophy for CNS radiotracer design. Acc. Chem. Res. 2014,47, 3127–3134. [CrossRef]
87. Elghetany, M.T.; Saleem, A. Methods for staining amyloid in tissues: A review. Stain Technol. 1988, 63,201–212. [CrossRef]
88. Vassar, P.S.; Culling, C.F. Fluorescent stains, with special reference to amyloid and connective tissues.Arch. Pathol. 1959, 68, 487–498. [PubMed]
89. Watanabe, H.; Ono, M.; Ariyoshi, T.; Katayanagi, R.; Saji, H. Novel Benzothiazole Derivatives as FluorescentProbes for Detection of β-Amyloid and α-Synuclein Aggregates. ACS Chem. Neurosci. 2017, 8, 1656–1662.[CrossRef] [PubMed]
90. Zeng, F.; Goodman, M.M. Fluorine-18 radiolabeled heterocycles as PET tracers for imaging β-amyloidplaques in Alzheimer’s disease. Curr. Top. Med. Chem. 2013, 13, 909–919. [CrossRef] [PubMed]
91. Mathis, C.A.; Mason, N.S.; Lopresti, B.J.; Klunk, W.E. Development of positron emission tomographyβ-amyloid plaque imaging agents. Semin. Nucl. Med. 2012, 42, 423–432. [CrossRef]
92. Klunk, W.E.; Wang, Y.; Huang, G.f.; Debnath, M.L.; Holt, D.P.; Mathis, C.A. Uncharged thioflavin-T derivativesbind to amyloid-beta protein with high affinity and readily enter the brain. Life Sciences 2001, 69, 1471–1484.[CrossRef]
93. Klunk, W.E.; Wang, Y.; Huang, G.-f.; Debnath, M.L.; Holt, D.P.; Shao, L.; Hamilton, R.L.; Ikonomovic, M.D.;DeKosky, S.T.; Mathis, C.A. The Binding of 2-(4′-Methylaminophenyl)Benzothiazole to Postmortem BrainHomogenates Is Dominated by the Amyloid Component. J. Neurosci. 2003, 23, 2086–2092. [CrossRef]
94. Mathis, C.A.; Wang, Y.; Holt, D.P.; Huang, G.F.; Debnath, M.L.; Klunk, W.E. Synthesis and evaluation of11C-labeled 6-substituted 2-arylbenzothiazoles as amyloid imaging agents. J. Med. Chem. 2003, 46, 2740–2754.[CrossRef]
27

Molecules 2020, 25, 977
95. Price, J.C.; Klunk, W.E.; Lopresti, B.J.; Lu, X.; Hoge, J.A.; Ziolko, S.K.; Holt, D.P.; Meltzer, C.C.; DeKosky, S.T.;Mathis, C.A. Kinetic modeling of amyloid binding in humans using PET imaging and Pittsburgh Compound-B.J. Cereb. Blood Flow Metab. 2005, 25, 1528–1547. [CrossRef]
96. Mathis, C.A.; Bacskai, B.J.; Kajdasz, S.T.; McLellan, M.E.; Frosch, M.P.; Hyman, B.T.; Holt, D.P.; Wang, Y.;Huang, G.-f.; Debnath, M.L.; et al. A lipophilic thioflavin-T derivative for positron emission tomography(PET) imaging of amyloid in brain. Bioorganic & Medicinal Chemistry Letters 2002, 12, 295–298. [CrossRef]
97. Klunk, W.E.; Mathis, C.A. Whatever happened to Pittsburgh Compound-A? Alzheimer Dis. Assoc. Disord.2008, 22, 198–203. [CrossRef]
98. Mintun, M.A.; Larossa, G.N.; Sheline, Y.I.; Dence, C.S.; Lee, S.Y.; Mach, R.H.; Klunk, W.E.; Mathis, C.A.;DeKosky, S.T.; Morris, J.C. 11CPIB in a nondemented population: potential antecedent marker of Alzheimerdisease. Neurology 2006, 67, 446–452. [CrossRef] [PubMed]
99. Ikonomovic, M.D.; Klunk, W.E.; Abrahamson, E.E.; Mathis, C.A.; Price, J.C.; Tsopelas, N.D.; Lopresti, B.J.;Ziolko, S.; Bi, W.; Paljug, W.R.; et al. Post-mortem correlates of in vivo PiB-PET amyloid imaging in a typicalcase of Alzheimer’s disease. Brain 2008, 131, 1630–1645. [CrossRef] [PubMed]
100. Chitneni, S.K.; Serdons, K.; Evens, N.; Fonge, H.; Celen, S.; Deroose, C.M.; Debyser, Z.; Mortelmans, L.;Verbruggen, A.M.; Bormans, G.M. Efficient purification and metabolite analysis of radiotracers usinghigh-performance liquid chromatography and on-line solid-phase extraction. J. Chromatogr. A 2008, 1189,323–331. [CrossRef] [PubMed]
101. Serdons, K.; Terwinghe, C.; Vermaelen, P.; van Laere, K.; Kung, H.; Mortelmans, L.; Bormans, G.;Verbruggen, A. Synthesis and evaluation of 18F-labeled 2-phenylbenzothiazoles as positron emissiontomography imaging agents for amyloid plaques in Alzheimer’s disease. J. Med. Chem. 2009, 52, 1428–1437.[CrossRef] [PubMed]
102. Mathis, C.A.; Holt, D.; Wang, Y.; Huang, G.-f.; Debnath, M.; Shao, L.; Klunk, W.E. P2-178 Species-dependentformation and identification of the brain metabolites of the amyloid imaging agent [11C]PIB. Neurobiol. Aging2004, 25, S277–S278. [CrossRef]
103. Juréus, A.; Swahn, B.-M.; Sandell, J.; Jeppsson, F.; Johnson, A.E.; Johnström, P.; Neelissen, J.A.M.;Sunnemark, D.; Farde, L.; Svensson, S.P.S. Characterization of AZD4694, a novel fluorinated Abeta plaqueneuroimaging PET radioligand. J. Neurochem. 2010, 114, 784–794. [CrossRef]
104. Mason, N.S.; Mathis, C.A.; Klunk, W.E. Positron emission tomography radioligands for in vivo imaging ofAβ plaques. J. Labelled Comp. Radiopharm. 2013, 56, 89–95. [CrossRef]
105. Snellman, A.; Rokka, J.; Lopez-Picon, F.R.; Eskola, O.; Wilson, I.; Farrar, G.; Scheinin, M.; Solin, O.; Rinne, J.O.;Haaparanta-Solin, M. Pharmacokinetics of 18Fflutemetamol in wild-type rodents and its binding to betaamyloid deposits in a mouse model of Alzheimer’s disease. Eur. J. Nucl. Med. Mol. Imaging 2012, 39,1784–1795. [CrossRef]
106. Rabinovici, G.D. The translational journey of brain β-amyloid imaging: from positron emission tomographyto autopsy to clinic. JAMA Neurol. 2015, 72, 265–266. [CrossRef]
107. Curtis, C.; Gamez, J.E.; Singh, U.; Sadowsky, C.H.; Villena, T.; Sabbagh, M.N.; Beach, T.G.; Duara, R.;Fleisher, A.S.; Frey, K.A.; et al. Phase 3 trial of flutemetamol labeled with radioactive fluorine 18 imaging andneuritic plaque density. JAMA Neurol. 2015, 72, 287–294. [CrossRef]
108. GE Healthcare. Gehealthcare Vizamyl Prescribing Information. Available online: http://www3.gehealthcare.com/~{}/media/documents/us-global/products/nuclear-imaging-agents_non-gatekeeper/clinical%20product%20info/vizamyl/gehealthcare-vizamyl-prescribing-information.pdf(accessed on 15 September 2016).
109. Kung, M.-P.; Hou, C.; Zhuang, Z.-P.; Skovronsky, D.; Kung, H.F. Binding of two potential imaging agentstargeting amyloid plaques in postmortem brain tissues of patients with Alzheimer’s disease. Brain Res. 2004,1025, 98–105. [CrossRef] [PubMed]
110. Ono, M.; Wilson, A.; Nobrega, J.; Westaway, D.; Verhoeff, P.; Zhuang, Z.-P.; Kung, M.-P.; Kung, H.F.11C-labeled stilbene derivatives as Aβ-aggregate-specific PET imaging agents for Alzheimer’s disease.Nucl. Med. Biol. 2003, 30, 565–571. [CrossRef]
111. Verhoeff, N.P.L.G.; Wilson, A.A.; Takeshita, S.; Trop, L.; Hussey, D.; Singh, K.; Kung, H.F.; Kung, M.-P.;Houle, S. In-vivo imaging of Alzheimer disease beta-amyloid with 11CSB-13 PET. Am. J. Geriatr. Psychiatry2004, 12, 584–595. [CrossRef] [PubMed]
28

Molecules 2020, 25, 977
112. Zhang, W.; Oya, S.; Kung, M.-P.; Hou, C.; Maier, D.L.; Kung, H.F. F-18 stilbenes as PET imaging agents fordetecting beta-amyloid plaques in the brain. J. Med. Chem. 2005, 48, 5980–5988. [CrossRef]
113. Stephenson, K.A.; Chandra, R.; Zhuang, Z.-P.; Hou, C.; Oya, S.; Kung, M.-P.; Kung, H.F. Fluoro-pegylated(FPEG) imaging agents targeting Abeta aggregates. Bioconjug. Chem. 2007, 18, 238–246. [CrossRef]
114. Zhang, W.; Oya, S.; Kung, M.-P.; Hou, C.; Maier, D.L.; Kung, H.F. F-18 Polyethyleneglycol stilbenes as PETimaging agents targeting Abeta aggregates in the brain. Nucl. Med. Biol. 2005, 32, 799–809. [CrossRef]
115. Kung, H.F.; Choi, S.R.; Qu, W.; Zhang, W.; Skovronsky, D. 18F stilbenes and styrylpyridines for PET imagingof A beta plaques in Alzheimer’s disease: A miniperspective. J. Med. Chem. 2010, 53, 933–941. [CrossRef]
116. Rowe, C.C.; Ackerman, U.; Browne, W.; Mulligan, R.; Pike, K.L.; O’Keefe, G.; Tochon-Danguy, H.; Chan, G.;Berlangieri, S.U.; Jones, G.; et al. Imaging of amyloid β in Alzheimer’s disease with 18F-BAY94-9172, a novelPET tracer: proof of mechanism. Lancet Neurol. 2008, 7, 129–135. [CrossRef]
117. Frequently Asked Questions about Beta-Amyloid Imaging. Available online: https://www.accessdata.fda.gov/drugsatfda_docs/label/2014/204677s000lbl.pdf (accessed on 20 February 2020).
118. Zhang, W.; Kung, M.-P.; Oya, S.; Hou, C.; Kung, H.F. 18F-labeled styrylpyridines as PET agents for amyloidplaque imaging. Nucl. Med. Biol. 2007, 34, 89–97. [CrossRef]
119. Choi, S.R.; Golding, G.; Zhuang, Z.; Zhang, W.; Lim, N.; Hefti, F.; Benedum, T.E.; Kilbourn, M.R.;Skovronsky, D.; Kung, H.F. Preclinical properties of 18F-AV-45: A PET agent for Abeta plaques in the brain.J. Nucl. Med. 2009, 50, 1887–1894. [CrossRef]
120. Wong, D.F.; Rosenberg, P.B.; Zhou, Y.; Kumar, A.; Raymont, V.; Ravert, H.T.; Dannals, R.F.; Nandi, A.;Brasic, J.R.; Ye, W.; et al. In vivo imaging of amyloid deposition in Alzheimer disease using the radioligand18F-AV-45 (florbetapir corrected F 18). J. Nucl. Med. 2010, 51, 913–920. [CrossRef] [PubMed]
121. Okamura, N.; Yanai, K. Florbetapir (18F), a PET imaging agent that binds to amyloid plaques for the potentialdetection of Alzheimer’s disease. IDrugs 2010, 13, 890–899. [PubMed]
122. Kolata, G. Promise Seen for Detection of Alzheimer’s. Available online: https://www.nytimes.com/2010/06/24/health/research/24scans.html (accessed on 5 December 2019).
123. Johnson, A.E.; Jeppsson, F.; Sandell, J.; Wensbo, D.; Neelissen, J.A.M.; Juréus, A.; Ström, P.; Norman, H.;Farde, L.; Svensson, S.P.S. AZD2184: A radioligand for sensitive detection of beta-amyloid deposits.J. Neurochem. 2009, 108, 1177–1186. [CrossRef] [PubMed]
124. Swahn, B.-M.; Sandell, J.; Pyring, D.; Bergh, M.; Jeppsson, F.; Juréus, A.; Neelissen, J.; Johnström, P.; Schou, M.;Svensson, S. Synthesis and evaluation of pyridylbenzofuran, pyridylbenzothiazole and pyridylbenzoxazolederivatives as 18F-PET imaging agents for β-amyloid plaques. Bioorg. Med. Chem. Lett. 2012, 22, 4332–4337.[CrossRef] [PubMed]
125. Nelissen, N.; van Laere, K.; Thurfjell, L.; Owenius, R.; Vandenbulcke, M.; Koole, M.; Bormans, G.; Brooks, D.J.;Vandenberghe, R. Phase 1 study of the Pittsburgh compound B derivative 18F-flutemetamol in healthyvolunteers and patients with probable Alzheimer disease. J. Nucl. Med. 2009, 50, 1251–1259. [CrossRef][PubMed]
126. Mathis, C.; Lopresti, B.; Mason, N.; Price, J.; Flatt, N.; Bi, W.; Ziolko, S.; DeKosky, S.; Klunk, W.Comparison of the Amyloid Imaging Agents [F-18]3′-F-PIB and [C-11]PIB in Alzheimer’s Disease and ControlSubjects. Available online: http://jnm.snmjournals.org/content/48/supplement_2/56P.3.short (accessed on6 December 2019).
127. Lopresti, B.J.; Klunk, W.E.; Mathis, C.A.; Hoge, J.A.; Ziolko, S.K.; Lu, X.; Meltzer, C.C.; Schimmel, K.;Tsopelas, N.D.; DeKosky, S.T.; et al. Simplified quantification of Pittsburgh Compound B amyloid imagingPET studies: A comparative analysis. J. Nucl. Med. 2005, 46, 1959–1972.
128. Cselényi, Z.; Jönhagen, M.E.; Forsberg, A.; Halldin, C.; Julin, P.; Schou, M.; Johnström, P.; Varnäs, K.;Svensson, S.; Farde, L. Clinical validation of 18F-AZD4694, an amyloid-β-specific PET radioligand.J. Nucl. Med. 2012, 53, 415–424. [CrossRef]
129. A Phase 3 Clinical Trial to Evaluate the Efficacy and Safety of [18F]NAV4694 PET for Detection ofCerebral Beta-Amyloid When Compared With Postmortem Histopathology-Full Text View-ClinicalTrials.gov.Available online: https://clinicaltrials.gov/ct2/show/NCT01886820 (accessed on 6 December 2019).
130. Flutafuranol F 18-Navidea Biopharmaceuticals-AdisInsight. Available online: https://adisinsight.springer.com/drugs/800031066 (accessed on 6 December 2019).
29

Molecules 2020, 25, 977
131. Hostetler, E.D.; Sanabria-Bohórquez, S.; Fan, H.; Zeng, Z.; Gammage, L.; Miller, P.; O’Malley, S.; Connolly, B.;Mulhearn, J.; Harrison, S.T.; et al. 18FFluoroazabenzoxazoles as potential amyloid plaque PET tracers:synthesis and in vivo evaluation in rhesus monkey. Nucl. Med. Biol. 2011, 38, 1193–1203. [CrossRef]
132. Merck Clinical Trials. Available online: https://www.merck.com/clinical-trials/study.html?id=3328-002&kw=alzheimer%27s&tab=eligibility (accessed on 6 December 2019).
133. Yousefi, B.H.; Drzezga, A.; von Reutern, B.; Manook, A.; Schwaiger, M.; Wester, H.-J.; Henriksen, G. A Novel(18)F-Labeled Imidazo2,1-bbenzothiazole (IBT) for High-Contrast PET Imaging of β-Amyloid Plaques.ACS Med. Chem. Lett. 2011, 2, 673–677. [CrossRef]
134. Yousefi, B.H.; von Reutern, B.; Scherübl, D.; Manook, A.; Schwaiger, M.; Grimmer, T.; Henriksen, G.;Förster, S.; Drzezga, A.; Wester, H.-J. FIBT versus florbetaben and PiB: A preclinical comparison study withamyloid-PET in transgenic mice. EJNMMI Res. 2015, 5, 6519. [CrossRef]
135. Westwell, A.D. Fluorinated Pharmaceuticals. Development of 18F-labeled compounds for imaging of Aβ plaques bymeans of PET.; Future Science Ltd.: London, UK, 2015; ISBN 9781910419007.
136. Yousefi, B.H.; Manook, A.; Grimmer, T.; Arzberger, T.; von Reutern, B.; Henriksen, G.; Drzezga, A.; Förster, S.;Schwaiger, M.; Wester, H.-J. Characterization and first human investigation of FIBT, a novel fluorinated Aβ
plaque neuroimaging PET radioligand. ACS Chem. Neurosci. 2015, 6, 428–437. [CrossRef] [PubMed]137. Kim, Y.; Rosenberg, P.; Oh, E. A Review of Diagnostic Impact of Amyloid Positron Emission Tomography
Imaging in Clinical Practice. Dement. Geriatr. Cogn. Disord. 2018, 46, 154–167. [CrossRef] [PubMed]138. Barthel, H.; Sabri, O. Clinical Use and Utility of Amyloid Imaging. J. Nucl. Med. 2017, 58, 1711–1717.
[CrossRef] [PubMed]139. Chiotis, K.; Saint-Aubert, L.; Boccardi, M.; Gietl, A.; Picco, A.; Varrone, A.; Garibotto, V.; Herholz, K.; Nobili, F.;
Nordberg, A. Clinical validity of increased cortical uptake of amyloid ligands on PET as a biomarker forAlzheimer’s disease in the context of a structured 5-phase development framework. Neurobiol. Aging 2017,52, 214–227. [CrossRef]
140. Ceccaldi, M.; Jonveaux, T.; Verger, A.; Salmon, P.K.; Houzard, C.; Godefroy, O.; Shields, T.;Perrotin, A.; Gismondi, R.; Bullich, S.; et al. Impact of Florbetaben PET Imaging on Diagnosis andManagement of Patients with Suspected Alzheimer’s Disease Eligible for CSF Analysis in France.Available online: http://jnm.snmjournals.org/content/58/supplement_1/561?related-urls=yes&legid=jnumed;58/supplement_1/561 (accessed on 8 February 2020).
141. Hattori, N.; Ono, S.; UDO, N.; Yamamoto, S.; Ogawa, M.; Sugie, H. Clinical Impact of F-18 Flutemetamol(FMM) PET to Assess Cerebral Aß Pathology in Patients with Various Cognitive Disorders. Available online:http://jnm.snmjournals.org/content/59/supplement_1/480 (accessed on 8 February 2020).
142. Leuzy, A.; Savitcheva, I.; Chiotis, K.; Lilja, J.; Andersen, P.; Bogdanovic, N.; Jelic, V.; Nordberg, A.Clinical impact of 18Fflutemetamol PET among memory clinic patients with an unclear diagnosis. Eur. J.Nucl. Med. Mol. Imaging 2019, 46, 1276–1286. [CrossRef]
143. Sabri, O.; Seibyl, J.; Rowe, C.; Barthel, H. Beta-amyloid imaging with florbetaben. Clin. Transl. Imaging 2015,3, 13–26. [CrossRef]
144. de Wilde, A.; van der Flier, W.M.; Pelkmans, W.; Bouwman, F.; Verwer, J.; Groot, C.; van Buchem, M.M.;Zwan, M.; Ossenkoppele, R.; Yaqub, M.; et al. Association of Amyloid Positron Emission Tomography WithChanges in Diagnosis and Patient Treatment in an Unselected Memory Clinic Cohort: The ABIDE Project.JAMA Neurol. 2018, 75, 1062–1070. [CrossRef]
145. Zannas, A.S.; Doraiswamy, P.M.; Shpanskaya, K.S.; Murphy, K.R.; Petrella, J.R.; Burke, J.R.; Wong, T.Z.Impact of 18F-florbetapir PET imaging of β-amyloid neuritic plaque density on clinical decision-making.Neurocase 2014, 20, 466–473. [CrossRef]
146. University of Zurich. Investigating the Clinical Consequences of Flutemetamol-PET-Scanning-ICHGCP-Clinical Trials Registry. Available online: https://ichgcp.net/clinical-trials-registry/NCT02353949(accessed on 8 February 2020).
147. Buée, L.; Bussière, T.; Buée-Scherrer, V.; Delacourte, A.; Hof, P.R. Tau protein isoforms, phosphorylation androle in neurodegenerative disorders11These authors contributed equally to this work. Brain Res. Rev. 2000,33, 95–130. [CrossRef]
148. Fichou, Y.; Al-Hilaly, Y.K.; Devred, F.; Smet-Nocca, C.; Tsvetkov, P.O.; Verelst, J.; Winderickx, J.; Geukens, N.;Vanmechelen, E.; Perrotin, A.; et al. The elusive tau molecular structures: can we translate the recentbreakthroughs into new targets for intervention? Acta Neuropathol. Commun. 2019, 7, 31. [CrossRef]
30

Molecules 2020, 25, 977
149. Harada, R.; Okamura, N.; Furumoto, S.; Tago, T.; Yanai, K.; Arai, H.; Kudo, Y. Characteristics of Tau and ItsLigands in PET Imaging. Biomolecules 2016, 6, 7. [CrossRef] [PubMed]
150. Mott, R.T.; Dickson, D.W.; Trojanowski, J.Q.; Zhukareva, V.; Lee, V.M.; Forman, M.; van Deerlin, V.; Ervin, J.F.;Wang, D.-S.; Schmechel, D.E.; et al. Neuropathologic, biochemical, and molecular characterization of thefrontotemporal dementias. J. Neuropathol. Exp. Neurol. 2005, 64, 420–428. [CrossRef] [PubMed]
151. Dickson, D.W.; Kouri, N.; Murray, M.E.; Josephs, K.A. Neuropathology of frontotemporal lobardegeneration-tau (FTLD-tau). J. Mol. Neurosci. 2011, 45, 384–389. [CrossRef] [PubMed]
152. Harada, R.; Okamura, N.; Furumoto, S.; Yanai, K. Imaging Protein Misfolding in the Brain Using β-SheetLigands. Front. Neurosci. 2018, 12, 585. [CrossRef] [PubMed]
153. Clinton, L.K.; Blurton-Jones, M.; Myczek, K.; Trojanowski, J.Q.; LaFerla, F.M. Synergistic Interactions betweenAbeta, tau, and alpha-synuclein: Acceleration of neuropathology and cognitive decline. J. Neurosci. 2010, 30,7281–7289. [CrossRef] [PubMed]
154. Näslund, J.; Haroutunian, V.; Mohs, R.; Davis, K.L.; Davies, P.; Greengard, P.; Buxbaum, J.D.Correlation between elevated levels of amyloid beta-peptide in the brain and cognitive decline. JAMA 2000,283, 1571–1577. [CrossRef]
155. Okamura, N.; Suemoto, T.; Furumoto, S.; Suzuki, M.; Shimadzu, H.; Akatsu, H.; Yamamoto, T.; Fujiwara, H.;Nemoto, M.; Maruyama, M.; et al. Quinoline and benzimidazole derivatives: candidate probes for in vivoimaging of tau pathology in Alzheimer’s disease. J. Neurosci. 2005, 25, 10857–10862. [CrossRef]
156. Fodero-Tavoletti, M.T.; Okamura, N.; Furumoto, S.; Mulligan, R.S.; Connor, A.R.; McLean, C.A.; Cao, D.;Rigopoulos, A.; Cartwright, G.A.; O’Keefe, G.; et al. 18F-THK523: A novel in vivo tau imaging ligand forAlzheimer’s disease. Brain 2011, 134, 1089–1100. [CrossRef]
157. Okamura, N.; Furumoto, S.; Harada, R.; Tago, T.; Yoshikawa, T.; Fodero-Tavoletti, M.; Mulligan, R.S.;Villemagne, V.L.; Akatsu, H.; Yamamoto, T.; et al. Novel 18F-labeled arylquinoline derivatives for noninvasiveimaging of tau pathology in Alzheimer disease. J. Nucl. Med. 2013, 54, 1420–1427. [CrossRef]
158. Villemagne, V.L.; Furumoto, S.; Fodero-Tavoletti, M.T.; Mulligan, R.S.; Hodges, J.; Harada, R.; Yates, P.;Piguet, O.; Pejoska, S.; Doré, V.; et al. In vivo evaluation of a novel tau imaging tracer for Alzheimer’s disease.Eur. J. Nucl. Med. Mol. Imaging 2014, 41, 816–826. [CrossRef]
159. Tago, T.; Furumoto, S.; Okamura, N.; Harada, R.; Adachi, H.; Ishikawa, Y.; Yanai, K.; Iwata, R.; Kudo, Y.Preclinical Evaluation of (18)FTHK-5105 Enantiomers: Effects of Chirality on Its Effectiveness as a TauImaging Radiotracer. Mol. Imaging Biol. 2016, 18, 258–266. [CrossRef] [PubMed]
160. Okamura, N.; Furumoto, S.; Fodero-Tavoletti, M.T.; Mulligan, R.S.; Harada, R.; Yates, P.; Pejoska, S.; Kudo, Y.;Masters, C.L.; Yanai, K.; et al. Non-invasive assessment of Alzheimer’s disease neurofibrillary pathologyusing 18F-THK5105 PET. Brain 2014, 137, 1762–1771. [CrossRef] [PubMed]
161. Saint-Aubert, L.; Almkvist, O.; Chiotis, K.; Almeida, R.; Wall, A.; Nordberg, A. Regional tau depositionmeasured by 18FTHK5317 positron emission tomography is associated to cognition via glucose metabolismin Alzheimer’s disease. Alzheimers Res. Ther. 2016, 8, 38. [CrossRef] [PubMed]
162. Chiotis, K.; Saint-Aubert, L.; Savitcheva, I.; Jelic, V.; Andersen, P.; Jonasson, M.; Eriksson, J.; Lubberink, M.;Almkvist, O.; Wall, A.; et al. Imaging in-vivo tau pathology in Alzheimer’s disease with THK5317 PET in amultimodal paradigm. Eur. J. Nucl. Med. Mol. Imaging 2016, 43, 1686–1699. [CrossRef] [PubMed]
163. Tago, T.; Furumoto, S.; Okamura, N.; Harada, R.; Adachi, H.; Ishikawa, Y.; Yanai, K.; Iwata, R.; Kudo, Y.Structure-Activity Relationship of 2-Arylquinolines as PET Imaging Tracers for Tau Pathology in AlzheimerDisease. J. Nucl. Med. 2016, 57, 608–614. [CrossRef] [PubMed]
164. Harada, R.; Okamura, N.; Furumoto, S.; Furukawa, K.; Ishiki, A.; Tomita, N.; Tago, T.; Hiraoka, K.;Watanuki, S.; Shidahara, M.; et al. 18F-THK5351: A Novel PET Radiotracer for Imaging NeurofibrillaryPathology in Alzheimer Disease. J. Nucl. Med. 2016, 57, 208–214. [CrossRef]
165. Sone, D.; Imabayashi, E.; Maikusa, N.; Okamura, N.; Furumoto, S.; Kudo, Y.; Ogawa, M.; Takano, H.;Yokoi, Y.; Sakata, M.; et al. Regional tau deposition and subregion atrophy of medial temporal structures inearly Alzheimer’s disease: A combined positron emission tomography/magnetic resonance imaging study.Alzheimers Dement. 2017, 9, 35–40. [CrossRef]
166. Betthauser, T.J.; Lao, P.J.; Murali, D.; Barnhart, T.E.; Furumoto, S.; Okamura, N.; Stone, C.K.; Johnson, S.C.;Christian, B.T. In Vivo Comparison of Tau Radioligands 18F-THK-5351 and 18F-THK-5317. J. Nucl. Med.2017, 58, 996–1002. [CrossRef]
31

Molecules 2020, 25, 977
167. Edmondson, D.E.; Mattevi, A.; Binda, C.; Li, M.; Hubálek, F. Structure and mechanism of monoamine oxidase.Curr. Med. Chem. 2004, 11, 1983–1993. [CrossRef]
168. Tipton, K.F.; Boyce, S.; O’Sullivan, J.; Davey, G.P.; Healy, J. Monoamine oxidases: certainties and uncertainties.Curr. Med. Chem. 2004, 11, 1965–1982. [CrossRef]
169. Ishiki, A.; Harada, R.; Kai, H.; Sato, N.; Totsune, T.; Tomita, N.; Watanuki, S.; Hiraoka, K.; Ishikawa, Y.;Funaki, Y.; et al. Neuroimaging-pathological correlations of 18FTHK5351 PET in progressive supranuclearpalsy. Acta Neuropathol. Commun. 2018, 6, 53. [CrossRef] [PubMed]
170. Harada, R.; Ishiki, A.; Kai, H.; Sato, N.; Furukawa, K.; Furumoto, S.; Tago, T.; Tomita, N.; Watanuki, S.;Hiraoka, K.; et al. Correlations of 18F-THK5351 PET with Postmortem Burden of Tau and Astrogliosis inAlzheimer Disease. J. Nucl. Med. 2018, 59, 671–674. [CrossRef] [PubMed]
171. Krebs, M.R.H.; Bromley, E.H.C.; Donald, A.M. The binding of thioflavin-T to amyloid fibrils: localisation andimplications. J. Struct. Biol. 2005, 149, 30–37. [CrossRef] [PubMed]
172. Maruyama, M.; Shimada, H.; Suhara, T.; Shinotoh, H.; Ji, B.; Maeda, J.; Zhang, M.-R.; Trojanowski, J.Q.;Lee, V.M.-Y.; Ono, M.; et al. Imaging of tau pathology in a tauopathy mouse model and in Alzheimer patientscompared to normal controls. Neuron 2013, 79, 1094–1108. [CrossRef] [PubMed]
173. Hashimoto, H.; Kawamura, K.; Igarashi, N.; Takei, M.; Fujishiro, T.; Aihara, Y.; Shiomi, S.; Muto, M.;Ito, T.; Furutsuka, K.; et al. Radiosynthesis, photoisomerization, biodistribution, and metabolite analysis of11C-PBB3 as a clinically useful PET probe for imaging of tau pathology. J. Nucl. Med. 2014, 55, 1532–1538.[CrossRef] [PubMed]
174. Koga, S.; Ono, M.; Sahara, N.; Higuchi, M.; Dickson, D.W. Fluorescence and autoradiographic evaluation oftau PET ligand PBB3 to α-synuclein pathology. Mov. Disord. 2017, 32, 884–892. [CrossRef]
175. Perez-Soriano, A.; Arena, J.E.; Dinelle, K.; Miao, Q.; McKenzie, J.; Neilson, N.; Puschmann, A.; Schaffer, P.;Shinotoh, H.; Smith-Forrester, J.; et al. PBB3 imaging in Parkinsonian disorders: Evidence for binding to tauand other proteins. Mov. Disord. 2017, 32, 1016–1024. [CrossRef]
176. Hsieh, C.-J.; Mach, R.H.; Zhude, T.; Kotzbauer, P.T. Imaging of Aggregated Alpha-Synuclein in Parkinson’sDisease: A Work in Progress. The newsletter of the SNMI. Centrer for Molecular Imaging Innovation and Translation.2018, 12. Available online: http://s3.amazonaws.com/rdcmssnmmi/files/production/public/FileDownloads/MiGateway_2_2018_final.pdf (accessed on 8 December 2019).
177. Cashion, D.K.; Chen, G.; Kasi, D.; Kolb, H.C.; Liu, C.; Sinha, A.; Szardenings, A.K.; Wang, E.; Yu, C.;Zhang, W.; et al. Imaging Agents for Detecting Neurological Disorders. Available online: https://patentscope.wipo.int/search/en/detail.jsf?docId=WO2011119565 (accessed on 8 December 2019).
178. Xia, C.-F.; Arteaga, J.; Chen, G.; Gangadharmath, U.; Gomez, L.F.; Kasi, D.; Lam, C.; Liang, Q.; Liu, C.;Mocharla, V.P.; et al. (18)FT807, a novel tau positron emission tomography imaging agent for Alzheimer’sdisease. Alzheimers Dement. 2013, 9, 666–676. [CrossRef]
179. Zhang, W.; Arteaga, J.; Cashion, D.K.; Chen, G.; Gangadharmath, U.; Gomez, L.F.; Kasi, D.; Lam, C.; Liang, Q.;Liu, C.; et al. A highly selective and specific PET tracer for imaging of tau pathologies. J. Alzheimers Dis.2012, 31, 601–612. [CrossRef]
180. Chien, D.T.; Bahri, S.; Szardenings, A.K.; Walsh, J.C.; Mu, F.; Su, M.-Y.; Shankle, W.R.; Elizarov, A.; Kolb, H.C.Early clinical PET imaging results with the novel PHF-tau radioligand F-18-T807. J. Alzheimers Dis. 2013, 34,457–468. [CrossRef] [PubMed]
181. Mintun, M.; Schwarz, A.; Joshi, A.; Shcherbinin, S.; Chien, D.; Elizarov, A.; Su, M.-Y.; Shankle, W.;Pontecorvo, M.; Tauscher, J.; et al. Exploratory analyses of regional human brain distribution of the PETtau tracer F18-labeled T807 (AV-1541) in subjects with normal cognitive function or cognitive impairmentthought to be due to Alzheimer’s disease. Alzheimer’s Dement. 2013, 9, P842. [CrossRef]
182. Ono, M.; Sahara, N.; Kumata, K.; Ji, B.; Ni, R.; Koga, S.; Dickson, D.W.; Trojanowski, J.Q.; Lee, V.M.-Y.;Yoshida, M.; et al. Distinct binding of PET ligands PBB3 and AV-1451 to tau fibril strains in neurodegenerativetauopathies. Brain 2017, 140, 764–780. [CrossRef] [PubMed]
183. Cho, H.; Choi, J.Y.; Lee, S.H.; Ryu, Y.H.; Lee, M.S.; Lyoo, C.H. 18 F-AV-1451 binds to putamen in multiplesystem atrophy. Mov. Disord. 2017, 32, 171–173. [CrossRef] [PubMed]
184. Leuzy, A.; Chiotis, K.; Lemoine, L.; Gillberg, P.-G.; Almkvist, O.; Rodriguez-Vieitez, E.; Nordberg, A. Tau PETimaging in neurodegenerative tauopathies-still a challenge. Mol. Psychiatry 2019, 24, 1112–1134. [CrossRef][PubMed]
32

Molecules 2020, 25, 977
185. Kolb, H.C.; Andrés, J.I. Tau Positron Emission Tomography Imaging. Cold Spring Harb. Perspect. Biol. 2017, 9.[CrossRef]
186. Lowe, V.J.; Curran, G.; Fang, P.; Liesinger, A.M.; Josephs, K.A.; Parisi, J.E.; Kantarci, K.; Boeve, B.F.;Pandey, M.K.; Bruinsma, T.; et al. An autoradiographic evaluation of AV-1451 Tau PET in dementia.Acta Neuropathol. Commun. 2016, 4, 58. [CrossRef]
187. Hostetler, E.D.; Walji, A.M.; Zeng, Z.; Miller, P.; Bennacef, I.; Salinas, C.; Connolly, B.; Gantert, L.; Haley, H.;Holahan, M.; et al. Preclinical Characterization of 18F-MK-6240, a Promising PET Tracer for In VivoQuantification of Human Neurofibrillary Tangles. J. Nucl. Med. 2016, 57, 1599–1606. [CrossRef]
188. Vermeiren, C.; Motte, P.; Viot, D.; Mairet-Coello, G.; Courade, J.-P.; Citron, M.; Mercier, J.; Hannestad, J.;Gillard, M. The tau positron-emission tomography tracer AV-1451 binds with similar affinities to tau fibrilsand monoamine oxidases. Mov. Disord. 2018, 33, 273–281. [CrossRef]
189. Wooten, D.W.; Guehl, N.J.; Verwer, E.E.; Shoup, T.M.; Yokell, D.L.; Zubcevik, N.; Vasdev, N.; Zafonte, R.D.;Johnson, K.A.; El Fakhri, G.; et al. Pharmacokinetic Evaluation of the Tau PET Radiotracer 18F-T807(18F-AV-1451) in Human Subjects. J. Nucl. Med. 2017, 58, 484–491. [CrossRef]
190. Shcherbinin, S.; Schwarz, A.J.; Joshi, A.; Navitsky, M.; Flitter, M.; Shankle, W.R.; Devous, M.D.; Mintun, M.A.Kinetics of the Tau PET Tracer 18F-AV-1451 (T807) in Subjects with Normal Cognitive Function, MildCognitive Impairment, and Alzheimer Disease. J. Nucl. Med. 2016, 57, 1535–1542. [CrossRef] [PubMed]
191. Declercq, L.; Celen, S.; Lecina, J.; Ahamed, M.; Tousseyn, T.; Moechars, D.; Alcazar, J.; Ariza, M.; Fierens, K.;Bottelbergs, A.; et al. Comparison of New Tau PET-Tracer Candidates With 18FT808 and 18FT807. Mol. Imaging2016, 15. [CrossRef] [PubMed]
192. Wang, Y.T.; Edison, P. Tau Imaging in Neurodegenerative Diseases Using Positron Emission Tomography.Curr. Neurol. Neurosci. Rep. 2019, 19, 45. [CrossRef] [PubMed]
193. Sanabria Bohórquez, S.; Marik, J.; Ogasawara, A.; Tinianow, J.N.; Gill, H.S.; Barret, O.; Tamagnan, G.;Alagille, D.; Ayalon, G.; Manser, P.; et al. 18FGTP1 (Genentech Tau Probe 1), a radioligand for detectingneurofibrillary tangle tau pathology in Alzheimer’s disease. Eur. J. Nucl. Med. Mol. Imaging 2019, 46,2077–2089. [CrossRef]
194. Barret, O.; Alagille, D.; Sanabria, S.; Comley, R.A.; Weimer, R.M.; Borroni, E.; Mintun, M.; Seneca, N.; Papin, C.;Morley, T.; et al. Kinetic Modeling of the Tau PET Tracer 18F-AV-1451 in Human Healthy Volunteers andAlzheimer Disease Subjects. J. Nucl. Med. 2017, 58, 1124–1131. [CrossRef]
195. Seki, C.; Tagai, K.; Shimada, H.; Takahata, K.; Kubota, M.; Takado, Y.; Shinitoh, H.; Kimura, Y.; Ichise, M.; Okada, M.Establishment of a Simplified Method to Quantify [18F]PM-PBB3 ([18F]APN-1607) Binding in the Brains ofLiving Human Subjects. 2019. Available online: https://repo.qst.go.jp/?action=pages_view_main&active_action=repository_view_main_item_detail&item_id=78239&item_no=1&page_id=13&block_id=21 (accessed on18 February 2020).
196. 18F-PM-PBB3 PET Study in Tauopathy Including Alzheimer’s Disease, Other Dementias and NormalControls-Full Text View-ClinicalTrials.gov. Available online: https://clinicaltrials.gov/ct2/show/study/NCT03625128 (accessed on 10 December 2019).
197. Brendel, M.; Yousefi, B.H.; Blume, T.; Herz, M.; Focke, C.; Deussing, M.; Peters, F.; Lindner, S.; vonUngern-Sternberg, B.; Drzezga, A.; et al. Comparison of 18F-T807 and 18F-THK5117 PET in a Mouse Modelof Tau Pathology. Front. Aging Neurosci. 2018, 10, 174. [CrossRef]
198. Wong, D.F.; Comley, R.A.; Kuwabara, H.; Rosenberg, P.B.; Resnick, S.M.; Ostrowitzki, S.; Vozzi, C.; Boess, F.;Oh, E.; Lyketsos, C.G.; et al. Characterization of 3 Novel Tau Radiopharmaceuticals, 11C-RO-963, 11C-RO-643,and 18F-RO-948, in Healthy Controls and in Alzheimer Subjects. J. Nucl. Med. 2018, 59, 1869–1876. [CrossRef]
199. Gobbi, L.C.; Knust, H.; Körner, M.; Honer, M.; Czech, C.; Belli, S.; Muri, D.; Edelmann, M.R.; Hartung, T.;Erbsmehl, I.; et al. Identification of Three Novel Radiotracers for Imaging Aggregated Tau in Alzheimer’sDisease with Positron Emission Tomography. J. Med. Chem. 2017, 60, 7350–7370. [CrossRef]
200. Honer, M.; Gobbi, L.; Knust, H.; Kuwabara, H.; Muri, D.; Koerner, M.; Valentine, H.; Dannals, R.F.; Wong, D.F.;Borroni, E. Preclinical Evaluation of 18F-RO6958948, 11C-RO6931643, and 11C-RO6924963 as Novel PETRadiotracers for Imaging Tau Aggregates in Alzheimer Disease. J. Nucl. Med. 2018, 59, 675–681. [CrossRef]
201. Marquié, M.; Normandin, M.D.; Vanderburg, C.R.; Costantino, I.M.; Bien, E.A.; Rycyna, L.G.; Klunk, W.E.;Mathis, C.A.; Ikonomovic, M.D.; Debnath, M.L.; et al. Validating novel tau positron emission tomographytracer F-18-AV-1451 (T807) on postmortem brain tissue. Ann. Neurol. 2015, 78, 787–800. [CrossRef]
33

Molecules 2020, 25, 977
202. Walji, A.M.; Hostetler, E.D.; Selnick, H.; Zeng, Z.; Miller, P.; Bennacef, I.; Salinas, C.; Connolly, B.; Gantert, L.;Holahan, M.; et al. Discovery of 6-(Fluoro-(18)F)-3-(1H-pyrrolo2,3-cpyridin-1-yl)isoquinolin-5-amine((18)F-MK-6240): A Positron Emission Tomography (PET) Imaging Agent for Quantification of NeurofibrillaryTangles (NFTs). J. Med. Chem. 2016, 59, 4778–4789. [CrossRef] [PubMed]
203. Pascoal, T.A.; Shin, M.; Kang, M.S.; Chamoun, M.; Chartrand, D.; Mathotaarachchi, S.; Bennacef, I.;Therriault, J.; Ng, K.P.; Hopewell, R.; et al. In vivo quantification of neurofibrillary tangles with 18FMK-6240.Alzheimers Res. Ther. 2018, 10, 74. [CrossRef] [PubMed]
204. Betthauser, T.J.; Cody, K.A.; Zammit, M.D.; Murali, D.; Converse, A.K.; Barnhart, T.E.; Stone, C.K.;Rowley, H.A.; Johnson, S.C.; Christian, B.T. In Vivo Characterization and Quantification of NeurofibrillaryTau PET Radioligand 18F-MK-6240 in Humans from Alzheimer Disease Dementia to Young Controls.J. Nucl. Med. 2019, 60, 93–99. [CrossRef] [PubMed]
205. [18F]MK-6240 Positron Emission Tomography (PET) Tracer First-in-Human Validation Study(MK-6240-001)-Full Text View-ClinicalTrials.gov. Available online: https://clinicaltrials.gov/ct2/show/NCT02562989 (accessed on 8 December 2019).
206. Declercq, L.; Rombouts, F.; Koole, M.; Fierens, K.; Mariën, J.; Langlois, X.; Andrés, J.I.; Schmidt, M.;Macdonald, G.; Moechars, D.; et al. Preclinical Evaluation of 18F-JNJ64349311, a Novel PET Tracer for TauImaging. J. Nucl. Med. 2017, 58, 975–981. [CrossRef] [PubMed]
207. Politis, M. Neuroimaging in Parkinson disease: from research setting to clinical practice. Nat. Rev. Neurol.2014, 10, 708–722. [CrossRef] [PubMed]
208. Dickson, D.W.; Braak, H.; Duda, J.E.; Duyckaerts, C.; Gasser, T.; Halliday, G.M.; Hardy, J.; Leverenz, J.B.;Del Tredici, K.; Wszolek, Z.K.; et al. Neuropathological assessment of Parkinson’s disease: refining thediagnostic criteria. Lancet Neurol. 2009, 8, 1150–1157. [CrossRef]
209. Yu, L.; Cui, J.; Padakanti, P.K.; Engel, L.; Bagchi, D.P.; Kotzbauer, P.T.; Tu, Z. Synthesis and in vitro evaluationof α-synuclein ligands. Bioorg. Med. Chem. 2012, 20, 4625–4634. [CrossRef]
210. Bagchi, D.P.; Yu, L.; Perlmutter, J.S.; Xu, J.; Mach, R.H.; Tu, Z.; Kotzbauer, P.T. Binding of the radioligandSIL23 to α-synuclein fibrils in Parkinson disease brain tissue establishes feasibility and screening approachesfor developing a Parkinson disease imaging agent. PLoS ONE 2013, 8, e55031. [CrossRef]
211. Zhang, X.; Jin, H.; Padakanti, P.K.; Li, J.; Yang, H.; Fan, J.; Mach, R.H.; Kotzbauer, P.; Tu, Z. Radiosynthesis andin Vivo Evaluation of Two PET Radioligands for Imaging α-Synuclein. Appl. Sci. 2014, 4, 66–78. [CrossRef]
212. Honson, N.S.; Johnson, R.L.; Huang, W.; Inglese, J.; Austin, C.P.; Kuret, J. Differentiating Alzheimerdisease-associated aggregates with small molecules. Neurobiol. Dis. 2007, 28, 251–260. [CrossRef]
213. Chu, W.; Zhou, D.; Gaba, V.; Liu, J.; Li, S.; Peng, X.; Xu, J.; Dhavale, D.; Bagchi, D.P.; d’Avignon, A.;et al. Design, Synthesis, and Characterization of 3-(Benzylidene)indolin-2-one Derivatives as Ligands forα-Synuclein Fibrils. J. Med. Chem. 2015, 58, 6002–6017. [CrossRef] [PubMed]
214. Hsieh, C.-J.; Xu, K.; Lee, I.; Graham, T.J.A.; Tu, Z.; Dhavale, D.; Kotzbauer, P.; Mach, R.H. Chalcones andFive-Membered Heterocyclic Isosteres Bind to Alpha Synuclein Fibrils in Vitro. ACS Omega 2018, 3, 4486–4493.[CrossRef] [PubMed]
215. Ono, M.; Maya, Y.; Haratake, M.; Ito, K.; Mori, H.; Nakayama, M. Aurones serve as probes of beta-amyloidplaques in Alzheimer’s disease. Biochem. Biophys. Res. Commun. 2007, 361, 116–121. [CrossRef] [PubMed]
216. Ono, M.; Haratake, M.; Mori, H.; Nakayama, M. Novel chalcones as probes for in vivo imaging of beta-amyloidplaques in Alzheimer’s brains. Bioorg. Med. Chem. 2007, 15, 6802–6809. [CrossRef]
217. Ono, M.; Yoshida, N.; Ishibashi, K.; Haratake, M.; Arano, Y.; Mori, H.; Nakayama, M. Radioiodinated flavonesfor in vivo imaging of beta-amyloid plaques in the brain. J. Med. Chem. 2005, 48, 7253–7260. [CrossRef]
218. Meng, X.; Munishkina, L.A.; Fink, A.L.; Uversky, V.N. Effects of Various Flavonoids on the α-SynucleinFibrillation Process. Parkinsons. Dis. 2010, 2010, 650794. [CrossRef]
219. Zhu, M.; Han, S.; Fink, A.L. Oxidized quercetin inhibits α-synuclein fibrillization. Biochim. Biophys. Acta2013, 1830, 2872–2881. [CrossRef]
220. Masuda, M.; Suzuki, N.; Taniguchi, S.; Oikawa, T.; Nonaka, T.; Iwatsubo, T.; Hisanaga, S.-i.; Goedert, M.;Hasegawa, M. Small molecule inhibitors of alpha-synuclein filament assembly. Biochemistry 2006, 45,6085–6094. [CrossRef]
221. Cui, M.; Ono, M.; Watanabe, H.; Kimura, H.; Liu, B.; Saji, H. Smart near-infrared fluorescence probes withdonor-acceptor structure for in vivo detection of β-amyloid deposits. J. Am. Chem. Soc. 2014, 136, 3388–3394.[CrossRef]
34

Molecules 2020, 25, 977
222. Ono, M.; Doi, Y.; Watanabe, H.; Ihara, M.; Ozaki, A.; Saji, H. Structure–activity relationships of radioiodinateddiphenyl derivatives with different conjugated double bonds as ligands for α-synuclein aggregates. RSC Adv.2016, 6, 44305–44312. [CrossRef]
223. Fanti, S.; Bonfiglioli, R.; Decristoforo, C. Highlights of the 30th Annual Congress of the EANM, Vienna 2017:“Yes we can-make nuclear medicine great again”. Eur. J. Nucl. Med. Mol. Imaging 2018, 45, 1781–1794.[CrossRef] [PubMed]
224. Wester, H.-J.; Yousefi, B.H. US20170157274A1-Compounds Binding to Neuropathological Aggregates-GooglePatents. Available online: https://patents.google.com/patent/US20170157274A1/en (accessed on24 December 2019).
© 2020 by the authors. Licensee MDPI, Basel, Switzerland. This article is an open accessarticle distributed under the terms and conditions of the Creative Commons Attribution(CC BY) license (http://creativecommons.org/licenses/by/4.0/).
35


molecules
Article
Metabolic Brain Network Analysis of FDG-PET inAlzheimer’s Disease Using Kernel-BasedPersistent Features
Liqun Kuang 1,*, Deyu Zhao 1, Jiacheng Xing 2, Zhongyu Chen 3, Fengguang Xiong 1 and
Xie Han 1,*1 School of Data Science and Technology, North University of China, Taiyuan 030051, China;
[email protected] (D.Z.); [email protected] (F.X.)2 School of Software, Nanchang University, Nanchang 330047, China; [email protected] School of Software, East China Jiaotong University, Nanchang 330013, China; [email protected]* Correspondence: [email protected] (L.K.); [email protected] (X.H.)
Academic Editor: Peter BrustReceived: 7 May 2019; Accepted: 20 June 2019; Published: 21 June 2019
Abstract: Recent research of persistent homology in algebraic topology has shown that the alterednetwork organization of human brain provides a promising indicator of many neuropsychiatricdisorders and neurodegenerative diseases. However, the current slope-based approach may notaccurately characterize changes of persistent features over graph filtration because such curves arenot strictly linear. Moreover, our previous integrated persistent feature (IPF) works well on anrs-fMRI cohort while it has not yet been studied on metabolic brain networks. To address these issues,we propose a novel univariate network measurement, kernel-based IPF (KBI), based on the prior IPF,to quantify the difference between IPF curves. In our experiments, we apply the KBI index to studyfluorodeoxyglucose positron emission tomography (FDG-PET) imaging data from 140 subjects withAlzheimer’s disease (AD), 280 subjects with mild cognitive impairment (MCI), and 280 healthy normalcontrols (NC). The results show the disruption of network integration in the progress of AD. Comparedto previous persistent homology-based measures, as well as other standard graph-based measuresthat characterize small-world organization and modular structure, our proposed network index KBIpossesses more significant group difference and better classification performance, suggesting that itmay be used as an effective preclinical AD imaging biomarker.
Keywords: Alzheimer’s disease (AD); network measure; graph theory; brain network; positronemission tomography (PET); persistent homology
1. Introduction
Alzheimer’s disease (AD) is one of the most common neurodegenerative neurological diseases andis the most common form of dementia in the elderly [1]. Its clinical manifestations include long-termmemory loss, cognitive decline, language disorders, and other symptoms. AD seriously affects thenormal life of the elderly. However, the pathology of AD is not yet clear [1]. Some existing imagingtechnologies are used to explore the mechanisms of human brain function. Compared to magneticresonance imaging (MRI), fluorodeoxyglucose positron emission tomography (FDG-PET) has beendemonstrated to be a more precise predictor of both AD and mild cognitive impairment (MCI), andis more suitable for monitoring disease progression [2]. It collects and measures changes in glucosemetabolism values in brain regions or local brain cells. The signals are then converted into effectivethree-dimensional images and the connectivity between brain regions are analyzed.
The topological organization of metabolic brain networks have been successfully characterized inmany cases using various measures based on graph theory [3–5], such as characteristic path length
Molecules 2019, 24, 2301; doi:10.3390/molecules24122301 www.mdpi.com/journal/molecules37

Molecules 2019, 24, 2301
(CPL) [6], global efficiency [7], modularity (Mod) [7,8], and network diameter (ND) [9], to name buta few. Specifically, in patients with AD and MCI, several research groups have reported topologicalalterations in the whole-brain connectome, including a loss of small-worldness [10], a redistributionof hubs [9,11], and a disrupted modular organization [12]. Traditionally, weighted networks usuallyrequire defining a set of thresholding values before quantifying network topology [13–15], which mayresult in inconsistent network features when the thresholding values vary. Generally, the choice ofthreshold is rather arbitrary and there are no widely accepted criteria [16,17].
Recently, persistent homology [18] in algebraic topology has been studied to detect persistentstructures generated over all possible thresholds [19–23] in brain network analysis. There have beensignificant efforts to model evolution of brain networks and to link network topology to networkdynamics. This method constructs multiscale network for all possible thresholds wherever thepersistent topological features over the evolution of the network changes are identified. Its abilityto handle noisy data and provide homological information has turned it into a successful tool forthe analysis of brain network structures [24]. One typical application of persistent homology is in aBetti number plot (BNP) [18], which has been successfully applied to the brain network research onepilepsy [20], autism spectrum disorder, and attention-deficit hyperactivity disorder [19,23]. As BNPignores the association between persistent features and forthcoming thresholding value changes,we proposed an integrated persistent feature (IPF) by integrating an additional feature of connectedcomponent aggregation cost with BNP, and applied it to measure an AD network using resting statefunctional MRI (rs-fMRI) in our prior study [25]. However, both BNP and IPF applied linear regressionanalysis for computing the slope of the plot over all thresholds as a univariate network index. Such aslope-based approach may not accurately characterize the changes of persistent features over graphfiltration because the curves are not strictly linear. Moreover, our previous IPF works well on anrs-fMRI cohort though it has not been used to study metabolic brain networks yet.
In this paper, we borrow the idea of kernel methods [26,27] on persistent homology and proposea kernel-based IPF (KBI) index based on our prior work on IPF. We hypothesized that our KBI indexmay help to better reveal the difference between brain networks. With the cross-sectional FDG-PETimaging data of 140 AD, 280 MCI, and 280 normal control (NC) individuals, we set out to test thishypothesis by computing the KBI indices that measure the differences between AD, MCI, and NCgroups. We further perform statistical inference and classification to validate the power of KBI.
2. Results
In this section, we use FDG-PET data to evaluate statistical power and classification performanceof our proposed KBI index for the analysis of brain metabolic networks related to AD. We furthercompared it with prior persistent features, BNP [19,21,23] and SIP [25], as well as some other standardgraph-based indices.
2.1. Metabolic Brain Networks
After data preprocessing, the summarized point cloud were extracted from PET 3D imagingusing predefined automated anatomical labeling atlas with 90 (AAL-90) regions of interests (ROI) [28].We obtained the SUV matrix for all 700 subjects in all 90 ROIs and plot three histograms, in Figure 1,to show the global distributions of FDG uptake in AD, MCI, and NC. As the number of AD is half ofMCI and NC, we have normalized the SUV distribution of AD by doubling its statistics. We observedthat the AD cohort has lower glucose metabolism than MCI and NC, but no significant differences weredetected in the statistical inference of permutation test. We calculated the Pearson-based correlationdistance of FDG uptake between each pair of brain regions using Equation (1) and constructedgroup-wise brain metabolic networks. The three multiscale networks of AD, MCI, and NC groups areshown in Figure 2, which visualizes the evolution of brain networks over different thresholds.
38

Molecules 2019, 24, 2301
Figure 1. The fluorodeoxyglucose (FDG) uptake distribution of AD, MCI, and NC groups.
Figure 2. The constructed multiscale networks of AD, MCI, and NC by graph filtration λ, and the nodecolor represents the ROI index predefined in AAL-90 atlas.
2.2. Brain Network Features
We computed the values of graph-based network indices (CPL, ND, and Mod) in three groupsbased on their weighted networks after filtering their edges, whose corresponding p-values passed astatistical threshold (Bonferroni corrected p < 0.05). We then obtained the multiscale network accordingto graph filtration and computed the BNP and IPF index (i.e., SIP), as well as KBI index. Figure 3 showsthree separate IPF plots of AD, MCI, and NC. All brain network index values are shown in Table 1.The differences between groups need to be further verified by statistical inference and classification.
39

Molecules 2019, 24, 2301
Figure 3. The proposed integrated persistent feature (IPF) plot for three group-wise networks of AD,MCI and NC, respectively.
Table 1. The network index values of three groups.
Cohort KBI SIP BNP CPL ND Mod
AD 0.577 0.790 268.7 1.20 1.601 1.289MCI 0.826 0.842 265.2 1.17 1.457 0.770NC 0.988 0.882 245.5 1.15 1.436 1.004
2.3. Statistical Group Difference Performance
In this study, we use the permutation test for 10,000 permutations between any two groups, andshow the resulting p-value in Table 2. Only the proposed KBI index obtained a significant difference inany between-group at the significance level of 0.05.
Table 2. Statistical p-values for between-group differences by different graph indices on an AAL-90 atlas.
Cohort KBI SIP BNP CPL ND Mod
AD vs. MCI 0.017 0.036 0.048 0.058 0.397 0.074AD vs. NC 0.002 0.042 0.054 0.285 0.266 0.063MCI vs. NC 0.036 0.076 0.339 0.062 0.031 0.458
Only the proposed KBI index detected significant difference in any between-group (any p-value < 0.05).
2.4. Classification Performance
Furthermore, we resampled the networks 5000 times for each group with the resampling rate of0.5, and obtained 5000 values of each network index for each group. We then performed leave-one-outcrossvalidation to evaluate the classification powers of two-label (Figures 4 and 5) and three-label(Figure 6) by SVM. Our KBI shows better classification performance than prior persistent features, SIPand BNP, as well as other standard graph-based features, including CPL, ND, and Mod.
40

Molecules 2019, 24, 2301
Figure 4. Comparison of ROC curves of different network indices for MCI vs. NC.
Figure 5. Comparisons of ROC curves of different network indices for AD vs. NC.
Figure 6. Three-label classification.
3. Discussion
3.1. Present Findings
This study has three main findings.First, from Figure 1, we found that the AD cohort has lower glucose metabolism than MCI and NC.
This may imply cognitive impairment in AD and MCI. Such an inference is further partly confirmed bygraph theory analysis because a larger CPL is present in AD and MCI, while the network with smallerCPL is considered to be efficient.
Second, in our previous study [25], we had developed a univariate network index, SIP, based onhomology to model graph dynamics over all possible scales and applied it to study the rs-fMRI data of
41

Molecules 2019, 24, 2301
AD. We found the SIP values of AD were lower than MCI and much lower than NC. In the currentPET data, we still find the SIP values show the same pattern AD <MCI < NC, suggesting a slowernetwork integration rate in AD and MCI groups. Thus, the results from both independent cohortsprovide consistent empirical evidence for decreased functional integration in AD dementia and MCI.
Finally, we propose a novel univariate network index KBI to enhance our previous study basedon persistent homology. With our univariate KBI index, the difference of persistent features betweencognitive dysfunction and NC brain network can be measured more accurately. Our preliminaryexperimental results demonstrate that the proposed KBI may greatly boost prior SIP and BNP powerin both statistical inference and classification analyses. The KBI also outperforms other standardgraph-based methods, such as CPL, ND, and Mod, suggesting that our method may serve as a valuablepreclinical AD imaging biomarker.
3.2. Exploring Other Connectivity Definitions
There are many types of distance functions to construct weighted networks in brain networkanalysis [29], such as Pearson correlation, partial correlation, psycho–physiological interactions, ReHo,partial least squares, wavelet-based correlation, mutual information, synchronization likelihood,principal component analysis, independent component analysis, cluster analysis, dynamic causalmodeling, Granger causality modeling, structural equation modeling, and multivariate autoregressivemodeling, among others. At present, it is difficult to put forward the evaluation criteria of thesemethods, and few studies have compared them comprehensively. Although the Pearson correlationthat we used in this study may be the most practical scheme to define the connectome in AD studies,there is still debate about the choice of connectivity definition [29,30]. Therefore, we performed fourother connectivity definitions to explore more potentials in defining connectivity network. They wereKendall correlation [31], Spearman correlation [32], partial least squares [33], and Granger causalitymodeling [34]. The obtained p-values of our proposed KBI with these distance functions are shown inTable 3. There was no significant difference if Granger causality modeling was used, while the otherthree methods detected at least one significant difference. It should be noted that none of these methodsperformed significantly better than Pearson correlation (Table 1) in our current dataset. Moreover,when we checked all measures to discriminate AD, MCI, and NC by these methods, we found that thethree-label classification accuracy of BNP (88.3%) was improved greatly if the partial least squaresmethod was applied, while the performances in other cases have not been improved significantly. Suchan empirical study may justify the connectivity definition adopted in our current work.
Table 3. Statistical p-values for between-group differences of KBI by different connectivity definitions.
Between-Group
Definitions of Distance Function
KendallCorrelation
SpearmanCorrelation
Partial LeastSquares
Granger CausalityModeling
AD vs. MCI 0.003 0.007 0.159 0.399AD vs. NC 0.005 0.003 0.047 0.375MCI vs. NC 0.109 0.224 0.198 0.238
3.3. Ways of Network Construction
Graph-based brain connectome analyses are sensitive to the choice of parcellation schemes.To assess the effects of different parcellation strategies, we carried out the same set of analyses withanother commonly employed atlas, the Harvard–Oxford atlas [35,36] with 110 ROIs (HOA-110).The detailed statistical significances of between-group difference on HOA-110 are presented in Table 4.Again, our proposed KBI achieved better statistical power.
42
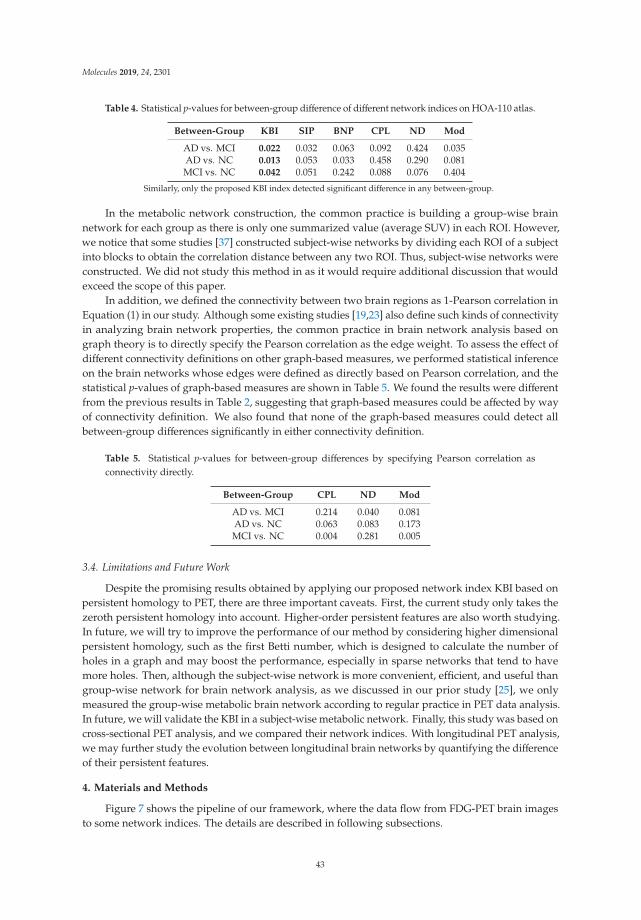
Molecules 2019, 24, 2301
Table 4. Statistical p-values for between-group difference of different network indices on HOA-110 atlas.
Between-Group KBI SIP BNP CPL ND Mod
AD vs. MCI 0.022 0.032 0.063 0.092 0.424 0.035AD vs. NC 0.013 0.053 0.033 0.458 0.290 0.081MCI vs. NC 0.042 0.051 0.242 0.088 0.076 0.404
Similarly, only the proposed KBI index detected significant difference in any between-group.
In the metabolic network construction, the common practice is building a group-wise brainnetwork for each group as there is only one summarized value (average SUV) in each ROI. However,we notice that some studies [37] constructed subject-wise networks by dividing each ROI of a subjectinto blocks to obtain the correlation distance between any two ROI. Thus, subject-wise networks wereconstructed. We did not study this method in as it would require additional discussion that wouldexceed the scope of this paper.
In addition, we defined the connectivity between two brain regions as 1-Pearson correlation inEquation (1) in our study. Although some existing studies [19,23] also define such kinds of connectivityin analyzing brain network properties, the common practice in brain network analysis based ongraph theory is to directly specify the Pearson correlation as the edge weight. To assess the effect ofdifferent connectivity definitions on other graph-based measures, we performed statistical inferenceon the brain networks whose edges were defined as directly based on Pearson correlation, and thestatistical p-values of graph-based measures are shown in Table 5. We found the results were differentfrom the previous results in Table 2, suggesting that graph-based measures could be affected by wayof connectivity definition. We also found that none of the graph-based measures could detect allbetween-group differences significantly in either connectivity definition.
Table 5. Statistical p-values for between-group differences by specifying Pearson correlation asconnectivity directly.
Between-Group CPL ND Mod
AD vs. MCI 0.214 0.040 0.081AD vs. NC 0.063 0.083 0.173MCI vs. NC 0.004 0.281 0.005
3.4. Limitations and Future Work
Despite the promising results obtained by applying our proposed network index KBI based onpersistent homology to PET, there are three important caveats. First, the current study only takes thezeroth persistent homology into account. Higher-order persistent features are also worth studying.In future, we will try to improve the performance of our method by considering higher dimensionalpersistent homology, such as the first Betti number, which is designed to calculate the number ofholes in a graph and may boost the performance, especially in sparse networks that tend to havemore holes. Then, although the subject-wise network is more convenient, efficient, and useful thangroup-wise network for brain network analysis, as we discussed in our prior study [25], we onlymeasured the group-wise metabolic brain network according to regular practice in PET data analysis.In future, we will validate the KBI in a subject-wise metabolic network. Finally, this study was based oncross-sectional PET analysis, and we compared their network indices. With longitudinal PET analysis,we may further study the evolution between longitudinal brain networks by quantifying the differenceof their persistent features.
4. Materials and Methods
Figure 7 shows the pipeline of our framework, where the data flow from FDG-PET brain imagesto some network indices. The details are described in following subsections.
43

Molecules 2019, 24, 2301
4.1. Participants
Data used in the preparation of this article were obtained from the Alzheimer’s DiseaseNeuroimaging Initiative (ADNI) database (adni.loni.usc.edu) [38,39]. ADNI was launched in 2003as a public–private partnership led by Principal Investigator Michael W. Weiner, MD. The primarygoal of ADNI has been to test whether serial magnetic resonance imaging (MRI), positron emissiontomography (PET), other biological markers, and clinical and neuropsychological assessment can becombined to measure the progression of mild cognitive impairment (MCI) and early Alzheimer’sdisease (AD).
In this study, we chose 700 subjects with FDG-PET data from ADNI2. To match the three researchcohorts of AD, MCI, and NC in gender and age, 140 AD, 280 MCI, and 280 NC subjects from 57 sitesacross North America were selected. The detailed cohort information is described in Table 6.
Figure 7. The pipeline of the brain network analysis based on a group of subjects. SUV, support vectormachine; BNP, Betti number plot; SIP, slope of IPF plot; KBI, kernel-based IPF; CPL, characteristic pathlength; ND, network diameter; Mod, modularity.
Table 6. Demographic information of the subjects in this study.
AD (n = 140) MCI (n = 280) NC (n = 280) p-value c
Age a 74.2 ± 7.8 73.9 ± 8.0 75.0 ± 6.6 0.20Gender b 70/70 140/140 140/140 1
CDR ≥ 1 0.5 0 –
Key: AD, Alzheimer’s disease; MCI, mild cognitive impairment; NC, normal control; a mean ± SD; b male/femalenumber; c statistical group significance using ANOVA test.
44

Molecules 2019, 24, 2301
4.2. FDG-PET Data Acquisition and Preprocessing
All FDG-PET scans were obtained using Siemens, GE, and Philips PET scanners. Details of thePET data acquisition is described at http://adni.loni.usc.edu/methods/pet-analysis/pre-processing/.All FDG-PET scans used in this research are preprocessed (step 1 of Figure 7) as follows [40]. First,in order to eliminate the individual differences in brain morphology between subjects such thatthey can completely coincide and be subject to effective statistical analysis, we used the softwaretoolkit Statistical Parametric Mapping (SPM8) [41] in MATLAB (Mathworks Inc, Natick, MA, USA)to linearly align the images into the Montreal Neurological Institute (MNI) space using the TPM.niitemplate file released with SPM. Second, we borrow a brain mask from SPM, exclude the brain stemand only keep the cerebral cortex (because the cerebral cortex is the object of this study), and thensegmented all the images with this cerebral mask. Third, we conducted spatial smoothing with aGaussian kernel of the full width at half maximum (FWHM) equal to (8,8,8) in three directions (x,y,z)to improve signal-to-noise.
4.3. Network Construction
A weighted graph is a natural and efficient way to represent metabolic brain network because itrepresents a discretized version of original PET images. In computer graphics, polygon meshes, as aclass of graphs with particular connectivity restrictions, are extensively used to represent the topologyof an object [42]; however, the mesh representation may not be the most suitable representation foranalyzing PET images because of connectivity restrictions [43]. Here, we extend polygon meshes togeneral graphs by relaxing the connectivity restrictions. Such graphs are easier to construct and areflexible enough to capture metabolic information. We construct a weighted network by encoding themetabolic information through an adjacency matrix W = {wij}. The node corresponds to the brainregions, and the edge corresponds to the interregional correlation of brain metabolism. Specifically,the region parcellation in brain imaging is usually defined based on an anatomical atlas. In thisstudy, we applied a predefined atlas, an automated anatomical labeling atlas with 90 (AAL-90) regionsof interests (ROI) [28]. Once an ROI is specified, an overall summary measure within it can becalculated to assess the response as a whole, rather than on a voxel-by-voxel basis (step 2 of Figure 7).The most straightforward way to do so is by taking the average standard uptake values (SUV) of all
voxels within the ROI. The SUV of a specific ROI is 1M
M∑p = 1
vp, where M is the total voxel number
in a given ROI and vp is the FDG uptake value of voxel p. Given K subjects and N brain regions,let SUVi = {SUVi1, SUVi2, . . . , SUViN,}(1 ≤ i ≤ N) be the vector of average SUV in i-th ROI of all Ksubjects (step 3 of Figure 7), and the edge weight wij between two brain regions is defined as 1-Pearsoncorrelation of SUV between them (step 4 of Figure 7), i.e.
wij = 1−cov(SUVi, SUVj
)
σSUViσSUVj
, (1)
where SUVi, SUVj are the average SUV in i-th and j-th brain region respectively, cov is the covariance,
σ is the standard deviation, andcov(SUVi,SUVj)σSUViσSUVj
is coefficient of Pearson correlation.
4.4. Network Indices
In clinical settings, doctors prefer single indices as biomarkers because a single neuroimagingindex provides a practical reference for evaluating disease progression and for effective treatments.Generally, there are some available network indices based on graph theory that measure brain globalattributes. In addition, we focus on some univariate indices that were developed from persistenthomology in algebraic topology, and compare them with the network indices from traditional graphtheory in our experiments.
45

Molecules 2019, 24, 2301
4.4.1. Traditional Graph Theory Indices
Traditionally, graph theoretical analysis has been applied to measure brain network topologicalfeatures. In this study, three global network indices based on graph theory are investigated, includingcharacteristic path length (CPL) [6], network diameter (ND) [9], and modularity (Mod) [7].
Briefly, CPL can be understood as indicating a network with “easily” transferred information.It is the average shortest path length between all pairs of nodes in the graph, and is calculated asCPL = 1
N(N−1)∑
i∈V, j∈V,i� jdi, j, where di,j is the shortest path length between nodes i and j. Note that
infinitely long paths (i.e., paths between disconnected nodes) are not included in computations. NDis the greatest distance between any pair of nodes, and is defined as ND = max
i∈Vmaxj∈V
di, j. It enables
understanding of the size of a network. A graph with a large ND and small CPL would thereforebe considered an efficient network. Mod describes the extent to which a network has modules thatdiffer from others, each of which is independent and functionally specialized [7]. Computationally, it is
expressed as Mod =∑
i∈M
⎡⎢⎢⎢⎢⎢⎣cii −⎛⎜⎜⎜⎜⎝∑
j∈Mcij
⎞⎟⎟⎟⎟⎠2⎤⎥⎥⎥⎥⎥⎦, where i and j are individual modules in the set of all modules
M, and c is the proportion of existing connections between two modules.In practice, we filtered the weighted network before computing these graph-based indices by only
selecting the edges whose corresponding p-values passed through a statistical threshold (Bonferronicorrected p < 0.05) and then adopted the Brain Connectivity Toolbox (https://sites.google.com/site/bctnet/) [7] for their implementation (step 6 (right) of Figure 7).
4.4.2. Persistent Features Based on Persistent Homology
Persistent homology is an emerging mathematical concept for characterizing shapes in complexdata, and the persistence features based on BNP are widely recognized as a useful feature descriptor.BNPs can distinguish robust and noisy topological properties over a wide range of graph filtrationsbased on the connectivity of k-dimensional simplicial complexes [18] (step 6 (left) of Figure 7).Graph filtration is an important tool [24] in persistent homology that constructs nesting subnetworksin a coherent manner and avoids thresholding selection (step 5 of Figure 7). BNPs have beensuccessfully applied to measure brain networks based on FDG-PET and structural MRI data [23] insome neurodegenerative diseases. In our previous study [25], we proposed an integrated persistentfeature (IPF) by integrating an additional feature of connected component aggregation cost with BNPto achieve holistic descriptions of graph evolutions. The IPF at filtration λi is defined as [25]
IPFλi =
⎧⎪⎪⎪⎪⎪⎪⎨⎪⎪⎪⎪⎪⎪⎩
m−im(m−1)
m−1∑k=i+1
λk, 0 ≤ i ≤ m− 2
0, i = m− 1
, (2)
where the maximal graph filtration is λ0 = 0 < λ1 < λ2 < · · · < λm−1. As the IPF plot over all possiblefiltration values is a monotonically decreasing convergence function, the absolute value of the slope ofIPF plot (SIP) was defined as a univariate network index and was successfully applied to quantifybrain network dynamics on rs-fMRI data of AD. Both the BNP and SIP indices indicate the rate ofconnecting components converging over the filtration value, and can be thought as the informationdiffusion rate or the convergence speed with said network.
4.4.3. The Kernel-Based IPF (KBI) Index
Although the SIP has been developed as a univariate network index in our previous study, it maynot be the most appropriate way to describe IPF plot as it is nonlinear, strictly speaking. Recently, somekernel methods [26,27] have been defined on persistent homology to measure the distance betweenpersistence diagrams, which are not only provably stable but also discriminative. Therefore, we employ
46
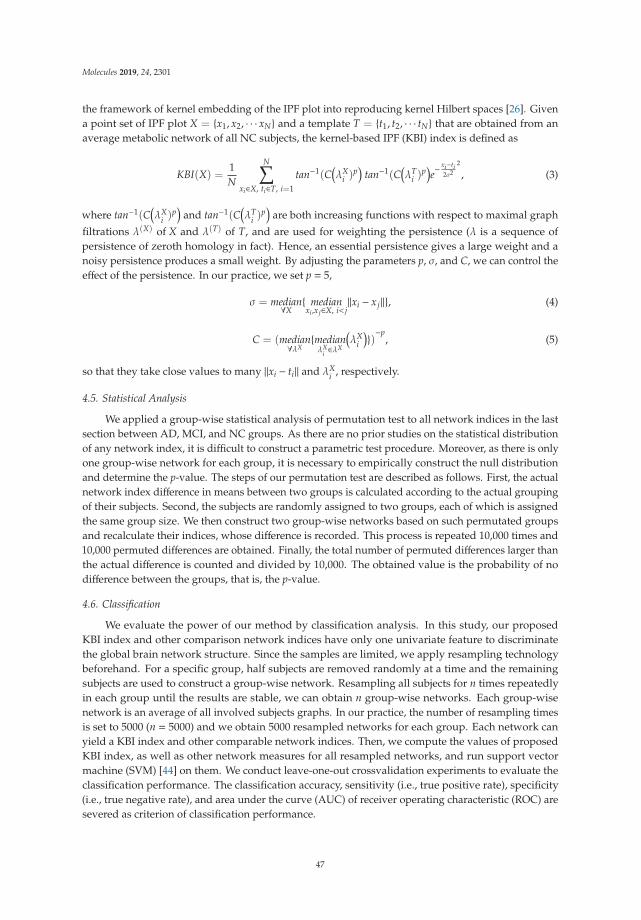
Molecules 2019, 24, 2301
the framework of kernel embedding of the IPF plot into reproducing kernel Hilbert spaces [26]. Givena point set of IPF plot X = {x1, x2, · · · xN} and a template T = {t1, t2, · · · tN} that are obtained from anaverage metabolic network of all NC subjects, the kernel-based IPF (KBI) index is defined as
KBI(X) =1N
N∑
xi∈X, ti∈T, i=1
tan−1(C(λX
i )p)
tan−1(C(λT
i )p)e−
xi−ti2σ2
2
, (3)
where tan−1(C(λX
i )p)
and tan−1(C(λT
i )p)
are both increasing functions with respect to maximal graph
filtrations λ(X) of X and λ(T) of T, and are used for weighting the persistence (λ is a sequence ofpersistence of zeroth homology in fact). Hence, an essential persistence gives a large weight and anoisy persistence produces a small weight. By adjusting the parameters p, σ, and C, we can control theeffect of the persistence. In our practice, we set p = 5,
σ = median∀X{ medianxi,xj∈X, i< j
‖xi − xj‖}, (4)
C = (median∀λX
{medianλX
i ∈λX
(λX
i
)})−p
, (5)
so that they take close values to many ‖xi − ti‖ and λXi , respectively.
4.5. Statistical Analysis
We applied a group-wise statistical analysis of permutation test to all network indices in the lastsection between AD, MCI, and NC groups. As there are no prior studies on the statistical distributionof any network index, it is difficult to construct a parametric test procedure. Moreover, as there is onlyone group-wise network for each group, it is necessary to empirically construct the null distributionand determine the p-value. The steps of our permutation test are described as follows. First, the actualnetwork index difference in means between two groups is calculated according to the actual groupingof their subjects. Second, the subjects are randomly assigned to two groups, each of which is assignedthe same group size. We then construct two group-wise networks based on such permutated groupsand recalculate their indices, whose difference is recorded. This process is repeated 10,000 times and10,000 permuted differences are obtained. Finally, the total number of permuted differences larger thanthe actual difference is counted and divided by 10,000. The obtained value is the probability of nodifference between the groups, that is, the p-value.
4.6. Classification
We evaluate the power of our method by classification analysis. In this study, our proposedKBI index and other comparison network indices have only one univariate feature to discriminatethe global brain network structure. Since the samples are limited, we apply resampling technologybeforehand. For a specific group, half subjects are removed randomly at a time and the remainingsubjects are used to construct a group-wise network. Resampling all subjects for n times repeatedlyin each group until the results are stable, we can obtain n group-wise networks. Each group-wisenetwork is an average of all involved subjects graphs. In our practice, the number of resampling timesis set to 5000 (n = 5000) and we obtain 5000 resampled networks for each group. Each network canyield a KBI index and other comparable network indices. Then, we compute the values of proposedKBI index, as well as other network measures for all resampled networks, and run support vectormachine (SVM) [44] on them. We conduct leave-one-out crossvalidation experiments to evaluate theclassification performance. The classification accuracy, sensitivity (i.e., true positive rate), specificity(i.e., true negative rate), and area under the curve (AUC) of receiver operating characteristic (ROC) aresevered as criterion of classification performance.
47

Molecules 2019, 24, 2301
5. Conclusions
This work proposed a novel network index KBI based on our prior work of persistent feature IPFto measure the metabolic brain network of FDG-PET on cognitively impaired cohort. The proposedKBI encoded a great deal of dynamic information over all possible scales that may be inaccessible bystandard graph-based measures. Compared to previous slope-based approaches of persistent homology,our kernel-based network index is more accurate regarding the characterization of differences betweenpersistent features. Our current results show that the slope of IPF plot present a pattern AD <MCI <NC in a FDG-PET cohort, consistent with our prior finding in an rs-fMRI cohort, and indicate a slowernetwork integration rate in AD dementia and MCI. Moreover, the enhanced measurement KBI greatlyboosted the performance of prior persistent features and outperformed some standard graph-basednetwork indices in both statistical inference and classification experiments, suggesting that our methodmay serve as a valuable preclinical AD imaging biomarker.
Author Contributions: Conceptualization and methodology, L.K., D.Z. and X.H.; validation: D.Z., J.X. and Z.C.;formal analysis: L.K., F.X., and X.H.; writing: L.K., D.Z., and X.H. visualization, F.X.; software, J.X. and Z.C.
Funding: This work was supported by the National Natural Science Foundation of China (61672473 and 61602426to L.K., F.X. and X.H.) and Shanxi Province Key R&D Technology Project (201803D121081 to L.K., F.X. and X.H.).
Acknowledgments: Data collection and sharing for this project was funded by the Alzheimer’s DiseaseNeuroimaging Initiative (ADNI) (National Institutes of Health Grant U01 AG024904) and DOD ADNI (Departmentof Defense award number W81XWH-12-2-0012). ADNI is funded by the National Institute on Aging, the NationalInstitute of Biomedical Imaging and Bioengineering, and through generous contributions from the following:AbbVie, Alzheimer’s Association; Alzheimer’s Drug Discovery Foundation; Araclon Biotech; BioClinica, Inc.;Biogen; Bristol-Myers Squibb Company; CereSpir, Inc.; Cogstate; Eisai Inc.; Elan Pharmaceuticals, Inc.; Eli Lillyand Company; EuroImmun; F. Hoffmann-La Roche Ltd. and its affiliated company Genentech, Inc.; Fujirebio; GEHealthcare; IXICO Ltd.; Janssen Alzheimer Immunotherapy Research & Development, LLC.; Johnson & JohnsonPharmaceutical Research & Development LLC.; Lumosity; Lundbeck; Merck & Co., Inc.; Meso Scale Diagnostics,LLC.; NeuroRx Research; Neurotrack Technologies; Novartis Pharmaceuticals Corporation; Pfizer Inc.; PiramalImaging; Servier; Takeda Pharmaceutical Company; and Transition Therapeutics. The Canadian Institutes ofHealth Research is providing funds to support ADNI clinical sites in Canada. Private sector contributions arefacilitated by the Foundation for the National Institutes of Health (www.fnih.org). The grantee organization isthe Northern California Institute for Research and Education, and the study is coordinated by the Alzheimer’sTherapeutic Research Institute at the University of Southern California. ADNI data are disseminated by theLaboratory for Neuro Imaging at the University of Southern California.
Conflicts of Interest: The authors declare no competing financial interest.
References
1. Lane, C.A.; Hardy, J.; Schott, J.M. Alzheimer’s disease. Eur. J. Neurol. 2018, 25, 59–70. [CrossRef] [PubMed]2. Ito, K.; Fukuyama, H.; Senda, M.; Ishii, K.; Maeda, K.; Yamamoto, Y.; Ouchi, Y.; Ishii, K.; Okumura, A.;
Fujiwara, K. Prediction of outcomes in mild cognitive impairment by using 18F-FDG-PET: A multicenterstudy. J. Alzheimers Dis. 2015, 45, 543–552. [CrossRef] [PubMed]
3. Sporns, O. Graph theory methods: Applications in brain networks. Dialogues Clin. Neuro. 2018, 20, 111–121.4. Bullmore, E.; Sporns, O. Complex brain networks: Graph theoretical analysis of structural and functional
systems. Nat. Rev. Neurosci. 2009, 10, 186–198. [CrossRef] [PubMed]5. Sporns, O. The human connectome: A complex network. Ann. N. Y. Acad. Sci. 2011, 1224, 109–125.
[CrossRef] [PubMed]6. Brier, M.R.; Thomas, J.B.; Fagan, A.M.; Hassenstab, J.; Holtzman, D.M.; Benzinger, T.L.; Morris, J.C.;
Ances, B.M. Functional connectivity and graph theory in preclinical alzheimer’s disease. Neurobiol. Aging2014, 35, 757–768. [CrossRef] [PubMed]
7. Rubinov, M.; Sporns, O. Complex network measures of brain connectivity: Uses and interpretations.NeuroImage 2010, 52, 1059–1069. [CrossRef]
8. Sporns, O.; Betzel, R.F. Modular brain networks. Annu. Rev. Psychol. 2016, 67, 613–640. [CrossRef]9. Fagerholm, E.D.; Hellyer, P.J.; Scott, G.; Leech, R.; Sharp, D.J. Disconnection of network hubs and cognitive
impairment after traumatic brain injury. Brain 2015, 138, 1696–1709. [CrossRef]
48

Molecules 2019, 24, 2301
10. Stam, C.; Jones, B.; Nolte, G.; Breakspear, M.; Scheltens, P. Small-world networks and functional connectivityin alzheimer’s disease. Cereb. Cortex 2006, 17, 92–99. [CrossRef]
11. Qiu, T.; Luo, X.; Shen, Z.; Huang, P.; Xu, X.; Zhou, J.; Zhang, M. Disrupted brain network in progressive mildcognitive impairment measured by eigenvector centrality mapping is linked to cognition and cerebrospinalfluid biomarkers. J. Alzheimers Dis. 2016, 54, 1483–1493. [CrossRef] [PubMed]
12. De Haan, W.; Van Der Flier, W.M.; Koene, T.; Smits, L.L.; Scheltens, P.; Stam, C.J. Disrupted modular braindynamics reflect cognitive dysfunction in alzheimer’s disease. NeuroImage 2012, 59, 3085–3093. [CrossRef][PubMed]
13. Tong, T.; Aganj, I.; Ge, T.; Polimeni, J.R.; Fischl, B. Functional density and edge maps: Characterizingfunctional architecture in individuals and improving cross-subject registration. NeuroImage 2017, 158,346–355. [CrossRef] [PubMed]
14. Daianu, M.; Jahanshad, N.; Nir, T.M.; Jack, C.R.; Weiner, M.W.; Bernstein, M.A.; Thompson, P.M. Rich clubanalysis in the alzheimer’s disease connectome reveals a relatively undisturbed structural core network.Hum. Brain Mapp. 2015, 36, 3087–3103. [CrossRef] [PubMed]
15. McKenna, F.; Koo, B.B.; Killiany, R. Comparison of apoe-related brain connectivity differences in early mciand normal aging populations: An fmri study. Brain Imaging Behav. 2016, 10, 970–983. [CrossRef] [PubMed]
16. Woo, C.-W.; Krishnan, A.; Wager, T.D. Cluster-extent based thresholding in fmri analyses: Pitfalls andrecommendations. NeuroImage 2014, 91, 412–419. [CrossRef]
17. Zalesky, A.; Cocchi, L.; Fornito, A.; Murray, M.M.; Bullmore, E. Connectivity differences in brain networks.NeuroImage 2012, 60, 1055–1062. [CrossRef] [PubMed]
18. Edelsbrunner, H.; Harer, J. Computational Topology: An Introduction; American Mathematical Society:Heidelberg, Germany, 2010.
19. Lee, H.; Kang, H.; Chung, M.K.; Kim, B.-N.; Lee, D.S. Persistent brain network homology from the perspectiveof dendrogram. IEEE Trans. Med. Imaging 2012, 31, 2267–2277.
20. Choi, H.; Kim, Y.K.; Kang, H.; Lee, H.; Im, H.-J.; Kim, E.E.; Chung, J.-K.; Lee, D.S. Abnormal metabolicconnectivity in the pilocarpine-induced epilepsy rat model: A multiscale network analysis based on persistenthomology. NeuroImage 2014, 99, 226–236. [CrossRef]
21. Chung, M.K.; Hanson, J.L.; Ye, J.; Davidson, R.J.; Pollak, S.D. Persistent homology in sparse regression andits application to brain morphometry. IEEE Trans. Med. Imaging 2015, 34, 1928–1939. [CrossRef]
22. Yoo, K.; Lee, P.; Chung, M.K.; Sohn, W.S.; Chung, S.J.; Na, D.L.; Ju, D.; Jeong, Y. Degree-based statistic andcenter persistency for brain connectivity analysis. Hum. Brain Mapp. 2017, 38, 165–181. [CrossRef] [PubMed]
23. Lee, H.; Kang, H.; Chung, M.K.; Lim, S.; Kim, B.N.; Lee, D.S. Integrated multimodal network approach to petand mri based on multidimensional persistent homology. Hum. Brain Mapp. 2017, 38, 1387–1402. [CrossRef][PubMed]
24. Giusti, C.; Ghrist, R.; Bassett, D.S. Two’s company, three (or more) is a simplex: Algebraic-topological toolsfor understanding higher-order structure in neural data. J. Comput. Neurosci. 2016, 41, 1–14. [CrossRef][PubMed]
25. Kuang, L.; Han, X.; Chen, K. A concise and persistent feature to study brain resting-state network dynamics:Findings from the alzheimer’s disease neuroimaging initiative. Hum. Brain Mapp. 2019, 40, 1062–1081.[CrossRef] [PubMed]
26. Kusano, G.; Hiraoka, Y.; Fukumizu, K. Persistence Weighted Gaussian Kernel for Topological Data Analysis;International Conference on Machine Learning: New York, NY, USA, 2016; pp. 2004–2013.
27. Carrière, M.; Cuturi, M.; Oudot, S. Sliced wasserstein kernel for persistence diagrams. Working Papers 2017.28. Tzourio-Mazoyer, N.; Landeau, B.; Papathanassiou, D.; Crivello, F.; Etard, O.; Delcroix, N.; Mazoyer, B.;
Joliot, M. Automated anatomical labeling of activations in spm using a macroscopic anatomical parcellationof the mni mri single-subject brain. NeuroImage 2002, 15, 273–289. [CrossRef] [PubMed]
29. Friston, K.J. Functional and effective connectivity: A review. Brain Connect 2011, 1, 13–36. [CrossRef]30. Valdes-Sosa, P.A.; Roebroeck, A.; Daunizeau, J.; Friston, K. Effective connectivity: Influence, causality and
biophysical modeling. NeuroImage 2011, 58, 339–361. [CrossRef]31. Kendall, M.G. A new measure of rank correlation. Biometrika 1938, 30, 81–93. [CrossRef]32. Best, D.; Roberts, D. Algorithm as 89: The upper tail probabilities of spearman’s rho. J. R. Stat. Soc. Ser. C
(Appl. Stat.) 1975, 24, 377–379. [CrossRef]
49

Molecules 2019, 24, 2301
33. McIntosh, A.R.; Chau, W.K.; Protzner, A.B. Spatiotemporal analysis of event-related fmri data using partialleast squares. NeuroImage 2004, 23, 764–775. [CrossRef] [PubMed]
34. Roebroeck, A.; Formisano, E.; Goebel, R. The identification of interacting networks in the brain using fmri:Model selection, causality and deconvolution. NeuroImage 2011, 58, 296–302. [CrossRef] [PubMed]
35. Kennedy, D.; Lange, N.; Makris, N.; Bates, J.; Meyer, J.; Caviness Jr, V. Gyri of the human neocortex: Anmri-based analysis of volume and variance. Cereb. Cortex 1998, 8, 372–384. [CrossRef] [PubMed]
36. Makris, N.; Meyer, J.W.; Bates, J.F.; Yeterian, E.H.; Kennedy, D.N.; Caviness, V.S. Mri-based topographicparcellation of human cerebral white matter and nuclei: Ii. Rationale and applications with systematics ofcerebral connectivity. NeuroImage 1999, 9, 18–45. [CrossRef] [PubMed]
37. Yu, Z.; Yao, Z.; Zheng, W.; Jing, Y.; Ding, Z.; Mi, L.; Lu, S. Predicting mci Progression with Individual MetabolicNetwork Based on Longitudinal FDG-PET; IEEE International Conference on Bioinformatics & Biomedicine:Kansas City, MO, USA, 2017.
38. Jagust, W.J.; Bandy, D.; Chen, K.; Foster, N.L.; Landau, S.M.; Mathis, C.A.; Price, J.C.; Reiman, E.M.;Skovronsky, D.; Koeppe, R.A. The alzheimer’s disease neuroimaging initiative positron emission tomographycore. Alzheimer’s Dement. 2010, 6, 221–229. [CrossRef]
39. Jack, C.R.; Bernstein, M.A.; Fox, N.C.; Thompson, P.; Alexander, G.; Harvey, D.; Borowski, B.; Britson, P.J.L.;Whitwell, J.; Ward, C. The alzheimer’s disease neuroimaging initiative (adni): Mri methods. J. Magn. Reson.Imaging 2008, 27, 685–691. [CrossRef] [PubMed]
40. Mi, L.; Zhang, W.; Zhang, J.; Fan, Y.; Goradia, D.; Chen, K.; Reiman, E.M.; Gu, X.; Wang, Y. An optimaltransportation based univariate neuroimaging index. In Proceedings of the IEEE International Conferenceon Computer Vision, Venice, Italy, 2017; pp. 182–191.
41. Penny, W.D.; Friston, K.J.; Ashburner, J.T.; Kiebel, S.J.; Nichols, T.E. Statistical Parametric Mapping: The Analysisof Functional Brain Images; Academic press: Pittsburgh, PA, USA, 2011.
42. De Floriani, L.; Magillo, P. Multiresolution mesh representation: Models and data structures. In Tutorials onMultiresolution in Geometric Modelling; Springer: Berlin/Heidelberg, Germany, 2002; pp. 363–417.
43. Chen, S.; Tian, D.; Feng, C.; Vetro, A.; Kovacevic, J. Fast resampling of 3d point clouds via graphs. arXiv 2017,arXiv:1702.06397. [CrossRef]
44. Cortes, C.; Vapnik, V. Support-vector networks. Mach. Learn. 1995, 20, 273–297. [CrossRef]
Sample Availability: Samples of the compounds are not available from the authors.
© 2019 by the authors. Licensee MDPI, Basel, Switzerland. This article is an open accessarticle distributed under the terms and conditions of the Creative Commons Attribution(CC BY) license (http://creativecommons.org/licenses/by/4.0/).
50

molecules
Article
Evaluating the In Vivo Specificity of [18F]UCB-H forthe SV2A Protein, Compared with SV2B and SV2C inRats Using microPET
Maria Elisa Serrano 1, Guillaume Becker 1, Mohamed Ali Bahri 1, Alain Seret 1,
Nathalie Mestdagh 2, Joël Mercier 2, Frédéric Mievis 3, Fabrice Giacomelli 3, Christian Lemaire 1,
Eric Salmon 1, André Luxen 1 and Alain Plenevaux 1,*
1 GIGA—CRC In Vivo Imaging, University of Liège, 8 Allée du 6 Août, Building B30, Sart Tilman, 4000 Liège,Belgium; [email protected] (M.E.S.); [email protected] (G.B.); [email protected] (M.A.B.);[email protected] (A.S.); [email protected] (C.L.); [email protected] (E.S.);[email protected] (A.L.)
2 UCB Pharma s.a., 1420 Braine-l’Alleud, Belgium; [email protected] (N.M.);[email protected] (J.M.)
3 Nucleis s.a., University of Liège, 8 Allée du 6 Août, Building B30, Sart Tilman, 4000 Liège, Belgium;[email protected] (F.M.); [email protected] (F.G.)
* Correspondence: [email protected]; Tel.: +32-4-3662316
Received: 22 March 2019; Accepted: 29 April 2019; Published: 1 May 2019
Abstract: The synaptic vesicle protein 2 (SV2) is involved in synaptic vesicle trafficking. The SV2Aisoform is the most studied and its implication in epilepsy therapy led to the development of thefirst SV2A PET radiotracer [18F]UCB-H. The objective of this study was to evaluate in vivo, usingmicroPET in rats, the specificity of [18F]UCB-H for SV2 isoform A in comparison with the othertwo isoforms (B and C) through a blocking assay. Twenty Sprague Dawley rats were pre-treatedeither with the vehicle, or with specific competitors against SV2A (levetiracetam), SV2B (UCB5203)and SV2C (UCB0949). The distribution volume (Vt, Logan plot, t* 15 min) was obtained with apopulation-based input function. The Vt analysis for the entire brain showed statistically significantdifferences between the levetiracetam group and the other groups (p < 0.001), but also between thevehicle and the SV2B group (p < 0.05). An in-depth Vt analysis conducted for eight relevant brainstructures confirmed the statistically significant differences between the levetiracetam group and theother groups (p < 0.001) and highlighted the superior and the inferior colliculi along with the cortexas regions also displaying statistically significant differences between the vehicle and SV2B groups(p < 0.05). These results emphasize the in vivo specificity of [18F]UCB-H for SV2A against SV2B andSV2C, confirming that [18F]UCB-H is a suitable radiotracer for in vivo imaging of the SV2A proteinswith PET.
Keywords: SV2A; SV2B; SV2C; microPET; [18F]UCB-H; epilepsy; PBIF; distribution volume; blockingassay; preclinical imaging
1. Introduction
The synaptic vesicle protein 2 (SV2) is an integral membrane protein with twelve transmembranedomains and three N-glycosylation sites in the intravesicular loop. The SV2 protein is ubiquitouslypresent in the nerve terminals of the central and peripheral nervous systems, and in several typesof endocrine cells [1]. This protein is critical for the adequate functioning of the central nervoussystem, acting as a modulator of synaptic transmission [2,3]. Moreover, it has been associated with thepathophysiology of epilepsy [4–6].
Molecules 2019, 24, 1705; doi:10.3390/molecules24091705 www.mdpi.com/journal/molecules51

Molecules 2019, 24, 1705
Previous studies have identified three SV2 isoforms: SV2A, SV2B and SV2C, characterized bydifferent expression levels during rodent brain development [7] and adulthood [8]. While the SV2Aisoform is present across all brain areas, the SV2C isoform can only be found in specific regions, suchas the striatum, pallidum, midbrain, brainstem, substantia nigra, and the olfactory bulb [9]. TheSV2B isoform is particularly present in the cerebral cortex, and the cornu ammonis sub-region ofthe hippocampus [10]. The three isoforms present large similarities in their structure: 65% betweenisoforms A and B, 62% between A and C, and 57% between B and C [8].
Of these three isoforms, SV2A is the most investigated. The antiepileptic drug levetiracetam(Keppra®) binds to SV2A, suggesting a role for SV2A in the pathology underlying certain forms ofepilepsy [11–14]. Several studies have shown a correlation between the brain expression of this isoformand the clinical efficacy of this drug [5,13].
To investigate the role of SV2A in vivo, in 2013 [18F]UCB-H was presented as an imaging agentwith a nanomolar affinity for human SV2A [3,15–17]. Since then, other PET radiotracers, such as[11C]UCB-J, or [11C]UCB-A, have been synthetized to study this protein [3,18–20] (see Figure 1).These PET radiotracers appear to be more specific than [18F]UCB-H (pIC50 = 7.8) [3,16], based ontheir respective affinity measured in vitro, with pIC50 = 8.2 for [11C]UCB-J [18] and pIC50 = 7.9 for[11C]UCB-A [20]. The three radiotracers have demonstrated potential for use as synaptic densitybiomarkers not only in animals, but also in humans [3,21–23]. However, despite the valuable propertiesof [11C]UCB-J and [11C]UCB-A in assessing brain synaptic density in vivo, their clinical applicationis limited to facilities with a cyclotron due to the short half-life of 11C (20.3 min) compared to thehalf-life of 18F (110 min). In addition, the use of a PET radiotracer with a longer half-life (such as 18F)allows the evaluation of a greater number of patients per day with just one production. Therefore,different fluorine-18-labelled derivatives of UCB-J are currently being developed and characterized,such as [18F]SDM-8 [24]. The potential of [18F]UCB-H for detecting variations in SV2A has alreadybeen demonstrated in vivo [25,26]. Nevertheless, as the actual specificity of [18F]UCB-H for SV2Aagainst SV2B and SV2C has never been addressed in vivo, we consider that this point deserves morecareful evaluation.
Figure 1. Chemical structures of [18F]UCB-H, [11C]UCB-J and [11C]UCB-A.
This paper, therefore, aims to evaluate for the first time the specificity of [18F]UCB-H for the SV2Aisoform against SV2B and SV2C using microPET imaging in rats, by means of a blocking assay betweenthis radiotracer and specific competitors for the three SV2 isoforms. The results will provide highlyvaluable information about the actual potential of [18F]UCB-H as a radiopharmaceutical candidate tostudy the SV2A protein with PET in research or clinical practice.
2. Results
Table 1 summarizes the results obtained from the in vitro binding assays. We observe that SV2BL
presents a high affinity for SV2B (pIC50 = 7.8), but also has an affinity for SV2A similar to that of SV2AL
(pIC50 = 5.6).
52

Molecules 2019, 24, 1705
Table 1. pIC50 of the competitors used for the different SV2 isoforms. Binding affinities measured forhuman SV2 proteins at 37 ◦C. Data are presented as mean (n = 3 to 10) from non-linear regressionanalysis of raw data using a sigmoidal dose-response model. Additional data for SV2BL (UCB5203)solubility: 0.1 mg/mL, route of administration: ip (suspension in 5% DMSO–1% methyl cellulose inwater), CEREP @ 10 μM: all targets < 50% inhibition, mouse brain fraction unbound: 37%, mouse brainexposure (3 mg/kg, 30–60 min): ~1.8 μM total→ 0.66 μM free→ ~100 fold IC50 SV2B. Additionaldata for SV2CL (UCB0949) solubility: 0.055 mg/mL, route of administration: ip (suspension in 5%DMSO—1% methyl cellulose in water), CEREP @ 10 μM: all targets < 50% inhibition, mouse brainfraction unbound: 54%, mouse brain exposure (3 mg/kg, 30–60 min): ~8 μM total→ 4.3 μM free→~270 fold IC50 SV2C.
Synaptic Vesicle Protein Isoforms
SV2A SV2B SV2C
SV2AL 5.2 −3.1 −3.2SV2BL 5.6 7.8 5.5SV2CL <5 5.9 7.8
In Figure 2, [18F]UCB-H parametric Vt maps are presented for the vehicle group and the threepre-treated groups (SV2AL, SV2BL and SV2CL). These pictures highlight a clear reduction of the[18F]UCB-H binding throughout the entire brain induced by levetiracetam (SV2AL) pre-treatment at10 mg/kg (PET image corresponding to the SV2AL group).
Figure 2. Example of an individual parametric Vt map of [18F]UCB-H binding in rat brain (PET),along with the corresponding individual MRI and the overlay of both images (PET +MRI). Rats werepre-treated 30 min before the 60 min PET acquisition with either vehicle, SV2A competitor (levetiracetam[SV2AL] at 10 mg/kg), SV2B competitor (UCB5203 [SV2BL] at 3 mg/kg) and SV2C competitor (UCB0949[SV2CL] at 3 mg/kg).
In Figure 3A, we can observe the time activity curves (TACs) corresponding to the four differenttreatments (vehicle, SV2AL, SV2BL and SV2CL), for one of the regions of interest (ROIs): the whole brain.
53

Molecules 2019, 24, 1705
The four TACs reveal a high initial uptake of [18F]UCB-H, which peaks around 5 min post-injection.Subsequently, the radioactivity is quickly washed out of the brain. Some differences can be observedin the kinetic of the TAC after pre-treatment with the respective ligands: The highest peak activity isobserved after pre-treatment with the vehicle and with SV2CL. Interestingly, the pre-treatments withSV2AL and SV2BL display the same peak of initial uptake. In the case of SV2BL, the kinetics of theTAC from 15 to 60 min are similar to the kinetics of the radiotracer after pre-treatment with either thevehicle or SV2CL. The TACs for all the ROIs are included in Supplementary Figure S1. In addition, thearea under each TAC (the AUC) is represented in Figure 3B, where we can observe the differencesbetween the [18F]UCB-H uptake after pre-treatment with SV2AL, and after pre-treatment with theother compounds.
Figure 3. Representative time activity curves (TACs) and AUC (area under each TAC) for the differentregions of interest (ROIs). (A) TACs extracted from the whole brain as ROI, and normalized by theinjected activities and the body weight. Lines represent the [18F]UCB-H uptake over a 60 min acquisitionafter pre-treatment with the vehicle, SV2AL, SV2BL, or SV2CL. (B) The bar plots represent the AUC inthe eight ROIs (mean ± SEM, n = 5).
Figure 4 presents the mean Vt values for the eight selected brain structures, calculated fromthe previous TACs and the population-based input function (PBIF). Comparing Figures 3B and 4,the differences between groups in AUC and in Vt are similar, with the highest value associated topre-treatment with the vehicle, and the lowest value for pre-treatment with SV2AL.
Table 2 summarizes, for the same regions, the impact on the Vt induced by the blocking experiments,expressed as the relative difference in Vt between the vehicle group and the pre-treated groups. In thewhole brain, mean Vt values of 10.4 ± 0.7, 6.0 ± 0.3, 8.3 ± 0.2 and 9.8 ± 0.3 were obtained for the vehicle(control) group, the SV2AL pre-treated group, the SV2BL pre-treated group and the SV2CL pre-treatedgroup, respectively. For the eight ROIs, a statistically significant difference was observed between theSV2AL pre-treated group and all the other groups (p < 0.001). Furthermore, for the whole brain, the
54

Molecules 2019, 24, 1705
cerebral cortex and the inferior and superior colliculus, a statistically significant difference was alsodetected between the vehicle group and the SV2BL pre-treated group (p < 0.05).
Figure 4. Vt values for the eight selected brain structures. Bars represent the mean ± SEM (n = 5).One-way ANOVA and Scheffe post-hoc tests were performed, with ***p < 0.001 and *p < 0.05.
Table 2. Illustration of the impact induced by the blocking experiments, expressed as percentage ofreduction calculated from the mean Vt values (n = 5) for the eight selected ROIs.
ROIs Vehicle vs. SV2AL Vehicle vs. SV2BL Vehicle vs. SV2CL
Whole brain 42.3 19.9 5.6Cortex 42.7 21.1 9.1
Hippocampus 46.8 16.9 2.1Inferior colliculus 49.1 23.7 8.5
Midbrain 46.3 19.1 5.1Caudate/Putamen 46.2 20.2 6.2Superior colliculus 50.4 23.4 7.6
Thalamus 45.9 19.7 4.4Mean 46.2 20.5 6.1SEM 1.0 0.8 0.8
3. Discussion
The SV2 protein is critical for the adequate functioning of the central nervous system, acting asa modulator of synaptic transmission by priming vesicles in quiescent neurons [4]. The divergentroles of the three isoforms which comprise this family have yet to be clarified, although differentpathologies have been associated with them. As previously stated, the SV2A isoform is associatedwith the physiopathology of epilepsy [5,27]. In contrast, the SV2B isoform is related with prostatesmall cell carcinoma [28] and the SV2C isoform is generally associated with the correct functioning ofbasal ganglia nuclei [9,29,30]. Some studies have evaluated the possible relation between SV2C andParkinson’s disease, as SV2C modulates dopamine release [29,31].
This paper’s goal was to evaluate, for the first time, in vivo the specificity of the [18F]UCB-Hradiotracer in targeting the SV2A isoform compared to SV2B and SV2C. The relevance of such a studystems from the fact that in vivo SV2A quantification can be considered to be an indirect measure of thesynaptic density [2,3,18], which is a key parameter for fundamental research and for the clinic.
Before discussing the results obtained during these blocking experiments, we have to addresssome general considerations. Firstly, the results presented issue from the microPET imaging technique.Like many other microPET cameras, the Focus120 used during this work has a spatial resolutionof 1.5 mm, at best hampering the study of brain structures of small size due to the partial volume
55

Molecules 2019, 24, 1705
effect [32,33]. Secondly, the rat brain distributions of the three SV2 protein isoforms [7–9] indicate thatalmost all major brain structures express at least two SV2 protein isoforms. SV2A, the most extensivelystudied, is ubiquitously distributed [1,8]. Like SV2A, SV2B can be found in almost all the rat brainstructures with few subtle differential expressions in some hippocampal substructures like CA3 andthe dentate gyrus, along with the reticular nucleus of the thalamus and some small areas in the brainstem [8,9,34]. Unfortunately, these regions are far too small to be correctly quantified with microPET.Janz and Sudhof showed that unlike SV2A and SV2B, the SV2C protein is characterized by muchmore restricted localization in brain regions considered to be evolutionarily well preserved in rats:The olfactory bulb, the striatum, the substantia nigra, and some nuclei in the pons and the medullaoblongata [9]. As we can see, it is impossible to find well defined brain structures for in vivo microPETquantification in which one of the three isoforms is uniquely or even mostly expressed. Anotherimportant point is that we do not have a clear picture of the respective proportions of each isoformpresent in the main rat brain structures. All these considerations will have to be taken into account inthe following discussion. Accordingly, we have decided to select eight major ROIs to ensure robustin vivo quantification with microPET: Whole brain, cortex, hippocampus, inferior colliculus, superiorcolliculus, midbrain, caudate putamen and thalamus.
The [18F]UCB-H Vt values obtained during this study for the vehicle pre-treated group, calculatedusing the PBIF [35] were in good agreement with those previously published for rats [35,36]. This isimportant in order to establish the consistency of the proposed methodology. The blocking experimentsrealized with SV2AL at 10 mg/kg demonstrated a clear significant competition (46.2%) betweenlevetiracetam and [18F]UCB-H in eight selected ROIs. These values are of the same order of magnitudeas those previously reported in rats [36]. According to the potency of levetiracetam for SV2A againstSV2B and SV2C (Table 2), we can conclude that SV2A is one of the main target of [18F]UCB-H in vivoin rats.
After performing a blocking experiment with SV2CL at 3 mg/kg, we obtained TACs with similarpeaks and kinetics to the TAC corresponding to pre-treatment with the vehicle, in all ROIs. Thequantification of the radiotracer uptake, using the Vt, highlighted no statistically significant in vivocompetition between SV2CL and [18F]UCB-H in any of the eight selected ROIs. From this we caninfer that SV2CL pre-treatment has either no impact or an impact of very small size. The populationused (n = 5) is not sufficient to demonstrate an effect of small size (f = 0.10), but is optimal to detectmedium (f = 0.25) and large effect sizes (f = 0.5). Another important point is that a highly potent SV2Ccompetitor like UCB0949 (pIC50 of 7.8) was unable to modify [18F]UCB-H binding in brain structureswith a high expression of SV2C, like the midbrain or the caudate/putamen [9]. The reduction measuredin these regions was of the same order of magnitude as that found in the other structures. Theseconsiderations support the theory that SV2C does not seem to be the main target of [18F]UCB-H in rats.
The pre-treatment with SV2BL at 3 mg/kg resulted in a TAC with a peak as high as that obtainedafter pre-treatment with SV2AL. However, it features kinetics which are similar to those obtained afterpre-treatment with the vehicle or SV2CL. This lower peak could be attributed to an initial non-specificbinding of SV2BL to the SV2A protein, for which it presents an affinity which is similar to that ofSV2AL, with a pIC50 = 5.6. After the peak, the SV2BL TAC follows a similar shape and level to those ofpre-treatment with the vehicle and SV2CL, indicating a washing out effect of this fraction of non-specificbinding of SV2BL to the SV2A protein. In order to confirm this hypothesis, a similar experiment with aSV2BL with a lower affinity for SV2A should be performed. However, the SV2BL used in this paper iscurrently the only one available. In addition to the previous analysis, we evaluated the changes inVt after pre-treatment with SV2BL. In these results, we can observe a consistent mean reduction of20.5% of the Vt values in the eight selected ROIs. The SV2BL is characterized by a pIC50 of 7.8 for theSV2B isoform. Such a highly potent competitor is expected to effectively impede the binding of anyradioligand to the SV2B isoform. If SV2B was the main target for [18F]UCB-H, the blocking inducedwith this highly efficient SV2BL would have been very pronounced and much higher than the 20%measured. In order to explain the 20% reduction of [18F]UCB-H Vt values, we have to take into account
56

Molecules 2019, 24, 1705
that SV2BL also presents some potency for SV2A. SV2BL has a pIC50 of 5.6, which is of the same orderof magnitude as that of levetiracetam. Thus, the SV2BL ligand has some affinity for SV2A, which couldlead to partial blocking of SV2A. Hence, the 20% reduction observed is most likely linked to SV2Ablocking induced by SV2BL. Accordingly, we can conclude that SV2B does not seem to be the maintarget of [18F]UCB-H in vivo in rats.
We are aware that the respective affinities of SV2BL and SV2CL are a problem for the interpretationof the data, but we have to consider that today UCB5203 and UCB0949 are the only compounds thatcan be used for this purpose.
4. Materials and Methods
4.1. Animals
Twenty male Sprague Dawley CD rats (five weeks old) were used, bred by Janvier Laboratories(France). The animals were housed in pairs for three weeks under standard 12:12 h light/dark conditions,maintaining room temperature at 22 ◦C, and humidity at approximately 50%. Standard pellet foodand water were provided ad libitum.
The experimental procedures and protocols used in this investigation (“Synap-SV2A project” files14-1753 and 13-1573) were reviewed and approved by the Institutional Animal Care and Use Committeeof the University of Liege, according to the Helsinki declaration, and conducted in accordance withthe European guidelines for care of laboratory animals (2010/63/EU). Moreover, the Animal ResearchReporting In Vivo Experiments (ARRIVE) guidelines [37] were followed as closely as possible to confera minimal intrinsic quality to the study.
4.2. Radiopharmaceutical Production and Drugs
[18F]UCB-H was produced through one-step radiolabeling of a pyridyliodonium precursor. Thismethod provides 34% ± 2% of injectable [18F]UCB-H (uncorrected radiochemical yield) from up to285 GBq (7.7 Ci) of [18F]fluoride (specific activity of 815 ± 185 GBq/μmol and measured purity of99.8 ± 0.5 wt %); this has previously been reported in Warnier et al. [17].
The ligand for the SV2A isoform (SV2AL) was purchased as an injectable solution (levetiracetam,Keppra®, UCB Pharma S.A. Brussels, Belgium). At the present time, there are no commerciallyavailable specific ligands for the other two SV2 isoforms (SV2B and SV2C). The competitors used wereobtained from UCB Pharma s.a.: UCB5203 for SV2B (SV2BL, MW: 236.238 g/mol) and UCB0949 forthe SV2C (SV2CL, MW: 281.197 g/mol). The information on these compounds was supplied by UCBPharma s.a. The respective affinities for the different SV2 isoforms are presented in Table 2.
The competitors were prepared daily in a vehicle composed of distilled water containing 1%methyl cellulose (viscosity: 15 cP, Sigma-Aldrich, Overijse, Belgium) and 5% dimethyl sulphoxide(DMSO, Sigma-Aldrich, Belgium). The concentrations differed depending on the product specificationsand their respective pharmacokinetics, provided by UCB Pharma s.a. The dosing used was 10 mg/kgfor SV2AL, 3 mg/kg for SV2BL, and 3 mg/kg for SV2CL. All solutions were administered through theintraperitoneal (i.p.) route in a total volume of 1 mL per kg of body weight. The animals used as acontrol group (vehicle) received an equal volume of vehicle through the same route of administration.
4.3. In Vitro Binding Assays
Reagents and reference compounds used were of analytical grade and obtained from variouscommercial sources. All cell culture reagents were obtained from Invitrogen (Merelbeke, Belgium).Radioligands (3H-UCB30889, 1184 GBq/mmol; 3H-UCB1418435, 925 GBq/mmol; and 3H-UCB101275-1,1110–1480 GBq/mmol) were obtained from G.E Healthcare, Amersham, UK (now Perkin Elmer,Zaventem, Belgium) and reference compounds (levetiracetam, UCB108649-1 and UCB101275-1) werecustom synthesized and stored according to manufacturer’s recommendations. Test and reference
57

Molecules 2019, 24, 1705
compounds were dissolved in 100% DMSO or H2O to give 1 or 10 mM stock solution. The final DMSOconcentration in assays was 0.1% unless otherwise stated.
Cell lines generated at UCB Biopharma were human embryonic kidney (HEK) 293 cells expressinghuman SV2A, SV2B or SV2C proteins. Cells were cultured in Dulbecco’s Modified Eagle medium. Theculture medium was supplemented with foetal bovine serum (FBS, 10%), 2 mM l-glutamine, 50 to100 U/mL penicillin, 50 to 100 μg/mL streptomycin, and 200 μg/mL hygromycin B. Cells were grown at37 ◦C with 95% air. Confluent cells were detached by 10 min incubation at 37 ◦C in phosphate bufferedsaline (PBS) containing 0.02% EDTA. Culture flasks were washed with 15 mL of ice-cold PBS. Thecell suspension was centrifuged at 1500× g for 10 min at 4 ◦C. The pellet was homogenized in 15 mMTris-HCl buffer (pH 7.5) containing 2 mM MgCl2, 0.3 mM EDTA, and 1 mM EGTA (buffer A) using aglass/teflon homogenizer. The crude homogenate was subjected to a freeze and thaw cycle in liquidnitrogen and DNAse (1 μL/mL) was then added. The homogenate was further incubated for 10 min at25 ◦C before being centrifuged at 40,000× g for 25 min at 4 ◦C. The pellet was re-suspended in buffer Aand washed once under the same conditions. The final crude membrane pellet was re-suspended at aprotein concentration of 1–3 mg/mL in 7.5 mM Tris-HCl buffer (pH 7.5 at 25 ◦C) containing 250 mMsucrose and stored in liquid nitrogen until use.
Membranes were incubated in binding buffer (see Table 3) containing test compound or positivecontrol in the presence of the radioligand. The non-specific binding (NSB) was defined as the residualbinding observed in the presence of a high concentration (1000 fold its Ki) of a specific unlabeledreference compound. Membrane-bound and free radioligands were separated by rapid filtrationthrough glass fiber filters (GF/C). Samples and filters were rinsed using at least 6 mL of washing buffer.The entire filtration procedure did not exceed 10 s per sample. The radioactivity trapped on the filterswas counted by liquid scintillation in a β-counter. To determine the affinity of a compound for a giventarget, competition curves were performed with at least 10 concentrations of compound spanning atleast 5 log units.
Table 3. Details of the in vitro binding assay determination. Percentage of inhibition was calculatedas follows: % INHIBITION = 100 − [((BI − NSB)/(B0 − NSB)) × 100], where B0 and BI representthe binding observed in the absence and presence of the test compound, respectively (dpm),NSB is the radioligand non-specific binding (dpm). Raw data were analyzed by non-linearregression using XLfitTM (IDBS, London, Great Britain) according to the following generic equation:B = NSB + [(B0 − NSB)/(1 + (((10X)/(10−pIC50))nH))], where B is the radioligand bound in the presenceof the unlabeled compound (dpm), NSB is the radioligand non-specific binding (dpm), B0 is theradioligand bound in the absence of unlabeled compound (dpm), X is the concentration of unlabeledcompound (log M), pIC50 is the concentration of unlabeled compound that inhibits the radioligandspecific binding by 50% (−log M), and nH is the Hill coefficient.
In Vitro Binding Details hSV2A Assay hSV2B hSV2C
Binding buffer 50 mM Tris-HCl (pH 7.4) containing 2 mM MgCl2
Filtration buffer Ice-cold 50 mM Tris-HCl (pH 7.4)
Incubation time 120 min at 37 ◦C in 0.5 mL 120 min at 37 ◦C in 0.5 mL 120 min at 37 ◦C in 0.2 mL
Radioligand 3H-UCB30889 (4 nM) 3H-UCB1418435 (8 nM) 3H-UCB101275-1 (20 nM)
Proteins75–125 μg
HEK293 membranes2–5 μg
HEK293 membranes40–60 μg
HEK293 membranes
Blocking drugLevetiracetam
(1 mM)UCB108649-2
(10 μM)UCB101275-1
(100 μM)
4.4. PET Acquisitions
The animals (n = 5 per group) were anesthetized using 4% isoflurane in air at a flow rate of1 L/min during induction and 1.5% to 2% isoflurane in air at 0.6 L/min during maintenance. Respiration
58
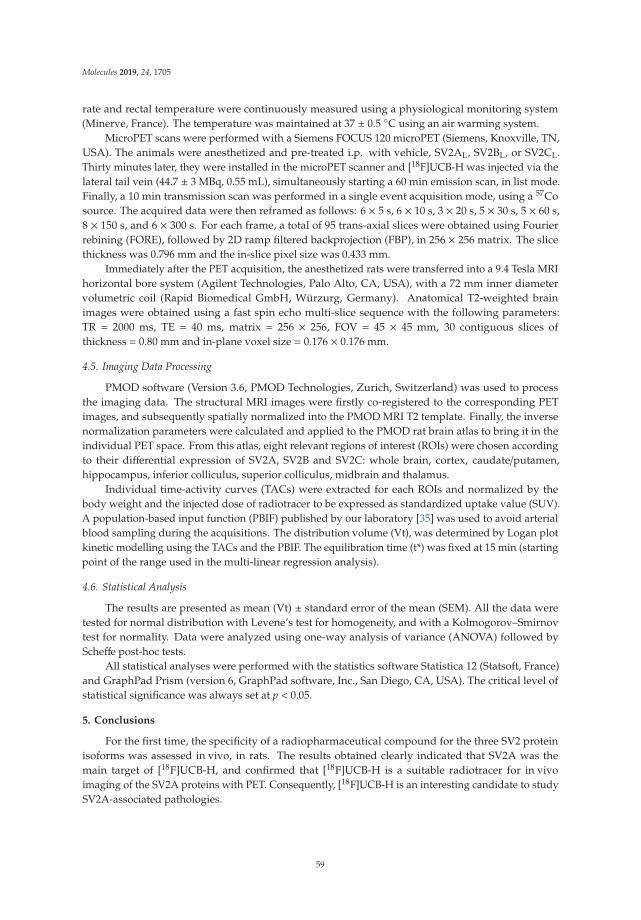
Molecules 2019, 24, 1705
rate and rectal temperature were continuously measured using a physiological monitoring system(Minerve, France). The temperature was maintained at 37 ± 0.5 ◦C using an air warming system.
MicroPET scans were performed with a Siemens FOCUS 120 microPET (Siemens, Knoxville, TN,USA). The animals were anesthetized and pre-treated i.p. with vehicle, SV2AL, SV2BL, or SV2CL.Thirty minutes later, they were installed in the microPET scanner and [18F]UCB-H was injected via thelateral tail vein (44.7 ± 3 MBq, 0.55 mL), simultaneously starting a 60 min emission scan, in list mode.Finally, a 10 min transmission scan was performed in a single event acquisition mode, using a 57Cosource. The acquired data were then reframed as follows: 6 × 5 s, 6 × 10 s, 3 × 20 s, 5 × 30 s, 5 × 60 s,8 × 150 s, and 6 × 300 s. For each frame, a total of 95 trans-axial slices were obtained using Fourierrebining (FORE), followed by 2D ramp filtered backprojection (FBP), in 256 × 256 matrix. The slicethickness was 0.796 mm and the in-slice pixel size was 0.433 mm.
Immediately after the PET acquisition, the anesthetized rats were transferred into a 9.4 Tesla MRIhorizontal bore system (Agilent Technologies, Palo Alto, CA, USA), with a 72 mm inner diametervolumetric coil (Rapid Biomedical GmbH, Würzurg, Germany). Anatomical T2-weighted brainimages were obtained using a fast spin echo multi-slice sequence with the following parameters:TR = 2000 ms, TE = 40 ms, matrix = 256 × 256, FOV = 45 × 45 mm, 30 contiguous slices ofthickness = 0.80 mm and in-plane voxel size = 0.176 × 0.176 mm.
4.5. Imaging Data Processing
PMOD software (Version 3.6, PMOD Technologies, Zurich, Switzerland) was used to processthe imaging data. The structural MRI images were firstly co-registered to the corresponding PETimages, and subsequently spatially normalized into the PMOD MRI T2 template. Finally, the inversenormalization parameters were calculated and applied to the PMOD rat brain atlas to bring it in theindividual PET space. From this atlas, eight relevant regions of interest (ROIs) were chosen accordingto their differential expression of SV2A, SV2B and SV2C: whole brain, cortex, caudate/putamen,hippocampus, inferior colliculus, superior colliculus, midbrain and thalamus.
Individual time-activity curves (TACs) were extracted for each ROIs and normalized by thebody weight and the injected dose of radiotracer to be expressed as standardized uptake value (SUV).A population-based input function (PBIF) published by our laboratory [35] was used to avoid arterialblood sampling during the acquisitions. The distribution volume (Vt), was determined by Logan plotkinetic modelling using the TACs and the PBIF. The equilibration time (t*) was fixed at 15 min (startingpoint of the range used in the multi-linear regression analysis).
4.6. Statistical Analysis
The results are presented as mean (Vt) ± standard error of the mean (SEM). All the data weretested for normal distribution with Levene’s test for homogeneity, and with a Kolmogorov–Smirnovtest for normality. Data were analyzed using one-way analysis of variance (ANOVA) followed byScheffe post-hoc tests.
All statistical analyses were performed with the statistics software Statistica 12 (Statsoft, France)and GraphPad Prism (version 6, GraphPad software, Inc., San Diego, CA, USA). The critical level ofstatistical significance was always set at p < 0.05.
5. Conclusions
For the first time, the specificity of a radiopharmaceutical compound for the three SV2 proteinisoforms was assessed in vivo, in rats. The results obtained clearly indicated that SV2A was themain target of [18F]UCB-H, and confirmed that [18F]UCB-H is a suitable radiotracer for in vivoimaging of the SV2A proteins with PET. Consequently, [18F]UCB-H is an interesting candidate to studySV2A-associated pathologies.
59

Molecules 2019, 24, 1705
Supplementary Materials: The following are available online. Figure S1: TACs extracted from the eight ROIs,and normalized by the injected activities and the body weight. Lines represent the [18F]UCB-H uptake over a60 min acquisition after pre-treatment with the vehicle, SV2AL, SV2BL, or SV2CL (mean ± SEM; n = 5).
Author Contributions: Conceptualization, M.E.S., G.B., A.S. and A.P.; methodology, M.A.B., A.S.; formal analysis,M.E.S., G.B., M.A.B., A.S. and A.P.; investigation, M.E.S. and G.B.; resources, N.M., J.M., F.M., F.G., C.L. and A.L.;data curation, M.A.B.; writing—original draft preparation, M.E.S.; writing—review and editing, G.B., M.A.B., A.S.,N.M., J.M., F.M., F.G., C.L., E.S., A.L. and A.P.; visualization, M.E.S., M.A.B. and A.P.; supervision, A.L. and A.P.;project administration, E.S. and A.P.; funding acquisition, A.P.
Funding: This research was funded by the University of Liège grant 13/17-07 and UCB Pharma s.a. as partners.The SV2BL (UCB5203) and SV2CL (UCB0949) ligands were provided by UCB Pharma s.a., compound structuresand specifications being confidential. M.E.S. is supported by the University of Liège grant 13/17-07. A.P. is researchdirector from F.R.S.-FNRS Belgium. J.M. and N.M. are UCB Pharma s.a. employees. F.M. and F.G. are Nucleiss.a. employees.
Conflicts of Interest: The authors declare no conflict of interest. The funders had no role in the design of thestudy; in the collection, analyses, or interpretation of data; in the writing of the manuscript, or in the decision topublish the results.
References
1. Buckley, K.; Kelly, R.B. Identification of a Transmembrane Glycoprotein Specific for Secretory Vesicles ofNeural and Endocrine Cells. J. Cell Biol. 1985, 100, 1284–1294. [CrossRef] [PubMed]
2. Finnema, S.J.; Nabulsi, N.B.; Eid, T.; Detyniecki, K.; Lin, S.-F.; Chen, M.-K.; Dhaher, R.; Matuskey, D.; Baum, E.;Holden, D.; et al. Imaging synaptic density in the living human brain. Sci. Transl. Med. 2016, 8, 348ra96.[CrossRef] [PubMed]
3. Mercier, J.; Provins, L.; Valade, A. Discovery and development of SV2A PET tracers: Potential for imagingsynaptic density and clinical applications. Drug Discov. Today Technol. 2017, 25, 45–52. [CrossRef]
4. Custer, K.L.; Austin, N.S.; Sullivan, J.M.; Bajjalieh, S.M. Synaptic Vesicle Protein 2 Enhances Release Probabilityat Quiescent Synapses. J. Neurosci. 2006, 26, 1303–1313. [CrossRef] [PubMed]
5. Van Vliet, E.A.; Aronica, E.; Redeker, S.; Boer, K.; Gorter, J.A. Decreased expression of synaptic vesicleprotein 2A, the binding site for levetiracetam, during epileptogenesis and chronic epilepsy. Epilepsia 2009, 50,422–433. [CrossRef] [PubMed]
6. Bartholome, O.; Van den Ackerveken, P.; Sánchez Gil, J.; de la Brassinne Bonardeaux, O.; Leprince, P.;Franzen, R.; Rogister, B. Puzzling Out Synaptic Vesicle 2 Family Members Functions. Front. Mol. Neurosci.2017, 10, 148. [CrossRef]
7. Crèvecœur, J.; Foerch, P.; Doupagne, M.; Thielen, C.; Vandenplas, C.; Moonen, G.; Deprez, M.; Rogister, B.Expression of SV2 isoforms during rodent brain development. BMC Neurosci. 2013, 14, 87. [CrossRef][PubMed]
8. Bajjalieh, S.M.; Frantz, G.D.; Weimann, J.M.; McConnell, S.K.; Scheller, R.H. Differential expression of synapticvesicle protein 2 (SV2) isoforms. J. Neurosci. 1994, 14, 5223–5235. [CrossRef]
9. Janz, R.; Südhof, T.C. SV2C is a synaptic vesicle protein with an unusually restricted localization: anatomy ofa synaptic vesicle protein family. Neuroscience 1999, 94, 1279–1290. [CrossRef]
10. Bajjalieh, S.M.; Peterson, K.; Linial, M.; Scheller, R.H. Brain contains two forms of synaptic vesicle protein 2.Proc. Natl. Acad. Sci. USA 1993, 90, 2150–2154. [CrossRef]
11. Stahl, S.M. Psychopharmacology of anticonvulsants: levetiracetam as a synaptic vesicle protein modulator.J. Clin. Psychiatry 2004, 65, 1162–1163. [CrossRef] [PubMed]
12. Matagne, A.; Margineanu, D.-G.; Kenda, B.; Michel, P.; Klitgaard, H. Anti-convulsive and anti-epilepticproperties of brivaracetam (ucb 34714), a high-affinity ligand for the synaptic vesicle protein, SV2A.Br. J. Pharmacol. 2008, 154, 1662–1671. [CrossRef] [PubMed]
13. Kaminski, R.M.; Gillard, M.; Leclercq, K.; Hanon, E.; Lorent, G.; Dassesse, D.; Matagne, A.; Klitgaard, H.Proepileptic phenotype of SV2A-deficient mice is associated with reduced anticonvulsant efficacy oflevetiracetam. Epilepsia 2009, 50, 1729–1740. [CrossRef] [PubMed]
14. Lynch, B.A.; Lambeng, N.; Nocka, K.; Kensel-Hammes, P.; Bajjalieh, S.M.; Matagne, A.; Fuks, B. The synapticvesicle protein SV2A is the binding site for the antiepileptic drug levetiracetam. Proc. Natl. Acad. Sci. USA2004, 101, 9861–9866. [CrossRef] [PubMed]
60
Molecules 2019, 24, 1705
15. Bretin, F.; Bahri, M.A.; Bernard, C.; Warnock, G.; Aerts, J.; Mestdagh, N.; Buchanan, T.; Otoul, C.; Koestler, F.;Mievis, F.; et al. Biodistribution and Radiation Dosimetry for the Novel SV2A Radiotracer [18F]UCB-H:First-in-Human Study. Mol. Imaging Biol. 2015, 17, 557–564. [CrossRef] [PubMed]
16. Bretin, F.; Warnock, G.; Bahri, M.A.; Aerts, J.; Mestdagh, N.; Buchanan, T.; Valade, A.; Mievis, F.; Giacomelli, F.;Lemaire, C.; et al. Preclinical radiation dosimetry for the novel SV2A radiotracer [18F]UCB-H. EJNMMI Res.2013, 3, 35. [CrossRef]
17. Warnier, C.; Lemaire, C.; Becker, G.; Zaragoza, G.; Giacomelli, F.; Aerts, J.; Otabashi, M.; Bahri, M.A.;Mercier, J.; Plenevaux, A.; et al. Enabling Efficient Positron Emission Tomography (PET) Imaging of SynapticVesicle Glycoprotein 2A (SV2A) with a Robust and One-Step Radiosynthesis of a Highly Potent 18F-LabeledLigand ([18F]UCB-H). J. Med. Chem. 2016, 59, 8955–8966. [CrossRef] [PubMed]
18. Nabulsi, N.B.; Mercier, J.; Holden, D.; Carre, S.; Najafzadeh, S.; Vandergeten, M.-C.; Lin, S.-F.; Deo, A.;Price, N.; Wood, M.; et al. Synthesis and Preclinical Evaluation of 11C-UCB-J as a PET Tracer for Imaging theSynaptic Vesicle Glycoprotein 2A in the Brain. J. Nucl. Med. 2016, 57, 777–784. [CrossRef] [PubMed]
19. Cai, H.; Mangner, T.J.; Muzik, O.; Wang, M.-W.; Chugani, D.C.; Chugani, H.T. Radiosynthesis of11C-levetiracetam: A potential marker for PET imaging of SV2A expression. ACS Med. Chem. Lett.2014, 5, 1152–1155. [CrossRef]
20. Estrada, S.; Lubberink, M.; Thibblin, A.; Sprycha, M.; Buchanan, T.; Mestdagh, N.; Kenda, B.; Mercier, J.;Provins, L.; Gillard, M.; et al. [11C]UCB-A, a novel PET tracer for synaptic vesicle protein 2 A. Nucl. Med. Biol.2016, 43, 325–332. [CrossRef] [PubMed]
21. Heurling, K.; Ashton, N.J.; Leuzy, A.; Zimmer, E.R.; Blennow, K.; Zetterberg, H.; Eriksson, J.; Lubberink, M.;Schöll, M. Synaptic vesicle protein 2A as a potential biomarker in synaptopathies. Mol. Cell. Neurosci. 2019.[CrossRef] [PubMed]
22. Rabiner, E.A. Imaging Synaptic Density: A Different Look at Neurologic Diseases. J. Nucl. Med. 2018, 59,380–381. [CrossRef] [PubMed]
23. Cai, Z.; Li, S.; Matuskey, D.; Nabulsi, N.; Huang, Y. PET imaging of synaptic density: A new tool forinvestigation of neuropsychiatric diseases. Neurosci. Lett. 2019, 691, 44–50. [CrossRef] [PubMed]
24. Li, S.; Cai, Z.; Wu, X.; Holden, D.; Pracitto, R.; Kapinos, M.; Gao, H.; Labaree, D.; Nabulsi, N.; Carson, R.E.; et al.Synthesis and in Vivo Evaluation of a Novel PET Radiotracer for Imaging of Synaptic Vesicle Glycoprotein2A (SV2A) in Nonhuman Primates. ACS Chem. Neurosci. 2019, 10, 1544–1554. [CrossRef] [PubMed]
25. Bahri, M.A.; Plenevaux, A.; Aerts, J.; Bastin, C.; Becker, G.; Mercier, J.; Valade, A.; Buchanan, T.; Mestdagh, N.;Ledoux, D.; et al. Measuring brain synaptic vesicle protein 2A with positron emission tomography and[18F]UCB-H. Alzheimer’s Dement. 2017, 3, 481–486.
26. Serrano, M.E.; Bahri, M.A.; Becker, G.; Seret, A.; Mievis, F.; Giacomelli, F.; Lemaire, C.; Salmon, E.; Luxen, A.;Plenevaux, A. Quantification of [18F]UCB-H Binding in the Rat Brain: From Kinetic Modelling to StandardisedUptake Value. Mol. Imaging Biol. 2018. [CrossRef] [PubMed]
27. Hanaya, R.; Hosoyama, H.; Sugata, S.; Tokudome, M.; Hirano, H.; Tokimura, H.; Kurisu, K.; Serikawa, T.;Sasa, M.; Arita, K. Low distribution of synaptic vesicle protein 2A and synaptotagimin-1 in the cerebral cortexand hippocampus of spontaneously epileptic rats exhibiting both tonic convulsion and absence seizure.Neuroscience 2012, 221, 12–20. [CrossRef] [PubMed]
28. Clegg, N.; Ferguson, C.; True, L.D.; Arnold, H.; Moorman, A.; Quinn, J.E.; Vessella, R.L.; Nelson, P.S. Molecularcharacterization of prostatic small-cell neuroendocrine carcinoma. Prostate 2003, 55, 55–64. [CrossRef][PubMed]
29. Dardou, D.; Monlezun, S.; Foerch, P.; Courade, J.P.; Cuvelier, L.; de Ryck, M.; Schiffmann, S.N. A role for Sv2cin basal ganglia functions. Brain Res. 2013, 1507, 61–73. [CrossRef]
30. Altmann, V.; Schumacher-Schuh, A.F.; Rieck, M.; Callegari-Jacques, S.M.; Rieder, C.R.; Hutz, M.H. Influenceof genetic, biological and pharmacological factors on levodopa dose in Parkinson’s disease. Pharmacogenomics2016, 17, 481–488. [CrossRef] [PubMed]
31. Dunn, A.R.; Stout, K.A.; Ozawa, M.; Lohr, K.M.; Hoffman, C.A.; Bernstein, A.I.; Li, Y.; Wang, M.; Sgobio, C.;Sastry, N.; et al. Synaptic vesicle glycoprotein 2C (SV2C) modulates dopamine release and is disrupted inParkinson disease. Proc. Natl. Acad. Sci. USA 2017, 114, E2253–E2262. [CrossRef] [PubMed]
32. Karp, J.S.; Daube-Witherspoon, M.E.; Muehllehner, G. Factors affecting accuracy and precision in PET volumeimaging. J. Cereb. Blood Flow Metab. 1991, 11, A38–A44. [CrossRef] [PubMed]
61

Molecules 2019, 24, 1705
33. Aston, J.A.D.; Cunningham, V.J.; Asselin, M.-C.; Hammers, A.; Evans, A.C.; Gunn, R.N. Positron emissiontomography partial volume correction: estimation and algorithms. J. Cereb. Blood Flow Metab. 2002, 22,1019–1034. [CrossRef] [PubMed]
34. Dardou, D.; Dassesse, D.; Cuvelier, L.; Deprez, T.; De Ryck, M.; Schiffmann, S.N. Distribution of SV2C mRNAand protein expression in the mouse brain with a particular emphasis on the basal ganglia system. Brain Res.2011, 1367, 130–145. [CrossRef] [PubMed]
35. Becker, G.; Warnier, C.; Serrano, M.E.; Bahri, M.A.; Mercier, J.; Lemaire, C.; Salmon, E.; Luxen, A.; Plenevaux, A.Pharmacokinetic Characterization of [18F]UCB-H PET Radiopharmaceutical in the Rat Brain. Mol. Pharm.2017, 14, 2719–2725. [CrossRef]
36. Warnock, G.I.; Aerts, J.; Bahri, M.A.; Bretin, F.; Lemaire, C.; Giacomelli, F.; Mievis, F.; Mestdagh, N.;Buchanan, T.; Valade, A.; et al. Evaluation of 18F-UCB-H as a novel PET tracer for synaptic vesicle protein2A in the brain. J. Nucl. Med. 2014, 55, 1336–1341. [CrossRef] [PubMed]
37. Kilkenny, C.; Browne, W.; Cuthill, I.; Emerson, M.; Altman, D. Improving bioscience research reporting:The ARRIVE guidelines for reporting animal research. J. Pharmacol. Pharmacother. 2010, 1, 94. [CrossRef][PubMed]
Sample Availability: Not available.
© 2019 by the authors. Licensee MDPI, Basel, Switzerland. This article is an open accessarticle distributed under the terms and conditions of the Creative Commons Attribution(CC BY) license (http://creativecommons.org/licenses/by/4.0/).
62

molecules
Article
In Vitro and In Vivo Characterization ofDibenzothiophene Derivatives [125I]Iodo-ASEM and[18F]ASEM as Radiotracers of Homo- and Heteromericα7 Nicotinic Acetylcholine Receptors
Cornelius K. Donat 1,2,*, Henrik H. Hansen 1, Hanne D. Hansen 1, Ronnie C. Mease 3,
Andrew G. Horti 3, Martin G. Pomper 3, Elina T. L’Estrade 1,4,5, Matthias M. Herth 4,5,
Dan Peters 6, Gitte M. Knudsen 1 and Jens D. Mikkelsen 1,*1 Neurobiology Research Unit, Copenhagen University Hospital, Rigshospitalet, DK-2100 Copenhagen,
Denmark; [email protected] (H.H.H.); [email protected] (H.D.H.); [email protected] (E.T.L.);[email protected] (G.M.K.)
2 Department of Brain Sciences, Imperial College London, London W12 0 LS, UK3 Russell H. Morgan Department of Radiology and Radiological Science, The Johns Hopkins University School
of Medicine, Baltimore, MD 21287, USA; [email protected] (R.C.M.); [email protected] (A.G.H.);[email protected] (M.G.P.)
4 Department of Drug Design and Pharmacology, University of Copenhagen, Jagtvej 162, 2100 Copenhagen,Denmark; [email protected]
5 Department of Clinical Physiology, Nuclear Medicine & PET, Rigshospitalet, Blegdamsvej 9,2100 Copenhagen, Denmark
6 DanPET AB, 216 19 Malmö, Sweden; [email protected]* Correspondence: [email protected] (C.K.D.); [email protected] (J.D.M.);
Tel.: +45-40205378 (J.D.M)
Academic Editor: Peter BrustReceived: 24 January 2020; Accepted: 27 February 2020; Published: 20 March 2020
Abstract: The α7 nicotinic acetylcholine receptor (α7 nAChR) is involved in several cognitive andphysiologic processes; its expression levels and patterns change in neurologic and psychiatric diseases,such as schizophrenia and Alzheimer’s disease, which makes it a relevant drug target. Developmentof selective radioligands is important for defining binding properties and occupancy of novelmolecules targeting the receptor. We tested the in vitro binding properties of [125I]Iodo-ASEM[(3-(1,4-diazabycyclo[3.2.2]nonan-4-yl)-6-(125I-iododibenzo[b,d]thiopentene 5,5-dioxide)] in themouse, rat and pig brain using autoradiography. The in vivo binding properties of [18F]ASEMwere investigated using positron emission tomography (PET) in the pig brain. [125I]Iodo-ASEMshowed specific and displaceable high affinity (~1 nM) binding in mouse, rat, and pig brain. Bindingpattern overlapped with [125I]α-bungarotoxin, specific binding was absent inα7 nAChR gene-deficientmice and binding was blocked by a range ofα7 nAChR orthosteric modulators in an affinity-dependentorder in the pig brain. Interestingly, relative to the wild-type, binding in β2 nAChR gene-deficientmice was lower for [125I]Iodo-ASEM (58% ± 2.7%) than [125I]α-bungarotoxin (23% ± 0.2%), potentiallyindicating different binding properties to heteromeric α7β2 nAChR. [18F]ASEM PET in the pig showedhigh brain uptake and reversible tracer kinetics with a similar spatial distribution as previouslyreported for α7 nAChR. Blocking with SSR-180,711 resulted in a significant decrease in [18F]ASEMbinding. Our findings indicate that [125I]Iodo-ASEM allows sensitive and selective imaging of α7nAChR in vitro, with better signal-to-noise ratio than previous tracers. Preliminary data of [18F]ASEMin the pig brain demonstrated principal suitable kinetic properties for in vivo quantification of α7nAChR, comparable to previously published data.
Keywords: alpha 7; nicotinic acetylcholine receptors; PET; nAChR; autoradiography
Molecules 2020, 25, 1425; doi:10.3390/molecules25061425 www.mdpi.com/journal/molecules63

Molecules 2020, 25, 1425
1. Introduction
The α7 nicotinic acetylcholine receptor (α7 nAChR) belongs to the superfamily of ligand-gated ionchannels and is expressed across all mammalian species [1–4]. The receptor plays an important role incognition [5], mood [6] and consistent with this, α7 nAChR are particularly abundant in hippocampusand prefrontal cortex [7,8]. Furthermore, α7 nAChR are implied in neuro-immune [9] and immunefunctions [10] under homeostatic conditions.
Changes in protein and mRNA levels of α7 nAChR have been reported in a number ofneuropsychiatric and neurodegenerative diseases [1,11–15]. Notably, certain polymorphisms in thepromoter region of the α7 nAChR gene (CHRNA7) [16] are probable risk factors for neuropsychiatricdiseases, such as major depression [17] and schizophrenia [18] and are associated with developmentaldisorders and cognitive impairments [19]. Additionally, α7 nAChRs are expressed by several centraland peripheral immune cells and activation via agonists and positive allosteric modulators showedneuroprotective and immunomodulatory efficacy in different preclinical disease models [20–24].
Changes of α7 nAChR in the healthy and diseased brain can only be detected in vivo by molecularimaging, such as positron emission tomography (PET) using specific radiotracers. A clinically usableradiotracer requires sufficient selectivity, specificity and suitable affinity, depending on the target [25].Most of the previously described α7 nAChR PET tracers, among those [18F]NS14490, [11C]NS14492,[11C]CHIBA-1001 and [11C]A-582941 (Table 1), studied in mice, pigs and non-human primates exhibitedsome shortcomings, such as poor specific and/or high nonspecific binding or radiometabolites crossingthe blood–brain barrier [26–32]. Furthermore, the specificity of novel α7 nAChR tracers has not alwaysbeen tested in respective gene-deficient mice, e.g., using in vitro autoradiography.
While development of novel tracers from different lead structures is still ongoing [33–37],tilorone [38] provided a lead-structure for a number of derivatives subsequently developed into α7nAChR PET tracers. From those, [18F]ASEM (JHU82132) [39] and the structurally related [18F]DBT-10(JHU82108) [40] have been most widely investigated. Initial studies have shown that ASEM is apotent antagonist [39] with subnanomolar affinity and high selectivity [39,41], further substantiatedby the radiolabelled compounds [18F]ASEM [26] and [125I]Iodo-ASEM [42] as tested in human andrat recombinant α7 nAChR. [18F]ASEM and [125I]Iodo-ASEM readily enter the mouse brain, aredisplaceable, and accumulate in regions with highest α7 nAChR density [26,39,42,43].
More recent studies using [18F]ASEM and [18F]DBT-10 further supported the suitability of thetracers, showing high and reversible brain uptake with a regional binding pattern consistent withthe distribution of α7 nAChR receptors in the non-human primate brain [39,44,45]. Favourablebrain pharmacokinetics, excellent test-retest reproducibility and regional uptake [18F]ASEM patternconsistent with post-mortem α7 nAChR distribution have been reported in human PET studies [43,46].Several recent studies extended the available data in human subjects, showing good agreementwith previous distribution volumes (VT) and test-retest values in nonhuman primates and healthyvolunteers [44]. A study in ageing subjects showed a significant positive correlation between ageand [18F]ASEM VT in striatum and several cortical regions [47], however without any correlationbetween VT and cognitive measures. A small sample of individuals with schizophrenia on stableantipsychotic medication showed lower [18F]ASEM VT in cingulate cortex and hippocampus [46]and individuals with recent onset of psychosis were also reported to show lower [18F]ASEM VT inhippocampus, after controlling for age [48]. Interestingly, patients with mild cognitive impairmentshowed higher [18F]ASEM VT when adjusted for age as compared to the control group [49], consistentwith post-mortem findings from patients and animal models. Additionally, [18F]ASEM has beenemployed in a rat 6-OHDA lesion model of Parkinson’s disease, showing an initial increase of[18F]ASEM SUVr in the ipsilateral striatum and substantia nigra between 3 and 7 days, which coincidedwith several histology markers of glia activation [50].
64

Molecules 2020, 25, 1425
While this data shows the general applicability of [18F]ASEM, binding properties and interpretationof novel α7 nAChR tracers might be complicated by the fact that α7 subunits can form heteromericreceptors together with other subunits, specifically β2 [51]. These receptors can be heterologouslyexpressed in oocytes and are found in the rodent and human basal forebrain and cortex [52,53].While these heteromeric receptors display different pharmacological properties [52,54], it is not clearhow this translates to radiotracer binding. In vitro binding studies of [18F]ASEM or [125I]ASEM ingene-deficient mice could answer the question, and would also reveal the suitability of [125I]ASEM forin vitro autoradiographic studies. The latter would offer a better comparability to in vivo PET dataover the current gold-standard tracer [125I]α-bungarotoxin. We therefore investigated the potentialof [125I]ASEM for in vitro studies of the α7 nAChR, by comparing binding of [125I]Iodo-ASEM in rat,mouse and pig brain sections. Furthermore, [18F]ASEM was characterized for in vivo brain uptakeand target selectivity in a PET study conducted in the pig.
Table 1. Common α7 nAChR ligands and their structure, previously evaluated as radiotracers.
Tracer Structure
[11C]CHIBA-1001
[11C]A-582941
[18F]NS14490
[11C]NS14492
[18F]ASEM
[18F]DBT-10
[125I]ASEM
2. Results
2.1. In Vitro Autoradiography
Cerebral binding of [125I]Iodo-ASEM was investigated across several mammalian species, i.e.,rat (Figure 1A, upper row), mouse (Figure 2A) and pig brain (Figure 1A, lower row) and compared to[125I]α-bungarotoxin (Figure 1B/2B). Total cortical [125I]Iodo-ASEM binding was highest in the pig, andlower in the rat and mouse (Figures 1C and 2C), as compared to [125I]α-bungarotoxin. [125I]Iodo-ASEMbinding was displaceable with (-)-nicotine (1 mMol/L, data not shown) and SSR-180,711 (10 μMol/L,Figures 1A and 2A, nonspecific binding) in all species.
65

Molecules 2020, 25, 1425
Figure 1. (A,B) Representative autoradiographs showing [125I]Iodo-ASEM and [125I]α-bungarotoxintotal and non-specific binding (determined with 1 mMol/L (-)-nicotine for [125I]α-bungarotoxin and10 μMol/L SSR-180,711 for [125I]Iodo-ASEM) in 12 μm sections of the rat (upper row) and pig brain(lower row). Arrowheads indicate residual white matter binding. (C) Comparative quantitative analysisof specific binding (± S.E.M.) of [125I]Iodo-ASEM and [125I]α-bungarotoxin from autoradiography inthe rat (n = 1) and pig cortex (n = 2). All autoradiographic experiments and quantifications are carriedout in 3-4 sections per animal.
A non-specific binding component remained detectable under the described experimentalconditions at low levels in white matter structures (arrowheads, Figures 1A and 2A). The distributionpattern of [125I]Iodo-ASEM binding in the rat, mouse and pig brain was comparable to that of[125I]α-bungarotoxin (Figures 1B and 2B). In the pig, [125I]Iodo-ASEM showed a laminar bindingpattern in the frontal cortex, with highest density in cortical layers (1–3) (Figure 1A, lower row), whilein the rat, binding in motor, cingulate and somatosensory cortex was more prominent in layers 5–6.However, this species difference was also observed for [125I]α-bungarotoxin (Figure 1B).
Figure 2. (A,B) Representative autoradiographs showing total [125I]Iodo-ASEM (A) and [125I]a-bungarotoxin(B) and non-specific (determined with 1 mMol/L (-)-nicotine for [125I]α-bungarotoxin and 10 μMol/LSSR-180,711 for [125I]Iodo-ASEM) binding in 12 μm brain sections of α7 and β2 nAChR wild-typevs. corresponding gene-deficient (def) mice (n = 1 each). Arrowheads indicate residual white matterbinding. (C) Comparative quantitative analysis of specific binding (± S.E.M.) of [125I]Iodo-ASEM and[125I]a-bungarotoxin in α7 and β2 nAChR wild-type vs. corresponding gene-deficient mice (n = 1).All autoradiographic experiments and quantifications are carried out in 3-6 sections per animal.
66
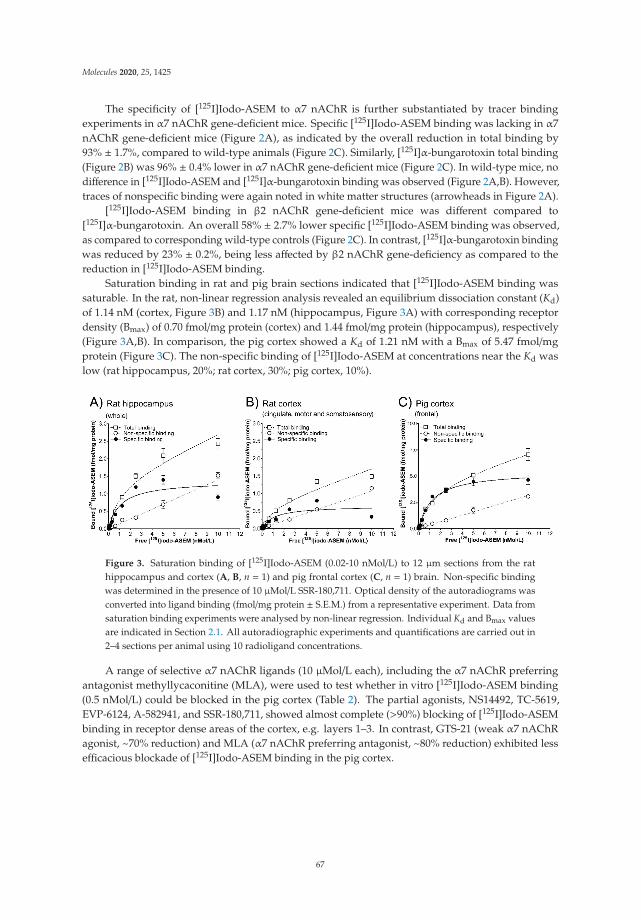
Molecules 2020, 25, 1425
The specificity of [125I]Iodo-ASEM to α7 nAChR is further substantiated by tracer bindingexperiments in α7 nAChR gene-deficient mice. Specific [125I]Iodo-ASEM binding was lacking in α7nAChR gene-deficient mice (Figure 2A), as indicated by the overall reduction in total binding by93% ± 1.7%, compared to wild-type animals (Figure 2C). Similarly, [125I]α-bungarotoxin total binding(Figure 2B) was 96% ± 0.4% lower in α7 nAChR gene-deficient mice (Figure 2C). In wild-type mice, nodifference in [125I]Iodo-ASEM and [125I]α-bungarotoxin binding was observed (Figure 2A,B). However,traces of nonspecific binding were again noted in white matter structures (arrowheads in Figure 2A).
[125I]Iodo-ASEM binding in β2 nAChR gene-deficient mice was different compared to[125I]α-bungarotoxin. An overall 58% ± 2.7% lower specific [125I]Iodo-ASEM binding was observed,as compared to corresponding wild-type controls (Figure 2C). In contrast, [125I]α-bungarotoxin bindingwas reduced by 23% ± 0.2%, being less affected by β2 nAChR gene-deficiency as compared to thereduction in [125I]Iodo-ASEM binding.
Saturation binding in rat and pig brain sections indicated that [125I]Iodo-ASEM binding wassaturable. In the rat, non-linear regression analysis revealed an equilibrium dissociation constant (Kd)of 1.14 nM (cortex, Figure 3B) and 1.17 nM (hippocampus, Figure 3A) with corresponding receptordensity (Bmax) of 0.70 fmol/mg protein (cortex) and 1.44 fmol/mg protein (hippocampus), respectively(Figure 3A,B). In comparison, the pig cortex showed a Kd of 1.21 nM with a Bmax of 5.47 fmol/mgprotein (Figure 3C). The non-specific binding of [125I]Iodo-ASEM at concentrations near the Kd waslow (rat hippocampus, 20%; rat cortex, 30%; pig cortex, 10%).
Figure 3. Saturation binding of [125I]Iodo-ASEM (0.02-10 nMol/L) to 12 μm sections from the rathippocampus and cortex (A, B, n = 1) and pig frontal cortex (C, n = 1) brain. Non-specific bindingwas determined in the presence of 10 μMol/L SSR-180,711. Optical density of the autoradiograms wasconverted into ligand binding (fmol/mg protein ± S.E.M.) from a representative experiment. Data fromsaturation binding experiments were analysed by non-linear regression. Individual Kd and Bmax valuesare indicated in Section 2.1. All autoradiographic experiments and quantifications are carried out in2–4 sections per animal using 10 radioligand concentrations.
A range of selective α7 nAChR ligands (10 μMol/L each), including the α7 nAChR preferringantagonist methyllycaconitine (MLA), were used to test whether in vitro [125I]Iodo-ASEM binding(0.5 nMol/L) could be blocked in the pig cortex (Table 2). The partial agonists, NS14492, TC-5619,EVP-6124, A-582941, and SSR-180,711, showed almost complete (>90%) blocking of [125I]Iodo-ASEMbinding in receptor dense areas of the cortex, e.g. layers 1–3. In contrast, GTS-21 (weak α7 nAChRagonist, ~70% reduction) and MLA (α7 nAChR preferring antagonist, ~80% reduction) exhibited lessefficacious blockade of [125I]Iodo-ASEM binding in the pig cortex.
67
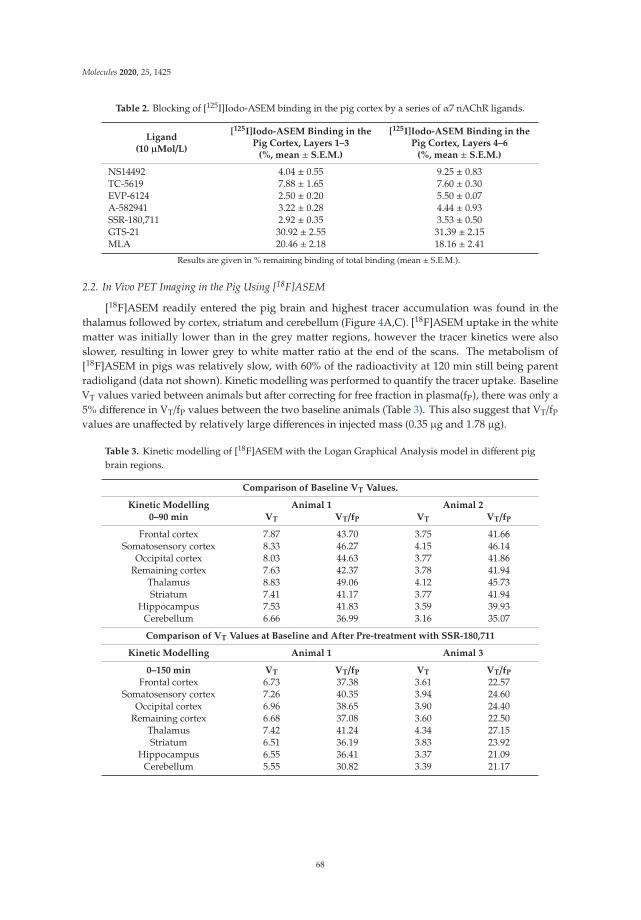
Molecules 2020, 25, 1425
Table 2. Blocking of [125I]Iodo-ASEM binding in the pig cortex by a series of α7 nAChR ligands.
Ligand(10 μMol/L)
[125I]Iodo-ASEM Binding in thePig Cortex, Layers 1–3
(%, mean ± S.E.M.)
[125I]Iodo-ASEM Binding in thePig Cortex, Layers 4–6
(%, mean ± S.E.M.)
NS14492 4.04 ± 0.55 9.25 ± 0.83TC-5619 7.88 ± 1.65 7.60 ± 0.30EVP-6124 2.50 ± 0.20 5.50 ± 0.07A-582941 3.22 ± 0.28 4.44 ± 0.93SSR-180,711 2.92 ± 0.35 3.53 ± 0.50GTS-21 30.92 ± 2.55 31.39 ± 2.15MLA 20.46 ± 2.18 18.16 ± 2.41
Results are given in % remaining binding of total binding (mean ± S.E.M.).
2.2. In Vivo PET Imaging in the Pig Using [18F]ASEM
[18F]ASEM readily entered the pig brain and highest tracer accumulation was found in thethalamus followed by cortex, striatum and cerebellum (Figure 4A,C). [18F]ASEM uptake in the whitematter was initially lower than in the grey matter regions, however the tracer kinetics were alsoslower, resulting in lower grey to white matter ratio at the end of the scans. The metabolism of[18F]ASEM in pigs was relatively slow, with 60% of the radioactivity at 120 min still being parentradioligand (data not shown). Kinetic modelling was performed to quantify the tracer uptake. BaselineVT values varied between animals but after correcting for free fraction in plasma(fP), there was only a5% difference in VT/fP values between the two baseline animals (Table 3). This also suggest that VT/fP
values are unaffected by relatively large differences in injected mass (0.35 μg and 1.78 μg).
Table 3. Kinetic modelling of [18F]ASEM with the Logan Graphical Analysis model in different pigbrain regions.
Comparison of Baseline VT Values.
Kinetic Modelling Animal 1 Animal 2
0–90 min VT VT/fP VT VT/fP
Frontal cortex 7.87 43.70 3.75 41.66Somatosensory cortex 8.33 46.27 4.15 46.14
Occipital cortex 8.03 44.63 3.77 41.86Remaining cortex 7.63 42.37 3.78 41.94
Thalamus 8.83 49.06 4.12 45.73Striatum 7.41 41.17 3.77 41.94
Hippocampus 7.53 41.83 3.59 39.93Cerebellum 6.66 36.99 3.16 35.07
Comparison of VT Values at Baseline and After Pre-treatment with SSR-180,711
Kinetic Modelling Animal 1 Animal 3
0–150 min VT VT/fP VT VT/fP
Frontal cortex 6.73 37.38 3.61 22.57Somatosensory cortex 7.26 40.35 3.94 24.60
Occipital cortex 6.96 38.65 3.90 24.40Remaining cortex 6.68 37.08 3.60 22.50
Thalamus 7.42 41.24 4.34 27.15Striatum 6.51 36.19 3.83 23.92
Hippocampus 6.55 36.41 3.37 21.09Cerebellum 5.55 30.82 3.39 21.17
68

Molecules 2020, 25, 1425
In a third animal, we evaluated the specificity of [18F]ASEM binding in vivo, by administeringSSR-180,711 (1 mg/kg) prior to injection of [18F]ASEM. Compared to the baseline studies, we found anincrease in [18F]ASEM uptake in all brain areas investigated (Figure 4A). Quantification of uptake andsubsequent correction for fP revealed that SSR-180,711 administration decreased the VT/fP comparedto baseline (Table 3). Occupancy was computed with the Lassen plot using VT/fP values comparingbaseline data from animal 1 and blocking data from animal 3 (0-150 min scan data). We found that the1 mg/kg SSR-180,711 dose resulted in a 49% occupancy (Figure 4B).
From the Lassen plot, the volume of non-displaceable binding (VND/fP) was found to be 9.2 mL/cm3.When comparing the VND/fP to the VT/fP in the thalamus, we found that 78% of the signal observed inthe thalamus is specific binding, leaving 22% as non-displaceable binding.
In one animal, [18F]ASEM acquisition time was 240 min, which allowed subsequent analysis ofthe time-stability of the parameters estimated with kinetic modelling. Again, the LGA model wasused to determine VT with different scan length and VT values were found to decrease with more timeincluded in the kinetic modelling. Using all data (0–240 min), VT values were 5.4 mL/cm3 (thalamus),5.0 mL/cm3 (frontal cortex) and 4.0 mL/cm3 (cerebellum).
The upper half of the table shows the baseline distribution volumes (VT) values with and withoutcorrection for free fraction in plasma (fP) in two different animals. Bottom part of the table describesVT values with and without correction for (fP) at baseline (animal 1) and after pre-treatment withSSR-180,711 (animal 3). See Table 4 (Material and Methods) for fP values in the individual animals.Because animal 2 was only scanned for 90 min, the acquisition time of animal 1 was truncated to 90 minto allow for comparison.
Figure 4. [18F]ASEM binding in the pig brain. (A) Time-activity curves of [18F]ASEM in three differentanimals: Animal 1, bsl, blue; Animal 2, bsl, black; Animal 3, SSR-180,711 pre-treated, red. The regionsshown are: Thalamus (tha, triangles) and cerebellum (cb, circles). (B) Lassen plot with total distributionvolumes (VT) corrected for free fraction in plasma (fP) using values from animal 1 and animal 3.Each point represents one region of interest (ROI), please refer to the method section for the completelist of ROIs. (C) Summed PET image (0–240 min) from animal 1 showing the distribution of [18F]ASEMin the pig brain. SUV: standard uptake value. Bsl: baseline. SSR: SSR-180,711 (1 mg/kg).
69

Molecules 2020, 25, 1425
3. Discussion
In this study, we investigated binding properties of radiolabelled ASEM in vitro ([125I]Iodo-ASEM]and in vivo ([18F]ASEM). Autoradiography was used to determine the applicability of [125I]Iodo-ASEMfor in vitro assessment of α7 nAChR receptor distribution and occupancy in the mammalian brain.[125I]Iodo-ASEM showed high-affinity and specific binding to α7 nAChR in the rat, mouse and pigbrain. Specific binding was absent in α7 gene-deficient mice, indicating high specificity and selectivity.Saturation binding experiments in rat and pig brain sections revealed low nanomolar Kd values(approximately 1 nM) in both species. Bmax in the pig cortex was considerably higher as compared tothe binding found in the mouse and rat brain cortex. Such species differences are well documented inthe literature, e.g., for metabotropic glutamate 5 receptors and the 18 kDa translocator protein betweenmonkey and humans [55,56]. As affinity and selectivity are major criteria for radiotracers, our datafurther substantiates the suitability of ASEM derivatives as favourable α7 nAChR tracers [57,58]
We found that the affinity of [125I]Iodo-ASEM in the pig brain as determined with autoradiographywas in a similar range as [3H]NS14492 [59]. In contrast, higher affinities and receptor densities arereported for radioligand binding assay in brain homogenates for a number of different α7 nAChRligands, such as [3H]NS14492 and [3H]A-585539 [60], including other dibenzothiophenes [26,38].
Across the brain and specifically regions with high α7 nAChR expression, such as hippocampusand superficial cortical layers, non-specific binding of [125I]Iodo-ASEM at concentrations near the Kd
was low (10%–30% of total binding) and produced a robust specific signal. However, a consistentnonspecific binding component in white matter was observed in all investigated species, in particularthe corpus callosum and subcortical tracts. This is supported by previously reported in vivo findingsin human and non-human primate subjects [39,43], where tracer uptake was lowest in white matterstructures, such as the corpus callosum. Furthermore, we also observed slower in vivo kinetics inwhite matter structures in the pig brain. This could be caused by lower perfusion or kinetics may bedifferent when the tracer interacts with lipid membranes, compared to interaction with the receptor.As in vitro binding conditions are distinctly different due to absent metabolism and blood flow, it ispossible that these effects may limit pronounced non-specific white matter binding in vivo or thatthe nonspecific binding exhibits much slower kinetics. Under the employed incubation conditions,[125I]α-bungarotoxin shows no white matter residual binding. However, under the same conditions,the overall non-specific binding in grey matter for [125I]α-bungarotoxin is approximately 45% in human(data not shown) and 55% in pig brain tissue, where it is much lower for [125I]Iodo-ASEM (~10%–30%).
[125I]Iodo-ASEM binding enables an important distinction between grey and white matterstructures, e.g., the distinct cortical laminar binding pattern observable in the pig. While[125I]Iodo-ASEM binding was prominent in the deeper cortical layers in the mouse and rat, superficialcortical layers were intensely labelled in the pig. Using in vitro autoradiography, similar laminarcortical binding pattern in the pig brain has also recently been reported for a structurally differentα7 nAChR radioligand, [3H]NS14492 [61]. Binding of both tracers was matching the pattern of[125I]α-bungarotoxin, the in vitro gold-standard radioligand for α7 nAChR. However, the spatialbinding pattern in the rodent brain was only similar between [125I]Iodo-ASEM and [125I]α-bungarotoxin,but not for [3H]NS14492, suggesting different binding profiles of antagonists and agonists, or speciesdifferences in affinity.
[125I]Iodo-ASEM proved specific to the α7 nAChR, as evidenced by the lack of specific binding inα7 nAChR gene-deficient mice and a virtually complete block of cortical [125I]Iodo-ASEM binding by awide range of structurally different α7 nAChR selective ligands and MLA, with the rank order beingNS14492=TC-5619=EVP-6124=A-582941=SSR-180,711>MLA>GTS-21. While this corresponds wellwith the individual high affinities in the nanomolar range (NS14492, TC5619, EVP-6124, A-582941,SSR-180,711) [31,62–65], as compared to the lower affinity of a partial agonist (GTS-21) [66], it could alsoreflect the general differences between antagonists and agonist in terms of binding sites and kinetics.
70

Molecules 2020, 25, 1425
When comparing to [125I]α-bungarotoxin, the specific binding of [125I]Iodo-ASEM was lower inthe rat and mouse brain, but higher in the pig cortex. While species differences in receptor structuremay account for the discrepancies, it should also be considered that different incubation protocolswere used for the determination of optimal [125I]Iodo-ASEM and [125I]α-bungarotoxin binding. Hence,a relatively high detergent concentration was required in the experiments to obtain optimal totaltissue binding of [125I]Iodo-ASEM, which may potentially affect binding of the radioligand in themammalian species tested, e.g., through differences in lipid content and myelination. For example,[125I]Iodo-ASEM showed some degree of non-displaceable binding to white matter structures, whichcould be caused by the ligands’ lipophilicity and/or different kinetics in white matter structures.
Interestingly, radioligand binding in β2 nAChR gene-deficient mice was more strongly reducedfor [125I]Iodo-ASEM than [125I]α-bungarotoxin. This observation suggests different binding propertiesand subtype selectivity to heteromeric α7β2 nAChR, compared to the homomeric receptors. In the CNS,heteromeric α7β2 nAChR are identified in the mouse forebrain and hippocampal neurons, rat basalforebrain cholinergic neurons, as well as in the human basal forebrain and cerebral cortex. Importantly,α7β2 nAChR display distinct functional properties as compared to homomeric α7 nAChR [51,67],owing to their slower whole cell decay kinetics and current amplitudes in both transfected cellsystems and native rodent neurons [53,54,68–70]. Accordingly, co-expression of α7 and β2 nAChRsubunits in Xenopus oocytes also results in lower maximal responses (evoked current amplitudes) ofselective α7 nAChR agonists but does not shift pharmacology to a more β2-like profile [52–54,71].These in vitro studies in transfected cell systems therefore suggest that α7 nAChR agonists bindto the α7-α7 subunit interface, and β2 subunits likely do not contribute to the ligand binding siteon heteromeric α7β2 nAChR [67,71]. When using selective α7 nAChR antagonists, including MLAand α-bungarotoxin, to alter the response to some nicotinic agonists in either homomeric α7 andheteromeric α7β2 nAChR, results have been less consistent, as they show unaltered [54] or reducedpotency [52] and efficacy [53] in comparison to homomeric α7 nAChR expressed in Xenopus oocytes.The functional significance of heteromeric α7 nAChR expression is not well understood, with recentwork suggesting that this subtype combination might be more sensitive to inhibition by oligomericamyloid β1–42 [68,69] and isoflurane [72], as compared to homomeric α7 nAChR. Our finding thatbinding of [125I]Iodo-ASEM, an antagonist, was markedly reduced in the forebrain of β2 gene-deficientmice therefore may suggest that [125I]Iodo-ASEM binds to heteromeric α7β2 nAChR in the brain,as opposed to [125I]α-bungarotoxin. Whether this is due to different affinity for homomeric α7 andheteromeric α7β2 nAChR requires further in vitro studies. Although speculative, this may offer achance to probe the binding of amyloid β1–42 to heteromeric α7β2 nAChR in vivo using PET.
In vivo uptake of [18F]ASEM into the pig brain occurred rapidly within the first 10–20 minand a reversible but slower washout was found, as observed in human and non-human primatesubjects [39,43]. The in vivo distribution of [18F]ASEM found here is very similar to that of [11C]NS14492and importantly, also in accordance with the distribution of α7 nAChR in the pig brain [31,73].Furthermore, our data with [18F]ASEM matches previous reports with the structurally similar analogue[18F]DBT-10 in piglets [40].
We found variations in brain uptake and fP in the two baseline animals, and this result is consistentwith the interpretation that lower fP will lead to lower brain uptake [74]. Due to the limited number ofanimals in this study, this observation merits further investigations. Our finding is however supportedby PET studies in non-human primates with [18F]ASEM and [18F]DBT-10, where VT/fP was shown tobe a more stable outcome measure than VT [44,45]. This has also been shown for radiotracers bindingto other neurotransmitter receptors [75].
VT was found to increase slightly when the scan time was prolonged. This phenomenon wasmost pronounced in the thalamus and least pronounced in the white matter and is evident from theTACs (Figure 4A), where the ratio between e.g., thalamus and cerebellum was lower at 240 min thanat 90 min. This finding is in contrast with the non-human primate and human data, where VT wasunderestimated when reducing the PET data from 180 to 60 min [44]. Given that ASEM is an antagonist,
71

Molecules 2020, 25, 1425
it is unlikely that internalization of the receptor-ligand complex is an explanation for the decrease inVT. We cannot exclude that other receptor adaptations, such as (de)sensitization, could be responsiblefor this observation. Desensitization could occur if experiments were not conducted at tracer dose, i.e.,but we did not attempt to identify the mass dose limit of unlabelled ASEM. Although the injecteddoses of ASEM varied in the two baseline animals, we only found a 5% difference in the calculatedVT/fP, which suggest that the studies were conducted at tracer doses. The injected doses in this study(0.007–0.085 ug/kg) are higher than the doses used in the non-human primate evaluation of [18F]ASEM,where injected doses ranged from 0.009 to 0.056 μg/kg [44]. Further studies are needed to identify themass dose limit of unlabelled ASEM.
While pre-treatment with 1 mg/kg SSR-180,711 resulted in an increased uptake of [18F]ASEM,kinetic modelling for quantification of tracer uptake showed that SSR-180,711 at this dose resultedin 49% occupancy. A similar phenomenon has also been reported in piglets when [18F]DBT-10 wasblocked by the weak agonist NS6740, which was ascribed to a potential blood flow-driven effect ofNS6740 leading to greater central uptake of [18F]DBT-10 [40]. The increased tracer uptake could alsobe a result of peripheral α7 nAChR binding sites having been blocked by SSR-180,771. The occupancyfound by us is in line with previous work of Horti et al., reporting 39% and 81% occupancy for dosesof 0.5 and 5 mg/kg SSR-180,711, respectively [39]. The occupancy computed in this study should beinterpreted with care, as the baseline and blocking study is conducted in two different pigs. Due to thehalf-life of [18F]ASEM, it was not possible to conduct the study in the same animal on the same day.A further limitation to this in vivo study is the low number of PET scans and animals and thus we canonly provide a descriptive presentation of the data, without statistical evaluations.
From our results, [125I]Iodo-ASEM therefore offers several advantages over [125I]α-bungarotoxin:1) low nonspecific binding, 2) similar high affinity and selectivity and 3) in vivo applicability and directcomparison of PET data with autoradiographic data. The lower nonspecific binding of [125I]Iodo-ASEMis advantageous primarily in vitro, as it allows for a better signal-to-noise ratio over [125I]α-bungarotoxinat very similar affinities. While a low nonspecific binding would also be favourable under in vivoconditions (e.g., PET), having two nearly identical molecules as tracers offers interesting avenues,especially for preclinical studies. In vivo PET/SPECT imaging data can be acquired through [18F]ASEM,[18F]DBT10 or [123I]Iodo-ASEM and results can be validated or extended by using the advantages ofin vitro autoradiography (e.g. resolution) with [125I]Iodo-ASEM.
In conclusion, [125I]-Iodo-ASEM is applicable for visualizingα7 nAChR binding in vitro, its bindingis different between species, and may potentially bind to heteromeric α7β2 nAChR. In addition,[18F]ASEM is demonstrated to have suitable kinetic properties for in vivo quantification of α7 nAChRin the pig.
4. Materials and Methods
4.1. Compounds and Radioligands
[125I]Iodo-ASEM [(3-(1,4-diazabycyclo[3.2.2]nonan-4-yl)-6-(125I-iododibenzo[b,d]thiopentene5,5-dioxide)] was labelled according to previously published procedures [42]. Mean molar activitywas 59.94 ± 6.25 TBq/mmol. [125I]Tyr-54-mono-Iodo-α-bungarotoxin (81.4 TBq/mmol) was purchasedfrom Perkin-Elmer (Skovlunde, Denmark). (-)-nicotine tartrate was purchased from Sigma-Aldrich(St. Louis, MO). Unlabelled ASEM and precursor for radiosynthesis was provided by DanPET (Malmoe,Sweden). The α7-selective ligands were purchased from Sigma-Aldrich (MLA) or provided by DanPET(NS11492) or NeuroSearch A/S (Copenhagen, Denmark) (SSR-180,711, TC-5619, EVP-6124, A-58294,and GTS-21.
72

Molecules 2020, 25, 1425
4.2. Tissue Origin and Sectioning for In Vitro Autoradiography
All animal procedures were approved by the Danish Animal Experimentation Inspectorate (J. No.2012-15-2034-00156) and treated in concordance with the European Communities Council Directive of24th November 1986 (86/609ECC).
One female Sprague-Dawley rat (250 g, obtained from Charles River, Sulzfeld, Germany) waseuthanized with an intraperitoneal overdose of pentobarbital, the brain was quickly removed andsnap-frozen in −50 ◦C 2-methylbutane, then stored at −80 ◦C until further processing.
Mice deficient for the α7 subunits (The Jackson Laboratory) and β2 (Institut Pasteur, Paris,France) and their corresponding wild-type littermates were bred (C57BL/6J background) in an animalcare facility at Virginia Commonwealth University. Brains from α7 and β2 gene-deficient miceand corresponding wild-type littermates were kindly provided by Dr. M. Imad Damaj (Dept. ofPharmacology and Toxicology, Virginia Commonwealth University, Richmond, VA, USA).
One two-month old female Danish domestic pig (Landrace x Yorkshire x Duroc, 22 kg) waseuthanized with an intravenous injection of pentobarbital, the brain was quickly excised, separated intwo hemispheres and frozen on dry ice, before being stored at −80 ◦C.
All brain specimens were cut in 12 μm serial sections on a cryostat (Microm HM 500 OM, Walldorf,Germany), thaw-mounted onto Super Frost slides (Thermo Scientific, Hvidovre, Denmark), briefly airdried and stored at −80 ◦C until further processing. Protein concentration was determined from singleor three sections with the Bio-Rad Protein Assay (Bio-Rad, Hercules, CA, USA) based on the method ofBradford [76].
4.3. In Vitro Autoradiography with [125I]Iodo-ASEM
Initial optimization of assay conditions was performed to maximize total binding while keepingnon-specific binding low. Adjustments included buffer composition and pH, detergent concentration,wash and incubation time and temperature. An assay buffer with 50 mMol/L Tris-HCl pH 7.4, 21 ◦C(termed Tris-HCl buffer) provided best preserved tissue integrity and lowest non-specific binding,as compared to physiologic Tris, Tris-EDTA-EGTA or HEPES-KRH buffer (data not shown). For allfurther experiments, tissue from 1–2 animals was used, with experiments and quantifications carriedout using 3–4 sections for pig and rat tissue and 3–6 sections for mouse tissue. Adjacent sectionswere used for autoradiography for all similar experiments (e.g. saturation binding). Sections werebrought to room temperature and pre-incubated for 20 min in Tris-HCl buffer (pH 7.4, 21 ◦C), thenincubated for 60 min in the same buffer (21 ◦C) containing 1.5% Triton X-100 (v/v) and 0.5-1.0 nMol/L[125I]Iodo-ASEM in a humidified chamber. Non-specific binding of [125I]Iodo-ASEM was assessedin the presence of 10 μMol/L SSR-180,711, added to the buffer. Blocking of [125I]Iodo-ASEM bindingwas investigated with a series of individual α7 nAChR selective compounds (10 μMol/L) added to theincubation buffer, i.e., methyllycaconitine (MLA) [77], SSR-180,711 [63], NS14492 [31], TC-5619 [64],EVP-6124 [65], A-582941 [62], and GTS-21 [66]. Following incubation, slides were rinsed in Tris-HClbuffer (pH 7.4, 21 ◦C), washed 2 × 5 min in Tris-HCl buffer (pH 7.4, 4 ◦C) and rinsed (5 sec) in ice-colddistilled water. Slides were gently dried under an air stream and exposed to 4% paraformaldehydevapour overnight at 4 ◦C, followed by another drying step in a desiccator for 1 h. Adjacent sectionswere used for autoradiography.
4.4. In Vitro Autoradiography with [125I]α-bungarotoxin
Slides were thawed at room temperature (21 ◦C) for 30 min, followed by 30 min of rehydration in50 mMol/L Tris buffer with 0.1% BSA (w/v), pH 7.3 (binding buffer). For assessment of α-bungarotoxinbinding, the binding buffer contained 0.5 mMol/L [125I]α-bungarotoxin and 4.5 nMol/L unlabelledα-bungarotoxin (Tocris, Denmark) yielding a total of 5 nMol/L α-bungarotoxin (incubation buffer).Total binding was determined using one set of slides incubated with the radioligand for 2 h atroom temperature in a humidified chamber. Non-specific binding was determined in the presence
73

Molecules 2020, 25, 1425
of 1 mMol/L (-)-nicotine added to the incubation buffer. Afterwards, slides were briefly rinsed inbinding buffer, followed by 2 × 30 min of washing in ice-cold binding buffer (4 ◦C). Finally, slideswere briefly rinsed (5 sec) in ice-cold distilled water, dried under a gentle air stream and exposedto 4% paraformaldehyde vapour overnight at 4 ◦C. On the next day, the slides were dried for 1 h ina desiccator.
4.5. Saturation Binding and Kinetic Analysis Using In Vitro Autoradiography
Saturation binding was carried out in rat and pig brain sections as described above (Section 4.3).Sections were incubated with ten serial dilutions of [125I]Iodo-ASEM ranging from 0.02 to 10 nMol/L,with concentrations measured by gamma-counting. Non-specific binding was determined in adjacentsections in the presence of 10 μMol/L SSR-180,711 for each radioligand concentration. Binding wasterminated by washing the sections in ice-cold binding buffer. The equilibrium dissociation constant(Kd) and maximum number of binding sites (Bmax) were determined by non-linear regression analysisof a one-site saturation binding model using GraphPad Prism 6.0 (GraphPad Software, Inc., San Diego,CA, USA).
4.6. Autoradiographic Image Acquisition and Analysis
BAS SR2040 phosphor imaging plates (Fujifilm, Toyko, Japan) were exposed to the samples alongwith [125I] standards (ARI 0133A; American Radiolabeled Chemicals, St. Louis, USA) for 24-72 hours.Imaging plates were scanned using a Phosphor Imager BAS-2500 (Fujifilm Europe GmbH, Düsseldorf,Germany). Images were converted to TIF-files using the manufacturer’s software and analysed inQuantityOne (BioRad, Waltham, MA, USA). Regions of interest (ROIs) were drawn over grey andwhite matter structures, depending on the investigated species. High intensity circular spots wereoccasionally observed in [125I]Iodo-ASEM autoradiographs and were excluded from the analysis.For α7 and β2 gene-deficient mice, only one ROI was drawn over the whole brain, again excludingspots and irregular white matter binding. In the rat brain, the ROIs were drawn over cortex andhippocampus. From the pig brain, only frontal cortex sections were cut, the ROIs therefore containedthe frontal cortex and white matter tracts. The mean values of optical density per mm2 (averaged fromthe replicates) were converted to radioactive concentration using a linear regression derived from the[125I] radioactive standards. A global background of the imaging plate and individual non-specificbinding were subtracted. Final values were expressed as fmol/mg protein, based on the proteinmeasurements from individual sections.
4.7. Radiosynthesis of [18F]ASEM
The radiosynthesis of [18F]ASEM was performed as previously published [26]. No-carrier-addedaqueous 18F-fluoride from the target was collected at a non-conditioned activated (10 mL ethanol,20 mL water and dried with air) anion-exchange cartridge (QMA). A solution of 20 mg of1,10-diaza-4,7,13,16,21,24-hexaoxabicyclo[8.8.8]hexacosane (Kryptofix-222) and 3.3 mg of K2CO3
dissolved in a 0.65 mL methanol-water mixture (97/3 v/v) was used to elute the 18F-fluoride off thecartridge. The elute was thereafter dried by evaporation at 90 ◦C under nitrogen and then further driedtwice with 1 mL dry acetonitrile. To the dried Kryptofix®222/[18F]fluoride complex, 2.4 mg (0.006mmol)/L of 3-(1,4-Diazabicyclo[3.2.2]nonan-4-yl)-6-nitrodibenzo[b,d]- thiophene 5,5-Dioxide dissolvedin 0.8 mL DMSO was added. The reaction was performed at 160 ◦C for 15 min and afterwards thecrude was quenched with 3.5 mL H2O. Reactants and by-products were separated from [18F]ASEMby semi-preparative HPLC [Luna column, Phenomenex Ltd. Aschaffenburg, Germany; 10 μm C18(2)10×250 mm column, flow rate 6 mL/min, eluent: Ethanol/0.1% H3PO4 in water (25:75) with 6 mMascorbic acid to prevent radiolysis]. The retention time for [18F]ASEM was 400-450 s and the productwas collected into a vial containing 9 mL of PBS (phosphate-buffered saline). The product was visuallyinspected for clarity, absence of colour and visible particles. Chemical and radiochemical purities wereassessed by analytical HPLC [Kinetex column, Phenomenex Ltd. Aschaffenburg, Germany; 2.6μ C18
74

Molecules 2020, 25, 1425
4.60 × 50 mm, eluent: ACN/0.1% H3PO4 in water (25:75) RT: [18F]ASEM = 1.3 min; nitro precursor = 1min; flow rate 1.5 mL/min]. Molar activity (Am) of the radiotracer was determined as follows: the areaof the UV absorbance peak corresponding to the radiolabelled product was measured (integrated) onthe HPLC chromatogram. This value was then converted into a molar mass by comparison with anaverage of integrated areas (triplet) of a known standard of the reference compound.
4.8. In Vivo Imaging in the Pig
Three female pigs (21, 22 and 23 kg) were used for in vivo PET imaging on a HRRT PET scanner(Siemens Healthcare, Erlangen, Germany). All animal procedures were approved by the DanishCouncil for Animal Ethics (journal no. 2012-15-2934-00156).
4.8.1. Animal Procedures
Before scanning, anaesthesia was induced with i.m. injection of 0.13 mL/kg Zoletil veterinarymixture (Virbac, Kolding, Denmark; 10.87 mg/kg xylazine + 10.87 mg/kg ketamine + 1.74 mg/kgmethadone + 1.74 mg/kg butorphanol + 10.87 mg/kg tiletamine + 10.87 mg/kg zolezepam). Hereafter,anaesthesia was maintained with constant propofol infusion (1.5 mg/kg/h intravenous (i.v.); B. Braun,Melsungen, Germany). An arterial i.v. catheter was employed for blood sampling from the rightfemoral artery and two venous i.v. catheters for injections were placed in the left and right mammaryveins. During anaesthesia, animals were endotracheally intubated and ventilated. Vital parameters(heart rate, body temperature, blood pressure, oxygen saturation and end tidal CO2) were continuouslymonitored during the scan.
4.8.2. PET Scanning
[18F]ASEM was given as intravenous i.v. bolus, with experimental details described in Table 4.
Table 4. Experimental details of [18F]ASEM PET scans in pigs.
Details Animal 1 Animal 2 Animal 3
Type of experiment Baseline Baseline SSR-180,711; 1 mg/kgScan length 240 min 90 min 150 min
Molar activity 20 GBq/μmol 345 GBq/μmol 388 GBq/μmolInjected activity 99 MBq 335 MBq 189 MBq
Injected mass 1.78 μg 0.35 μg 0.18 μgFree plasma fraction 18% 16% 9%
4.8.3. Blood Sampling
During the first 30 min of the scans, radioactivity in the whole blood was continuously measuredusing an ABSS autosampler (Allogg Technology, Mariefred, Sweden) counting coincidences in alead-shielded detector. Concurrently, arterial whole blood was sampled manually at times 2.5, 5, 10, 20,30, 40, 50, 70, 89, 91, 120 and 150 min after injection of [18F]ASEM. Total radioactivity in plasma (500 μL)and whole blood (500 μL) was measured in a well counter (Cobra 5003; Packard Instruments, Meriden,CT, USA), which was cross-calibrated to the HRRT scanner and autosampler. All measurements ofradioactivity were decay corrected to the time of radioligand injection.
4.8.4. Metabolite Analysis
Radiolabelled parent compound and metabolites were determined by direct injection of plasmainto a radio-HPLC system (Dionex Ultimate 3000; Thermo Fisher Scientific, Hvidovre, Denmark)configured for column switching. Manually drawn arterial whole blood samples were centrifuged(1500 g, 7 min, 4 ◦C), and plasma was filtered through a syringe filter (Whatman GD/X 13 mm or 25 mm,PVDF membrane, 0.45 μm pore size; Frisenette ApS, Knebel, Denmark) prior to the analysis by HPLC
75

Molecules 2020, 25, 1425
as previously described [78]. To increase sensitivity on gamma counts from samples with low levelsof radioactivity, eluent from the HPLC was collected into fractions (10 mL) using a fraction collector(Foxy Jr FC144; Teledyne, Lincoln, NE, USA) and counted offline in a well counter (2480 Wizard2
Automatic Gamma Counter, Wallac Oy, Turku, Finland).
4.8.5. Determination of Free Fraction
The free, non-protein bound fraction of [18F]ASEM in pig plasma, fp, was estimated using anequilibrium dialysis chamber method as previously described [79].
4.8.6. Reconstruction and Pre-Processing of PET Data
150 -minute list-mode PET data were reconstructed in 58 dynamic frames (6 × 10, 6 × 20, 6 × 30,6 × 60, 4 × 120, 14 × 300, 8 × 150, 8 × 300 s). One animal was scanned for 240 min using the mentionedframing protocol but adding 9 frames of 600 s). Images consisted of 207 planes of 256 × 256 voxels of1.22 × 1.22 × 1.22 mm. A summed picture of all counts in the 150-min scan was reconstructed for eachpig and used for co-registration to a standardized MRI-based atlas of the domestic pig brain, similar tothat previously published [80]. The time activity curveds (TACs) were calculated for the followingvolumes of interest (VOIs): thalamus, striatum, hippocampus, cerebellum, white matter, frontal cortex,somatosensory cortex, occipital cortex, rest of the cortex. Radioactivity in all VOIs was calculated asthe average of radioactive concentration (Bq/mL) in the left and right sides. Outcome measure in theTACs was calculated as radioactive concentration in VOI (in kBq/mL) normalized to the injected dosecorrected for animal weight (in kBq/kg), yielding standardized uptake values (g/mL).
4.8.7. Kinetic Modelling of PET Data
The PET imaging data were analysed with the Logan graphical analysis (LGA) model, usingthe metabolite corrected arterial plasma concentration to calculate the primary outcome measure:total distribution volume (VT). The secondary outcome measure was VT values corrected for freefraction in plasma (VT/fP). The parent fraction curve for [18F]ASEM was fitted with a Watabe fit.Both curves were constrained to 1.0 at time = 0. Kinetic modeling was performed in PMOD version 3.0(PMOD Technologies).
Author Contributions: Conceptualization: C.K.D., J.D.M., A.G.H., M.G.P., D.P; Methodology: C.K.D., H.D.H.,G.M.K., M.M.H.; Formal analysis: C.K.D.; H.D.H., H.H.H.; Investigation: C.K.D.; H.D.H., E.T.L.; Resources: D.P.,R.C.M., M.M.H., A.G.H.; Writing—original draft preparation: C.K.D.; H.H.H., H.D.H.; Writing—review andediting: C.K.D., H.D.H., J.D.M., A.G.H., M.G.P., G.M.K., M.M.H.,; Visualization: C.K.D., H.D.H.; Supervision:J.D.M., G.M.K.; Funding acquisition: J.D.M., G.M.K., M.G.P.; All authors have read and agreed to the publishedversion of the manuscript.
Funding: This study was supported by the Danish Strategic Research Council (project COGNITO), EB024495,the Augustinus, Elsass and The Lundbeck Foundations.
Acknowledgments: The authors would like to thank the animal facilities at the Department of ExperimentalMedicine, University of Copenhagen.
Conflicts of Interest: The authors declare no conflict of interest.
References
1. Marutle, A.; Zhang, X.; Court, J.; Piggott, M.; Johnson, M.; Perry, R.; Perry, E.; Nordberg, A. Laminardistribution of nicotinic receptor subtypes in cortical regions in schizophrenia. J. Chem. Neuroanat. 2001, 22,115–126. [CrossRef]
2. Kulak, J.M.; Carroll, F.I.; Schneider, J.S. [125I]Iodomethyllycaconitine binds to alpha7 nicotinic acetylcholinereceptors in monkey brain. Eur. J. Neurosci. 2006, 23, 2604–2610. [CrossRef] [PubMed]
76

Molecules 2020, 25, 1425
3. Whiteaker, P.; Davies, A.R.; Marks, M.J.; Blagbrough, I.S.; Potter, B.V.; Wolstenholme, A.J.; Collins, A.C.;Wonnacott, S. An autoradiographic study of the distribution of binding sites for the novel alpha7-selectivenicotinic radioligand [3H]-methyllycaconitine in the mouse brain. Eur. J. Neurosci. 1999, 11, 2689–2696.[CrossRef] [PubMed]
4. Quik, M.; Choremis, J.; Komourian, J.; Lukas, R.J.; Puchacz, E. Similarity between rat brain nicotinicalpha-bungarotoxin receptors and stably expressed alpha-bungarotoxin binding sites. J. Neurochem. 1996, 67,145–154. [CrossRef] [PubMed]
5. Lendvai, B.; Kassai, F.; Szajli, A.; Nemethy, Z. alpha7 nicotinic acetylcholine receptors and their role incognition. Brain Res. Bull. 2013, 93, 86–96. [CrossRef] [PubMed]
6. Picciotto, M.R.; Lewis, A.S.; van Schalkwyk, G.I.; Mineur, Y.S. Mood and anxiety regulation by nicotinicacetylcholine receptors: A potential pathway to modulate aggression and related behavioral states.Neuropharmacology 2015, 96, 235–243. [CrossRef] [PubMed]
7. Albuquerque, E.X.; Pereira, E.F.; Alkondon, M.; Rogers, S.W. Mammalian nicotinic acetylcholine receptors:From structure to function. Physiol. Rev. 2009, 89, 73–120. [CrossRef]
8. Dani, J.A.; Bertrand, D. Nicotinic acetylcholine receptors and nicotinic cholinergic mechanisms of the centralnervous system. Annu Rev Pharm. Toxicol 2007, 47, 699–729. [CrossRef]
9. Maurer, S.V.; Williams, C.L. The Cholinergic System Modulates Memory and Hippocampal Plasticity via ItsInteractions with Non-Neuronal Cells. Front Immunol. 2017, 8, 1489. [CrossRef]
10. Bosmans, G.; Shimizu Bassi, G.; Florens, M.; Gonzalez-Dominguez, E.; Matteoli, G.; Boeckxstaens, G.E.Cholinergic Modulation of Type 2 Immune Responses. Front Immunol. 2017, 8, 1873. [CrossRef]
11. Freedman, R.; Hall, M.; Adler, L.E.; Leonard, S. Evidence in postmortem brain tissue for decreased numbersof hippocampal nicotinic receptors in schizophrenia. Biol. Psychiatry 1995, 38, 22–33. [CrossRef]
12. Guillozet-Bongaarts, A.L.; Hyde, T.M.; Dalley, R.A.; Hawrylycz, M.J.; Henry, A.; Hof, P.R.; Hohmann, J.;Jones, A.R.; Kuan, C.L.; Royall, J.; et al. Altered gene expression in the dorsolateral prefrontal cortex ofindividuals with schizophrenia. Mol. Psychiatry 2014, 19, 478–485. [CrossRef]
13. Kunii, Y.; Zhang, W.; Xu, Q.; Hyde, T.M.; McFadden, W.; Shin, J.H.; Deep-Soboslay, A.; Ye, T.; Li, C.;Kleinman, J.E.; et al. CHRNA7 and CHRFAM7A mRNAs: Co-Localized and Their Expression Levels Alteredin the Postmortem Dorsolateral Prefrontal Cortex in Major Psychiatric Disorders. Am. J. Psychiatry 2015.[CrossRef] [PubMed]
14. Thomsen, M.S.; Weyn, A.; Mikkelsen, J.D. Hippocampal alpha7 nicotinic acetylcholine receptor levels inpatients with schizophrenia, bipolar disorder, or major depressive disorder. Bipolar Disord. 2011, 13, 701–707.[CrossRef] [PubMed]
15. Sugaya, K.; Giacobini, E.; Chiappinelli, V.A. Nicotinic acetylcholine receptor subtypes in human frontalcortex: Changes in Alzheimer’s disease. J. Neurosci. Res. 1990, 27, 349–359. [CrossRef]
16. Araud, T.; Graw, S.; Berger, R.; Lee, M.; Neveu, E.; Bertrand, D.; Leonard, S. The chimeric gene CHRFAM7A,a partial duplication of the CHRNA7 gene, is a dominant negative regulator of alpha7*nAChR function.Biochem. Pharmacol. 2011, 82, 904–914. [CrossRef]
17. Gillentine, M.A.; Lozoya, R.; Yin, J.; Grochowski, C.M.; White, J.J.; Schaaf, C.P.; Calarge, C.A. CHRNA7 copynumber gains are enriched in adolescents with major depressive and anxiety disorders. J. Affect. Disord.2018, 239, 247–252. [CrossRef]
18. Sinkus, M.L.; Graw, S.; Freedman, R.; Ross, R.G.; Lester, H.A.; Leonard, S. The human CHRNA7 andCHRFAM7A genes: A review of the genetics, regulation, and function. Neuropharmacology 2015. [CrossRef]
19. Gillentine, M.A.; Berry, L.N.; Goin-Kochel, R.P.; Ali, M.A.; Ge, J.; Guffey, D.; Rosenfeld, J.A.; Hannig, V.;Bader, P.; Proud, M.; et al. The Cognitive and Behavioral Phenotypes of Individuals with CHRNA7Duplications. J. Autism Dev. Disord. 2017, 47, 549–562. [CrossRef]
20. Hua, S.; Ek, C.J.; Mallard, C.; Johansson, M.E. Perinatal hypoxia-ischemia reduces alpha 7 nicotinic receptorexpression and selective alpha 7 nicotinic receptor stimulation suppresses inflammation and promotesmicroglial Mox phenotype. Biomed Res. Int. 2014, 2014, 718769. [CrossRef]
21. Han, Z.; Li, L.; Wang, L.; Degos, V.; Maze, M.; Su, H. Alpha-7 nicotinic acetylcholine receptor agonisttreatment reduces neuroinflammation, oxidative stress, and brain injury in mice with ischemic stroke andbone fracture. J. Neurochem. 2014, 131, 498–508. [CrossRef] [PubMed]
77

Molecules 2020, 25, 1425
22. Dash, P.K.; Zhao, J.; Kobori, N.; Redell, J.B.; Hylin, M.J.; Hood, K.N.; Moore, A.N. Activation of Alpha 7Cholinergic Nicotinic Receptors Reduce Blood-Brain Barrier Permeability following Experimental TraumaticBrain Injury. J. Neurosci. 2016, 36, 2809–2818. [CrossRef] [PubMed]
23. Mavropoulos, S.A.; Khan, N.S.; Levy, A.C.J.; Faliks, B.T.; Sison, C.P.; Pavlov, V.A.; Zhang, Y.; Ojamaa, K.Nicotinic acetylcholine receptor-mediated protection of the rat heart exposed to ischemia reperfusion.Mol. Med. 2017, 23. [CrossRef] [PubMed]
24. Gatson, J.W.; Simpkins, J.W.; Uteshev, V.V. High therapeutic potential of positive allosteric modulation ofalpha7 nAChRs in a rat model of traumatic brain injury: Proof-of-concept. Brain Res. Bull. 2015, 112, 35–41.[CrossRef] [PubMed]
25. Pike, V.W. Considerations in the Development of Reversibly Binding PET Radioligands for Brain Imaging.Nicotin4 2016, 23, 1818–1869.
26. Gao, Y.; Kellar, K.J.; Yasuda, R.P.; Tran, T.; Xiao, Y.; Dannals, R.F.; Horti, A.G. Derivatives of dibenzothiophenefor positron emission tomography imaging of alpha7-nicotinic acetylcholine receptors. J. Med. Chem. 2013,56, 7574–7589. [CrossRef]
27. Toyohara, J.; Hashimoto, K. α7 Nicotinic Receptor Agonists: Potential Therapeutic Drugs for Treatmentof Cognitive Impairments in Schizophrenia and Alzheimer’s Disease. Open Med. Chem. J. 2010, 4, 37–56.[CrossRef]
28. Hashimoto, K.; Nishiyama, S.; Ohba, H.; Matsuo, M.; Kobashi, T.; Takahagi, M.; Iyo, M.; Kitashoji, T.;Tsukada, H. [11C]CHIBA-1001 as a novel PET ligand for α7 nicotinic receptors in the brain: A PET study inconscious monkeys. PLoS ONE 2008, 3, e3231. [CrossRef]
29. Rötering, S.; Scheunemann, M.; Fischer, S.; Hiller, A.; Peters, D.; Deuther-Conrad, W.; Brust, P. Radiosynthesisand first evaluation in mice of [(18)F]NS14490 for molecular imaging of alpha7 nicotinic acetylcholinereceptors. Bioorganic Med. Chem. 2013, 21, 2635–2642.
30. Kim, S.W.; Ding, Y.S.; Alexoff, D.; Patel, V.; Logan, J.; Lin, K.S.; Shea, C.; Muench, L.; Xu, Y.; Carter, P.; et al.Synthesis and positron emission tomography studies of C-11-labeled isotopomers and metabolites of GTS-21,a partial alpha7 nicotinic cholinergic agonist drug. Nucl. Med. Biol. 2007, 34, 541–551. [CrossRef]
31. Ettrup, A.; Mikkelsen, J.D.; Lehel, S.; Madsen, J.; Nielsen, E.O.; Palner, M.; Timmermann, D.B.; Peters, D.;Knudsen, G.M. 11C-NS14492 as a novel PET radioligand for imaging cerebral alpha7 nicotinic acetylcholinereceptors: In vivo evaluation and drug occupancy measurements. J. Nucl. Med. 2011, 52, 1449–1456.[CrossRef] [PubMed]
32. Deuther-Conrad, W.; Fischer, S.; Hiller, A.; Becker, G.; Cumming, P.; Xiong, G.; Funke, U.; Sabri, O.;Peters, D.; Brust, P. Assessment of alpha7 nicotinic acetylcholine receptor availability in juvenile pig brainwith [(18)F]NS10743. Eur. J. Nucl. Med. Mol. Imaging 2011. [CrossRef] [PubMed]
33. Ouach, A.; Vercouillie, J.; Bertrand, E.; Rodrigues, N.; Pin, F.; Serriere, S.; Boiaryna, L.; Chartier, A.; Percina, N.;Tangpong, P.; et al. Bis(het)aryl-1,2,3-triazole quinuclidines as alpha7 nicotinic acetylcholine receptor ligands:Synthesis, structure affinity relationships, agonism activity, [(18)F]-radiolabeling and PET study in rats. Eur. J.Med. Chem. 2019, 179, 449–469. [CrossRef] [PubMed]
34. Huan, W.; Aiqin, W.; Jianping, L.; Qianqian, X.; Xia, L.; Lei, Y.; Yu, F.; Huabei, Z. Radiosynthesis and in-vivoevaluation of [125I]IBT: A single-photon emission computed tomography radiotracer for alpha7-nicotinicacetylcholine receptor imaging. Nucl. Med. Commun. 2017, 38, 683–693. [CrossRef] [PubMed]
35. Wang, S.; Fang, Y.; Wang, H.; Gao, H.; Jiang, G.; Liu, J.; Xue, Q.; Qi, Y.; Cao, M.; Qiang, B.; et al. Design, synthesisand biological evaluation of 1,4-Diazobicylco[3.2.2]nonane derivatives as alpha7-Nicotinic acetylcholinereceptor PET/CT imaging agents and agonists for Alzheimer’s disease. Eur. J. Med. Chem. 2018, 159, 255–266.[CrossRef] [PubMed]
36. Teodoro, R.; Scheunemann, M.; Wenzel, B.; Peters, D.; Deuther-Conrad, W.; Brust, P. Synthesis andradiofluorination of novel fluoren-9-one based derivatives for the imaging of alpha7 nicotinic acetylcholinereceptor with PET. Bioorg. Med. Chem. Lett. 2018, 28, 1471–1475. [CrossRef]
37. Sarasamkan, J.; Scheunemann, M.; Apaijai, N.; Palee, S.; Parichatikanond, W.; Arunrungvichian, K.;Fischer, S.; Chattipakorn, S.; Deuther-Conrad, W.; Schuurmann, G.; et al. Varying Chirality Across NicotinicAcetylcholine Receptor Subtypes: Selective Binding of Quinuclidine Triazole Compounds. Acs Med. Chem.Lett. 2016, 7, 890–895. [CrossRef]
78

Molecules 2020, 25, 1425
38. Schrimpf, M.R.; Sippy, K.B.; Briggs, C.A.; Anderson, D.J.; Li, T.; Ji, J.; Frost, J.M.; Surowy, C.S.; Bunnelle, W.H.;Gopalakrishnan, M.; et al. SAR of alpha7 nicotinic receptor agonists derived from tilorone: Exploration of anovel nicotinic pharmacophore. Bioorg. Med. Chem. Lett. 2012, 22, 1633–1638. [CrossRef]
39. Horti, A.G.; Gao, Y.; Kuwabara, H.; Wang, Y.; Abazyan, S.; Yasuda, R.P.; Tran, T.; Xiao, Y.; Sahibzada, N.;Holt, D.P.; et al. 18F-ASEM, a radiolabeled antagonist for imaging the alpha7-nicotinic acetylcholine receptorwith PET. J. Nucl. Med. 2014, 55, 672–677. [CrossRef]
40. Teodoro, R.; Scheunemann, M.; Deuther-Conrad, W.; Wenzel, B.; Fasoli, F.M.; Gotti, C.; Kranz, M.; Donat, C.K.;Patt, M.; Hillmer, A.; et al. A Promising PET Tracer for Imaging of alpha(7) Nicotinic Acetylcholine Receptorsin the Brain: Design, Synthesis, and In Vivo Evaluation of a Dibenzothiophene-Based Radioligand. Molecules2015, 20, 18387–18421. [CrossRef]
41. Horti, A.G. Development of [(18)F]ASEM, a specific radiotracer for quantification of the alpha7-nAChR withpositron-emission tomography. Biochem. Pharmacol. 2015, 97, 566–575. [CrossRef] [PubMed]
42. Gao, Y.; Mease, R.C.; Olson, T.T.; Kellar, K.J.; Dannals, R.F.; Pomper, M.G.; Horti, A.G. [(125)I]Iodo-ASEM, aspecific in vivo radioligand for alpha7-nAChR. Nucl. Med. Biol. 2015, 42, 488–493. [CrossRef] [PubMed]
43. Wong, D.F.; Kuwabara, H.; Pomper, M.; Holt, D.P.; Brasic, J.R.; George, N.; Frolov, B.; Willis, W.; Gao, Y.;Valentine, H.; et al. Human brain imaging of alpha7 nAChR with [(18)F]ASEM: A new PET radiotracer forneuropsychiatry and determination of drug occupancy. WinnieBbb13 2014, 16, 730–738.
44. Hillmer, A.T.; Li, S.; Zheng, M.Q.; Scheunemann, M.; Lin, S.F.; Nabulsi, N.; Holden, D.; Pracitto, R.;Labaree, D.; Ropchan, J.; et al. PET imaging of alpha7 nicotinic acetylcholine receptors: A comparative studyof [18F]ASEM and [18F]DBT-10 in nonhuman primates, and further evaluation of [18F]ASEM in humans.Eur. J. Nucl. Med. Mol. Imaging 2017, 44, 1042–1050. [CrossRef]
45. Hillmer, A.T.; Zheng, M.Q.; Li, S.; Scheunemann, M.; Lin, S.F.; Holden, D.; Labaree, D.; Ropchan, J.;Teodoro, R.; Deuther-Conrad, W.; et al. PET imaging evaluation of [(18)F]DBT-10, a novel radioligand specificto alpha7 nicotinic acetylcholine receptors, in nonhuman primates. Eur. J. Nucl. Med. Mol. Imaging 2016, 43,537–547. [CrossRef]
46. Wong, D.F.; Kuwabara, H.; Horti, A.G.; Roberts, J.M.; Nandi, A.; Cascella, N.; Brasic, J.; Weerts, E.M.;Kitzmiller, K.; Phan, J.A.; et al. Brain PET Imaging of alpha7-nAChR with [18F]ASEM: Reproducibility,Occupancy, Receptor Density, and Changes in Schizophrenia. Int. J. Neuropsychopharmacol. /Off. Sci. J. Coll.Int. Neuropsychopharmacol. 2018, 21, 656–667.
47. Coughlin, J.M.; Du, Y.; Rosenthal, H.B.; Slania, S.; Min Koo, S.; Park, A.; Solomon, G.; Vranesic, M.;Antonsdottir, I.; Speck, C.L.; et al. The distribution of the alpha7 nicotinic acetylcholine receptor in healthyaging: An in vivo positron emission tomography study with [(18)F]ASEM. NeuroImage 2017, 165, 118–124.[CrossRef]
48. Coughlin, J.; Du, Y.; Crawford, J.L.; Rubin, L.H.; Behnam Azad, B.; Lesniak, W.G.; Horti, A.G.; Schretlen, D.J.;Sawa, A.; Pomper, M.G. The availability of the alpha7 nicotinic acetylcholine receptor in recent-onsetpsychosis: A study using (18)F-ASEM PET. J. Nucl. Med. 2018. [CrossRef]
49. Coughlin, J.M.; Rubin, L.H.; Du, Y.; Rowe, S.P.; Crawford, J.L.; Rosenthal, H.B.; Frey, S.M.; Marshall, E.S.;Shinehouse, L.K.; Chen, A.; et al. High availability of the alpha7 nicotinic acetylcholine receptor in brainsof individuals with mild cognitive impairment: A pilot study using (18)F-ASEM PET. J. Nucl. Med. 2019.[CrossRef]
50. Vetel, S.; Vercouillie, J.; Buron, F.; Vergote, J.; Tauber, C.; Busson, J.; Chicheri, G.; Routier, S.; Serriere, S.;Chalon, S. Longitudinal PET Imaging of alpha7 Nicotinic Acetylcholine Receptors with [(18)F]ASEM in aRat Model of Parkinson’s Disease. WinnieBbb13 2019. [CrossRef]
51. Wu, J.; Liu, Q.; Tang, P.; Mikkelsen, J.D.; Shen, J.; Whiteaker, P.; Yakel, J.L. Heteromeric alpha7beta2 NicotinicAcetylcholine Receptors in the Brain. Trends Pharm. Sci. 2016, 37, 562–574. [CrossRef] [PubMed]
52. Thomsen, M.S.; Zwart, R.; Ursu, D.; Jensen, M.M.; Pinborg, L.H.; Gilmour, G.; Wu, J.; Sher, E.; Mikkelsen, J.D.alpha7 and beta2 Nicotinic Acetylcholine Receptor Subunits Form Heteromeric Receptor Complexes thatAre Expressed in the Human Cortex and Display Distinct Pharmacological Properties. PLoS ONE 2015, 10,e0130572. [CrossRef] [PubMed]
53. Moretti, M.; Zoli, M.; George, A.A.; Lukas, R.J.; Pistillo, F.; Maskos, U.; Whiteaker, P.; Gotti, C. The novelalpha7beta2-nicotinic acetylcholine receptor subtype is expressed in mouse and human basal forebrain:Biochemical and pharmacological characterization. Mol. Pharmacol. 2014, 86, 306–317. [CrossRef] [PubMed]
79

Molecules 2020, 25, 1425
54. Zwart, R.; Strotton, M.; Ching, J.; Astles, P.C.; Sher, E. Unique pharmacology of heteromeric alpha7beta2nicotinic acetylcholine receptors expressed in Xenopus laevis oocytes. Eur. J. Pharmacol. 2014, 726C, 77–86.[CrossRef]
55. Patel, S.; Hamill, T.G.; Connolly, B.; Jagoda, E.; Li, W.; Gibson, R.E. Species differences in mGluR5 bindingsites in mammalian central nervous system determined using in vitro binding with [18F]F-PEB. Pet§Cholin22007, 34, 1009–1017. [CrossRef]
56. Fujita, M.; Imaizumi, M.; Zoghbi, S.S.; Fujimura, Y.; Farris, A.G.; Suhara, T.; Hong, J.; Pike, V.W.; Innis, R.B.Kinetic analysis in healthy humans of a novel positron emission tomography radioligand to image theperipheral benzodiazepine receptor, a potential biomarker for inflammation. NeuroImage 2008, 40, 43–52.[CrossRef]
57. Van de Bittner, G.C.; Ricq, E.L.; Hooker, J.M. A philosophy for CNS radiotracer design. Acc Chem. Res. 2014,47, 3127–3134. [CrossRef]
58. Laruelle, M.; Slifstein, M.; Huang, Y. Relationships between radiotracer properties and image quality inmolecular imaging of the brain with positron emission tomography. Nicotin4 2003, 5, 363–375. [CrossRef]
59. Magnussen, J.H.; Ettrup, A.; Donat, C.K.; Peters, D.; Pedersen, M.H.F.; Knudsen, G.M.; Mikkelsen, J.D.Radiosynthesis and in vitro validation of 3H-NS14492 as a novel high affinity α7 nicotinic acetylcholinereceptor radioligand Mol. Cell. Neurosci. 2014. [CrossRef]
60. Anderson, D.J.; Bunnelle, W.; Surber, B.; Du, J.; Surowy, C.; Tribollet, E.; Marguerat, A.;Bertrand, D.; Gopalakrishnan, M. [3H]A-585539 [(1S,4S)-2,2-dimethyl-5-(6-phenylpyridazin-3-yl)-5-aza-2-azoniabicyclo[2.2.1]hept ane], a novel high-affinity alpha7 neuronal nicotinic receptor agonist: Radioligandbinding characterization to rat and human brain. J. Pharmacol. Exp. Ther. 2008, 324, 179–187. [CrossRef]
61. Magnussen, J.H.; Ettrup, A.; Donat, C.K.; Peters, D.; Pedersen, M.H.; Knudsen, G.M.; Mikkelsen, J.D.Radiosynthesis and in vitro validation of (3)H-NS14492 as a novel high affinity alpha7 nicotinic receptorradioligand. Eur. J. Pharmacol. 2015, 762, 35–41. [CrossRef] [PubMed]
62. Bitner, R.S.; Bunnelle, W.H.; Anderson, D.J.; Briggs, C.A.; Buccafusco, J.; Curzon, P.; Decker, M.W.; Frost, J.M.;Gronlien, J.H.; Gubbins, E.; et al. Broad-spectrum efficacy across cognitive domains by alpha7 nicotinicacetylcholine receptor agonism correlates with activation of ERK1/2 and CREB phosphorylation pathways.J. Neurosci. 2007, 27, 10578–10587. [CrossRef] [PubMed]
63. Biton, B.; Bergis, O.E.; Galli, F.; Nedelec, A.; Lochead, A.W.; Jegham, S.; Godet, D.; Lanneau, C.; Santamaria, R.;Chesney, F.; et al. SSR180711, a novel selective alpha7 nicotinic receptor partial agonist: (1) binding andfunctional profile. Neuropsychopharmacology 2007, 32, 1–16. [CrossRef] [PubMed]
64. Hauser, T.A.; Kucinski, A.; Jordan, K.G.; Gatto, G.J.; Wersinger, S.R.; Hesse, R.A.; Stachowiak, E.K.;Stachowiak, M.K.; Papke, R.L.; Lippiello, P.M.; et al. TC-5619: An alpha7 neuronal nicotinic receptor-selectiveagonist that demonstrates efficacy in animal models of the positive and negative symptoms and cognitivedysfunction of schizophrenia. Biochem. Pharmacol. 2009, 78, 803–812. [CrossRef] [PubMed]
65. Prickaerts, J.; van Goethem, N.P.; Chesworth, R.; Shapiro, G.; Boess, F.G.; Methfessel, C.; Reneerkens, O.A.;Flood, D.G.; Hilt, D.; Gawryl, M.; et al. EVP-6124, a novel and selective alpha7 nicotinic acetylcholinereceptor partial agonist, improves memory performance by potentiating the acetylcholine response of alpha7nicotinic acetylcholine receptors. Neuropharmacology 2012, 62, 1099–1110. [CrossRef] [PubMed]
66. Meyer, E.M.; Tay, E.T.; Papke, R.L.; Meyers, C.; Huang, G.L.; de Fiebre, C.M.3-[2,4-Dimethoxybenzylidene]anabaseine (DMXB) selectively activates rat alpha7 receptors andimproves memory-related behaviors in a mecamylamine-sensitive manner. Brain Res. 1997, 768, 49–56.[CrossRef]
67. Nielsen, B.E.; Minguez, T.; Bermudez, I.; Bouzat, C. Molecular function of the novel α7β2 nicotinic receptor.Cell. Mol. Life Sci. Cmls 2018, 75, 2457–2471. [CrossRef]
68. Liu, Q.; Huang, Y.; Shen, J.; Steffensen, S.; Wu, J. Functional alpha7beta2 nicotinic acetylcholine receptorsexpressed in hippocampal interneurons exhibit high sensitivity to pathological level of amyloid beta peptides.Bmc Neurosci. 2012, 13, 155. [CrossRef]
69. Liu, Q.; Huang, Y.; Xue, F.; Simard, A.; DeChon, J.; Li, G.; Zhang, J.; Lucero, L.; Wang, M.; Sierks, M.; et al.A novel nicotinic acetylcholine receptor subtype in basal forebrain cholinergic neurons with high sensitivityto amyloid peptides. J. Neurosci. 2009, 29, 918–929. [CrossRef]
80

Molecules 2020, 25, 1425
70. Khiroug, S.S.; Harkness, P.C.; Lamb, P.W.; Sudweeks, S.N.; Khiroug, L.; Millar, N.S.; Yakel, J.L. Rat nicotinicACh receptor alpha7 and beta2 subunits co-assemble to form functional heteromeric nicotinic receptorchannels. J Physiol 2002, 540, 425–434. [CrossRef]
71. Murray, T.A.; Bertrand, D.; Papke, R.L.; George, A.A.; Pantoja, R.; Srinivasan, R.; Liu, Q.; Wu, J.; Whiteaker, P.;Lester, H.A.; et al. alpha7beta2 nicotinic acetylcholine receptors assemble, function, and are activatedprimarily via their alpha7-alpha7 interfaces. Mol. Pharmacol. 2012, 81, 175–188. [CrossRef] [PubMed]
72. Mowrey, D.D.; Liu, Q.; Bondarenko, V.; Chen, Q.; Seyoum, E.; Xu, Y.; Wu, J.; Tang, P. Insights into distinctmodulation of α7 and α7β2 nicotinic acetylcholine receptors by the volatile anesthetic isoflurane. J. Biol.Chem. 2013, 288, 35793–35800. [CrossRef] [PubMed]
73. Teodoro, R.; Moldovan, R.P.; Lueg, C.; Gunther, R.; Donat, C.K.; Ludwig, F.A.; Fischer, S.; Deuther-Conrad, W.;Wunsch, B.; Brust, P. Radiofluorination and biological evaluation of N-aryl-oxadiazolyl-propionamides aspotential radioligands for PET imaging of cannabinoid CB2 receptors. Org. Med. Chem. Lett. 2013, 3, 11.[CrossRef] [PubMed]
74. Innis, R.B.; Cunningham, V.J.; Delforge, J.; Fujita, M.; Gjedde, A.; Gunn, R.N.; Holden, J.; Houle, S.;Huang, S.-C.; Ichise, M.; et al. Consensus nomenclature for in vivo imaging of reversibly binding radioligands.J. Cereb. Blood Flow Metab: Off. J. Int. Soc. Cereb. Blood Flow Metab. 2007, 27, 1533–1539. [CrossRef] [PubMed]
75. Gallezot, J.-D.; Weinzimmer, D.; Nabulsi, N.; Lin, S.-F.; Fowles, K.; Sandiego, C.; McCarthy, T.J.; Maguire, R.P.;Carson, R.E.; Ding, Y.-S. Evaluation of [(11)C]MRB for assessment of occupancy of norepinephrine transporters:Studies with atomoxetine in non-human primates. NeuroImage 2011, 56, 268–279. [CrossRef]
76. Bradford, M.M. A rapid and sensitive method for the quantitation of microgram quantities of protein utilizingthe principle of protein-dye binding. Anal. Biochem. 1976, 72, 248–254. [CrossRef]
77. Ward, J.M.; Cockcroft, V.B.; Lunt, G.G.; Smillie, F.S.; Wonnacott, S. Methyllycaconitine: A selective probe forneuronal alpha-bungarotoxin binding sites. Febs Lett. 1990, 270, 45–48. [CrossRef]
78. Gillings, N. A restricted access material for rapid analysis of [(11)C]-labeled radiopharmaceuticals and theirmetabolites in plasma. Nucl. Med. Biol. 2009, 36, 961–965. [CrossRef]
79. Kornum, B.R.; Lind, N.M.; Gillings, N.; Marner, L.; Andersen, F.; Knudsen, G.M. Evaluation of the novel5-HT4 receptor PET ligand [11C]SB207145 in the Gottingen minipig. J. Cereb. Blood Flow Metab. 2009, 29,186–196. [CrossRef]
80. Villadsen, J.; Hansen, H.D.; Jorgensen, L.M.; Keller, S.H.; Andersen, F.L.; Petersen, I.N.; Knudsen, G.M.;Svarer, C. Automatic delineation of brain regions on MRI and PET images from the pig. J. Neurosci. Methods2018, 294, 51–58. [CrossRef]
Sample Availability: Samples of the compounds are not available.
© 2020 by the authors. Licensee MDPI, Basel, Switzerland. This article is an open accessarticle distributed under the terms and conditions of the Creative Commons Attribution(CC BY) license (http://creativecommons.org/licenses/by/4.0/).
81


molecules
Brief Report
A New Positron Emission Tomography Probe forOrexin Receptors Neuroimaging
Ping Bai 1,2,3, Sha Bai 2, Michael S. Placzek 2, Xiaoxia Lu 1, Stephanie A. Fiedler 2,
Brenda Ntaganda 2, Hsiao-Ying Wey 2 and Changning Wang 2,*
1 Chengdu Institute of Biology, Chinese Academy of Sciences, Chengdu 610041, China;[email protected] (P.B.); [email protected] (X.L.)
2 Athinoula A. Martinos Center for Biomedical Imaging, Department of Radiology, Massachusetts GeneralHospital, Harvard Medical School, Charlestown, MA 02129, USA; [email protected] (S.B.);[email protected] (M.S.P.); [email protected] (S.A.F.);[email protected] (B.N.); [email protected] (H.-Y.W.)
3 University of Chinese Academy of Sciences, Beijing 100049, China* Correspondence: [email protected]
Received: 17 December 2019; Accepted: 20 February 2020; Published: 25 February 2020
Abstract: The orexin receptor (OX) is critically involved in motivation and sleep−wake regulationand holds promising therapeutic potential in various mood disorders. To further investigate therole of orexin receptors (OXRs) in the living human brain and to evaluate the treatment potential oforexin-targeting therapeutics, we herein report a novel PET probe ([11C]CW24) for OXRs in the brain.CW24 has moderate binding affinity for OXRs (IC50 = 0.253 μM and 1.406 μM for OX1R and OX2R,respectively) and shows good selectivity to OXRs over 40 other central nervous system (CNS) targets.[11C]CW24 has high brain uptake in rodents and nonhuman primates, suitable metabolic stability,and appropriate distribution and pharmacokinetics for brain positron emission tomography (PET)imaging. [11C]CW24 warrants further evaluation as a PET imaging probe of OXRs in the brain.
Keywords: orexin receptors; PET; radiotracer; imaging
1. Introduction
Orexin (OX) is a hypothalamic hypocretin peptide that mediates multiple functions such asarousal, attention, neuroendocrine, water balance, and pain modulation [1–6]. The orexin system hastwo peptide members, orexin-A and orexin-B with 33 amino acids and 28 amino acids, respectively [7].Orexin receptors (OXRs) also have two subtypes (OX1R and OX2R). Orexin-A has similar bindingaffinities to OX1R and OX2R, while orexin-B has a 10-fold higher affinity for OX2R compared withOX1R. OXRs are differently expressed throughout the brain. OX1R is mainly expressed in the prefrontaland infralimbic cortex, hippocampus, paraventricular thalamic nucleus, and locus coeruleus [8].OX2R is mainly distributed in the cerebral cortex, septal nuclei, lateral hypothalamus, hippocampus,and hypothalamic nuclei [9]. The differential distribution of OXRs in the brain may be responsible forthe various physiological and psychiatric functions mediated by the OXR system [10–12].
Therapeutics targeting the orexin system have been investigated for various brain disorderssuch as insomnia [1,3], cluster headache [13], substance abuse [4,14], and maladaptation tostress [15,16]. This has led to the design and evaluation of orexin antagonists, including dual-OX1Rand OX2R antagonists (DORA) and selective OX1R and OX2R antagonists (SORA). [7] Almorexant [5](ACT-426606) [17] from Actelion, SB-649868 [18] from GSK, and Suvorexant [6] from Merck are a fewexamples demonstrating the efforts from pharmaceutical companies. Among these compounds,many have entered into clinical trials, however, Suvorexant is the only U.S. Food and DrugAdministration (FDA) approved orexin drug for the insomnia market. The discovery of ORX
Molecules 2020, 25, 1018; doi:10.3390/molecules25051018 www.mdpi.com/journal/molecules83
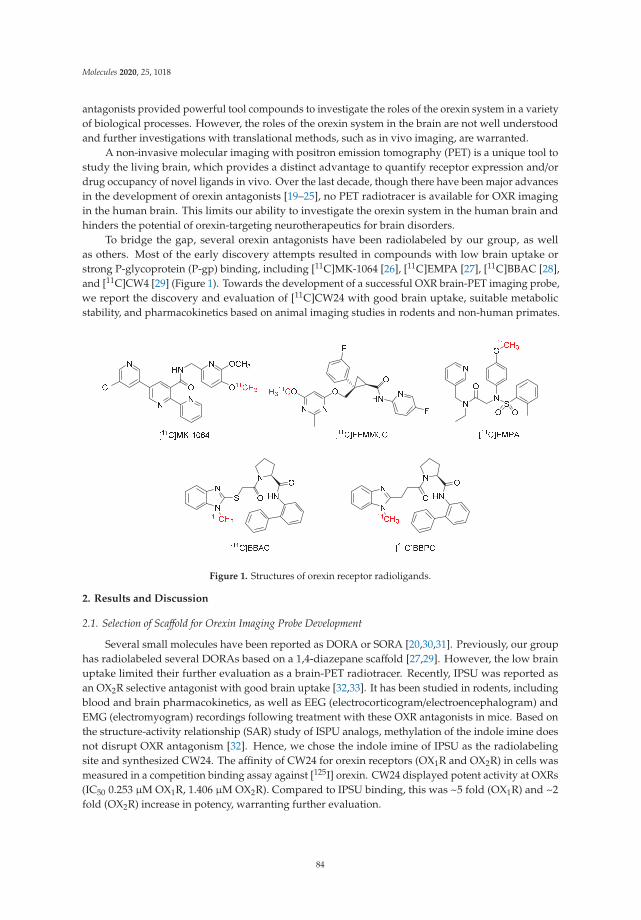
Molecules 2020, 25, 1018
antagonists provided powerful tool compounds to investigate the roles of the orexin system in a varietyof biological processes. However, the roles of the orexin system in the brain are not well understoodand further investigations with translational methods, such as in vivo imaging, are warranted.
A non-invasive molecular imaging with positron emission tomography (PET) is a unique tool tostudy the living brain, which provides a distinct advantage to quantify receptor expression and/ordrug occupancy of novel ligands in vivo. Over the last decade, though there have been major advancesin the development of orexin antagonists [19–25], no PET radiotracer is available for OXR imagingin the human brain. This limits our ability to investigate the orexin system in the human brain andhinders the potential of orexin-targeting neurotherapeutics for brain disorders.
To bridge the gap, several orexin antagonists have been radiolabeled by our group, as wellas others. Most of the early discovery attempts resulted in compounds with low brain uptake orstrong P-glycoprotein (P-gp) binding, including [11C]MK-1064 [26], [11C]EMPA [27], [11C]BBAC [28],and [11C]CW4 [29] (Figure 1). Towards the development of a successful OXR brain-PET imaging probe,we report the discovery and evaluation of [11C]CW24 with good brain uptake, suitable metabolicstability, and pharmacokinetics based on animal imaging studies in rodents and non-human primates.
Figure 1. Structures of orexin receptor radioligands.
2. Results and Discussion
2.1. Selection of Scaffold for Orexin Imaging Probe Development
Several small molecules have been reported as DORA or SORA [20,30,31]. Previously, our grouphas radiolabeled several DORAs based on a 1,4-diazepane scaffold [27,29]. However, the low brainuptake limited their further evaluation as a brain-PET radiotracer. Recently, IPSU was reported asan OX2R selective antagonist with good brain uptake [32,33]. It has been studied in rodents, includingblood and brain pharmacokinetics, as well as EEG (electrocorticogram/electroencephalogram) andEMG (electromyogram) recordings following treatment with these OXR antagonists in mice. Based onthe structure-activity relationship (SAR) study of ISPU analogs, methylation of the indole imine doesnot disrupt OXR antagonism [32]. Hence, we chose the indole imine of IPSU as the radiolabelingsite and synthesized CW24. The affinity of CW24 for orexin receptors (OX1R and OX2R) in cells wasmeasured in a competition binding assay against [125I] orexin. CW24 displayed potent activity at OXRs(IC50 0.253 μM OX1R, 1.406 μM OX2R). Compared to IPSU binding, this was ~5 fold (OX1R) and ~2fold (OX2R) increase in potency, warranting further evaluation.
84

Molecules 2020, 25, 1018
2.2. Physicochemical Properties of CW24
Lipophilicity (logP) and molecular weight need to be optimized for sufficient blood-brain barrier(BBB) penetration while also avoiding high non-specific binding. Studies have shown that it is preferredfor clogP ≤ 4, clogD ≤ 3, total polar surface area (tPSA) between 30–75 and molecular weight (M.W.) <500 for successful brain-PET imaging probes [34,35]. IPSU is reported as a non-selective OXR antagonistwith good brain uptake [33]. CW24, the methylated form of IPSU, had favorable properties for CNSpenetration (M.W. = 419.5, Log D(7.4) = 2.3, tPSA = 60.74, IC50 = 0.253 μM and 1.406 μM for OX1R andOX2R, respectively) (Figure 2). Furthermore, we tested the off-target binding of CW24 in vitro, [36]and were pleased to see that CW24 was selective for OXRs compared to 40 other CNS targets(NationalInstitute of Mental Health Psychoactive Drug Screening Program, NIMH PDSP) (Table S1).
Figure 2. Structures and physicochemical properties of IPSU and CW24 (n.t. = not tested). IC50 ofIPSU, CW24 and suvorexant were measured by a radioligand competition binding assay.
2.3. Chemical Synthesis for CW24 and [11C]CW24
CW24 was prepared from IPSU via direct methylation in the presence of a base (Figures S1 and S2).[11C]CW24 was radiosynthesized from IPSU (0.5 mg) in DMF (1 mL) with KOH (10 mg) and allowedto react with [11C]CH3I for 3 min at 100 ◦C (Scheme 1). The average synthesis time was 30–35 minutesfrom end of cyclotron bombardment (EOB) to end of synthesis (EOS), the radiochemical yield (RCY)was 10–21% (non-decay corrected, from trapped [11C]CH3I), the specific activity (As) was 1.28 ± 0.2mCi/nmol (EOS), the chemical and radiochemical purities of [11C]CW24 were ≥ 97%.
Scheme 1. Radiolabeling condition: IPSU (precursor, 0.5 mg), [11C]CH3I, KOH (10 mg), in 1.0 mL DMF,3 min, 100 ◦C. Radiochemical yield (RCY): 10–21% (non-decay corrected from trapped [11C]CH3I).
85

Molecules 2020, 25, 1018
2.4. Mouse Imaging with [11C]CW24
We performed PET-computed tomography (CT) imaging on mice to test [11C]CW24 asa neuroimaging probe for OXR imaging in vivo. [11C]CW24 exhibited high brain uptake (%ID/cc = 3.5%at Cmax, 1.5 min post-injection). In general, %ID/cc above 0.1% in rat or 0.01% in non-human primatewithin 5 min post-injection is above the threshold for suitable BBB penetration for CNS PET imagingstudies [37]. Next, to evaluate the specificity of [11C]CW24 for OXRs, PET-CT imaging studies wereperformed in mice after 5 min pretreatment with IPSU (0.5 and 2.0 mg/kg; i.v.) or Suvorexant (5.0 mg/kg;i.v.). Time-activity curves (TACs) were normalized for peak uptake (~20 seconds post-injection inthese studies) (Figure 3). Approximately 10% reduction in [11C]CW24 uptake with 0.5 mg/kg IPSUadministration in 30–60 mins post-injection of [11C]CW24. In addition, approximately 50% reductionwas found when the blocking dose of IPSU was increased to 2.0 mg/kg. Suvorxant (5.0 mg/kg)administration at 30–60 mins post-injection of [11C]CW24 also showed ~50% reduction in the mousebrain. Following IPSU pretreatment, [11C]CW24 binding was reduced in a dose-dependent manner inthe brain for the relative radioactivity changes after administration. These results strongly supportthat [11C]CW24 binds selectively to the OXRs in vivo.
Figure 3. (A) The PET/CT imaging of [11C]CW24 focused on mice brain (20-60 min after intravenousadministration (i.v.)); (B) baseline and blocking time-activity curve (TAC) of [11C]CW24 and (C) TACafter normalized the brain uptake curves with the highest uptake time point (20 seconds post-injection).
2.5. Non-human Primate (NHP) Imaging with [11C]CW24
Encouraged by the promising imaging results of [11C]CW24 in mice, we performed PET- Magneticresonance imaging (MR) imaging in a NHP (Figures 4 and 5). In macaque, [11C]CW24 demonstratedhigh brain uptake. We observed a peak standard uptake value (SUV) (SUV=C(T)/(injected dose/bodyweight) between 1.5–3.0 for all brain regions examined (Figure 4A). Furthermore, relatively higheruptake was observed in the midbrain and the thalamus and lower uptake in the hippocampus whichsuggests heterogenous expressions of OXR in the macaque brain. To further investigate the specificbinding of [11C]CW24, a blocking study was performed in which 2.0 mg/kg IPSU was administered5 min prior the PET-MR acquisition. Similar to the blocking results shown in mice, a reduction ofradioactivity uptake was found in several brain regions including hippocampus, nucleus accumbens,thalamus, hypothalamus, putamen and cerebellum (Figure 4B). Using the arterial blood data as inputfunction, Logan graphical analysis was applied to quantify volume of distribution (VT, mL/cm3) of[11C]CW24 (Figure 5). The metabolite-corrected arterial plasma after [11C]CW24 bolus injection isshowed in Figure 5C.
86

Molecules 2020, 25, 1018
Figure 4. (A) Positron emission tomography (PET)-Magnetic resonance (MR) Imaging (macaque brain).Summed PET images (30–90 min after [11C]CW24 injection) superimposed structural MRI from thesame macaque. (B) Time−activity curves for brain regions of interest from baseline and blocking scansare shown (2.0 mg/kg IPSU) (a) hippocampus, (b) nucleus accumbens, (c) thalamus, (d) hypothalamus,(e) putamen and (f) cerebellum.
Figure 5. Kinetic modeling results with [11C]CW24 in the macaque brain. (A) The total volume ofdistribution (VT) images derived from Logan plot with arterial blood data as input function (color barindicates VT values from 1–2.5 mL/cm3 (blue to red); (B) Regional VT values showed that the expressiondifference in brain regions; (C) Arterial plasma analysis showed that [11C]CW24 radioactivity wasrapidly cleared from blood and [11C]CW24 stability evaluated in plasma over time showed lastingpresence of ~47% of parent compound at 30 min.
87

Molecules 2020, 25, 1018
Based on our evaluation both in rodents and NHPs in vivo, [11C]CW24 is a promising OXR PETradioligand candidate. It has been reported that OXR was typically present in the cerebral cortex,septal nuclei, hippocampus, medial thalamic groups, raphe nuclei, and abundantly expressed inhypothalamic nuclei that regulate the homeostasis in rodents [12]. In addition, OX2R was found to haveexpression in the hypothalamus that enables its unique role of sleep-wake regulation [11]. Compare tothe previous OXR probes we developed [27,29] [11C]CW24 had higher brain uptake, increased isoformselectivity over IPSU, appropriate kinetics and distribution, which warrants further development ofOXR PET radioligands based on [11C]CW24.
3. Materials and Methods
3.1. Synthesis of Compound CW24
A mixture of IPSU (5 mg, 0.012 mmol, purchased form MedChemExpress), KOH (4 mg, 0.06 mmol),and CH3I (5 mg, 0.036 mmol) in DMF (0.1 mL) were reacted at room temperature overnight. The reactionmixture was purified by reverse phase chromatography (H2O: CH3CN = 1:1) to give the desiredproduct (2 mg, 0.005 mmol, 39% yield) as a white solid. 1H-NMR (500 MHz, Chloroform-d) δ 8.04 (d, J= 5.6 Hz, 1H), 7.64 (d, J = 7.9 Hz, 1H), 7.29 (d, J = 8.2 Hz, 1H), 7.22 (t, J = 7.7 Hz, 1H), 7.10 (t, J = 7.4 Hz,1H), 7.02 (s, 1H), 5.93 (s, 1H), 4.72 (s, 2H), 4.40 (dt, J = 13.7, 4.7 Hz, 2H), 3.87 (s, 3H), 3.75 (s, 3H), 3.38(m, 2H), 3.24 (t, J = 6.1 Hz, 2H), 2.24 (m, 2H), 1.83–1.77 (m, 2H), 1.73 (m, 2H), 1.50 (m, 2H).13C-NMR(125 MHz, Chloroform-d) δ 174.50, 169.94, 161.78, 157.98, 137.12, 128.79, 127.61, 121.89, 119.68, 119.41,110.84, 109.29, 95.96, 53.00, 46.79, 41.77, 40.27, 39.80(2), 33.84(2), 32.82, 30.61, 18.91. LC-MS [M]+ 419.85.
3.2. Radiosynthesis of [11C]CW24
[11C]CH3I was trapped in a reactor (TRACERlab FX-M synthesizer, General Electric) preloadedwith the precursor (0.5 mg), KOH (5.0 mg) in 1.0 mL dry DMF. The mixture was stirred for 3 minat 100 ◦C and followed by adding water (1.2 mL). The product was separated by reverse phasesemi-preparative HPLC (Phenomenex Luna 5u C8(2), 250 mm × 10 mm, 5 μm; 5.0 mL/min; 60% H2O+ ammonium formate (0.1 M)/ 40% CH3CN; isocratic). The collected final product was loaded ontoa C-18 sep-pak cartridge, and rinsed with water (5 mL), eluted with EtOH (0.3 mL), and saline (0.9%,2.7 mL). The average time required for the synthesis from EOB to EOS was 30–35 min. The averageradiochemical yield (RCY) was 10%–21% (non-decay corrected to trapped [11C]CH3I). Chemical andradiochemical purities were ≥ 95 % (measured with HPLC equipped with a UV detector and a gammadetector) with a specific activity (As) of 1.28 ± 0.2 mCi/nmol (EOS).
3.3. Assessment of Lipophilicity (Log D; pH 7.4)
Log D was determined according to methods identical to those we previously reported [38].
3.4. Human Orexin GPCR Binding (Agonist Radioligand) Assay
Radioligand competition binding assays were performed by Panlabs, Eurofins Pharma DiscoveryServices. Briefly, human recombinant orexin OX1 receptors expressed in CHO-S cells were used inmodified HEPES buffer pH 7.4. An aliquot was incubated with 0.1 nM [125I] Orexin A for 60 minutesat 25 ◦C. Receptors were filtered and then counted to determine [125I] Orexin A specifically binding.Human recombinant OX2 receptors were used in modified HEPES buffer pH 7.4. An aliquot wasincubated with 0.04 nM [125I] Orexin A for 180 minutes at 25 ◦C. Membranes were filtered and thencounted to determine [125I] Orexin A specifically bound.
3.5. Rodent PET/CT Acquisition
The Subcommittee on Research Animal Care (SRAC) serves as the Institutional Animal Careand Use Committee (IACUC) for the Massachusetts General Hospital (MGH). SRAC reviewed andapproved all procedures detailed in this paper. B6C3F1/J mice (male, 18-month old; n = 4 total) were
88

Molecules 2020, 25, 1018
utilized in this study. IPSU and Suvorexant were purchased form MedChemExpress and dissolved in1.0 % DMSO + 1.0 % Tween 80 + 98.0 % saline to make a solution of 1.0 mg/mL.
Animals were anesthetized with 1–1.5% isoflurane and maintained with isoflurane during theimaging scan. In a single imaging session, mice were arranged in a Triumph PET/CT scanner (GammaMedica, Northridge, CA). The mice were administered [11C]CW24 (3700–7400 KBq per animal) after5-min pre-treatment of IPSU (0.5 and 2.0 mg/kg; n = 1 for each dose; i.v.), Suvorexant (5.0 mg/kg; n = 1;i.v.), or vehicle (n = 1) via a lateral tail vein catheter. Animals underwent a 60 min dynamic PET scanfollowed by computed tomography (CT).
3.6. Rodent PET/CT Image Analysis
PET data were reconstructed using a 3D-MLEM method resulting in a full width at half-maximumresolution of 1 mm. PET and CT images in DICOM format were imported to PMOD (PMODTechnologies, Ltd. Zürich, Switzerland) and co-registered to the brain atlas. Volumes of interest(VOIs) were drawn as spheres in brain regions guided by CT structural images and summed PET data.Time-activity curves (TACs) were exported as activity per unit volume (%ID/cc) for analysis.
3.7. Macaque PET-MR Acquisition
A male rhesus macaque (14.4 kg) was included in this study. After endotracheal intubation,the macaque was catheterized antecubitally for radiotracer injection and a radial arterial line wasplaced for arterial blood sampling and radiometabolite analysis. The animal was anesthetized with1.2–1.3% Isoflurane in medical oxygen throughout the imaging session. PET-MR data was acquiredon a 3T Siemens MRI scanner (Munich, Germany) with a BrainPET insert. A baseline and a blockingscan were performed on the same animal. Dynamic PET image acquisition was initiated followed bya bolus administration of [11C]CW24 (179 MBq for the baseline scan and 192 MBq for the blockingscan). To characterize the specific binding of [11C]CW24, a blocking study was carried out in which2.0 mg/kg IPSU (1.0 % DMSO + 1.0 % Tween 80 + 98.0 % saline to make a solution of 1.0 mg/mL) wasadministered 5 min prior the acquisition. A T1-weighting multi-echo magnetization-prepared rapidgradient-echo (MEMPRAGE) sequence began as the PET scan for anatomic co-registration. DynamicPET data were corrected for decay, scatter, and attenuation and reconstructed using methods similar toour previous studies [39].
3.8. PET-MR Imaging Data Analysis for the Macaque Study
Motion-corrected PET data were registered to the INIA19 macaque MRI Template. VOIs wereselected according to the INIA19 Template and NeuroMaps Atlas [40]. TACs from the whole Macaquebrain as well as a few brain regions were exported. With the availability of a metabolite-correctedarterial plasma data, the regional volume of distribution (VT) was calculated using Logan Plot analysis(with a fixed t* of 40 min).
3.9. Plasma and Metabolite Analysis
Briefly, arterial blood samples collected (every 10 s at first 3 min post-administration of [11C]CW24,then 5 min, 10 min, 20 min, 30 min, 45 min, 60 min, and 90 min) during macaque imaging werecentrifuged to separate plasma, which was then removed and placed in an automated gammacounter [41]. Metabolite analysis of blood samples collected from 5 to 90 min was conducted ona custom automated robot fitted with Phenomenex SPE Strata-X 500 mg solid phase extractioncartridges that were primed with ethanol (2 mL) and deionized water (20 mL). Protein precipitationwas achieved by the addition of plasma (300 μL) to acetonitrile (300 μL), which was centrifuged for1 min to obtain protein-free plasma (PFP). Three hundred microliters of PFP/acetonitrile solutionwas diluted into deionized water (3 mL), loaded onto the C18 cartridge, and removed of polarmetabolites with 100% water. Next, a series of extractions was performed using water and acetonitrile.
89

Molecules 2020, 25, 1018
Each sample was counted in a WIZARD2 Automatic Gamma Counter to determine the presence ofradiolabeled metabolites.
4. Conclusions
In summary, our developed PET imaging radio-ligands, [11C]CW24, provides a non-invasivequantitative imaging tool for evaluating OXR expression in the brain. Based on the in vitro and in vivoevaluations, [11C]CW24 had high brain uptake and good target-selectivity, but suffers from highnon-specific binding. Therefore, [11C]CW24 could be used as a lead compound to develop brain-PETprobes for OXRs to investigate not only the roles of OXR in a variety of disease applications, but alsothe development of OXR neurotherapeutics. In future studies, it is important that we characterizeand optimize [11C]CW24 to improve specific binding for developing potential PET imaging probes forhuman imaging.
Supplementary Materials: The following are available online, Figure S1: Representative 1H, 13C-NMR andHPLC data for CW24; Figure S2: The HPLC profile of CW24; Table S1: Off-target binding data of CW24.
Author Contributions: Investigation, P.B., S.B.; writing—original draft preparation, P.B.; writing—review andediting, M.S.P., B.N., S.A.F., H.-Y.W.; supervision, X.L.; project administration, C.W.; funding acquisition, C.W.All authors have read and agreed to the published version of the manuscript.
Funding: This research was funded by National Institutes of Health (NIH), grant number DA048123 and the APCwas funded by NIH-DA048123.
Acknowledgments: This work was supported by NIH funding (DA048123) and pilot funding from the AthinoulaA. Martinos Center for Biomedical Imaging at the Massachusetts General Hospital (C.W. and H.-Y.W.). The imagingstudies were carried out at the Martinos Center, using resources provided by the Center for Functional NeuroimagingTechnologies, P41EB015896, a P41 Regional Resource supported by the National Institute of Biomedical Imagingand Bioengineering (NIBIB), National Institutes of Health. This work also involved the use of instrumentationsupported by the NIH Shared Instrumentation Grant Program and/or High-End Instrumentation Grant Program;specifically, grant numbers: S10RR017208, S10RR026666, S10RR022976, S10RR019933, S10RR023401. The authorPing Bai gratefully acknowledges financial support by China Scholarship Council (CSC) for this training atthe Martinos Center. The authors are grateful to (Judit Sore, the Martinos Center radioligand lab, PET/MRimaging staff (Grae Arabasz, Shirley Hsu and Regan Butterfield), and Helen Deng for assistance with non-humanprimate imaging.
Conflicts of Interest: The authors declare no conflict of interest.
References
1. Ammoun, S.; Holmqvist, T.; Shariatmadari, R.; Oonk, H.B.; Detheux, M.; Parmentier, M.; Akerman, K.E.;Kukkonen, J.P. Distinct recognition of OX1 and OX2 receptors by orexin peptides. J. Pharmacol. Exp. Ther.2003, 305, 507–514. [CrossRef] [PubMed]
2. Bettica, P.; Squassante, L.; Groeger, J.A.; Gennery, B.; Winsky-Sommerer, R.; Dijk, D.J. Differential effectsof a dual orexin receptor antagonist (SB-649868) and zolpidem on sleep initiation and consolidation, SWS,REM sleep, and EEG power spectra in a model of situational insomnia. Neuropsychopharmacology 2012, 37,1224–1233. [CrossRef]
3. Bingham, M.J.; Cai, J.; Deehan, M.R. Eating, sleeping and rewarding: Orexin receptors and their antagonists.Curr. Opin Drug Discov. Devel. 2006, 9, 551–559.
4. Boutrel, B.; Kenny, P.J.; Specio, S.E.; Martin-Fardon, R.; Markou, A.; Koob, G.F.; de Lecea, L. Role forhypocretin in mediating stress-induced reinstatement of cocaine-seeking behavior. Proc. Natl. Acad. Sci.USA 2005, 102, 19168–19173. [CrossRef]
5. Brisbare-Roch, C.; Dingemanse, J.; Koberstein, R.; Hoever, P.; Aissaoui, H.; Flores, S.; Mueller, C.; Nayler, O.;van Gerven, J.; de Haas, S.L.; et al. Promotion of sleep by targeting the orexin system in rats, dogs andhumans. Nat. Med. 2007, 13, 150–155. [CrossRef]
6. Cada, D.J.; Levien, T.L.; Baker, D.E. Suvorexant. Hosp Pharm. 2015, 50, 59–71. [CrossRef]7. Roecker, A.J.; Cox, C.D.; Coleman, P.J. Orexin receptor antagonists: New therapeutic agents for the treatment
of insomnia. J. Med. Chem. 2016, 59, 504–530. [CrossRef]8. Bingham, S.; Davey, P.T.; Babbs, A.J.; Irving, E.A.; Sammons, M.J.; Wyles, M.; Jeffrey, P.; Cutler, L.; Riba, I.;
Johns, A.; et al. Orexin-A, an hypothalamic peptide with analgesic properties. Pain 2001, 92, 81–90. [CrossRef]
90

Molecules 2020, 25, 1018
9. Tabaeizadeh, M.; Motiei-Langroudi, R.; Mirbaha, H.; Esmaeili, B.; Tahsili-Fahadan, P.; Javadi-Paydar, M.;Ghaffarpour, M.; Dehpour, A.R. The differential effects of OX1R and OX2R selective antagonists on morphineconditioned place preference in naive versus morphine-dependent mice. Behav. Brain Res. 2013, 237, 41–48.[CrossRef] [PubMed]
10. De Lecea, L.; Kilduff, T.S.; Peyron, C.; Gao, X.; Foye, P.E.; Danielson, P.E.; Fukuhara, C.; Battenberg, E.L.;Gautvik, V.T.; Frankel, W.N.; et al. The hypocretins: Hypothalamus-specific peptides with neuroexcitatoryactivity. Proc. Natl. Acad Sci. USA 1998, 95, 322–327. [CrossRef] [PubMed]
11. Sakurai, T.; Amemiya, A.; Ishii, M.; Matsuzaki, I.; Chemelli, R.M.; Tanaka, H.; Williams, S.C.; Richardson, J.A.;Kozlowski, G.P.; Wilson, S.; et al. Orexins and orexin receptors: A family of hypothalamic neuropeptidesand G protein-coupled receptors that regulate feeding behavior. Cell 1998, 92, 573–585. [CrossRef]
12. Marcus, J.N.; Aschkenasi, C.J.; Lee, C.E.; Chemelli, R.M.; Saper, C.B.; Yanagisawa, M.; Elmquist, J.K.Differential expression of orexin receptors 1 and 2 in the rat brain. J. Comp. Neurol. 2001, 435, 6–25. [CrossRef][PubMed]
13. Suzuki, H.; Takemoto, Y.; Yamamoto, T. Differential distribution of orexin-A-like and orexin receptor 1(OX1R)-like immunoreactivities in the Xenopus pituitary. Tissue Cell 2007, 39, 423–430. [CrossRef] [PubMed]
14. Mahler, S.V.; Smith, R.J.; Moorman, D.E.; Sartor, G.C.; Aston-Jones, G. Multiple roles for orexin/hypocretin inaddiction. Prog. Brain Res. 2012, 198, 79–121. [PubMed]
15. Ida, T.; Nakahara, K.; Murakami, T.; Hanada, R.; Nakazato, M.; Murakami, N. Possible involvement of orexinin the stress reaction in rats. Biochem. Biophys. Res. Commun. 2000, 270, 318–323. [CrossRef]
16. Furlong, T.M.; Vianna, D.M.; Liu, L.; Carrive, P. Hypocretin/orexin contributes to the expression of some butnot all forms of stress and arousal. Eur. J. Neurosci. 2009, 30, 1603–1614. [CrossRef]
17. Stachulski, A.V.; Baillie, T.A.; Park, B.K.; Obach, R.S.; Dalvie, D.K.; Williams, D.P.; Srivastava, A.; Regan, S.L.;Antoine, D.J.; Goldring, C.E.; et al. The generation, detection, and effects of reactive drug metabolites. Med.Res. Rev. 2013, 33, 985–1080. [CrossRef]
18. Bettica, P.; Squassante, L.; Zamuner, S.; Nucci, G.; Danker-Hopfe, H.; Ratti, E. The orexin antagonist SB-649868promotes and maintains sleep in men with primary insomnia. Sleep 2012, 35, 1097–1104. [CrossRef]
19. Hirose, M.; Egashira, S.; Goto, Y.; Hashihayata, T.; Ohtake, N.; Iwaasa, H.; Hata, M.; Fukami, T.; Kanatani, A.;Yamada, K. N-acyl 6,7-dimethoxy-1,2,3,4-tetrahydroisoquinoline: The first orexin-2 receptor selectivenon-peptidic antagonist. Bioorg. Med. Chem. Lett. 2003, 13, 4497–4499. [CrossRef]
20. Whitman, D.B.; Cox, C.D.; Breslin, M.J.; Brashear, K.M.; Schreier, J.D.; Bogusky, M.J.; Bednar, R.A.; Lemaire, W.;Bruno, J.G.; Hartman, G.D.; et al. Discovery of a potent, CNS-penetrant orexin receptor antagonist based onan n,n-disubstituted-1,4-diazepane scaffold that promotes sleep in rats. Chem. Med. Chem. 2009, 4, 1069–1074.[CrossRef]
21. Malherbe, P.; Borroni, E.; Pinard, E.; Wettstein, J.G.; Knoflach, F. Biochemical and electrophysiologicalcharacterization of almorexant, a dual orexin 1 receptor (OX1)/orexin 2 receptor (OX2) antagonist: Comparisonwith selective OX1 and OX2 antagonists. Mol. Pharmacol. 2009, 76, 618–631. [CrossRef] [PubMed]
22. McAtee, L.C.; Sutton, S.W.; Rudolph, D.A.; Li, X.; Aluisio, L.E.; Phuong, V.K.; Dvorak, C.A.; Lovenberg, T.W.;Carruthers, N.I.; Jones, T.K. Novel substituted 4-phenyl-[1,3]dioxanes: Potent and selective orexin receptor 2(OX(2)R) antagonists. Bioorg. Med. Chem. Lett. 2004, 14, 4225–4229. [CrossRef] [PubMed]
23. Porter, R.A.; Chan, W.N.; Coulton, S.; Johns, A.; Hadley, M.S.; Widdowson, K.; Jerman, J.C.; Brough, S.J.;Coldwell, M.; Smart, D.; et al. 1,3-Biarylureas as selective non-peptide antagonists of the orexin-1 receptor.Bioorg. Med. Chem. Lett. 2001, 11, 1907–1910. [CrossRef]
24. Smart, D.; Sabido-David, C.; Brough, S.J.; Jewitt, F.; Johns, A.; Porter, R.A.; Jerman, J.C. SB-334867-A: The firstselective orexin-1 receptor antagonist. Br. J. Pharmacol. 2001, 132, 1179–1182. [CrossRef] [PubMed]
25. Srinivasan, S.; Simms, J.A.; Nielsen, C.K.; Lieske, S.P.; Bito-Onon, J.J.; Yi, H.; Hopf, F.W.; Bonci, A.; Bartlett, S.E.The dual orexin/hypocretin receptor antagonist, almorexant, in the ventral tegmental area attenuates ethanolself-administration. PLoS ONE 2012, 7, e44726. [CrossRef]
26. Gao, M.; Wang, M.; Zheng, Q.H. Synthesis of [(11)C]MK-1064 as a new PET radioligand for imaging oforexin-2 receptor. Bioorg. Med. Chem. Lett. 2016, 26, 3694–3699. [CrossRef]
27. Wang, C.; Moseley, C.K.; Carlin, S.M.; Wilson, C.M.; Neelamegam, R.; Hooker, J.M. Radiosynthesis andevaluation of [11C]EMPA as a potential PET tracer for orexin 2 receptors. Bioorg. Med. Chem. Lett. 2013, 23,3389–3392. [CrossRef]
91
Molecules 2020, 25, 1018
28. Liu, F.; Majo, V.J.; Prabhakaran, J.; Castrillion, J.; Mann, J.J.; Martinez, D.; Kumar, J.S. Radiosynthesis of[11C]BBAC and [11C]BBPC as potential PET tracers for orexin2 receptors. Bioorg. Med. Chem. Lett. 2012, 22,2172–2174. [CrossRef]
29. Wang, C.; Wilson, C.M.; Moseley, C.K.; Carlin, S.M.; Hsu, S.; Arabasz, G.; Schroeder, F.A.; Sander, C.Y.;Hooker, J.M. Evaluation of potential PET imaging probes for the orexin 2 receptors. Nucl. Med. Biol. 2013, 40,1000–1005. [CrossRef]
30. Cox, C.D.; McGaughey, G.B.; Bogusky, M.J.; Whitman, D.B.; Ball, R.G.; Winrow, C.J.; Renger, J.J.; Coleman, P.J.Conformational analysis of N,N-disubstituted-1,4-diazepane orexin receptor antagonists and implicationsfor receptor binding. Bioorg. Med. Chem. Lett. 2009, 19, 2997–3001. [CrossRef]
31. Steiner, M.A.; Gatfield, J.; Brisbare-Roch, C.; Dietrich, H.; Treiber, A.; Jenck, F.; Boss, C. Discovery andcharacterization of ACT-335827, an orally available, brain penetrant orexin receptor type 1 selective antagonist.Chem. Med. Chem. 2013, 8, 898–903. [CrossRef] [PubMed]
32. Betschart, C.; Hintermann, S.; Behnke, D.; Cotesta, S.; Fendt, M.; Gee, C.E.; Jacobson, L.H.; Laue, G.; Ofner, S.;Chaudhari, V.; et al. Identification of a novel series of orexin receptor antagonists with a distinct effect onsleep architecture for the treatment of insomnia. J. Med. Chem. 2013, 56, 7590–7607. [CrossRef]
33. Callander, G.E.; Olorunda, M.; Monna, D.; Schuepbach, E.; Langenegger, D.; Betschart, C.; Hintermann, S.;Behnke, D.; Cotesta, S.; Fendt, M.; et al. Kinetic properties of "dual" orexin receptor antagonists at OX1R andOX2R orexin receptors. Front. Neurosci. 2013, 7, 230. [CrossRef] [PubMed]
34. Zhang, L.; Villalobos, A.; Beck, E.M.; Bocan, T.; Chappie, T.A.; Chen, L.; Grimwood, S.; Heck, S.D.; Helal, C.J.;Hou, X.; et al. Design and selection parameters to accelerate the discovery of novel central nervoussystem positron emission tomography (PET) ligands and their application in the development of a novelphosphodiesterase 2A PET ligand. J. Med. Chem. 2013, 56, 4568–4579. [CrossRef] [PubMed]
35. Seo, Y.J.; Kang, Y.; Muench, L.; Reid, A.; Caesar, S.; Jean, L.; Wagner, F.; Holson, E.; Haggarty, S.J.; Weiss, P.;et al. Image-guided synthesis reveals potent blood-brain barrier permeable histone deacetylase inhibitors.ACS Chem. Neurosci. 2014, 5, 588–596. [CrossRef] [PubMed]
36. Besnard, J.; Ruda, G.F.; Setola, V.; Abecassis, K.; Rodriguiz, R.M.; Huang, X.P.; Norval, S.; Sassano, M.F.;Shin, A.I.; Webster, L.A.; et al. Automated design of ligands to polypharmacological profiles. Nature 2012,492, 215–220. [CrossRef]
37. Van de Bittner, G.C.; Ricq, E.L.; Hooker, J.M. A philosophy for CNS radiotracer design. Acc. Chem. Res. 2014,47, 3127–3134. [CrossRef]
38. Wang, C.; Placzek, M.S.; Van de Bittner, G.C.; Schroeder, F.A.; Hooker, J.M. A Novel Radiotracer for ImagingMonoacylglycerol Lipase in the Brain Using Positron Emission Tomography. ACS Chem. Neurosci. 2016, 7,484–489. [CrossRef]
39. Wang, C.; Schroeder, F.A.; Hooker, J.M. Development of new positron emission tomography radiotracer forBET imaging. ACS Chem. Neurosci. 2017, 8, 17–21. [CrossRef]
40. Rohlfing, T.; Kroenke, C.D.; Sullivan, E.V.; Dubach, M.F.; Bowden, D.M.; Grant, K.A.; Pfefferbaum, A.The INIA19 template and neuromaps atlas for primate brain image parcellation and spatial normalization.Front. Neuroinform 2012, 6, 27. [CrossRef]
41. Bai, P.; Wey, H.-Y.; Patnaik, D.; Lu, X.; Rokka, J.; Stephanie, F.; Haggarty, S.J.; Wang, C. Positronemission tomography probes targeting bromodomain and extra-terminal (BET) domains to enable in vivoneuroepigenetic imaging. Chem. Commun. 2019, 55, 12932–12935. [CrossRef] [PubMed]
Sample Availability: Samples of the compounds (IPSU and CW24) are available from the authors.
© 2020 by the authors. Licensee MDPI, Basel, Switzerland. This article is an open accessarticle distributed under the terms and conditions of the Creative Commons Attribution(CC BY) license (http://creativecommons.org/licenses/by/4.0/).
92

molecules
Article
PET Imaging of the Adenosine A2A Receptor in theRotenone-Based Mouse Model of Parkinson’s Diseasewith [18F]FESCH Synthesized by a SimplifiedTwo-Step One-Pot Radiolabeling Strategy
Susann Schröder 1,*, Thu Hang Lai 2, Magali Toussaint 2, Mathias Kranz 3,4,
Alexandra Chovsepian 5, Qi Shang 6,7, Sladjana Dukic-Stefanovic 2, Winnie Deuther-Conrad 2,
Rodrigo Teodoro 2, Barbara Wenzel 2, Rares-Petru Moldovan 2, Francisco Pan-Montojo 5,6 and
Peter Brust 2
1 ROTOP Pharmaka Ltd., Department of Research and Development, Dresden 01328, Germany2 Helmholtz-Zentrum Dresden-Rossendorf (HZDR), Department of Neuroradiopharmaceuticals, Institute of
Radiopharmaceutical Cancer Research, Research Site Leipzig, Leipzig 04318, Germany; [email protected] (T.H.L.);[email protected] (M.T.); [email protected] (S.D.-S.); [email protected] (W.D.-C.);[email protected] (R.T.); [email protected] (B.W.); [email protected] (R.-P.M.); [email protected] (P.B.)
3 PET Imaging Center, University Hospital of North Norway (UNN), Tromsø 9009, Norway;[email protected]
4 Nuclear Medicine and Radiation Biology Research Group, The Arctic University of Norway,Tromsø 9009, Norway
5 University Hospital Munich, Department of Psychiatry, Ludwig-Maximilians-Universität (LMU) Munich,Munich 80336, Germany; [email protected] (A.C.);[email protected] (F.P.-M.)
6 University Hospital Munich, Department of Neurology, Ludwig-Maximilians-Universität (LMU) Munich,Munich 81377, Germany; [email protected]
7 University Hospital Carl Gustav Carus, Clinic of Neurology, Technische Universität Dresden (TUD),Dresden 01307, Germany
* Correspondence: [email protected]; Tel.: +49-341-234-179-4631
Received: 24 January 2020; Accepted: 27 March 2020; Published: 2 April 2020
Abstract: The adenosine A2A receptor (A2AR) is regarded as a particularly appropriate target fornon-dopaminergic treatment of Parkinson’s disease (PD). An increased A2AR availability has beenfound in the human striatum at early stages of PD and in patients with PD and dyskinesias. The aimof this small animal positron emission tomography/magnetic resonance (PET/MR) imaging studywas to investigate whether rotenone-treated mice reflect the aspect of striatal A2AR upregulation inPD. For that purpose, we selected the known A2AR-specific radiotracer [18F]FESCH and developed asimplified two-step one-pot radiosynthesis. PET images showed a high uptake of [18F]FESCH inthe mouse striatum. Concomitantly, metabolism studies with [18F]FESCH revealed the presence of abrain-penetrant radiometabolite. In rotenone-treated mice, a slightly higher striatal A2AR binding of[18F]FESCH was found. Nonetheless, the correlation between the increased A2AR levels within theproposed PD animal model remains to be further investigated.
Keywords: adenosine A2A receptor; Parkinson’s disease; rotenone-based mouse model; PET imaging;[18F]FESCH; two-step one-pot radiosynthesis
1. Introduction
Parkinson’s disease (PD) is characterized by the degeneration of dopaminergic neurons in thebrain, especially in the substantia nigra, resulting in a decreased dopamine level in the striatum.
Molecules 2020, 25, 1633; doi:10.3390/molecules25071633 www.mdpi.com/journal/molecules93

Molecules 2020, 25, 1633
Consequently, stimulation of the dopamine D2 receptor (D2R) is reduced and, further, the morphologyof striatal neurons and synaptic connections is changing. These effects lead to motor dysfunctions likebradykinesia, tremor, rigor, and postural instability [1,2]. The standard therapy of PD is based on thepharmacological increase of dopamine levels either by administration of L-DOPA as metabolic precursorof dopamine or by dopamine agonists. Further strategies to raise or maintain the dopamine levelsare based on inhibitors for dopamine reuptake and dopamine-degrading enzymes (e.g., monoamineoxidase B, catechol-O-methyl transferase) [2]. These dopamine- increasing drugs have only a positiveeffect on motor functions at short-term treatment but cause undesirable side effects at long-termtreatment like dyskinesia, nausea, and hallucinations. Due to these limitations, the medicinal researchis currently focusing on non-dopaminergic therapies of PD [2,3].
The adenosine A2A receptor (A2AR) is a G-protein coupled receptor that is highly expressed inthe basal ganglia of the brain, mainly in striatopallidal GABAergic neurons. Furthermore, in thisbrain area the A2AR and the D2R are co-localized and form heteromeric receptor complexes whileshowing contradictory effects on motor functions [2]. For example, an L-DOPA-induced increaseof dopamine stimulates the D2R leading to enhanced motor activity. Activation of the A2AR byadenosine or appropriate agonists results in the inhibition of the D2R and, thus, in reduced dopaminebinding [2,4,5]. Pharmacological inhibition of the A2AR amplifies the D2R-dependent signaling cascadeand improves motor symptoms [2,3,5,6]. Since the A2AR modulates the dopamine binding affinityof the D2R, selective A2AR antagonists have great potential as appropriate non-dopaminergic PDtherapeutics [2,3,6]. In clinical phase II and III trials, the A2AR antagonists istradefylline, preladenant,and tozadenant improved motor symptoms in PD patients [7–9]. Out of these, istradefylline
(Nourianz®) has already been approved in Japan [10] and currently by the U.S. Food and DrugAdministration (FDA) as an adjunctive treatment to L-DOPA.
Furthermore, a comparative neuropathological postmortem study on brain slices from healthysubjects and PD patients showed a 2.5-fold increased striatal A2AR protein level already at early PDstages pointing out that A2AR upregulation is an initial event in the pathogenesis of the disease [11].Though, it remains unclear whether there is a correlation between altered A2AR expression and motorsymptoms in PD.
Molecular imaging of the A2AR with positron emission tomography (PET) enables the non-invasiveinvestigation of pathological changes of the receptor level in the human brain [12].
A clinical PET study using [11C]SCH442416 (Figure 1) revealed a 70–80% increased A2ARavailability in the striatum of PD patients with L-DOPA-induced dyskinesia [13]. This stronglyindicates a key role of A2AR not only in the development of PD [11] but also in the progression ofthe disease and in association with the dopaminergic standard therapy [2,13]. Hence, A2AR-PETis considered as an appropriate tool for early diagnosis and staging of PD as well as evaluation ofpotential A2AR antagonists for PD treatment by means of receptor occupancy studies. The maindisadvantage of 11C-labeled radiotracers for clinical routine applications is the short half-life of thenuclide (t1/2 = 20.3 min). To date, there is only one 18F-labeled (t1/2 = 109.7 min) A2AR radiotracer,[18F]MNI-444 [14,15] (Figure 1), that has already been evaluated in a clinical PET study. In healthyvolunteers [15], a high uptake of activity in the striatum has been observed. However, no follow-upstudies have been published since 2015 and further data of [18F]MNI-444 regarding specificity ofA2AR binding in humans or selectivity over the adenosine A1 receptor (A1R), which is also highlyexpressed in the brain [16,17], are not yet available. For that reason, we selected the well-studiedand highly A2AR-selective radiotracer [18F]FESCH [18–21] (Ki(hA2AR) = 12.4 nM, Ki(hA1R) ~ 10 μM,former [18F]MRS5425 [18]) for our purposes, which is the [18F]fluoroethoxy analog of [11C]SCH442416
(Figure 1). [18F]FESCH has been evaluated in healthy rats and in rats with unilateral PD symptoms byPET showing an A2AR-specific binding in the striatum and a significantly increased A2AR-mediateduptake in the 6-hydroxydopamine-lesioned hemisphere of 9–12% [19,21]. Therefore, [18F]FESCH hasbeen stated as the most suitable radiotracer for quantification of the A2AR in the brain with PET [21].
94
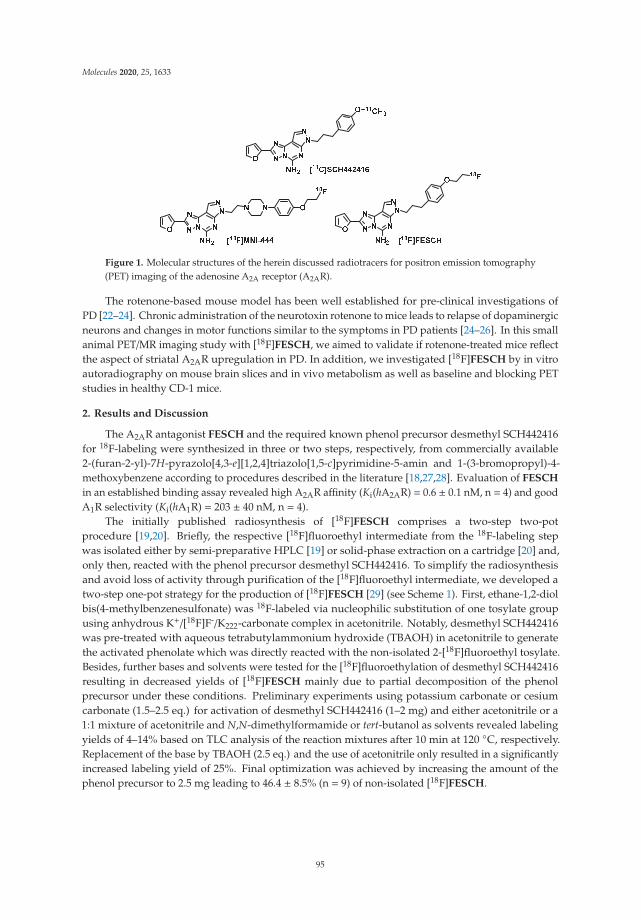
Molecules 2020, 25, 1633
Figure 1. Molecular structures of the herein discussed radiotracers for positron emission tomography(PET) imaging of the adenosine A2A receptor (A2AR).
The rotenone-based mouse model has been well established for pre-clinical investigations ofPD [22–24]. Chronic administration of the neurotoxin rotenone to mice leads to relapse of dopaminergicneurons and changes in motor functions similar to the symptoms in PD patients [24–26]. In this smallanimal PET/MR imaging study with [18F]FESCH, we aimed to validate if rotenone-treated mice reflectthe aspect of striatal A2AR upregulation in PD. In addition, we investigated [18F]FESCH by in vitroautoradiography on mouse brain slices and in vivo metabolism as well as baseline and blocking PETstudies in healthy CD-1 mice.
2. Results and Discussion
The A2AR antagonist FESCH and the required known phenol precursor desmethyl SCH442416for 18F-labeling were synthesized in three or two steps, respectively, from commercially available2-(furan-2-yl)-7H-pyrazolo[4,3-e][1,2,4]triazolo[1,5-c]pyrimidine-5-amin and 1-(3-bromopropyl)-4-methoxybenzene according to procedures described in the literature [18,27,28]. Evaluation of FESCH
in an established binding assay revealed high A2AR affinity (Ki(hA2AR) = 0.6 ± 0.1 nM, n = 4) and goodA1R selectivity (Ki(hA1R) = 203 ± 40 nM, n = 4).
The initially published radiosynthesis of [18F]FESCH comprises a two-step two-potprocedure [19,20]. Briefly, the respective [18F]fluoroethyl intermediate from the 18F-labeling stepwas isolated either by semi-preparative HPLC [19] or solid-phase extraction on a cartridge [20] and,only then, reacted with the phenol precursor desmethyl SCH442416. To simplify the radiosynthesisand avoid loss of activity through purification of the [18F]fluoroethyl intermediate, we developed atwo-step one-pot strategy for the production of [18F]FESCH [29] (see Scheme 1). First, ethane-1,2-diolbis(4-methylbenzenesulfonate) was 18F-labeled via nucleophilic substitution of one tosylate groupusing anhydrous K+/[18F]F-/K222-carbonate complex in acetonitrile. Notably, desmethyl SCH442416was pre-treated with aqueous tetrabutylammonium hydroxide (TBAOH) in acetonitrile to generatethe activated phenolate which was directly reacted with the non-isolated 2-[18F]fluoroethyl tosylate.Besides, further bases and solvents were tested for the [18F]fluoroethylation of desmethyl SCH442416resulting in decreased yields of [18F]FESCH mainly due to partial decomposition of the phenolprecursor under these conditions. Preliminary experiments using potassium carbonate or cesiumcarbonate (1.5–2.5 eq.) for activation of desmethyl SCH442416 (1–2 mg) and either acetonitrile or a1:1 mixture of acetonitrile and N,N-dimethylformamide or tert-butanol as solvents revealed labelingyields of 4–14% based on TLC analysis of the reaction mixtures after 10 min at 120 ◦C, respectively.Replacement of the base by TBAOH (2.5 eq.) and the use of acetonitrile only resulted in a significantlyincreased labeling yield of 25%. Final optimization was achieved by increasing the amount of thephenol precursor to 2.5 mg leading to 46.4 ± 8.5% (n = 9) of non-isolated [18F]FESCH.
95
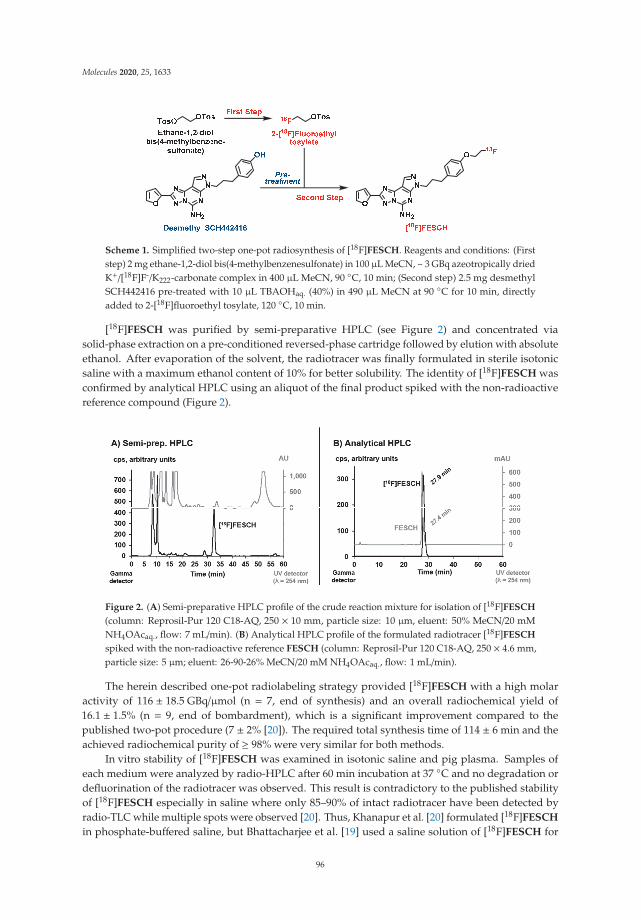
Molecules 2020, 25, 1633
Scheme 1. Simplified two-step one-pot radiosynthesis of [18F]FESCH. Reagents and conditions: (Firststep) 2 mg ethane-1,2-diol bis(4-methylbenzenesulfonate) in 100 μL MeCN, ~ 3 GBq azeotropically driedK+/[18F]F-/K222-carbonate complex in 400 μL MeCN, 90 ◦C, 10 min; (Second step) 2.5 mg desmethylSCH442416 pre-treated with 10 μL TBAOHaq. (40%) in 490 μL MeCN at 90 ◦C for 10 min, directlyadded to 2-[18F]fluoroethyl tosylate, 120 ◦C, 10 min.
[18F]FESCH was purified by semi-preparative HPLC (see Figure 2) and concentrated viasolid-phase extraction on a pre-conditioned reversed-phase cartridge followed by elution with absoluteethanol. After evaporation of the solvent, the radiotracer was finally formulated in sterile isotonicsaline with a maximum ethanol content of 10% for better solubility. The identity of [18F]FESCH wasconfirmed by analytical HPLC using an aliquot of the final product spiked with the non-radioactivereference compound (Figure 2).
Figure 2. (A) Semi-preparative HPLC profile of the crude reaction mixture for isolation of [18F]FESCH
(column: Reprosil-Pur 120 C18-AQ, 250 × 10 mm, particle size: 10 μm, eluent: 50% MeCN/20 mMNH4OAcaq., flow: 7 mL/min). (B) Analytical HPLC profile of the formulated radiotracer [18F]FESCH
spiked with the non-radioactive reference FESCH (column: Reprosil-Pur 120 C18-AQ, 250 × 4.6 mm,particle size: 5 μm; eluent: 26-90-26% MeCN/20 mM NH4OAcaq., flow: 1 mL/min).
The herein described one-pot radiolabeling strategy provided [18F]FESCH with a high molaractivity of 116 ± 18.5 GBq/μmol (n = 7, end of synthesis) and an overall radiochemical yield of16.1 ± 1.5% (n = 9, end of bombardment), which is a significant improvement compared to thepublished two-pot procedure (7 ± 2% [20]). The required total synthesis time of 114 ± 6 min and theachieved radiochemical purity of ≥ 98% were very similar for both methods.
In vitro stability of [18F]FESCH was examined in isotonic saline and pig plasma. Samples ofeach medium were analyzed by radio-HPLC after 60 min incubation at 37 ◦C and no degradation ordefluorination of the radiotracer was observed. This result is contradictory to the published stabilityof [18F]FESCH especially in saline where only 85–90% of intact radiotracer have been detected byradio-TLC while multiple spots were observed [20]. Thus, Khanapur et al. [20] formulated [18F]FESCH
in phosphate-buffered saline, but Bhattacharjee et al. [19] used a saline solution of [18F]FESCH for
96

Molecules 2020, 25, 1633
biological investigations. At present, we have no explanation for that and as we detected only theintact radiotracer in isotonic saline (see Figure 2), formulation of [18F]FESCH in another medium wasnot required.
The distribution coefficient of [18F]FESCH was determined by partitioning between n-octanol andphosphate-buffered saline (PBS, pH = 7.4) at ambient temperature using the conventional shake-flaskmethod. The obtained logD7.4 value of 1.97 ± 0.17 (n = 4) emphasizes the lipophilic character of theradiotracer which allows a passive diffusion through the blood–brain barrier [30–32]. However, there isa discrepancy compared to the published logD value of 3.16 ± 0.03 [20] which might be caused bydifferent experimental setups.
In vitro autoradiography studies were accomplished by incubating sections of mouse brain with[18F]FESCH. Non-specific binding was assessed by co-incubation with an excess of either FESCH orZM241385, respectively. The images demonstrated an A2AR-specific accumulation of [18F]FESCH inthe striatum (Figure 3), which is characterized by the binding parameters KD = 4.69 ± 1.17 nM andBmax = 497 ± 97 fmol/mg wet weight consistent with the literature [33].
Figure 3. Representative autoradiographic images of transversal CD-1 mouse brain slices. (A)In vitro distribution of activity after incubation with 0.2 MBq/mL of [18F]FESCH (TB = total binding).(B) Non-specific binding (NB) of [18F]FESCH determined in the presence of 1 μM of FESCH orZM241385, respectively, as blocking agents. (C) Nissl staining, St = Striatum, Cb = Cerebellum.
For in vivo imaging investigations in healthy CD-1 mice (n = 12, 10 weeks, 30–35 g), [18F]FESCH
was injected intravenously (baseline: 2.8 ± 2 MBq, vehicle: 5.8 ± 2 MBq, blocking: 6.4 ± 2.5 MBqwith n = 4, respectively) and whole body scans were performed for 60 min in listmode with a MedisonanoScan® PET/MR scanner followed by dynamic reconstruction. Time-activity curves (TACs) weregenerated for regions of interest such as striatum and cerebellum as reference region. The obtained PETimages showed a high striatal uptake of [18F]FESCH with a standardized uptake value ratio (SUVR)for striatum over cerebellum of > 5 (9–30 min post injection (p.i.)). In vivo selectivity for the A2AR washighlighted by the significant reduction of the SUVR by 29–42% (9–30 min p.i. with p < 0.05) afterpre-injection of tozadenant as blocking agent (Figure 4). The highest achievable dose of tozadenant
was 2.5 mg/kg with respect to solubility and volume of injection as well as the concentrations of DMSOand Kolliphor® EL suitable for in vivo application in mice. The herein observed blocking effect is inaccordance with the estimated A2AR occupancy for tozadenant in rhesus monkey of about 72% at5 mg/kg [14]. These results indicate that [18F]FESCH is a promising radiotracer for molecular imagingof the A2AR in the brain.
97

Molecules 2020, 25, 1633
Figure 4. (A) Representative horizontal PET images of [18F]FESCH uptake (average 10–30 min) in thebrain of healthy CD-1 mice under vehicle (15 min pre-injection of DMSO:Kolliphor® EL:0.9% NaCl, 1:2:7,5 μL/g) and blocking conditions (15 min pre-injection of tozadenant 2.5 mg/kg in DMSO:Kolliphor®
EL:0.9% NaCl, 1:2:7, 5 μL/g; red = striatum; yellow = cerebellum). (B) Averaged TACs of [18F]FESCH
for vehicle (n = 4) and tozadenant pre-injected mice (n = 4) with SUVRs for striatum over cerebellum.
However, a representative metabolism study revealed only moderate in vivo stability of[18F]FESCH. Analytical radio-HPLC (Figure 5) of the extracted mouse plasma sample showed 41%of intact radiotracer at 15 min p.i. (recovery of total activity = 84%). In the analyzed brain sample,one polar radiometabolite ([18F]M1) was detected accounting for 29% of the total extracted activity at15 min p.i. (recovery = 98%).
Figure 5. Representative in vivo metabolism study of CD-1 mouse plasma and brain samples at 15min p.i. of [18F]FESCH (~ 17 MBq): Analytical radio-HPLC profiles of extracted (A) brain and (B)plasma sample (column: Reprosil-Pur 120 C18-AQ, 250 × 4.6 mm, particle size: 5 μm; eluent: 26-90-26%MeCN/20 mM NH4OAcaq., flow: 1 mL/min).
Compared to the published study in Wistar-Unilever rats (46% intact radiotracer in plasma at60 min p.i. [20]) the in vivo degradation of [18F]FESCH appears to be somewhat faster in mice. Notablyand to the best of our knowledge, the formation of brain-penetrating radiometabolites of [18F]FESCH
has not been regarded before. Based on our experiences with radiotracers bearing a [18F]fluoroethoxymoiety [34,35], the herein observed radiometabolite [18F]M1 is proposed to be 2-[18F]fluoroethanol orthe oxidized 2-[18F]fluoroacetaldehyde and 2-[18F]fluoroacetate, resulting from a cytochrome P450enzyme-induced metabolic degradation [36,37], which are able to cross the blood–brain barrier [38–41].
For PET/MR studies with [18F]FESCH in the rotenone-based mouse model of PD, the radiotracer(9.7± 1.3 MBq) was administrated to C57BL/6JRj mice (control: n= 5; rotenone-treated: n= 7; 16 months,28–35 g) followed by the same imaging protocol used for the baseline and blocking studies in CD-1mice. Although statistically not significant, the averaged TACs between 2 and 61 min p.i. revealed aslightly higher uptake of [18F]FESCH in the striatum of rotenone-treated mice compared to controls.
98

Molecules 2020, 25, 1633
An increase of the SUVR for striatum over cerebellum by 15–33% was observed, which was caused bythe elevated SUV for striatum of 11–27% (21–61 min p.i., respectively; Figure 6).
Figure 6. (A) Representative horizontal PET images of [18F]FESCH uptake (average 2–61 min) inthe brain of control and rotenone-treated C57BL/6JRj mice (red = striatum; yellow = cerebellum).(B) Averaged TACs of [18F]FESCH for control (n = 5) and rotenone-treated mice (n = 7) with SUVs forstriatum and SUVRs for striatum over cerebellum.
These results are in accordance with the determined A2AR levels on C57BL/6JRj mouse brainsections from a comparative in vitro immunofluorescence study. No significant difference in thefluorescence signal of the A2AR between control and rotenone-treated mice was observed (Figure 7).
Figure 7. Mean fluorescence intensity of A2AR staining on the striatum of coronal C57BL/6JRj mousebrain sections: (A) Control vs. rotenone-treated wild-type mice (n = 3, respectively); (B) Young(39 weeks) vs. old (71–76 weeks) A30P transgenic mice (n = 3, respectively).
The increased A2AR availability in the striatum of PD patients appears to be related toL-DOPA-induced dyskinesia. In the rotenone-treated mice, we did not identify any signs of dyskinesiaand, thus, it is not surprising that in this PD mouse model no significant increase in the A2ARdensity was detected either by PET imaging or by immunofluorescence staining. With regard
99

Molecules 2020, 25, 1633
to dyskinesia, the rotenone model is comparable to another neurotoxin-based PD mouse modelusing 1-methyl-4-phenyl-1,2,3,6-tetrahydropyridine (MPTP), where only weak signs of dyskinesiawere observed and this exclusively under L-DOPA treatment [42]. To date, unilateral injection of6-hydroxydopamine (6-OHDA) is the only effective neurotoxin-related approach to replicate evidentlysome forms of dyskinesia in rats and mice. In the 6-OHDA mouse model, dyskinesia is detectedas abnormal involuntary movements (AIMs) with a more simplified range than in rats, presentingmore prominent rotational locomotion with less dystonic features, i.e., axial AIMs [42]. None of theabove-mentioned AIMs were detected in the rotenone-treated mice. Consequently, it remains to beexamined whether treatment with L-DOPA would lead to dyskinesia in the rotenone model as shownfor the MPTP model and if this would cause a quantifiable increase in striatal A2AR levels.
In contrast to the above-discussed neurotoxin-based PD animal models, the A30P mouse linerepresents a transgenic model of PD. This mouse line overexpresses the human A30P mutation in theα-synuclein gene, where the 30th amino acid residue alanine is replaced by proline, in all neurons.The A30P mutation is associated with rare familial cases of PD. Since α-synuclein is a main constituentof Lewy bodies, the A30P transgenic mice are characterized by Lewy body formation in neuronalcell bodies and neurites throughout the brain [43]. The α-synuclein pathology and PD-associatedsymptoms become prominent at about 69 weeks of age [43,44]. In an ongoing study, we detectedslightly, but due to the rather small and highly variable data set statistically non-significant, higherstriatal mean fluorescence intensities of the A2AR signal in older symptomatic A30P transgenic micecompared to younger ones without symptoms (see Figure 7). We will further investigate this PD mousemodel by small animal PET/MR imaging studies using a novel derivative of [18F]FESCH currentlyunder development.
3. Summary and Conclusions
In this study, we investigated the suitability of the known radiotracer [18F]FESCH for in vitroand in vivo imaging of the A2AR in the mouse brain by autoradiography and small animalPET/MR. Contrary to previous estimations, the herein observed brain-penetrating radiometabolitemight limit the applicability of [18F]FESCH for valid quantification of A2AR levels in the striatumwith PET. One promising strategy to decelerate the degradation of 18F-labeled radiotracers is thedeuterium-hydrogen exchange at the metabolic labile position in the molecular structure of thecompound [45]. Thus, our recent efforts are focused on a deuterated derivative of [18F]FESCH withenhanced in vivo stability particularly at the [18F]fluoroethoxy side chain.
In the investigated rotenone-based mouse model of PD, no significant difference in the striatalA2AR density between rotenone-treated mice and controls was detectable by PET imaging orimmunofluorescence staining. These results indicate that the rotenone model does not reflectupregulation of striatal A2AR in PD, which appears to be related to dyskinesia. Therefore, it remainsto be further examined whether treatment with L-DOPA could cause a detectable increase in A2ARlevels in the striatum, which would induce observable dyskinesia in this PD model. In a parallel andongoing study to characterize the A30P mouse model, initial findings reveal that this transgenic modelmight be more suitable with regard to displaying PD-like pathological changes in A2AR availability.
4. Materials and Methods
4.1. General Information
Chemicals and solvents were purchased from standard commercial sources in analytical gradeand were used without further purification. Radio-TLCs were performed on pre-coated silica gelplates (Alugram® Xtra SIL G/UV254, Polygram® SIL G/UV254; Carl Roth, Karlsruhe, Germany).The compounds were localized at 254 nm (UV lamp). Radio-TLC was recorded using a bioimaginganalyzer system (BAS-1800 II, Fuji Photo Film, Co. Ltd., Tokyo, Japan) and images were evaluatedwith Aida 2.31 software (raytest Isotopenmessgeräte GmbH, Straubenhardt, Germany). Column
100

Molecules 2020, 25, 1633
chromatography was conducted on silica gel (0.06–0.20 mm; Carl Roth, Karlsruhe, Germany). HPLCseparations were performed on JASCO systems equipped with UV detectors from JASCO DeutschlandGmbH (Pfungstadt, Germany) and activity detectors from raytest Isotopenmessgeräte GmbH (GABIStar, Straubenhardt, Germany).
Semi-preparative HPLC conditions were: Column: Reprosil-Pur C18-AQ, 250 × 10 mm; particlesize: 10μm; eluent: 50% MeCN/20 mM NH4OAcaq.; flow: 7 mL/min; ambient temperature; UV detectionat 254 nm.
Analytical HPLC conditions were: Column: Reprosil-Pur C18-AQ, 250 × 4.6 mm; particlesize: 5 μm; gradient: 0–10 min: 26% MeCN, 10–35 min: 26%→ 90% MeCN, 35–45 min: 90% MeCN,45–50 min: 90%→ 26% MeCN, 50–60 min: 26% MeCN/20 mM NH4OAcaq.; isocratic: 40% MeCN/20 mMNH4OAcaq.; flow: 1 mL/min; ambient temperature; UV detection at 254 nm. Molar activity wasdetermined on the base of a calibration curve (0.05–2.0 μg FESCH) carried out under isocratic HPLCconditions (36% MeCN/20 mM NH4OAcaq.) using chromatograms obtained at 264 nm as the maximumof UV absorbance.
No-carrier-added (n.c.a.) [18F]fluoride (t1/2 = 109.8 min) was produced via the [18O(p,n)18F]nuclear reaction by irradiation of [18O]H2O (Hyox 18 enriched water, Rotem Industries Ltd, Arava,Israel) on a Cyclone®18/9 (IBA RadioPharma Solutions, Louvain-la-Neuve, Belgium) with fixed energyproton beam using Nirta® [18F]fluoride XL target.
4.2. Radiosynthesis
The aqueous solution of no-carrier-added [18F]fluoride (~ 3 GBq) was trapped on a Chromafix®
30 PS-HCO3− cartridge (MACHEREY-NAGEL GmbH & Co. KG, Düren, Germany). The activity was
eluted with 300 μL of an aqueous K2CO3-solution (1.78 mg, 12.9 μmol) into a 4-mL V-vial containingKryptofix 2.2.2 (K2.2.2, 5.6 mg, 14.9 μmol) in 1 mL MeCN. The K+/[18F]F−/K2.2.2-carbonate complexwas azeotropically dried under vacuum and argon flow within 7–10 min using a Discover PETwaveMicrowave CEM® (75 W, 50–60 ◦C, power cycling mode, CEM GmbH, Kamp-Lintfort, Germany).Two aliquots of MeCN (2 × 1 mL) were added during the drying procedure and the final complex wasdissolved in 400 μL MeCN ready for radiolabeling.
The aliphatic radiolabeling of ethane-1,2-diol bis(4-methylbenzenesulfonate) (Sigma-Aldrich,Munich, Germany; 2 mg in 100 μL MeCN) was performed under conventional heating at 90 ◦Cfor 10 min. After pre-heating of the phenol precursor desmethyl SCH442416 (2.5 mg in 490 μLMeCN) with 10 μL TBAOHaq. (40%) at 90 ◦C for 10 min, this solution was directly added to thecrude 2-[18F]fluoroethyl tosylate and the reaction mixture was stirred for 10 min at 120 ◦C. Aliquotsof the reaction mixtures from both steps were analyzed by radio-TLC (EtOAc/petroleum ether; firststep = 1:1; second step = 6:1) or radio-HPLC (isocratic mode, see General Information) to determine theradiochemical yields of crude 2-[18F]fluoroethyl tosylate (Rf = 0.7, 87.0 ± 2.3%; n = 9) and [18F]FESCH
(Rf = 0.5, 46.4 ± 8.5%; tR = 29.4 min, 34.4 ± 4.1%, decay corrected for tR = 0 min; n = 9), respectively.After dilution with water (1:1), the crude reaction mixture was applied to an isocratic
semi-preparative HPLC (see General Information) for isolation of the desired radiotracer [18F]FESCH
(tR = 32–33 min). The collected fractions were diluted with water (total volume = 40 mL), passedthrough a Sep-Pak® C18 Plus cartridge (Waters, Milford, MA, USA; pre-conditioned with 5 mL ofabsolute EtOH and 60 mL water), and eluted with 1.5 mL of absolute EtOH. Evaporation of the solventat 70 ◦C under a gentle argon stream and subsequent formulation of the radiotracer in sterile isotonicsaline containing 10% EtOH afforded a [18F]FESCH solution usable for biological investigations.
The identity of the radiotracer was proved by analytical radio-HPLC (see General Information) ofsamples of [18F]FESCH spiked with the non-radioactive reference compound FESCH using a gradientand an isocratic mode.
101

Molecules 2020, 25, 1633
4.3. Investigation of In Vitro Stability and Lipophilicity (logD7.4)
The in vitro stability of [18F]FESCH (4–6 MBq) was studied by incubation in isotonic saline and pigplasma (500 μL each) at 37 ◦C. Samples were taken at 60 min and analyzed by radio-HPLC (see GeneralInformation).
The lipophilicity of [18F]FESCH was examined by partitioning between n-octanol andphosphate-buffered saline (PBS, pH = 7.4) at ambient temperature using the conventional shake-flaskmethod. The radiotracer (65 μL, ~ 8 MBq) was added to a tube containing the n-octanol/PBS-mixture(6 mL, 1:1, four-fold determination). The tubes were shaken for 20 min using a mechanical shaker(HS250 basic, IKA Labortechnik GmbH & Co. KG, Staufen, Germany) followed by centrifugation(5500 rpm for 5 min) and separation of the phases. Aliquots were taken from the organic and the aqueousphase (1 mL each) and activity was measured with an automated gamma counter (1480 WIZARD,Fa. Perkin Elmer, Waltham, MA, USA). The distribution coefficient (D7.4) was calculated as [activity(cpm/mL) in n-octanol]/[activity (cpm/mL) in PBS, pH = 7.4] stated as the decade logarithm (logD7.4).
4.4. Binding Assay
Membrane homogenates prepared from stably transfected CHO-K1 cells (Chinese hamster ovarycells, clone K1) with the human A1R or A2AR, provided by Prof. Klotz, University of Würzburg,Würzburg, Germany, were used for the binding experiments. The following radioligands wereemployed: [3H]ZM241385 for the A2AR and [3H]DPCPX for the A1R. For the determination of A2ARand A1R binding affinity of reference compound, frozen cell suspensions were thawed, homogenizedby a 27-gauge needle, and diluted with 50 mM TRIS-HCl buffer (pH = 7.4, 100 mM NaCl, 5 mM MgCl2,1 mM EDTA) containing 1 μU/mL adenosine deaminase (ADA). Membrane suspension was incubatedwith 1.5 nM [3H]ZM241385 or 1 nM [3H]DPCPX and various concentrations of the test compound.Non-specific binding was determined by co-incubation with 10 μM ZM241385 or 1 μM DPCPX.The incubation was performed at room temperature for 90 min and terminated by rapid filtrationusing Whatman GF/B glass-fiber filters, pre-soaked in 0.3% polyethyleneimine and a 48-channelharvester (Biomedical Research and Development Laboratories, Gaithersburg, MD, USA) followedby washing four times with ice-cold TRIS-HCl buffer. Filter-bound radioactivity was quantified byliquid scintillation counting. At least two separate experiments were performed for determination ofKi values. All data were analyzed with GraphPad Prism, Version 4.1 (GraphPad Inc., La Jolla, CA,USA), according to the Cheng–Prusoff equation.
4.5. Animal Experiments
All experimental work including animals was conducted in accordance with the national legislationon the use of animals for research (Tierschutzgesetz (TierSchG), Tierschutz-Versuchstierverordnung(TierSchVersV)) and was approved by the responsible animal care committees of the Free Stateof Bavaria and the Free State of Saxony (TVV 08/13, 24-9168.11/18/8, June 12th, 2013 andTVV 18/18, DD24.1-5131/446/19, June 20th, 2018; Landesdirektion Sachsen). Female CD-1 mice,10–12 weeks, were obtained from the Medizinisch-Experimentelles Zentrum at University of Leipzig,Leipzig, Germany.
4.5.1. In Vitro Autoradiography
Cryosections of brains obtained from female CD-1 mice (10–12 weeks) were thawed, dried in astream of cold air, and pre-incubated in 50 mM TRIS-HCl buffer (pH = 7.4, 100 mM NaCl, 5 mM MgCl2,1 mM EDTA) containing 1 μU/mL adenosine deaminase (ADA) for 15 min at ambient temperature.Afterwards, brain sections were incubated with 0.1–0.2 MBq/mL [18F]FESCH in buffer for 90 minat room temperature. Non-specific binding was determined in the presence of 1 μM of FESCH orZM241385, respectively. Subsequently, the sections were washed twice for 5 min in ice-cold TRIS-HClbuffer, and dipped for 5 s in ice-cold deionized water. The sections were rapidly dried in a stream
102

Molecules 2020, 25, 1633
of cold air before being exposed overnight on an imaging plate (Fujifilm Corporation, Tokyo, Japan).Developed autoradiographs were analyzed in a phosphor imager (HD-CR 35, Duerr NDT GmbH,Bietigheim Bissingen, Germany). The quantification was performed by using 2D-densitometric analysis(AIDA 2.31 software, raytest Isotopenmessgeräte GmbH, Straubenhardt, Germany). Further dataanalysis was performed with GraphPad Prism, Version 4.1 (GraphPad Inc., La Jolla, CA, USA).
4.5.2. Rotenone-Based and A30P Transgenic Mouse Models of Parkinson’s Disease
Animal Housing
Male wild-type C57BL/6JRj mice (Janvier Labs, Le Genest-Saint-Isle, France) and male(Thy1)-h[A30P]α-syn transgenic C57BL/6JRj mice (generated according to the protocol by Kahleet al. [43], hereafter “A30P transgenic mice”) were housed at room temperature under a 12:12 hdark:light cycle. Food and water was provided ad libidum.
Oral Rotenone Administration
Wild-type C57BL/6JRj mice (12 months) were divided into two groups and treated 5 days a weekfor 4 months. A 1.2 mm × 60 mm gavage (Unimed, Lausanne, Switzerland) was used to administer0.01 mL/g animal weight of rotenone (Sigma-Aldrich, Munich, Germany) solution corresponding toa 5 mg/kg dose. Controls were treated only with the vehicle solution (2% carboxymethyl cellulose(Sigma-Aldrich, Munich, Germany) and 1.25% chloroform (Carl Roth, Karlsruhe, Germany)).
4.5.3. Immunofluorescence Staining and Imaging
Immunostaining
Cryosections of brains obtained from wild-type C57BL/6JRj mice (16 months, vehicle androtenone-treated) or A30P transgenic mice (young group = 39 weeks; old group = 71–76 weeks)were immunostained using the free-floating technique and all procedures took place in a well of a12-well plate. Briefly, brain sections were washed with PBS (pH = 7.4) for 10 min, then blocked withblocking solution (PBS, 0.02% Triton-X and 5% donkey serum) for 1 h, and incubated in the first antibody(1:100, rabbit anti-adenosine receptor A2A, ab3461, Abcam, Cambridge, UK) in blocking solution at4 ◦C overnight. On the next day, sections were washed in PBS (4 × 15 min) and incubated with thesecondary antibody (1:500, donkey Alexa® 555 anti-rabbit, Invitrogen/Thermo Fisher Scientific Inc.,Waltham, MA, USA) for three hours at room temperature. Sections were washed in PBS (4 × 15 min),transferred to the slide, and mounted with Mowiol mounting medium (50% PBS, 25% ethylenglycoland 25% glycerol).
Microscopy and Image Analysis
Images were obtained with an Apotome.2 fluorescence microscope (Carl Zeiss Microscopy GmbH,Jena, Germany). Mean fluorescence intensity (MFI) in the striatum was measured using Fiji-ImageJ,a free-software for image analysis (ImageJ v1.52p, National Institutes of Health (NIH), Bethesda, MD,USA). MFI values were normalized to background signal.
4.5.4. Small Animal PET/MR Studies
For the time of the experiments, female CD-1 mice (n = 12; age = 10 weeks; weight = 30–35 g)and male C57BL/6JRj mice (control with n = 5; rotenone-treated with n = 7; age = 16 months;weight = 28–35 g) were kept in a dedicated climatic chamber with free access to water and foodunder a 12:12 h dark:light cycle at a constant temperature of 24 ◦C. The animals received an injectionof [18F]FESCH into the tail vein (5.0 ± 2.5 MBq for CD-1 mice) or retro-orbital (9.7 ± 1.3 MBq forC57BL/6JRj mice) followed by a 60-min PET/MR scan (Mediso nanoScan®, Budapest, Hungary).Each PET image was corrected for random coincidences, dead time, scatter, and attenuation (AC),
103

Molecules 2020, 25, 1633
based on a whole body (WB) MR scan. The reconstruction parameters for the list mode data werethe following: 3D-ordered subset expectation maximization (OSEM), 4 iterations, 6 subsets, energywindow = 400–600 keV, coincidence mode = 1–5, ring difference = 81. The mice were positioned pronein a special mouse bed (heated up to 37 ◦C), with the head fixed to a mouth piece for the anesthetic gassupply with isoflurane in 40% air and 60% oxygen (anesthesia unit: U-410, Agnthos, Lidingö, Sweden;gas blender: MCQ, Rome, Italy). The PET data were collected by a continuous WB scan during theentire investigation. Following the 60-min PET scan, a T1-weighted WB gradient echo sequence (GRE,repetition time = 20 ms, echo time = 6.4 ms) was performed for AC and anatomical orientation. Imageregistration and evaluation of the region of interest (ROI) were done with PMOD (PMOD TechnologiesLLC, v. 3.9, Zurich, Switzerland).
The respective brain regions were identified using the mouse brain atlas templateMa–Benveniste–Mirrione–FDG. The activity data are expressed as mean standardized uptake value(SUV) of the overall ROI.
4.5.5. In Vivo Metabolism Study
The radiotracer [18F]FESCH (~ 17 MBq in 150 μL isotonic saline) was injected into a female CD-1mouse via the tail vein. Brain and blood samples were obtained at 15 min p.i., plasma separated bycentrifugation (14,000 × g, 1 min), and brain homogenized in ~ 1 mL isotonic saline on ice (10 strokesof a polytetrafluoroethylene (Teflon®) plunger at 1000 rpm in a borosilicate glass cylinder; Potter SHomogenizer, B. Braun Melsungen AG, Melsungen, Germany).
Two consecutive extractions were performed as duplicate (plasma) or triplicate (brain)determinations. Plasma (50 μL) and brain samples (250 μL) were added to an ice-cold acetone/watermixture (4:1; plasma or brain sample/organic solvent = 1:4). The samples were vortexed for 1min, incubated on ice for 10 min (first extraction) or 5 min (second extraction) and centrifuged at10,000 rpm for 5 min. Supernatants were collected and the precipitates were re-dissolved in 100μL of the ice-cold acetone/water mixture (4:1) for the second extraction. Activity of aliquots fromsupernatants of each extraction step and of the precipitates was quantified using an automated gammacounter (1480 WIZARD, Fa. Perkin Elmer). The supernatants from both extractions were combined,concentrated at 70 ◦C under argon stream, and analyzed by radio-HPLC (gradient mode, see GeneralInformation). By this protocol, [18F]FESCH was quantitatively extracted from the biological materialas proven by in vitro incubation of the radiotracer in pig plasma.
Author Contributions: S.S., T.H.L., and R.-P.M. designed and performed organic syntheses; S.S., T.H.L., R.T.,and B.W. designed and performed radiosyntheses; S.S., T.H.L., A.C., S.D.-S., W.D.-C., F.P.-M., and P.B. designedand performed in vitro and in vivo studies; M.T., M.K., Q.S., W.D.-C., and P.B. designed and performed PET/MRstudies; S.S., T.H.L., M.T., M.K., A.C., Q.S., S.D.-S., W.D.-C., F.P.-M., and P.B. analyzed the data. All authors readand approved the final manuscript.
Funding: This work (Project No. 100226753) was funded by the European Regional Development Fund (ERDF)and Sächsische Aufbaubank (SAB).
Acknowledgments: We thank Karsten Franke and Steffen Fischer, HZDR, for providing [18F]fluoride.
Conflicts of Interest: The authors declare no conflict of interest.
References
1. Gerlach, M.; Reichmann, H.; Riederer, P. Die Parkinson-Krankheit: Grundlagen, Klinik, Therapie; Springer: Wien,Austria; New York, NY, USA, 2007; p. 453.
2. De Lera Ruiz, M.; Lim, Y.-H.; Zheng, J. Adenosine A2A receptor as a drug discovery target. J. Med. Chem.2014, 57, 3623–3650. [CrossRef] [PubMed]
3. Jorg, M.; Scammells, P.J.; Capuano, B. The dopamine D2 and adenosine A2A receptors: Past, present andfuture trends for the treatment of Parkinson’s disease. Curr. Med. Chem. 2014, 21, 3188–3210. [CrossRef][PubMed]
104

Molecules 2020, 25, 1633
4. Ferre, S.; von Euler, G.; Johansson, B.; Fredholm, B.B.; Fuxe, K. Stimulation of high-affinity adenosine A2
receptors decreases the affinity of dopamine D2 receptors in rat striatal membranes. Proc. Natl. Acad. Sci.USA 1991, 88, 7238–7241. [CrossRef] [PubMed]
5. Ferré, S.; Bonaventura, J.; Tomasi, D.; Navarro, G.; Moreno, E.; Cortés, A.; Lluís, C.; Casadó, V.; Volkow, N.D.Allosteric mechanisms within the adenosine A2A–dopamine D2 receptor heterotetramer. Neuropharmacology2016, 104, 154–160. [CrossRef]
6. Nazario, L.R.; da Silva, R.S.; Bonan, C.D. Targeting adenosine signaling in Parkinson’s disease:From pharmacological to non-pharmacological approaches. Front. Neurosci. 2017, 11, 658. [CrossRef]
7. LeWitt, P.A.; Guttman, M.; Tetrud, J.W.; Tuite, P.J.; Mori, A.; Chaikin, P.; Sussman, N.M.; Group, U.S.S.Adenosine A2A receptor antagonist istradefylline (KW-6002) reduces “off” time in Parkinson’s disease: Adouble-blind, randomized, multicenter clinical trial (6002-US-005). Ann. Neurol. 2008, 63, 295–302. [CrossRef]
8. Hauser, R.A.; Cantillon, M.; Pourcher, E.; Micheli, F.; Mok, V.; Onofrj, M.; Huyck, S.; Wolski, K. Preladenantin patients with Parkinson’s disease and motor fluctuations: A phase 2, double-blind, randomised trial.Lancet Neurol. 2011, 10, 221–229. [CrossRef]
9. Hauser, R.A.; Olanow, C.W.; Kieburtz, K.D.; Pourcher, E.; Docu-Axelerad, A.; Lew, M.; Kozyolkin, O.;Neale, A.; Resburg, C.; Meya, U.; et al. Tozadenant (SYN115) in patients with Parkinson’s disease whohave motor fluctuations on levodopa: A phase 2b, double-blind, randomised trial. Lancet Neurol. 2014, 13,767–776. [CrossRef]
10. Dungo, R.; Deeks, E.D. Istradefylline: First global approval. Drugs 2013, 73, 875–882. [CrossRef]11. Villar-Menéndez, I.; Porta, S.; Buira, S.P.; Pereira-Veiga, T.; Díaz-Sánchez, S.; Albasanz, J.L.; Ferrer, I.;
Martín, M.; Barrachina, M. Increased striatal adenosine A2A receptor levels is an early event in Parkinson’sdisease-related pathology and it is potentially regulated by miR-34b. Neurobiol. Dis. 2014, 69, 206–214.[CrossRef]
12. Khanapur, S.; Waarde, A.V.; Ishiwata, K.; Leenders, K.L.; Dierckx, R.A.J.O.; Elsinga, P.H. Adenosine A2A
receptor antagonists as positron emission tomography (PET) tracers. Curr. Med. Chem. 2014, 21, 312–328.[CrossRef]
13. Ramlackhansingh, A.F.; Bose, S.K.; Ahmed, I.; Turkheimer, F.E.; Pavese, N.; Brooks, D.J. Adenosine 2Areceptor availability in dyskinetic and nondyskinetic patients with Parkinson disease. Neurology 2011, 76,1811–1816. [CrossRef]
14. Barret, O.; Hannestad, J.; Alagille, D.; Vala, C.; Tavares, A.; Papin, C.; Morley, T.; Fowles, K.; Lee, H.; Seibyl, J.;et al. Adenosine 2A receptor occupancy by tozadenant and preladenant in rhesus monkeys. J. Nucl. Med.2014, 55, 1712–1718. [CrossRef]
15. Barret, O.; Hannestad, J.; Vala, C.; Alagille, D.; Tavares, A.; Laruelle, M.; Jennings, D.; Marek, K.; Russell, D.;Seibyl, J.; et al. Characterization in humans of 18F-MNI-444, a novel PET radiotracer for brain adenosine A2A
receptors. J. Nucl. Med. 2015, 56, 586–591. [CrossRef]16. Chen, J.-F.; Eltzschig, H.K.; Fredholm, B.B. Adenosine receptors as drug targets—What are the challenges?
Nat. Rev. Drug Discov. 2013, 12, 265–286. [CrossRef] [PubMed]17. Svenningsson, P.; Hall, H.; Sedvall, G.; Fredholm, B.B. Distribution of adenosine receptors in the postmortem
human brain: An extended autoradiographic study. Synapse 1997, 27, 322–335. [CrossRef]18. Shinkre, B.A.; Kumar, T.S.; Gao, Z.-G.; Deflorian, F.; Jacobson, K.A.; Trenkle, W.C. Synthesis and evaluation
of 1,2,4-triazolo[1,5-c]pyrimidine derivatives as A2A receptor-selective antagonists. Bioorg. Med. Chem. Lett.2010, 20, 5690–5694. [CrossRef] [PubMed]
19. Bhattacharjee, A.K.; Lang, L.; Jacobson, O.; Shinkre, B.; Ma, Y.; Niu, G.; Trenkle, W.C.; Jacobson, K.A.; Chen, X.;Kiesewetter, D.O. Striatal adenosine A2A receptor-mediated positron emission tomographic imaging in6-hydroxydopamine-lesioned rats using [18F]-MRS5425. Nucl. Med. Biol. 2011, 38, 897–906. [CrossRef]
20. Khanapur, S.; Paul, S.; Shah, A.; Vatakuti, S.; Koole, M.J.B.; Zijlma, R.; Dierckx, R.A.J.O.; Luurtsema, G.;Garg, P.; van Waarde, A.; et al. Development of [18F]-labeled pyrazolo[4,3-e]-1,2,4- triazolo[1,5-c]pyrimidine(SCH442416) analogs for the imaging of cerebral adenosine A2A receptors with positron emission tomography.J. Med. Chem. 2014, 57, 6765–6780. [CrossRef]
21. Khanapur, S.; van Waarde, A.; Dierckx, R.A.; Elsinga, P.H.; Koole, M.J. Preclinical evaluation and quantificationof 18F-fluoroethyl and 18F-fluoropropyl analogs of SCH442416 as radioligands for PET imaging of theadenosine A2A receptor in rat brain. J. Nucl. Med. 2017, 58, 466–472. [CrossRef]
105

Molecules 2020, 25, 1633
22. Pan-Montojo, F.; Anichtchik, O.; Dening, Y.; Knels, L.; Pursche, S.; Jung, R.; Jackson, S.; Gille, G.;Spillantini, M.G.; Reichmann, H.; et al. Progression of Parkinson’s disease pathology is reproducedby intragastric administration of rotenone in mice. PLoS ONE 2010, 5, e8762. [CrossRef] [PubMed]
23. Arnhold, M.; Dening, Y.; Chopin, M.; Arévalo, E.; Schwarz, M.; Reichmann, H.; Gille, G.; Funk, R.H.W.;Pan-Montojo, F. Changes in the sympathetic innervation of the gut in rotenone-treated mice as possible earlybiomarker for Parkinson’s disease. Clin. Auton. Res. 2016, 26, 211–222. [CrossRef]
24. Pan-Montojo, F.; Schwarz, M.; Winkler, C.; Arnhold, M.; O’Sullivan, G.A.; Pal, A.; Said, J.; Marsico, G.;Verbavatz, J.M.; Rodrigo-Angulo, M.; et al. Environmental toxins trigger PD-like progression via increasedalpha-synuclein release from enteric neurons in mice. Sci. Rep. 2012, 2, 898. [CrossRef] [PubMed]
25. Moon, Y.; Lee, K.H.; Park, J.-H.; Geum, D.; Kim, K. Mitochondrial membrane depolarization and the selectivedeath of dopaminergic neurons by rotenone: Protective effect of coenzyme Q10. J. Neurochem. 2005, 93,1199–1208. [CrossRef] [PubMed]
26. Betarbet, R.; Sherer, T.B.; MacKenzie, G.; Garcia-Osuna, M.; Panov, A.V.; Greenamyre, J.T. Chronic systemicpesticide exposure reproduces features of Parkinson’s disease. Nat. Neurosci. 2000, 3, 1301–1306. [CrossRef][PubMed]
27. Baraldi, P.G.; Cacciari, B.; Romagnoli, R.; Spalluto, G.; Monopoli, A.; Ongini, E.; Varani, K.; Borea, P.A.7-Substituted 5-amino-2-(2-furyl)pyrazolo[4,3-e]-1,2,4-triazolo[1,5-c]pyrimidines as A2A adenosine receptorantagonists: A study on the importance of modifications at the side chain on the activity and solubility.J. Med. Chem. 2002, 45, 115–126. [CrossRef]
28. Damont, A.; Hinnen, F.; Kuhnast, B.; Schöllhorn-Peyronneau, M.-A.; James, M.; Luus, C.; Tavitian, B.;Kassiou, M.; Dollé, F. Radiosynthesis of [18F]DPA-714, a selective radioligand for imaging the translocatorprotein (18 kDa) with PET. J. Label. Compd. Rad. 2008, 51, 286–292. [CrossRef]
29. Schröder, S.; Lai, T.H.; Kranz, M.; Toussaint, M.; Shang, Q.; Dukic-Stefanovic, S.; Pan-Montojo, F.; Brust, P.Investigation of [18F]FESCH for PET imaging of the adenosine A2A receptor in a rotenone-based mousemodel of Parkinson´s disease and development of a two-step one-pot radiolabeling strategy. J. Label. Compd.Rad. 2019, 62, S183.
30. Tavares, A.A.S.; Lewsey, J.; Dewar, D.; Pimlott, S.L. Radiotracer properties determined by high performanceliquid chromatography: A potential tool for brain radiotracer discovery. Nucl. Med. Biol. 2012, 39, 127–135.[CrossRef]
31. Clark, D.E. In silico prediction of blood–brain barrier permeation. Drug Discov. Today 2003, 8, 927–933.[CrossRef]
32. Waterhouse, R.N. Determination of lipophilicity and its use as a predictor of blood–brain barrier penetrationof molecular imaging agents. Mol. Imaging Biol. 2003, 5, 376–389. [CrossRef] [PubMed]
33. Sihver, W.; Schulze, A.; Wutz, W.; Stusgen, S.; Olsson, R.A.; Bier, D.; Holschbach, M.H. Autoradiographiccomparison of in vitro binding characteristics of various tritiated adenosine A2A receptor ligands in rat,mouse and pig brain and first ex vivo results. Eur. J. Pharmacol. 2009, 616, 107–114. [CrossRef] [PubMed]
34. Schröder, S.; Wenzel, B.; Deuther-Conrad, W.; Teodoro, R.; Kranz, M.; Scheunemann, M.; Egerland, U.;Höfgen, N.; Briel, D.; Steinbach, J.; et al. Investigation of an 18F-labelled imidazopyridotriazine for molecularimaging of cyclic nucleotide phosphodiesterase 2A. Molecules 2018, 23, 556. [CrossRef] [PubMed]
35. Liu, J.; Wenzel, B.; Dukic-Stefanovic, S.; Teodoro, R.; Ludwig, F.-A.; Deuther-Conrad, W.; Schröder, S.;Chezal, J.-M.; Moreau, E.; Brust, P.; et al. Development of a new radiofluorinated quinoline analog for PETimaging of phosphodiesterase 5 (PDE5) in brain. Pharmaceuticals 2016, 9, 22. [CrossRef] [PubMed]
36. Zoghbi, S.S.; Shetty, H.U.; Ichise, M.; Fujita, M.; Imaizumi, M.; Liow, J.-S.; Shah, J.; Musachio, J.L.; Pike, V.W.;Innis, R.B. PET imaging of the dopamine transporter with [18F]FECNT: A polar radiometabolite confoundsbrain radioligand measurements. J. Nucl. Med. 2006, 47, 520–527.
37. Evens, N.; Vandeputte, C.; Muccioli, G.G.; Lambert, D.M.; Baekelandt, V.; Verbruggen, A.M.; Debyser, Z.; VanLaere, K.; Bormans, G.M. Synthesis, in vitro and in vivo evaluation of fluorine-18 labelled FE-GW405833 as aPET tracer for type 2 cannabinoid receptor imaging. Bioorgan. Med. Chem. 2011, 19, 4499–4505. [CrossRef]
38. Lear, J.L.; Ackermann, R.F. Evaluation of radiolabeled acetate and fluoroacetate as potential tracers of cerebraloxidative metabolism. Metab. Brain Dis. 1990, 5, 45–56. [CrossRef]
39. Mori, T.; Sun, L.-Q.; Kobayashi, M.; Kiyono, Y.; Okazawa, H.; Furukawa, T.; Kawashima, H.; Welch, M.J.;Fujibayashi, Y. Preparation and evaluation of ethyl[18F]fluoroacetate as a proradiotracer of [18F]fluoroacetatefor the measurement of glial metabolism by PET. Nucl. Med. Biol. 2009, 36, 155–162. [CrossRef]
106

Molecules 2020, 25, 1633
40. Muir, D.; Berl, S.; Clarke, D.D. Acetate and fluoroacetate as possible markers for glial metabolism in vivo.Brain Res. 1986, 380, 336–340. [CrossRef]
41. Ponde, D.E.; Dence, C.S.; Oyama, N.; Kim, J.; Tai, Y.-C.; Laforest, R.; Siegel, B.A.; Welch, M.J. 18F-Fluoroacetate:A potential acetate analog for prostate tumor imaging—In vivo evaluation of 18F-fluoroacetate versus11C-acetate. J. Nucl. Med. 2007, 48, 420–428.
42. Peng, Q.; Zhong, S.; Tan, Y.; Zeng, W.; Wang, J.; Cheng, C.; Yang, X.; Wu, Y.; Cao, X.; Xu, Y. The rodent modelsof dyskinesia and their behavioral assessment. Front. Neurol. 2019, 10, 1016. [CrossRef] [PubMed]
43. Kahle, P.J.; Neumann, M.; Ozmen, L.; Müller, V.; Jacobsen, H.; Schindzielorz, A.; Okochi, M.; Leimer, U.;van der Putten, H.; Probst, A.; et al. Subcellular localization of wild-type and Parkinson’s disease-associatedmutant α-synuclein in human and transgenic mouse brain. J. Neurosci. 2000, 20, 6365–6373. [CrossRef][PubMed]
44. Wagner, J.; Ryazanov, S.; Leonov, A.; Levin, J.; Shi, S.; Schmidt, F.; Prix, C.; Pan-Montojo, F.; Bertsch, U.;Mitteregger-Kretzschmar, G.; et al. Anle138b: A novel oligomer modulator for disease-modifying therapy ofneurodegenerative diseases such as prion and Parkinson’s disease. Acta Neuropathol. 2013, 125, 795–813.[CrossRef] [PubMed]
45. Kuchar, M.; Mamat, C. Methods to increase the metabolic stability of 18F-radiotracers. Molecules 2015, 20,16186–16220. [CrossRef]
Sample Availability: Not available.
© 2020 by the authors. Licensee MDPI, Basel, Switzerland. This article is an open accessarticle distributed under the terms and conditions of the Creative Commons Attribution(CC BY) license (http://creativecommons.org/licenses/by/4.0/).
107


molecules
Article
Synthesis and In Vitro Evaluation of8-Pyridinyl-SubstitutedBenzo[e]imidazo[2,1-c][1,2,4]triazines asPhosphodiesterase 2A Inhibitors
Rien Ritawidya 1,2,*, Friedrich-Alexander Ludwig 1, Detlef Briel 3, Peter Brust 1 and
Matthias Scheunemann 1,*
1 Department of Neuroradiopharmaceuticals, Institute of Radiopharmaceuticals Cancer Research,Helmholtz-Zentrum Dresden-Rossendorf, 04318 Leipzig, Germany
2 Center for Radioisotope and Radiopharmaceutical Technology, National Nuclear and EnergyAgency (BATAN), Puspiptek Area, Serpong, South Tangerang 15310, Indonesia
3 Pharmaceutical/Medicinal Chemistry, Institute of Pharmacy, Faculty of Medicine, Leipzig University,Brüderstraße 34, 04103 Leipzig, Germany
* Correspondence: [email protected] or [email protected] (R.R.); [email protected] (M.S.);Tel.: +49-341-234-179-4611 (R.R.); +49-341-234-179-4618 (M.S.)
Academic Editor: Diego Muñoz-TorreroReceived: 24 May 2019; Accepted: 26 July 2019; Published: 31 July 2019
Abstract: Phosphodiesterase 2A (PDE2A) is highly expressed in distinct areas of the brain, which areknown to be related to neuropsychiatric diseases. The development of suitable PDE2A tracers forPositron Emission Tomography (PET) would permit the in vivo imaging of the PDE2A and evaluationof disease-mediated alterations of its expression. A series of novel fluorinated PDE2A inhibitors onthe basis of a Benzoimidazotriazine (BIT) scaffold was prepared leading to a prospective inhibitorfor further development of a PDE2A PET imaging agent. BIT derivatives (BIT1–9) were obtainedby a seven-step synthesis route, and their inhibitory potency towards PDE2A and selectivity overother PDEs were evaluated. BIT1 demonstrated much higher inhibition than other BIT derivatives(82.9% inhibition of PDE2A at 10 nM). BIT1 displayed an IC50 for PDE2A of 3.33 nM with 16-foldselectivity over PDE10A. This finding revealed that a derivative bearing both a 2-fluoro-pyridin-4-yland 2-chloro-5-methoxy-phenyl unit at the 8- and 1-position, respectively, appeared to be the mostpotent inhibitor. In vitro studies of BIT1 using mouse liver microsomes (MLM) disclosed BIT1 asa suitable ligand for 18F-labeling. Nevertheless, future in vivo metabolism studies are required.
Keywords: Phosphodiesterase 2A (PDE2A); Positron Emission Tomography (PET); Benzoimidazotriazine(BIT); fluorinated; Mouse Liver Microsomes (MLM)
1. Introduction
Cyclic nucleotide Phosphodiesterases (PDEs) represent a class of enzymes catalyzing the hydrolysisof the intracellular second messengers, cyclic Adenosine Monophosphate (cAMP) and cyclic GuanosineMonophosphate (cGMP) [1]. cAMP and cGMP are involved in a great variety of cellular functionsrelated to physiological and pathophysiological processes in brain and periphery [2–6].
The 11 family members of PDEs are encoded by 21 genes and classified by their substratespecificity [7–10]. PDEs 4, 7, and 8 are cAMP-specific and PDEs 5, 6, and 9 cGMP-specific, and others(PDEs 1, 2, 3, 10, and 11) hydrolyze both substrates [7,9,11].
The dual substrate enzyme PDE2A is highly expressed in some brain areas, such as nucleusaccumbens, cortex, hippocampus [7], striatum, amygdala [12], substantia nigra, and olfactory
Molecules 2019, 24, 2791; doi:10.3390/molecules24152791 www.mdpi.com/journal/molecules109

Molecules 2019, 24, 2791
neurons [13–15], thus being involved in complex neuronal processes like learning, concentration,memory, emotion, and related diseases [8,9]. The inhibition of PDE2A will increase the intracellularlevels of cGMP and cAMP in PDE2A-abundant tissues and may result in improvement of neuroplasticityand memory function [8].
The activity of PDE2A inhibitors related to cognitive improvement has been evaluated in animalmodels [1,7,16,17]. These results suggest the use of PDE2A inhibitors for treatment of neuropsychiatricdiseases such as Alzheimer’s disease and schizophrenia [18].
Up to now, there have been several PDE2A inhibitors reported. BAY 60-7550 (Figure 1), the firsthighly-selective PDE2A inhibitor, has been widely used to evaluate PDE2A activity. However,this compound shows a poor pharmacokinetic profile, as well as poor ability to cross the blood-brainbarrier [11,16]. The finding of BAY 60-7550 triggered many pharmaceutical companies to discoverpotent PDE2A inhibitors for potential use in treating a variety of brain diseases [11].
Figure 1. Different PDE inhibitors [15,19–27].
In 2010, Biotie Therapies and Wyeth claimed a series of 1,2,4-triazine- and pyrazine-containingtricyclic compounds exhibiting dual inhibition against both PDE2A and PDE10A as therapeutictargets [25–28]. The triazine series comprises benzo- and pyridine-fused imidazo[5,1-c][1,2,4]triazinederivatives [27], some of which are depicted in Figure 1 (Compounds I (TA1), II, and III), along withtheir binding affinities. In 2015, our group reported on the first PDE2A PET tracers on the basisof a Pyridoimidazotriazine (PIT) scaffold starting from I (TA1, Figure 1), as the lead compound.Two fluoroalkyl derivatives, TA3 and TA4 (Figure 1), demonstrated high affinity towards PDE2Awith 28-fold and 125-fold selectivity over PDE10A, respectively [15,21]. More recently, we gaineda further improvement in terms of in vitro PDE2A binding via replacement of the 1-methoxy in TA1
by 1-(2-fluoroethoxy), resulting in the compound TA5, (Figure 1) [15,21,22]. However, after successful18F-labeling, the obtained tracers, [18F]TA3 and [18F]TA4, did not entirely succeed and were provento be suitable only for in vitro autoradiographic PDE2A imaging. Beyond that, [18F]TA5 failed todemonstrate specific binding in vitro [22]. The formation of brain-penetrating radiometabolites dueto the O-defluoroalkylation limited their application for in vivo PDE2A imaging. Therefore, furtherstructural modifications of tricyclic lead are inevitably required to allow appropriate in vivo PDE2Aimaging [21,22]. A further tracer, [18F]AQ28A, obtained as a developmental compound from ourPDE10 program (AQ28A, Figure 1), was proven to be sufficiently metabolically stable and to enable
110

Molecules 2019, 24, 2791
in vivo imaging of PDE10A in rodents by PET [24]. As one feature, the fluorinated aromatic ring ofthis compound was ascribed to its performance as a promising tracer.
As part of our ongoing commitment in 18F-PET tracer development devoted to PDE imaging(2A, 5A, and 10A) [21,22,24,29], we focused on Benzoimidazotriazine (BIT) as the scaffold, which differsin a benzo ring formally replacing the pyrido ring of our hitherto investigated TA compounds.Because of our findings from AQ28A, we felt encouraged to combine a 2-fluorpyridine moiety asa fluorine-bearing group with structural features required for PDE2A binding (Figure 2). Herein,we report the synthesis and in vitro evaluation of fluorinated derivatives containing a BIT scaffold andthe selection of a promising ligand for the development of a 18F-labeled ligand for PDE2A imagingwith PET. The use of a benzo fused imidazo[2,1-c][1,2,4]triazine allows us to readily perform structuralmodification in the six-membered benzo ring (8-position) while retaining the structural modifiability ofthe imidazole portion (1-position) of the tricycle (Figure 2). An example of this BIT series, compoundIII (Figures 1 and 2), bearing no substituent at the 6-position, was more potent to PDE2A in comparisonto II and served as the lead in our studies [26].
Figure 2. Approach for structural modification of the lead structure III.
Therefore, our strategy was to modify this structure by changing the substituents at 1-(phenyl) andthe 8-position (pyridinyl instead of F) in order to obtain potent and selective PDE2A inhibitors(Figure 2). These can be established via a standard palladium (Pd)-catalyzed Suzuki couplingreaction [30]. Our main interest was to obtain fluorinated compounds for the development of PDE2APET tracers. Therefore, the introduction of fluorine-containing groups particularly at the 8-position(pyridinyl) is required. According to our previous work, several fluorinated pyridinyl substituentsmay enhance the potency and selectivity to PDE2A, and the incorporation of the pyridine moiety istolerable. Besides, pyridine, as an electron-deficient aromatic ring, offers a convenient way to performradiofluorination via nucleophilic aromatic substitution [31]. Furthermore, fluorinated pyridinylsubstituents are relatively more stable towards metabolic degradation compared with fluoroalkylgroups, which were found to be more prone to defluoroalkylation [15,21,22,24].
2. Results and Discussion
2.1. Chemistry
The first of our synthetic approaches focused on bromo-3-methylbenzo[e]imidazo[5,1-c][1,2,4]triazine(Scheme 1, Compound 5) as the key intermediate for further conversions into the desired final products(BIT derivatives). The 8-bromo-substituted tricycle 5 was synthesized in four steps starting from4-bromo-2-fluoro-aniline (1) as depicted in Scheme 1.
111

Molecules 2019, 24, 2791
Scheme 1. Synthesis of Compound 5. (i) Oxidation, NaBO3·4H2O, acetic acid, 65 ◦C, 2–3 d;(ii) 4-methyl-1H-imidazole, K2CO3, DMF, room temperature (rt), 1–2 d; (iii) Fe (5 eq), HOAc/EtOH,reflux, 2.5 h; (iv) NaNO2, acetic acid, H2O, rt, 1 h.
The oxidation of the aromatic amino group with sodium perborate tetrahydrate (NaBO3·4H2O)in acetic acid afforded nitro compound 2 in a 51% yield. To avoid significant by-product formation,the reaction temperature was kept below 65 ◦C, and the aniline 1 was slowly added to the oxidizingagent [23]. The obtained 4-bromo-2-fluoro-nitrobenzene (2) was reacted with 4-methyl-1H-imidazoleto provide the corresponding N-aryl-4- and N-aryl-5-methylimidazoles 3 and 3b. This nucleophilicaromatic substitution (SNAr) employed 1.2 eq of 4-Me-imidazole and 2.0 eq of K2CO3 in DMF andformed a mixture of 3 and 3b in a ratio of ~4:1 [32,33]. However, the main regioisomer 3 couldbe purified via repeated recrystallization from methanol (50% yield). The reduction of 3 using ironafforded aniline 4 in high yield (92%). The iron powder represents a preferred reducing agent for nitrocompounds bearing sensitive functional groups such as halides and/or other reducible groups [34].A subsequent one-pot diazotation-intramolecular azo coupling of compound 4 by use of aqueoussodium nitrite in acetic acid gave the intermediate 5 in a satisfactory yield of 93%. The overall yieldwas 22%.
The synthesis of diaryl-substituted compounds (BIT derivatives) starting from 5 is depicted inScheme 2. Positions 1 and 8 were substituted with different aryl moieties by two independent Suzukicouplings, possible through an intermediate bromination on position 1. The first Suzuki couplingwas used to introduce a substituted pyridine ring to the 8-position. Six different Boronic Acids (BAs),including fluoropyridinyl boronic acids (8a–8d) and pyridinyl boronic acids (8e and 8f) as well,were coupled in the presence of K2CO3 as a base and Pd(Ph3)4 as a catalyst under standard conditions(Scheme 1, Table 1).
Cross-coupling products 6a–6f were obtained after flash column chromatography purification inyields from 28%–98%, as depicted in Table 1. Afterwards, the bromination of the imidazo fused ring inthe 1-position was carried out using N-bromosuccinimide (NBS) in acetonitrile at room temperatureand provided Compounds 7a–7f in moderate to high yields (Table 1).
112

Molecules 2019, 24, 2791
Scheme 2. Approach to achieve a series of nine BIT derivatives. (i) R1B(OH)2 (8a–8f), K2CO3, Pd(PPh3)4,1,4-dioxane:H2O (4:1), reflux, 1–2 d; (ii) NBS, MeCN, rt 4–6 h; (iii) R2B(OH)2 (9a [phe-1-B(OH)2],9b [phe-2-B(OH)2]), or R2B(pin) (9c, [phe-3-B(pin)]), K2CO3, Pd(PPh3)4, dioxane:H2O (4:1), reflux,1–2 d.
Table 1. Yields of Suzuki coupling with compound 5 (products: 6a–6f) and of bromination (products:7a–7f).
Entry Starting Boronic Acid (BA)Product of First
Suzuki CouplingYield
Product ofBromination
Yield
1 2-fluoro-pyridine-4-yl-BA (8a) 6a 76% 7a 79%2 6-fluoro-pyridine-3-yl-BA (8b) 6b 28% 7b 63%3 2-fluoro-pyridine-3-yl-BA (8c) 6c 98% 7c 88%4 3-fluoro-pyridine-5-yl-BA (8d) 6d 56% 7d 98%5 pyridine-3-yl-BA (8e) 6e 77% 7e 87%6 pyridine-4-yl-BA (8f) 6f 87% 7f 92%
By a second Suzuki coupling, the five-membered imidazole portion was functionalized (Scheme 2).Initially, two ortho-chlorophenyl boronic acid (BA) derivatives 9a and 9c were used for couplingwith 7a and 7b, as well. In addition, to include the 5′′-methoxy substituted BA 9a, we investigateda derivative with a modified propoxy substitution by using 9c with a (3-methyloxetan-3-yl)methoxymoiety at the C-5′′-position (Scheme 2, 9c [phe-3-B(pin)]). It has been reported that an oxetane residuemay modulate and positively influence physicochemical, as well as biological properties of a drugcandidate [35,36]. Besides, an oxetane moiety is regarded to induce stability towards metabolic attacksimilar to a corresponding geminal dimethyl unit (gem-Me2) [37], but in contrast will not increase thelipophilicity of the compound [35,36]. To make this oxetane derivative available, we prepared boronicester 9c in three steps, starting from 3-bromo-phenol (10) (Scheme 3).
113

Molecules 2019, 24, 2791
Scheme 3. Preparation of 9c. (i) 3-methyloxetan-3-yl-methyl-mesylate, Cs2CO3, K2CO3, MeCN,75–79 ◦C, 18 h; (ii) B2pin2, PdCl2(dppf), KOAc, 2-Me-THF, Ar; (iii) NCS, DMF, rt.
First, phenol 10 was reacted with 3-methyloxetan-3-yl-methyl-mesylate to provide aryl ether 11
(85% yield). Afterwards, Miyaura-borylation was performed to react 11 with bis(pinacolato)diboron(B2pin2) in the presence of PdCl2(dppf) and KOAc as a catalyst and base, respectively, providingboronate ester 12 in a good yield of 81%. Finally, the chlorination of 12 ortho to the boronate ester bymeans of N-chloro-succinimide (NCS) in DMF at room temperature afforded 9c in a yield of 56% [38].
Boronic acid derivatives 9a and 9c were reacted with 7a and 7b via cross-coupling under conditionssimilar to those described for the reactions of BAs 8a–8f with compound 5. Reaction products BIT1,BIT2, and BIT3 were obtained in satisfactory yields, as depicted in Table 2 (Entries 1–3).
Table 2. Series of BIT derivatives according to Scheme 2.
Entry Bromo CompoundBoronic Acid
DerivativeR1/R2 Product Yield
1 7a 9a 2-F-pyr-4/phe-1 BIT1 80%2 7b 9c 6-F-pyr-3/phe-3 BIT2 79%3 7a 9c 2-F-pyr-4/phe-3 BIT3 68%4 7b 9a 6-F-pyr-3/phe-1 BIT4 64%5 7c 9a 2-F-pyr-3/phe-1 BIT5 69%6 7a 9b 2-F-pyr-4/phe-2 BIT6 72%7 7d 9a 5-F-pyr-3/phe-1 BIT7 56%8 7e 9b pyr-3/phe-2 BIT8 82%9 7f 9b pyr-4/phe-2 BIT9 39%
In vitro evaluation data of the first series of final compounds revealed BIT1 to have a higherinhibitory potency towards PDE2A in contrast to BIT2 and BIT3 (see the In Vitro Evaluation section).Therefore, on the basis of this first finding, we prepared further BIT derivatives and investigated theeffect of an alteration of the pyridinyl substitution in 8-position on the PDE2A inhibition. For thatpurpose, we synthesized BIT4–BIT9 with the methoxy group in the 5′′-position, since this substitutionappeared to be the most promising for the inhibition of PDE2A. Of the newly-synthesized compounds,BIT6, BIT8, and BIT9 possessed the fluoro substitution in position 2′′ of the phenyl residue. BIT4–BIT9
were obtained in moderate to good yields as shown in Table 2 (Entries 4–9). After characterization byone- and two-dimensional NMR spectroscopy and HR-MS (see Supplementary Materials), the newderivatives were evaluated in vitro (see the In Vitro Evaluation Section).
2.2. In Vitro Evaluation: Structure-Activity Relationships of BIT Derivatives
Final products (BIT derivatives) were evaluated in vitro towards PDEs by means of radioligandbinding assays. Inhibition of PDE2A was measured at an inhibitor concentration of 10 nM and thoseof other PDEs at a concentration of 1 μM for each BIT derivative. The inhibitory potencies of all BITcompounds are summarized in Table 3.
114

Molecules 2019, 24, 2791
Table 3. Percentage inhibition of PDE sub-types from synthesized compounds; for PDE2A3,the compounds were measured at a concentration of 10 nM and for PDE4A1, PDE5A1, PDE9A1,and PDE10A1 at 1 μM.
Inhibition of PDE Sub-Types (%)
2A3 4A1 5A1 9A1 10A1
BIT1 82.9 58.6 29.3 NI 32.4BIT2 8.52 64.1 NI NI 2.46BIT3 13.2 72.7 NI NI 28.2BIT4 2.63 NI NI NI 10.8BIT5 NI NI NI NI 22.1BIT6 56.6 54.2 13.6 28.4 74.0BIT7 50.6 65.7 25.1 11.5 87.0BIT8 NI 13.9 36.2 NI 55.5BIT9 80.5 86.8 57.7 17.5 96.6TA1 93.5 24.9 3.08 NI 41
NI: No Inhibition
We first focused our attention on modifications at the 1-position while keeping the2-fluoropyridin-4-yl (2-F-pyr-4) fixed at the 8-position as for compounds BIT1 and BIT3. Accordingto our previous work [21], a longer alkyl side chain length (3-fluoropropoxy to 4-fluorobutoxy,as TA3–TA4) contributes to improved potency, as well as selectivity towards PDE2A, as was alsoshown for TA1 (Figure 1) [15,21]. However, the substitution of the 5′′-methoxy group (BIT1) bya (3-methyloxetan-3-yl)methoxy moiety (BIT3) in the 1-phenyl moiety resulted in a strong reduction ofinhibitory potency towards PDE2A3 from 82.9% to 13.2% (at 10 nM). One possible explanation forthat result might be the increased polarity of the chosen oxetanyl-methoxy residue compared withalkoxy groups, which possibly is unfavorable for key interactions towards PDE2A. It was reportedthat the phenylpropyl portion in the imidazole ring of BAY 60-7550 interacts with Leu770, one ofthe amino acids that is known to be responsible for hydrophobic pocket (H-pocket) formation in thePDE2A active site [39]. Moreover, BAY 60-7550 binding to the PDE2A active site suggested that theselectivity for PDE2A was generated from the ability of the ligand to induce a conformational changeof Leu770 [1,39]. Therefore, it is hypothesized that BIT3 may not induce the conformational change ofthe Leu770 amino acid that generates the selectivity pocket formation, thus leading to potency lossestowards PDE2A [1,39].
In the case of a pair of 6-F-pyr-3-substituted products, BIT2 and BIT4, a weak inverse effect ofPDE2A binding was observed [40], depending on the nature of the 5′′ substituent and in comparisonto BIT3/BIT1. Strikingly, the much lower inhibition displayed by BIT4 (2.63%) in contrast to BIT1
(82.9%), bearing the same phe-1 substituent, points to the impact of the pyridine substitution pattern inexerting inhibition on PDE2A.
In this connection, another factor that contributes to the selectivity of BAY 60-7550 isa glutamine-switch mechanism [39], which is generally proposed for dual substrate-specific PDEs,such as PDE2A [1,39]. We assume that triazine N-5 in our scaffold might accept a hydrogen bond fromGln859 in a similar mode as described for the pyrazine portion in bioisosteric triazoloquinoxaline-basedPDE2A inhibitors [16,20]. We further investigated the influence of different pyridinyl substituents atthe 8-position on PDE2A inhibition while keeping the phe-1 fixed at the 1-position. In addition toBIT4, containing a 6-F-pyr-3, the PDE2A inhibition also dropped significantly with BIT5, containinga 2-F-pyr-3 at the 8-position. Interestingly, a potency of at least 50% remained with the introduction ofthe 5-F-pyr-3 residue (BIT7) at the 8-position. It is not unambiguously clear whether this was causedonly by the position of the pyridine nitrogen, which may affect rotational freedom of the ring viaactive site H-bonding to the pyridine N [16], or in the case of BIT1 and BIT7, additionally by X-H···F-Cinteractions with fluorine [41,42]. Considering this, we found an influence of substituent variation atthe 8-position while keeping phe-1 at the 1-position in decreasing order of activity towards PDE2A
115
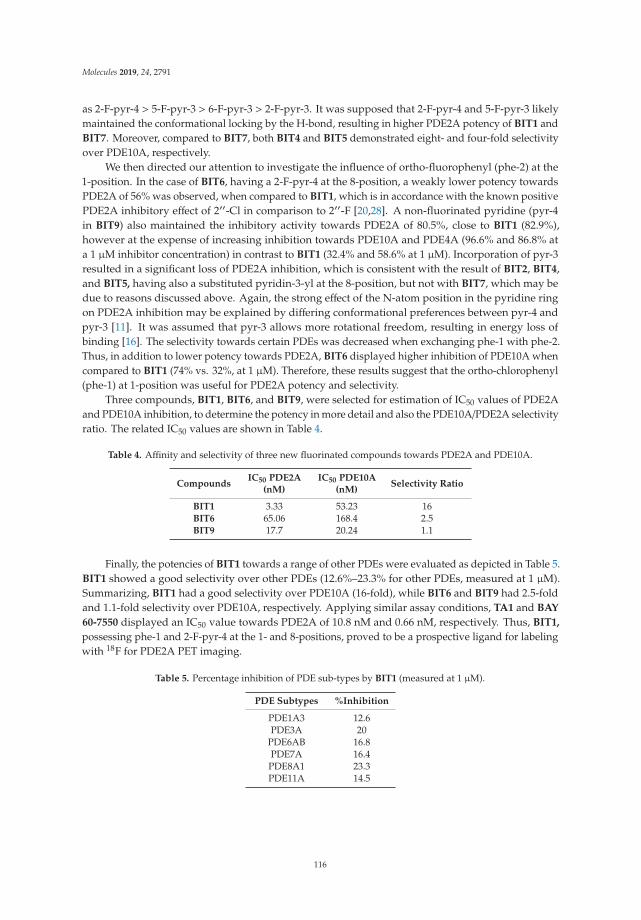
Molecules 2019, 24, 2791
as 2-F-pyr-4 > 5-F-pyr-3 > 6-F-pyr-3 > 2-F-pyr-3. It was supposed that 2-F-pyr-4 and 5-F-pyr-3 likelymaintained the conformational locking by the H-bond, resulting in higher PDE2A potency of BIT1 andBIT7. Moreover, compared to BIT7, both BIT4 and BIT5 demonstrated eight- and four-fold selectivityover PDE10A, respectively.
We then directed our attention to investigate the influence of ortho-fluorophenyl (phe-2) at the1-position. In the case of BIT6, having a 2-F-pyr-4 at the 8-position, a weakly lower potency towardsPDE2A of 56% was observed, when compared to BIT1, which is in accordance with the known positivePDE2A inhibitory effect of 2′′-Cl in comparison to 2′′-F [20,28]. A non-fluorinated pyridine (pyr-4in BIT9) also maintained the inhibitory activity towards PDE2A of 80.5%, close to BIT1 (82.9%),however at the expense of increasing inhibition towards PDE10A and PDE4A (96.6% and 86.8% ata 1 μM inhibitor concentration) in contrast to BIT1 (32.4% and 58.6% at 1 μM). Incorporation of pyr-3resulted in a significant loss of PDE2A inhibition, which is consistent with the result of BIT2, BIT4,and BIT5, having also a substituted pyridin-3-yl at the 8-position, but not with BIT7, which may bedue to reasons discussed above. Again, the strong effect of the N-atom position in the pyridine ringon PDE2A inhibition may be explained by differing conformational preferences between pyr-4 andpyr-3 [11]. It was assumed that pyr-3 allows more rotational freedom, resulting in energy loss ofbinding [16]. The selectivity towards certain PDEs was decreased when exchanging phe-1 with phe-2.Thus, in addition to lower potency towards PDE2A, BIT6 displayed higher inhibition of PDE10A whencompared to BIT1 (74% vs. 32%, at 1 μM). Therefore, these results suggest that the ortho-chlorophenyl(phe-1) at 1-position was useful for PDE2A potency and selectivity.
Three compounds, BIT1, BIT6, and BIT9, were selected for estimation of IC50 values of PDE2Aand PDE10A inhibition, to determine the potency in more detail and also the PDE10A/PDE2A selectivityratio. The related IC50 values are shown in Table 4.
Table 4. Affinity and selectivity of three new fluorinated compounds towards PDE2A and PDE10A.
CompoundsIC50 PDE2A
(nM)IC50 PDE10A
(nM)Selectivity Ratio
BIT1 3.33 53.23 16BIT6 65.06 168.4 2.5BIT9 17.7 20.24 1.1
Finally, the potencies of BIT1 towards a range of other PDEs were evaluated as depicted in Table 5.BIT1 showed a good selectivity over other PDEs (12.6%–23.3% for other PDEs, measured at 1 μM).Summarizing, BIT1 had a good selectivity over PDE10A (16-fold), while BIT6 and BIT9 had 2.5-foldand 1.1-fold selectivity over PDE10A, respectively. Applying similar assay conditions, TA1 and BAY
60-7550 displayed an IC50 value towards PDE2A of 10.8 nM and 0.66 nM, respectively. Thus, BIT1,
possessing phe-1 and 2-F-pyr-4 at the 1- and 8-positions, proved to be a prospective ligand for labelingwith 18F for PDE2A PET imaging.
Table 5. Percentage inhibition of PDE sub-types by BIT1 (measured at 1 μM).
PDE Subtypes %Inhibition
PDE1A3 12.6PDE3A 20
PDE6AB 16.8PDE7A 16.4
PDE8A1 23.3PDE11A 14.5
116

Molecules 2019, 24, 2791
2.3. Incubations with Mouse Liver Microsomes
To gain first information about whether BIT1 is prone to metabolic degradation, the compoundwas investigated in an in vitro test system. Briefly, BIT1 was incubated with Mouse Liver Microsomes(MLM), in the presence of NADPH, at 37 ◦C for 90 min [43]. After protein precipitation by addition ofacetonitrile and subsequent centrifugation, the supernatant was examined by HPLC-UV-MS.
After incubation with MLM for 90 min, unchanged BIT1 could still be detected in high amounts(Figure 3). The main fractions of in vitro metabolites were products of a mono-oxygenation of BIT1,namely Metabolites M3, M5, and M6 (see Table 6).
Figure 3. HPLC-UV chromatogram after incubation of BIT1 with MLM in the presence of NADPH(for conditions, see the experimental part): (a) UV chromatogram (partial) recorded during gradientelution (Method A); (b) UV chromatogram recorded during isocratic elution (Method B).
Table 6. Overview of HPLC and MS data of in vitro metabolites of BIT1 formed by MLM in thepresence of NADPH.
MetabolitetR (min)
Method AGradient
tR (min)Method BIsocratic
m/zFound
m/zTheoret.
Identification
BIT1 11.28 16.10 420.7 420.1 parent (M + H)+
M1 8.47 2.85 422.7 422.1 reduction(M + 2H + H)+
M2 9.05 4.24 452.8 452.1 di-oxygenation(M + 2O + H)+
M3 9.33 5.02 436.7 436.1 mono-oxygenation(M + O + H)+
M4 9.86 7.03 406.6 406.1 demethylation(M-CH3 + H)+
M5 10.67 12.04 436.7 436.1 mono-oxygenation(M + O + H)+
M6not
detected 17.89 436.7 436.1 mono-oxygenation(M + O + H)+
The metabolite M6 was detectable only by an HPLC method with isocratic elution as shownin Figure 3b. Furthermore, one metabolite resulting from a two-fold oxygenation (M2) was found.Due to the limitations of a single quadrupole MS, it was not possible to obtain information regarding
117

Molecules 2019, 24, 2791
the sites of functionalization in the molecule, neither to distinguish products from N-oxidation orC-hydroxylation [44]. In contrast, for the formation of M1 and M4 by reduction and demethylation,respectively, the chloro(methoxy)-phenyl moiety is expected to undergo these reactions under theconditions applied.
The considerable metabolic stability of BIT1 in vitro supports the potential suitability of thecorresponding 18F-labelled compounds as a radioligand for PET. However, due to the retentionproperties of the metabolite M6 in HPLC this metabolite may have a similar or higher lipophilicity incomparison to BIT1. Therefore, of the metabolites detected, M6 most likely bears the risk of passing theblood-brain barrier and influencing brain PET results. Hence, future in vivo metabolism studies shouldpay attention to the occurrence of this metabolite, as well as to distinguish it chromatographically fromthe parent compound.
3. Materials and Methods
3.1. General Information
Chemicals were purchased from following suppliers: Manchester Organics, abcr, VWR, Fluka,Acros, Roth, ChemPure, Merck, Sigma Aldrich, Apollo scientific, and Fluorochem. Solvents weredried before use, if required. Air- and moisture-sensitive reactions were carried out under argonatmosphere. Room temperature (rt) refers to 20–25 ◦C. The progress of a reaction was monitoredby thin layer chromatography using pre-coated TLC sheets POLYGRAM® SIL G/UV254 purchasedfrom Macherey-Nagel. Detected spots were observed under UV light at λ 254 nm and 365 nm.Flash chromatography was performed with silica gel 40–63 μm from VWR Chemicals.
NMR spectra (1H, 13C, 19F) were recorded on Mercury 300/Mercury 400 (Varian, Palo Alto,CA, USA) or Fourier 300/Avance DRX 400 Bruker (Billerica, MA, USA) instruments. Signals of solventswere used as internal standards for 1H-NMR (CDCl3, δH = 7.26; DMSO-d6, δH = 2.50) and 13C-NMR(CDCl3, δC = 77.16; DMSO-d6, δC = 39.52). The chemical shifts (δ) are reported in ppm as follows: s,singlet; d, doublet; t, triplet; m, multiplet; and the coupling constants (J) are reported in Hz. Massspectra were recorded on an ESQUIRE 3000 Plus (ESI, low resolution) and a 7 T APEX II (ESI, highresolution) from Bruker Daltonics.
3.2. Syntheses
4-Bromo-2-fluoro-nitrobenzene (2): A suspension of sodium perborate tetrahydrate (20.24 g, 0.13 mol)in glacial acetic acid (80 mL) was stirred at 65 ◦C. 4-Bromo-2-fluoro-aniline (5 g, 26.31 mmol, 1 eq) in35 mL acetic acid was dropwise added over 5 h. The reaction was heated overnight, and subsequently,another portion of NaBO3·4H2O (12.2 g, 78.9 mmol) was added. After full consumption of thestarting material, the reaction mixture was cooled to room temperature, the solid filtered off, and thefiltrate quenched with ice-cold water (600 mL). Then, the precipitate was filtrated and purified withcolumn chromatography (hexane/chloroform, 2:1) to give the product as yellow solid 2 (2.96 g, 51%).TLC (hexane/CHCl3 (2:1)): Rf = 0.32. 1H-NMR (400 MHz, CDCl3) δH = 8.01–7.93 (m, 1H), 7.50 (dd,J = 10.1, 1.9 Hz, 1H), 7.48–7.44 (m, 1H). 13C-NMR (101 MHz, CDCl3) δC = 155.48 (d, J = 269.9 Hz),136.60 (d, J = 7.2 Hz), 129.56 (d, J = 8.9 Hz), 128.24 (d, J = 4.3 Hz), 127.28 (d, J = 2.5 Hz), 122.21(d, J = 23.6 Hz). LR-MS (EI): m/z = 219 (calcd. 219 for C6H3
79BrFNO2+ [M]+)
4-Bromo-2-(4-methyl-1H-imidazol-1-yl) nitrobenzene (3): A mixture of compound 2 (9.46 g, 43 mmol) andK2CO3 (11.9 g, 86 mmol) in DMF (40 mL) was stirred at 4 ◦C, while a solution of 4-methyl imidazole(3.78 g, 46 mmol) in DMF (10 mL) was slowly added in the course of 2 h. Afterwards, stirring wascontinued for 10 h at room temperature. The reaction mixture was poured into water (250 mL), and theformed precipitate was filtered off, washed, and dried to give a brown yellow solid (10.47 g), which wasfound to be an impure mixture of regioisomeric Products 3 and 3b in a ratio of ~4:1, according to1H-NMR. The solid was dissolved in CHCl3 (80 mL) and filtered through a plug of silica gel (2 g).The solvent was evaporated, and the remaining solid was recrystallized twice from aqueous EtOH
118

Molecules 2019, 24, 2791
(80%) to give pure 3, as bright yellow crystals (7.09 g, 58%). Mp. 151–152.5 ◦C; TLC (CHCl3/MeCN(10:1)]: Rf = 0.33. 1H-NMR (400 MHz, CDCl3) δH = 7.85 (d, J = 8.7 Hz, 1H), 7.70 (dd, J = 8.7, 2.0 Hz, 1H),7.61 (d, J = 2.0 Hz, 1H), 7.52 (d, J = 0.9 Hz, 1H), 6.75 (s, 1H), 2.27 (d, J = 0.9 Hz, 3H). 13C-NMR (101 MHz,CDCl3) δC = 143.91, 140.24, 136.31, 132.37, 131.95, 131.47, 127.95, 126.68, 116.35, 13.71. LR-MS (ESI+):m/z = 282, (calcd. 282 for C10H9
79BrN3O2+ [M + H]+).
The minor regioisomer was isolated from a sample (0.36 g) of the filtrate obtained from the firstrecrystallization. It was purified via flash purification applying a gradient from CHCl3 (100%) toCHCl3/MeCN (30:1) to give pure 3b, as a yellow solid (0.11 g). Mp. 107.5–109 ◦C; TLC [CHCl3/MeCN(10:1)]: Rf = 0.26. 1H-NMR (400 MHz, CDCl3) δH = 7.97 (d, J = 8.7 Hz, 1H), 7.81 (dd, J = 8.7, 2.1 Hz, 1H),7.59 (d, J = 2.1 Hz, 1H), 7.46 (s, 1H), 6.91 (s, 1H), 2.04 (s, 3H). 13C-NMR (101 MHz, CDCl3) δC = 145.38,136.78, 133.60, 133.54, 131.16, 128.99, 128.22, 127.82, 126.78, 9.24.
4-Bromo-2-(4-methyl-1 H-imidazol-1-yl) aniline (4): Nitro compound 3 (4.42 g, 15.7 mmol, 1 eq) wasdissolved under argon in a 1:1 mixture of ethanol (50 mL) and acetic acid (50 mL). Iron powder (5.25 g,94 mmol) was added, and the reaction mixture was stirred under reflux for 2.5 h (bath temperature115–120 ◦C). The mixture was filtered through celite, and the filtrate was adjusted to pH 8 with Na2CO3
until a greenish solid formed. The mixture was extracted with Ethyl Acetate (EE, 3 × 100 mL), and theorganic phase was washed with water (2 × 100 mL) and saturated NaCl solution (100 mL), and dried(Na2SO4). The solvent was evaporated to give a beige solid (3.64 g, 92%). TLC (CHCl3/MeOH/30%NH3 (10:1:0.1)): Rf = 0.41. 1H-NMR (400 MHz, CDCl3) δH = 7.52 (d, J = 1.0 Hz, 1H), 7.30 (dd, J = 8.6,2.3 Hz, 1H), 7.23 (d, J = 2.2 Hz, 1H), 6.80 (s, 1H), 6.71 (t, J = 8.0 Hz, 1H), 3.68 (d, J = 48.0 Hz, 2H),2.30 (d, J = 0.6 Hz, 3H).13C-NMR (101 MHz, CDCl3) δC = 141.22, 139.48, 136.72, 132.47, 129.50, 124.52,117.94, 116.32, 109.38, 13.77. LR-MS (ESI+): m/z = 274, (calcd. 274 for C10H10
79BrN3Na+ [M + Na]+).
8-Bromo-3-methylbenzo[e]imidazo[5,1-c][1,2,4]triazine (5): A solution of NaNO2 (1.28 g, 18.6 mmol) inH2O (10 mL) was added to a stirred solution of 4 (3.13 g, 12.4 mmol) in acetic acid (60 mL) at roomtemperature. A yellow precipitate formed immediately. After 5 h of stirring, the reaction mixturewas evaporated to half of its original volume and diluted with H2O (50 mL). The pH was carefullyadjusted to pH 8 by the addition of solid NaHCO3. The yellow solid was filtered off and dried to give 5
(3.24 g, 98% sufficiently pure for the next step). The solid was dissolved in CHCl3 (150 mL) and filteredthrough a plug of silica gel (2 g). The filtrate was concentrated and triturated with CHCl3/heptanemixtures to afford a yellow powder (2.9 g, 89%). TLC (hexane/ethyl acetate (1:3)): Rf = 0.45. 1H-NMR(400 MHz, DMSO-d6) δH = 9.16 (s, 1H), 8.70 (d, J = 2.0 Hz, 1H), 8.29 (d, J = 8.6 Hz, 1H), 7.88 (dd, J = 8.6,2.0 Hz, 1H), 2.74 (s, 3H). 13C-NMR (101 MHz, DMSO-d6) δC = 137.71, 135.87, 134.37, 131.40, 130.55,127.23, 126.01, 123.04, 118.35, 12.39. LR-MS (ESI+): m/z = 263 (calcd. 263 for C10H8
79BrN4+ [M + H]+).
3.2.1. General Procedure A for the Suzuki Coupling of Bromo Derivatives 5, 7a, 7b, 7c, 7d, 7e, and 7f
Brominated compound (1 eq), boronic acid derivative (BA, 8a–8f, 9a–9c, 1.1–1.3 eq), and K2CO3 (2–3 eq)were combined in a mixture of 1,4-dioxane and water (4:1). The suspension was degassed with argonfor 5–10 min, and Pd(PPh3)4 (5–10 mol%) was added. The mixture was refluxed (bath temperature102–108 ◦C) for 1–2 days until completion of the reaction (as indicated by TLC). The solvent wasremoved, and the residue was partitioned between CHCl3 and water. The aqueous layer was extractedtwice with CHCl3, and the combined organic layers were dried (Na2SO4) and the solvent evaporated.Unless stated otherwise, the obtained residue was purified by flash chromatography on silica gel usingCHCl3/MeOH (10:1) as the eluent. The following products were isolated:
8-(2-Fluoropyridin-4-yl)-3-methylbenzo[e]imidazo[5,1-c][1,2,4]triazine (6a): Based on General ProcedureA of Suzuki coupling, a mixture of compound 5 (101 mg, 0.38 mmol,1 eq), BA 8a (65 mg,0.46 mmol,1.2 eq), and K2CO3 (131 mg, 0.95 mmol, 2.5 eq), in dioxane/water (5 mL) were reacted in the presenceof Pd(PPh3)4 (44 mg, 10 mol%) to give after purification compound 6a (81 mg, 76%) as a yellow solid.TLC (hexane/ethyl acetate (1:1)): Rf = 0.25. 1H-NMR (400 MHz, DMSO-d6) δH = 9.28 (s, 1H), 8.92
119

Molecules 2019, 24, 2791
(d, J = 1.9 Hz, 1H), 8.52 (d, J = 8.5 Hz, 1H), 8.46 (d, J = 5.3 Hz, 1H), 8.25 (dd, J = 8.5, 1.9 Hz, 1H), 7.97(dt, J = 5.3, 1.8 Hz, 1H), 7.82 (s, 1H), 2.79 (s, 3H). LR-MS (ESI+): m/z = 280, (calcd. 280 for C15H11FN5
+
[M + H]+).
8-(6-Fluoropyridin-3-yl)-3-methylbenzo[e]imidazo[5,1-c][1,2,4]triazine (6b): According to General ProcedureA, compound 5 (500 mg, 1.9 mmol,1 eq), BA 8b (321 mg, 2.28 mmol, 1.2 eq), K2CO3 (788 mg, 5.7 mmol,3 eq), and Pd(PPh3)4 (220 mg, 10 mol%) were reacted in dioxane/water (24 mL) to yield after purificationcompound 6b (150 mg, 28%), as a yellow powder. TLC (CH3Cl3/MeOH (10:1)): Rf = 0.38. 1H-NMR(400 MHz, CDCl3) δH = 8.62–8.52 (m, 3H), 8.12 (ddd, J = 8.4, 7.4, 2.7 Hz, 1H), 7.98 (d, J = 1.8 Hz, 1H),7.82 (dd, J = 8.4, 1.8 Hz, 1H), 7.13 (dd, J = 8.5, 3.1 Hz, 1H), 2.91 (s, 3H). LR-MS (ESI+): m/z = 280, (calcd.280 for C15H11FN5
+ [M + H]+).
8-(2-Fluoropyridin-3-yl)-3-methylbenzo[e]imidazo[5,1-c][1,2,4]triazine (6c): According to General ProcedureA, compound 5 (501 mg, 1.9 mmol, 1 eq), BA 8c (325 mg, 2.28 mmol, 1.2 eq), K2CO3 (661 mg, 4.75 mmol,2.5 eq), and Pd(PPh3)4 (219 mg, 10 mol%) were reacted in dioxane/water (15 mL) to afford afterpurification compound 6c (0.52 g, 98%), as a yellow solid. TLC (CHCl3/MeOH (10:1)): Rf = 0.38.1H-NMR (400 MHz, CDCl3) δH = 8.58–8.52 (m, 1H), 8.34 (dt, J = 5.0, 1.5 Hz, 1H), 8.10–7.99 (m, 1H),7.85 (dd, J = 8.4, 1.6 Hz, 1H), 7.71–7.62 (m, 1H), 7.58–7.37 (m, 2H), 2.92 (s, 3H). LR-MS (ESI+): m/z = 280(calcd. 280 for C15H11FN5
+ [M + H]+).
8-(5-Fuoropyridin-3-yl)-3-methylbenzo[e]imidazo[5,1-c][1,2,4]triazine (6d): According to General ProcedureA, compound 5 (200 mg, 0.76 mmol, 1 eq), BA 8d (118 mg, 0.84 mmol, 1.1 eq), K2CO3 (315 mg,2.28 mmol, 3.0 eq), and Pd(PPh3)4 (44 mg, 5 mol%) were reacted in dioxane/water (10 mL) to give afterpurification Compound 6d (0.12 g, 56%), as a yellow powder. TLC (CHCl3/MeOH (10:1)): Rf = 0.29.1H-NMR (400 MHz, DMSO-d6) δH = 9.26 (s, 1H), 9.09 (d, J = 1.9 Hz, 1H), 8.88 (d, J = 1.8 Hz, 1H), 8.71(d, J = 2.7 Hz, 1H), 8.49 (d, J = 8.5 Hz, 1H), 8.36 (dt, J = 10.3, 2.3 Hz, 1H), 8.19 (dd, J = 8.5, 1.9 Hz, 1H),2.77 (s, 3H).
3-Methyl-8-(pyridin-3-yl)benzo[e]imidazo[5,1-c][1,2,4]triazine (6e): According to General Procedure A,compound 5 (1.0 g, 3.8 mmol, 1 eq), BA 8e (0.61 mg, 4.94 mmol, 1.3 eq), K2CO3 (1.58 g, 11.4 mmol,3 eq), and Pd(PPh3)4 (220 mg, 5 mol%) were reacted in dioxane/water (50 mL) to give after purificationby flash chromatography compound 6e (0.76 g, 77%), as a yellow solid. TLC (CHCl3/MeOH (10:1)):Rf = 0.20. 1H-NMR (400 MHz, DMSO-d6) δH = 9.23 (s, 1H), 9.16 (d, J = 2.1 Hz, 1H), 8.77 (d, J = 1.8 Hz,1H), 8.69 (dd, J = 4.8, 1.6 Hz, 1H), 8.45 (d, J = 8.4 Hz, 1H), 8.35–8.30 (m, 1H), 8.11 (dd, J = 8.5, 1.8 Hz,1H), 7.60 (ddd, J = 8.0, 4.8, 0.9 Hz, 1H), 2.75 (s, 3H). LR-MS (ESI+): m/z = 262, (calcd. 262 for C15H12N5
+
[M+H]+).
3-Methyl-8-(pyridin-4yl)benzo[e]imidazo[5,1-c][1,2,4]triazine (6f): According to General Procedure A,compound 5 (200 mg, 0.76 mmol, 1 eq), K2CO3 (265 mg, 1.92 mmol, 2.52 eq), BA 8f (119 mg, 0.968mmol, 1.27 eq), and Pd(PPh3)4 (44 mg, 0.038 mmol, 5 mol%) were reacted in dioxane/water (5 mL) toafford after purification compound 6f (173 mg, 87%), as a yellow solid. TLC (CHCl3/MeOH (10:1)):Rf = 0.23. 1H-NMR (300 MHz, DMSO-d6) δH = 9.26 (s, 1H), 8.82 (d, J = 1.8 Hz, 1H), 8.78–8.75 (m, 2H),8.47 (d, J = 8.5 Hz, 1H), 8.15 (dd, J = 8.5, 1.9 Hz, 1H), 7.96–7.92 (m, 2H), 2.75 (s, 3H).
3.2.2. General Procedure B for Bromination of Compounds 6a, 6b, 6c, 6d, 6e, and 6f
N-Bromosuccinimide (NBS, ~1.5 eq) was added to a suspension of compounds 6a–6f in acetonitrile.The reaction mixture was protected from light and stirred at room temperature for 1–2 d. After thefull conversion of the starting material, the mixture was partitioned between CHCl3 and H2O.The organic layer was washed with aqueous NaHCO3 (5%), water, and saturated NaCl solution.After drying (Na2SO4) and evaporation, the residue was purified by flash chromatography, elutingwith CHCl3/MeOH (10:1).
120

Molecules 2019, 24, 2791
1-Bromo-8-(2-fluoropyridin-4-yl)methylbenzo[e]imidazo[5,1-c][1,2,4]triazine (7a): According to GeneralProcedure B, for bromination, compound 6a (300 mg, 1.07 mmol) and NBS (287 mg, 1.61 mmol) werereacted in acetonitrile (20 mL) to give after purification compound 7a, as a yellow solid (306 mg, 79%).TLC (CHCl3/MeOH (10:1)): Rf = 0.74. 1H-NMR (400 MHz, CDCl3) δH = 9.25 (t, J = 10.2 Hz, 1H), 8.59(d, J = 8.4 Hz, 1H), 8.42 (t, J = 8.7 Hz, 1H), 7.94 (dd, J = 8.4, 1.8 Hz, 1H), 7.55–7.48 (m, 1H), 7.25 (s, 1H),2.89 (d, J = 3.6 Hz, 3H). LR-MS (ESI+): m/z = 358 (calcd. 358 for C15H10
79BrFN5+ [M + H]+)
1-Bromo-8-(6-fluoropyridin-3-yl)-3-methylbenzo[e]imidazo[5,1-c][1,2,4]triazine (7b): According to GeneralProcedure B, compound 6b (354 mg, 1.27 mmol) and NBS (338 mg, 1.9 mmol) were reacted in acetonitrile(16 mL) to give after purification Compound 7b, as a yellow solid (290 mg, 63%). TLC (CHCl3/MeOH(10:1)): Rf = 0.71. 1H-NMR (400 MHz, CDCl3) δH = 9.15 (d, J = 1.8 Hz, 1H), 8.59 (d, J = 2.6 Hz, 1H), 8.56(d, J = 8.4 Hz, 1H), 8.12 (ddd, J = 8.5, 7.4, 2.7 Hz, 1H), 7.87 (dd, J = 8.4, 1.8 Hz, 1H), 7.13 (dd, J = 8.5, 3.0Hz, 1H), 2.88 (s, 3H). LR-MS (ESI+): m/z = 358 (calcd. 358 for C15H10
79BrFN5+, [M + H]+).
1-Bromo-8-(2-fluoropyridin-3-yl)-3-methylbenzo[e]imidazo[5,1-c][1,2,4]triazine (7c): According To GeneralProcedure B, compound 6c (169 mg, 0.61 mmol) and NBS (162 mg, 0.91 mmol) were reacted in acetonitrile(6 mL) to give after purification compound 7c, as a yellow solid (192 mg, 88%). TLC (CHCl3/MeOH(10:1)), Rf = 0.66. 1H-NMR (400 MHz, CDCl3) δH = 9.23 (t, J = 1.5 Hz, 1H), 8.54 (d, J = 8.4 Hz, 1H), 8.34(dt, J = 4.9, 1.5 Hz, 1H), 8.08–8.00 (m, 1H), 7.89 (dt, J = 8.4, 1.6 Hz, 1H), 7.46–7.37 (m, 1H), 2.88 (s, 3H).LR-MS (ESI+): m/z = 358, (calcd. 358 for C15H10
79BrFN5+ [M + H]+).
1-Bromo-8-(5-fluoropyridin-3-yl)-3-methylbenzo[e]imidazo[5,1-c][1,2,4]triazine (7d): According to GeneralProcedure B, compound 6d (120 mg, 0.43 mmol) and NBS (115 mg, 0.65 mmol) were reacted inacetonitrile (4 mL) to afford after purification Compound 7d, (151 mg, 98%), as a yellow solid.TLC (CHCl3/MeOH (10:1)), Rf = 0.71. 1H-NMR (300 MHz, CDCl3) δH = 9.20–9.19 (m, 1H), 8.83–8.81(m, 1H), 8.61–8.59 (m, 1H), 8.56 (d, J = 0.4 Hz, 1H), 7.90 (dd, J = 8.4, 1.8 Hz, 1H), 7.73 (ddd, J = 9.1, 2.7,1.9 Hz, 1H), 2.88 (s, 3H). LR-MS (ESI+): m/z = 358, (calcd. 358 for C15H10
79BrFN5+ [M + H]+).
1-Bromo-3-methyl-8-(pyridin-3-yl)benzo[e]imidazo[5,1-c][1,2,4]triazine (7e): According to GeneralProcedure B, compound 6e (300 mg, 1.15 mmol, 1 eq) and NBS (306 mg, 1.72 mmol) were reactedin acetonitrile (8 mL) to afford after purification compound 7e (343 mg, 87%), as a yellow solid.TLC (CHCl3/MeOH (10:1)): Rf = 0.47. 1H-NMR (400 MHz, CDCl3) δH = 9.19 (d, J = 1.7 Hz, 1H), 9.00(dd, J = 2.5, 0.9 Hz, 1H), 8.73 (dd, J = 4.8, 1.6 Hz, 1H), 8.55 (d, J = 8.4 Hz, 1H), 8.03 (ddd, J = 8.0, 2.5,1.6 Hz, 1H), 7.91 (dd, J = 8.4, 1.8 Hz, 1H), 7.50 (ddd, J = 8.0, 4.8, 0.9 Hz, 1H), 2.87 (s, 3H). LR-MS (ESI+):m/z = 340, (calcd. 340 for C15H11
79BrN5+ [M + H]+).
1-Bromo-3-methyl-8-(pyridin-4-yl)benzo[e]imidazo[5,1-c][1,2,4]triazine (7f): According to General ProcedureB, compound 6f (100 mg, 0.383 mmol, 1 eq) and NBS (102 mg, 0.573 mmol) were reacted in MeCN(4 mL) to give after purification compound 7f (120 mg, 92%), as a yellow powder. TLC (CHCl3/MeOH(10:1)): Rf = 0.54. 1H-NMR (400 MHz, DMSO-d6) δH = 9.27 (d, J = 1.8 Hz, 1H), 8.85–8.78 (m, 2H), 8.58(d, J = 8.4 Hz, 1H), 8.24 (dd, J = 8.4, 1.8 Hz, 1H), 7.97–7.91 (m, 1H), 2.76 (s, 3H). LR-MS (ESI+): m/z = 340,(calcd. 340 for C15H11
79BrN5+ [M + H]+).
3.2.3. Synthesis of Oxetanyl Building Block 9c
3-((3-Bromophenoxy)methyl)-3-methyloxetane (11): A mixture of (3-methyloxetan-3-yl) methanol (2.09 g,20.4 mmol) and triethylamine (TEA, 3.2 mL, 23 mmol) in MeCN (8 mL) was stirred and cooled at15–25 ◦C, while a solution of methanesulfonyl chloride (1.55 mL, 20 mmol) in MeCN (3 mL) wasdropwise added in the course of 20 min. The mixture was stirred at 22 ◦C for 4 h and at 0–2 ◦C for30 min. The precipitated TEA hydrochloride was filtered off and washed with MeCN (2 × 2.5 mL).To the filtrate was successively added 3-bromophenol (10, 3.46 g, 20 mmol) and Cs2CO3 (3.26 g,10 mmol) along with K2CO3 (2.07 g, 15 mmol). The resulting suspension was stirred and heated at75–79 ◦C for 18 h (progress monitored by TLC). Upon completion, the suspension was stirred with
121

Molecules 2019, 24, 2791
methyl tert-butyl ether (MTBE, 50 mL) for 2 h. The solid was filtered off and the filtrate washed withsodium hydroxide solution (0.8 M, 1 × 20, 2 × 10 mL) and dried (Na2CO3). The solvent was evaporatedand the remaining oil bulb-to-bulb distilled (4 mbar, air bath 150–190 ◦C) to afford compound 11,as a colorless oil (4.35 g, 85%). TLC (heptane/MTBE (3:2)): Rf = 0.4. 1H-NMR (400 MHz, CDCl3)δH = 7.18–7.12 (m, 1H), 7.12-7.08 (m, 2H), 6.87 (ddd, J = 8.1, 2.5, 1.3 Hz, 1H), 4.61 (d, J = 6.0 Hz, 2H),4.46 (d, J = 6.0 Hz, 2H), 4.00 (s, 2H), 1.43 (s, 3H). 13C-NMR (101 MHz, CDCl3) δC = 159.86, 130.70,124.24, 122.94, 117.97, 113.62, 79.81 (2C), 73.06, 39.74, 21.33.
4,4,5,5-Tetramethyl-2-(3-((3-methyloxetan-3-yl) methoxy) phenyl)-1,3,2-dioxaborolane (12): A mixture of3-bromophenylether 11 (1.75 g, 6.8 mmol), KOAc (1.5 g, 15.3 mmol), and bis(pinacolato)diboron (1.77 g,15 mmol, in 2-methyltetrahydrofuran (24 mL)) was degassed with argon for 10 min. After additionof Pd(dppf)Cl2 (0.07 g, 0.096 mmol), the mixture was refluxed for 7 h. Upon completion (monitoredby TLC), CH2Cl2 (25 mL) was added, the resulting suspension stirred for 1 h, and the solid filteredoff. The filtrate was evaporated, and the viscous residue (3.2 g) was dissolved in MTBE (70 mL)and subsequently filtered through a short silica gel column (H 2 cm × D 2 cm). The filtrate wasextracted with aqueous NaOH (0.75 M, 4 × 12 mL). The alkaline extract was neutralized by slowaddition of aqueous HCl (4 M) at 0–2 ◦C (→ pH 6–7). The separated oil was extracted with MTBE(3 × 15 mL), and after drying (MgSO4), the solvent was evaporated to leave a viscous residue (2.15 g).Crystallization was achieved by trituration with MTBE/heptane to yield 12, as a colorless solid (1.67 g,81%). TLC (heptane/MTBE (2:1)): Rf = 0.38. 1H-NMR (300 MHz, CDCl3) δH = 7.42 (dt, J = 7.3, 1.1 Hz,1H), 7.38–7.35 (m, 1H), 7.31 (t, J = 7.7 Hz, 1H), 7.04 (ddd, J = 8.2, 2.8, 1.2, 30 Hz, 1H), 4.63 (d, J = 5.9 Hz,2H), 4.45 (d, J = 5.9 Hz, 2H), 4.06 (s, 2H), 1.44 (s, 3H), 1.35 (s, 12H). 13C-NMR (75 MHz, CDCl3)δC = 158.65, 129.15, 127.59, 119.86, 118.27, 84.01, 80.01, 72.87, 39.86, 25.01, 21.47 (the boron-substitutedcarbon atom was not detectable).
2-(2-Chloro-5-((3-methyloxetan-5 3-yl) methoxy) phenyl)-4,4,5,5-tetramethyl-1,3,2-dioxaborolane (9c):N-Chlorosuccinimide (NCS, 0.4 g, 3.0 mmol) was added to a solution of compound 12 (0.73 g,2.4 mmol) in DMF (7 mL). The mixture was stirred at room temperature for 20 h (monitored by TLC).The solvent was removed in vacuo, and the viscous residue was dissolved in MTBE (20 mL). The solutionwas successively washed with aqueous Na2S2O3 (10%, 9 mL) and water (6 mL) and extracted withaqueous NaOH (0.75 M, 3 × 6 mL). The alkaline extract was neutralized (→ pH 7–8) by slow additionof aqueous HCl (4 M) at 0–2 ◦C. The separated oil was extracted with MTBE (3 × 10 mL), and afterdrying (MgSO4), the solvent was evaporated to leave a viscous residue. Crystallization was achievedby trituration with MTBE/heptane to yield 9c, as a colorless solid (0.45 g, 56%). TLC (heptane/MTBE(2:1)): Rf = 0.30. 1H-NMR (300 MHz, CDCl3) δH = 7.25 (d, J = 8.8 Hz, 1H), 7.23 (d, J = 3.2 Hz, 1H), 6.90(dd, J = 8.8, 3.2 20 Hz, 1H), 4.61 (d, J = 5.9 Hz, 2H), 4.44 (d, J = 5.9 Hz, 2H), 4.01 (s, 2H), 1.42 (s, 3H), 1.37(s, 12H). 13C-NMR (75 MHz, CDCl3) δC = 157.11, 131.36, 130.49, 121.90, 121.88, 118.33, 84.39, 79.90,79.88, 73.15, 39.82, 24.95, 21.40.
3.2.4. Synthesis of Compounds BIT1–BIT9 via Suzuki Coupling According to General Procedure A
1-(2-Chloro-5-methoxyphenyl)-8-(2-fluoropyridin-4-yl)-3methylbenzo[e]imidazo[5,1-c][1,2,4]triazine (BIT1):Based on General Procedure A for Suzuki coupling, a mixture of compound 7a (100 mg, 0.28 mmol,1 eq), BA 9a (63.4 mg,0.34 mmol, 1.2 eq), and K2CO3 (97 mg, 0.7 mmol, 2.5 eq) in dioxane/water(5 mL) was reacted in the presence of Pd(PPh3)4 (33 mg, 10 mol%) to give after purification by flashchromatography (gradient: hexane/ethyl acetate, 9:1→ ethyl acetate, 100%) compound BIT1 (92 mg,80%) as a yellow powder. TLC (hexane/ethyl acetate (1:1)): Rf = 0.33. 1H-NMR (400 MHz, CDCl3)δH = 8.55 (d, J = 8.4 Hz, 1H), 8.27 (d, J = 5.2 Hz, 1H), 7.85 (dd, J = 8.4, 1.7 Hz, 1H), 7.56 (d, J = 8.8 Hz,1H), 7.48 (d, J = 1.6 Hz, 1H), 7.21 (d, J = 3.0 Hz, 1H), 7.19 (d, J = 3.1 Hz, 1H), 7.16 (d, J = 3.0 Hz, 1H),6.88 (s, 1H), 3.87 (s, 3H), 2.99 (s, 3H). 13C-NMR (75 MHz, CDCl3) δC = 164.59 (d, J = 239.3 Hz), 159.09,151.71 (d, J = 8.1 Hz), 148.68 (d, J = 15.4 Hz), 140.20 (d, J = 3.3 Hz), 139.84, 137.41, 136.98, 136.18, 131.51,131.44, 130.81, 126.00, 124.05, 119.38 (d, J = 4.1 Hz), 118.56, 117.68, 113.90, 107.44 (d, J = 38.7 Hz), 56.01,
122
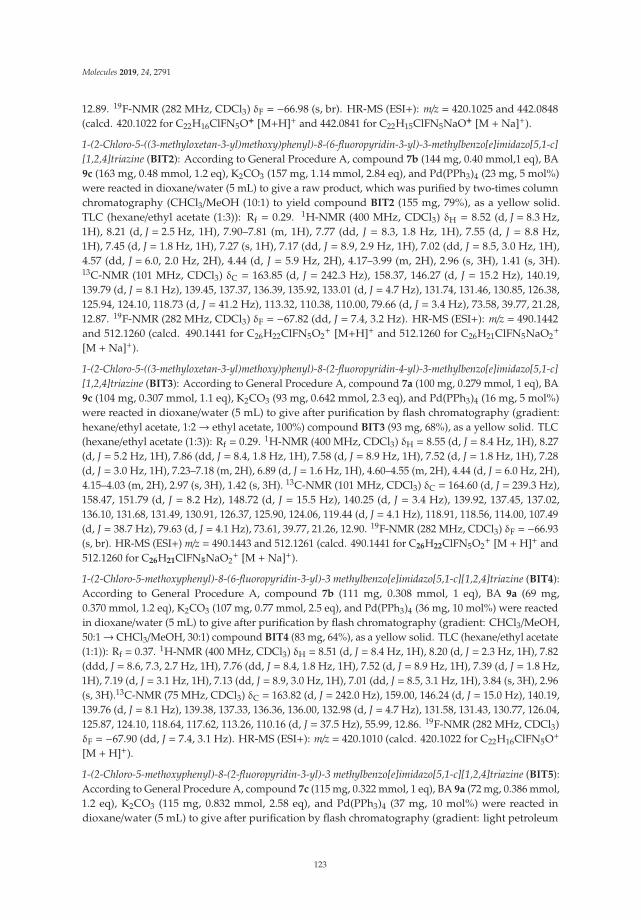
Molecules 2019, 24, 2791
12.89. 19F-NMR (282 MHz, CDCl3) δF = −66.98 (s, br). HR-MS (ESI+): m/z = 420.1025 and 442.0848(calcd. 420.1022 for C22H16ClFN5O+ [M+H]+ and 442.0841 for C22H15ClFN5NaO+ [M + Na]+).
1-(2-Chloro-5-((3-methyloxetan-3-yl)methoxy)phenyl)-8-(6-fluoropyridin-3-yl)-3-methylbenzo[e]imidazo[5,1-c][1,2,4]triazine (BIT2): According to General Procedure A, compound 7b (144 mg, 0.40 mmol,1 eq), BA9c (163 mg, 0.48 mmol, 1.2 eq), K2CO3 (157 mg, 1.14 mmol, 2.84 eq), and Pd(PPh3)4 (23 mg, 5 mol%)were reacted in dioxane/water (5 mL) to give a raw product, which was purified by two-times columnchromatography (CHCl3/MeOH (10:1) to yield compound BIT2 (155 mg, 79%), as a yellow solid.TLC (hexane/ethyl acetate (1:3)): Rf = 0.29. 1H-NMR (400 MHz, CDCl3) δH = 8.52 (d, J = 8.3 Hz,1H), 8.21 (d, J = 2.5 Hz, 1H), 7.90–7.81 (m, 1H), 7.77 (dd, J = 8.3, 1.8 Hz, 1H), 7.55 (d, J = 8.8 Hz,1H), 7.45 (d, J = 1.8 Hz, 1H), 7.27 (s, 1H), 7.17 (dd, J = 8.9, 2.9 Hz, 1H), 7.02 (dd, J = 8.5, 3.0 Hz, 1H),4.57 (dd, J = 6.0, 2.0 Hz, 2H), 4.44 (d, J = 5.9 Hz, 2H), 4.17–3.99 (m, 2H), 2.96 (s, 3H), 1.41 (s, 3H).13C-NMR (101 MHz, CDCl3) δC = 163.85 (d, J = 242.3 Hz), 158.37, 146.27 (d, J = 15.2 Hz), 140.19,139.79 (d, J = 8.1 Hz), 139.45, 137.37, 136.39, 135.92, 133.01 (d, J = 4.7 Hz), 131.74, 131.46, 130.85, 126.38,125.94, 124.10, 118.73 (d, J = 41.2 Hz), 113.32, 110.38, 110.00, 79.66 (d, J = 3.4 Hz), 73.58, 39.77, 21.28,12.87. 19F-NMR (282 MHz, CDCl3) δF = −67.82 (dd, J = 7.4, 3.2 Hz). HR-MS (ESI+): m/z = 490.1442and 512.1260 (calcd. 490.1441 for C26H22ClFN5O2
+ [M+H]+ and 512.1260 for C26H21ClFN5NaO2+
[M + Na]+).
1-(2-Chloro-5-((3-methyloxetan-3-yl)methoxy)phenyl)-8-(2-fluoropyridin-4-yl)-3-methylbenzo[e]imidazo[5,1-c][1,2,4]triazine (BIT3): According to General Procedure A, compound 7a (100 mg, 0.279 mmol, 1 eq), BA9c (104 mg, 0.307 mmol, 1.1 eq), K2CO3 (93 mg, 0.642 mmol, 2.3 eq), and Pd(PPh3)4 (16 mg, 5 mol%)were reacted in dioxane/water (5 mL) to give after purification by flash chromatography (gradient:hexane/ethyl acetate, 1:2→ ethyl acetate, 100%) compound BIT3 (93 mg, 68%), as a yellow solid. TLC(hexane/ethyl acetate (1:3)): Rf = 0.29. 1H-NMR (400 MHz, CDCl3) δH = 8.55 (d, J = 8.4 Hz, 1H), 8.27(d, J = 5.2 Hz, 1H), 7.86 (dd, J = 8.4, 1.8 Hz, 1H), 7.58 (d, J = 8.9 Hz, 1H), 7.52 (d, J = 1.8 Hz, 1H), 7.28(d, J = 3.0 Hz, 1H), 7.23–7.18 (m, 2H), 6.89 (d, J = 1.6 Hz, 1H), 4.60–4.55 (m, 2H), 4.44 (d, J = 6.0 Hz, 2H),4.15–4.03 (m, 2H), 2.97 (s, 3H), 1.42 (s, 3H). 13C-NMR (101 MHz, CDCl3) δC = 164.60 (d, J = 239.3 Hz),158.47, 151.79 (d, J = 8.2 Hz), 148.72 (d, J = 15.5 Hz), 140.25 (d, J = 3.4 Hz), 139.92, 137.45, 137.02,136.10, 131.68, 131.49, 130.91, 126.37, 125.90, 124.06, 119.44 (d, J = 4.1 Hz), 118.91, 118.56, 114.00, 107.49(d, J = 38.7 Hz), 79.63 (d, J = 4.1 Hz), 73.61, 39.77, 21.26, 12.90. 19F-NMR (282 MHz, CDCl3) δF = −66.93(s, br). HR-MS (ESI+) m/z = 490.1443 and 512.1261 (calcd. 490.1441 for C26H22ClFN5O2
+ [M + H]+ and512.1260 for C26H21ClFN5NaO2
+ [M + Na]+).
1-(2-Chloro-5-methoxyphenyl)-8-(6-fluoropyridin-3-yl)-3 methylbenzo[e]imidazo[5,1-c][1,2,4]triazine (BIT4):According to General Procedure A, compound 7b (111 mg, 0.308 mmol, 1 eq), BA 9a (69 mg,0.370 mmol, 1.2 eq), K2CO3 (107 mg, 0.77 mmol, 2.5 eq), and Pd(PPh3)4 (36 mg, 10 mol%) were reactedin dioxane/water (5 mL) to give after purification by flash chromatography (gradient: CHCl3/MeOH,50:1→ CHCl3/MeOH, 30:1) compound BIT4 (83 mg, 64%), as a yellow solid. TLC (hexane/ethyl acetate(1:1)): Rf = 0.37. 1H-NMR (400 MHz, CDCl3) δH = 8.51 (d, J = 8.4 Hz, 1H), 8.20 (d, J = 2.3 Hz, 1H), 7.82(ddd, J = 8.6, 7.3, 2.7 Hz, 1H), 7.76 (dd, J = 8.4, 1.8 Hz, 1H), 7.52 (d, J = 8.9 Hz, 1H), 7.39 (d, J = 1.8 Hz,1H), 7.19 (d, J = 3.1 Hz, 1H), 7.13 (dd, J = 8.9, 3.0 Hz, 1H), 7.01 (dd, J = 8.5, 3.1 Hz, 1H), 3.84 (s, 3H), 2.96(s, 3H).13C-NMR (75 MHz, CDCl3) δC = 163.82 (d, J = 242.0 Hz), 159.00, 146.24 (d, J = 15.0 Hz), 140.19,139.76 (d, J = 8.1 Hz), 139.38, 137.33, 136.36, 136.00, 132.98 (d, J = 4.7 Hz), 131.58, 131.43, 130.77, 126.04,125.87, 124.10, 118.64, 117.62, 113.26, 110.16 (d, J = 37.5 Hz), 55.99, 12.86. 19F-NMR (282 MHz, CDCl3)δF = −67.90 (dd, J = 7.4, 3.1 Hz). HR-MS (ESI+): m/z = 420.1010 (calcd. 420.1022 for C22H16ClFN5O+
[M + H]+).
1-(2-Chloro-5-methoxyphenyl)-8-(2-fluoropyridin-3-yl)-3 methylbenzo[e]imidazo[5,1-c][1,2,4]triazine (BIT5):According to General Procedure A, compound 7c (115 mg, 0.322 mmol, 1 eq), BA 9a (72 mg, 0.386 mmol,1.2 eq), K2CO3 (115 mg, 0.832 mmol, 2.58 eq), and Pd(PPh3)4 (37 mg, 10 mol%) were reacted indioxane/water (5 mL) to give after purification by flash chromatography (gradient: light petroleum
123

Molecules 2019, 24, 2791
ether/ethyl acetate, 1:1 → light petroleum ether/ethyl acetate, 1:2) compound BIT5 (93 mg, 69%),as a yellow solid. TLC (light petroleum ether/ethyl acetate (1:2)): Rf = 0.43. 1H-NMR (300 MHz, CDCl3)δH = 8.51 (d, J = 8.4 Hz, 1H), 8.22 (dd, J = 4.8, 0.7 Hz, 1H), 7.83–7.73 (m, 2H), 7.52–7.45 (m, 2H), 7.32–7.27(m, 1H), 7.17 (d, J = 3.0 Hz, 1H), 7.10 (dd, J = 8.9, 3.0 Hz, 1H), 3.83 (s, 3H), 2.97 (s, 3H). 13C-NMR(75 MHz, CDCl3) δC = 160.19 (d, J = 242.0 Hz), 158.95, 147.84 (d, J = 15.0 Hz), 140.67 (d, J = 3.5 Hz),139.44, 137.51, 137.42 (d, J = 2.1 Hz), 136.37, 136.21, 131.33, 131.01, 130.93, 127.58 (d, J = 2.8 Hz), 126.05,123.76, 122.28 (d, J = 4.6 Hz), 121.95 (d, J = 27.2 Hz), 118.72, 117.03, 115.51 (d, J = 5.2 Hz), 55.95, 12.88.19F-NMR (282 MHz, CDCl3) δF = −70.11 (d, J = 9.8 Hz). HR-MS (ESI+): m/z = 420.1014 (calcd. 420.1022for C22H16ClFN5O+ [M + H]+).
1-(2-Fluoro-5-methoxyphenyl)-8-(2-fluoropyridin-4-yl)-3-methylbenzo[e]imidazo[5,1-c][1,2,4]triazine (BIT6):According to General Procedure A, compound 7a (100 mg, 0.279 mmol, 1 eq), BA 9b (62 mg, 0.365mmol, 1.3 eq), K2CO3 (97 mg, 0.698 mmol, 2.58 eq), and Pd(PPh3)4 (32 mg, 10 mol%) were reacted indioxane/water (5 mL) to give after purification by flash chromatography (gradient: light petroleumether/ethyl acetate, 1:1 → light petroleum ether/ethyl acetate, 1:2) compound BIT6 (81 mg, 72%),as an orange solid. TLC (petroleum ether/ethyl acetate (1:2)): Rf = 0.54. 1H-NMR (300 MHz, CDCl3)δH = 8.55 (d, J = 8.4 Hz, 1H), 8.27 (dd, J = 5.3, 0.7 Hz, 1H), 7.86 (dd, J = 8.4, 1.9 Hz, 1H), 7.73 (dd, J = 3.5,1.8 Hz, 1H), 7.30–7.27 (m, 1H), 7.25–7.14 (m, 3H), 6.94–6.91 (m, 1H), 3.88 (s, 3H), 2.97 (s, 3H).13C-NMR(75 MHz, CDCl3) δC = 164.61 (d, J = 239.5 Hz), 156.62 (d, J = 7.1 Hz), 153.86 (d, J = 246.3 Hz), 153.58,151.80, 148.73 (d, J = 15.4 Hz), 140.32, 140.24 (d, J = 2.9 Hz), 137.50 (d, J = 62.8 Hz), 133.85, 131.56, 125.94,124.28, 120.00 (d, J = 16.3 Hz), 119.46 (d, J = 4.1 Hz), 118.76 (d, J = 7.9 Hz), 117.03 (d, J = 22.7 Hz), 116.44,113.90 (d, J = 2.2 Hz), 107.56 (d, J = 38.8 Hz), 56.21, 12.88.19F-NMR (282 MHz, CDCl3) δF =−66.90—-66.97(m), −121.68–121.78 (m). HR-MS (ESI+): m/z = 404.1325 (calcd. 404.1317 for C22H16F2N5O+ [M + H]+).
1-(2-Chloro-5-methoxyphenyl)-8-(3-fluoropyridin-5-yl)-3 methylbenzo[e]imidazo[5,1-c][1,2,4]triazine (BIT7):According to General Procedure A, compound 7d (100 mg, 0.279 mmol, 1 eq), BA 9a (62 mg,0.335 mmol, 1.2 eq), K2CO3 (116 mg, 0.839 mmol, 3.0 eq), and Pd(PPh3)4 (17 mg, 5 mol%) were reactedin dioxane/water (5 mL) to give after purification by flash chromatography (gradient: hexane/ethylacetate, 1:2 → hexane/ethyl acetate, 1:3) compound BIT7 (79 mg, 67%), as a yellow solid. TLC(hexane/ethyl acetate (1:2)): Rf = 0.38. 1H-NMR (400 MHz, CDCl3) δH = 8.53 (d, J = 8.4 Hz, 1H), 8.48(d, J = 2.7 Hz, 1H), 8.46–8.45 (m, 1H), 7.81 (dd, J = 8.4, 1.9 Hz, 1H), 7.55 (d, J = 8.9 Hz, 1H), 7.44–7.38(m, 2H), 7.20 (d, J = 3.0 Hz, 1H), 7.14 (dd, J = 8.9, 3.0 Hz, 1H), 3.85 (s, 3H), 2.97 (s, 3H). 13C-NMR(101 MHz, CDCl3) δC = 159.71 (d, J = 258.4 Hz), 159.05, 143.99 (d, J = 4.0 Hz), 139.77, 139.56, 138.21(d, J = 23.1 Hz), 137.37, 136.58, 136.23 (d, J = 3.8 Hz), 136.09, 131.52, 131.48, 130.84, 126.02, 125.99, 124.10,121.21 (d, J = 19.0 Hz), 118.59, 117.70, 113.68, 55.99, 12.87. 19F-NMR (377 MHz, CDCl3) δF = −125.95(d, J = 9.2 Hz). HR-MS (ESI+): m/z = 420.1024 (calcd. 420.1022 for C22H16ClFN5O+ [M + H]+).
1-(2-Fluoro-5-methoxyphenyl)-3-methyl-8-(pyridin-3-yl)benzo[e]imidazo[5,1-c][1,2,4]triazine (BIT8): Accordingto General Procedure A, compound 7e (100 mg, 0.294 mmol, 1 eq), BA 9b (60 mg, 0.353 mmol, 1.2 eq),K2CO3 (110 mg, 0.796 mmol, 2.7 eq), and Pd(PPh3)4 (17 mg, 5 mol%) were reacted in dioxane/water(5 mL) to give after purification by flash chromatography (gradient: hexane/ethyl acetate, 1:3→ ethylacetate, 100%) compound BIT8 (93 mg, 82%), as an orange solid. TLC (hexane/ethyl acetate (1:3)):Rf = 0.35. 1H-NMR (300 MHz, CDCl3) δH = 8.69–8.62 (m, 2H), 8.53 (d, J = 8.4 Hz, 1H), 7.83 (dd, J = 8.4,1.8 Hz, 1H), 7.77 (ddd, J = 8.0, 2.4, 1.6 Hz, 1H), 7.70 (dd, J = 3.5, 1.8 Hz, 1H), 7.39 (ddd, J = 8.0, 4.8,0.8 Hz, 1H), 7.30–7.23 (m, 2H), 7.18–7.11 (m, 1H), 3.86 (s, 3H), 2.97 (s, 3H). 13C-NMR (75 MHz, CDCl3)δC = 156.52 (d, J = 1.8 Hz), 154.85 (d, J = 243.0 Hz), 149.93, 148.39, 140.58 (d, J = 125.3 Hz), 137.76, 136.60,134.74, 134.53, 133.64, 131.43, 128.62 (d, J = 12.4 Hz), 126.12, 124.28, 123.94, 120.12 (d, J = 16.6 Hz),118.83 (d, J = 7.9 Hz), 117.01 (d, J = 22.9 Hz), 116.29 (d, J = 2.0 Hz), 113.35 (d, J = 1.9 Hz), 56.18, 12.86.19F-NMR (282 MHz, CDCl3) δF = −121.71 (td, J = 9.0, 4.0 Hz). HR-MS (ESI+): m/z = 386.1400 (calcd.386.1412 for C22H17FN5O+ [M + H]+).
124

Molecules 2019, 24, 2791
1-(2-Fluoro-5-methoxyphenyl)-3-methyl-8-(pyridin-4-yl)benzo[e]imidazo[5,1-c][1,2,4]triazine (BIT9): Accordingto General Procedure A, compound 7f (100 mg, 0.294 mmol, 1 eq), BA 9b (61 mg, 0.366 mmol, 1.2 eq),K2CO3 (103 mg, 0.745 mmol, 2.53 eq), and Pd(PPh3)4 (19 mg, 5 mol%) were reacted in dioxane/water(5 mL) to give a raw product, which was purified by two-times flash chromatography: CHCl3/MeOH(10:1) was used first, followed by hexane/ethyl acetate (gradient 1:3→ ethyl acetate, 100%) to obtaincompound BIT9 (44 mg, 39%), as a yellow solid. TLC (hexane/ethyl acetate (1:1)): Rf = 0.29. 1H-NMR(300 MHz, CDCl3) δH = 8.68–8.65 (m, 2H), 8.53 (d, J = 8.5 Hz, 1H), 7.87 (dd, J = 8.4, 1.8 Hz, 1H), 7.74(ddd, J = 3.5, 1.9, 0.5 Hz, 1H), 7.33–7.30 (m, 2H), 7.29–7.22 (m, 2H), 7.19–7.13 (m, 1H), 3.87 (s, 3H),2.96 (s, 3H). 13C-NMR (101 MHz, CDCl3) δC = 156.57 (d, J = 2.0 Hz), 154.85 (d, J = 243.4 Hz), 150.60,146.38, 141.51, 140.07, 137.81, 137.04, 133.73, 131.46, 125.98, 124.28, 121.65, 120.11 (d, J = 16.6 Hz),118.86 (d, J = 7.9 Hz), 117.01 (d, J = 22.6 Hz), 116.24 (d, J = 2.0 Hz), 113.67 (d, J = 2.3 Hz), 56.21, 12.87.19F-NMR (282 MHz, CDCl3) δF = −121.63—121.71 (m). HR-MS (ESI+): m/z = 386.1404 (calcd. 386.1412for C22H17FN5O+ [M + H]+).
3.3. Biology
3.3.1. In Vitro Evaluation of BIT Derivatives Towards PDEs
The inhibitory potency of BIT derivatives against the human recombinant PDE subtype wasdetermined in enzyme assays, conducted by SB Drug Discovery (Scotland, U.K.). The phosphodiesteraseassays were performed using recombinant human PDE enzymes expressed in a baculoviral system.This had similarity to PDE enzymes taken from human tissue using known inhibitor standardswhere available. The radiometric assay was a modification of the two-step method of Thompson andAppleman [45], which was adapted for 96-well plate format.
Firstly, tritium-labeled cyclic AMP or cyclic GMP was hydrolyzed to 5′-AMP or 5′-GMP byphosphodiesterase. The 5′-AMP or 5′-GMP was then further hydrolyzed to adenosine or guanosineby nucleotidase in snake venom. An anion-exchange resin bound all charged nucleotides and left[3H]adenosine or [3H]guanosine as the only labeled compound to be counted by liquid scintillation.Briefly, 50 μL of diluted human PDE enzyme were incubated with 50 μL of [3H]-cAMP or [3H]-cGMPand 11 μL of 50% DMSO (or compound dilution) for 20 min (at 30 ◦C). Reactions were carried outin a Greiner 96-deep well 1-mL master-block. The enzyme was diluted in 20 mM Tris HCl pH 7.4and [3H]-cAMP or [3H]-cGMP are diluted in 10 mM MgCl2, 40 mM Tris HCl pH 7.4. The reaction isterminated by denaturing the PDE enzyme (at 70 ◦C for 2 min), after which 25 μL of snake venomnucleotidase were added and incubated for 10 min (at 30 ◦C). Plates were centrifuged for 9 secondsbefore incubation. After incubation, 200 μL of Dowex resin were added, and the plate was shaken for20 min then centrifuged for 3 min at 2500 r.p.m. Fifty microliters of supernatant were removed andadded to 200 μL of MicroScint-20 in white plates (Greiner 96-well Optiplate) and shaken for 30 minbefore reading on a Perkin Elmer TopCount Scintillation Counter.
Compounds were tested at a concentration of 10 nM against human PDE2A3 and at 1 μM forPDE4A1, PDE5A, PDE6AB, PDE9A1, and PDE10A1. The percentage of inhibition of the compoundsand standard inhibitors was determined and compared to historical assay data to ensure that they fellwithin acceptable ranges. For IC50 values’ measurements, BIT1 was tested at concentrations of 0.1,0.5, 1.0, 5.0, 10.0, and 100 nM, and BIT6 and BIT9 were tested at concentrations of 0.5, 1.0, 5.0, 10.0,100, and 1000 nM against PDE2A3, while the concentration against PDE10A1 at 0.25, 5.0, 10, 100, 250,and 1000 nM (n = 2).
Data generated were analyzed using Prism software (GraphPad Inc.).
3.3.2. Incubations with Mouse Liver Microsomes
For microsome experiments, the following instruments were used: BioShake iQ (QUANTIFOILInstruments, Jena, Germany), Centrifuge 5424 (Eppendorf, Hamburg, Germany), DB-3D TECHNE SampleConcentrator (Biostep, Jahnsdorf, Germany), and UltiMate 3000 UHPLC System (Thermo Scientific,
125

Molecules 2019, 24, 2791
Germering, Germany) including a DAD detector (DAD-3000RS) coupled to an MSQ Plus SingleQuadrupole Mass Spectrometer (Thermo Scientific, Austin, Texas, USA).
NADPH (Nicotinamide Adenine Dinucleotide Phosphate) and testosterone were purchased fromSigma-Aldrich (Steinheim, Germany). GIBCO Mouse Liver Microsomes (MLM, 20 mg/mL) werepurchased from Life Technologies (Darmstadt, Germany). Dulbecco’s Phosphate-Buffered Saline (PBS)(without Ca2+, Mg2+) was purchased from Biochrom (Berlin, Germany).
Incubations had a final volume of 250 μL and were performed in PBS (pH 7.4). BIT1 was freshlydissolved in DMSO to provide a stock solution of 2 mM that was used for the experiments and resultedin an amount of DMSO of 1% in each incubation mixture. In the following, final concentrations areprovided in brackets [43]. PBS, MLM (1 mg/mL), and BIT1 (20 μM) were mixed and preincubated at37 ◦C for 5 min. Analogously, preincubated NADPH (2 mM) was added, and the mixtures were gentlyshaken at 37 ◦C. After 90 min, portions of 1.0 mL of cold acetonitrile (−20 ◦C) were added, respectively,followed by vigorous shaking (30 s), cooling on ice (4 min), and centrifugation at 14,000 rpm (10 min).Supernatants were concentrated at 50 ◦C under a flow of nitrogen to provide residual volumes of40–60 μL, which were reconditioned by adding acetonitrile/water 1:1 (v/v) to obtain samples of 100 μL,which were stored at 4 ◦C until analyzed by HPLC-UV-MS. As a positive control, testosterone wasused as the substrate and incubated at an appropriate concentration, similar to the protocol describedabove, to give complete conversion confirmed by HPLC. Furthermore, incubations without NADPH,microsomal protein, and BIT1, respectively, were performed as negative controls.
HPLC-UV-MS analyses were performed on a ReproSil-Pur 120 C18-AQ-column, 125 mm × 3 mm,3 μm (Dr. Maisch GmbH, Ammerbuch, Germany) equipped with an appropriate precolumn at 25 ◦Cand a flow rate of 0.7 mL/min. The solvent system consisted of Eluent A: water, containing 2 mMammonium acetate, and Eluent B: water/acetonitrile 20/80 (v/v), containing 2 mM ammonium acetate.Two methods were applied. Method A (gradient elution, % acetonitrile): 0–1.5 min, 10%; 1.5–10 min,10–80%; 10-13 min, 80%; 13–16 min 10%. Method B (isocratic elution, % acetonitrile): 0–25 min, 42%.For both methods, UV detection was performed at a wavelength of 228 nm (maximum UV absorbanceof BIT1) and a bandwidth of 20 nm. MSQ Plus single quadrupole mass spectrometer was operated inpositive electrospray ionization mode: probe temperature 500 ◦C, needle voltage 5 V, cone voltage 75 V.
4. Conclusions
A series of novel fluorinated PDE2A inhibitors based on a BIT (benzoimidazotriazine) scaffoldwas successfully prepared and evaluated in vitro. The binding results revealed that a modificationwith a 2,2-oxetanyl propoxy portion on the phenyl (phe-3) at the 1-position led to a potency losstowards PDE2A. However, a small methoxy group at the same position (phe-1) led to a significantincrease of potency towards PDE2A. It appeared that a higher inhibition towards PDE2A wasobtained by pyridine-4-yl residues in this position, either fluorinated or non-fluorinated. Furthermore,the introduction of ortho-fluorophenyl at the 1-position, instead of o-chlorophenyl, showed a lackof selectivity towards PDE2A. The introduction of the 2-fluoropyridin-4-yl residue at the 8-positionprovided us a promising candidate for future labeling with fluorine-18.
In vitro metabolism studies of BIT1 with MLM showed that BIT1 was sufficiently stable andsuitable for the development of an 18F-labeled radioligand. This should further be proven by in vivoinvestigations in the future. Taken together, BIT1 might be a prospective ligand to be developed asa radioligand for PDE2A-PET imaging.
Supplementary Materials: Supplementary Materials including NMR spectra of final compounds BIT1–BIT9,and dose response curves (BIT1, BIT6, and BIT9) can be accessed at.
Author Contributions: R.R., D.B., and M.S. designed and performed the organic syntheses; R.R., P.B., and M.S.designed the in vitro evaluation; R.R. and F.-A.L. designed and performed the microsomal incubations; R.R.,F.-A.L, D.B., P.B., and M.S. wrote the paper. All authors read and approved the final manuscript.
Funding: This research was funded by the Deutsche Forschungsgemeinschaft (DFG), Project Number:SCHE 1825/3-1.
126

Molecules 2019, 24, 2791
Acknowledgments: The authors would like to thank the Indonesia Ministry of Research and Technology-Programfor Research and Innovation in Science and Technology Project (RISET-Pro), World Bank Loan No. 8245-ID,for supporting the PhD thesis of Rien Ritawidya. We also thank the staff of the Institute of Analytical Chemistry,Department of Chemistry and Mineralogy of University of Leipzig, for recording and processing the NMR andLR/HR-MS spectra and Tina Spalholz (HZDR) for technical assistance.
Conflicts of Interest: The authors declare no conflict of interest.
References
1. Helal, C.J.; Arnold, E.P.; Boyden, T.L.; Chang, C.; Chappie, T.A.; Fennell, K.F.; Forman, M.D.; Hajos, M.;Harms, J.F.; Hoffman, W.E.; et al. Application of Structure-Based Design and Parallel Chemistry to Identifya Potent, Selective, and Brain Penetrant Phosphodiesterase 2A Inhibitor. J. Med. Chem. 2017, 60, 5673–5698.[CrossRef] [PubMed]
2. Fajardo, A.M.; Piazza, G.A.; Tinsley, H.N. The role of cyclic nucleotide signaling pathways in cancer: Targetsfor prevention and treatment. Cancers 2014, 6, 436–458. [CrossRef] [PubMed]
3. Maurice, D.H.; Ke, H.; Ahmad, F.; Wang, Y.; Chung, J.; Manganiello, V.C. Advances in targeting cyclicnucleotide phosphodiesterases. Nat. Rev. Drug Discov. 2014, 13, 290–314. [CrossRef] [PubMed]
4. Conti, M.; Beavo, J. Biochemistry and physiology of cyclic nucleotide phosphodiesterases: Essentialcomponents in cyclic nucleotide signaling. Annu. Rev. Biochem. 2007, 76, 481–511. [CrossRef] [PubMed]
5. Francis, S.H.; Blount, M.A.; Corbin, J.D. Mammalian cyclic nucleotide phosphodiesterases: Molecularmechanisms and physiological functions. Physiol. Rev. 2011, 91, 651–690. [CrossRef] [PubMed]
6. Keravis, T.; Lugnier, C. Cyclic nucleotide phosphodiesterase (PDE) isozymes as targets of the intracellularsignalling network: Benefits of PDE inhibitors in various diseases and perspectives for future therapeuticdevelopments. Br. J. Pharmacol. 2012, 165, 1288–1305. [CrossRef]
7. Lakics, V.; Karran, E.H.; Boess, F.G. Quantitative comparison of phosphodiesterase mRNA distribution inhuman brain and peripheral tissues. Neuropharmacology 2010, 59, 367–374. [CrossRef] [PubMed]
8. Gomez, L.; Massari, M.E.; Vickers, T.; Freestone, G.; Vernier, W.; Ly, K.; Xu, R.; McCarrick, M.; Marrone, T.;Metz, M.; et al. Design and Synthesis of Novel and Selective Phosphodiesterase 2 (PDE2a) Inhibitors for theTreatment of Memory Disorders. J. Med. Chem 2017, 60, 2037–2051. [CrossRef] [PubMed]
9. Gomez, L.; Breitenbucher, J.G. PDE2 inhibition: Potential for the treatment of cognitive disorders. Bioorg. Med.Chem. Lett 2013, 23, 6522–6527. [CrossRef]
10. Redrobe, J.P.; Rasmussen, L.K.; Christoffersen, C.T.; Bundgaard, C.; Jørgensen, M. Characterisation of LuAF33241: A novel, brain-penetrant, dual inhibitor of phosphodiesterase (PDE) 2A and PDE10A. Eur. J.Pharmacol. 2015, 761, 79–85. [CrossRef]
11. Mikami, S.; Sasaki, S.; Asano, Y.; Ujikawa, O.; Fukumoto, S.; Nakashima, K.; Oki, H.; Kamiguchi, N.;Imada, H.; Iwashita, H.; et al. Discovery of an Orally Bioavailable, Brain-Penetrating, in Vivo ActivePhosphodiesterase 2A Inhibitor Lead Series for the Treatment of Cognitive Disorders. J. Med. Chem. 2017,60, 7658–7676. [CrossRef] [PubMed]
12. Kehler, J. Targeting Phosphodiesterases in the CNS. In Comprehensive Medicinal Chemistry, 3rd ed;Chackalamannil, S., Rotela, D., Ward, S.E., Eds.; Elsevier: Oxford, UK, 2017; Volume 7, pp. 1–24.
13. Stephenson, D.T.; Coskran, T.M.; Kelly, M.P.; Kleiman, R.J.; Morton, D.; O’Neill, S.M.; Schmidt, C.J.;Weinberg, R.J.; Menniti, F.S. The distribution of phosphodiesterase 2A in the rat brain. Neuroscience 2012,226, 145–155. [CrossRef] [PubMed]
14. Stephenson, D.T.; Coskran, T.M.; Wilhelms, M.B.; Adamowicz, W.O.; O’Donnell, M.M.; Muravnick, K.B.;Menniti, F.S.; Kleiman, R.J.; Morton, D. Immunohistochemical localization of phosphodiesterase 2A inmultiple mammalian species. J. Histochem. Cytochem 2009, 57, 933–949. [CrossRef] [PubMed]
15. Schroder, S.; Wenzel, B.; Deuther-Conrad, W.; Scheunemann, M.; Brust, P. Novel Radioligands for CyclicNucleotide Phosphodiesterase Imaging with Positron Emission Tomography: An Update on DevelopmentsSince 2012. Molecules 2016, 21, 650. [CrossRef] [PubMed]
16. Buijnsters, P.; de Angelis, M.; Langlois, X.; Rombouts, F.J.R.; Sanderson, W.; Tresadern, G.; Ritchie, A.;Trabanco, A.A.; VanHoof, G.; van Roosbroeck, Y.; et al. Structure-Based Design of a Potent, Selective,and Brain Penetrating PDE2 Inhibitor with Demonstrated Target Engagement. ACS Med. Chem. Lett. 2014,5, 1049–1053. [CrossRef]
127

Molecules 2019, 24, 2791
17. Blokland, A.; Menniti, F.S.; Prickaerts, J. PDE inhibition and cognition enhancement. Expert. Opin. Ther. Pat.2012, 22, 349–354. [CrossRef] [PubMed]
18. Helal, C.J.; Arnold, E.; Boyden, T.; Chang, C.; Chappie, T.A.; Fisher, E.; Hajos, M.; Harms, J.F.; Hoffman, W.E.;Humphrey, J.M.; et al. Identification of a Potent, Highly Selective, and Brain Penetrant Phosphodiesterase2A Inhibitor Clinical Candidate. J. Med. Chem. 2018, 61, 1001–1018. [CrossRef]
19. Malamas, M.S.; Ni, Y.; Erdei, J.J.; Egerland, U.; Langen, B. The Substituted Imidazo [1,5-a]Quinoxalines asInhibitors of Phosphodiesterase 10. WO 2010/138833 A1, 2 December 2010.
20. Am Ende, C.W.; Kormos, B.L.; Humphrey, J.M. The State of the Art in Selective PDE2A Inhibitor Design.In Phosphodiesterases and their inhibitors; Liras, S., Bell, A.S., Eds.; Wiley-VCH: Weinheim an der Bergstrasse,Germany, 2014; Volume 61, pp. 83–104.
21. Schroder, S.; Wenzel, B.; Deuther-Conrad, W.; Teodoro, R.; Egerland, U.; Kranz, M.; Scheunemann, M.;Hofgen, N.; Steinbach, J.; Brust, P. Synthesis, 18F-Radiolabelling and Biological Characterization of NovelFluoroalkylated Triazine Derivatives for in Vivo Imaging of Phosphodiesterase 2A in Brain via PositronEmission Tomography. Molecules 2015, 20, 9591–9615. [CrossRef]
22. Schröder, S.; Wenzel, B.; Deuther-Conrad, W.; Teodoro, R.; Kranz, M.; Scheunemann, M.; Egerland, U.;Höfgen, N.; Briel, D.; Steinbach, J.; et al. Investigation of an 18F-labelled Imidazopyridotriazine for MolecularImaging of Cyclic Nucleotide Phosphodiesterase 2A. Molecules 2018, 23, 556. [CrossRef]
23. Wagner, S.; Scheunemann, M.; Dipper, K.; Egerland, U.; Hoefgen, N.; Steinbach, J.; Brust, P. Development ofhighly potent phosphodiesterase 10A (PDE10A) inhibitors: Synthesis and in vitro evaluation of 1,8-dipyridinyl-and 1-pyridinyl-substituted imidazo[1,5-a]quinoxalines. Eur. J. Med. Chem. 2016, 107, 97–108. [CrossRef]
24. Wagner, S.; Teodoro, R.; Deuther-Conrad, W.; Kranz, M.; Scheunemann, M.; Fischer, S.; Wenzel, B.;Egerland, U.; Hoefgen, N.; Steinbach, J.; et al. Radiosynthesis and biological evaluation of the new PDE10Aradioligand [18F]AQ28A. J. Label. Compd. Radiopharm. 2017, 60, 36–48. [CrossRef] [PubMed]
25. Stange, H.; Langen, B.; Egerland, U.; Hoefgen, N.; Priebs, M.; Malamas, M.S.; Erdei, J.; Ni, Y. TriazineDerivatives as Inhibitors of Phosphodiesterases. Patent US 2010/0120762 A1, 13 May 2010.
26. Stange, H.; Langen, B.; Egerland, U.; Hoefgen, N.; Priebs, M.; Malamas, M.S.; Erdei, J.J.; Ni, Y.Imidazo[5,1-C][1,2,4]Benzotriazine Derivatives As Inhibitors of. Patent US 2010/0120763 A1, 13 May 2010.
27. Malamas, M.S.; Stange, H.; Schindler, R.; Lankau, H.-J.; Grunwald, C.; Langen, B.; Egerland, U.; Hage, T.;Ni, Y.; Erdei, J.; et al. Novel triazines as potent and selective phosphodiesterase 10A inhibitors. Bioorg. Med.Chem. Lett. 2012, 22, 5876–5884. [CrossRef] [PubMed]
28. Trabanco, A.A.; Buijnsters, P.; Rombouts, F.J.R. Towards selective phosphodiesterase 2A (PDE2A) inhibitors:A patent review (2010 - present). Expert. Opin. Ther. Pat. 2016, 26, 933–946. [CrossRef] [PubMed]
29. Liu, J.; Wenzel, B.; Dukic-Stefanovic, S.; Teodoro, R.; Ludwig, F.-A.; Deuther-Conrad, W.; Schröder, S.;Chezal, J.-M.; Moreau, E.; Brust, P.; et al. Development of a new radiofluorinated quinoline analog for PETimaging of phosphodiesterase 5 (PDE5) in brain. Pharmaceuticals 2016, 9, 22. [CrossRef] [PubMed]
30. Gujral, S.S.; Khatri, S.; Riyal, P. Suzuki Cross Coupling Reaction- A Review. Indo Glob. J. Pharm. Sci. 2012,2, 351–367.
31. Dollé, F. [18F]Fluoropyridines: From Conventional Radiotracers to the Labeling of Macromolecules Such asProteins and Oligonucleotides. In PET Chemistry The Driving Force in Molecular Imaging; Schubinger, P.A.,Lehmann, L., Friebe, M., Eds.; Springer: Berlin, Germany, 2006; Volume 62, pp. 113–157.
32. Goldstein, S.W.; Bill, A.; Dhuguru, J.; Ghoneim, O. Nucleophilic Aromatic Substitution—Addition andIdentification of an Amine. J. Chem. Educ. 2017, 94, 1388–1390. [CrossRef]
33. Artamkina, G.A.; Egorov, M.P.; Beletskaya, I.P. Some aspects of anionic sigma complexes. Chem. Rev. 1982,82, 427–459. [CrossRef]
34. Gamble, A.B.; Garner, J.; Gordon, C.P.; O’Conner, S.M.J.; Keller, P.A. Aryl Nitro Reduction with Iron Powderor Stannous Chloride under Ultrasonic Irradiation. Synth. Commun. 2007, 37, 2777–2786. [CrossRef]
35. Wuitschik, G.; Rogers-Evans, M.; Muller, K.; Fischer, H.; Wagner, B.; Schuler, F.; Polonchuk, L.; Carreira, E.M.Oxetanes as promising modules in drug discovery. Angew. Chem. Int. Ed. 2006, 45, 7736–7739. [CrossRef]
36. Bull, J.A.; Croft, R.A.; Davis, O.A.; Doran, R.; Morgan, K.F. Oxetanes: Recent Advances in Synthesis,Reactivity, and Medicinal Chemistry. Chem. Rev. 2016, 116, 12150–12233. [CrossRef]
37. Talele, T.T. Natural-Products-Inspired Use of the gem-Dimethyl Group in Medicinal Chemistry. J. Med. Chem.2018, 61, 2166–2210. [CrossRef] [PubMed]
128

Molecules 2019, 24, 2791
38. Kamei, T. Metal-free halogenation of arylboronate with N-halosuccinimide. Tetrahedron Lett. 2014, 55, 4245–4247.[CrossRef]
39. Zhu, J.; Yang, Q.; Dai, D.; Huang, Q. X-ray crystal structure of phosphodiesterase 2 in complex with a highlyselective, nanomolar inhibitor reveals a binding-induced pocket important for selectivity. J. Am. Chem. Soc.2013, 135, 11708–11711. [CrossRef] [PubMed]
40. Gomez, L.; Xu, R.; Sinko, W.; Selfridge, B.; Vernier, W.; Ly, K.; Truong, R.; Metz, M.; Marrone, T.; Sebring, K.;et al. Mathematical and Structural Characterization of Strong Nonadditive Structure-Activity RelationshipCaused by Protein Conformational Changes. J. Med. Chem. 2018, 61, 7754–7766. [CrossRef] [PubMed]
41. Schneider, H.-J. Hydrogen bonds with fluorine. Studies in solution, in gas phase and by computations,conflicting conclusions from crystallographic analyses. Chem. Sci. 2012, 3, 1381–1394. [CrossRef]
42. Taylor, R. The hydrogen bond between N-H or O-H and organic fluorine: favourable yes, competitive no.Acta. Crys. 2017, B73, 474–488. [CrossRef] [PubMed]
43. Ludwig, F.-A.; Smits, R.; Fischer, S.; Donat, C.K.; Hoepping, A.; Brust, P.; Steinbach, J. LC-MS SupportedStudies on the in Vitro Metabolism of both Enantiomers of Flubatine and the in Vivo Metabolism of(+)-[18F]Flubatine-A Positron Emission Tomography Radioligand for Imaging α4β2 Nicotinic AcetylcholineReceptors. Molecules 2016, 21, 1200. [CrossRef] [PubMed]
44. Testa, B.; Kraemer, S.D. The Biochemistry of Drug Metabolism—An The Biochemistry of DrugMetabolism-Introduction Part 2. Redox Reaction and Their Enzymes. Chem. Biodivers. 2007, 4, 257–405.[CrossRef]
45. Russell, T.R.; Thompson, W.J.; Schneider, F.; Schneider, F.W.; Appleman, M.M. 3′:5′-Cyclic AdenosineMonophosphate Phosphodiesterase: Negative Cooperativity. Proc. Natl. Acad. Sci. USA 1972, 69, 1791–1795.[CrossRef]
Sample Availability: BIT2, and BIT6 are avaliable from the authors.
© 2019 by the authors. Licensee MDPI, Basel, Switzerland. This article is an open accessarticle distributed under the terms and conditions of the Creative Commons Attribution(CC BY) license (http://creativecommons.org/licenses/by/4.0/).
129


molecules
Article
Radiosynthesis and Biological Investigation of aNovel Fluorine-18 LabeledBenzoimidazotriazine-Based Radioligand for theImaging of Phosphodiesterase 2A with PositronEmission Tomography
Rien Ritawidya 1,2,*, Barbara Wenzel 1, Rodrigo Teodoro 1, Magali Toussaint 1, Mathias Kranz 3,4,
Winnie Deuther-Conrad 1, Sladjana Dukic-Stefanovic 1, Friedrich-Alexander Ludwig 1,
Matthias Scheunemann 1 and Peter Brust 1
1 Helmholtz-Zentrum Dresden-Rossendorf, Institute of Radiopharmaceutical Cancer Research, Research SiteLeipzig, Department of Neuroradiopharmaceuticals, 04318 Leipzig, Germany; [email protected] (B.W.);[email protected] (R.T.); [email protected] (M.T.); [email protected] (W.D.-C.);[email protected] (S.D.-S.); [email protected] (F.-A.L.); [email protected] (M.S.);[email protected] (P.B.)
2 Center for Radioisotope and Radiopharmaceutical Technology, National Nuclear Energy Agency (BATAN),Puspiptek Area, Serpong, South Tangerang 15314, Indonesia
3 Tromsø PET Center, University Hospital of North Norway, 9009 Tromsø, Norway; [email protected] Nuclear Medicine and Radiation Biology Research Group, The Arctic University of Norway,
9009 Tromsø, Norway* Correspondence: [email protected] or [email protected]; Tel.: +49-341-234-179-4611 or +62-21-756-3141
Received: 24 October 2019; Accepted: 12 November 2019; Published: 15 November 2019
Abstract: A specific radioligand for the imaging of cyclic nucleotide phosphodiesterase 2A(PDE2A) via positron emission tomography (PET) would be helpful for research on the physiologyand disease-related changes in the expression of this enzyme in the brain. In this report,the radiosynthesis of a novel PDE2A radioligand and the subsequent biological evaluation weredescribed. Our prospective compound 1-(2-chloro-5-methoxy phenyl)-8-(2-fluoropyridin-4-yl)-3-methylbenzo[e]imidazo[5,1-c][1,2,4]triazine, benzoimidazotriazine (BIT1) (IC50 PDE2A = 3.33 nM;16-fold selectivity over PDE10A) was fluorine-18 labeled via aromatic nucleophilic substitution ofthe corresponding nitro precursor using the K[18F]F-K2.2.2-carbonate complex system. The newradioligand [18F]BIT1 was obtained with a high radiochemical yield (54 ± 2%, n = 3), a highradiochemical purity (≥99%), and high molar activities (155–175 GBq/μmol, n = 3). In vitroautoradiography on pig brain cryosections exhibited a heterogeneous spatial distribution of [18F]BIT1
corresponding to the known pattern of expression of PDE2A. The investigation of in vivo metabolismof [18F]BIT1 in a mouse revealed sufficient metabolic stability. PET studies in mouse exhibiteda moderate brain uptake of [18F]BIT1 with a maximum standardized uptake value of ~0.7 at5 min p.i. However, in vivo blocking studies revealed a non-target specific binding of [18F]BIT1.Therefore, further structural modifications are needed to improve target selectivity.
Keywords: cyclic nucleotide phosphodiesterase; PDE2A radioligand; nitro-precursor; fluorine-18;in vitro autoradiography; PET imaging
1. Introduction
The cyclic nucleotide phosphodiesterases (PDEs) are a superfamily of enzymes catalyzing thehydrolysis of the intracellular secondary messengers, cyclic adenosine monophosphate (cAMP) and
Molecules 2019, 24, 4149; doi:10.3390/molecules24224149 www.mdpi.com/journal/molecules131

Molecules 2019, 24, 4149
cyclic guanosine monophosphate (cGMP) [1–3]. These secondary messengers are involved in a greatvariety of cellular functions associated with normal and pathophysiological processes in the brain andperiphery [3–6].
The 11 family members of PDEs are encoded by 21 genes and classified by their substratespecificity [3,7]. PDE 4, 7, and 8 are only cAMP-specific, PDE 5, 6, and 9 are cGMP-specific, and theremaining PDE 1, 2, 3, 10, and 11 hydrolyze both substrates [3,6,7].
The dual-substrate enzyme PDE2A is abundantly expressed in brain, in particular, in caudate,nucleus accumbens, cortex, hippocampus [3,8,9], amygdala [10,11], substantia nigra, as well as olfactorytubercle [11,12], while the expression in the midbrain, hindbrain, and cerebellum is comparativelylow [8,11,12]. This specific distribution indicates a role of PDE2A in the modulation of complexneuronal processes, such as learning, concentration, memory, emotion, depression, anxiety, and CNSrelated disorder [10,13,14]. The pharmacological inhibition of PDE2A has been evaluated in preclinicalstudies, thus suggesting PDE2A inhibitors as a potential treatment for neurodegenerative diseases,such as Alzheimer’s disease, schizophrenia, and dementia [15,16]. PDE2A inhibition has the potentialto prolong the duration of cAMP- and cGMP-dependent signaling pathways, eventually improvingneural plasticity and memory function [3,13,17].
Positron emission tomography (PET) is a molecular imaging modality that enables the visualization,characterization, and measurement of molecular targets and biochemical processes in living systems [18].Accordingly, a PDE2A specific radiotracer would allow quantification of PDE2A expression, as well asdisease-related changes thereof.
The so far most developed PDE2A radioligands are shown in Figure 1. The first highly potentPDE2A compound [18F]B-23 (IC50 hPDE2A = 1 nM; IC50 rPDE10A = 11 nM) was developed by JanssenPharmaceutica NV (Beerse, Belgium) [10,19]. Biodistribution and microPET imaging studies in ratsdemonstrated high uptake of activity in the striatum; however, brain-penetrating radio-metaboliteslimited further evaluation. Pfizer Inc. (New York, NY, USA) also reported on a highly affine PDE2Aradioligand, [18F]PF-05270430 (IC50 hPDE2A = 0.5 nM; IC50 hPDE10A >3000 nM) [10,20], which hasbeen evaluated in monkeys [20] and translated to clinical trials [21,22]. [18F]PF-05270430 showedhigh target-specific accumulation in the putamen, caudate, and nucleus-accumbens, as well as goodmetabolic stability and a favorable kinetic profile, pointing out [18F]PF-05270430 as a promising PDE2APET ligand [21]. However, using the cerebellum as a reference region, the estimated binding potentialof [18F]PF-05270430 was low, and the authors concluded that further studies are required to validatethe suitability of the cerebellum as a reference region [21].
In parallel to Pfizer, our group developed further PDE2A radioligands on the basis ofpyridoimidazotriazine. The recently published compounds [18F]TA3 (IC50 PDE2A = 11.4 nM; IC50
PDE10A = 318 nM) and [18F]TA4 (IC50 PDE2A = 7.3 nM; IC50 PDE10A = 913 nM) (Figure 1) werecharacterized by high potency and selectivity towards PDE2A [24]. Notably, both radiotracers werefound to be suitable radioligands for in vitro imaging of PDE2A; however, in vivo metabolism studiesrevealed a high fraction of polar radio-metabolites in the brain limiting their use for in vivo PDE2Aimaging. The latest radioligand out of this series, [18F]TA5 ((IC50 PDE2A = 3.0 nM; IC50 PDE10A >1000nM, Figure 1), exhibited the highest potency towards PDE2A and selectivity over PDE10A. However,autoradiographic studies of [18F]TA5 showed a homogenous and non-displaceable binding in ratand pig brain cryosections, indicating an insufficient specificity of this radioligand [25]. In addition,[18F]TA5 is degraded extremely fast in the mouse. Therefore, we decided to perform further structuralmodifications to develop fluorine-18 labeled PET tracers with improved metabolic stability for themolecular imaging of PDE2A.
132

Molecules 2019, 24, 4149
Figure 1. Selected phosphodiesterase 2A (PDE2A) PET radioligands [10,19,20,23–25].
In our continuous effort to develop fluorine-18 labeled PET tracers dedicated to molecular imagingof PDE2A, we selected the benzoimidazotriazine (BIT) scaffold (Figure 1) as lead structure by replacingthe pyrido ring of the TA compounds with a benzo ring [26,27]. As a first result, we very recentlyreported on the synthesis and inhibitory potency of nine new fluorinated derivatives based on this BITscaffold [28]. In order to increase the metabolic stability of the corresponding PDE2A radioligands,the fluorine was introduced by substituting a fluoropyridine ring at the benzene moiety. Out of thisseries, derivative BIT1 (Figure 1) was selected as the most suitable candidate for 18F-labeling andbiological investigation (IC50 PDE2A = 3.33 nM; 16-fold selectivity over PDE10A) [28].
Herein, we reported on the development and the evaluation of [18F]BIT1, including the synthesisof the corresponding nitro precursor, the manual radiosynthesis, and the transfer to an automatedsynthesis module, and the subsequent in vitro and in vivo investigations.
2. Results and Discussion
2.1. Precursor Synthesis and Radiochemistry
2.1.1. Synthesis of the Labeling Precursor 5
The synthesis of the reference compound BIT1 has been reported previously [28]. For an efficientradiosynthesis of [18F]BIT1, we selected the nitro precursor 5 because of its higher reactivityto nucleophilic aromatic substitutions in comparison to a bromo-substituted precursor [29,30].As depicted in Scheme 1, 5 was prepared in four steps starting from the BIT key intermediate1 [28]. Firstly, Miyaura borylation of 1 with bis(pinacolato)diboron, using potassium acetate and[Pd(dppf)Cl2] as base and catalyst, afforded the pinacol boronic ester 2 in a satisfactory yield of85% [31]. By palladium-catalyzed Suzuki coupling with 4-bromo-2-nitropyridine, compound 3 wasobtained in 63% yield. This 4-bromo-2-nitropyridine was synthesized according to a slightly modifiedprocedure, already described in the literature [32]. Thereafter, the bromination at 1-position of theimidazole ring using N-bromo-succinimide (NBS) afforded compound 4 in an excellent yield of 97%.Finally, the subsequent Suzuki coupling with 2-chloro-5-methoxy-phenyl boronic acid gave the nitroprecursor 5 in 68% yield (NMR spectrums of precursor 5 see in the Supplementary Materials).
133

Molecules 2019, 24, 4149
Scheme 1. Synthesis of precursor 5. Reagents and conditions: (i) Bis(pinacolato)diboron [Pd(dppf)Cl2],KOAc, 2-methyltetrahydrofuran (2-MeTHF), 100 ◦C (6 h), 85 ◦C (12 h), 85%; (ii) 4-bromo-2-nitropyridine,K2CO3, Pd(PPh3)4, 1,2-dimethoxyethane, 63%; (iii) N-bromo-succinimide (NBS), acetonitrile (MeCN),room temperature (RT), 4–6 h, 97%; (iv) 2-chloro-5-methoxy-phenyl-1-yl-boronic acid, K2CO3,[Pd(PPh3)4], 1,4-dioxane/H2O (4:1), reflux, 1–2 d, 68%.
2.1.2. Radiosynthesis and Characterization of [18F]BIT1
Manual Radiosynthesis
The new PDE2A radioligand [18F]BIT1 was prepared by heteroaromatic nucleophilic substitutionof 5 using a classical anhydrous K[18F]F-K2.2.2 carbonate complex. The radiolabeling process of[18F]BIT1 was carried out under thermal heating applying a constant amount of 1.0 mg of precursor5 by using different (i) polar aprotic solvents dimethylsulfoxide (DMSO), N,N-dimethylformamide(DMF), and acetonitrile (MeCN), (ii) temperatures, and (iii) reaction times.
As shown in Figure 2, after 5 min (min) reaction time, a radiochemical yield (RCY) of ~57% wasobtained when DMF was used at 150 ◦C. According to radio-TLC, besides [18F]fluoride, three radioactiveby-products were observed, which accounted for 10% of total radioactivity. When the temperature wasreduced to 120 ◦C, an increase of the RCY up to 93% was observed at this early time point. However,the RCY decreased with increasing the reaction time, indicating a decomposition of [18F]BIT1 underthese conditions. The highest RCY in DMF (~94%) was achieved when the reaction temperature wasfurther reduced to 100 ◦C. At this temperature, the product remained stable over 20 min reactiontime. By contrast, almost no radiofluorination could be observed when MeCN was used (RCY ≤1%).With DMSO as a solvent, high RCYs (>85%) were obtained at 150 ◦C and 120 ◦C, which remainedconstant up to 20 min reaction time in contrast to the findings with DMF. A further decrease to100 ◦C resulted in an increase of the RCY (>95%) after 10 min of reaction time. The precursor 5 wasstable throughout the time of analysis, as proven by HPLC (data not shown). Based on these results,DMSO was selected for the production of [18F]BIT1.
Due to the similarity of the chromatographic behavior of the nitro precursor and the corresponding18F-radiotracer, the use of a low amount of precursor is beneficial for subsequent isolation of theradiotracer via semi-preparative HPLC [33,34]. Accordingly, the further reduction of the amount ofthe nitro precursor 5 up to 0.5 mg was investigated, achieving an excellent RCY of ≥95% (DMSO,100 ◦C, 5 min reaction time). The selection of a suitable column for semi-preparative HPLC was alsosomewhat crucial in order to have a separation of the radiotracer and its nitro precursor in a reasonabletime [33]. According to our previous experiences [33], a slightly polar C18 phase turned out to be mostappropriate for the isolation of [18F]BIT1 using a mixture of MeCN/water and ammonium acetate asa buffer.
[18F]BIT1 was successfully isolated under the aforementioned conditions and further purifiedby solid-phase extraction (SPE). After formulation in 0.9% saline containing 10% ethanol, [18F]BIT1
134

Molecules 2019, 24, 4149
was obtained with an RCY of 38% (decay corrected to the end of the bombardment, EOB), and molaractivities in the range of 38 GBq/μmol (at the end of synthesis, EOS).
Figure 2. The radiochemical yield of [18F]BIT1 depending on reaction time, temperature, and solvent.(Conditions: K[18F]F-K2.2.2, thermal heating, 1.0 mg of 5). BIT, benzoimidazotriazine.
Automated Radiosynthesis of [18F]BIT1
By using the most appropriate conditions of the manual procedure, the automated radiosynthesisof [18F]BIT1 (Scheme 2) was established using a TRACERlab FX2 N synthesis module (GE Healthcare,Waukesha, WI, USA). The detailed configuration is shown in theexperimental part. Briefly, the [18F]F-
was firstly trapped on an anion exchange cartridge and then eluted into the reactor using an aqueouspotassium carbonate solution. The reaction took place with the [18F]F-/K2.2.2./K2CO3 system andthe nitro precursor 5 (0.5 mg) in DMSO at 100 ◦C for 5 min. After the isolation of [18F]BIT1 viasemi-preparative RP-HPLC (Figure 3A), the product was purified via SPE on an RP cartridge andformulated in sterile isotonic saline containing 10% of EtOH. The total synthesis time of [18F]BIT1 wasapproximately 75 min. Analytical radio- and UV-HPLC of the final product, spiked with the non-labeledreference compound BIT1, confirmed the identity of [18F]BIT1 (Figure 3B). Finally, the radiotracer wasobtained with a radiochemical purity of ≥99%, an RCY of 54 ± 2% (EOB, n = 3), and molar activities inthe range of 155–175 GBq/μmol (EOS, n = 3).
Scheme 2. 18F-labeling of [18F]BIT1.
135
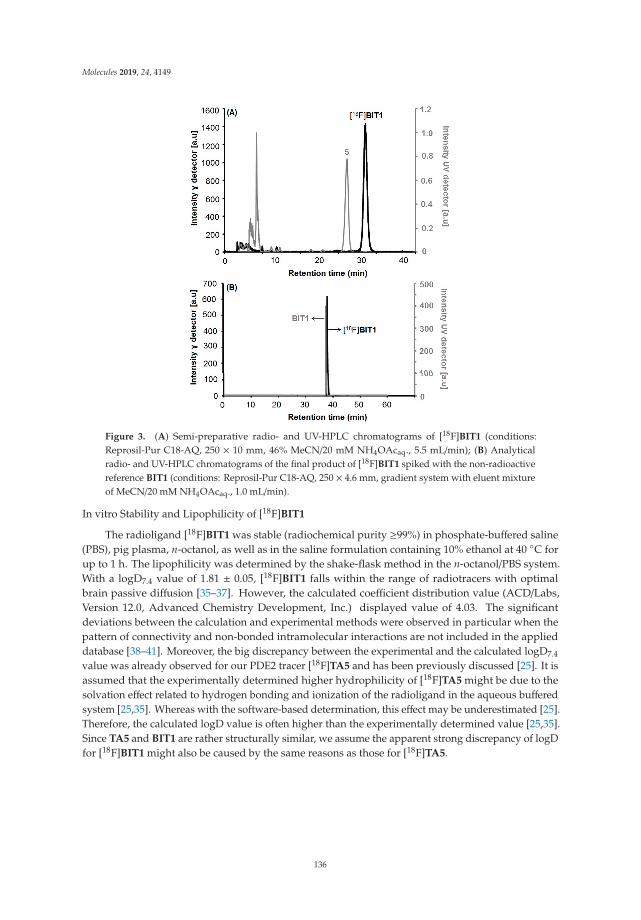
Molecules 2019, 24, 4149
Figure 3. (A) Semi-preparative radio- and UV-HPLC chromatograms of [18F]BIT1 (conditions:Reprosil-Pur C18-AQ, 250 × 10 mm, 46% MeCN/20 mM NH4OAcaq., 5.5 mL/min); (B) Analyticalradio- and UV-HPLC chromatograms of the final product of [18F]BIT1 spiked with the non-radioactivereference BIT1 (conditions: Reprosil-Pur C18-AQ, 250 × 4.6 mm, gradient system with eluent mixtureof MeCN/20 mM NH4OAcaq., 1.0 mL/min).
In vitro Stability and Lipophilicity of [18F]BIT1
The radioligand [18F]BIT1 was stable (radiochemical purity ≥99%) in phosphate-buffered saline(PBS), pig plasma, n-octanol, as well as in the saline formulation containing 10% ethanol at 40 ◦C forup to 1 h. The lipophilicity was determined by the shake-flask method in the n-octanol/PBS system.With a logD7.4 value of 1.81 ± 0.05, [18F]BIT1 falls within the range of radiotracers with optimalbrain passive diffusion [35–37]. However, the calculated coefficient distribution value (ACD/Labs,Version 12.0, Advanced Chemistry Development, Inc.) displayed value of 4.03. The significantdeviations between the calculation and experimental methods were observed in particular when thepattern of connectivity and non-bonded intramolecular interactions are not included in the applieddatabase [38–41]. Moreover, the big discrepancy between the experimental and the calculated logD7.4
value was already observed for our PDE2 tracer [18F]TA5 and has been previously discussed [25]. It isassumed that the experimentally determined higher hydrophilicity of [18F]TA5 might be due to thesolvation effect related to hydrogen bonding and ionization of the radioligand in the aqueous bufferedsystem [25,35]. Whereas with the software-based determination, this effect may be underestimated [25].Therefore, the calculated logD value is often higher than the experimentally determined value [25,35].Since TA5 and BIT1 are rather structurally similar, we assume the apparent strong discrepancy of logDfor [18F]BIT1 might also be caused by the same reasons as those for [18F]TA5.
136
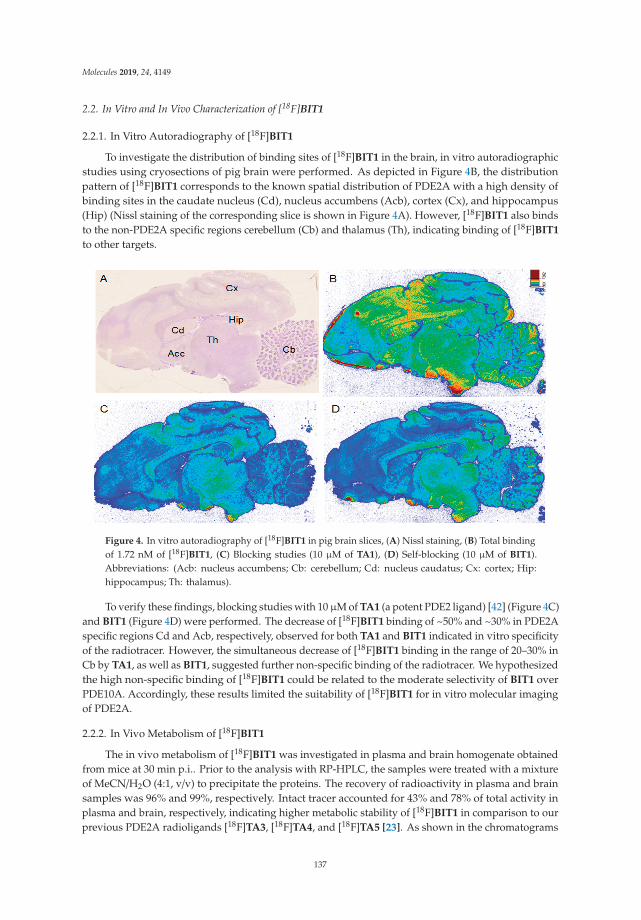
Molecules 2019, 24, 4149
2.2. In Vitro and In Vivo Characterization of [18F]BIT1
2.2.1. In Vitro Autoradiography of [18F]BIT1
To investigate the distribution of binding sites of [18F]BIT1 in the brain, in vitro autoradiographicstudies using cryosections of pig brain were performed. As depicted in Figure 4B, the distributionpattern of [18F]BIT1 corresponds to the known spatial distribution of PDE2A with a high density ofbinding sites in the caudate nucleus (Cd), nucleus accumbens (Acb), cortex (Cx), and hippocampus(Hip) (Nissl staining of the corresponding slice is shown in Figure 4A). However, [18F]BIT1 also bindsto the non-PDE2A specific regions cerebellum (Cb) and thalamus (Th), indicating binding of [18F]BIT1
to other targets.
Figure 4. In vitro autoradiography of [18F]BIT1 in pig brain slices, (A) Nissl staining, (B) Total bindingof 1.72 nM of [18F]BIT1, (C) Blocking studies (10 μM of TA1), (D) Self-blocking (10 μM of BIT1).Abbreviations: (Acb: nucleus accumbens; Cb: cerebellum; Cd: nucleus caudatus; Cx: cortex; Hip:hippocampus; Th: thalamus).
To verify these findings, blocking studies with 10μM of TA1 (a potent PDE2 ligand) [42] (Figure 4C)and BIT1 (Figure 4D) were performed. The decrease of [18F]BIT1 binding of ~50% and ~30% in PDE2Aspecific regions Cd and Acb, respectively, observed for both TA1 and BIT1 indicated in vitro specificityof the radiotracer. However, the simultaneous decrease of [18F]BIT1 binding in the range of 20–30% inCb by TA1, as well as BIT1, suggested further non-specific binding of the radiotracer. We hypothesizedthe high non-specific binding of [18F]BIT1 could be related to the moderate selectivity of BIT1 overPDE10A. Accordingly, these results limited the suitability of [18F]BIT1 for in vitro molecular imagingof PDE2A.
2.2.2. In Vivo Metabolism of [18F]BIT1
The in vivo metabolism of [18F]BIT1 was investigated in plasma and brain homogenate obtainedfrom mice at 30 min p.i.. Prior to the analysis with RP-HPLC, the samples were treated with a mixtureof MeCN/H2O (4:1, v/v) to precipitate the proteins. The recovery of radioactivity in plasma and brainsamples was 96% and 99%, respectively. Intact tracer accounted for 43% and 78% of total activity inplasma and brain, respectively, indicating higher metabolic stability of [18F]BIT1 in comparison to ourprevious PDE2A radioligands [18F]TA3, [18F]TA4, and [18F]TA5 [23]. As shown in the chromatograms
137
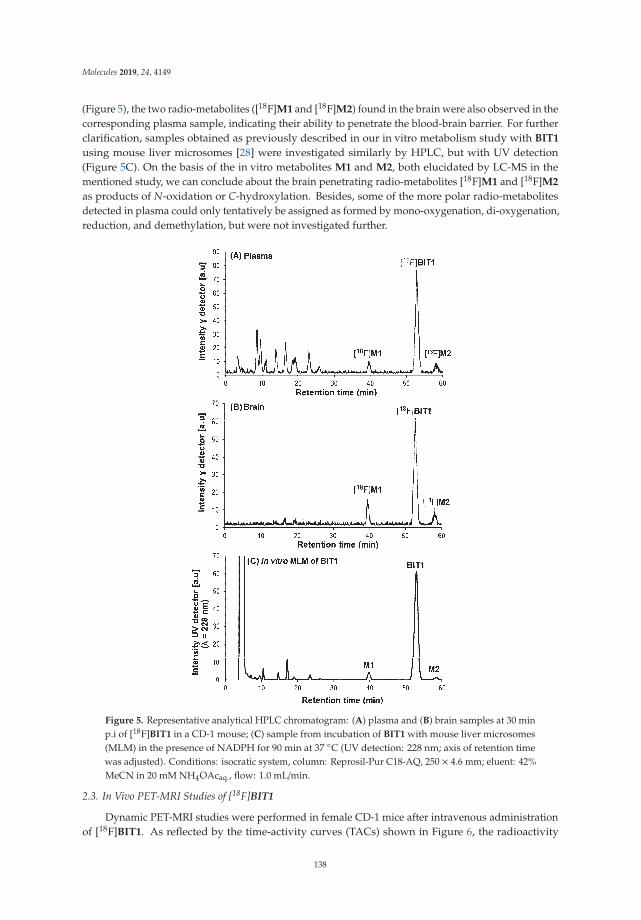
Molecules 2019, 24, 4149
(Figure 5), the two radio-metabolites ([18F]M1 and [18F]M2) found in the brain were also observed in thecorresponding plasma sample, indicating their ability to penetrate the blood-brain barrier. For furtherclarification, samples obtained as previously described in our in vitro metabolism study with BIT1
using mouse liver microsomes [28] were investigated similarly by HPLC, but with UV detection(Figure 5C). On the basis of the in vitro metabolites M1 and M2, both elucidated by LC-MS in thementioned study, we can conclude about the brain penetrating radio-metabolites [18F]M1 and [18F]M2
as products of N-oxidation or C-hydroxylation. Besides, some of the more polar radio-metabolitesdetected in plasma could only tentatively be assigned as formed by mono-oxygenation, di-oxygenation,reduction, and demethylation, but were not investigated further.
Figure 5. Representative analytical HPLC chromatogram: (A) plasma and (B) brain samples at 30 minp.i of [18F]BIT1 in a CD-1 mouse; (C) sample from incubation of BIT1 with mouse liver microsomes(MLM) in the presence of NADPH for 90 min at 37 ◦C (UV detection: 228 nm; axis of retention timewas adjusted). Conditions: isocratic system, column: Reprosil-Pur C18-AQ, 250 × 4.6 mm; eluent: 42%MeCN in 20 mM NH4OAcaq., flow: 1.0 mL/min.
2.3. In Vivo PET-MRI Studies of [18F]BIT1
Dynamic PET-MRI studies were performed in female CD-1 mice after intravenous administrationof [18F]BIT1. As reflected by the time-activity curves (TACs) shown in Figure 6, the radioactivity
138

Molecules 2019, 24, 4149
uptake in the whole brain, striatum, and cerebellum reached standardized uptake values (SUVs) ofabout 0.7 at 5 min p.i., indicating blood-brain barrier penetration. Since there is no difference in theTACs between the whole brain, striatum, and cerebellum, [18F]BIT1 is assumed to possess low specificbinding also in vivo.
Figure 6. Averaged time-activity curves of [18F]BIT1 in CD-1 mice (n = 2) with standard uptake values(SUV) in the whole brain, striatum, and cerebellum.
To further investigate this hypothesis, blocking studies were performed by concomitant injectionof TA1 and [18F]BIT1. However, since no significant reduction of radioactivity uptake in thePDE2A-specific region striatum was detectable (data not shown), the high non-specific bindingof [18F]BIT1 already observed in vitro was confirmed.
Overall, the herein reported potential PDE2A radioligand, selected from a new class of8-pyridinyl-BIT compounds, demonstrated sufficient blood-brain barrier (BBB) permeability. However,[18F]BIT1 was found to be insufficient for in vivo imaging of PDE2A with PET. Further structuralmodifications are needed to obtain PDE2A selective radioligands for in vitro and in vivo research.Extensive structure-activity relationship (SAR) studies could lead to the improvement of the selectivityand specificity of compounds. In particular, modifications of the set substituents at 1- and 8-positionsof the BIT scaffold might result in additive as well as nonadditive effects in compound potency [43].
3. Materials and Methods
3.1. General Methods
All chemicals were purchased from commercial sources and used without further purification.Solvents were dried before used if required. Air and moisture-sensitive reactions were carriedout under argon atmosphere. Room temperature (RT) refers to 20–25 ◦C. Reaction mixtures weremonitored by thin-layer chromatography (TLC) using pre-coated TLC-plates POLYGRAM® SILG/UV254 (Macherey-Nagel GmbH & Co. KG, Düren, Germany). The spots were detected underUV light at λ 254 nm and 365 nm. For the purification of final products, flash chromatography wasperformed with silica gel 40–63 μm (Merck KGaA, Darmstadt, Germany). Radio-TLC was performedon Polygram SIL G/UV254 plates (Macherey-Nagel GmbH & Co. KG, Düren, Germany) pre-coatedplates with a mixture of chloroform/methanol (10:1, v/v) as eluent. The radio-TLC plates were exposedto storage phosphor screens (BAS-IP MS 2025, FUJIFILM Co., Tokyo, Japan) and recorded using theAmershamTyphoon RGB Biomolecular Imager (GE Healthcare Life Sciences, Freiburg, Germany),and the images were quantified with ImageQuant TL8.1 software (GE Healthcare Life Sciences,Freiburg, Germany).
139
Molecules 2019, 24, 4149
NMR spectra (1H and 13C) were recorded on Mercury 300/Mercury 400 (Varian, Palo Alto, CA,USA) or Fourier 300/Avance DRX 400 Bruker (Billerica, MA, USA) instruments. Residual solvent proton(1H) and carbon (13C) resonances were used as internal standards for 1H-NMR (CDCl3, δH = 7.26;DMSO-d6, δH = 2.50) and 13C-NMR (CDCl3, δC = 77.16; DMSO-d6, δC = 39.52). The chemical shifts (δ)were reported in ppm as follows: s, singlet; d, doublet; t, triplet; m, multiplet, and the coupling constants(J) are reported in Hz. Mass spectra were recorded on an ESQUIRE 3000 Plus (ESI, low resolution) anda 7 T APEX II (ESI, high resolution) (Bruker Daltonics, Bruker Corporation, Billerica, MA, USA).
For semi-preparative HPLC, the following conditions were used. Column: Reprosil-Pur C18-AQ,250 × 10 mm, particle size: 10 μm; eluent: 46% MeCN/20 mM NH4OAcaq.; flow: 5.5 mL/min;ambient temperature; UV detection at 254 nm. The semi-preparative HPLC separations in the manualradiosynthesis were performed on a JASCO LC-2000 system, using a PU-2080-20 pump, an UV/VIS-2075detector coupled with a radioactivity HPLC flow monitor (Gabi Star, raytest IsotopenmessgeräteGmbH, Straubenhardt, Germany) and a fraction collector (Advantec CHF-122SC, Dublin, CA, USA).Data recording was performed with the Galaxie chromatography software (Agilent Technologies,Santa Clara, USA).
Analytical chromatographic separations were performed on a JASCO LC-2000 system,incorporating a PU-2080Plus pump, AS-2055Plus auto-injector (100 μL sample loop), and a UV-2070 Plusdetector coupled with a gamma radioactivity HPLC detector (Gabi Star, raytest IsotopenmessgeräteGmbH, Straubenhardt, Germany). Data analysis was performed with the Galaxie chromatographysoftware (Agilent Technologies, Santa Clara, USA) using the chromatogram obtained at 254 nm.A Reprosil-Pur C18-AQ column (250× 4.6 mm; 5 μm; Dr. Maisch HPLC GmbH, Ammerbuch-Entringen,Germany) with MeCN/20 mM NH4OAcaq. (pH 6.8) as eluent mixture and a flow of 1.0 mL/min wasused (gradient: eluent A 10% MeCN/20 mM NH4OAcaq.; eluent B 90% MeCN/20 mM NH4OAcaq.;0–10 min 100% A, 10–40 min up to 100% B, 40–45 min 100% B, 45–50 min up to 100% A, 50–60 min100% A; isocratic system 42% MeCN/20 mM NH4OAcaq.; flow: 1.0 mL/min; ambient temperature).
The molar activities were determined on the basis of a calibration curve (0.1–6 μg of BIT1)performed under isocratic HPLC conditions (46% MeCN/20 mM NH4OAcaq.) using chromatogramsobtained at 228 nm as the maximum of UV absorbance of compound BIT1.
No-carrier-added (n.c.a.) [18F]fluoride (t1/2 = 109.8 min) was produced by irradiation of [18O]H2O(Hyox 18 enriched water, Rotem Industries Ltd., Arava, Israel) via [18O(p,n)18F] nuclear reaction byirradiation of on a Cyclone®18/9 (iba RadioPharma Solutions, Louvain-la-Neuve, Belgium).
Remote-controlled automated syntheses were performed using a TRACERlab FX2 N synthesizer(GE Healthcare, USA) equipped with a N810.3FT.18 pump (KNF Neuburger GmbH, Freiburg, Germany),a BlueShadow UV detector 10D (KNAUER GmbH, Berlin, Germany), NaI(Tl)- counter, and theTRACERlab FX Software.
3.2. Precursor Synthesis and Radiochemistry
The final compounds described in this manuscript meet the purity requirement (>95%) determinedby UV-HPLC.
3.2.1. Synthesis of Precursor
3-Methyl-8-(4,4,5,5-tetramethyl-1,3,2-dioxaborolan-2-yl)benzo[e]imidazo[5,1-c][1,2,4]triazine (2)A mixture of bromo derivative 1 [28] (1.32 g, 5 mmol), potassium acetate (1.1 g, 11.2 mmol),
and bis(pinacolato)diboron (1.3 g, 5.11 mmol) in 2-MeTHF (20 mL) was degassed with argon for 10 min.After the addition of Pd(dppf)Cl2 (0.055 g, 0.075 mmol), the mixture was refluxed at 100 ◦C for 6 h andat 85 ◦C for 12 h. Upon completion of the reaction (monitored by TLC), CH2Cl2 (25 mL) was added,and the reaction mixture was stirred for 1 h. The solid was filtered off, and the filtrate was evaporated.The dark brown semi-solid residue (2.5 g) was dissolved in MTBE (60 mL) and filtered through ashort silica gel column (H: 3 cm × D: 2 cm). Heptane (30 mL) was added to the eluate, followed byconcentration to a volume of approximately 20 mL. The precipitated solid was filtered and dissolved
140

Molecules 2019, 24, 4149
in MTBE (120 mL), and the solution obtained was filtered again through a short silica gel column (H:2 cm × D: 2 cm). The yellow eluate was concentrated (→ ~15 mL) and treated with n-heptane (30 mL).The solid obtained was filtered and dried under reduced pressure to afford a yellow solid 2 (1.32 g,85%). TLC [CHCl3/MeCN (10:1)]: Rf = 0.26 (strong tailing). 1H NMR (400 MHz, CDCl3) δH = 8.57(s, 1H), 8.41 (d, J = 8.0 Hz, 1H), 8.25 (s, 1H), 8.05 (dd, J = 8.0, 1.1 Hz, 1H), 2.89 (s, 3H), 1.40 (s, 13H).
3-Methyl-8-(2-nitropyridin-4-5 yl)benzo[e]imidazo[5,1-c][1,2,4]triazine (3)A mixture of boronic ester 2 (470 mg, 1.5 mmol, 1 eq) and 4-bromo-2-nitropyridine (243 mg,
1.2 mmol) in 1,2-dimethoxyethane (6 mL) and an aqueous solution of K2CO3 (2 M, 1.75 mL, 3.5 mmol)was degassed with argon for 20 min. Pd(PPh3)4 (50 mg, 0.043 mmol) was added, and the reactionmixture was heated at 95 ◦C for 1 h and 88 ◦C for 14 h. Upon full conversion of starting material(monitored by TLC), the solvent was evaporated, and the residue was partitioned between water(30 mL) and CHCl3 (50 mL). After separation of the organic layer, the aqueous layer was extractedwith CHCl3/MeCN (8:1, 6 × 30) and CHCl3 (5 × 30 mL). The combined organic layers were dried overNa2CO3, and the solvent was evaporated to leave a solid residue (370 mg). The residue was refluxedin MeCN (50 mL) for 5 min, and after cooling to 0–2 ◦C, the product was filtered and dried to give 3 asyellow solid (233 mg, 63%). TLC [CHCl3/MeOH/30% NH3 (10:1:0.1)]: Rf = 0.35. 1H NMR (300 MHz,DMSO-d6) δH = 9.26 (s, 1H), 8.96 (dd, J = 2.0, 0.5 Hz, 1H), 8.85 (dt, J = 5.1, 0.8 Hz, 1H), 8.82–8.80(m, 1H), 8.52 (dd, J = 8.7, 1.5 Hz, 1H), 8.42 (dd, J = 5.1, 1.7 Hz, 1H), 8.28 (dd, J = 8.5, 2.0 Hz, 1H), 2.78(d, J = 1.7 Hz, 3H). 13C NMR (75 MHz, DMSO-d6) δC = 157.67, 149.59, 149.28, 138.82, 138.14, 136.18,135.67, 130.31, 127.22, 127.17, 126.02, 122.45, 115.55, 114.35, 12.18.
1-Brom-3-methyl-8-(2-nitropyridin-4-yl)benzo[e]imidazo[5,1-c][1,2,4]triazine (4)N-Bromosuccinimide (NBS) (48 mg, 1.58 eq) was added to a suspension of compound 3 (52 mg,
1 eq) in 2.5 mL MeCN. The reaction mixture was protected from light and stirred at RT for 1–2 d.After the complete conversion of starting material (monitored by TLC), the mixture was partitionedbetween CHCl3 (15 mL) and water (15 mL). The organic layer was washed with aqueous NaHCO3
(5%, 15 mL) and Na2SO3 (5%, 15 mL). The aqueous layer was extracted again with CHCl3 (4x5 mL).The combined organic layers were dried (Na2SO4) and evaporated. The crude product was purified bycolumn chromatography (CHCl3/MeOH, 20:1) to afford compound 4 as a yellow solid (64 mg, 97%).TLC [CHCl3/MeOH (20:1)]: Rf = 0.59. 1H NMR (400 MHz, CDCl3) δH = 9.31 (d, J = 1.8 Hz, 1H), 8.84 (d,J = 5.0 Hz, 1H), 8.65 (d, J = 8.4 Hz, 1H), 8.59 (d, J = 1.6 Hz, 1H), 8.04–7.98 (m, 2H), 2.90 (s, 3H).
1-(2-Chloro-5-methoxyphenyl)-3-methyl-8-(2-nitropyridin-4-yl)benzo[e]imidazo[5,1-c][1,2,4]triazine (5)Brominated compound 4 (43 mg, 0.112 mmol, 1 eq), 2-chloro-5-methoxyphenyl boronic acid
(27 mg, 0.145 mmol, 1.29 eq), and K2CO3 (44 mg, 0.318 mmol, 2.8 eq) were combined in a mixtureof 1,4-dioxane and H2O (4:1). Under argon atmosphere, [Pd(PPh3)4] (13 mg, 10 mol%) was added.After refluxing at 101–105
◦C for 3 h, the reaction mixture was stirred at RT for 16 h. Afterward, the
residue was partitioned between CHCl3 (20 mL) and water (20 mL). The organic layer was washedwith water (20 mL) and brine (20 mL). The aqueous layer was extracted with CHCl3 (3 × 10 mL),and the combined organic layers were dried over Na2SO4, and the solvent was evaporated underreduced pressure. The crude product was purified by column chromatography using a gradient system(n-hexane/ethyl acetate from 1:1 to 1:3) to get the corresponding precursor 5 as a yellow solid (34 mg,68%). TLC [n-hexane/ethyl acetate (1:2)]: Rf = 0.38. 1H NMR (400 MHz, CDCl3) δH = 8.71 (dd, J = 5.0,0.6 Hz, 1H), 8.60 (d, J = 8.4 Hz, 1H), 8.15 (dd, J = 1.6, 0.6 Hz, 1H), 7.95 (dd, J = 8.4, 1.9 Hz, 1H), 7.77(dd, J = 5.0, 1.6 Hz, 1H), 7.67–7.64 (m, 1H), 7.58 (d, J = 1.9 Hz, 1H), 7.24–7.20 (m, 2H), 3.87 (s, 3H), 3.00(s, 3H). 13C NMR (101 MHz, CDCl3) δC = 159.24, 157.85, 150.52, 149.96, 140.32, 138.66, 137.53, 137.22,136.47, 131.76, 131.27, 131.11, 126.50, 125.79, 125.61, 124.31, 118.59, 117.99, 115.77, 114.21, 56.06, 12.94.ESI (+): m/z = 447.10 (calcd. 447.10 for C22H16ClN6O3
+ [M + H]+).
3.2.2. In Vitro Metabolism of BIT1
BIT1 was incubated with mouse liver microsomes in the presence of NADPH, including positiveand negative controls, for 90 min at 37 ◦C, as previously described [28]. Obtained samples were
141

Molecules 2019, 24, 4149
investigated by analytical HPLC with an isocratic system (42% MeCN/20 mM NH4OAcaq; flow rate of1.0 mL/min) and UV detection (228 nm).
3.2.3. Radiochemistry
Manual Radiosynthesis
No carrier added [18F]fluoride in 1.5 mL water and was trapped on a Chromafix® 30 PS-HCO3−
cartridge (Macherey-Nagel GmbH & Co. KG, Düren, Germany). The activity was eluted with 300 μLof an aqueous solution of potassium carbonate solution (K2CO3, 1.8 mg, 13 μmol) into a 4 mL V-vial,and Kryptofix2.2.2. (K2.2.2) (11 mg, 29 μmol) in 1.0 mL MeCN was added. The aqueous [18F]fluoride wasazeotropically dried under vacuum and nitrogen flow within 7–10 min using a single-mode microwave(75 W, at 50–60 ◦C, power cycling mode). Two aliquots of MeCN (2 × 1.0 mL) were added duringthe drying procedure, and the final complex was dissolved in 500 μL of solvent (DMSO, DMF, andMeCN) ready for labeling. Thereafter, 0.5–1.0 mg of precursor in 500 μL labeling solvent was added,and the 18F-labeling was performed at different temperatures (100 ◦C, 120 ◦C, and 150 ◦C). To analyzethe reaction mixture and to determine radiochemical yields, samples were taken for radio-HPLC andradio-TLC at different time points (5, 10, 15, and 20 min).
After cooling to <30 ◦C, the reaction mixture was diluted with 1.0 mL water and 2.0 mL ofMeCN/H2O (1:1) and directly applied to an isocratic semi-preparative RP-HPLC for isolation of[18F]BIT1 (46% MeCN/20 mM NH4OAcaq., 5.5 mL/min, Reprosil-Pur C18-AQ column, 250 × 10 mm;10 μm; Dr. Maisch HPLC GmbH, Ammerbuch-Entringen, Germany). The collected radiotracer fractionwas diluted with 35 mL water to perform purification by sorption on a Sep-Pak® C18 light cartridge(Waters, Milford, MA, USA) and successive elution with 0.75 mL of ethanol.
Automated Radiosynthesis of [18F]BIT1
The automated radiosynthesis was performed in a TRACERlab FX2 N synthesis module (GEHealthcare, Waukesha, WI, USA). About 2–4.5 GBq of aqueous n.c.a [18F]fluoride was trapped on aChromafix® 30 PS-HCO3
- cartridge (Figure 7, Macherey-Nagel GmbH & Co. KG, Düren, Germany,entry 1) and eluted with K2CO3 (1.8 mg, 13 μmol, entry 2) in 400 μL water. Kryptofix K2.2.2 (11 mg,29 μmol, in 1.0 mL MeCN, entry 3) was directly added. Afterward, azeotropic drying was performed at60 ◦C and 85 ◦C under a vacuum. Thereafter, 0.5 mg of 5 in 1.0 mL DMSO (entry 4) was transferred tothe reactor, and subsequently, the reaction was performed at 100 ◦C for 5 min. After cooling the reactorto 30 ◦C, 1.0 mL of H2O and 2.0 mL of MeCN/H2O (1:1) (entry 5) were added and transferred into theinjection vial (entry 6). The semi-preparative HPLC was performed using a Reprosil-Pur C-18 AQcolumn (250 × 10 mm; 10 μM) using 46% MeCN in aqueous 20 mM ammonium acetate at a flow rateof 5.5 mL/min (entry 7). The [18F]BIT1 fraction was pooled in 35 mL H2O (entry 8) and then loaded ona preconditioned Sep-Pak® C18 light cartridge (Waters, Milford, MA, USA, entry 9), and washed with2.0 mL of H2O (entry 10). Afterward, the trapped [18F]BIT1 was eluted with 1.2 mL EtOH (entry 11)into the product vial (entry 12). The product was transferred out of the hot cell, and the solvent wasreduced under a gentle argon stream at 70 ◦C to a final volume of 10–50 μL. Afterward, the radiotracerwas diluted in isotonic saline to obtain a final product containing 10% of EtOH (v/v). The identity ofthe final product was confirmed using radioanalytical HPLC.
142
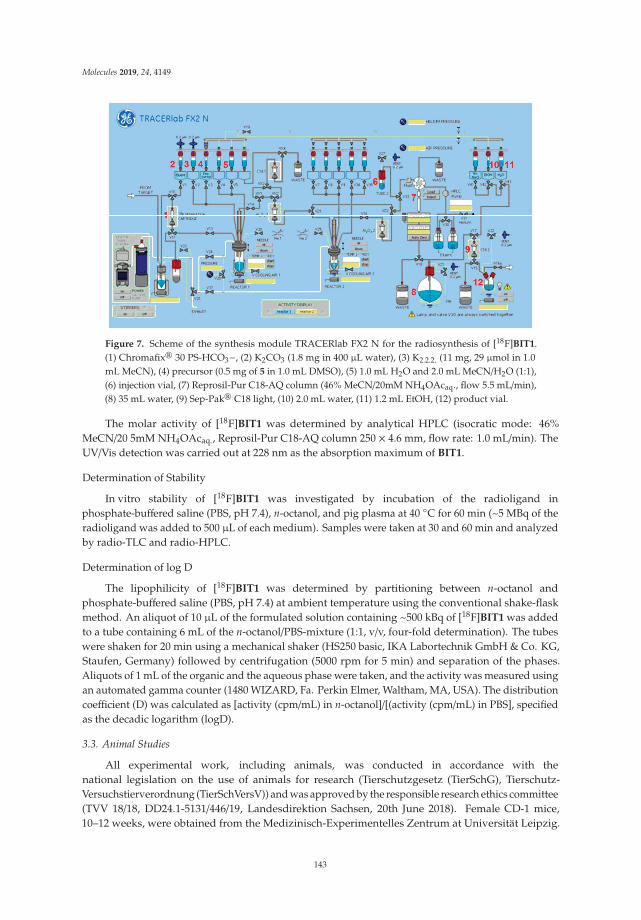
Molecules 2019, 24, 4149
Figure 7. Scheme of the synthesis module TRACERlab FX2 N for the radiosynthesis of [18F]BIT1.(1) Chromafix® 30 PS-HCO3−, (2) K2CO3 (1.8 mg in 400 μL water), (3) K2.2.2. (11 mg, 29 μmol in 1.0mL MeCN), (4) precursor (0.5 mg of 5 in 1.0 mL DMSO), (5) 1.0 mL H2O and 2.0 mL MeCN/H2O (1:1),(6) injection vial, (7) Reprosil-Pur C18-AQ column (46% MeCN/20mM NH4OAcaq., flow 5.5 mL/min),(8) 35 mL water, (9) Sep-Pak® C18 light, (10) 2.0 mL water, (11) 1.2 mL EtOH, (12) product vial.
The molar activity of [18F]BIT1 was determined by analytical HPLC (isocratic mode: 46%MeCN/20 5mM NH4OAcaq., Reprosil-Pur C18-AQ column 250 × 4.6 mm, flow rate: 1.0 mL/min). TheUV/Vis detection was carried out at 228 nm as the absorption maximum of BIT1.
Determination of Stability
In vitro stability of [18F]BIT1 was investigated by incubation of the radioligand inphosphate-buffered saline (PBS, pH 7.4), n-octanol, and pig plasma at 40 ◦C for 60 min (~5 MBq of theradioligand was added to 500 μL of each medium). Samples were taken at 30 and 60 min and analyzedby radio-TLC and radio-HPLC.
Determination of log D
The lipophilicity of [18F]BIT1 was determined by partitioning between n-octanol andphosphate-buffered saline (PBS, pH 7.4) at ambient temperature using the conventional shake-flaskmethod. An aliquot of 10 μL of the formulated solution containing ~500 kBq of [18F]BIT1 was addedto a tube containing 6 mL of the n-octanol/PBS-mixture (1:1, v/v, four-fold determination). The tubeswere shaken for 20 min using a mechanical shaker (HS250 basic, IKA Labortechnik GmbH & Co. KG,Staufen, Germany) followed by centrifugation (5000 rpm for 5 min) and separation of the phases.Aliquots of 1 mL of the organic and the aqueous phase were taken, and the activity was measured usingan automated gamma counter (1480 WIZARD, Fa. Perkin Elmer, Waltham, MA, USA). The distributioncoefficient (D) was calculated as [activity (cpm/mL) in n-octanol]/[(activity (cpm/mL) in PBS], specifiedas the decadic logarithm (logD).
3.3. Animal Studies
All experimental work, including animals, was conducted in accordance with thenational legislation on the use of animals for research (Tierschutzgesetz (TierSchG), Tierschutz-Versuchstierverordnung (TierSchVersV)) and was approved by the responsible research ethics committee(TVV 18/18, DD24.1-5131/446/19, Landesdirektion Sachsen, 20th June 2018). Female CD-1 mice,10–12 weeks, were obtained from the Medizinisch-Experimentelles Zentrum at Universität Leipzig.
143

Molecules 2019, 24, 4149
For the time of the experiments, the animals were kept in a dedicated climatic chamber with free accessto water and food under a 12:12 h dark:light cycle at a constant temperature of 24 ◦C. Piglet brainswere obtained from anesthetized and euthanized juvenile female German landrace pigs (Lehr- undVersuchsgut Oberholz, Universität Leipzig).
3.3.1. In Vitro Autoradiography of [18F]BIT1
Pig brain cryosections (16 μm; Microm HM560 Cryostat, FischerScientific GmbH, Schwerte,Germany) were thawed, dried in a stream of cold air, and preincubated for 10 min with buffer (50 mMTRIS-HCl, pH 7.4, 120 mM NaCl, 5 mM KCl, 2 mM MgCl2) at room temperature. Afterward, brainsections were incubated with 1.72 nM of [18F]BIT1 in the buffer for 60 min at room temperature.The sections were then washed twice with ice-cold 50 mM TRIS-HCl (pH 7.4), dipped in ice-colddeionized water, dried in a stream of cold air, and exposed for 60 min to an image plate. The analysiswas performed using an image plate scanner (HD-CR 35; Duerr NDT GmbH, Bietigheim Bissingen,Germany). Non-specific binding was determined using 10 μM TA1 and BIT1 as blocking compounds.
3.3.2. In Vivo Metabolism of [18F]BIT1
[18F]BIT1 (~19 MBq) was injected in female CD-1 mice (10–12 weeks old) via the tail vein. Brainand blood samples were obtained at 30 min p.i., plasma separated by centrifugation (14,000 rpm,1 min), and brain homogenized in ~1 mL isotonic saline on ice (10 strokes of a PTFE plunge at 1000 rpm)in borosilicate glass.
Protein precipitation of plasma and brain samples was performed in duplicate with ice-coldMeCN/H2O (8:2, v/v), which was added to the samples (sample/solvent, 1:4, v/v). The samples werevortexed for 1 min, followed by resting on ice for 10 min. Afterward, the samples were centrifuged for5 min at 10,000 g. Supernatants were collected, and 100 μL ice-cold MeCN/H2O (8:2, v/v) was added tothe pellets for the second extraction, applying the same treatment as before. The combined supernatantswere concentrated at 70 ◦C under nitrogen stream until a remaining volume of 100 μL and subsequentlyquantified by analytical radio-HPLC with an isocratic system (42% MeCN/20 mM NH4OAcaq.; flowrate: 1.0 mL/min). The activity recovery was determined by measuring the radioactivity of aliquotstaken from supernatants and the pellets using a gamma counter.
3.4. PET-MRI Studies of [18F]BIT1
PET/MRI scans were performed using a preclinical PET/MRI system (nanoScan, Mediso MedicalImaging Systems, Budapest, Hungary). Animals were anesthetized with a mixture of air/isoflurane(2.0%, 200 mL/min) (Anesthesia Unit U-410, agntho’s, Lidingö, Sweden), and their body temperaturemaintained at 37 ◦C with a thermal bed system. [18F]BIT1 (2 MBq, Am: 155 GBq/μmol, EOS) wasinjected via the tail vein, either without (baseline study, n = 2) or with TA1 (2 mg/kg, DMSO/NaCl(1:25); blocking study, n = 2). A dynamic 60-min PET scan was started 20 sec before radioligandinjection. The list-mode data were reconstructed into 33 frames (12 × 10 sec, 6 × 30 sec, 5 × 1 min,10 × 5 min) with 3D-ordered subset expectation maximization, 4 iterations, and 6 subsets, using anenergy window of 400 to 600 KeV and coincidence mode of 1–5. After the PET scan, an MRI scan wasperformed for anatomical orientation and attenuation correction on a 1T magnet using a T1-weightedgradient-echo sequence (TR = 15 ms, TE = 2.6 ms). The data analysis was done with PMOD (PMODTechnologies Ltd., Zurich, Switzerland, v. 3.6), and an atlas-based method was used to obtain SUVtime-activity curves for the striatum, cerebellum, and the whole brain.
4. Conclusions
In our efforts to develop a specific radioligand for PET imaging of PDE2A in the brain on the basisof a benzoimidazotriazine scaffold, we successfully prepared the novel PDE2A radioligand [18F]BIT1
with a high radiochemical yield, radiochemical purity, as well as molar activity. Our findings showed
144

Molecules 2019, 24, 4149
that this class of compound demonstrated good brain penetration and sufficient in vivo metabolicstability. However, [18F]BIT1 was not suitable for the molecular imaging of PDE2A in the brain becauseof a high non-specific binding. Further structural modifications are required to obtain more satisfactoryPDE2A specific radioligands.
Supplementary Materials: The following are available online, Figures S1–S2: NMR spectra of precursor 5 (1Hand 13C), Figure S3. The calibration curve of molar activity of reference BIT1.
Author Contributions: B.W., M.S., and P.B. designed the study; M.S. and R.R. designed and performed organicsyntheses; B.W., R.R., and R.T. performed radiosynthesis; W.D.-C., B.W., R.T., F.-A.L., and R.R. performed in vivometabolism studies; S.D.-S., W.D.-C., and P.B. performed in vitro autoradiographic studies; M.T., M.K., W.D.-C.,and P.B. designed and performed PET-MR studies; R.R., B.W., R.T., M.T., M.K., W.D.-C., S.D.-S, F.-A.L., M.S., andP.B. wrote the paper. All authors read and approved the final manuscript.
Acknowledgments: This work was financially supported by the Deutsche Forschungsgemeinschaft (DFG), ProjectNumber: SCHE 1825/3-1. We further thank the Research and Innovation in Science and Technology Project(RISET-Pro), the Ministry of Research, Technology, and Higher Education, Republic of Indonesia, World Bank LoanNo. 8245-ID, for supporting the Ph.D. thesis of Rien Ritawidya, the staff of the Institute of Analytical Chemistry(University of Leipzig) for measuring NMR and LR/HR-MS spectra, Karsten Franke and Steffen Fischer for theproduction of [18F]fluoride, and Tina Spalholz for technical assistance.
Conflicts of Interest: The authors declare no conflict of interest.
References
1. Helal, C.J.; Arnold, E.P.; Boyden, T.L.; Chang, C.; Chappie, T.A.; Fennell, K.F.; Forman, M.D.; Hajos, M.;Harms, J.F.; Hoffman, W.E.; et al. Application of structure-based design and parallel chemistry to identify apotent, selective, and brain penetrant phosphodiesterase 2A inhibitor. J. Med. Chem. 2017, 60, 5673–5698.[CrossRef] [PubMed]
2. Zhu, J.; Yang, Q.; Dai, D.; Huang, Q. X-ray crystal structure of phosphodiesterase 2 in complex with a highlyselective, nanomolar inhibitor reveals a binding-induced pocket important for selectivity. J. Am. Chem. Soc.2013, 135, 11708–11711. [CrossRef] [PubMed]
3. Wu, Y.; Li, Z.; Huang, Y.-Y.; Wu, D.; Luo, H.-B. Novel phosphodiesterase inhibitors for cognitive improvementin Alzheimer’s disease. J. Med. Chem. 2018, 61, 5467–5483. [CrossRef] [PubMed]
4. Svensson, F.; Bender, A.; Bailey, D. Fragment-based drug discovery of phosphodiesterase inhibitors.J. Med. Chem. 2018, 61, 1415–1424. [CrossRef] [PubMed]
5. Jäger, R.; Schwede, F.; Genieser, H.-G.; Koesling, D.; Russwurm, M. Activation of PDE2 and PDE5 by specificGAF ligands: Delayed activation of PDE5. Br. J. Pharmacol. 2010, 161, 1645–1660. [CrossRef] [PubMed]
6. Maurice, D.H.; Ke, H.; Ahmad, F.; Wang, Y.; Chung, J.; Manganiello, V.C. Advances in targeting cyclicnucleotide phosphodiesterases. Nat. Rev. Drug Discov. 2014, 13, 290–314. [CrossRef]
7. Conti, M.; Beavo, J. Biochemistry and physiology of cyclic nucleotide phosphodiesterases: Essentialcomponents in cyclic nucleotide signaling. Annu. Rev. Biochem. 2007, 76, 481–511. [CrossRef]
8. Lakics, V.; Karran, E.H.; Boess, F.G. Quantitative comparison of phosphodiesterase mRNA distribution inhuman brain and peripheral tissues. Neuropharmacology 2010, 59, 367–374. [CrossRef]
9. Menniti, F.S.; Faraci, W.S.; Schmidt, C.J. Phosphodiesterases in the CNS: Targets for drug development.Nat. Rev. Drug Discov. 2006, 5, 660–670. [CrossRef]
10. Gomez, L.; Breitenbucher, J.G. PDE2 inhibition: Potential for the treatment of cognitive disorders.Bioorganic Med. Chem. Lett. 2013, 23, 6522–6527. [CrossRef]
11. Stephenson, D.T.; Coskran, T.M.; Wilhelms, M.B.; Adamowicz, W.O.; O’Donnell, M.M.; Muravnick, K.B.;Menniti, F.S.; Kleiman, R.J.; Morton, D. Immunohistochemical localization of phosphodiesterase 2A inmultiple mammalian species. J. Histochem. Cytochem. 2009, 57, 933–949. [CrossRef] [PubMed]
12. Stephenson, D.T.; Coskran, T.M.; Kelly, M.P.; Kleiman, R.J.; Morton, D.; O’Neill, S.M.; Schmidt, C.J.;Weinberg, R.J.; Menniti, F.S. The distribution of phosphodiesterase 2A in the rat brain. Neuroscience 2012, 226,145–155. [CrossRef] [PubMed]
13. Gomez, L.; Massari, M.E.; Vickers, T.; Freestone, G.; Vernier, W.; Ly, K.; Xu, R.; McCarrick, M.; Marrone, T.;Metz, M.; et al. Design and synthesis of novel and selective phosphodiesterase 2 (PDE2a) inhibitors for thetreatment of memory disorders. J. Med. Chem. 2017, 60, 2037–2051. [CrossRef] [PubMed]
145

Molecules 2019, 24, 4149
14. Sierksma, A.S.R.; Rutten, K.; Sydlik, S.; Rostamian, S.; Steinbusch, H.W.M.; van den Hove, D.L.A.; Prickaerts, J.Chronic phosphodiesterase type 2 inhibition improves memory in the APPswe/PS1dE9 mouse model ofAlzheimer’s disease. Neuropharmacology 2013, 64, 124–136. [CrossRef] [PubMed]
15. Umar, T.; Hoda, N. Selective inhibitors of phosphodiesterases: Therapeutic promise for neurodegenerativedisorders. Med. Chem. Commun. 2015, 6, 2063–2080. [CrossRef]
16. Mikami, S.; Sasaki, S.; Asano, Y.; Ujikawa, O.; Fukumoto, S.; Nakashima, K.; Oki, H.; Kamiguchi, N.; Imada, H.;Iwashita, H.; et al. Discovery of an orally bioavailable, brain-penetrating, in vivo active phosphodiesterase2A inhibitor lead series for the treatment of cognitive disorders. J. Med. Chem. 2017, 60, 7658–7676. [CrossRef]
17. Reneerkens, O.A.H.; Rutten, K.; Steinbusch, H.W.M.; Blokland, A.; Prickaerts, J. Selective phosphodiesteraseinhibitors: A promising target for cognition enhancement. Psychopharmacology 2009, 202, 419–443. [CrossRef]
18. Brust, P.; van den Hoff, J.; Steinbach, J. Development of 18F-labeled radiotracers for neuroreceptor imagingwith positron emission tomography. Neurosci. Bull. 2014, 30, 777–811. [CrossRef]
19. Andrés-Gil, J.I.; Rombouts, F.J.R.; Trabanco, A.A.; Vanhoof, G.C.P.; De Angelis, M.; Buijnsters, P.J.J.A.;Guillemont, J.E.G.; Bormans, G.M.R.; Celen, S.J.L.; Vliegen, M. 1-aryl-4-methyl-[1,2,4]triazolo[4,3-a]quinoxalineDerivatives. Patent No. WO 2013/000924 A1, 3 January 2013.
20. Zhang, L.; Villalobos, A.; Beck, E.M.; Bocan, T.; Chappie, T.A.; Chen, L.; Grimwood, S.; Heck, S.D.; Helal, C.J.;Hou, X.; et al. Design and selection parameters to accelerate the discovery of novel central nervoussystem positron emission tomography (PET) ligands and their application in the development of a novelphosphodiesterase 2A PET ligand. J. Med. Chem. 2013, 56, 4568–4579. [CrossRef]
21. Naganawa, M.; Waterhouse, R.N.; Nabulsi, N.; Lin, S.-F.; Labaree, D.; Ropchan, J.; Tarabar, S.; DeMartinis, N.;Ogden, A.; Banerjee, A.; et al. First-in-human assessment of the novel PDE2A PET radiotracer 18F-PF-05270430.J. Nucl. Med. 2016, 57, 1388–1395. [CrossRef]
22. Naganawa, M.; Nabulsi, N.; Waterhouse, R.; Lin, S.-F.; Zhang, L.; Cass, T.; Ropchan, J.; McCarthy, T.; Huang, Y.;Carson, R. Human PET studies [18F]PF-05270430, a PET radiotracer for imaging phosphodiesterase-2A.J. Nucl. Med. 2013, 54, 201.
23. Schröder, S.; Wenzel, B.; Deuther-Conrad, W.; Scheunemann, M.; Brust, P. Novel radioligands for cyclicnucleotide phosphodiesterase imaging with positron emission tomography: An update on developmentssince 2012. Molecules 2016, 21, 650. [CrossRef] [PubMed]
24. Schröder, S.; Wenzel, B.; Deuther-Conrad, W.; Teodoro, R.; Egerland, U.; Kranz, M.; Scheunemann, M.;Höfgen, N.; Steinbach, J.; Brust, P. Synthesis, 18F-radiolabelling and biological characterization of novelfluoroalkylated triazine derivatives for in vivo imaging of phosphodiesterase 2A in brain via positronemission tomography. Molecules 2015, 20, 9591–9615. [CrossRef] [PubMed]
25. Schröder, S.; Wenzel, B.; Deuther-Conrad, W.; Teodoro, R.; Kranz, M.; Scheunemann, M.; Egerland, U.;Höfgen, N.; Briel, D.; Steinbach, J.; et al. Investigation of an 18F-labelled imidazopyridotriazine for molecularimaging of cyclic nucleotide phosphodiesterase 2A. Molecules 2018, 23, 556. [CrossRef]
26. Stange, H.; Langen, B.; Egerland, U.; Hoefgen, N.; Priebs, M.; Malamas, M.S.; Erdei, J.J.; Ni, Y.Imidazo[5,1-c][1,2,4]benzotriazine Derivatives as Inhibitors of Phosphodiesterases. Patent US 2010/0120763 A1,13 May 2010.
27. Malamas, M.S.; Stange, H.; Schindler, R.; Lankau, H.-J.; Grunwald, C.; Langen, B.; Egerland, U.; Hage, T.;Ni, Y.; Erdei, J.; et al. Novel triazines as potent and selective phosphodiesterase 10A inhibitors. BioorganicMed. Chem. Lett. 2012, 22, 5876–5884. [CrossRef]
28. Ritawidya, R.; Ludwig, F.-A.; Briel, D.; Brust, P.; Scheunemann, M. Synthesis and in vitro evaluation of8-pyridinyl-substituted benzo[e]imidazo[2,1-c][1,2,4]triazines as phosphodiesterase 2A inhibitors. Molecules2019, 24, 2791. [CrossRef]
29. Dolci, L.; Dolle, F.; Valette, H.; Vaufrey, F.; Fuseau, C.; Bottlaender, M.; Crouzel, C. Synthesis of afluorine-18 labeled derivative of epibatidine for in vivo nicotinic acetylcholine receptor PET imaging.Bioorganic Med. Chem. 1999, 7, 467–479. [CrossRef]
30. Wagner, S.; Teodoro, R.; Deuther-Conrad, W.; Kranz, M.; Scheunemann, M.; Fischer, S.; Wenzel, B.;Egerland, U.; Hoefgen, N.; Steinbach, J.; et al. Radiosynthesis and biological evaluation of the new PDE10Aradioligand [18F]AQ28A. J. Label. Compd. Radiopharm. 2017, 60, 36–48. [CrossRef]
31. Ishiyama, T.; Murata, M.; Miyaura, N. Palladium(0)-catalyzed cross-coupling reaction of alkoxydiboron withhaloarenes: A direct procedure for arylboronic esters. J. Org. Chem. 1995, 60, 7508–7510. [CrossRef]
32. Wiley, R.H.; Hartman, J.L. Oxidation of aminopyridines to nitropyridines. J. Am. Chem. Soc. 1951, 73, 494.
146

Molecules 2019, 24, 4149
33. Wenzel, B.; Günther, R.; Brust, P.; Steinbach, J. A fluoro versus a nitro derivative-a high-performance liquidchromatography study of two basic analytes with different reversed phases and silica phases as basis for theseparation of a positron emission tomography radiotracer. J. Chromatogr. A 2013, 1311, 98–105. [CrossRef][PubMed]
34. Lindemann, M.; Hinz, S.; Deuther-Conrad, W.; Namasivayam, V.; Dukic-Stefanovic, S.; Teodoro, R.;Toussaint, M.; Kranz, M.; Juhl, C.; Steinbach, J.; et al. Radiosynthesis and in vivo evaluation of a fluorine-18labeled pyrazine based radioligand for PET imaging of the adenosine A2B receptor. Bioorganic Med. Chem.2018, 26, 4650–4663. [CrossRef] [PubMed]
35. Waterhouse, R.N. Determination of lipophilicity and its use as a predictor of blood–brain barrier penetrationof molecular imaging agents. Mol. Imaging Biol. 2003, 5, 376–389. [CrossRef] [PubMed]
36. Pike, V.W. PET radiotracers: Crossing the blood-brain barrier and surviving metabolism. Trends Pharmacol. Sci.2009, 30, 431–440. [CrossRef] [PubMed]
37. van de Waterbeemd, H.; Camenisch, G.; Folkers, G.; Chretien, J.R.; Raevsky, O.A. Estimation of blood-brainbarrier crossing of drugs using molecular size and shape, and H-bonding descriptors. J. Drug Target. 1998, 6,151–165. [CrossRef] [PubMed]
38. Testa, B.; Crivori, P.; Reist, M.; Carrupt, P.-A. The influence of lipophilicity on the pharmacokinetic behaviorof drugs: Concepts and examples. Perspect. Drug Discov. Des. 2000, 19, 179–211. [CrossRef]
39. Bodor, N.; Gabanyi, Z.; Wong, C.-K. A new method for the estimation of partition coefficient. J. Am. Chem.Soc. 1989, 111, 3783–3786. [CrossRef]
40. Donovan, S.F.; Pescatore, M.C. Method for measuring the logarithm of the octanol–water partitioncoefficient by using short octadecyl–poly(vinyl alcohol) high-performance liquid chromatography columns.J. Chromatogr. A 2002, 952, 47–61. [CrossRef]
41. Vraka, C.; Nics, L.; Wagner, K.-H.; Hacker, M.; Wadsak, W.; Mitterhauser, M. LogP, a yesterday’s value?Nucl. Med. Biol. 2017, 50, 1–10. [CrossRef]
42. Stange, H.; Langen, B.; Egerland, U.; Hoefgen, N.; Priebs, M.; Malamas, M.S.; Erdei, J.; Ni, Y. TriazineDerivatives as Inhibitors of Phosphodiesterases. Patent No. WO 2010/054253 A1, 14 May 2010.
43. Gomez, L.; Xu, R.; Sinko, W.; Selfridge, B.; Vernier, W.; Ly, K.; Truong, R.; Metz, M.; Marrone, T.; Sebring, K.;et al. Mathematical and Structural characterization of strong nonadditive structure-activity relationshipcaused by protein conformational changes. J. Med. Chem. 2018, 61, 7754–7766. [CrossRef]
Sample Availability: Samples of the compounds are not available from the authors..
© 2019 by the authors. Licensee MDPI, Basel, Switzerland. This article is an open accessarticle distributed under the terms and conditions of the Creative Commons Attribution(CC BY) license (http://creativecommons.org/licenses/by/4.0/).
147


molecules
Review
A Survey of Molecular Imaging of Opioid Receptors
Paul Cumming 1,2,*, János Marton 3, Tuomas O. Lilius 4, Dag Erlend Olberg 5 and
Axel Rominger 1,*
1 Department of Nuclear Medicine, University of Bern, Inselspital, Freiburgstraße 18, 3010 Bern, Switzerland2 School of Psychology and Counselling and IHBI, Queensland University of Technology,
QLD 4059, Brisbane, Australia3 ABX Advanced Biochemical Compounds, Biomedizinische Forschungsreagenzien GmbH,
Heinrich-Glaeser-Strasse 10-14, D-1454 Radeberg, Germany; [email protected] Center for Translational Neuromedicine, Faculty of Health and Medical Sciences, University of Copenhagen,
2200 Copenhagen N, Denmark; [email protected] School of Pharmacy, University of Oslo, Norwegian Medical Cyclotron Centre, N-0372 Oslo, Norway and
Norwegian Medical Cyclotron Centre Ltd., Sognsvannsveien 20, N-0372 Oslo, Norway;[email protected]
* Correspondence: [email protected] (P.C.); [email protected] (A.R.);Tel.: +41-31-664-04-98 (P.C.); +41-31-632-26-10 (A.R.)
Academic Editor: Peter BrustReceived: 21 October 2019; Accepted: 13 November 2019; Published: 19 November 2019
Abstract: The discovery of endogenous peptide ligands for morphine binding sites occurred inparallel with the identification of three subclasses of opioid receptor (OR), traditionally designated asμ, δ, and κ, along with the more recently defined opioid-receptor-like (ORL1) receptor. Early effortsin opioid receptor radiochemistry focused on the structure of the prototype agonist ligand, morphine,although N-[methyl-11C]morphine, -codeine and -heroin did not show significant binding in vivo.[11C]Diprenorphine ([11C]DPN), an orvinol type, non-selective OR antagonist ligand, was among thefirst successful PET tracers for molecular brain imaging, but has been largely supplanted in researchstudies by the μ-preferring agonist [11C]carfentanil ([11C]Caf). These two tracers have the propertyof being displaceable by endogenous opioid peptides in living brain, thus potentially serving in acompetition-binding model. Indeed, many clinical PET studies with [11C]DPN or [11C]Caf affirm therelease of endogenous opioids in response to painful stimuli. Numerous other PET studies implicateμ-OR signaling in aspects of human personality and vulnerability to drug dependence, but there havebeen very few clinical PET studies of μORs in neurological disorders. Tracers based on naltrindole, anon-peptide antagonist of the δ-preferring endogenous opioid enkephalin, have been used in PETstudies of δORs, and [11C]GR103545 is validated for studies of κORs. Structures such as [11C]NOP-1Ashow selective binding at ORL-1 receptors in living brain. However, there is scant documentation ofδ-, κ-, or ORL1 receptors in healthy human brain or in neurological and psychiatric disorders; here,clinical PET research must catch up with recent progress in radiopharmaceutical chemistry.
Keywords: opioid receptors; positron emission tomography; radiotracers; μOR-, δOR-, κOR- andORL1-ligands; epilepsy; movement disorders; pain; drug dependence
1. Introduction
The analgesic and soporific properties of opium have been known since antiquity, perhaps firstattested in the detached reveries of Homer’s Lotophagi. The sinister side of opium dreams is depictedin Tennyson’s version of that story, and more distinctly in the memoires of Thomas de Quincy, whomay have had the distinction of establishing a genre of literature, the addiction diary. A key activeconstituent of the sap of Papaver somniferum was first isolated in 1804 by the apothecary Friedrich
Molecules 2019, 24, 4190; doi:10.3390/molecules24224190 www.mdpi.com/journal/molecules149

Molecules 2019, 24, 4190
Wilhelm Sertürner, who named it morphium, later morphine (1). Chemists identified its elementalcomposition in the 19th century, and efforts to determine its structure were rewarded in 1925, whenGulland and Robinson [1] recommended a structure consistent with the characteristics of morphineand codeine and their degradation products. Subsequent investigations confirmed the correctnessof the analytically deduced structure of morphine, culminating in its total synthesis, achieved in the1950s by Gates and Tschudi [2,3]. The absolute stereochemistry of morphine’s five chiral carbons (5, 6,9, 13 and 14) was reported by Bentley and Cardwell [4] in 1955, and the first practically realizablemorphine total synthesis with reasonable yields was reported by Rice in 1980 [5]. To this day, it is moreeconomical to allow the poppy plant to do the main work of morphine (1) synthesis, although chemistshave since produced so many structural variants that one might consider opioid pharmacology to be adiscipline in its own right. There have been several reviews of opioid receptor imaging in the pastdecade [6–8], but we now present a comprehensive update on the the main classes of opioid receptor(OR) ligands used for positron emission tomography (PET), and review clinical findings with thistechnology. Relevant chemical structures of endogenous opioid peptides and representative smallmolecule opioid receptor ligands are depicted in Figure 1.
HONH2
NH
O HN
ONH
O HN
O
S
OH
O
HONH2
NH
O HN
ONH
O HN
OOH
O
HO
ONCH3
HOH
O
ONCH3
OOH
HO
ON
OOH
Met5-enkephalin Leu5-enkephalinMorphine
Oxycodone Naltrexone
N
OOCH3
Cyprodime
H3CO
HO
ON
NOH
Naloxonazine
1 2 3
4 5 6 7
A
B
C
DE
1
23
4
5
67
8
9
1011
1213
14
15 1617
5R, 6S, 9R, 13S, 14R
OH
N
ON
HO
Figure 1. Chemical structures of endogenous opioid peptides and selected opioid receptor ligands.
The modern era of opioid pharmacology began with the identification of an opioid bindingsite in brain tissue in studies with tritiated naloxone [9]. Soon thereafter, opioid peptides wereisolated from pig brain [10], which famously involved whisky as an emolument for the slaughterhouseworkers. The pentapeptides Met5-enkephalin (2) and Leu5-enkephalin (3) both had morphine-likeeffects in inhibiting the electrically stimulated contraction of the vas deferens, with the latter compoundbeing somewhat less potent. The enkephalins were most abundant in striatum and hypothalamusof rat, guinea pig and calf, and Met5-enkephalin (2) was generally 3–6 times more abundant thanLeu5-enkephalin (3) [11,12]. An additional higher molecular weight opioid (β-endorphin) isolated andsequenced from camel pituitary extracts proved to be a 31 amino acid polypeptide possessing homologywith Met5-enkephalin (2) [13]. A trypsin-sensitive opioid activity (dynorphin-A) isolated from pituitaryis a 17 amino acid polypeptide possessing N-terminal homology with Leu5-enkephalin (3), with theshorter peptide dynorphin-B [1-13] having almost 1000-fold higher potency than Leu5-enkephalin (3) inthe guinea pig ileum muscle preparation [14]. Soon after these discoveries, bovine DNA sequences werecloned for the β-endorphin precursor corticotropin-β-lipotropin [15], the Met5/Leu5-enkephalin (2, 3)precursor preproenkephalin-A [16] (which proved to contain four copies of Met5-enkephalin (2) andone copy of Leu5-enkephalin (3), consistent with the ratio of their tissue concentrations), and the closelyrelated preproenkephalin-B [17]. Other researchers cloned porcine preprodynorphin, the precursor fordynorphin A [1-17], dynorphin-A [1-8], dynorphin B [1-13], and other opioid peptides [18].
150

Molecules 2019, 24, 4190
It was soon apparent that the endogenous opioid peptides bound to at least three distinct sitesin the brain and peripheral tissues, known as μ-, δ-, and κORs. For a time, the orphaned σ receptorswere thought to comprise another type of OR [20], due to the analgesic (and hallucinogenic) actionof pentazocine at κORs in brain. However, binding of σOR ligands is not displacable by the opioidantagonist naloxone, nor do σORs bind opioid peptides with high affinity, such that the σ- receptoris now recognized as a pharmacological class in its own right. The μOR gene has at least 14 exonsthat can give rise to diverse splice variants, and at least three pharmacologically distinct subtypes arerecognized: μ1, μ2 and μ3. Displacement studies in vitro and in vivo with the μ-selective competitiveantagonist cyprodime (6) and the μ1-specific competitor naloxonazine (7) showed that [11C]carfentanil([11C]Caf, 8) binds predominantly to the μ1 subtype [21]. The μ3 subtype is alkaloid sensitive andopioid peptide insensitive; it couples to nitric oxide generation, and, extraordinarily, its endogenousagonist in amygdala seems to be morphine (1) [22]. There is also an opioid receptor-like receptor1 (ORL1), which is activated by the 17 amino acid polypeptide known as nociceptin/ orphanin FQ(N/OFQ) [23].
Opioid signaling has an important function in the modulation of pain processing at the spinallevel. ORs synthetized in the dorsal root ganglion are transported to peripheral nerve endings and tothe superficial layers of the spinal cord dorsal horn. In the dorsal horn, μORs are the most denselyexpressed subtype, followed by δ-, and κORs. Over 70% of the ORs there are located on the centralterminals of small-diameter (mostly C and A-delta fibres) primary afferent neurons. A main mechanismof opioid analgesia lies in the activation of presynaptic μORs in the spinal cord, leading to decreasedrelease of excitatory transmitters and nociceptive transmission. Unforunately, PET methods do notsuffice for detecting ORs in the human spinal cord.
Figure 2 shows PET images of the distributions in human telencephalon of binding sites for the fourmain classes of ORs, μ, δ, κ, and ORL1. The pattern of μORs in Figure 2A encompasses the telencephalicpain pathway of limbic brain regions. Supraspinal μORs in the nucleus accumbens and amygdalahave a role in the analgesic and reinforcing properties of opioids. The thalamus, especially the medialstructures, relay nociceptive spinothalamic input from the spinal cord to higher structures. μORs alsohave a prominent distribution in the brainstem, with high density in several structures associated withanalgesia, such as the periaqueductal gray, rostroventral medulla, the reticular formation, and locuscoeruleus [24–26]. From these structures, efferent outflow descends to the spinal cord where it acts toinhibit nociceptive transmission in afferent fibres. μORs are also abundant in the hypothalamus, wherethey might affect hormonal regulation. Receptors in the medullary vagal complex, area postrema, andnucleus tractus solitarius, can mediate endocrine actions and nausea.
As seen in Figure 2B, the δOR has high expression in the cerebral cortex, nucleus accumbens, andthe caudate putamen. This receptor is involved in analgesic activity at both spinal and supraspinal sites.Similarly as μORs, agonists of central δORs contribute to respiratory depression, whereas receptorsin the gut mediate constipation, an important side effect of morphine. The δORs receptors localizepresynaptically where they inhibit the release of excitatory neurotransmitters [27]. Despite theseproperties, δ-selective drugs have not yet found clinical application.
The κORs have wide expression in rat brain, with highest levels in the ventral tegmental area,substantia nigra, nucleus accumbens, caudate putamen, claustrum, endoperiform nucleus, varioushypothalamic nuclei, and the amygdala [28]. A similar expression profile occurs in the humanbrain [29,30], as seen in Figure 2C. Activation of κORs does not produce respiratory depression, buttypical adverse effects include sedation and dysphoria, limiting the clinical use of κOR targetingdrugs [27]. Despite generally dysphoric effects in humans, the κOR agonist Salvinorin-A, which isobtained from the leaves of Salvia divinorum, finds a niche market in the drug subculture for thoseseeking to briefly experience a dissociative state.
151
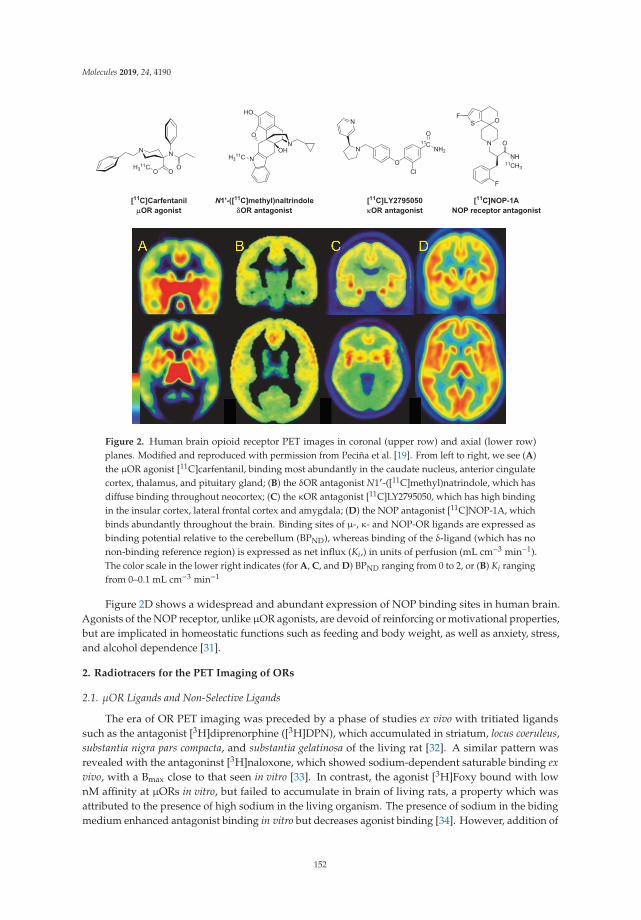
Molecules 2019, 24, 4190
N N
OO O
[11C]CarfentanilOR agonist
H311C
N
O
HO
H311C
NOH
N1'-([11C]methyl)naltrindoleOR antagonist
O
N
N
11CNH2
O
Cl
[11C]LY2795050OR antagonist
O
N
SF
NH
O
11CH3
F
[11C]NOP-1ANOP receptor antagonist
Figure 2. Human brain opioid receptor PET images in coronal (upper row) and axial (lower row)planes. Modified and reproduced with permission from Peciña et al. [19]. From left to right, we see (A)the μOR agonist [11C]carfentanil, binding most abundantly in the caudate nucleus, anterior cingulatecortex, thalamus, and pituitary gland; (B) the δOR antagonist N1′-([11C]methyl)natrindole, which hasdiffuse binding throughout neocortex; (C) the κOR antagonist [11C]LY2795050, which has high bindingin the insular cortex, lateral frontal cortex and amygdala; (D) the NOP antagonist [11C]NOP-1A, whichbinds abundantly throughout the brain. Binding sites of μ-, κ- and NOP-OR ligands are expressed asbinding potential relative to the cerebellum (BPND), whereas binding of the δ-ligand (which has nonon-binding reference region) is expressed as net influx (Ki,) in units of perfusion (mL cm−3 min−1).The color scale in the lower right indicates (for A, C, and D) BPND ranging from 0 to 2, or (B) Ki rangingfrom 0–0.1 mL cm−3 min−1
Figure 2D shows a widespread and abundant expression of NOP binding sites in human brain.Agonists of the NOP receptor, unlike μOR agonists, are devoid of reinforcing or motivational properties,but are implicated in homeostatic functions such as feeding and body weight, as well as anxiety, stress,and alcohol dependence [31].
2. Radiotracers for the PET Imaging of ORs
2.1. μOR Ligands and Non-Selective Ligands
The era of OR PET imaging was preceded by a phase of studies ex vivo with tritiated ligandssuch as the antagonist [3H]diprenorphine ([3H]DPN), which accumulated in striatum, locus coeruleus,substantia nigra pars compacta, and substantia gelatinosa of the living rat [32]. A similar pattern wasrevealed with the antagoninst [3H]naloxone, which showed sodium-dependent saturable binding exvivo, with a Bmax close to that seen in vitro [33]. In contrast, the agonist [3H]Foxy bound with lownM affinity at μORs in vitro, but failed to accumulate in brain of living rats, a property which wasattributed to the presence of high sodium in the living organism. The presence of sodium in the bidingmedium enhanced antagonist binding in vitro but decreases agonist binding [34]. However, addition of
152

Molecules 2019, 24, 4190
Na+ to the incubation medium had little effect on the affinity of the morphiceptin analog μOR agonistTyr-Pro-(NMe)Phe-D-Pro-NH2 in vitro ([3H]PL017) [35]. Unpredictable sensitivity of binding to thepresence of sodium in the medium seems mainly to be a property of agonist ligands.
OR PET imaging began with the introduction of 3-O-acetyl-[18F]cyclofoxy (3-O-Ac-[18F]FcyF),(10). 3-O-Ac-[18F]FcyF (10, Figure 3) is an opioid antagonist radiotracer, which was preparedfrom 3-O-acetyl-6α-naltrexol triflate via direct nucleophilic substitution with tetraethylammonium[18F]fluoride in anhydrous acetonitrile at 80 ◦C for 15 min [36,37]. Based on displacement studies withCyF, binding of 3-O-Ac-[18F]FcyF (10) is likely to reveal the composite of μ- and κOR binding [38],despite the qualitatively μOR-like binding pattern reported in living baboon brain examined with3-O-Ac-[18F]FcyF (10) [36], and the pattern of [3H]cyclofoxy retention in rat brain analysed ex vivo [39].However, in a rat study, the increased [3H]cyclofoxy binding provoked by chronic treatment withmorphine (1) could be attributed to upregulation of μOR sites [40]. Saturation binding PET studieswith [18F]FcyF (11) in awake rat indicated a single binding site with apparent affinity of 2 nM and Bmax
ranging from 15 pmol/g in white matter to 74 pmol/g in striatum; these results matched closely thecorresponding results obtained in vitro [41].
N N
OO O
[11C]Caf
H311C
8
O
ON
18FOH
3-O-Ac-[18F]FcyF
10
H3C
O
HO
ON
18FOH
CH3
[18F]Foxy
9
HO
ON
18FOH
[18F]FcyF
11
NH3
11C O
[11C]pethidine
O
12
NO
O
Ph Ph
11CH3
[11C]LAAM
13
HO
O
ON
HO CH3
CH3H
HO
O
ON
HO
CH3H
[11C]DPN[11C]BPN
H311CH3
11C
14 15
HO
O
ONCH3
HO
CH3H
18F
[18F]FE-PEO
HO
O
ON
HO CH3
CH3H
[18F]FE-DPN
18F
16 17
HO
O
ONCH3
HO
CH3H
HO
O
ON
HO
CH3H
18F
HO
O
ON
HO CH3
CH3H
18F
[11C]PEO [18F]FP-norBPN[18F]FP-norDPN
H311C H3CH3C
18 2120
[18F]FE-BPN
19
HO
O
ON
HO
CH3H
18F
1
23
4
56
7
8
9
1011
1213
14
15 1617
18
19
20
Figure 3. Structures of μ-selective and non-selective opioid receptor radioligands.
PET studies with N-[methyl-11C]-labelled morphine, codeine, heroin and pethidine indicateddistinct differences in uptake and kinetics in rhesus brain [42], all seemingly in relation to lipophilicity ofthe various drugs. A more detailed kinetics analysis of N-[methyl-11C]pethidine (12) in brain of rhesusmonkey indicated a very low binding potential [43]. The methadone analogue [11C]L-α-acetylmethadol([11C]LAAM, 13) had moderate uptake in brain of mice, but its specific binding was not reported [44].These observations are a case in point supporting the generalization that effective pharmaceuticals donot necessary make good ligands for molecular imaging of their targets.
The displaceability of OR ligands by competitors in vivo is a complex matter, and one increasinglyrelevant given the current opioid abuse crisis in some countries. Whereas antagonists such as naloxoneare effective in rescuing addicts from death by overdose, naloxone also finds experimental use in
153

Molecules 2019, 24, 4190
molecular imaging studies to confirm binding of PET tracers to ORs. Thus, the BPND of [11C]Caf (8)to μORs in human brain, which ranged from 1.0 in cerebellum to 2.7 in caudate nucleus, was nearlycompletely displaced throughout in brain by a 50-mg dose of naltrexone (NTX, 5) [45], closely matchingthe dose used for resuce from opioid agonist overdose. In humans, intranasal naloxone administrationcaused a rapid displacement of [11C]Caf (8), in accordance with the rapid response seen in treatmentfor overdose [46].
Buprenorphine (BPN) [47–49] is a narcotic analgesic used since the 1970s in the low dosemanagement of post-operative pain. Since 2002, BPN has approval in the United States at higher doseor in combination with naloxone (Suboxone®) for substitution therapy in the management of opiateaddiction. BPN contains the same 6,14-ethenomorphinan skeleton as diprenorphine (DPN), and bothcompounds have an N17-cyclopropylmethyl substituent, although BPN contains a tert-butyl group inposition-20 instead of methyl. Interestingly, BPN has a completely different pharmacological profilethan DPN. Whereas DPN is a mixed antagonist, BPN is a partial μOR agonist and κOR antagonist, anddisplays some affinity for the NOP receptor [50] (Table 1).
Table 1. Binding profile of selected ligands at the human opioid receptors [51] .
Ki [nM] CompoundLigand
μ-OR δ-OR κ-OR NOPAction
ClassRef.
Met5-enkephalin 261 9.9 - - agonist δOR EOP Stefanucci [52]Leu5-enkephalin 513 10.7 - - agonist δOR EOP Stefanucci [52]β-Endorphin 2.1 2.4 96 - agonist μOR, κOR EOP Corbett [53]Dinorphin A 1.6 1.25 0.05 386 agonist κOR EOP Zhang [54]Nociceptin 437 2846 147 0.08 agonist EOP Cami-Cobeci [50]Morphine 2.06 >10,000 134 >10,000 agonist μOR EM Valenzano [55]Oxycodone 16 7680 43,000 - agonist μOR EM Miyazaki [56]Naltrexone 0.62 12.3 1.88 - antagonist EM Zheng [57]Carfentanil 0.07 - - - agonist μOR 4-AP Henriksen [58]Carfentanila 0.051 4.7 13 - agonist μOR 4-AP Frost [59]Carfentanilb 0.024 3.28 43.1 - agonist μOR 4-AP Cometta [60]Cyclofoxya 2.62 89 9.3 - antagonist μOR, κOR EM Rothman [38]DPN 0.07 0.23 0.02 - antagonist orvinol Raynor [61]BPN 1.5 6.1 2.5 77.4 partial μOR agonist, κOR antagonist orvinol Cami-Cobeci [50]PEO 0.18 5.1 0.12 - full agonist orvinol Marton [62]FE-DPN 0.24 8.00 0.20 - antagonist orvinol Schoultz [63]FE-BPN 0.24 2.10 0.12 - mixed agonist/antagonist orvinol Schoultz [63]FE-PEO 0.10 0.49 0.08 - full agonist orvinol Schoultz [63]NTIb 3.8 0.03 332 - antagonist δOR EM Portoghese [64]MeNTIb 14 0.02 65 - antagonist δOR EM Portoghese [64]GR103545 16.2 536 0.02 - agonist κOR ArAP Schoultz [65]LY2459989a 7.68 91.3 0.18 - antagonist κOR APPB Zheng [66]LY2795050 25.8 153 0.72 - antagonist κOR APPB Zheng [57]FEKAP 7.4 139 0.43 - agonist κOR ArAP Li [67]EKAP 8.6 386 0.28 - agonist ArAP Li [68]MeJDTic 8.88 118 1.01 - antagonist κOR JDTic Poisnel [69]Salvinorin A >1000 5790 1.9 - agonist κOR NND Harding [70]NOP-1A - - - 0.15 antagonist NOP FDPTP Pike [71]MK-0911 94 - - 0.6 antagonist NOP SPB Hostetler [72]
EOP: Endogenous opioid peptide, EM: 4,5-Eopxy-morphinan, 4-AP: 4-Anilidopiperidine, orvinol: 6,14-ethenomorphinan, Bentley-compound, ArAP: Arylacetamidopiperazine, APPB: Aryl-phenylpyrrolidinylmethyl-phenoxy-benzamide, JDTic: trans-3,4-dimethyl-4-(3-hydroxyphenyl)- piperidine, NND: “non nitrogenous” diterpene,FDPTP: 2′-fluoro-4′,5′-dihydrospiro[piperidine- 4,7′-thieno [2,3-c]pyran]- derivative, SPB: [[spiro[2.5]octan-8-yl]-methyl]piperidin-4-yl] benzimidazol-2-one, a: in the rat brain b: in guinea pig brain membranes.
Luthra et al. [73] synthesized N17-cyclopropyl[11C]methyl-buprenorphine starting fromN17-nor-buprenorphine. Analogously to the N17-cyclopropyl[11C]methyl-diprenorphine synthesis [74]the corresponding precursor, nor-BPN, was reacted with cyclopropyl[11C]carbonyl chloride andthe carbonyl functional group of the resulting intermediate was reduced with LiAlH4. Leveret al. [75] developed a metabolically stable radiotracer, 6-O-(methyl-11C)-BPN, at Johns HopkinsUniversity in 1990 in a two-step synthesis from 3-O-TBDMS-6-O-desmethyl-BPN. The precursorwas selectively alkylated in position-6 with [11C]iodomethane/NaH in DMF at 80 ◦C for two min.Following desilylation, [11C]BPN (14) was produced in 10% radiochemical yield with molar activityof 41 GBq/μmol. Subsequently, Luthra et al. [76], aiming to avoid the formation of 3-O-alkylatedby-products, introduced the base-stable, acid labile trityl protecting group to protect the phenolichydroxyl in position-3. Applying 3-O-trityl-6-O-desmethyl-BPN in a two-step, fully-automated
154
Molecules 2019, 24, 4190
radiosynthesis (11C-methylation/deprotection), yielded [11C]BPN (14) in 15% radiochemical yieldand with a molar activity of 13-22 GBq/μmol. In 2014, Schoultz et al. [63] reported a procedure forthe radiosynthesis of 6-O-(2-[18F]fluoroethyl)-6-O-desmethyl-BPN ([18F]FE-BPN (19)) via 18F-fluoro-alkylation of 3-O-trityl-6-O-desmethyl-BPN (TDBPN) precursor with [18F]fluoroethyl tosylate andsubsequent trityl deprotection. The decay corrected formulated product yield was 26 % and the molaractivity 50–300 GBq/μmol.
DPN, a semisynthetic thebaine/oripavine derivative with a methyl group amenable for labelling inposition-20, belongs structurally to the ring-C bridged morphinans (6,14-ethenomorphinans, orvinols,Bentley-compounds) [48]. DPN is a nonselective OR antagonist with affinity in the nanomolar range(Table 1), 100 times more potent than nalorphine. Indeed, DPN is used in the veterinary medicineas an antidote/reversing agent/antagonist for remobilizing large African animals (rhinos/elephants,Revivon®), which had been immobilized with the astonishingly potent agonists etorphine or carfentanil.
The first attempt at labelling of DPN with carbon-11 in postition-20 was reported by Burns et al. [77],who used N-cyclopropylmethyl-dihydronororvinone as precursor. The reaction of the precursor bearingan acetyl group in position-7-alpha with [11C]methyllithium yielded 20-[11C]methyl-DPN ([11C]DPN(15)). Luthra et al. [74] developed cyclopropyl[11C]methyl-DPN by alkylating N17-nor-DPN withcyclopropane[11C]carbonyl chloride and then reducing the N-cyclopropyl[11C]carbonyl intermediatewith LiAlH4 in THF. The radiochemical yield of the corresponding radioligands were low in bothcases [74,77].
In 1987, Lever et al. [78] developed a [11C]DPN (15) synthesis by alkylating the precursor3-O-TBDMS-6-O-desmethyl-DPN in position-6 with [11C]iodomethane in DMF containing sodiumhydride at 80 ◦C for two min. After cleavage of the TBDMS protecting group, [11C]DPN (15) wasobtained with 10 % radiochemical yield and 64 GBq/μmol molar activity. In 1994, Luthra and herassociates at the Hammersmith Hospital developed a new precursor for the radiosynthesis of [11C]DPN(15) [76]. Selective alkylation of 3-O-trityl-6-O-desmethyl-DPN (TDDPN) with [11C]iodomethanein the presence of NaH/DMF (95 ◦C, five min). Upon deprotection with 2 M hydrochloric acid (95◦C, two min) the radiotracer 15 was obtained with a radiochemical yield of 13–19% and a molaractivity of 16–24 GBq/μmol. Recently, Fairclough et al. [79] at the University of Manchester reported amodified synthetic method also starting from TDDPN, yielding [11]DPN (15) with ten times highermolar activity (240 GBq/μmol) [76] and a radiochemical yield of 32%. The non-selective OR partialmixed agonist/antagonist 6-O-(methyl-11C)-BPN ([11C]BPN, 14) accumulated in striatum, thalamusand cingulate cortex in living baboon brain. Analysis of the dynamic PET data with a model assumingirreversible trapping gave a net blood-brain clearance (Ki) of about 0.064 mL cm−3 min−1, which washalved by administration of naloxone, indicating substantial displaceability [80]. In a study in heroinaddicts, the BPN occupancy at [11C]Caf (8) binding sites was estimated relative to the drug-free baseline.An oral dose of 2 mg BPN had an occupancy of about 50% throughout brain, whereas 16 mg had 85%global occupancy [81]. On the other hand, therapeutic methadone (18–90 mg/day) did not provokeany discernible occupancy at 6-O-(methyl-11C)-diprenorphine ([11C]DPN, 15) binding sites, neither inhuman opioid addicts, nor in mice, a phenomenon attributed to high agonist potency of methadone,such that withdrawl effects are averted with a rather low occupancy [82]. In further preclinical studiesfrom the same research group, binding of [11C]DPN (15) in mouse brain was unaltered by treatmentwith oxycodone (4) or morphine (1) (full agonists at μORs), but was reduced by approximately 90% byBPN (partial agonist at μORs and antagonist at the δ- and κORs).
A comparative OR PET study in humans compared the distributions of the μOR-selective agonist[11C]Caf (8) and the mixed antagonist [11C]DPN (15) [83]. Qualitatively, [11C]DPN (15) binding inthe striatum, cingulate and frontal cortex exceeded that of [11C]Caf (8) (which had highest bindingin the μOR-rich thalamus), consistent with labeling of additional non-μOR sites by [11C]DPN (15).An investigation of ORs in human cerebellum showed abundant binding of a μOR-specific ligand inthe molecular layer, moderate binding of a κOR-selective ligand, but a near absence of δOR bindingsites, which was consistent with the observations of [11C]DPN (15) binding in vivo [84]. The presence
155

Molecules 2019, 24, 4190
of binding sites in cerebellum can be an obstacle to the valid use of reference tissue methods ofPET quantitation.
As a longer-lived alternative to [11C]DPN, (15), Wester et al. developed6-O-(2-[18F]fluoroethyl)-6-O-desmethyl-DPN ([18F]FE-DPN (16)) [85], which contains a 2-fluoroethoxygroup in position-6 instead of an OCH3. [18F]FE-DPN (16) was synthesized from TDDPN, the socalled “Luthra-precursor” [76], the same precursor as for [11C]DPN (15). For the synthesis of 16,TDDPN was reacted with [18F]fluoroethyl tosylate ([18F]FE-Tos) in DMF in the presence of sodiumhydride for five min at 100 ◦C. The trityl protecting group was removed with 2 N hydrochloricacid, yielding [18F]FE-DPN (16) with a radiochemical yield of 22 ± 7% and the molar activity was37 GBq/μmol [85]. In 2013, Schoultz et al. [86] reported an automated radiosynthesis of 16 fromTDDPN with a decay-corrected radiochemical yield of 25 ± 7%. [18F]FE-DPN (16) has similar uptake as[11C]DPN (15) in mouse brain, and obtained a BPND in human thalamus of about 2 relative to occipitalcortex, versus only 0.3 in somatosensory cortex [87]. Women showed faster plasma metabolism[18F]FE-DPN (16) than men, which might contribute to apparent gender differences in binding [88].
The first instance of full compartmental analysis of an opioid PET ligand in living brain was for thecase of [11C]Caf, as described below. This fentanyl analogue belongs to the 4-anilidopiperidine (4AP)class of OR ligands, which are potentμOR-selective agonists. Since 1960, numerous 4AP-type OR ligandswere synthesized and their structure-activity-relationship at ORs were recently summarized [89,90].Caf is structurally different from fentanyl in that it contains an additional carboxymethyl group inposition-4 of the piperidine ring. Caf is a μOR-selective full agonist of extreme potency, being almost10,000 times more potent than morphine (1) [58,91]. In 1985, [11C]Caf (8) radiotracer was applied in thefirst human PET study [59,92]. For the radiosynthesis of [11C]Caf, desmethyl-Caf sodium carboxylatewas alkylated with [11C]iodomethane in DMF at 35 ◦C for five min [92]. This procedure gave molaractivity at the end of synthesis of 122 GBq/μmol, which would correspond to mass dose of about 500pg in a human PET study, which is too low to have any effect on particpants. According to a novelversion of the radiosynthesis, desmethyl-Caf free acid serves as precursor in a reaction performed indimethylsulfoxide with [11C]methyl triflate in the presence of tetrabutylammonium hydroxide [93].This procedure gave a molar activity of 5 GBq/μmol, which would correspond to a mass dose of 100 μg,certainly intruding into the range causing some pharmacological effects. Risk of toxicity is a seriousmatter in PET imaging with potent agonists, and for society in general, given the weaponization [94](figurative and literal) that is possible with Caf.
For the compartmental analysis of [11C]Caf (8), two models were fitted to dynamic time activitycurves (TACs) measured by PET in human brain relative to a metabolite-corrected arterial inputfunction [95]; this approach is the gold standard for PET quantitation. The input function obtained byHPLC analysis of plasma extracts showed that untransformed parent fractions declined to 50% at 25min post injection. The authors estimated microparameters for the reversible transfer of the traceracross the blood-brain barrier (K1/k2), the reversible binding to a receptor compartment (k3/k4), andthe reversible association to a non-specific compartment in brain (k5/k6). The mean binding potential(BP; k3/k4) was 1.8 in frontal cortex and 3.4 in thalamus at baseline, versus only 0.16 and 0.26 aftertreatment with naloxone (0.1 mg/kg). This study set a very high standard for quantitative PET analysis,although the molar activity of the tracer may not have been completely adequate. The amount ofmass injected corresponded to about 5 μg Caf per scan, which could cause some analgesia in humans,although being less than 10% of the dose causing loss of consciousness. Nonetheless, this again raisesthe issue of safety in PET studies with the using of high-potency full agonist ligands, as noted above.Unless the the highest possible molar activity is obtained, pharmacologically significant occupancy canoccur, bringing a risk of toxicity. Test-retest studies with [11C]Caf (8) showed admirable low variability(< 6%) and high intraclass correlation coefficients (ICC > 0.90) of the total distribution volume (VT)relative to the metabolite-corrected arterial input, and likewise BPND relative to a reference tissue [96].
Phenethyl-orvinol (PEO) [97] shares the same in ring-C bridged morphinan scaffold asDPN and BPN. PEO contains a 6,14-etheno-bridge, an N17-methyl substituent and a 2-phenethyl
156

Molecules 2019, 24, 4190
group in position-20. It is a full agonist with higher affinity at μOR (0.18 nM) and κORs(0.12 nM) than to δORs (5.1 nM). The radiosynthesis of 6-O-(methyl-11C)-phenethyl-orvinol([11C]PEO, 18) was reported by Marton et al. [62] in 2009. The Luthra-type trityl-protectedprecursor (3-O-trityl-6-O-desmethyl-phenethyl-orvinol, TDPEO) was alkylated in position-6 with[11C]iodomethane in the presence of 8-10 equiv. sodium hydride. The protecting group was removedwith 1 M hydrochloric acid in ethanol, yielding [11C]PEO (18) with a radiochemical yield of 57 ± 16%and a molar activity of 60 GBq/μmol.
In 2012, Marton and Henriksen [98] reported the preliminary results of the synthesisof 6-O-(2-[18F]fluoroethyl)-6-O-desmethyl-phenethyl-orvinol ([18F]FE-PEO, 17) starting from6-O-(2-tosyloxyethyl)-6-O-desmethyl-phenylethyl-orvinol (TE-TDPEO) via direct nucleophilicfluorination and subsequent deprotection. This procedure gave [18F]FE-PEO (17) in an isolatedpreparative yield of 35 ± 8% with a molar activity of 55–130 GBq/μmol. In 2013, a research groupof the University of Cambridge [99] investigated [18F]FE-PEO (17) as a candidate OR PET-ligand,obtained by an automated cGMP-compliant method the [18F]FE-PEO at 28 ± 15% yield and 52–224GBq/μmol molar activity. In 2014, Schoultz et al. [63] reported the synthesis and biological evaluationof three structurally-related 6-O-(2-[18F]fluoroethyl)-6-O-desmethy-orvinols, i.e. [18F]FE-DPN (16),[18F]FE-BPN (19), and [18F]FE-PEO (17). The production of these 18F-fluoroethyl-orvinol radiotracers(16,17,19) was accomplished from 3-O-trityl-6-O-desmethyl-orvinol precursors (TDDPN, TDBPN,TDPEO) in a two-pot, three-step synthesis. [18F]FE-PEO (17) had a molar activity at end of synthesisof 50–250 GBq/μmol [99], corresponding to an injected mass <1 μg in human PET studies. The totaldistribution volume (VT) in rat brain ranged from 1 mL cm−3 in cerebellum to 8 mL cm−3 in thalamus;displacement studies in vitro with the μOR-selective agonist DAMGO indicated high specificity incertain brain regions. [18F]FE-DPN (16) had a molar activity of 37 GBq/μmol [85].
2.2. Delta Ligands
N1′-Methylnaltrindole (MeNTI, Figure 4) is a highly selective δOR antagonist (Table 1). MeNTIwas prepared from naltrexone (5) in a Fischer-indol synthesis with N-methyl-N-phenylhydrazine [64].The radiosynthesis of [11C]MeNTI was reported by Lever et al. in 1995 [100]. In the first step,3-O-benzyl-naltrindole was reacted with [11C]iodomethane in DMF in the presence of either sodiumhydride or tetrabutylammonium hydroxide at 80 ◦C for two min. The next step was hydrogenolysis ofthe formed 3-O-benzyl-N1′-(methyl-11C)-naltrindole under heterogenous catalytic conditions (H2, 10%Pd/C, DMF/ethanol, 80 ◦C, four min), or alternatively catalytic transfer hydrogenation (HCOONH4,10% Pd/C, MeOH). This gave [11C]MeNTI (22) with 6% radiochemical yield and a molar activity of 76GBq/μmol.
N
O
HO
H311C
NOH
N
O
HO
NOH
18F
NS
O O
F
N
N
OO
H311C
22 23 24
[11C]MeNTI [18F]FE-NTI N-substituted-[11C]quinolinimide
Figure 4. Labeled δ-opioid receptor ligands.
Human PET studies with [11C]MeNTI (22) confirmed earlier demonstrations in living mice ofδOR-selectivity in vivo [101]. The binding ratio relative to cerebellum ranged from 1.1 in hippocampusto 1.7 in striatum and insular cortex, regional values correlated rather precisely with known densityof δORs in vitro, and showed 50% displacement after administration of 50 mg NTX (5). The tracershowed pseudo-irreversible binding characteristics over the course of 90 min, with net blood-brain
157

Molecules 2019, 24, 4190
clearance (Ki) ranging from 0.04 in cerebellum to 0.11 mL cm−3 min−1 in putamen [102]. The Ki for[11C]MeNTI (22) in human brain declined by only about 20% after treatment with naloxone at a dosecompletely displacing μOR sites [45]. The authors of that study suggested that incomplete and variableδOR blockade might contribute to the success of NTX (5) as a treatment for alcoholism.
N1′-(2-[18F]fluoroethyl)naltrindole (23, [18F]FE-NTI, BU97001) was developed by Matthews etal. in 1999 [103]. The precursor, N1′-[2-(tosyloxyethyl)]-3-O-benzyl-naltrindole, was prepared infour consecutive transformations from naltrexone (5). In the first step, naltrexone (5) was reactedin a Fischer-indol synthesis with 2-(N1-phenylhydrazino)acetic acid ethyl ester. The resultingindolomorphinanyl-acetic ester was reacted with benzyl bromide to yield the 3-O-benzyl protectedNTI derivative, which was reduced with LiAlH4 in THF-toluene to afford the correspondingindolomorphinanyl ethanol intermediate. This compound was reacted with tosyl chloride toprovide the appropriate precursor with a tosyloxy leaving group. For the radiosynthesis of[18F]FE-NTI (23), the precursor was reacted in a direct nucleophilic reaction with potassium[18F]fluoride/K2CO3/Kryptofix[2.2.2] in DMF to yield N1′-(2-[18F]fluoroethyl)-3-O-benzyl-naltrindole.Final debenzylation by hydrogenolysis under heterogenous catalytical conditions (H2, Pd/C,N,N-dimethyl formamide) gave [18F]FE-NTI (23) with a radiochemical yield of 10% and molaractivity of 31 GBq/μmol. [18F]FE-NTI (23) was an antagonist in mouse vas deferens with high selectivityover μ- and κOR sites, and its tritiated version bound to rat whole brain as a single site with KD of 0.42nM and Bmax of 3 pmol g−1 [104].
In 2007, Bourdier et al., [105] reported the radiosynthesis of a 2-[11C]methyl-pyrrolo[3,4-b]pyridine-5,7-dione derivative (N-substituted-[11C]quinolinimide) (24). The radiotracercontaining a [11C]methyl-group on the pyridine ring was synthesized from a tributylstannyl precursor,with introduction of the [11C]methyl group by the Stille reaction using [11C]iodomethane in the presenceof tris(dibenzylideneacetone)dipalladium, tri-o-tolylphosphine, K2CO3, and CuCl in DMF, heated at 90◦C for five min. The labelled compound (24) was synthesized with a radiochemical yield of 60 ± 10%and a molar activity of 30–56 GBq/μmol. The unlabelled version of the N-substituted quinolinimidehad higher δOR-selectivity than MeNTI, but its 11C-derivative (24) failed to label ORs in mouse brain,due either to excessively rapid metabolism [105], or its only moderate affinity.
2.3. Kappa Ligands
GR89696 ((±)-methyl 4[(3,4-dichlorophenyl)acetyl]-3-(1-pyrrolidinylmethyl)- 1-piperazine-carboxylate [106–108] (Glaxo Group Research Ltd.) is a κOR-selective agonist with anarylacetamidopiperazine/diacylpiperazine structural core. GR103545, the biologically active(R)-(−)-enantiomer of GR89696, displays subnanomolar affinity and 1000-fold selectivity for humanκOR (Ki = 0.02 nM), [65]. Ravert et al. [109] reported synthesis of both enantiomers of [11C]GR89696 (26,Figure 5) from the corresponding chiral normethylcarbamoyl precursor [108,110]. The radiosynthesiswas accomplished by acylation of the secondary amine with [11C]methyl chloroformate indichloromethane in the presence of trimethylamine, giving product with molar radioactivity of69 GBq/μmol. Mouse brain distribution of the synthesized enantiomers, ((R)-(−)-[11C]GR103545 (25)and the (S)-(+)-enantiomer [11C]SGR) was determined in vivo, which showed the (S)-enantiomerto be inactive. The low radiochemical yield of the radiosynthesis (2–14%) [110,111] motivated thedevelopment of elaborate new radiochemical methods. In 2008, Schoultz et al. [112] developed a simple[11C]methyl triflate mediated methylation of carbamino adducts. Normethylcarbamoyl-GR103545 wasconverted to [11C]GR103545 (25) with [11C]CH3OTf under mild conditions in 64–91% radiochemicalyield. Wilson et al. [113] developed a method for preparing [11C-carbonyl]-methylcarbamatesdirectly from primary or secondary amines, applying either DBU or BEMP and cyclotron-produced[11C]CO2. [11C-carbonyl]-GR103545 (25) was synthesized with high radiochemical purity (>98%) andmolar activity of 108–162 GBq/μmol. In 2011, Nabulsi et al. [114] reported an automated two-step,one-pot procedure for the synthesis of [11C]GR103545 (25) from normethylcarbamoyl-GR103545 viatranscarboxylation using the zwitterionic carbamic complex DBU-CO2 and [11C]CH3OTf.
158

Molecules 2019, 24, 4190
NN
O
OH3
11C
NO
ClCl
NN
O
OH3
11C
NO
ClCl
NN
O
OH3
11C
NO
ClCl
NN
O
OH3
11C
NO
ClCl
F
25 26 27 28
[11C]GR103545 [11C]GR89696 [11C]EKAP [11C]FEKAP
N11CH3
NH
O
HON
OH
29
[11C]MeJDTic
O
N
N
11CNH2
O
ClO
N
N
11CNH2
O
FO
N
N
NH2
O
18F
30 31 32
[11C]LY2795050 [11C]LY2459989 [18F]LY2459989
O
N NH2
O
F
34
LY2456302
CH3H3C
O
O
OO
H H
O
OO
H311C
O
33
[11C]Salvinorin A
NNH
O
HON
OH
35
[18F]FP-JDTic
18F
Figure 5. Selected κOR ligands.
In PET studies, the κOR-agonist ligand [11C]GR103545 (25) had a VT in baboon brain rangingfrom 3 mL cm−3 in cerebellum to 10 mL cm−3 in striatum and cingulate cortex [111]. Naloxonehomogeneously displaced tracer throughout brain, but had no effect on VT in cerebellum, which wouldsupport use of that brain region as a reference tissue. The tracer had >100-fold selectivity for κ- over δ-and μORs in vitro [65]. Much as in baboons, PET studies in rhesus monkey showed VT ranging from8 mL cm−3 in cerebellum to 21 mL cm−3 in striatum. Other monkey studies showed BPND rangingfrom 0.3 in amygdala to 2.2 in putamen [115]. This bolus plus infusion study with increasing massdose in monkeys indicated an in vivo KD of 2 nM and Bmax of 1–6 pmol g−1. In 2014, Naganawa etal. [116] reported the first-in-human PET study with [11C]GR103545 (25). Test-retest variability of thequantitative endpoint VT was about 15%, and binding ranged from 8 mL cm−3 in cerebellum to 41 mLcm−3 in amygdala; Lassen plots with naltrexone blocking indicated a non-specific uptake (VND) ofonly 3.4 mL cm−3, thus emphasizing the absence of any non-binding reference region.
Based on the substituted-diacylpiperazine scaffold of GR103545, researchers at Yale Universitydeveloped the new κOR agonist radiotracers [11C]EKAP (27) [68] and [11C]FEKAP (28) [67] withimproved pharmacological and PET-imaging profile compared with the native compound. In theopen-ring analogs of GR103545, the pyrrolidinyl-methyl group of the original molecule in position-3was replaced by a diethylamino-methyl in EKAP and a ((ethyl)2-fluoroethyl)amino)methyl group inFEKAP. Imaging studies [11C]EKAP (27) in rhesus monkey showed rapid metabolism in vivo and fast,reversible binding kinetics in brain that was blockable with specific competitors. The BPND rangedfrom 0.8 in frontal cortex to 1.8 in globus pallidus.
Researchers at Eli Lilly, in cooperation with the Yale University, developed κOR antagonistradiotracers with the 3-pyridinyl-1-pyrrolidinylmethyl structural scaffold. Along these lines, in2013, Zheng et al. [57] synthesized the selective κOR antagonist radiotracer [11C]LY2795050 (30)from an iodophenyl precursor in a two-step procedure. The precursor was converted by transitionmetal-mediated cyanation using H11CN and Pd2(dba)3/dppf to a [11C]nitrile intermediate. This latterwas partially hydrolysed with NaOH/H2O2 in DMF at 80 ◦C for five min, giving a 12% radiochemical
159

Molecules 2019, 24, 4190
yield with molar activity of 23.6 GBq/μmol. [11C]LY2459989 (31) was prepared in a two-step one-potradiosynthesis. In the first step, an aryl-iodide-type precursor was transformed in a palladium catalyzedreaction (Pd2dba3/dppf) with H11CN to the corresponding [11C]nitrile, which was reacted with H2O2
under basic condition to afford 31 with 7.4% radiochemical yield and 23 GBq/μmol molar activity.LY2459989 is the fluorine-containing analogue of LY2795050. Li et al. [117] synthesised the
18F-fluorine-labelled version of LY2459989 using two different methods. Using the nitro precursor, theradiochemical yield was too low, but applying the iodonium ylide precursor, [18F]LY2459989 (30) wasprepared with 36% radiochemical yield and 1,175 GBq/μmol molar activity. While admirably high, thismolar activity falls far short of the theoretical maximium for 18F-, which is 63,000 GBq/μmol. Wheredoes all that non-radioactive fluoride come from?
As noted above, salvinorin A [118–120] is a naturally occurring non-alkaloid neo-clerodanediterpenoid, isolated from Salvia divinorum. Also as noted above, smokings Salvinorin-A can provoke adissociative hallucinogenic experience distinct from that of the classical hallucinogens. It has a uniquestructure with seven chiral carbons and is potent and highly selective κOR agonist; salvinorin A doesnot display any significant activity at other OR subtypes. In 2008, Hooker et al. [121] synthesized thecarbon-11 labelled version of salvinorin A (33), using salvinorin B as precursor for the radiosynthesis.The 2-alpha-hydroxyl group of the precursor was acylated with [11C]acetyl chloride in DMF in thepresence of DMAP at 0 ◦C for 7–10 min, giving a radiochemical yield of 3.5–10% with molar activity7.4–28 GBq/μmol. PET studies in baboon brain showed rapid uptake and washout of [11C]salvinorinA (33), matching the brief duration of the hallucinatory/dissociative experience reported by humansusers. Rat studies showed that acute doses of salvinorin A caused dose-dependent occupancy at brainκORs labelled in vivo with [11C]GR103545 (25). Pretreatment with a high dose in the hours before PETexamination caused persistent reductions in receptor availability, despite the brief plasma half-lifeof the drug, and despite the rather brief duration of the hallucinogenic experience. This suggeststhat κOR activation by agonists such as salvinorin A provokes a delayed and persistent receptorinternalization [122].
In 2001, Thomas et al. [123] identified the first κOR-selective antagonist ligand,trans-3,4-dimethyl-4-(3-hydroxyphenyl)piperidine (JDTic, > 200-fold selective, Table 1), with non-opiatestructure. MeJDTic is a derivative of JDTic that is ring methylated on the nitrogen of thetetrahydroisoquinoline. Poisnel et al. [69] prepared [11C]MeJDTic (29) from JDTic by methylationwith [11C]methyl triflate in acetonitrile at room temperature for three min. The radiochemical yieldwas 78–98% and the molar activity 1.5–4.4 GBq/μmol. Recently, Schmitt et al. [124] synthesizedN-[18F]fluoropropyl-JDTic ([18F]FP-JDTic) (35)) from JDTic with [18F]fluoropropyl-tosylate in DMSO inthe presence of DIPEA and LiI at 150 ◦C for 30 min. In vivo studies in mouse showed accumulation of[18F]FP-JDTic (35) in peripheral organs rich in κORs. [11C]MeJDTic (29) entered mouse brain in vivo,albeit attaining a concentration of only 0.2–0.3% ID/g. Its binding was substantially reduced bytreatment with the κOR agonist U50,488, but was unaffected by morphine (1) or naltrindole (NTI), thusattesting to its high selectivity for κOR sites [69]. The κOR-agonist [11C]LY2795050 (30) had an in vitrobinding affinity of 1 nM, and 25 fold selectivity over μORs (Table 1). It readily entered monkey brain,and was substantially displacement by naloxone [57]. Displacement studies showed scant specificbinding in monkey cerebellum, which supports its use as a reference region for quantitation. The tracerhad a BPND as high as 1.0 in parts of the basal ganglia [125]. Dual tracer studies in monkey showed theLY2795050 displaced [11C]Caf (8) from μOR sites with an ED50 of 119 μg/kg, whereas the ED50 at κORsites was 16 μg/kg, indicating 8-fold selectivity in vivo [125,126]. Corresponding human studies withkinetic modelling showed VT ranging from 2 mL cm−3 in cerebellum to 4 mL cm−3 in amygdala, andLasson plots with partial NTX (5) blocking indicated a VND (non-specific binding) close to 1.6 mL cm−3,thus giving a BPND of 1.5 in amygdala versus only 0.2 in cerebellum [126]. The test-retest reliability inhuman brain was about 10% [127]. PET with [11C]LY2795050 (30) has revealed the dose-occupancyrelationship in human brain for the experimental κOR antagonist LY2456302 (34), which is underdevelopment as a treatment of alcoholism [128].
160

Molecules 2019, 24, 4190
[11C]LY2459989 (31) had sub-nM affinity at κOR sites in vitro, with 30-fold selectivity over μORand 400-fold selectivity over δOR sites [66]. Preliminary PET studies in monkey showed rapid kineticsand substantial displaceability in vivo, with BPND ranging from 0.5 in thalamus to 2.2 in globus pallidus.A comparison of κOR ligands in rat showed that the agonist [11C]GR103545 (25) and the antagonist[11C]LY2459989 (31) had similar displacement by various κOR antagonists. However, and of greatsignificance, the κOR agonists salvinorin A and U-50488, while displacing [11C]GR103545 (25) bindingin vivo, did not alter [11C]LY2459989 (31) binding [129], which may indicate an allosteric bindingmechanism. The novel κOR agonist tracer [11C]-EKAP (27) showed fast uptake kinetics and highspecific binding in monkey brain, with VT ranging from 12 mL cm−3 in cerebellum to mL cm−3 inglobus pallidus, corresponding to a BPND of 1.8, its binding was 95% displaced by pre-blocking withthe antagonists naloxone or LY2795050 [68].
The highly selective and potent κOR-ligand U-50488 served as a scaffold for developingfluoro-alkylated PET ligands, but proved inappropriate due to 100-fold loss of affinity relativeto the starting compound [130]. The novel fluorinated κ-ligand [18F]LY2459989 (32) had similar kineticproperties in monkey PET studies to those of [11C]LY2459989 (31) [117].
2.4. Nociceptin and Opioid-like 1 Receptors (ORL1)
Emerging evidence supports the use of agonists for the nociceptin/orphanin FQ peptidereceptor (NOP) in the clinical management of pain and for substance abuse [131], thuspresenting an attractive target for molecular imgaing A series of NOP ligands based on a2′-fluoro-4′,5′-dihydrospiro[piperidine-4,7′-thieno[2,3-c]pyran]-scaffold were screened in rats [71].Uptake in monkey brain in a baseline condition contrasted with a blocking conditionindicated specific binding of several of the [11C]-labelled compounds, of which [11C]NOP-1A((2S)-2-[(2-fluorophenyl)methyl]- 3-(2-fluorospiro[4,5-dihydrothieno[2,3-c]pyran- 7,4′-piperidine-1′-yl)-N-methyl-propanamide (36, Figure 6) was selected for further investigations. In the synthesisdeveloped by Pike et al. [71], [11C]NOP-1A (36) was prepared from a primary-amide type precursorby methylation with [11C]iodomethane in DMSO basified with potassium hydroxide at 80 ◦C for 5min. PET imaging experiments with 36 showed a VT in monkey brain ranging from 13 mL cm−3
in cerebellum to 21 mL cm−3 in amygdala. This fell globally to 8 mL cm−3 after blocking with theantagonist SB-612111, indicating a BPND of 1–2 [132]. A somewhat lower VT range was detected inhuman brain [133], where the test-retest reliability was about 12% [134].
O
N
SF
NH
O
11CH3
F
O
N
SCl
F F
NN
N
OH
36 37
N
O
F
N
N
N
CT3
O
38
[11C]NOP-1A LY2940094
[3H]PF-7191
N N
O
18FN
OH
39
[18F]MK-0911
Figure 6. Chemical structures of selected ORL1 receptor ligands.
The NOP/ORL1 antagonist LY2940094 (37) exerted a dose-dependent reduction in immobilityin the forced swim test, matching that provoked by imipramine, consistent with a potentialantidepressant action [23]. Changes in [11C]NOP-1A (36) binding in brain of living rats revealedthe ORL1 occupancy of orally administered LY2940094 (37) [135]. MK-0911 (1-(2-fluoroethyl)-3-[(3R,4R)-3-(hydroxymethyl)-1-[[(8S)-spiro[2.5]octan-8-yl]methyl]piperidin-4-yl]benzimidazol-2- one)is a high affinity, selective NOP receptor antagonist developed by Merck Pharmaceuticals.The fluorine-18 labelled version [18F]MK-0911 (39) had a VT in human brain ranging from 5 mL cm−3
161

Molecules 2019, 24, 4190
in cerebellum to 7 mL cm−3 in temporal cortex, with excellent test-retest stability [72]. Displacementstudies with antagonists revealed the presence of a small specific binding component in cerebellum,again raising a red flag about reference tissue quantitation. Studies with the nociceptine ligand[3H]PF-7191 (38) showed sub-nM binding displacement in vitro (Ki = 0.1 nM) and high selectivity overother OR types, as well as promising displaceable binding in rat brain measured ex vivo [136].
3. Clinical Studies
3.1. Age and Gender
The BPND of [11C]Caf (8) relative to occipital cortex was 20% lower in thalamus and amygdala ofhealthy, aged women compared with young women, but tended to increase with age in frontal cortex,whereas increases were more consistently seen in aged men [137]. This finding seems relevant to theage-dependent changes in sensitivity to μOR agonists, compounded by possible gender differences inhepatic tracer metabolism, noted above. Preliminary results with [11C]LY2795050 (30) PET did notindicate any change in κOR availability with age in humans [138]. Another κ-OR PET study with thatligand showed slightly higher (5–10%) VT in widespread brain regions of male subjects than that seenin age-matched women [139].
3.2. Epilepsy
A dual tracer PET study of patients with temporal lobe epilepsy showed increased binding of[11C]Caf (8) to μORs in the temporal neocortex and decreased binding in the amygdala ipsilateralto the epileptic focus [140]. However, binding of [11C]DPN (15) to μ- and other OR subtypes didnot differ between affected and unaffected cerebral hemipsheres, emphasizing the importance ofsubtype selectivity in PET studies. Another multi-tracer PET study in temporal lobe epilepsy showedincreased μOR binding ([11C]Caf (8)) in medial inferior temporal cortex and a more widespreadincrease in δOR binding ([11C]MeNTI (22)) in the affected temporal lobe [141]. Increased [11C]DPN (15)binding in temporal pole and fusiform gyrus of epilepsy patients declined with time since last seizure,indicating a transient response of the opioid system [142]. Applying a partial volume correctionrevealed small post-ictal increases in [11C]DPN (15) VT in the (sclerotic) hippocampus relative to theinterictal state [143], possibly indicating reduced competition from endogenous opioids. Thus, theremay be reduced opioid transmission in the post-ictal period.
A study of five patients with reading epilepsy (i.e. seizures provoked by reading text) revealedvery circumscribed 10% reductions in [11C]DPN binding the temporal parietal cortex in the activationcondition compared to non-reading baseline, whereas no such changes was seen in control subjects [144].In the context of a competition model, the authors interpreted this to indicate task-dependent releaseof opioid peptides in the patients, but it is difficult to determine the causal relationship between thisrelease and the seizures.
3.3. Movement Disorders
In an MPTP model of acquired parkinsonism, a substantial striatal dopamine depletion toFDOPA–PET was associated with a 20–30% reduction in the VT of [18F]FcyF, (11) in opioid-receptorrich areas, i.e., caudate, anterior putamen, thalamus, and amygdala relative to intact animals [145].These animals had recovery of their motor function, suggesting that the μOR changes were an adaptiveresponse to dopamine depletion. The same group reported that this effect was (paradoxically) bilateralin animals with unilateral dopamine lesions [146]. In patients with Parkinson’s disease, the [11C]DPN(15) binding relative to occipital cortex was 20–30% reduced in striatum and thalamus only in thosepatients with iatrogenic DOPA-dyskinesia, but was unaffected in nondyskinetic Parkinson’s diseasepatients [147]. This observation seems to merit further investigation, given the disabling effect ofdyskinesias often encountered in the treatment of Parkinson’s disease. On the other hand, there was no
162
Molecules 2019, 24, 4190
difference in [11C]DPN (15) binding in symptomatic DYT1 primary torsion dystonia patients relativeto controls [148].
Regional [11C]DPN (15) binding was unaffected in patients with restless legs syndrome (which,like, Parkinson’s disease, is responsive to levodopa treatment). However, there was a negativecorrelation between VT and motor symptom severity, and a negative correlation between severity ofpain and ligand binding in the medial pain system (medial thalamus, amygdala, caudate nucleus,anterior cingulate gyrus, insular and orbitofrontal cortex). The authors interpreted this result inrelation to pain-induced release of endogenous peptides, rather than a primary aspect of restless legssyndrome [149].
Binding of the non-selective OR ligand [11C]DPN PET was reduced by 31% in the caudate nucleusand 26% in putamen of a small group of symptomatic Huntington’s disease patients compared toage-matched healthy controls [150]. This effect was less pronounced than was the loss of dopaminetransporters seen in the same patients, suggesting that the reduction in ORs may partially accommodatethe nigrostriatal degeneration. Despite this finding, there has been no indication for opioid medicationsin the symptomatic treatment of HD.
3.4. Pain
A qualitative study of post pontine infarct central pain showed a reduction in [11C]DPN (15) uptakein the lateral cerebral cortex on the side contralateral to the main symptoms [151]. A more detailedstudy indicated [11C]DPN (15) binding reductions in contralateral thalamus, parietal, secondarysomatosensory, insular and lateral prefrontal cortices; these reductions were similar irrespective ofthe site of the lesion causing the central pain syndrome [152]. Indeed, this network of brain regions isrecognized as comprising a central pain pathway. Another [11C]DPN (15) study of central neuropathicpain showed 15–30% lower OR-binding within the medial pain system (cingulate, insula and thalamus),as well as the inferior parietal cortex of the lateral system (Brodman area 40). Patients with peripheralneuropathic pain had bilateral and symmetrical decreases in [11C]DPN (15) binding in contrast tothe hemispheric changes seen in central pain patients [153]. As always, these binding reductions areambiguous, perhaps due to reduced receptor expression, increased occupancy, or internalization.
Poor sleep quality in relation to topical application of 10% capsaicin cream (which directly activatescutaneous pain receptors) was associated with higher baseline [11C]Caf (8) BPND in the frontal lobe [154].Thus, we suppose that baseline cortical binding may reflect a tradeoff between pain sensitivity andsome cognitive or resilience function subserved by μ-ORs. Capsaicin-induced pain provoked a decreasein [11C]Caf (8) binding in the contralateral thalamus by as much as 50%, increasing as the subjectiveseverity of the pain [155]. Heat pain reduced the [18F]FE-DPN (16) binding in limbic and paralimbicbrain areas including the rostral ACC and insula [156]. Application of sustained painful stimulus of thejaw muscle with saline injection provoked bilateral reductions in [11C]Caf (8) binding in the ipsilateralamygdala (5%) and contralateral ventrolateral thalamus (7%) [157]. The same painful stimulus thatprovoked 5–10% decreases in [11C]Caf (8) binding in healthy young men tended to increase binding inwomen; this gender difference was most pronounced in the ventral striatum ipsilateral to the pain [158].A small group of patients with trigeminal neuralgia had reduced [11C]Caf (8) binding in left nucleusaccumbens, a brain region earlier implicated in pain modulation and response to reward or aversivestimuli [159]. It would be interesting to test if this phenomenon correlated with individual differencesin affective state or trait neuroticism.
In another [11C]Caf (8) study, the reduced binding provoked soon after administration of asustained pain of moderate intensity had normalized in the hours after cessation of the stimulus [160].In general, painful stimuli do not desensitize with time, so the relationship between temporal dynamicsof opioid signaling and pain perception must be complex. Indeed, pain researchers and clinicians alikeare familiar with the phenomenon of allodynia, which is a decrease in pain threshold, or the conversionof previously non-painful stimuli to pain. In a sciatic nerve stimulation model, pain conditioning somehours after stimulation was associated with increased C-fibre response and reduced C-fibre threshold,
163

Molecules 2019, 24, 4190
as well as supraspinal changes marked by increased binding of [11C]PEO (18) in ipsilateral and bilateralstructures of the rat brain [161]. Thus, allodynia may indicate inactivation of pain-mediated opioidrelease in brain, resulting in greater OR availability. On the other hand, an [18F]FE-DPN (16) PETstudy in athletes contrasting receptor availability at rest with the condition immediately after runninga half marathon showed reduced binding in various paralimbic and prefontal cortical structures, to anextent correlation with post-running euphoria (“runner’s high”) [162]. Similarly, a [11C]Caf (8) studyin recreationally active men showed a relationship between post-exercising euphoria with decreasedμOR binding in widespread cortical areas after high intensity exercise, although effects were less clearafter moderate intensity exercise [163].
Prolonged electrical stimulation of the motor cortex for relief of neuropathic pain caused reductionsin [11C]DPN (15) binding in part of the cingulate cortex, prefrontal cortex, the periaqueductal grayprefrontal cortex, and cerebellum [164]. Some of these changes correlated with the extent of pain relief.In a case study, a single session of motor cortex stimulation improved the cold pain threshold, whiledecreasing [11C]Caf (8) binding in pain-network brain regions [165]. Other studies showed that lowcerebral binding of [11C]DPN (15) predicted for poor response to motor cortex stimulation for thetreatment of neuropathic pain [166]. Stimulation of the central grey for treatment of phantom limbpain provoked a focal decrease in midbrain [11C]DPN (15) binding, indicating endogenous opioidrelease [167].
Visceral pain applied by gastric inflammation was without effect on cerebral [11C]Caf (8) bindingin healthy volunteers [168], this standing in contrast to findings with somatic pain as described above.On the other hand, vestibular stimulation provoked decreased [18F]FE-DPN (16) binding in parts ofthe right dominant cortical vestibular network [169].
A [11C]Caf (8) study in which painful heat was applied after administration of supposedlyanalgesic cream indicated a placebo-mediated reduction in receptor availability [170]. The samegroup later showed that placebo transcranial direct current stimulation (tDCS) reduced [11C]Caf (8)BPND in the periaqueductal gray matter (PAG), precuneus, and thalamus, indicating endogenousopioid release [171]. This placebo effect apparently increased upon administration of verum tDCS.In another study, acupuncture administered according to an authentic analgesic procedure had onlyslight effects on the binding of [11C]DPN (15) in human brain [172]. However, a study with [11C]Caf(8) showed acupuncture therapy to provoke short-term and persistent 10–30% increases in μORbinding in pain-related brain regions; importantly the verum acupuncture condition was contrastedwith a sham acupuncture condition in that study [173]. Thus, while acupuncture analgesia maybe “in one’s head”, there seems to be a real component mediated by increased opioid transmission.Transcutaneous electrical acupoint stimulation (TEAS) is an analogue of the electrical acupuncturetechnique. Administration of TEAS at 2 Hz to anesthetized monkey provoked reductions in [11C]Caf(8) binding in striatum, amygdala and ACC, whereas 100 Hz stimulation had no effect relative tobaseline PET recordings [174].
Reminiscent of the findings in the study of pain-induced sleep disturbance noted above, across sectional study of sensory processing in healthy volunteers showed lower baseline bindingof [18F]FE-DPN (16) in regions such as insular cortex and orbitofrontal cortex of those with greatersensitivity to cold pain. In addition, there were negative correlations between regional bindingand sensory thresholds for non-painful stimuli [175]. Similarly, the individual striatal binding of[11C]Caf (8) BPND predicted cold pressor pain threshold, but not cold pressor pain tolerance or tactilesensitivity [176]. A longitudinal [18F]FE-DPN (16) PET study in neuropathic pain model rats showedlower μ+κ OR availability in the insula, caudate putamen, and motor cortex at three months after theinjury [177]. These reductions occurred in association with anhedonia (disinterest in sucrose solution).Overall, these studies suggest that individual differences in OR signaling may mediate vulnerability toenvironmental stressors, a topic to be elaborated in Section 3.5 below.
Binding of [11C]DPN (15) was reduced in pineal gland (but not in the brain per se) of patients whohad been experiencing cluster headache attacks [178], said to be one of the most painful experiences.
164
Molecules 2019, 24, 4190
The authors suggested that inputs from trigeminal nerve to the pineal gland might mediate this change.A group of seven spontaneous migrainers showed ictal reductions in [11C]Caf (8) binding in the medialprefrontal cortex, which correlated with the baseline or intra-ictal binding [179]. The [11C]DPN (15)BPND in brain did not differ between migrainers and healthy controls, nor was there any effect ofplacebo treatment in either group [180].
3.5. Personality, Drug Dependence, and Psychiatric Disorders
Scores in the personality trait of harm avoidance in a group of 23 healthy males correlatedpositively with binding of [18F]FE-DPN (16) in the bilateral ventral striatum, suggesting a link withpredisposition to substance abuse [181]. It might follow that drug abuse is a kind of self-medicationfor those with pronounced harm avoidance trait. A comparison of [11C]Caf (8) uptake in healthyindividuals showed that high scores in the harm avoidance trait were associated with high μORavailability in frontal and insular cortex [182], again linking the hard avoidance trait with lower tonicopioid transmission. Score in a scale of behavioral activation, which conceptually guides approachbehavior, and notably in a scale designated “fun-seeking”, correlated positively with [11C]Caf (8)in widespread brain regions [183]. A [11C]Caf (8) study in 49 healthy volunteers showed an inverserelationship between μOR availability in various brain regions and individual scores in the avoidancedimension of interpersonal attachment [184]. Considering the harm avoidance findings, baseline μORavailability may mediate a trade-off between harm avoidance and avoidant behavior in interpersonalrelationships, in a psychological analogue of pain or cold sensitivity.
In a large group of healthy women, [11C]Caf (8) binding had a negative correlation with BOLDsignal responses in amygdala, hippocampus, thalamus, and hypothalamus to viewing emotionallyarousing scenes [185]. Non-sexual, albeit pleasurable social touch from a partner provoked widespreadincreases in [11C]Caf (8) binding, suggesting reduced opioid signaling [186], whereas social laughterprovoked by viewing comedic film clips decreased [11C]Caf (8) binding in thalamus, caudate nucleus,and anterior insula. Furthermore, baseline μOR availability in some regions was associated with therate of social laughter [187]. These results are difficult to reconcile, since pleasurable social experiencescan seemingly have opposite effects on μOR availability. Contrasting the [11C]Caf (8) binding ineuthymic and unhappy states (provoked by autobiographical reflection) in young women showedhigher μOR availability in the rostral anterior cingulate, ventral pallidum, amygdala, and inferiortemporal cortex in the unhappy state [188]. This kind of sad reflection provoked greater increases in[11C]Caf (8) binding in widespread brain regions of women with major depression [189], suggesting anexaggerated opioid response in relation to mood disorder, as distinct from ordinary sadness. A pilotPET study with the κOR-ligand [11C]GR103545 (25) did not reveal any binding differences betweenhealthy control and patients suffering from major depression [190]. However, a [11C]EKAP (27) κORstudy in healthy volunteers showed an inverse correlation between social status and [11C]salvinorin A(33) binding in widespread brain areas, with a special association occurring in brain regions mediatingreward or aversion [191]. Given the association between social stress and depression, one might haveexpected covariance κORs in the two studies.
A recent [11C]Caf (8) PET study of 19 schizophrenia patients and 20 controls showed a 10% lower(Cohen’s d = 0.7) μOR -availability in striatium of the patient group. While such a decrease can hardlybe pathogonomic of disease, the authors also reported considerably higher inter-regional covarianceof the [11C]Caf (8) binding in the patients, which might indicate an aberent spatial pattern of opioidsignalling in schizophrenia [192]. There have been no OR PET studies in bipolar disorder.
A [11C]Caf (8) study showed that circulating levels of the anti-nociceptive cytokine IL-1ra (whichcorrelated with neuroticism scores) predicted for the pain response to a standard stimulus (salineinfusion to the masseter muscle), and likewise the reduction in μOR availability in the basal gangliaduring the painful stimulus [193]. In a group of female patients suffering from fibromyalgia, [11C]Caf(8) binding correlated with pain-evoked BOLD signal changes in several brain regions, includingdorsolateral prefrontal cortex and nucleus accumbens [194]. Overall, these studies suggest some
165

Molecules 2019, 24, 4190
linking between opioid transmission, mood, and inflammatory markers, which returns to the thenotioin that OR signaling may mediate personality traits and vulnerability to stresses of various sorts.
[11C]Caf (8) PET showed persistently increased μOR binding in frontal and cingulate cortex ofacutely detoxified cocaine addicts, which correlated with the extent of craving [195]. Elevated [11C]Caf(8) binding in frontal and temporal cortical regions was a significant predictor of time to relapseto cocaine use among abstinent addicts [196]. Binge cocaine users showed a significant associationbetween [11C]GR103545 (25) binding to κORs with the amount of drug consumed. Furthermore, athree-day cocaine binge reduced binding by about 15% [197]. The cerebral binding (VT) of the ORL1ligand [11C]NOP-1A (36) was globally elevated 10% in detoxified cocaine users [198].
One [11C]Caf (8) PET study showed persistently increased μOR binding in striatum of detoxifiedalcoholics, which furthermore correlated with the extent of craving [199]. Abstinent alcoholics showedsignificantly higher [11C]Caf (8) binding compared to controls, but a blunting of the response toamphetamine (which indirectly displaces μOR binding), resembling that seen by the same researchgroup in compulsive gamblers [200]. However, others saw only a small increase in [11C]DPN (15) VT
in brain of acutely withdrawn alcoholics, although there was a correlation between individual PETresults and craving scores at the time of scanning [201]; the combined (μ+κ) PET signal in that studymakes difficult a comparison with [11C]Caf (8) studies. Post mortem autoradiographic examination of[3H]DAMGO binding in brain of a large group of alcoholics showed substantial reductions in μORbinding sites, whereas low [11C]Caf (8) BPND in ventral striatum of acutely detoxified patients predictedhigh risk of relapse and poor response to naloxone in interaction with the μOR rs1799971 allele [202].The disagreement between μOR findings in vivo and post mortem could indicate low tonic occupancy inalcohol dependent patients, since competition effects would disappear in autoradiographic studies.
In a [11C]MeNTI (22) PET study, there was globally 10–20% higher δOR binding in brain of alarge group of alcohol-dependent subjects; which reached significance upon correcting for age, gender,and smoking status; there was an inverse relationship between binding in some regions and intensityof craving [203]. The VT of the κOR-selective ligand [11C]LY2795050 (30) was significantly lower inamygdala and pallidum of alcohol-dependent subjects [138]. This stands in contrast to the usualfinding of increased μOR binding and the single report of elevated δOR binding.
The naloxone challenge paradigm has a long history in investigations of the regulation ofthe neuroendocrine axis, but it has been uncertain if naloxone-induced increases in ACTH andcortisol secretion bear any relation to central OR pathways. In a [11C]Caf (8) PET study of healthyvolunteers there were negative relationships between cortisol (but not ACTH) response to naloxoneand ligand BPND in ventral striatum, putamen and caudate [204]. The inverse relationship betweennaloxone-induced cortisol secretion and [11C]Caf (8) BPND in various brain regions of healthy volunteerswas absent in alcohol dependent subjects [205]. This suggests that central ORs exert a top-downregulation of the neuroendocrine axis, which might contribute to individual differences in stressresponse, and that the normal regulation of this axis is disprupted in alcohol dependence.
There was only a slight difference in [11C]Caf (8) binding between non-smoking carriers of theμOR rs1799971 allelic variants, but this allelic difference was greater among smokers. Furthermore,the contrast in PET results between active and denicotinized cigarette conditions revealed a positiverelationship between reward and altered μOR availability in the smokers [206]. An apparentre-analysis of the same data showed widespread reductions in [11C]Caf (8) binding after smokinga nicotine-containing cigarette; this effect was moderated by the rs1799971 polymorphism, wherecarriers of the A allele showed greater response to active cigarette smoking, and higher baselineμOR binding [207]. The authors conceded that non-nicotinergic factors, i.e. conditioning, could becontributing to aspects of smoking related opioid transmission [208].
Smoking subjects with higher dependence, craving, and cigarette consumption rates showedlower baseline [11C]Caf (8) BPND in limbic brain regions. There was bluniting of this association duringNTX (5) treatment [209], but there was very low residual specific binding in the NTX condition, whichmust have compromised the sensitivity of the method. Another [11C]Caf (8) PET study showed no
166

Molecules 2019, 24, 4190
difference in BPND between placebo and active nicotine cigarette conditions, and no difference betweensmokers and nonsmokers. However, there was a negative correlation in the smokers between BPND inbilateral superior temporal cortex with scores in an index of nicotine dependence [210].
As noted above, challenge with amphetamine can indirectly provoke increased opioid peptiderelease. However, in a placebo-controlled, double-blinded and randomized [11C]Caf (8) PET study,amphetamine challenge (0.3 mg/kg) did not alter μOR availability in healthy male volunteers [211].This stands in contrast to another study, wherein a high dose of amphetamine (0.5 mg/kg) provokedreductions in [11C]Caf (8) binding in widespread brain regions, i.e. frontal cortex, putamen, caudate,thalamus, anterior cingulate, and insula, whereas a sub-pharmacological dose was without suchan effect [212,213]. Preclinical studies point to the importance of receptor internalization on thevulnerability of OR-receptor binding to challenge with amphetamine [214]. Notwithstanding thiscaveat, amphetamine induced reductions in [11C]Caf (8) binding were blunted in compulsive gamblerscompared to that in a healthy control group controlled for smoking and drinking [215]. There was ageneral correlation between dopamine synthesis capacity to FDOPA PET and [11C]Caf (8) binding inputamen of healthy controls, and likewise in pathological gamblers, consistent with a tight relationshipbetween dopamine and opioid systems in relation to compulsive behaviors [216].
Women with bulimia nervosa had reduced [11C]Caf (8) binding in the left insula, to an extentcorrelating with their duration of fasting [217]. Obese patients (BMI 40) had globally 20% lower[11C]Caf (8) BPND compared to lean volunteers; contrary to some reports, the same obese subjects hadnormal dopamine D2 receptor levels in striatum [218]. There were similar reductions in [11C]Caf (8)binding in morbidly obese subjects and patients with binge eating disorder [219]. Weight loss afterbariatric surgery for the treatment of obesity resulted in a global 25% increase of μOR binding [220].A dual tracer study with [11C]Caf (8) and the dopamine receptor ligand [11C]raclopride showed ahigh correlation in the striatum of lean subjects, whereas this correlation was considerably weaker inthe ventral (limbic) striatum of the morbidly obese, suggesting an uncoupling of opioid/dopamineinteractions in that condition [221]. This finding might predict analogous results in gambling andsubstance abuse disorders, which likewise may involve dysregulation opioid/dopamine interactions.
Feeding, regardless of the hedonic experience (palatable versus unpalatable meal), provokedwidespread decreases in [11C]Caf (8) binding in non-obese healthy subjects, suggesting that ORtransmission mediates some aspect of the rewarding properties of food [222]. Also in non-obesesubjects, [11C]Caf (8) BPND in amygdala correlated inversely with BMI in the range 20–27 [223]. In thatstudy, BPND in other brain regions correlated with the BOLD signal response in orbitofrontal cortexupon viewing palatable food. In a group of lean subjects, the [11C]Caf (8) BPND at baseline in widespreadbrain regions correlated with BOLD responses to viewing palatable food [224], suggesting that lowbasal occupancy increases the response to cues. Interestingly, exercise increased or decreased thalamicμOR binding in these subjects; the direction of this change correlated with the individual BOLD signalin the contrast between viewing palatable and non-palatable food. This draws attention to individualdifferences in effects of exercise on the hedonic response to food, which may have some bearing onthe relationship between exercise and weight loss, with the caveat that only intense exercise maysignificantly engage opioid transmission, as claimed above. Other studies show widespread reductionsin μOR availability in frontolimbic regions after high intensity aerobic exercise, in correlation withnegative affect. In contrast, mean binding was unaltered after moderate-intensity exercise, althoughthere was some positive association with euphoria [225]; too much of a good thing spoils runner’shigh, it seems.
4. Conclusions and Outlook
The past decades have seen extraordinary progress in the development of ligands for PET studiesof ORs. Early radiopharmaceutical research focused on studies with the antagonist [11C]DPN (15)and the μOR-selective agonist [11C]Caf (8), and the great preponderance of human PET studieshave employed these and closely related tracers. While studies with non-selective tracers reveal the
167

Molecules 2019, 24, 4190
composite of OR binding sites, specific tracers may be more indicative of physiological changes indisease states. Attaining high molar activity is of great importance in PET studies with [11C]Caf (8)and other highly potent agonist ligands; fortunately, most tracers described in this review have molaractivities of at least 50 GBq/μmol, corresponding to an injected mass of about 1 μg of the drug. This ishardly a relevant dose in the case of antagonist ligands, and would give a comfortable 100-fold marginof safety with the potent μOR agonist [11C]Caf (8).
The μOR ligands have the useful property of binding in competition with endogenous opioidpeptides, such that changes in the uptake in PET studies can reveal altered endogenous opioid releaseunder various physiological conditions. This model has been particularly useful in studies of painpathways, which largely involve μORs in telencephalon, and in some pharmacological or behavioralactivation studies. However, the simple competition model may be inadequate to account for allobservations. Thus, one of the [11C]Caf (8) studies noted above reports widespread reductions in μORavailability after smoking [207], despite the 30–3000-fold lower affinity of endogenous opioid peptidesat μOR. This would seem to imply an implausibly enormous increase in peptide release to effect suchchanges by competition alone.
Pain studies have so far dominated the field of clinical PET research with OR-ligands, withrelatively few reports on other models or conditions, as summarized in Table 2. For example, there inonly one PET study of opioid receptors in schizophrenia, and only scant documentation in depression,or for that matter, in a range of common neurological disorders. In several human diseases notedabove, the OR binding may be only 10% higher or lower than in the control group; while these smalldifferences can have a large effect size, it is perhaps difficult to argue that such small differences can becausative of complex disorders or symptoms.
Table 2. A summary of the key results with opioid PET in clinical research.
Condition Ligand Main Finding Ref.
Healthy aging [11C]Caf (8)(μOR)
20% decrease in frontal cortex (females) [137]
Epilepsy [11C]Caf (8)(μOR)
Increased in ipsilateral temporal lobe, decreased in amygdala [140]
Epilepsy [11C]DPN (15)(mixed ligand)
No change [140]
Parkinson’s disease [11C]DPN (15)(mixed ligand)
20–30% decrease in striatum and thalamus only in thosepatients with iatrogenic DOPA-dyskinesia [147]
Huntington’s disease [11C]DPN (15)(mixed ligand)
30% reduced in caudate/putamen [150]
Pontine infarct central pain [11C]DPN (15)(mixed ligand)
Reduced throughout pain network [151]
Capsaicin-induced acute pain [11C]Caf (8)(μOR)
Up to 50% decrease contralateral thalamus, in proportion tosubjective severity [155]
Sustained painful stimulus of the jawmuscle with saline injection
[11C]Caf (8)(μOR)
Blateral decrease in binding in the ipsilateral amygdala (5%)and contralateral ventro-lateral thalamus (7%) [157]
painful heat [11C]Caf (8)(μOR)
Placebo effect on binding changes [170]
Acupuncture therapy with shamacupuncture control
[11C]Caf (8)(μOR)
Persistent 10–30% increases in μ-OR binding in pain-relatedbrain regions [173]
Harm avoidance trait in healthy males [18F]FE-DPN (16) (mixedligand)
Trait correlated positively with binding in vental striatum,suggesting link with substance abuse [181]
Correlation with BOLD signal responsesA large group of healthy women, binding.to viewing emotionally arousing scenes
[11C]Caf (8)(μOR)
Negative correlation in amygdala, hippocampus, thalamus,and hypothalamus [185]
Major depressive disorder [11C]GR103545 (25)(κOR)
No difference from controls [190]
Detoxified cocaine addicts [11C]Caf (8) (μOR)Increased in frontal and cingulate cortex, which correlatedwith the extent of craving [195]
Detoxified alcohol-dependent subjects [11C]MeNTI (22) (δOR)Globally 10–20% increased binding inverse relationship insome regions with intensity of craving [203]
Obesity (BMI > 40) [11C]Caf (8)(μOR)
Globally 20% lower compared to lean volunteers [218]
Feeding, regardless of the hedonicexperience in non-obese subjects
[11C]Caf (8)(μOR)
Widespread decreases in binding [222]
Addiction research using PET studies of ORs are so far mostly confined to alcohol, cocaine, andnicotine abuse and (strangely, perhaps), opioid addiction has hardly been a research theme, other than in
168

Molecules 2019, 24, 4190
a few occupancy studies. Since antagonists are relatively safe at doses provoking high occupancy (viz 50mg naloxone for opioid overdose), we suppose that the Bmax of ORs might be determinable in relation toopioid addiction and withdrawal by conducting serial PET studies over a range of molar activity, even inthe presence of significant agonist occupancy. Indeed, chronic morphine was reported 45 years ago toincrease the abundance of [3H]naloxone binding sites in rat brain [226], but no such studies are reportedin human opioid users, despite the catastrophe of the current opioid addiction epidemic. This kind ofinformation might help to understand better the correlates of addiction and relapse. In addition, geneticstudies of dopaminergic and opioid systems in relation to addiction [227], in conjunction with molecularimaging studies, could help to establish better the risk factors for opioid addiction. Endomorphinsand other novel opioid petpides may present new avenues for obtaining opioid analgesia [228], whilemoderating the risk of “iatrogenic opioid addiction”. The development of PET tracers with good bindingproperties in vivo and high selectivity for ORs other than the μ-type has accelerated in the past decade.However, there remain relatively few clinical molecular imaging studies of these important targets. Thus,developments in radioligand chemistry have for the presence to read for the present presence outpacedclinical PET imaging, a state of affairs that could enable and motivate a broad range of studies focusing onnon-μORs over the coming decades. Just for example, κORs have an established role in the reinstatementof stress induced drug use in experimental animals, i.e. nicotine use [229], and very recent results indicatea relationship between κORs and stress-induced binge cocaine use [197].
Funding: This research received no external funding.
Conflicts of Interest: The authors declare no conflict of interest.
Abbreviations
Compound Name, Synonyms
3-O-Ac-[18F]FcyF (10) 3-O-[18F]acetylcyclofoxy, 3-O-Acetyl-6-deoxy-6-beta-[18F]fluoronaltrexone
β-Endorphin
Tyr-Gly-Gly-Phe-Met-Thr-Ser-Glu-Lys-Ser-Gln-Thr-Pro-Leu-Val-Thr-Leu-Phe-Lys-Asn-Ala-Ile-Ile-Lys-Asn-Ala-Tyr-Lys-Lys-Gly-GluCAS RN: [61214-51-5]
BEMP2-tert-butylimino-2-diethylamino-1,3-dimethyl-perhydro-1,3,2-diazaphosphorineCAS RN: [98015-45-3]
[11C]BPN (14) [11C]buprenorphine, [6-O-methyl-11C]buprenorphine
Caf
carfentanil, 1-(2-phenylethyl)-4-[(1-oxopropyl)phenylamino]-4-piperidinecarboxylic acid methyl ester, R-31,833, 4-carboxymethyl-fentanyl,CAS RN: [59708-52-09]
[11C]Caf (8) [11C]carfentanil[3H]DAMGO [3,5-3H]Tyr-D-Ala-Gly-(NMe)Phe-Gly-olDBU 1,8-diazabicyclo[5.4.0]undec-7-ene, CAS RN: [6674-22-2]DIPEA ethyldiisopropylamine, N,N-diisopropylamine, Hünig’s baseDMF N,N-dimethylformamide[11C]DPN (15) [11C]diprenorphine, [6-O-methyl-11C]diprenorphine
dppf 1,1’-ferrocenediyl-bis(diphenylphosphine), CAS RN: [121450-46-8]Dynorphin A [1-17] Tyr-Gly-Gly-Phe-Leu-Arg-Arg-Ile-Arg-Pro-Lys-Leu-Lys-T rp-Asp-Asn-Gln CAS RN: [80448-90-4]Dynorphin A [1-8] Tyr-Gly-Gly-Phe-Leu-Arg-Arg-Ile, CAS RN: [75790-53-3]
Dynorpin B [1-13]Tyr-Gly-Gly-Phe-Leu-Arg-Arg-Gln-Phe-Lys-Val-Val-Thr,CAS RN: [83335-41-5]
[11C]EKAP (27) (R)-(methyl-11C) 4-(2-(3,4-dichlorophenyl)acetyl)-3-((diethylamino)methyl) piperazine-1-carboxylate
cyF
cyclofoxy, 6-deoxy-6β-[18F]fluoro-naltrexone,N-cyclopropylmethyl-6-deoxy-6β-fluoro-noroxymorphone,17-cyclopropylmethyl-4,5α-epoxy-6β-fluoro-morphinan-3,14-diolCAS RN: [103223-57-0]
[18F]FcyF (11)
[18F]cyclofoxy, 6-Deoxy-6-β-[18F]fluoro-naltrexone,N-cyclopropylmethyl-6-deoxy-6β-[18F]fluoro-noroxymorphone,CAS RN: [103223-58-1]
FDOPA 6-fluoro-L-dopa, 2-Fluoro-5-hydroxy-L-tyrosine, CAS RN: [144334-59-8][18F]FE-DPN (16) 6-O-(2-[18F]fluoroethyl)-6-O-desmethyl-diprenorphine[11C]FEKAP (28) (R)-(methyl-11C)4-(2-(3,4-dichlorophenyl)acetyl)-3-((ethyl(2-fluoroethyl)amino) methyl)piperazine-1-carboxylate[18F]FE-BPN (19) 6-O-(2-[18F]fluoroethyl)-6-O-desmethyl-buprenorphine[18F]FP-norBPN (21) N17-(3-[18F]fluoropropyl)-nor-buprenorphine[18F]FP-norDPN (20) N17-(3-[18F]fluoropropyl)-nor-diprenorphine
169
Molecules 2019, 24, 4190
[18F]FE-NTI (23) [18F]fluoroethyl-naltrindole, N1’-(2-[18F]Fluoroethyl)-naltrindole, [18F]BU97001[18F]FE-PEO (17) 6-O-(2-[18F]fluoroethyl)-6-O-desmethyl-phenethyl-orvinol[18F]FE-Tos [18F]fluoroethyl tosylate
Foxy6-deoxy-6β-fluoro-oxymorphone, «fluorooxymorphone », 4,5α-Epoxy -6β-fluoro-17-methyl-morphinan-3,14-diol,CAS RN: [92593-44-7]
[3H]Foxy[1,2-3H]-4,5α-epoxy-6β-fluoro-17-methyl-morphinan-3,14-diol,CAS RN: [96917-45-2]
[11C]GR103545 (25) [(3,4-dichlorophenyl)acetyl]-(3R)-(1-pyrrolidinylmethyl)-1-piperazine carboxylic acid methyl-11C ester[11C]GR89696 (26) 4-[(3,4-dichlorophenyl)acetyl]-3-(R,S)-(1-pyrrolidinylmethyl)-1-piperazine carboxylic acid methyl-11C esterHD Huntington’s disease
[11C]LAAM (13)N-(methyl-11C)-L-α-acetoxymethadol, N-(methyl-11C)-levo-alpha-acetyl methadol, N-(methyl-11C)-levomethadylacetate
Leu5-enkephalin H-Tyr-Gly-Gly-Phe-Leu-OH, CAS RN: [58569-55-4]LY2459989 3-fluoro-4-[4-[[(2S)-2-(3-pyridyl)pyrrolidin-1-yl]methyl]phenoxy] benzamide
LY27950503-chloro-4-[4-[[(2S)-2-(3-pyridyl)pyrrolidin-1-yl]methyl]phenoxy] benzamide,CAS RN: [1346133-08-1]
LY2456302 (34)(S)-4-(4-((2-(3,5-dimethylphenyl)pyrrolidin-1-yl)methyl)phenoxy)- 3-fluorobenzamide, CERC-501, CAS RN:[1174130-61-0]
LY2940094
([2-[4-[(2-chloro-4,4-difluoro-spiro[5H-thieno[2,3-c]pyran-7,4′-piperidine]-1′-yl)methyl]-3-methyl-pyrazol-1-yl]-3-pyridyl]methanol), BTRX-246040,CAS RN: [1307245-86-0]
Met5-enkephalin H-Tyr-Gly-Gly-Phe-Met-OH
[11C]MeJDTic (29)
(3S)-7-hydroxy-N-((1S)-1-[[3R,4R)-4-(3-hydroxyphenyl)-3,4-dimethyl-1-piperidinyl]methyl]-2-methylpropyl)-2-[11C]methyl-1,2,3,4-tetrahydro-3-isoquinolinecarboxamide
[11C]MeNTI (22) [11C]methyl-naltrindole, N1’-[11C]methyl-naltrindole
[18F]MK-0911 (39)1-(2-[18F]fluoroethyl)-3-[(3R,4R)-3-(hydroxymethyl)-1-[[(8S)-spiro[2.5]octan-8-yl]methyl]piperidin-4-yl]benzimidazol-2-one
MPTP 1-methyl-4-phenyl-1,2,3,6-tetrahydropyridine, CAS RN: [28289-54-5]Oxycodone 14-hydroxy-dihydrocodeinone, CAS RN: [76-42-6]
NaloxoneN17-allyl-14-hydroxy-dihydromorphinone, N17-Allyl-noroxymorphone,CAS RN: [465-65-6]
Naltrexone
N17-cyclopropylmethyl-14-hydroxy-dihydromorphinone,N17-cyclopropylmethyl-noroxymorphone, NTXCAS RN: [16590-41-3]
Nociceptine Phe-Gly-Gly-Phe-Thr-Gly-Ala-Arg-Lys-Ser-Ala-Arg-Lys-Leu-Ala-Asn-GlnN-substituted-
[11C]quinolinimide (24)
6-(2-{2-[4-(4-fluorobutyl)-benzenesulfonyl]-1,2,3,4-tetrahydro-isoquinolin-1-yl}-ethyl)-2-[11C]methyl-pyrrolo[3,4-b]pyridine-5,7-dione
NTI naltrexone-indole, naltrindole, CAS RN: [111555-53-4]
[11C]NOP-1A (36)(2S)-2-[(2-fluorophenyl)methyl]-3-(2-fluorospiro[4,5-dihydro-thieno[2,3-c]pyran-7,4'-piperidine]-1'-yl)-N-[11C]methyl-propanamide
OR opioid receptor[11C]PEO (18) [11C]phenethyl-orvinol, [6-O-methyl-11C]phenethyl-orvinolPET positron emission tomographyPd2dba3 Pd2(dba)3, tris(dibenzylideneacetone)dipalladium, CAS RN: [51364-51-3]
[3H]PL017[3,5-3H]Tyr-Pro-(NMe)Phe-d-Pro-NH2, 3-N-Me-Phe-[3H]morphiceptin,[3H] [MePhe3,D-Pro4]morphiceptin
Salvinorin Amethyl (2S,4aR,6aR,7R,9S,10aS,10bR)-9-acetyloxy-2-(furan-3-yl)-6a,10b-dimethyl-4,10-dioxo-2,4a,5,6,7,8,9,10a-octahydro-1H-benzo[f]isochromene-7-carboxylate, CAS RN: [83729-01-5]
TBDMS tert-butyldimethylsilyl protecting groupTDBPN 3-O-trityl-6-O-desmethyl-buprenorphine, CAS RN: [157891-93-5]
TDDPN
3-O-trityl-6-O-desmethyl-diprenorphine, CAS RN: [157891-92-4],“Luthra-precursor”, TDDPN was the first product of the company ABX advanced biochemical compoundsBiomedizinische Forschungsreagenzien GmbH, Radeberg in 1997
TDPEO 3-O-trityl-6-O-desmethyl-phenethyl-orvionol, CAS RN: [1187551-69-4]
U-504883,4-dichloro-N-methyl-N-[(1R,2R)-2-(1-pyrrolidinyl)cyclohexyl]- benzene acetamide, NIH10533, CAS RN:[67198-13-4]
References
1. Gulland, J.M.; Robinson, R. Constitution of codeine and thebaine. Mem. Proc. Manchester Lit. Phil. Soc. 1925,69-86, 79–86.
2. Gates, M.; Tschudi, G. The synthesis of morphine. J. Am. Chem. Soc. 1952, 74, 1109–1110.3. Gates, M.; Tschudi, G. The synthesis of morphine. J. Am. Chem. Soc. 1956, 78, 1380–1393. [CrossRef]
170

Molecules 2019, 24, 4190
4. Bentley, K.W.; Cardwell, H.M.E. The Morphine-Thebaine group of alkaloids. Part V. The absolutestereochemistry of the morphine, benzylisoquinoline, aporphine, and tetrahydroberberine alkaloids. J. Chem.Soc. 1955, 3252–3260. [CrossRef]
5. Rice, K.C. Synthetic opium alkaloids and derivatives. A short total synthesis of (±)-dihydrothebainone,(±)-dihydrocodeinone, and (±)-nordihydrocodeinone as an approach to a practical synthesis of morphine,codeine, and congeners. J. Org. Chem. 1980, 45, 3135–3137. [CrossRef]
6. Lever, J.R. PET and SPECT imaging of the opioid system: Receptors, radioligands and avenues for drugdiscovery and development. Curr. Pharm. Des. 2007, 13, 33–49. [CrossRef] [PubMed]
7. Henriksen, G.; Willoch, F. Imaging of opioid receptors in the central nervous system. Brain 2008, 131,1171–1196.
8. Dannals, R.F. Positron emission tomography radioligands for the opioid system. J. Label. Compd. Radiopharm.2013, 56, 187–195. [CrossRef]
9. Pert, C.B.; Snyder, S.H. Properties of opiate-receptor binding in rat brain. Proc. Natl. Acad. Sci. USA 1973, 70,2243–2247. [CrossRef]
10. Hughes, J.; Smith, T.W.; Kosterlitz, H.W.; Fothergill, L.A.; Morgan, B.A.; Morris, H.R. Identification oftwo related pentapeptides from the brain with potent opiate agonist activity. Nature 1975, 258, 577–579.[CrossRef]
11. Di Giulio, A.M.; Majane, E.M.; Yang, H.Y. On the distribution of [met5]- and [leu5]-enkephalins in the brainof the rat, guinea-pig and calf. Br. J. Pharmacol. 1979, 66, 297–301. [CrossRef] [PubMed]
12. Hughes, J.; Kosterlitz, H.W.; Smith, T.W. The distribution of methionine-enkephalin and leucine-enkephalinin the brain and peripheral tissues. Br. J. Pharmacol. 1977, 61, 639–647. [CrossRef] [PubMed]
13. Li, C.H.; Chung, D. Isolation and Structure of an Untriakontapeptide with Opiate Activity from CamelPituitary Glands. Proc. Natl. Acad. Sci. USA 1976, 73, 1145–1148. [CrossRef] [PubMed]
14. Goldstein, A.; Tachibana, S.; Lowney, L.I.; Hunkapiller, M.; Hood, L. Dynorphin-(1-13), an extraordinarilypotent opioid peptide. Proc. Natl. Acad. Sci. USA 1979, 76, 6666–6670. [CrossRef] [PubMed]
15. Nakanishi, S.; Inoue, A.; Kita, T.; Numa, S.; Chang, A.C.; Cohen, S.N.; Nunberg, J.; Schimke, T.R. Constructionof bacterial plasmids that contain the nucleotide sequence for bovine corticotropin-beta-lipotropin precursor.Proc. Natl. Acad. Sci. USA 1978, 75, 6021–6025. [CrossRef]
16. Noda, M.; Furutani, Y.; Takahashi, H.; Toyosato, M.; Hirose, T.; Inayama, S.; Nakanishi, S.; Numa, S. Cloningand sequence analysis of cDNA for bovine adrenal preproenkephalin. Nature 1982, 295, 202–206. [CrossRef]
17. Horikawa, S.; Takai, T.; Toyosato, M.; Takahashi, H.; Noda, M.; Kakidani, H.; Kubo, T.; Hirose, T.; Inayama, S.;Hayashida, H.; et al. Isolation and structural organization of the human preproenkephalin B gene. Nature1983, 306, 611–614. [CrossRef]
18. Kakidani, H.; Furutani, Y.; Takahashi, H.; Noda, M.; Morimoto, Y.; Hirose, T.; Asai, M.; Inayama, S.;Nakanishi, S.; Numa, S. Cloning and sequence analysis of cDNA for porcine β-neo-endorphin/dynorphinprecursor. Nature 1982, 298, 245–249. [CrossRef]
19. Peciña, M.; Karp, J.F.; Mathew, S.; Todtenkopf, M.S.; Ehrich, E.W.; Zubieta, J.-K. Endogenous opioid systemdysregulation in depression: Implications for new therapeutic approaches. Mol. Psychiatry 2019, 24, 576–587.[CrossRef]
20. Su, T.P. Evidence for sigma opioid receptor: Binding of [3H]SKF-10047 to etorphine-inaccessible sites inguinea-pig brain. J. Pharmacol. Exp. Ther. 1982, 223, 284–290.
21. Eriksson, O.; Antoni, G. [11C]Carfentanil binds preferentially to mu-opioid receptor subtype 1 compared tosubtype 2. Mol. Imaging 2015, 14, 476–483. [CrossRef] [PubMed]
22. Zhu, W.; Ma, Y.; Bell, A.; Esch, T.; Guarna, M.; Bilfinger, T.V.; Bianchi, E.; Stefano, G.B. Presence of morphinein rat amygdala: Evidence for the mu3 opiate receptor subtype via nitric oxide release in limbic structures.Med. Sci. Monit. 2004, 10, 433–439.
23. Witkin, J.M.; Rorick-Kehn, L.M.; Benvenga, M.J.; Adams, B.L.; Gleason, S.D.; Knitowski, K.M.; Li, X.;Chaney, S.; Falcone, J.F.; Smith, J.W.; et al. Preclinical findings predicting efficacy and side-effect profile ofLY2940094, an antagonist of nociceptin receptors. Pharma Res. Per. 2016, 4, e00275. [CrossRef] [PubMed]
24. Janson, W.; Stein, C. Peripheral opioid analgesia. Curr. Pharm. Biotechnol. 2003, 4, 270–274. [CrossRef][PubMed]
25. Mansour, A.; Fox, C.A.; Akil, H.; Watson, S.J. Opioid-receptor mRNA expression in the rat CNS: Anatomicaland functional implications. Trends Neurosci. 1995, 18, 22–29. [CrossRef]
171
Molecules 2019, 24, 4190
26. Atweh, S.F.; Kuhar, M.J. Distribution and physiological significance of opioid receptors in the brain. Br. Med.Bull. 1983, 39, 47–52. [CrossRef]
27. Benyhe, S.; Zádor, F.; Ötvös, F. Biochemistry of opioid (morphine) receptors: Binding, structure and molecularmodelling. Acta Biol. Szeged 2015, 59 (Suppl. 1), 17–37.
28. Meng, F.; Xie, G.X.; Thompson, R.C.; Mansour, A.; Goldstein, A.; Watson, S.J.; Akil, H. Cloning andpharmacological characterization of a rat kappa opioid receptor. Proc. Natl. Acad. Sci. USA 1993, 90,9954–9958. [CrossRef]
29. Simonin, F.; Gavériaux-Ruff, C.; Befort, K.; Matthes, H.; Lannes, B.; Micheletti, G.; Mattéi, M.G.; Charron, G.;Bloch, B.; Kieffer, B. kappa-Opioid receptor in humans: cDNA and genomic cloning, chromosomal assignment,functional expression, pharmacology, and expression pattern in the central nervous system. Proc. Natl. Acad.Sci. USA 1995, 92, 7006–7010. [CrossRef]
30. Zhu, J.; Chen, C.; Xue, J.-C.; Kunapuli, S.; DeRiel, J.K.; Liu-Chen, L.-Y. Cloning of a human kappa opioidreceptor from the brain. Life Sci. 1995, 56, 201–207. [CrossRef]
31. Witkin, J.M.; Statnick, M.A.; Rorick-Kehn, L.M.; Pintar, J.E.; Ansonoff, M.; Chen, Y.; Tucker, R.C.;Ciccocioppo, R. The biology of Nociceptin/Orphanin FQ (N/OFQ) related to obesity, stress, anxiety, mood,and drug dependence. Pharmacol. Ther. 2014, 141, 283–299. [CrossRef] [PubMed]
32. Pert, C.B.; Kuhar, M.J.; Snyder, S.H. Autoradiograhic localization of the opiate receptor in rat brain. Life Sci.1975, 16, 1849–1853. [CrossRef]
33. Pert, C.B.; Snyder, S.H. Identification of opiate receptor binding in intact animals. Life Sci. 1975, 16, 1623–1634.[CrossRef]
34. Hu, X.; Wang, Y.; Hunkele, A.; Provasi, D.; Pasternak, G.W.; Filizola, M. Kinetic and thermodynamic insightsinto sodium ion translocation through the μ-opioid receptor from molecular dynamics and machine learninganalysis. PLoS Comput. Biol. 2019, 15, e1006689. [CrossRef] [PubMed]
35. Blanchard, S.G.; Lee, P.H.; Pugh, W.W.; Hong, J.S.; Chang, K.J. Characterization of the binding of a morphine(mu) receptor-specific ligand: Tyr-Pro-NMePhe-D-Pro-NH2, [3H]-PL17. Mol. Pharmacol. 1987, 31, 326–333.
36. Pert, C.B.; Danks, J.A.; Channing, M.A.; Eckelman, W.C.; Larson, S.M.; Bennett, J.M.; Burke, T.R.J.; Rice, K.C.3-[18F]Acetylcyclofoxy: A useful probe for the visualization of opiate receptors in living animals. FEBS Lett.1984, 177, 281–286. [CrossRef]
37. Larson, S.M.; Di Chiro, G. Comparative anatomo-functional imaging of two neuroreceptors and glucosemetabolism: A PET study performed in the living baboon. J. Comput. Assist. Tomogr. 1985, 9, 676–681.[CrossRef]
38. Rothman, R.B.; Bykov, V.; Reid, A.; De Costa, B.R.; Newman, A.H.; Jacobson, A.E.; Rice, K.C. A brief studyof the selectivity of norbinaltorphimine, (−)-cyclofoxy, and (+)-cyclofoxy among opioid receptor subtypesin vitro. Neuropeptides 1988, 12, 181–187. [CrossRef]
39. Ostrowski, N.L.; Burke, T.R.J.; Rice, K.C.; Pert, A.; Pert, C.B. The pattern of [3H]cyclofoxy retention in ratbrain after in vivo injection corresponds to the in vitro opiate receptor distribution. Brain Res. 1987, 402,275–286. [CrossRef]
40. Rothman, R.; McLean, S.; Bykov, V.; Lessor, R.A.; Jacobson, A.E.; Rice, K.C.; Holaday, J.W. Chronic morphineupregulates a mu-opiate binding site labeled by [3H]cycloFOXY: A novel opiate antagonist suitable forpositron emission tomography. Eur. J. Pharmacol. 1987, 142, 73–81. [CrossRef]
41. Kawai, R.; Carson, R.E.; Dunn, B.; Newman, A.H.; Rice, K.C.; Blasberg, R.G. Regional brain measurement ofBmax and KD with the opiate antagonist cyclofoxy: Equilibrium studies in the conscious rat. J. Cereb. BloodFlow. Metab. 1991, 11, 529–544. [CrossRef] [PubMed]
42. Hartvig, P.; Bergström, K.; Lindberg, B.; Lundberg, P.O.; Lundqvist, H.; Långström, B.; Svärd, H.; Rane, A.Kinetics of 11C-labeled opiates in the brain of rhesus monkeys. J. Pharmacol. Exp. Ther. 1984, 230, 250–255.[PubMed]
43. Hartvig, P.; Eckernäs, S.A.; Lindberg, B.S.; Lundqvist, H.; Antoni, G.; Rimland, A.; Långström, B. Regionaldistribution of the opioid receptor agonist N-(methyl-11C)pethidine in the brain of the rhesus monkey studiedwith positron emission tomography. Pharmacol. Toxicol. 1990, 66, 37–40. [CrossRef] [PubMed]
44. Sai, K.K.; Fan, J.; Tu, Z.; Zerkel, P.; Mach, R.H.; Kharasch, E.D. Automated radiochemical synthesis andbiodistribution of [
11C]l-α-acetylmethadol ([11C]LAAM). Appl. Radiat. Isot. 2014, 91, 135–140. [CrossRef]
172

Molecules 2019, 24, 4190
45. Weerts, E.M.; Kim, Y.K.; Wand, G.S.; Dannals, R.F.; Lee, J.S.; Frost, J.J.; McCaul, M.E. Differences in delta- andmu-opioid receptor blockade measured by positron emission tomography in naltrexone-treated recentlyabstinent alcohol-dependent subjects. Neuropsychopharmacology 2008, 33, 653–665. [CrossRef]
46. Johansson, J.; Hirvonen, J.; Lovró, Z.; Ekblad, L.; Kaasinen, V.; Rajasilta, O.; Helin, S.; Tuisku, J.; Sirén, S.;Pennanen, M.; et al. Intranasal naloxone rapidly occupies brain mu-opioid receptors in human subjects.Neuropsychopharmacology 2019, 44, 1667–1673. [CrossRef]
47. Lewis, J.W. Buprenorphine. Drug Alcohol Depen. 1985, 14, 363–372. [CrossRef]48. Lewis, J.W.; Husbands, S.M. The orvinols and related opioids—High affinity ligands with diverse efficacy
profiles. Curr. Pharm. Des. 2004, 10, 717–732. [CrossRef]49. Husbands, S.M. Buprenorphine and related orvinols. In Research and Development of Opioid-Related Ligands;
ACS Symposium Series; Ko, M.-C., Husbands, S.M., Eds.; American Chemical Society: Washington, DC,USA, 2013; Volume 1131, pp. 127–144.
50. Cami-Kobeci, G.; Polgar, W.E.; Khroyan, T.V.; Toll, L.; Husbands, S.M. Structural determinants of opioid andNOP receptor activity in aerivatives of buprenorphine. J. Med. Chem. 2011, 54, 6531–6537. [CrossRef]
51. Borsodi, A.; Bruchas, M.; Caló, G.; Chavkin, C.; Christie, M.J.; Civelli, O.; Connor, M.; Cox, B.M.; Devi, L.A.;Evans, C.; et al. Opioid receptors (version 2019.4) in the IUPHAR/BPS Guide to Pharmacology Database. InIUPHAR/BPS Guide to Pharmacology CITE, 2019(4); 2019. [CrossRef]
52. Stefanucci, A.; Lei, W.; Pieretti, S.; Novellino, E.; Dimmito, M.P.; Marzoli, F.; Streicher, J.M.; Mollica, A. Onresin click-chemistry-mediated synthesis of novel enkephalin analogues with potent anti-nociceptive activity.Sci. Rep. 2019, 9, 5771. [CrossRef]
53. Corbett, A.D.; Paterson, S.J.; Kosterlitz, H.W. Selectivity of ligands for opioid receptors. In Handbook ofExperimental Pharmacology Opioids I; Herz, A., Ed.; Springer-Verlag: New York, NY, USA, 1993; Volume 104/1,pp. 645–679.
54. Zhang, S.; Tong, Y.; Tian, M.; Dehaven, R.N.; Cortesburgos, L.; Mansson, E.; Simonin, F.; Kieffer, B.; Yu, L.Dynorphin A as a potential endogenous ligand for four members of the opioid receptor gene family. J.Pharmacol. Exp. Ther. 1998, 286, 136–141. [PubMed]
55. Valenzano, K.J.; Miller, W.; Chen, Z.; Shan, S.; Crumley, G.; Victory, S.F.; Davies, E.; Huang, J.-C.; Allie, N.;Nolan, S.J.; et al. DiPOA ([8-(3,3-Diphenyl-propyl)-4-oxo-1-phenyl-1,3,8-triazaspiro[4.5]dec-3-yl]-acetic acid),a novel, systemically available, and peripherally restricted mu-opioid agonist with antihyperalgesic activity:I. In vitro pharmacological characterization and pharmacokinetic properties. J. Pharmacol. Exp. Ther. 2004,310, 783–792. [PubMed]
56. Miyazaki, T.; Choi, I.Y.; Rubas, W.; Anand, N.K.; Ali, C.; Evans, J.; Gursahani, H.; Hennessy, M.; Kim, G.;McWeeney, D.; et al. NKTR-181: A novel mu-opioid analgesic with inherently low abuse potential. J.Pharmacol. Exp. Ther. 2017, 363, 104–113. [CrossRef] [PubMed]
57. Zheng, M.Q.; Nabulsi, N.; Kim, S.J.; Tomasi, G.; Lin, S.F.; Mitch, C.; Quimby, S.; Barth, V.; Rash, K.; Masters, J.;et al. Synthesis and evaluation of 11C-LY2795050 as a kappa-opioid receptor antagonist radiotracer for PETimaging. J. Nucl. Med. 2013, 54, 455–463. [CrossRef]
58. Henriksen, G.; Platzer, S.; Marton, J.; Hauser, A.; Berthele, A.; Schwaiger, M.; Marinelli, L.; Lavecchia, A.;Novellino, E.; Wester, H.-J. Syntheses, biological evaluation, and molecular modeling of 18F-labeled4-anilidopiperidines as μ-opioid receptor imaging agents. J. Med. Chem. 2005, 48, 7720–7732. [CrossRef]
59. Frost, J.J.; Wagner, H.N.J.; Dannals, R.F.; Ravert, H.T.; Links, J.M.; Wilson, A.A.; Burns, H.D.; Wong, D.F.;McPherson, R.W.; Rosenbaum, A.E.; et al. Imaging opiate receptors in the human brain by positrontomography. J. Comput. Assist. Tomogr. 1985, 9, 231–236. [CrossRef]
60. Cometta-Morini, C.; Maguire, P.A.; Loew, G.H. Molecular determinants of mu receptor recognition for thefentanyl class of compounds. Mol. Pharmacol. 1992, 41, 185–196.
61. Raynor, K.; Kong, H.; Chen, Y.; Yasuda, K.; Yu, L.; Bell, G.I.; Reisine, T. Pharmacological characterization ofthe cloned kappa-, delta-, and mu-opioid receptors. Mol. Pharmacol. 1994, 45, 330–334.
62. Marton, J.; Schoultz, B.W.; Hjørnevik, T.; Drzezga, A.; Yousefi, B.H.; Wester, H.-J.; Willoch, F.; Henriksen, G.Synthesis and evaluation of a full-agonist orvinol for PET-Imaging of opioid receptors: [11C]PEO. J. Med.Chem. 2009, 52, 5586–5589. [CrossRef]
173

Molecules 2019, 24, 4190
63. Schoultz, B.W.; Hjørnevik, T.; Reed, B.J.; Marton, J.; Coello, C.S.; Willoch, F.; Henriksen, G.Synthesis and evaluation of three structurally related 18F-labeled orvinols of different intrinsic activities:6-O-[18F]Fluoroethyl-diprenorphine ([18F]FDPN), 6-O-[18F]fluoroethyl-buprenorphine ([18F]FBPN), and6-O-[18F]fluoroethyl-phenethyl-orvinol ([18F]FPEO). J. Med. Chem. 2014, 57, 5464–5469.
64. Portoghese, P.S.; Sultana, M.; Takemori, A.E. Design of peptidomimetic delta opioid receptor antagonistsusing the message-address concept. J. Med. Chem. 1990, 33, 1714–1720. [CrossRef] [PubMed]
65. Schoultz, B.W.; Hjornevik, T.; Willoch, F.; Marton, J.; Noda, A.; Murakami, Y.; Miyoshi, S.; Nishimura, S.;Arstad, E.; Drzezga, A.; et al. Evaluation of the kappa-opioid receptor-selective tracer [11C]GR103545 inawake rhesus macaques. Eur. J. Nucl. Med. Mol. Imaging 2010, 37, 1174–1180. [CrossRef] [PubMed]
66. Zheng, M.-Q.; Kim, S.J.; Holden, D.; Lin, S.-F.; Need, A.; Rash, K.; Barth, V.; Mitch, C.; Navarro, A.; Kapinos, M.;et al. An improved antagonist radiotracer for the kappa-opioid receptor: Synthesis and characterization of11C-LY2459989. J. Nucl. Med. 2014, 55, 1185–1191. [CrossRef] [PubMed]
67. Li, S.; Zheng, M.-Q.; Naganawa, M.; Gao, H.; Pracitto, R.; Shirali, A.; Lin, S.-F.; Teng, J.-K.; Ropchan, J.;Huang, Y. Novel kappa opioid receptor agonist as improved PET radiotracer: Development and in vivoevaluation. Mol. Pharm. 2019, 16, 1523–1531. [CrossRef] [PubMed]
68. Li, S.; Zheng, M.-Q.; Naganawa, M.; Kim, S.J.; Gao, H.; Kapinos, M.; Labaree, D.; Huang, Y. Developmentand in vivo evaluation of a kappa-opioid receptor agonist as a PET radiotracer with superior imagingcharacteristics. J. Nucl. Med. 2019, 60, 1023–1030. [CrossRef]
69. Poisnel, G.; Oueslati, F.; Dhilly, M.; Delamare, J.; Perrio, C.; Debruyne, D.; Barré, L. [11C]-MeJDTic: A novelradioligand for kappa-opioid receptor positron emission tomography imaging. Nucl. Med. Biol. 2008, 35,561–569. [CrossRef]
70. Harding, W.W.; Tidgewell, K.; Byrd, N.; Cobb, H.; Dersch, C.M.; Butelman, E.R.; Rothman, R.B.; Prisinzano, T.E.Neoclerodane diterpenes as a novel scaffold for mu opioid receptor ligands. J. Med. Chem. 2005, 48, 4765–4771.[CrossRef]
71. Pike, V.W.; Rash, K.S.; Chen, Z.; Pedregal, C.; Statnick, M.A.; Kimura, Y.; Hong, J.S.; Zoghbi, S.S.; Fujita, M.;Toledo, M.A.; et al. Synthesis and evaluation of radioligands for imaging brain nociceptin/orphanin FQpeptide (NOP) receptors with positron emission tomography. J. Med. Chem. 2011, 54, 2687–2700. [CrossRef]
72. Hostetler, E.D.; Sanabria-Bohórquez, S.; Eng, W.; Joshi, A.D.; Patel, S.; Gibson, R.E.; O’Malley, S.; Krause, S.M.;Ryan, C.; Riffel, K.; et al. Evaluation of [18F]MK-0911, a positron emission tomography (PET) tracer foropioid receptor-like 1 (ORL1), in rhesus monkey and human. NeuroImage 2013, 68, 1–10. [CrossRef]
73. Luthra, S.K.; Pike, V.W.; Brady, F.; Horlock, P.L.; Prenant, C.; Crouzel, C. Preparation of [11C]buprenorphine—Apotential radioligand for the study of the opiate receptor system in vivo. Int. J. Radiat. Appl. Instrum. Part AAppl. Radiat. Isot. 1987, 38, 65–66. [CrossRef]
74. Luthra, S.K.; Pike, V.W.; Brady, F. The preparation of carbon-11 labelled diprenorphine: A new radioligandfor the study of the opiate receptor system in vivo. J. Chem. Soc. Chem. Commun. 1985, 20, 1423–1425.[CrossRef]
75. Lever, J.R.; Mazza, S.M.; Dannals, R.F.; Ravert, H.T.; Wilson, A.A.; Wagner, H.N. Facile synthesis of[11C]buprenorphine for positron emission tomographic studies of opioid receptors. Int. J. Radiat. Appl.Instrum. Part A Appl. Radiat. Isot. 1990, 41, 745–752. [CrossRef]
76. Luthra, S.K.; Brady, F.; Turton, D.R.; Brown, D.J.; Dowsett, K.; Waters, S.L.; Jones, A.K.P.;Matthews, R.W.; Crowder, J.C. Automated radiosyntheses of [6-O-methyl-11C]diprenorphine and[6-O-methyl-11C]buprenorphine from 3-O-trityl protected precursors. Appl. Radiat. Isot. 1994, 45, 857–873.[CrossRef]
77. Burns, H.D.; Lever, J.R.; Dannals, R.F.; Frost, J.J.; Wilson, A.A.; Ravert, H.T.; Subramanian, B.; Zeyman, S.E.;Langstrom, B.; Wagner, H.N., Jr. Synthesis of ligands for imaging opiate receptors by positron emissiontomography: Carbon-11 labelled diprenorphine. J. Label. Compd. Radiopharm. 1984, 22, 1167–1169.
78. Lever, J.R.; Dannals, R.F.; Wilson, A.A.; Ravert, H.T.; Wagner, H.N. Synthesis of carbon-11 labeleddiprenorphine: A radioligand for positron emission tomographic studies of opiate receptors. TetrahedronLett. 1987, 28, 4015–4018. [CrossRef]
79. Fairclough, M.; Prenant, C.; Brown, G.; McMahon, A.; Lowe, J.; Jones, A. The automated radiosynthesis andpurification of the opioid receptor antagonist, [6-O-methyl-11C]diprenorphine on the GE TRACERlab FXFEradiochemistry module. J. Label. Compd. Radiopharm. 2014, 57, 388–396. [CrossRef]
174

Molecules 2019, 24, 4190
80. Galynker, I.; Schlyer, D.J.; Dewey, S.L.; Fowler, J.S.; Logan, J.; Gatley, S.J.; MacGregor, R.R.;Ferrieri, R.A.; Holland, M.J.; Brodie, J.; et al. Opioid receptor imaging and displacement studies with[6-O-[11C]methyl]buprenorphine in baboon brain. Nucl. Med. Biol. 1996, 23, 325–331. [CrossRef]
81. Zubieta, J.; Greenwald, M.K.; Lombardi, U.; Woods, J.H.; Kilbourn, M.R.; Jewett, D.M.; Koeppe, R.A.;Schuster, C.R.; Johanson, C.E. Buprenorphine-induced changes in mu-opioid receptor availability in maleheroin-dependent volunteers: A preliminary study. Neuropsychopharmacology 2000, 23, 326–334. [CrossRef]
82. Melichar, J.K.; Hume, S.P.; Williams, T.M.; Daglish, M.R.; Taylor, L.G.; Ahmad, R.; Malizia, A.L.; Brooks, D.J.;Myles, J.S.; Lingford-Hughes, A.; et al. Using [11C]diprenorphine to image opioid receptor occupancy bymethadone in opioid addiction: Clinical and preclinical studies. J. Pharmacol. Exp. Ther. 2005, 312, 309–315.[CrossRef]
83. Frost, J.J.; Mayberg, H.S.; Sadzot, B.; Dannals, R.F.; Lever, J.R.; Ravert, H.T.; Wilson, A.A.; Wagner, H.N.J.;Links, J.M. Comparison of [11C]diprenorphine and [11C]carfentanil binding to opiate receptors in humansby positron emission tomography. J. Cereb. Blood Flow. Metab. 1990, 10, 484–492. [CrossRef]
84. Schadrack, J.; Willoch, F.; Platzer, S.; Bartenstein, P.; Mahal, B.; Dworzak, D.; Wester, H.J.; Zieglgänsberger, W.;Tölle, T.R. Opioid receptors in the human cerebellum: Evidence from [11C]diprenorphine PET, mRNAexpression and autoradiography. Neuroreport 1999, 10, 619–624. [CrossRef] [PubMed]
85. Wester, H.-J.; Willoch, F.; Tölle, T.R.; Munz, F.; Herz, M.; Øye, I.; Schadrack, J.; Schwaiger, M.; Bartenstein, P.6-O-(2-[18F]Fluoroethyl-6-O-desmethyldiprenorphine ([18F]DPN): Synthesis, biologic evaluation, andcomparison with [11C]DPN in humans. J. Nucl. Med. 2000, 41, 1279–1286. [PubMed]
86. Schoultz, B.W.; Reed, B.J.; Marton, J.; Willoch, F.; Henriksen, G. A fully automated radiosynthesis of[18F]fluoroethyl-diprenorphine on a single module by use of SPE cartridges for preparation of high quality2-[18F]fluoroethyl tosylate. Molecules 2013, 18, 7271–7278. [CrossRef] [PubMed]
87. Baumgärtner, U.; Buchholz, H.G.; Bellosevich, A.; Magerl, W.; Siessmeier, T.; Rolke, R.; Höhnemann, S.;Piel, M.; Rösch, F.; Wester, H.J.; et al. High opiate receptor binding potential in the human lateral pain system.NeuroImage 2006, 30, 692–699. [CrossRef]
88. Henriksen, G.; Spilker, M.E.; Sprenger, T.; Hauser, A.; Platzer, S.; Boecker, H.; Toelle, T.R.;Schwaiger, M.; Wester, H.J. Gender dependent rate of metabolism of the opioid receptor-PET ligand[18F]fluoroethyldiprenorphine. Nuklearmedizin 2006, 45, 197–200.
89. Vuckovic, S.; Prostran, M.; Ivanovic, M.; Došen-Micovic, L.; Todorovic, Z.; Nešic, Z.; Stojanovic, R.; Divac, N.;Mikovic, Ž. Fentanyl analogs: Stuctrure-activity-relationship study. Curr. Med. Chem. 2009, 16, 2468–2474.[CrossRef]
90. Vardanyan, R.S.; Hruby, V.J. Fentanyl-related compounds and derivatives: Current status and futureprospects for pharmaceutical applications. Future Med. Chem. 2014, 6, 385–412. [CrossRef]
91. Van Daele, P.G.; De Bruyn, M.F.; Boey, J.M.; Sanczuk, S.; Agten, J.T.; Janssen, P.A. Synthetic analgesics:N-(1-[2-arylethyl]-4-substituted 4-piperidinyl) N-arylalkanamides. Arzneim. Forsch. Drug Res. 1976, 26,1521–1531.
92. Dannals, R.F.; Ravert, H.T.; Frost, J.J.; Wilson, A.A.; Burns, H.D.; Wagner, H.N.J. Radiosynthesis of an opiatereceptor binding radiotracer: [11C]carfentanil. Int. J. Appl. Isot. 1985, 36, 303–306. [CrossRef]
93. Jewett, D.M.; Kilbourn, M.R. In vivo evaluation of new carfentanil-based radioligands for the mu opiatereceptor. Nucl. Med. Biol. 2004, 31, 321–325. [CrossRef]
94. Shafer, S.L. Carfentanil: A weapon of mass destruction. Can. J. Anesth. 2019, 66, 351–355. [CrossRef][PubMed]
95. Frost, J.J.; Douglass, K.H.; Mayberg, H.S.; Dannals, R.F.; Links, J.M.; Wilson, A.A.; Ravert, H.T.; Crozier, W.C.;Wagner, H.N.J. Multicompartmental analysis of [11C]-carfentanil binding to opiate receptors in humansmeasured by positron emission tomography. J. Cereb. Blood Flow. Metab. 1989, 9, 398–409. [CrossRef][PubMed]
96. Hirvonen, J.; Aalto, S.; Hagelberg, N.; Maksimow, A.; Ingman, K.; Oikonen, V.; Virkkala, J.; Någren, K.;Scheinin, H. Measurement of central mu-opioid receptor binding in vivo with PET and [11C]carfentanil: Atest-retest study in healthy subjects. Eur. J. Nucl. Med. Mol. Imaging 2009, 36, 275–286. [CrossRef] [PubMed]
97. Bentley, K.W.; Hardy, D.G. Novel analgesics and molecular rearrangements in the morphine-thebaine group.III. Alcohols of the 6,14-endo-ethenotetrahydrooripavine series and derived analogs of N-allylnormorphineand -norcodeine. J. Am. Chem. Soc. 1967, 89, 3281–3292. [CrossRef]
175

Molecules 2019, 24, 4190
98. Marton, J.; Henriksen, G. Design and synthesis of an 18F-labeled version of phenylethyl orvinol ([18F]FE-PEO)for PET-imaging of opioid receptors. Molecules 2012, 17, 11554–11569. [CrossRef]
99. Riss, P.J.; Hong, Y.T.; Marton, J.; Caprioli, D.; Williamson, D.J.; Ferrari, V.; Saigal, N.; Roth, B.L.; Henriksen, G.;Fryer, T.D.; et al. Synthesis and evaluation of 18F-FE-PEO in rodents: An 18F-labeled full agonist for opioidreceptor imaging. J. Nucl. Med. 2013, 54, 299–305. [CrossRef]
100. Lever, J.R.; Kinter, C.M.; Ravert, H.T.; Musachio, J.L.; Mathews, W.B.; Dannals, R.F. Synthesis ofN1′-([11C]methyl)naltrindole ([11C]MeNTI): A radioligand for positron emission tomographic studiesof delta opioid receptors. J. Label. Compd. Radiopharm. 1995, 36, 137–145. [CrossRef]
101. Madar, I.; Lever, J.R.; Kinter, C.M.; Scheffel, U.; Ravert, H.T.; Musachio, J.L.; Mathews, W.B.; Dannals, R.F.;Frost, J.J. Imaging of delta opioid receptors in human brain by N1′-([11C]methyl)naltrindole and PET. Synapse1996, 24, 19–28. [CrossRef]
102. Smith, J.S.; Zubieta, J.K.; Price, J.C.; Flesher, J.E.; Madar, I.; Lever, J.R.; Kinter, C.M.; Dannals, R.F.; Frost, J.J.Quantification of delta-opioid receptors in human brain with N1′-([11C]methyl) naltrindole and positronemission tomography. J. Cereb. Blood Flow. Metab. 1999, 19, 956–966. [CrossRef]
103. Mathews, W.B.; Kinter, C.M.; Palma, J.; Daniels, R.V.; Ravert, H.T.; Dannals, R.F.; Lever, J.R. Synthesis ofN1′-([18F]fluoroethyl)naltrindole ([18F]FEtNTI): A radioligand for positron emission tomographic studies ofdelta opioid receptors. J. Label. Compd. Radiopharm. 1999, 42, 43–54. [CrossRef]
104. Tyacke, R.J.; Robinson, E.S.; Schnabel, R.; Lewis, J.W.; Husbands, S.M.; Nutt, D.J.; Hudson, A.L.N1′-fluoroethyl-naltrindole (BU97001) and N1′-fluoroethyl-(14-formylamino)-naltrindole (BU97018)potential delta-opioid receptor PET ligands. Nucl. Med. Biol. 2002, 29, 455–462. [CrossRef]
105. Bourdier, T.; Poisnel, G.; Dhilly, M.; Delamare, J.; Henry, J.; Debruyne, D.; Barré, L. Synthesis and biologicalevaluation of N-substituted quinolinimides, as potential ligands for in vivo imaging studies of delta-opioidreceptors. Bioconj. Chem. 2007, 18, 538–548. [CrossRef] [PubMed]
106. Hayes, A.G.; Birch, P.J.; Hayward, N.J.; Sheehan, M.J.; Rogers, H.; Tyers, M.B.; Judd, D.B.; Scopes, D.I.C.;Naylor, A. A series of novel, highly potent and selective agonists for the kappa-opioid receptor. Br. J.Pharmacol. 1990, 101, 944–948. [CrossRef]
107. Birch, P.J.; Rogers, H.; Hayes, A.G.; Hayward, N.J.; Tyers, M.B.; Scopes, D.I.C.; Naylor, A.; Judd, D.B.Neuroprotective actions of GR89696, a highly potent and selective κ-opioid receptor agonist. Br. J. Pharmacol.1991, 103, 1819–1823. [CrossRef] [PubMed]
108. Naylor, A.; Judd, D.B.; Lloyd, J.E.; Scopes, D.I.C.; Hayes, A.G.; Birch, P.J. A potent new class of kappa-receptoragonist: 4-substituted 1-(arylacetyl)-2-[(dialkylamino)methyl]piperazines. J. Med. Chem. 1993, 36, 2075–2083.[CrossRef] [PubMed]
109. Ravert, H.T.; Mathews, W.B.; Musachio, J.L.; Scheffel, U.; Finley, P.; Dannals, R.F. [11C]-methyl4-[(3,4-dichlorophenyl)acetyl]-3-[(1-pyrrolidinyl)methyl]-1-piperazinecarboxylate ([11C]GR89696): Synthesisand in vivo binding to kappa opiate receptors. Nucl. Med. Biol. 1999, 26, 737–741. [CrossRef]
110. Ravert, H.T.; Scheffel, U.; Mathews, W.B.; Musachio, J.L.; Dannals, R.F. [11C]-GR89696, a potent kappa opiatereceptor radioligand; in vivo binding of the R and S enantiomers. Nucl. Med. Biol. 2002, 29, 47–53. [CrossRef]
111. Talbot, P.S.; Narendran, R.; Butelman, E.R.; Huang, Y.; Ngo, K.; Slifstein, M.; Martinez, D.; Laruelle, M.;Hwang, D.R. 11C-GR103545, a radiotracer for imaging kappa-opioid receptors in vivo with PET: Synthesisand evaluation in baboons. J. Nucl. Med. 2005, 46, 484–494.
112. Schoultz, B.W.; Arstad, E.; Marton, J.; Willoch, F.; Drzezga, A.; Wester, H.J.; Henriksen, G. A new method forradiosynthesis of 11C-labeled carbamate groups and its application for a highly efficient synthesis of thekappa-opioid receptor tracer [11C]GR103545. Open Med. Chem. J. 2008, 2, 72–74. [CrossRef]
113. Wilson, A.A.; Gracia, A.; Houle, S.; Vasdev, N. Direct fixation of [11C]-CO2 by amines: Formation of[11C-carbonyl]-methylcarbamates. Org. Biomol. Chem. 2010, 8, 428–432. [CrossRef]
114. Nabulsi, N.B.; Zheng, M.-Q.; Ropchan, J.; Labaree, D.; Ding, Y.-S.; Blumberg, L.; Huang, Y. [11C]GR103545:Novel one-pot radiosynthesis with high specific activity. Nucl. Med. Biol. 2011, 38, 215–221. [CrossRef][PubMed]
115. Tomasi, G.; Nabulsi, N.; Zheng, M.Q.; Weinzimmer, D.; Ropchan, J.; Blumberg, L.; Brown-Proctor, C.;Ding, Y.S.; Carson, R.E.; Huang, Y. Determination of in vivo Bmax and Kd for 11C-GR103545, an agonistPET tracer for kappa-opioid receptors: A study in nonhuman primates. J. Nucl. Med. 2013, 54, 600–608.[CrossRef] [PubMed]
176

Molecules 2019, 24, 4190
116. Naganawa, M.; Jacobsen, L.K.; Zheng, M.-Q.; Lin, S.-F.; Banerjee, A.; Byon, W.; Weinzimmer, D.; Tomasi, G.;Nabulsi, N.; Grimwood, S.; et al. Evaluation of the agonist PET radioligand [11C]GR103545 to image kappaopioid receptor in humans: Kinetic model selection, test–retest reproducibility and receptor occupancy bythe antagonist PF-04455242. NeuroImage 2014, 99, 69–79. [CrossRef] [PubMed]
117. Li, S.; Cai, Z.; Zheng, M.-Q.; Holden, D.; Naganawa, M.; Lin, S.-F.; Ropchan, J.; Labaree, D.; Kapinos, M.;Lara-Jaime, T.; et al. Novel 18F-labeled kappa-opioid receptor antagonist as PET radiotracer: Synthesis andin vivo evaluation of 18F-LY2459989 in nonhuman primates. J. Nucl. Med. 2018, 59, 140–146. [CrossRef]
118. Fichna, J.; Schicho, R.; Janecka, A.; Zjawiony, J.K.; Storr, M. Selective natural kappa opioid and cannabinoidreceptor agonists with a potential role in the treatment of gastrointestinal dysfunction. Drug News Perspect.2009, 22, 383–392. [CrossRef]
119. Butelman, E.R.; Kreek, M.J. Salvinorin A, a kappa-opioid receptor agonist hallucinogen: Pharmacology andpotential template for novel pharmacotherapeutic agents in neuropsychiatric disorders. Front. Pharmacol.2015, 6, 190.
120. Zjawiony, J.K.; Machado, A.S.; Menegatti, R.; Ghedini, P.C.; Costa, E.A.; Pedrino, G.R.; Lukas, S.E.;Franco, O.L.; Silva, O.N.; Fajemiroye, J.O. Cutting-edge search for safer opioid pain relief: Retrospectivereview of Salvinorin A and its analogs. Front. Psychiatry 2019, 10(157), 1–11. [CrossRef]
121. Hooker, J.M.; Xu, Y.; Schiffer, W.; Shea, C.; Carter, P.; Fowler, J.S. Pharmacokinetics of the potent hallucinogen,salvinorin A in primates parallels the rapid onset and short duration of effects in humans. NeuroImage 2008,41, 1044–1050. [CrossRef]
122. Placzek, M.S.; Van de Bittner, G.C.; Wey, H.Y.; Lukas, S.E.; Hooker, J.M. Immediate and persistent effects ofSalvinorin A on the kappa opioid receptor in rodents, monitored in vivo with PET. Neuropsychopharmacology2015, 40, 2865–2872. [CrossRef]
123. Thomas, J.B.; Atkinson, R.N.; Rothman, R.B.; Fix, S.E.; Mascarella, S.W.; Vinson, N.A.; Xu, H.; Dersch, C.M.;Lu, Y.F.; Cantrell, B.E.; et al. Identification of the first trans-(3R,4R)-dimethyl-4-(3-hydroxyphenyl)piperidinederivative to possess highly potent and selective opioid kappa receptor antagonist activity. J. Med. Chem.2001, 44, 2687–2690. [CrossRef]
124. Schmitt, S.; Delamare, J.; Tirel, O.; Fillesoye, F.; Dhilly, M.; Perrio, C. N-[18F]-FluoropropylJDTic forkappa-opioid receptor PET imaging: Radiosynthesis, pre-clinical evaluation, and metabolic investigation incomparison with parent JDTic. Nucl. Med. Biol. 2017, 44, 50–61. [CrossRef] [PubMed]
125. Kim, S.J.; Zheng, M.Q.; Nabulsi, N.; Labaree, D.; Ropchan, J.; Najafzadeh, S.; Carson, R.E.; Huang, Y.;Morris, E.D. Determination of the in vivo selectivity of a new kappa-opioid receptor antagonist PET tracer11C-LY2795050 in the rhesus monkey. J. Nucl. Med. 2013, 54, 1668–1674. [CrossRef] [PubMed]
126. Naganawa, M.; Zheng, M.Q.; Nabulsi, N.; Tomasi, G.; Henry, S.; Lin, S.F.; Ropchan, J.; Labaree, D.; Tauscher, J.;Neumeister, A.; et al. Kinetic modeling of 11C-LY2795050, a novel antagonist radiotracer for PET imaging ofthe kappa opioid receptor in humans. J. Cereb. Blood Flow. Metab. 2014, 34, 1818–1825. [CrossRef]
127. Naganawa, M.; Zheng, M.-Q.; Henry, S.; Nabulsi, N.; Lin, S.-F.; Ropchan, J.; Labaree, D.; Najafzadeh, S.;Kapinos, M.; Tauscher, J.; et al. Test–Retest Reproducibility of Binding Parameters in Humans with11C-LY2795050, an Antagonist PET Radiotracer for the kappa Opioid Receptor. J. Nucl. Med. 2015, 56,243–248. [CrossRef] [PubMed]
128. Naganawa, M.; Dickinson, G.L.; Zheng, M.-Q.; Henry, S.; Vandenhende, F.; Witcher, J.; Bell, R.; Nabulsi, N.;Lin, S.-F.; Ropchan, J.; et al. Receptor occupancy of the kappa-opioid antagonist LY2456302 measured withpositron emission tomography and the novel radiotracer 11C-LY2795050. J. Pharmacol. Exp. Ther. 2016, 356,260–266. [CrossRef]
129. Placzek, M.S.; Schroeder, F.A.; Che, T.; Wey, H.-Y.; Neelamegam, R.; Wang, C.; Roth, B.L.; Hooker, J.M.Discrepancies in kappa opioid agonist binding revealed through PET Imaging. ACS Chem. Neurosci. 2019,10, 384–395. [CrossRef]
130. Chesis, P.L.; Welch, M.J. Synthesis and in vitro characterization of fluorinated U-50488 analogs for PETstudies of kappa opioid receptors. Int. J. Radiat. Applicat. Instrum. Part A Appl. Radiat. Isot. 1990, 41, 267–273.[CrossRef]
131. Zaveri, N.T. Nociceptin opioid receptor (NOP) as a therapeutic target: Progress in translation from preclinicalresearch to clinical utility. J. Med. Chem. 2016, 59, 7011–7028. [CrossRef]
177

Molecules 2019, 24, 4190
132. Kimura, Y.; Fujita, M.; Hong, J.S.; Lohith, T.G.; Gladding, R.L.; Zoghbi, S.S.; Tauscher, J.A.; Goebl, N.;Rash, K.S.; Chen, Z.; et al. Brain and whole-body imaging in rhesus monkeys of 11C-NOP-1A, a promisingPET radioligand for nociceptin/orphanin FQ peptide receptors. J. Nucl. Med. 2011, 52, 1638–1645. [CrossRef]
133. Lohith, T.G.; Zoghbi, S.S.; Morse, C.L.; Araneta, M.F.; Barth, V.N.; Goebl, N.A.; Tauscher, J.T.; Pike, V.W.;Innis, R.B.; Fujita, M. Brain and whole-body imaging of nociceptin/orphanin FQ peptide receptor in humansusing the PET Ligand 11C-NOP-1A. J. Nucl. Med. 2012, 53, 385–392. [CrossRef]
134. Lohith, T.G.; Zoghbi, S.S.; Morse, C.L.; Araneta, M.D.F.; Barth, V.N.; Goebl, N.A.; Tauscher, J.T.; Pike, V.W.;Innis, R.B.; Fujita, M. Retest imaging of [11C]NOP-1A binding to nociceptin/orphanin FQ peptide (NOP)receptors in the brain of healthy humans. NeuroImage 2014, 87, 89–95. [CrossRef] [PubMed]
135. Raddad, E.; Chappell, A.; Meyer, J.; Wilson, A.A.; Ruegg, C.E.; Tauscher, J.; Statnick, M.A.; Barth, V.; Zhang, X.;Verfaille, S.J. Occupancy of nociceptin/orphanin FQ peptide receptors by the antagonist LY2940094 in ratsand healthy human subjects. Drug Metab. Dispos. 2016, 44, 1536–1542. [CrossRef] [PubMed]
136. Zhang, L.; Drummond, E.; Brodney, M.A.; Cianfrogna, J.; Drozda, S.E.; Grimwood, S.; Vanase-Frawley, M.A.;Villalobos, A. Design, synthesis and evaluation of [3H]PF-7191, a highly specific nociceptin opioid peptide(NOP) receptor radiotracer for in vivo receptor occupancy (RO) studies. Bioorg. Med. Chem. Lett. 2014, 24,5219–5223. [CrossRef] [PubMed]
137. Zubieta, J.K.; Dannals, R.F.; Frost, J.J. Gender and age influences on human brain mu-opioid receptor bindingmeasured by PET. Am. J. Psychiarty 1999, 156, 842–848. [CrossRef] [PubMed]
138. Vijay, A.; Cavallo, D.; Goldberg, A.; de Laat, B.; Nabulsi, N.; Huang, Y.; Krishnan-Sarin, S.; Morris, E.D.PET imaging reveals lower kappa opioid receptor availability in alcoholics but no effect of age.Neuropsychopharmacology 2018, 43, 2539–2547. [CrossRef]
139. Vijay, A.; Wang, S.; Worhunsky, P.; Zheng, M.-Q.; Nabulsi, N.; Ropchan, J.; Krishnan-Sarin, S.; Huang, Y.;Morris, E.D. PET imaging reveals sex differences in kappa opioid receptor availability in humans, in vivo.Am. J. Nucl. Med. Mol. Imaging 2016, 6, 205–214. [PubMed]
140. Mayberg, H.S.; Sadzot, B.; Meltzer, C.C.; Fisher, R.S.; Lesser, R.P.; Dannals, R.F.; Lever, J.R.; Wilson, A.A.;Ravert, H.T.; Wagner, H.N.J.; et al. Quantification of mu and non–mu opiate receptors in temporal lobeepilepsy using positron emission tomography. Ann. Neurol. 1991, 30, 3–11. [CrossRef]
141. Madar, I.; Lesser, R.P.; Krauss, G.; Zubieta, J.K.; Lever, J.R.; Kinter, C.M.; Ravert, H.T.; Musachio, J.L.;Mathews, W.B.; Dannals, R.F.; et al. Imaging of δ- and μ-opioid receptors in temporal lobe epilepsy bypositron emission tomography. Ann. Neurol. 1997, 41, 358–367. [CrossRef]
142. Hammers, A.; Asselin, M.-C.; Hinz, R.; Kitchen, I.; Brooks, D.J.; Duncan, J.S.; Koepp, M.J. Upregulation ofopioid receptor binding following spontaneous epileptic seizures. Brain 2007, 130, 1009–1016. [CrossRef]
143. McGinnity, C.J.; Shidahara, M.; Feldmann, M.; Keihaninejad, S.; Riaño Barros, D.A.; Gousias, I.S.; Duncan, J.S.;Brooks, D.J.; Heckemann, R.A.; Turkheimer, F.E.; et al. Quantification of opioid receptor availability followingspontaneous epileptic seizures: Correction of [11C]diprenorphine PET data for the partial-volume effect.NeuroImage 2013, 79, 72–80. [CrossRef]
144. Koepp, M.J.; Richardson, M.P.; Brooks, D.J.; Duncan, J.S. Focal cortical release of endogenous opioids duringreading induced seizures. Lancet 1998, 352, 952–955. [CrossRef]
145. Cohen, R.M.; Carson, R.E.; Aigner, T.G.; Doudet, D.J. Opiate receptor avidity is reduced in non-motorimpaired MPTP-lesioned rhesus monkeys. Brain Res. 1998, 806, 292–296. [CrossRef]
146. Cohen, R.M.; Carson, R.E.; Wyatt, R.J.; Doudet, D.J. Opiate receptor avidity is reduced bilaterally in rhesusmonkeys unilaterally lesioned with MPTP. Synapse 1999, 33, 282–288. [CrossRef]
147. Piccini, P.; Weeks, R.A.; Brooks, D.J. Alterations in opioid receptor binding in Parkinson’s disease patientswith levodopa-induced dyskinesias. Ann. Neurol. 1997, 42, 720–726. [CrossRef] [PubMed]
148. Whone, A.L.; Von Spiczak, S.; Edwards, M.; Valente, E.-M.; Hammers, A.; Bhatia, K.P.; Brooks, D.J. Opioidbinding in DYT1 primary torsion dystonia: An 11C-diprenorphine PET study. Mov. Dis. 2004, 19, 1498–1503.[CrossRef] [PubMed]
149. Von Spiczak, S.; Whone, A.L.; Hammers, A.; Asselin, M.-C.; Turkheimer, F.; Tings, T.; Happe, S.; Paulus, W.;Trenkwalder, C.; Brooks, D.J. The role of opioids in restless legs syndrome: An [11C]diprenorphine PETstudy. Brain 2005, 128, 906–917. [CrossRef] [PubMed]
150. Weeks, R.A.; Cunningham, V.J.; Piccini, P.; Waters, S.; Harding, A.E.; Brooks, D.J. 11C-Diprenorphine bindingin Huntington’s disease: A comparison of region of interest analysis with statistical parametric mapping. J.Cereb. Blood Flow. Metab. 1997, 17, 943–949. [CrossRef]
178

Molecules 2019, 24, 4190
151. Willoch, F.; Tölle, T.R.; Wester, H.-J.; Munz, F.; Petzold, A.; Schwaiger, M.; Conrad, B.; Bartenstein, P. Centralpain after pontine infarction is associated with changes in opioid receptor binding: A PET study with11C-Diprenorphine. AJNR Am. J. Neuroradiol. 1999, 20, 686–690.
152. Willoch, F.; Schindler, F.; Wester, H.-J.; Empl, M.; Straube, A.; Schwaiger, M.; Conrad, B.; Tölle, T.R. Centralpoststroke pain and reduced opioid receptor binding within pain processing circuitries: A [11C]diprenorphinePET study. Pain 2004, 108, 213–220. [CrossRef]
153. Maarrawi, J.; Peyron, R.; Mertens, P.; Costes, N.; Magnin, M.; Sindou, M.; Laurent, B.; Garcia-Larrea, L.Differential brain opioid receptor availability in central and peripheral neuropathic pain. Pain 2007, 127,183–194. [CrossRef]
154. Campbell, C.M.; Bounds, S.C.; Kuwabara, H.; Edwards, R.R.; Campbell, J.N.; Haythornthwaite, J.A.;Smith, M.T. Individual variation in sleep quality and duration is related to cerebral mu opioid receptorbinding potential during tonic laboratory pain in healthy subjects. Pain Med. 2013, 14, 1882–1892. [CrossRef][PubMed]
155. Bencherif, B.; Fuchs, P.N.; Sheth, R.; Dannals, R.F.; Campbell, J.N.; Frost, J.J. Pain activation of humansupraspinal opioid pathways as demonstrated by [11C]-carfentanil and positron emission tomography (PET).Pain 2002, 99, 589–598. [CrossRef]
156. Sprenger, T.; Valet, M.; Boecker, H.; Henriksen, G.; Spilker, M.E.; Willoch, F.; Wagner, K.J.; Wester, H.J.;Tölle, T.R. Opioidergic activation in the medial pain system after heat pain. Pain 2006, 122, 63–67. [CrossRef][PubMed]
157. Zubieta, J.K.; Smith, Y.R.; Bueller, J.A.; Xu, Y.; Kilbourn, M.R.; Jewett, D.M.; Meyer, C.R.; Koeppe, R.A.;Stohler, C.S. Regional mu opioid receptor regulation of sensory and affective dimensions of pain. Science2001, 293, 311–315. [CrossRef] [PubMed]
158. Zubieta, J.K.; Smith, Y.R.; Bueller, J.A.; Xu, Y.; Kilbourn, M.R.; Jewett, D.M.; Meyer, C.R.; Koeppe, R.A.;Stohler, C.S. Mu-opioid receptor-mediated antinociceptive responses differ in men and women. J. Neurosci.2002, 22, 5100–5107. [CrossRef] [PubMed]
159. DosSantos, M.F.; Martikainen, I.K.; Nascimento, T.D.; Love, T.M.; Deboer, M.D.; Maslowski, E.C.;Monteiro, A.A.; Vincent, M.B.; Zubieta, J.K.; DaSilva, A.F. Reduced basal ganglia mu-opioid receptoravailability in trigeminal neuropathic pain: A pilot study. Mol. Pain 2012, 8, 74. [CrossRef]
160. Scott, D.J.; Stohler, C.S.; Koeppe, R.A.; Zubieta, J.K. Time-course of change in [11C]carfentanil and[11C]raclopride binding potential after a nonpharmacological challenge. Synapse 2007, 61, 707–714. [CrossRef]
161. Hjornevik, T.; Schoultz, B.W.; Marton, J.; Gjerstad, J.; Drzezga, A.; Henriksen, G.; Willoch, F. Spinal long-termpotentiation is associated with reduced opioid neurotransmission in the rat brain. Clin. Physiol. Funct.Imaging 2010, 30, 285–293. [CrossRef]
162. Boecker, H.; Sprenger, T.; Spilker, M.E.; Henriksen, G.; Koppenhoefer, M.; Wagner, K.J.; Valet, M.; Berthele, A.;Tolle, T.R. The runner’s high: Opioidergic mechanisms in the human brain. Cereb. Cortex 2008, 18, 2523–2531.[CrossRef]
163. Saanijoki, T.; Tuominen, L.; Tuulari, J.J.; Nummenmaa, L.; Arponen, E.; Kalliokoski, K.; Hirvonen, J. Opioidrelease after high-intensity interval training in healthy human subjects. Neuropsychopharmacol 2018, 43,246–254. [CrossRef]
164. Maarrawi, J.; Peyron, R.; Mertens, P.; Costes, N.; Magnin, M.; Sindou, M.; Laurent, B.; Garcia-Larrea, L. Motorcortex stimulation for pain control induces changes in the endogenous opioid system. Neurology 2007, 69,827–834. [CrossRef] [PubMed]
165. DosSantos, M.F.; Love, T.M.; Martikainen, I.K.; Nascimento, T.D.; Fregni, F.; Cummiford, C.; Deboer, M.D.;Zubieta, J.K.; DaSilva, A.F. Immediate Effects of tDCS on the mu-opioid system of a chronic pain patient.Front. Psychiatry 2012, 3, 93. [PubMed]
166. Maarrawi, J.; Peyron, R.; Mertens, P.; Costes, N.; Magnin, M.; Sindou, M.; Laurent, B.; Garcia-Larrea, L. Brainopioid receptor density predicts motor cortex stimulation efficacy for chronic pain. Pain 2013, 154, 2563–2568.[CrossRef] [PubMed]
167. Sims-Williams, H.; Matthews, J.C.; Talbot, P.S.; Love-Jones, S.; Brooks, J.C.; Patel, N.K.; Pickering, A.E. Deepbrain stimulation of the periaqueductal gray releases endogenous opioids in humans. NeuroImage 2017, 146,833–842. [CrossRef]
179

Molecules 2019, 24, 4190
168. Ly, H.G.; Dupont, P.; Geeraerts, B.; Bormans, G.; Van Laere, K.; Tack, J.; Van Oudenhove, L. Lack ofendogenous opioid release during sustained visceral pain: A [11C]carfentanil PET study. Pain 2013, 154,2072–2077. [CrossRef]
169. Baier, B.; Bense, S.; Birklein, F.; Buchholz, H.-G.; Mischke, A.; Schreckenberger, M.; Dieterich, M. Evidence formodulation of opioidergic activity in central vestibular processing: A [18F] diprenorphine PET study. Hum.Brain Mapp. 2010, 31, 550–555. [CrossRef]
170. Wager, T.D.; Scott, D.J.; Zubieta, J.K. Placebo effects on human mu-opioid activity during pain. Proc. Natl.Acad. Sci. USA 2007, 104, 11056–11061. [CrossRef]
171. DosSantos, M.F.; Martikainen, I.K.; Nascimento, T.D.; Love, T.M.; DeBoer, M.D.; Schambra, H.M.; Bikson, M.;Zubieta, J.K.; DaSilva, A.F. Building up analgesia in humans via the endogenous mu-opioid system bycombining placebo and active tDCS: A preliminary report. PLoS ONE 2014, 9, e102350. [CrossRef]
172. Dougherty, D.D.; Kong, J.; Webb, M.; Bonab, A.A.; Fischman, A.J.; Gollub, R.L. A combined [11C]diprenorphinePET study and fMRI study of acupuncture analgesia. Behav. Brain Res. 2008, 193, 63–68. [CrossRef]
173. Harris, R.E.; Zubieta, J.K.; Scott, D.J.; Napadow, V.; Gracely, R.H.; Clauw, D.J. Traditional Chinese acupunctureand placebo (sham) acupuncture are differentiated by their effects on mu-opioid receptors (MORs). NeuroImage2009, 47, 1077–1085. [CrossRef]
174. Xiang, X.-H.; Chen, Y.-M.; Zhang, J.-M.; Tian, J.-H.; Han, J.-S.; Cui, C.-L. Low- and high-frequencytranscutaneous electrical acupoint stimulation induces different effects on cerebral mu-opioid receptoravailability in rhesus monkeys. J. Neurosci. Res. 2014, 92, 555–563. [CrossRef] [PubMed]
175. Mueller, C.; Klega, A.; Buchholz, H.-G.; Rolke, R.; Magerl, W.; Schirrmacher, R.; Schirrmacher, E.; Birklein, F.;Treede, R.-D.; Schreckenberger, M. Basal opioid receptor binding is associated with differences in sensoryperception in healthy human subjects: A [18F]diprenorphine PET study. NeuroImage 2010, 49, 731–737.[CrossRef] [PubMed]
176. Hagelberg, N.; Aalto, S.; Tuominen, L.; Pesonen, U.; Någren, K.; Hietala, J.; Scheinin, H.; Pertovaara, A.;Martikainen, I.K. Striatal mu-opioid receptor availability predicts cold pressor pain threshold in healthyhuman subjects. Neurosci. Lett. 2012, 521, 11–14. [CrossRef] [PubMed]
177. Thompson, S.J.; Pitcher, M.H.; Stone, L.S.; Tarum, F.; Niu, G.; Chen, X.; Kiesewetter, D.O.; Schweinhardt, P.;Bushnell, M.C. Chronic neuropathic pain reduces opioid receptor availability with associated anhedonia inrat. Pain 2018, 159, 1856–1866. [CrossRef] [PubMed]
178. Sprenger, T.; Willoch, F.; Miederer, M.; Schindler, F.; Valet, M.; Berthele, A.; Spilker, M.E.; Förderreuther, S.;Straube, A.; Stangier, I.; et al. Opioidergic changes in the pineal gland and hypothalamus in cluster headache:A ligand PET study. Neurology 2006, 66, 1108–1110. [CrossRef]
179. DaSilva, A.F.; Nascimento, T.D.; DosSantos, M.F.; Lucas, S.; van Holsbeeck, H.; DeBoer, M.; Maslowski, E.;Love, T.; Martikainen, I.K.; Koeppe, R.A.; et al. Mu-Opioid activation in the prefrontal cortex in migraineattacks—Brief report I. Ann. Clin. Transl. Neurol. 2014, 1, 439–444. [CrossRef]
180. Linnman, C.; Catana, C.; Petkov, M.P.; Chonde, D.B.; Becerra, L.; Hooker, J.; Borsook, D. Molecular andfunctional PET-fMRI measures of placebo analgesia in episodic migraine: Preliminary findings. NeuroImageClin. 2018, 17, 680–690. [CrossRef]
181. Schreckenberger, M.; Klega, A.; Gründer, G.; Buchholz, H.-G.; Scheurich, A.; Schirrmacher, R.; Schirrmacher, E.;Müller, C.; Henriksen, G.; Bartenstein, P. Opioid receptor PET reveals the psychobiologic correlates of rewardprocessing. J. Nucl. Med. 2008, 49, 1257–1261. [CrossRef]
182. Tuominen, L.; Salo, J.; Hirvonen, J.; Någren, K.; Laine, P.; Melartin, T.; Isometsä, E.; Viikari, J.; Raitakari, O.;Keltikangas-Järvinen, L.; et al. Temperament trait harm avoidance associates with mu-opioid receptoravailability in frontal cortex: A PET study using [11C]carfentanil. NeuroImage 2012, 61, 670–676. [CrossRef]
183. Karjalainen, T.; Tuominen, L.; Manninen, S.; Kalliokoski, K.K.; Nuutila, P.; Jääskeläinen, I.P.; Hari, R.; Sams, M.;Nummenmaa, L. Behavioural activation system sensitivity is associated with cerebral mu-opioid receptoravailability. Soc. Cogn. Affect. Neurosci. 2016, 11, 1310–1316. [CrossRef]
184. Nummenmaa, L.; Manninen, S.; Tuominen, L.; Hirvonen, J.; Kalliokoski, K.K.; Nuutila, P.; Jääskeläinen, I.P.;Hari, R.; Dunbar, R.I.; Sams, M. Adult attachment style is associated with cerebral mu-opioid receptoravailability in humans. Hum. Brain Mapp. 2015, 36, 3621–3628. [CrossRef]
185. Karjalainen, T.; Seppälä, K.; Glerean, E.; Karlsson, H.K.; Lahnakoski, J.M.; Nuutila, P.; Jääskeläinen, I.P.;Hari, R.; Sams, M.; Nummenmaa, L. Opioidergic Regulation of Emotional Arousal: A Combined PET–fMRIStudy. Cereb. Cortex 2018, 29, 4006–4016. [CrossRef]
180

Molecules 2019, 24, 4190
186. Nummenmaa, L.; Tuominen, L.; Dunbar, R.; Hirvonen, J.; Manninen, S.; Arponen, E.; Machin, A.; Hari, R.;Jääskeläinen, I.P.; Sams, M. Social touch modulates endogenous mu-opioid system activity in humans.NeuroImage 2016, 138, 242–247. [CrossRef]
187. Manninen, S.; Tuominen, L.; Dunbar, R.I.; Karjalainen, T.; Hirvonen, J.; Arponen, E.; Hari, R.; Jääskeläinen, I.P.;Sams, M.; Nummenmaa, L. Social laughter triggers endogenous opioid release in humans. J. Neurosci. 2017,37, 6125–6131. [CrossRef]
188. Prossin, A.R.; Koch, A.E.; Campbell, P.L.; Barichello, T.; Zalcman, S.S.; Zubieta, J.-K. Acute experimentalchanges in mood state regulate immune function in relation to central opioid neurotransmission: A model ofhuman CNS-peripheral inflammatory interaction. Mol. Psychiatry 2016, 21, 243–251. [CrossRef]
189. Kennedy, S.E.; Koeppe, R.A.; Young, E.A.; Zubieta, J.K. Dysregulation of Endogenous Opioid EmotionRegulation Circuitry in Major Depression in Women. Arch. Gen. Psychiatry. 2006, 63, 1199–1208. [CrossRef]
190. Miller, J.M.; Zanderigo, F.; Purushothaman, P.D.; DeLorenzo, C.; Rubin-Falcone, H.; Ogden, R.T.; Keilp, J.;Oquendo, M.A.; Nabulsi, N.; Huang, Y.H.; et al. Kappa opioid receptor binding in major depression: A pilotstudy. Synapse 2018, 72, e22042. [CrossRef]
191. Matuskey, D.; Dias, M.; Naganawa, M.; Pittman, B.; Henry, S.; Li, S.; Gao, H.; Ropchan, J.; Nabulsi, N.;Carson, R.E.; et al. Social status and demographic effects of the kappa opioid receptor: A PET imagingstudy with a novel agonist radiotracer in healthy volunteers. Neuropsychopharmacology 2019, 44, 1714–1719.[CrossRef]
192. Ashok, A.H.; Myers, J.; Marques, T.R.; Rabiner, E.A.; Howes, O.D. Reduced mu opioid receptor availabilityin schizophrenia revealed with [11C]carfentanil positron emission tomographic Imaging. Nat. Commun.2019, 10, 4493–4502. [CrossRef]
193. Prossin, A.R.; Zalcman, S.S.; Heitzeg, M.M.; Koch, A.E.; Campbell, P.L.; Phan, K.L.; Stohler, C.S.; Zubieta, J.K.Dynamic interactions between plasma IL-1 family cytokines and central endogenous opioid neurotransmitterfunction in humans. Neuropsychopharmacology 2015, 40, 554–565. [CrossRef]
194. Schrepf, A.; Harper, D.E.; Harte, S.E.; Wang, H.; Ichesco, E.; Hampson, J.P.; Zubieta, J.K.; Clauw, D.J.;Harris, R.E. Endogenous opioidergic dysregulation of pain in fibromyalgia: A PET and fMRI study. Pain2016, 157, 2217–2225. [CrossRef] [PubMed]
195. Gorelick, D.A.; Kim, Y.K.; Bencherif, B.; Boyd, S.J.; Nelson, R.; Copersino, M.; Endres, C.J.; Dannals, R.F.;Frost, J.J. Imaging brain mu-opioid receptors in abstinent cocaine users: Time course and relation to cocainecraving. Biol. Psychiatry 2005, 57, 1573–1582. [CrossRef] [PubMed]
196. Gorelick, D.A.; Kim, Y.K.; Bencherif, B.; Boyd, S.J.; Nelson, R.; Copersino, M.L.; Dannals, R.F.; Frost, J.J.Brain mu-opioid receptor binding: Relationship to relapse to cocaine use after monitored abstinence.Psychopharmacology 2008, 200, 475–486. [CrossRef] [PubMed]
197. Martinez, D.; Slifstein, M.; Matuskey, D.; Nabulsi, N.; Zheng, M.-Q.; Lin, S.-F.; Ropchan, J.; Urban, N.;Grassetti, A.; Chang, D.; et al. Kappa-opioid receptors, dynorphin, and cocaine addiction: A positronemission tomography study. Neuropsychopharmacology 2019, 44, 1720–1727. [CrossRef]
198. Narendran, R.; Tollefson, S.; Himes, M.L.; Paris, J.; Lopresti, B.; Ciccocioppo, R.; Scott Mason, N. Nociceptinreceptors upregulated in cocaine use disorder: A positron emission tomography imaging study using[11C]NOP-1A. Am. J. Psychiarty 2019, 176, 468–476. [CrossRef]
199. Heinz, A.; Reimold, M.; Wrase, J.; Hermann, D.; Croissant, B.; Mundle, G.; Dohmen, B.M.; Braus, D.F.;Schumann, G.; Machulla, H.J.; et al. Correlation of stable elevations in striatal mu-opioid receptor availabilityin detoxified alcoholic patients with alcohol craving: A positron emission tomography study using carbon11C-labeled carfentanil. Arch. Gen. Psychiatry 2005, 62, 57–64. [CrossRef]
200. Turton, S.; Myers, J.F.M.; Mick, I.; Colasanti, A.; Venkataraman, A.; Durant, C.; Waldman, A.; Brailsford, A.;Parkin, M.C.; Dawe, G.; et al. Blunted endogenous opioid release following an oral dexamphetaminechallenge in abstinent alcohol-dependent individuals. Mol. Psychiatry 2018. [CrossRef]
201. Williams, T.M.; Davies, S.J.C.; Taylor, L.G.; Daglish, M.R.C.; Hammers, A.; Brooks, D.J.; Nutt, D.J.;Lingford-Hughes, A. Brain opioid receptor binding in early abstinence from alcohol dependence andrelationship to craving: An [11C]diprenorphine PET study. Eur. Neuropsychopharmacol. 2009, 19, 740–748.[CrossRef]
181

Molecules 2019, 24, 4190
202. Hermann, D.; Hirth, N.; Reimold, M.; Batra, A.; Smolka, M.N.; Hoffmann, S.; Kiefer, F.; Noori, H.R.;Sommer, W.H.; Reischl, G.; et al. Low mu-opioid receptor status in alcohol dependence identified bycombined positron emission tomography and post-mortem brain analysis. Neuropsychopharmacology 2016,42, 606–614. [CrossRef]
203. Weerts, E.M.; Wand, G.S.; Kuwabara, H.; Munro, C.A.; Dannals, R.F.; Hilton, J.; Frost, J.J.; McCaul, M.E.Positron emission tomography imaging of Mu- and Delta-opioid receptor binding in alcohol-dependent andhealthy control subjects. Alcohol. Clin. Exp. Res. 2011, 35, 2162–2173. [CrossRef]
204. Wand, G.S.; Weerts, E.M.; Kuwabara, H.; Frost, J.J.; Xu, X.; McCaul, M.E. Naloxone-induced cortisol predictsmu opioid receptor binding potential in specific brain regions of healthy subjects. Psychoneuroendocrinology2011, 36, 1453–1459. [CrossRef] [PubMed]
205. Wand, G.S.; Weerts, E.M.; Kuwabara, H.; Wong, D.F.; Xu, X.; McCaul, M.E. The relationship betweennaloxone-induced cortisol and mu opioid receptor availability in mesolimbic structures is disrupted inalcohol dependent subjects. Alcohol 2012, 46, 511–517. [CrossRef] [PubMed]
206. Ray, R.; Ruparel, K.; Newberg, A.; Wileyto, E.P.; Loughead, J.W.; Divgi, C.; Blendy, J.A.; Logan, J.; Zubieta, J.-K.;Lerman, C. Human Mu Opioid Receptor (OPRM1 A118G) polymorphism is associated with brain mu-opioidreceptor binding potential in smokers. Proc. Natl. Acad. Sci. USA 2011, 108, 9268–9273. [CrossRef] [PubMed]
207. Domino, E.F.; Hirasawa-Fujita, M.; Ni, L.; Guthrie, S.K.; Zubieta, J.K. Regional brain [11C]carfentanil bindingfollowing tobacco smoking. Progr. Neuro-Psychopharmacol. Biol. Psychiatry 2015, 59, 100–104. [CrossRef]
208. Nuechterlein, E.B.; Ni, L.; Domino, E.F.; Zubieta, J.K. Nicotine-specific and non-specific effects of cigarettesmoking on endogenous opioid mechanisms. Progr. Neuro-Psychopharmacol. Biol. Psychiatry 2016, 69, 69–77.[CrossRef]
209. Weerts, E.M.; Wand, G.S.; Kuwabara, H.; Xu, X.; Frost, J.J.; Wong, D.F.; McCaul, M.E. Association of smokingwith mu-opioid receptor availability before and during naltrexone blockade in alcohol-dependent subjects.Addict. Biol. 2014, 19, 733–742. [CrossRef]
210. Kuwabara, H.; Heishman, S.J.; Brasic, J.R.; Contoreggi, C.; Cascella, N.; Mackowick, K.M.; Taylor, R.;Rousset, O.; Willis, W.; Huestis, M.A.; et al. Mu opioid receptor binding correlates with nicotine dependenceand reward in smokers. PLoS ONE 2014, 9, e113694. [CrossRef]
211. Guterstam, J.; Jayaram-Lindström, N.; Cervenka, S.; Frost, J.J.; Farde, L.; Halldin, C.; Franck, J. Effectsof amphetamine on the human brain opioid system—A positron emission tomography study. Int. J.Neuropsychopharmacol. 2013, 16, 763–769. [CrossRef]
212. Colasanti, A.; Searle, G.E.; Long, C.J.; Hill, S.P.; Reiley, R.R.; Quelch, D.; Erritzoe, D.; Tziortzi, A.C.; Reed, L.J.;Lingford-Hughes, A.; et al. Endogenous opioid release in the human brain reward system induced by acuteamphetamine administration. Biol. Psychiatry 2012, 72, 371–377. [CrossRef]
213. Mick, I.; Myers, J.; Stokes, P.R.A.; Erritzoe, D.; Colasanti, A.; Bowden-Jones, H.; Clark, L.; Gunn, R.N.;Rabiner, E.A.; Searle, G.E.; et al. Amphetamine induced endogenous opioid release in the human braindetected with [11C]carfentanil PET: Replication in an independent cohort. Int. J. Neuropsychopharmacol. 2014,17, 2069–2074. [CrossRef]
214. Quelch, D.R.; Katsouri, L.; Nutt, D.J.; Parker, C.A.; Tyacke, R.J. Imaging endogenous opioid peptide releasewith [11C]carfentanil and [3H]diprenorphine: Influence of agonist-induced internalization. J. Cereb. BloodFlow. Metab. 2014, 34, 1604–1612. [CrossRef] [PubMed]
215. Mick, I.; Myers, J.; Ramos, A.C.; Stokes, P.R.A.; Erritzoe, D.; Colasanti, A.; Gunn, R.N.; Rabiner, E.A.;Searle, G.E.; Waldman, A.D.; et al. Blunted endogenous opioid release following an oral amphetaminechallenge in pathological gamblers. Neuropsychopharmacology 2016, 41, 1742–1750. [CrossRef] [PubMed]
216. Majuri, J.; Joutsa, J.; Arponen, E.; Forsback, S.; Kaasinen, V. Dopamine synthesis capacity correlates withmu-opioid receptor availability in the human basal ganglia: A triple-tracer PET study. NeuroImage 2018, 183,1–6. [CrossRef] [PubMed]
217. Bencherif, B.; Guarda, A.S.; Colantuoni, C.; Ravert, H.T.; Dannals, R.F.; Frost, J.J. Regional mu-opioid receptorbinding in insular cortex is decreased in bulimia nervosa and correlates inversely with fasting behavior. J.Nucl. Med. 2005, 46, 1349–1351. [PubMed]
218. Karlsson, H.K.; Tuominen, L.; Tuulari, J.J.; Hirvonen, J.; Parkkola, R.; Helin, S.; Salminen, P.; Nuutila, P.;Nummenmaa, L. Obesity is associated with decreased mu-opioid but unaltered dopamine D2 receptoravailability in the brain. J. Neurosci. 2015, 35, 3959–3965. [CrossRef] [PubMed]
182

Molecules 2019, 24, 4190
219. Joutsa, J.; Karlsson, H.K.; Majuri, J.; Nuutila, P.; Helin, S.; Kaasinen, V.; Nummenmaa, L. Binge eating disorderand morbid obesity are associated with lowered mu-opioid receptor availability in the brain. Psychiatry Res.Neuroimaging 2018, 276, 41–45. [CrossRef] [PubMed]
220. Karlsson, H.K.; Tuulari, J.J.; Tuominen, L.; Hirvonen, J.; Honka, H.; Parkkola, R.; Helin, S.; Salminen, P.;Nuutila, P.; Nummenmaa, L. Weight loss after bariatric surgery normalizes brain opioid receptors in morbidobesity. Mol. Psychiatry 2016, 21, 1057–1062. [CrossRef]
221. Tuominen, L.; Tuulari, J.; Karlsson, H.; Hirvonen, J.; Helin, S.; Salminen, P.; Parkkola, R.; Hietala, J.; Nuutila, P.;Nummenmaa, L. Aberrant mesolimbic dopamine–opiate interaction in obesity. NeuroImage 2015, 122, 80–86.[CrossRef]
222. Tuulari, J.J.; Tuominen, L.; de Boer, F.E.; Hirvonen, J.; Helin, S.; Nuutila, P.; Nummenmaa, L. Feeding releasesendogenous opioids in humans. J. Neurosci. 2017, 37, 8284–8291. [CrossRef]
223. Nummenmaa, L.; Saanijoki, T.; Tuominen, L.; Hirvonen, J.; Tuulari, J.J.; Nuutila, P.; Kalliokoski, K. Mu-opioidreceptor system mediates reward processing in humans. Nat. Commun. 2018, 9, 1500. [CrossRef]
224. Saanijoki, T.; Nummenmaa, L.; Tuulari, J.J.; Tuominen, L.; Arponen, E.; Kalliokoski, K.K.; Hirvonen, J. Aerobicexercise modulates anticipatory reward processing via the mu-opioid receptor system. Hum. Brain Mapp.2018, 39, 3972–3983. [CrossRef] [PubMed]
225. Hiura, M.; Sakata, M.; Ishii, K.; Toyohara, J.; Oda, K.; Nariai, T.; Ishiwata, K. Central mu-opioidergic systemactivation evoked by heavy and severe-intensity cycling exercise in humans: A pilot study using positronemission tomography with 11C-carfentanil. Int. J. Sports Med. 2017, 38, 19–26. [PubMed]
226. Pert, C.B.; Snyder, S.H. Opiate receptor binding—Enhancement by opiate administration in vivo. Biochem.Pharmacol. 1976, 25, 847–853. [CrossRef]
227. Burns, J.A.; Kroll, D.S.; Feldman, D.E.; Liu, C.K.; Manza, P.; Wiers, C.E.; Volkow, N.D.; Wang, G.-J. Molecularimaging of opioid and dopamine systems: Insights into the pharmacogenetics of opioid use disorders. Front.Psychiatry 2019, 10, 626. [CrossRef] [PubMed]
228. Gu, Z.-H.; Wang, B.; Kou, Z.-Z.; Bai, Y.; Chen, T.; Dong, Y.-L.; Li, H.; Li, Y.-Q. Endomorphins: Promisingendogenous opioid peptides for the development of novel analgesics. Neurosignals 2017, 25, 98–116.[CrossRef] [PubMed]
229. Redila, V.A.; Chavkin, C. Stress-induced reinstatement of cocaine seeking is mediated by the kappa opioidsystem. Psychopharmacology 2008, 200, 59–70. [CrossRef] [PubMed]
© 2019 by the authors. Licensee MDPI, Basel, Switzerland. This article is an open accessarticle distributed under the terms and conditions of the Creative Commons Attribution(CC BY) license (http://creativecommons.org/licenses/by/4.0/).
183


molecules
Review
Current Landscape and Emerging Fields of PETImaging in Patients with Brain Tumors
Jan-Michael Werner 1, Philipp Lohmann 2, Gereon R. Fink 1,2, Karl-Josef Langen 2,3 and
Norbert Galldiks 1,2,*,†
1 Department of Neurology, Faculty of Medicine and University Hospital Cologne, University of Cologne,Kerpener St. 62, 50937 Cologne, Germany; [email protected] (J.-M.W.);[email protected] (G.R.F.)
2 Institute of Neuroscience and Medicine (INM-3, -4), Research Center Juelich, Leo-Brandt-St., 52425 Juelich,Germany; [email protected] (P.L.); [email protected] (K.-J.L.)
3 Department of Nuclear Medicine, University Hospital Aachen, 52074 Aachen, Germany* Correspondence: [email protected] or [email protected]; Tel.: +49-2461-61-9324 or+49-221-478-86124; Fax: +49-2461-61-1518 or +49-221-478-5669
† Center of Integrated Oncology (CIO), Universities of Aachen, Bonn, Cologne, and Duesseldorf, Germany.
Academic Editor: Peter BrustReceived: 28 February 2020; Accepted: 20 March 2020; Published: 24 March 2020
Abstract: The number of positron-emission tomography (PET) tracers used to evaluate patientswith brain tumors has increased substantially over the last years. For the management of patientswith brain tumors, the most important indications are the delineation of tumor extent (e.g., forplanning of resection or radiotherapy), the assessment of treatment response to systemic treatmentoptions such as alkylating chemotherapy, and the differentiation of treatment-related changes (e.g.,pseudoprogression or radiation necrosis) from tumor progression. Furthermore, newer PET imagingapproaches aim to address the need for noninvasive assessment of tumoral immune cell infiltrationand response to immunotherapies (e.g., T-cell imaging). This review summarizes the clinical value ofthe landscape of tracers that have been used in recent years for the above-mentioned indications andalso provides an overview of promising newer tracers for this group of patients.
Keywords: amino acid; FET; FACBC; FDOPA; immunoPET; molecular imaging; glioma; brainmetastases
1. Introduction
For the management of patients with brain tumors, clinicians frequently need to rely on imaginginformation obtained from anatomical magnetic resonance imaging (MRI) before, during, and afterthe treatment. While contrast-enhanced MRI is of paramount value in neuro-oncology, its specificityfor neoplastic tissue is low, and changes of the blood-brain barrier permeability as indicated bycontrast enhancement are not limited to tumor tissue [1–7]. Nevertheless, precise delineationof tumor extent, including non-enhancing tumor subregions, is decisive for several diagnosticand therapeutic steps (e.g., planning of biopsy, surgery, or radiotherapy) [7,8]. Following radio-and/or chemotherapy, neurooncologists often encounter treatment-related changes. Some of these,e.g., pseudoprogression, are difficult to differentiate from actual tumor progression with conventionalMRI alone [6–12]. Pseudoprogression describes a phenomenon characterized by an increase ofcontrast enhancement without clinical deterioration, and which disappears again over time withoutany treatment change [3,9,13–16]. Such treatment-related changes may occur early (in the case ofpseudoprogression typically within the first 12 weeks after chemoradiation completion) or late (severalmonths or even years after radiotherapy in the case 31 of radiation necrosis) [7,8,17].
Molecules 2020, 25, 1471; doi:10.3390/molecules25061471 www.mdpi.com/journal/molecules185
Molecules 2020, 25, 1471
Furthermore, surrogates of treatment response or progression obtained from MRI (e.g., a decreaseof contrast enhancement or the fluid-attenuated inversion recovery (FLAIR) signal hyperintensity)may be unspecific. They can be influenced by inflammation, infarction, and reactive changes aftersurgery [2,6,12,18]. If treatment-related changes remain unidentified, an effective treatment may beerroneously terminated prematurely. The latter may also harm survival and mislead study resultsevaluating novel treatment approaches for tumor relapse [19].
To overcome these diagnostic challenges, imaging techniques with higher diagnostic accuracy thanconventional MRI offering more than just anatomical information are needed. Apart from advancedMRI techniques, positron-emission tomography (PET) imaging has been evaluated over the pastdecades. It has been shown that PET imaging offers additional value in neuro-oncology since it enablesthe non-invasive evaluation of molecular and metabolic features of brain tumors. PET, therefore, is ofgreat value for the indications mentioned above, which are of particular clinical interest [7,8,10,20].Consequently, the PET task force of the Response Assessment in Neuro-Oncology (RANO) workinggroup highlighted the additional clinical value of PET imaging using amino acid tracers compared toanatomical MRI. Accordingly, its widespread clinical use was recommended in patients with gliomaand brain metastases [17,21].
The continuously growing landscape of PET tracers enables the evaluation of many biochemicalprocesses in patients with brain tumors. With the advent of newer treatment options in neuro-oncology,in particular, targeted therapy and various immunotherapy options, the needs for additional informationderived from neuroimaging in terms of characterization of the tumor environment, the evaluation oftumoral drug accumulation, immune cell infiltration, and the diagnosis of treatment-related changesfollowing these newer treatment options are steadily increasing. Some of these requirements may bemet by the existing landscape of well-established PET tracers, while others can be addressed by newerones [22,23].
This review summarizes the value of PET tracers that have been used in brain tumors in recentyears for the most relevant clinical indications. Furthermore, more unique but promising PET tracersare summarized and discussed.
2. Methods
A PubMed search using the terms “PET”, “positron”, “tracer”, “glioma”, “brain metastases”,“FDG”, “amino acid”, “methionine”, “FET”, “FDOPA”, “FACBC”, “AMT”, “TSPO”, “GE-180”, “FLT”,“FAZA”, “EGFR”, “VEGF”, “immunoPET”, “isocitrate dehydrogenase”, “radiotherapy”, “T-cellimaging”, “reporter gene”, “radiation necrosis”, “pseudoprogression”, “tumor extent”, “responseassessment”, “treatment-related changes”, and combinations thereof was performed until January2020. The PET tracers were evaluated regarding their clinical value for the delineation of tumor extent,diagnosis of treatment-related changes, the assessment of treatment response (Table 1), and accordingto the information provided by newer PET probes (Table 2).
186

Molecules 2020, 25, 1471
Ta
ble
1.
Freq
uent
lyus
edPE
Ttr
acer
sfo
rth
ede
linea
tion
oftu
mor
exte
nt,d
iagn
osis
oftr
eatm
ent-
rela
ted
chan
ges,
and
the
asse
ssm
ento
ftre
atm
entr
espo
nse
inbr
ain
tum
orim
agin
g.
Ima
gin
gT
arg
et
an
dC
orr
esp
on
din
gT
race
rsD
eli
ne
ati
on
of
Tu
mo
rE
xte
nt
Dia
gn
osi
so
fT
rea
tme
nt-
Re
late
dC
ha
ng
es
Ass
ess
me
nt
of
Tre
atm
en
tR
esp
on
se
Glu
cose
me
tab
oli
sm
[18F]
FDG
-+
-
Am
ino
aci
dtr
an
spo
rt
[18F]
FET
++
++
1++
2
[11C
]MET
++
+++
[18F]
FDO
PA++
++
++
[11C
]AM
T(++
)(++
)n.
a.
[18F]
FAC
BC(++
)n.
a.n.
a.
Mit
och
on
dri
al
tra
nsl
oca
tor
pro
tein
(TS
PO
)
[18F]
GE-
180
uncl
ear
n.a.
n.a.
Ce
llu
lar
pro
life
rati
on
[18F]
FLT
-+
++
3
Hy
po
xia
[18F]
FMIS
On.
a.n.
a.(++
)3
[18F]
FAZ
An.
a.n.
a.(++
)3
Pe
rfu
sio
n
[15O
]H2O
n.a.
n.a.
n.a.
An
gio
ge
ne
sis
[89Z
r]be
vaci
zum
abn.
a.n.
a.n.
a.
++=
high
dia
gnos
tic
accu
racy
;(++
)=
high
dia
gnos
tic
accu
racy
,bu
tlim
ited
dat
aav
aila
ble;+=
limit
edd
iagn
osti
cac
cura
cy;
-=
not
help
ful;
1=
incr
ease
dac
cura
cyw
hen
usi
ngd
ynam
ic[18
F]FE
TP
ET;
2=
inen
hanc
ing
and
non-
enha
ncin
gtu
mor
s;3=
inp
atie
nts
und
ergo
ing
anti
angi
ogen
ictr
eatm
ent
wit
hbe
vaci
zum
ab;
[11C
]AM
T=
α-[
11C
]-m
ethy
l-L
-try
pto
pha
n;[18
F]FA
CB=
anti
-1-a
min
o-3-
[18F]
flu
oroc
yclo
buta
ne-1
-car
boxy
licac
id;
[18F]
FAZ
A=
[18F]
flou
roaz
omyc
inar
abin
osid
e;[18
F]FD
G=
[18F]
-2-fl
uor
o-2-
deo
xy-D
-glu
cose
;[18
F]FD
OPA
=3,
4-d
ihyd
roxy
-6-[
18F]
flu
oro-
L-p
heny
lala
nine
;[18
F]FE
T=
O-(
2-[18
F]fl
uor
oeth
yl)-
L-t
yros
ine;
[18F]
FLT=
3′-d
eoxy
-3′ -[
18F]
fluro
thym
idin
e;[18
F]FM
ISO=
[18F]
fluor
omis
onid
azol
e;[15
O]H
2O=
radi
olab
eled
wat
er;[
11C
]MET=
[11C
]met
hyl-L
-met
hion
ine;
n.a.=
only
prel
imin
ary
orno
data
avai
labl
e.
187

Molecules 2020, 25, 1471
Ta
ble
2.
Prom
isin
gPE
Ttr
acer
sfo
rth
eev
alua
tion
ofne
wer
trea
tmen
topt
ions
.
Tra
cer
Ta
rge
tM
ech
an
ism
Ima
gin
go
fth
eE
GF
Rfa
mil
y
[11C
]erl
otin
ibEG
FRTK
I-m
edia
ted
imag
ing
[89Z
r]Z
r-D
FO-n
imot
uzum
abEG
FRA
ntib
ody-
med
iate
dim
agin
g
[11C
]PD
1530
35EG
FRTK
I-m
edia
ted
imag
ing
[89Z
r]pe
rtuz
umab
HER
2A
ntib
ody-
med
iate
dim
agin
g
[64C
u]-D
OTA
-tra
stuz
umab
HER
2A
ntib
ody-
med
iate
dim
agin
g
Imm
un
o-I
ma
gin
g
[89Z
r]ni
volu
mab
PD-1
Ant
ibod
y-m
edia
ted
imag
ing
[89Z
r]at
ezol
izum
abPD
-L1
Ant
ibod
y-m
edia
ted
imag
ing
[18F]
BMS-
9861
92PD
-L1
PET
imag
ing
usin
gan
engi
neer
edta
rget
-bin
ding
prot
ein
(adn
ecti
n)
[89Z
r]IA
B22M
2CC
D8+
T-ce
llsA
ntib
ody
frag
men
t-m
edia
ted
imag
ing
[18F]
CFA
DC
KTa
rget
ing
ofth
ede
oxy-
cyti
dine
kina
se
[18F]
FHBG
HSV
1-tk
Imag
ing
ofre
port
erge
neex
pres
sion
Ima
gin
go
fID
Hm
uta
tio
ns
[18F]
AG
I-51
98ID
H-m
utan
tcel
lsIm
agin
gof
the
mut
antI
DH
enzy
me
usin
ga
radi
olab
eled
IDH
1in
hibi
tor
[18F]
-lab
eled
tria
zine
diam
ine
anal
ogue
IDH
-mut
antc
ells
Imag
ing
ofth
em
utan
tID
Hen
zym
e
Rad
iola
bele
dbu
tyl-
phen
ylsu
lfon
amid
eID
H-m
utan
tcel
lsIm
agin
gof
the
mut
antI
DH
enzy
me
[11C
]ace
tate
IDH
-mut
antc
ells
Met
abol
ictr
appi
ngof
the
trac
erin
IDH
-mut
antc
ells
[18F]
CFA
=2-
chlo
ro-2′ -d
eoxy
-2′ -[
18F]
flu
oro-
9-b-
D-a
rabi
nofu
rano
syl-
aden
ine;
DC
K=
deo
xy-c
ytid
ine
kina
seE
GFR
=ep
ider
mal
grow
thfa
ctor
rece
pto
r;[18
F]FH
BG=
9-[4
-[18
F]fl
uor
o-3-
(hyd
roxy
met
hyl)
buty
l]gu
anin
e;H
ER
2=
hum
anep
ider
mal
grow
thfa
ctor
rece
pto
r2;
HSV
1-tk=
herp
essi
mp
lex
viru
sty
pe
1th
ymid
ine
kina
se;I
DH=
isoc
itra
tede
hydr
ogen
ase-
1or
-2;P
D-1=
prog
ram
med
cell
deat
hre
cept
or-1
;PD
-L1=
prog
ram
med
cell
deat
hpr
otei
nlig
and
1;T
KI=
tyro
sine
kina
sein
hibi
tor.
188

Molecules 2020, 25, 1471
3. Current Landscape of PET Imaging
PET allows targeting metabolic and molecular processes in patients with brain tumors relevant todiagnosis, treatment, and prognosis that cannot be assessed with anatomic computed tomography(CT) or MR imaging. A variety of PET tracers have been evaluated predominantly in glioma patientsor patients with brain metastases with the main focus on glucose metabolism, amino acid transport,proliferation, hypoxia, blood flow, or angiogenesis. This section will provide an overview of PETtracers for brain tumors that have been evaluated in human subjects in the last years, especially forthose above mentioned highly relevant indications in clinical routine. An overview is presented inTable 1.
3.1. PET Imaging of Glucose Metabolism
[18F]-2-Fluoro-2-deoxy-D-glucose ([18F]FDG) is the most widespread PET tracer in nuclearmedicine. In neoplastic tissue, the uptake of [18F]FDG reflects the increased expression of glucosetransporters and hexokinase. The latter enzyme phosphorylates glucose and [18F]FDG. In the centralnervous system, the physiologically high and varying uptake of [18F]FDG in healthy brain parenchymahampers the accurate delineation of the brain tumor. This limits the diagnostic accuracy for the correctidentification of treatment-related changes and assessment of treatment response in gliomas and brainmetastases [17,21]. It has repeatedly been shown that the diagnostic accuracy of [18F]FDG regarding thedifferentiation of radiation-induced changes from glioma and brain metastases recurrence is inferiorto other imaging modalities, including advanced MRI and amino acid PET [17,24–26]. However,[18F]FDG PET seems to be of value for the delineation of tumor extent and assessment of treatmentresponse in patients with primary central nervous system (CNS) lymphoma [27–30].
3.2. PET Using Amino Acid PET Tracers
Radiolabeled amino acid tracers (Figure 1) are of great interest in brain tumor imaging because ofthe high tumor-to-brain contrast based on the relatively high specificity for neoplastic tissue and thelow uptake in healthy brain tissue [7,8,21,31–33].
Figure 1. Chemical structure of radiolabeled amino acids.
189

Molecules 2020, 25, 1471
3.2.1. Uptake Mechanisms of Amino Acid PET Tracers
The uptake of the amino acid tracers O-(2-[18F]fluoroethyl)-L-tyrosine ([18F]FET),[11C]methyl-L-methionine ([11C]MET), and 3,4-dihydroxy-6-[18F]fluoro-L-phenylalanine ([18F]FDOPA)is mainly based on the increased expression of large neutral amino acid transporters of the l-type(LAT) in gliomas and brain metastases (i.e., subtypes LAT1 and LAT2) [7,34–37]. Moreover, LAT1overexpression correlates with malignant phenotypes and proliferation of gliomas. It is associated withglioma angiogenesis [38,39]. A critical consideration for the practical application of [11C]MET comparedto [18F]FET or [18F]FDOPA is the half-life of the [11C]-isotope ([18F] 110 vs. [11C] 20 min) [40,41],which allows the transport of [18F]FET and [18F]FDOPA to PET facilities. In contrast, the use of[11C]MET necessitates an on-site cyclotron. In many European centers, this logistical disadvantagehas led to the replacement of [11C]MET predominantly by [18F]FET [7]. When using [18F]FDOPA, thephysiological uptake in the striatum may hamper the evaluation of tumor extent [7,42].
The L-tryptophan analogue α-[11C]-methyl-L-tryptophan ([11C]AMT) is another radiolabeledamino acid with uptake via the LAT system. Additionally, [11C]AMT uptake is mediated via thekynurenine pathway and has a rate-limiting enzyme indoleamine 2,3-dioxygenase [43]. Indoleamine2,3-dioxygenase is upregulated in various cancers including gliomas [44], which prompted the use of[11C]AMT PET in patients with brain tumors [45].
Other tracerssuchas thesyntheticaminoacidanaloganti-1-amino-3-[18F]fluorocyclobutane-1-carboxylicacid ([18F]FACBC or [18F]fluciclovine) are also LAT-mediated but use additionally the alanine, serine, andcysteine transporter 2, which is upregulated in many human cancers [46–49].
3.2.2. Value of Amino Acid PET Tracers for Brain Tumor Patients
For the planning of diagnostic and therapeutic procedures, the precise delineation of tumorspread is essential. For example, the tumor extent as assessed by amino acid PET provides valuableinformation for planning stereotactic biopsies, resection, and radiotherapy [1,50–52]. For [11C]MET and[18F]FET, it has been shown that the delineation of tumor extent, particularly in non-enhancing gliomas,can be assessed with high accuracy using amino acid PET [51,53]. Preliminary data suggest that newertracers such as [18F]FACBC PET are also helpful in identifying metabolically active and non-contrastenhancing tumor regions in glioma patients [54–56]. Moreover, it has been shown that in the majorityof cases, the metabolically active tumor burden as assessed by amino acid PET extends considerablybeyond the volume of MRI contrast enhancement, which is of significant relevance for subsequenttreatment planning [1,7,53,57]. Regarding the comparability of PET tracers for this indication, [11C]MET,[18F]FET, and [18F]FDOPA seem to be equally informative [58–61]. Nevertheless, it has to be pointedout that 20–30% of grade II gliomas, according to the World Health Organization (WHO) classificationof tumors of the central nervous system [62,63], show no amino acid uptake [64–66]. A negative aminoacid PET, therefore, does not exclude glioma [8].
For the differentiation of treatment-related changes from tumor relapse, amino acid PET alsoprovides valuable diagnostic information. Using [18F]FET or [18F]FDOPA, especially the differentiationof radiation injury from tumor relapse in glioma patients, as well as in patients with brain metastases,can be obtained with a relatively high diagnostic accuracy between 80–90% (Figure 2) [11,26,67–80].Importantly, in glioma patients, parameters derived from dynamic [18F]FET PET acquisition mayfurther increase the diagnostic accuracy [67,74–76,78]. This has also been demonstrated in patients withbrain metastases who underwent radiosurgery for brain metastases treatment [80,81]. The diagnosticaccuracy of [11C]MET PET regarding this clinical question is slightly lower (approximately 75%) [8,82,83],which is most probably related to the higher affinity of [11C]MET for inflammation [84]. First PET studiesusing [11C]AMT or [18F]FACBC suggest that these tracers may also be of value for the differentiationof radiation injury from glioma progression [85,86].
190

Molecules 2020, 25, 1471
Figure 2. Radiation necrosis and chronic inflammation in a patient with brain metastases of aB-Raf proto-oncogene (BRAF)-mutated malignant melanoma who had been treated with whole-brainradiation therapy combined with concurrent dabrafenib plus trametinib. Twenty-four months later, thecontrast-enhanced magnetic resonance imaging (MRI) indicates a recurrence of the brain metastases(left panel), whereas the O-(2-[18F]fluoroethyl)-L-tyrosine ([18F]FET) positron-emission tomography(PET) shows only insignificant metabolic activity and is consistent with the findings of treatment-relatedMRI changes. Neuropathological findings (right panel) after stereotactic biopsy show signs of radiationnecrosis as well as considerable T-cell infiltration. (A) Hyaline, eosinophilic necrosis with evidenceof a necrotic vessel wall (arrowhead). (B) Vital brain parenchyma besides necrosis with activatedmicroglia cells (arrowhead), and blood vessels with lymphocyte infiltrates (arrows) without evidenceof tumor cells (inserted box). (C) Adjacent to inflamed blood vessels (arrows), a resorption of necrosesby macrophages (block arrows) as well as activated microglia cells (arrowheads) and astrocytes in thebrain parenchyma (inserted box). (D) The main population of intra- and perivascular T-cell infiltratesare CD3+ (arrow), but also CD4+ (inserted box left) and CD8+ (inserted box right) T-cells contribute tothe infiltrates (modified from Galldiks et al. [10], with permission from Oxford University Press).
The advent of immunotherapy using immune checkpoint inhibitors and targeted therapy hasimproved the survival of cancer patients, particularly in melanoma and lung cancer. Recent trialssuggest that patients with brain metastases from these tumor entities may also benefit from theseagents alone or in combination [87]. Regarding patients with brain metastases treated with checkpointinhibitors or targeted therapy (frequently combined with radiotherapy), initial data indicate that aminoacid PET may provide valuable information for differentiating relapse from equivocal MRI findingsrelated to immunotherapy-induced inflammation [10,88].
Recently, a variety of experimental treatment options has been introduced for treating patientswith high-grade glioma. [18F]FET PET was shown to differentiate benign MRI findings related to theseexperimental therapies, e.g., immunotherapy with dendritic cell vaccination or targeted therapy withregorafenib, from tumor relapse [89,90]. However, the number of patients treated with these therapiesand monitored with [18F]FET PET is still small, and the results should be interpreted with caution.
191

Molecules 2020, 25, 1471
The assessment of the response to a particular neurooncological treatment is of clinical relevancesince treatment decisions can be negatively affected by treatment-related changes. The accurateassessment of response helps both to discontinue an ineffective treatment option as early as possibleand to prevent an effective treatment from being erroneously terminated prematurely with a potentiallyharmful influence on survival. Furthermore, the evaluation of response also helps to avoid possibletreatment side effects, e.g., bone marrow depression or fatigue, and, therefore, to maintain or evenimprove life-quality. It has been shown in glioma patients that the assessment of response to alkylatingchemotherapy (i.e., temozolomide or lomustine) using [11C]MET or [18F]FET PET provides valuableadditional information compared to contrast-enhanced MRI. Importantly, metabolic PET responders(i.e., patients with a decrease of tumor-to-brain ratios or metabolically active tumor volumes at follow-uprelative to baseline imaging) had a significantly longer survival than metabolic non-responders [91–98].
Following antiangiogenic therapy using bevacizumab, the use of reduced contrast enhancement asa surrogate marker for treatment response is not optimal due to a phenomenon called pseudoresponse [9].Pseudoresponse describes a decrease of contrast enhancement related to a rapid restoration of theblood-brain barrier by antiangiogenic drugs [9]. However, a clinical benefit is not infrequently lackingin patients with an impressive radiological response (pseudoresponse). [18F]FET and [18F]FDOPA PETmay provide valuable information regarding the identification of pseudoresponse [99–102]. Moreover,[18F]FDOPA and [18F]FET PET were also able to predict a favorable clinical outcome in bevacizumabresponders [101–104].
After chemoradiation completion, newly diagnosed glioblastoma patients can be treated withtumor-treating fields therapy in addition to adjuvant temozolomide chemotherapy [105]. Initial studiessuggest that amino acid PET might identify responding patients undergoing tumor-treating fieldstherapy, but it has to be considered that the response can also be related to the concurrently appliedchemotherapy or delayed chemoradiation effects [106,107].
3.3. PET Imaging of the Mitochondrial Translocator Protein
PET ligands targeting the 18 kDa mitochondrial translocator protein (TSPO), located at theouter mitochondrial membrane and formerly known as the peripheral benzodiazepine receptor, arealso of interest in neuro-oncology [108,109]. TSPO is associated with neuroinflammation due to itsexpression in activated microglia, endothelial cells, and infiltrating macrophages [109]. The PET ligand[11C]PK11195 was one of the first ligands evaluated for TSPO expression in glioma patients [110–112].
The recently introduced TSPO ligand GE-180 labeled with [18F] offers an increased bindingspecificity and was tested in patients with gliomas [113] and neuroinflammatory diseases such asmultiple sclerosis [114–116]. Regarding the delineation of glioma extent, it has been demonstrated thatthe [18F]GE-180 uptake volume is significantly larger than the volume of contrast enhancement [113,117].However, when comparing [18F]FET with [18F]GE-180 uptake volumes intraindividually in terms ofspatial distribution, the overlap is only moderate (Dice similarity coefficient, 0.55) despite comparabletumor volumes [117]. These differences might help to characterize glioma heterogeneity and warrantfurther studies with spatial correlation of imaging findings of [18F]FET uptake to [18F]GE-180 uptakewith neuropathology.
3.4. PET Imaging of Cellular Proliferation
The radiolabeled nucleoside 3′-deoxy-3′-[18F]fluorothymidine ([18F]FLT) is a pyrimidine analogue.It is used to evaluate cellular proliferation because of its rapid incorporation into newly synthesizedDNA [118]. [18F]FLT is trapped intracellularly after phosphorylation by the thymidine kinase-1, acytoplasmatic enzyme expressed during cell proliferation [46,119]. However, the requirement of adisrupted blood-brain barrier for [18F]FLT uptake may limit its diagnostic use [2,120]. For example,in terms of tumor detection and delineation, [18F]FLT PET was less sensitive than [11C]MET PET todetect WHO grade II gliomas, which usually show no contrast enhancement [121]. Furthermore,a meta-analysis evaluating the value of [18F]FLT PET for the diagnosis of glioma recurrence based
192
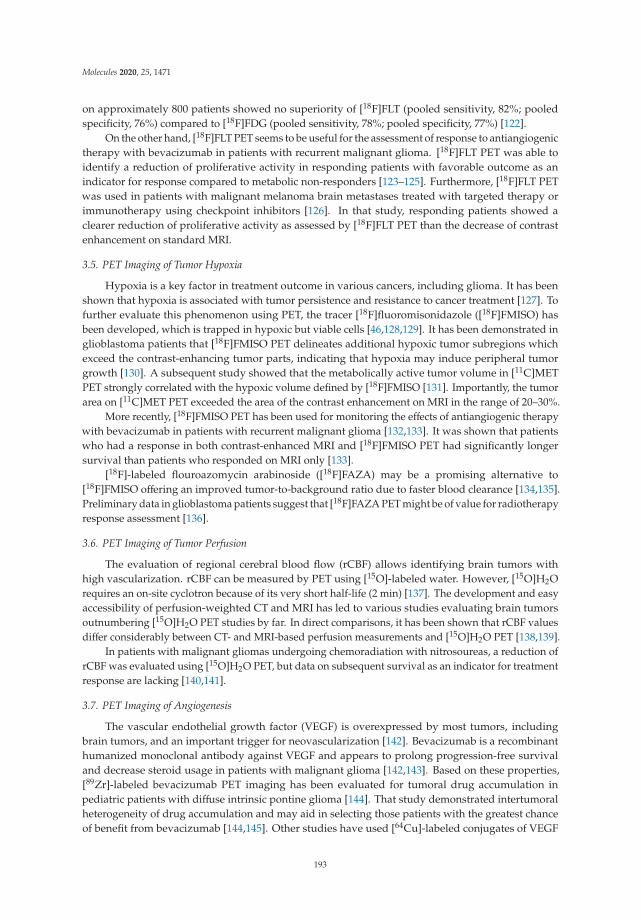
Molecules 2020, 25, 1471
on approximately 800 patients showed no superiority of [18F]FLT (pooled sensitivity, 82%; pooledspecificity, 76%) compared to [18F]FDG (pooled sensitivity, 78%; pooled specificity, 77%) [122].
On the other hand, [18F]FLT PET seems to be useful for the assessment of response to antiangiogenictherapy with bevacizumab in patients with recurrent malignant glioma. [18F]FLT PET was able toidentify a reduction of proliferative activity in responding patients with favorable outcome as anindicator for response compared to metabolic non-responders [123–125]. Furthermore, [18F]FLT PETwas used in patients with malignant melanoma brain metastases treated with targeted therapy orimmunotherapy using checkpoint inhibitors [126]. In that study, responding patients showed aclearer reduction of proliferative activity as assessed by [18F]FLT PET than the decrease of contrastenhancement on standard MRI.
3.5. PET Imaging of Tumor Hypoxia
Hypoxia is a key factor in treatment outcome in various cancers, including glioma. It has beenshown that hypoxia is associated with tumor persistence and resistance to cancer treatment [127]. Tofurther evaluate this phenomenon using PET, the tracer [18F]fluoromisonidazole ([18F]FMISO) hasbeen developed, which is trapped in hypoxic but viable cells [46,128,129]. It has been demonstrated inglioblastoma patients that [18F]FMISO PET delineates additional hypoxic tumor subregions whichexceed the contrast-enhancing tumor parts, indicating that hypoxia may induce peripheral tumorgrowth [130]. A subsequent study showed that the metabolically active tumor volume in [11C]METPET strongly correlated with the hypoxic volume defined by [18F]FMISO [131]. Importantly, the tumorarea on [11C]MET PET exceeded the area of the contrast enhancement on MRI in the range of 20–30%.
More recently, [18F]FMISO PET has been used for monitoring the effects of antiangiogenic therapywith bevacizumab in patients with recurrent malignant glioma [132,133]. It was shown that patientswho had a response in both contrast-enhanced MRI and [18F]FMISO PET had significantly longersurvival than patients who responded on MRI only [133].
[18F]-labeled flouroazomycin arabinoside ([18F]FAZA) may be a promising alternative to[18F]FMISO offering an improved tumor-to-background ratio due to faster blood clearance [134,135].Preliminary data in glioblastoma patients suggest that [18F]FAZA PET might be of value for radiotherapyresponse assessment [136].
3.6. PET Imaging of Tumor Perfusion
The evaluation of regional cerebral blood flow (rCBF) allows identifying brain tumors withhigh vascularization. rCBF can be measured by PET using [15O]-labeled water. However, [15O]H2Orequires an on-site cyclotron because of its very short half-life (2 min) [137]. The development and easyaccessibility of perfusion-weighted CT and MRI has led to various studies evaluating brain tumorsoutnumbering [15O]H2O PET studies by far. In direct comparisons, it has been shown that rCBF valuesdiffer considerably between CT- and MRI-based perfusion measurements and [15O]H2O PET [138,139].
In patients with malignant gliomas undergoing chemoradiation with nitrosoureas, a reduction ofrCBF was evaluated using [15O]H2O PET, but data on subsequent survival as an indicator for treatmentresponse are lacking [140,141].
3.7. PET Imaging of Angiogenesis
The vascular endothelial growth factor (VEGF) is overexpressed by most tumors, includingbrain tumors, and an important trigger for neovascularization [142]. Bevacizumab is a recombinanthumanized monoclonal antibody against VEGF and appears to prolong progression-free survivaland decrease steroid usage in patients with malignant glioma [142,143]. Based on these properties,[89Zr]-labeled bevacizumab PET imaging has been evaluated for tumoral drug accumulation inpediatric patients with diffuse intrinsic pontine glioma [144]. That study demonstrated intertumoralheterogeneity of drug accumulation and may aid in selecting those patients with the greatest chanceof benefit from bevacizumab [144,145]. Other studies have used [64Cu]-labeled conjugates of VEGF
193

Molecules 2020, 25, 1471
with DOTA (1,4,7,10-tetra-azacylododecane N,N′,N′′,N′′′-tetraacetic acid) for PET imaging in animalmodels [146–148]. Similarly, these approaches suggest the clinical value for the identification of patientswho will benefit from anti-VEGF therapy.
In adult glioblastoma patients, it has been demonstrated that accumulation of [123I]VEGF in thetumor region of glioblastomas can be assessed using single photon emission computed tomography(SPECT) imaging [149]. Importantly, high uptake of [123I]VEGF was able to identify glioblastomapatients with a poor clinical outcome.
4. Emerging Fields of PET Imaging
Currently, blockade of immune checkpoints and other immunotherapy options (i.e., vaccinationstrategies, oncolytic virus approaches, cell-based immunotherapy such as chimeric antigen receptorT-cells (CAR-T cells) are under evaluation in patients with brain cancer including glioma and brainmetastases. Furthermore, recent study results suggest that newer-generation targeted therapies are apromising treatment option, especially in a subset of patients with brain metastases [150]. As a newtreatment option, mutations of the isocitrate dehydrogenase (IDH) gene, which frequently occur inWHO grade II and III gliomas, have also gained interest as a potential treatment target [151,152]. Allthese promising treatment options impose new demands on brain imaging (e.g., imaging of immunereactions in the brain). The current body of literature suggests that PET has the potential to adapt tothese needs. An overview is presented in Table 2.
4.1. PET Imaging of the Epidermal Growth Factor Receptor Family
Both the epidermal growth factor receptor (EGFR) and the human epidermal growth factorreceptor 2 (HER2) are transmembrane protein receptors and belong to the EGFR family. These receptorsare targets for various growth factors that mediate various cellular processes such as differentiation orproliferation. In clinical oncology, various gene mutations may lead to overexpression of these proteinsand are associated with the development of a variety of cancers. Importantly, these mutations also playa significant role in various treatment options, including tyrosine kinase inhibitors and monoclonalantibodies targeting EGFR, HER2, or both [153], as well as for imaging. Especially the evaluation of aresponse to these targeted therapy options in patients with brain metastases (from melanoma, lung,or breast cancer) as well as in glioma patients is the indication with the highest clinical potential forEGFR- and HER2-targeted PET [154,155]. In recent years, radiolabeled EGFR and HER2 antibodies, aswell as tyrosine kinase inhibitors, have been used as PET imaging agents.
For identifying EGFR overexpression, PET ligands such as [11C]erlotinib, [11C]PD153035, and[89Zr]Zr-DFO-nimotuzumab have been used [156–158]. The most relevant PET tracers for imaging ofHER2 overexpression are [64Cu]DOTA-trastuzumab and [89Zr]pertuzumab (Figure 3) [159,160].
4.2. Immuno-Imaging: Immuno-PET and Imaging of T-Cells
In recent years, immunotherapy with antibodies directed against immune checkpoints such as thecytotoxic T-lymphocyte antigen-4 (CTLA-4; e.g., ipilimumab), the programmed cell death receptor-1(PD-1; e.g., pembrolizumab, nivolumab), or the programmed cell death protein ligand 1 (PD-L1; e.g.,atezolizumab) have gained paramount importance in clinical oncology and neuro-oncology. However,the efficacy and responsiveness of these agents may vary considerably among different cancer typesand across individuals. Biomarkers obtained from tumor tissue, such as PD-1 and PD-L1 expression,can help to select patients. However, these tissue biomarkers are limited, and some patients show noresponse even if the target is present [161]. Therefore, the significance of PET for predicting responseto immunotherapy and patient selection increases. Among other methods, immuno-PET combinesantibodies or antibody fragments with a radionuclide and takes advantage of the specificity and affinityof antibodies and the sensitivity of PET [162]. Generally, targets for immuno-PET can be T-cell markers(e.g., CD4+, CD8+), immune checkpoints (e.g., CTLA-4, PD-1, PD-L1), or biomarkers of the immuneresponse (e.g., interferon-γ, interleukin-2) [23].
194

Molecules 2020, 25, 1471
Figure 3. [64Cu]-DOTA-trastuzumab positron-emission tomography (PET) and contrast-enhancedmagnetic resonance imaging (MRI) performed one day after initiation of treatment with trastuzumabin a patient with a human epidermal growth factor receptor 2 (HER2)-positive breast cancer withbrain metastases. In single brain metastases, [64Cu]-DOTA-trastuzumab PET helps to improve lesiondetection (arrow) (modified from Tamura et al. [160], with permission from the Society of NuclearMedicine and Molecular Imaging).
First-in-human studies suggest that targeting PD-1 with [89Zr]nivolumab [163] or PD-L1 with[89Zr]atezolizumab [164] is useful as imaging biomarkers to non-invasively evaluate the expressionof these immune checkpoints in patients with extra- and intracranial cancer [164,165]. Engineeredtarget-binding proteins (adnectins) for PD-L1 ligands such as [18F]BMS-986192 are currently underevaluation [166].
Tumor-infiltrating T-cells (such as CD8+) play an essential role in the activation of immunecells in response to checkpoint inhibition [167]. Recently, it has been shown that a radiolabeled[89Zr]IAB22M2C has the potential to visualize CD8+ T-cell-enriched tumor tissue [168]. The assessmentof immune cells infiltrating tumors has also been investigated with PET using radiolabeled clofarabine(2-chloro-2′-deoxy-2′-[18F]fluoro-9-b-D-arabinofuranosyl-adenine; [18F]CFA) [169]. [18F]CFA is asubstrate for the enzyme deoxy-cytidine kinase, which is overexpressed in immune cells such as CD8+
T-cells [169]. Importantly, [18F]CFA PET has shown a great clinical potential to localize and quantifyimmune responses in glioblastoma patients undergoing dendritic cell vaccination treatment combinedwith immune checkpoint blockade (Figure 4) [169].
Another interesting approach is the transfection of immune cells with a reporter gene that encodesa protein that can be specifically targeted by a radiolabeled reporter probe [170]. Imaging of reportergene expression of cells transfected with the herpes simplex virus type 1 thymidine kinase reportergene has been demonstrated using 9-[4-[18F]fluoro-3-(hydroxymethyl)butyl]guanine ([18F]FHBG) [171].Moreover, this technique has the potential to image recently introduced cell-based therapies withCAR-T cells [23]. Accordingly, a study with recurrent high-grade glioma patients suggested that[18F]FHBG PET can detect reporter gene expression in CAR-engineered cytotoxic T-lymphocytes [172].
4.3. PET Imaging of Isocitrate Dehydrogenase Mutations
In patients with malignant glioma, the modest outcome improvement following both standardtherapy (i.e., chemoradiation with temozolomide) and newer treatment options (e.g., tumor-treatingfields) has prompted various efforts to identify molecules that are fundamental to regulate tumorprogression and provide additional options for personalized therapy in this group of patients.
195
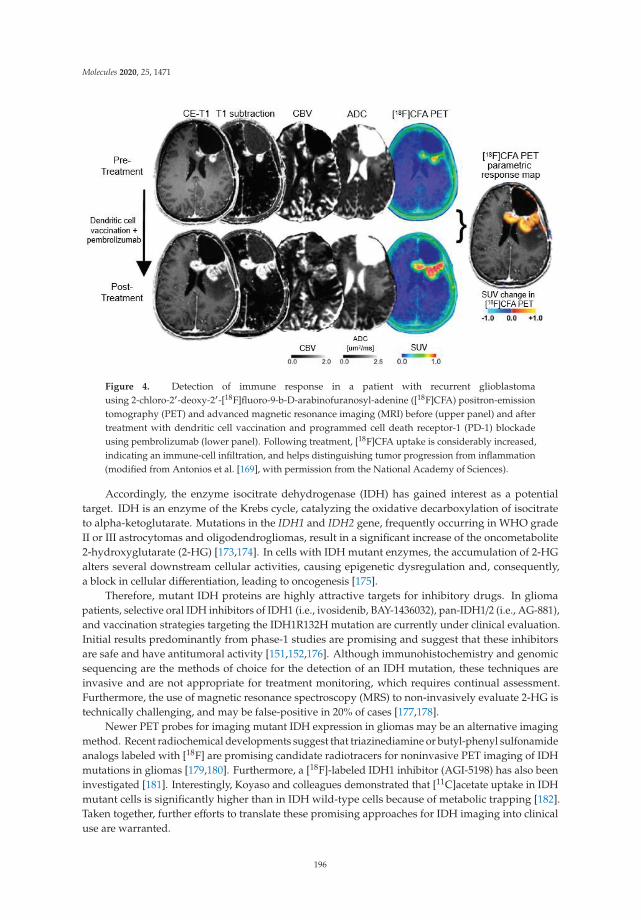
Molecules 2020, 25, 1471
Figure 4. Detection of immune response in a patient with recurrent glioblastomausing 2-chloro-2′-deoxy-2′-[18F]fluoro-9-b-D-arabinofuranosyl-adenine ([18F]CFA) positron-emissiontomography (PET) and advanced magnetic resonance imaging (MRI) before (upper panel) and aftertreatment with dendritic cell vaccination and programmed cell death receptor-1 (PD-1) blockadeusing pembrolizumab (lower panel). Following treatment, [18F]CFA uptake is considerably increased,indicating an immune-cell infiltration, and helps distinguishing tumor progression from inflammation(modified from Antonios et al. [169], with permission from the National Academy of Sciences).
Accordingly, the enzyme isocitrate dehydrogenase (IDH) has gained interest as a potentialtarget. IDH is an enzyme of the Krebs cycle, catalyzing the oxidative decarboxylation of isocitrateto alpha-ketoglutarate. Mutations in the IDH1 and IDH2 gene, frequently occurring in WHO gradeII or III astrocytomas and oligodendrogliomas, result in a significant increase of the oncometabolite2-hydroxyglutarate (2-HG) [173,174]. In cells with IDH mutant enzymes, the accumulation of 2-HGalters several downstream cellular activities, causing epigenetic dysregulation and, consequently,a block in cellular differentiation, leading to oncogenesis [175].
Therefore, mutant IDH proteins are highly attractive targets for inhibitory drugs. In gliomapatients, selective oral IDH inhibitors of IDH1 (i.e., ivosidenib, BAY-1436032), pan-IDH1/2 (i.e., AG-881),and vaccination strategies targeting the IDH1R132H mutation are currently under clinical evaluation.Initial results predominantly from phase-1 studies are promising and suggest that these inhibitorsare safe and have antitumoral activity [151,152,176]. Although immunohistochemistry and genomicsequencing are the methods of choice for the detection of an IDH mutation, these techniques areinvasive and are not appropriate for treatment monitoring, which requires continual assessment.Furthermore, the use of magnetic resonance spectroscopy (MRS) to non-invasively evaluate 2-HG istechnically challenging, and may be false-positive in 20% of cases [177,178].
Newer PET probes for imaging mutant IDH expression in gliomas may be an alternative imagingmethod. Recent radiochemical developments suggest that triazinediamine or butyl-phenyl sulfonamideanalogs labeled with [18F] are promising candidate radiotracers for noninvasive PET imaging of IDHmutations in gliomas [179,180]. Furthermore, a [18F]-labeled IDH1 inhibitor (AGI-5198) has also beeninvestigated [181]. Interestingly, Koyaso and colleagues demonstrated that [11C]acetate uptake in IDHmutant cells is significantly higher than in IDH wild-type cells because of metabolic trapping [182].Taken together, further efforts to translate these promising approaches for IDH imaging into clinicaluse are warranted.
196

Molecules 2020, 25, 1471
4.4. PET-Based Theranostics
The combination of therapeutics and diagnostics, also termed as theranostics, supports the conceptof precision oncology. One PET-based theranostic approach is the peptide receptor radionuclidetherapy (PRRT), in which overexpressed tumor-specific receptors are used as a therapeutic target.By exchanging the radionuclide used for diagnostic PET such as [68Ga] with a radiation source, typicallyß-emitters like [177Lu] or [90Y], the same PET tracer can be used for therapy. Although there are currentlyno theranostic approaches clinically established for gliomas or brain metastases, there are promisingconcepts. For example in patients with glioblastoma, a potential target is the overexpressed chemokinereceptor-4 (CXCR4) which is associated with a poor clinical outcome [183–185]. Visualization of CXCR4expression using diagnostic PET with CXCR4-directed [68Ga]Pentixafor® has been demonstrated inglioblastoma patients [186].
Another potential target is the prostate-specific membrane antigen (PSMA) which may beoverexpressed in prostate cancer and also in predominantly malignant gliomas. Diagnostic PETimaging of PSMA expression in patients with malignant glioma can be obtained using [68Ga]-labeledPSMA ligands [187–189]. The use of the theranostic agent [177Lu]-PSMA-617 has demonstratedfavorable safety and efficacy in patients with advanced prostate cancer, indicating the potential tobe also of value for patients with malignant glioma [190]. Nevertheless, the potential of theranosticsneeds to be further evaluated in patients with malignant gliomas.
5. Discussion
Anatomical MRI is currently the method of choice for neuroimaging of brain tumors, but PETcomplements this technique and provides important biological information that cannot be obtainedfrom anatomical MRI alone. Currently, best-established PET tracers in neuro-oncology are radiolabeledamino acids targeting L-system transporters. However, a considerable number of other PET tracershave been developed for brain tumor patients and allow the evaluation of a wide range of biochemicalprocesses. A variety of PET biomarkers offers the potential to play a clinically significant role for themonitoring of newer treatment options such as targeted therapy and immunotherapy, e.g., by providingan early assessment of response to these options, and for a more accurate differentiation of viabletumor from treatment-related changes. A major current shortcoming is the lack of large, prospectiveclinical trials in patients with both glioma and brain metastases for many of these PET tracers. Despiteencouraging early study results in the field, it has to be further demonstrated that these tracers improveconsiderably patient management and outcome.
Author Contributions: Study design, writing of manuscript drafts: J.W. and N.G. Revising manuscript, approvingfinal content of the manuscript: All. All authors have read and agreed to the published version of the manuscript.
Funding: The Cologne Clinician Scientist-Program (CCSP) of the Deutsche Forschungsgemeinschaft (DFG, FI773/15-1), Germany, supported this work.
Conflicts of Interest: Related to the present work, the authors disclosed no potential conflicts of interest.
References
1. Lohmann, P.; Stavrinou, P.; Lipke, K.; Bauer, E.K.; Ceccon, G.; Werner, J.M.; Neumaier, B.; Fink, G.R.;Shah, N.J.; Langen, K.J.; et al. FET PET reveals considerable spatial differences in tumour burden comparedto conventional MRI in newly diagnosed glioblastoma. Eur. J. Nucl. Med. Mol. Imaging 2019, 46, 591–602.[CrossRef]
2. Dhermain, F.G.; Hau, P.; Lanfermann, H.; Jacobs, A.H.; van den Bent, M.J. Advanced MRI and PET imagingfor assessment of treatment response in patients with gliomas. Lancet Neurol. 2010, 9, 906–920. [CrossRef]
3. Brandsma, D.; Stalpers, L.; Taal, W.; Sminia, P.; van den Bent, M.J. Clinical features, mechanisms, andmanagement of pseudoprogression in malignant gliomas. Lancet Oncol. 2008, 9, 453–461. [CrossRef]
197

Molecules 2020, 25, 1471
4. Hygino da Cruz, L.C., Jr.; Rodriguez, I.; Domingues, R.C.; Gasparetto, E.L.; Sorensen, A.G. Pseudoprogressionand pseudoresponse: Imaging challenges in the assessment of posttreatment glioma. AJNR Am. J. Neuroradiol.2011, 32, 1978–1985. [CrossRef]
5. Yang, I.; Aghi, M.K. New advances that enable identification of glioblastoma recurrence. Nat. Rev. Clin. Oncol.2009, 6, 648–657. [CrossRef]
6. Kumar, A.J.; Leeds, N.E.; Fuller, G.N.; Van Tassel, P.; Maor, M.H.; Sawaya, R.E.; Levin, V.A. Malignantgliomas: MR imaging spectrum of radiation therapy- and chemotherapy-induced necrosis of the brain aftertreatment. Radiology 2000, 217, 377–384. [CrossRef] [PubMed]
7. Langen, K.J.; Galldiks, N.; Hattingen, E.; Shah, N.J. Advances in neuro-oncology imaging. Nat. Rev. Neurol.2017, 13, 279–289. [CrossRef]
8. Galldiks, N.; Lohmann, P.; Albert, N.L.; Tonn, J.C.; Langen, K.-J. Current status of PET imaging inneuro-oncology. Neurooncol. Adv. 2019, 1. [CrossRef]
9. Brandsma, D.; van den Bent, M.J. Pseudoprogression and pseudoresponse in the treatment of gliomas. Curr.Opin. Neurol. 2009, 22, 633–638. [CrossRef]
10. Galldiks, N.; Kocher, M.; Ceccon, G.; Werner, J.M.; Brunn, A.; Deckert, M.; Pope, W.B.; Soffietti, R.; Le Rhun, E.;Weller, M.; et al. Imaging challenges of immunotherapy and targeted therapy in patients with brainmetastases: Response, progression, and pseudoprogression. Neuro Oncol. 2020, 22, 17–30. [CrossRef]
11. Galldiks, N.; Dunkl, V.; Stoffels, G.; Hutterer, M.; Rapp, M.; Sabel, M.; Reifenberger, G.; Kebir, S.;Dorn, F.; Blau, T.; et al. Diagnosis of pseudoprogression in patients with glioblastoma usingO-(2-[18F]fluoroethyl)-L-tyrosine PET. Eur. J. Nucl. Med. Mol. Imaging 2015, 42, 685–695. [CrossRef][PubMed]
12. Ahluwalia, M.S.; Wen, P.Y. Antiangiogenic therapy for patients with glioblastoma: Current challenges inimaging and future directions. Expert Rev. Anticancer Ther. 2011, 11, 653–656. [CrossRef]
13. Taal, W.; Brandsma, D.; de Bruin, H.G.; Bromberg, J.E.; Swaak-Kragten, A.T.; Smitt, P.A.; van Es, C.A.;van den Bent, M.J. Incidence of early pseudo-progression in a cohort of malignant glioma patients treatedwith chemoirradiation with temozolomide. Cancer 2008, 113, 405–410. [CrossRef]
14. Radbruch, A.; Fladt, J.; Kickingereder, P.; Wiestler, B.; Nowosielski, M.; Baumer, P.; Schlemmer, H.P.; Wick, A.;Heiland, S.; Wick, W.; et al. Pseudoprogression in patients with glioblastoma: Clinical relevance despite lowincidence. Neuro Oncol. 2015, 17, 151–159. [CrossRef]
15. Galldiks, N.; Kocher, M.; Langen, K.J. Pseudoprogression after glioma therapy: An update. Expert Rev.Neurother. 2017, 17, 1109–1115. [CrossRef] [PubMed]
16. Young, R.J.; Gupta, A.; Shah, A.D.; Graber, J.J.; Zhang, Z.; Shi, W.; Holodny, A.I.; Omuro, A.M. Potentialutility of conventional MRI signs in diagnosing pseudoprogression in glioblastoma. Neurology 2011, 76,1918–1924. [CrossRef] [PubMed]
17. Galldiks, N.; Langen, K.J.; Albert, N.L.; Chamberlain, M.; Soffietti, R.; Kim, M.M.; Law, I.; Le Rhun, E.;Chang, S.; Schwarting, J.; et al. PET imaging in patients with brain metastasis-report of the RANO/PETgroup. Neuro Oncol. 2019, 21, 585–595. [CrossRef] [PubMed]
18. Wen, P.Y.; Macdonald, D.R.; Reardon, D.A.; Cloughesy, T.F.; Sorensen, A.G.; Galanis, E.; Degroot, J.; Wick, W.;Gilbert, M.R.; Lassman, A.B.; et al. Updated response assessment criteria for high-grade gliomas: Responseassessment in neuro-oncology working group. J. Clin. Oncol. 2010, 28, 1963–1972. [CrossRef]
19. Reardon, D.A.; Weller, M. Pseudoprogression: Fact or wishful thinking in neuro-oncology? Lancet Oncol.2018, 19, 1561–1563. [CrossRef]
20. Nandu, H.; Wen, P.Y.; Huang, R.Y. Imaging in neuro-oncology. Ther. Adv. Neurol. Disord. 2018, 11. [CrossRef]21. Albert, N.L.; Weller, M.; Suchorska, B.; Galldiks, N.; Soffietti, R.; Kim, M.M.; la Fougere, C.; Pope, W.; Law, I.;
Arbizu, J.; et al. Response Assessment in Neuro-Oncology working group and European Association forNeuro-Oncology recommendations for the clinical use of PET imaging in gliomas. Neuro Oncol. 2016, 18,1199–1208. [CrossRef] [PubMed]
22. Wei, W.; Ni, D.; Ehlerding, E.B.; Luo, Q.Y.; Cai, W. PET Imaging of Receptor Tyrosine Kinases in Cancer.Mol. Cancer Ther. 2018, 17, 1625–1636. [CrossRef] [PubMed]
23. Wei, W.; Jiang, D.; Ehlerding, E.B.; Luo, Q.; Cai, W. Noninvasive PET Imaging of T cells. Trends Cancer 2018,4, 359–373. [CrossRef] [PubMed]
198

Molecules 2020, 25, 1471
24. Chernov, M.; Hayashi, M.; Izawa, M.; Ochiai, T.; Usukura, M.; Abe, K.; Ono, Y.; Muragaki, Y.; Kubo, O.;Hori, T.; et al. Differentiation of the radiation-induced necrosis and tumor recurrence after gamma kniferadiosurgery for brain metastases: Importance of multi-voxel proton MRS. Min-Minim. Invasive Neurosurg.2005, 48, 228–234. [CrossRef]
25. Hatzoglou, V.; Yang, T.J.; Omuro, A.; Gavrilovic, I.; Ulaner, G.; Rubel, J.; Schneider, T.; Woo, K.M.; Zhang, Z.;Peck, K.K.; et al. A prospective trial of dynamic contrast-enhanced MRI perfusion and fluorine-18 FDGPET-CT in differentiating brain tumor progression from radiation injury after cranial irradiation. NeuroOncol. 2016, 18, 873–880. [CrossRef]
26. Tomura, N.; Kokubun, M.; Saginoya, T.; Mizuno, Y.; Kikuchi, Y. Differentiation between Treatment-InducedNecrosis and Recurrent Tumors in Patients with Metastatic Brain Tumors: Comparison among(11)C-Methionine-PET, FDG-PET, MR Permeability Imaging, and MRI-ADC-Preliminary Results. AJNR Am.J. Neuroradiol. 2017, 38, 1520–1527. [CrossRef]
27. Palmedo, H.; Urbach, H.; Bender, H.; Schlegel, U.; Schmidt-Wolf, I.G.; Matthies, A.; Linnebank, M.; Joe, A.;Bucerius, J.; Biersack, H.J.; et al. FDG-PET in immunocompetent patients with primary central nervoussystem lymphoma: Correlation with MRI and clinical follow-up. Eur. J. Nucl. Med. Mol. Imaging 2006, 33,164–168. [CrossRef]
28. Birsen, R.; Blanc, E.; Willems, L.; Burroni, B.; Legoff, M.; Le Ray, E.; Pilorge, S.; Salah, S.; Quentin, A.; Deau, B.;et al. Prognostic value of early 18F-FDG PET scanning evaluation in immunocompetent primary CNSlymphoma patients. Oncotarget 2018, 9, 16822–16831. [CrossRef]
29. Chiavazza, C.; Pellerino, A.; Ferrio, F.; Cistaro, A.; Soffietti, R.; Ruda, R. Primary CNS Lymphomas: Challengesin Diagnosis and Monitoring. Biomed. Res. Int. 2018, 2018, 3606970. [CrossRef]
30. Herholz, K.; Langen, K.J.; Schiepers, C.; Mountz, J.M. Brain tumors. Semin. Nucl. Med. 2012, 42, 356–370.[CrossRef]
31. Langen, K.J.; Watts, C. Neuro-oncology: Amino acid PET for brain tumours—Ready for the clinic? Nat. Rev.Neurol. 2016, 12, 375–376. [CrossRef] [PubMed]
32. Law, I.; Albert, N.L.; Arbizu, J.; Boellaard, R.; Drzezga, A.; Galldiks, N.; la Fougere, C.; Langen, K.J.; Lopci, E.;Lowe, V.; et al. Joint EANM/EANO/RANO practice guidelines/SNMMI procedure standards for imagingof gliomas using PET with radiolabelled amino acids and [(18)F]FDG: Version 1.0. Eur. J. Nucl. Med. Mol.Imaging 2019, 46, 540–557. [CrossRef] [PubMed]
33. Drake, L.R.; Hillmer, A.T.; Cai, Z. Approaches to PET Imaging of Glioblastoma. Molecules 2020, 25, 568.[CrossRef]
34. Youland, R.S.; Kitange, G.J.; Peterson, T.E.; Pafundi, D.H.; Ramiscal, J.A.; Pokorny, J.L.; Giannini, C.;Laack, N.N.; Parney, I.F.; Lowe, V.J.; et al. The role of LAT1 in (18)F-DOPA uptake in malignant gliomas.J. Neurooncol. 2013, 111, 11–18. [CrossRef] [PubMed]
35. Papin-Michault, C.; Bonnetaud, C.; Dufour, M.; Almairac, F.; Coutts, M.; Patouraux, S.; Virolle, T.; Darcourt, J.;Burel-Vandenbos, F. Study of LAT1 Expression in Brain Metastases: Towards a Better Understanding ofthe Results of Positron Emission Tomography Using Amino Acid Tracers. PLoS ONE 2016, 11, e0157139.[CrossRef] [PubMed]
36. Wiriyasermkul, P.; Nagamori, S.; Tominaga, H.; Oriuchi, N.; Kaira, K.; Nakao, H.; Kitashoji, T.; Ohgaki, R.;Tanaka, H.; Endou, H.; et al. Transport of 3-fluoro-L-alpha-methyl-tyrosine by tumor-upregulated L-typeamino acid transporter 1: A cause of the tumor uptake in PET. J. Nucl. Med. 2012, 53, 1253–1261. [CrossRef]
37. Okubo, S.; Zhen, H.N.; Kawai, N.; Nishiyama, Y.; Haba, R.; Tamiya, T. Correlation of L-methyl-11C-methionine(MET) uptake with L-type amino acid transporter 1 in human gliomas. J. Neurooncol. 2010, 99, 217–225.[CrossRef] [PubMed]
38. Haining, Z.; Kawai, N.; Miyake, K.; Okada, M.; Okubo, S.; Zhang, X.; Fei, Z.; Tamiya, T. Relation of LAT1/4F2hcexpression with pathological grade, proliferation and angiogenesis in human gliomas. BMC Clin. Pathol.2012, 12, 4. [CrossRef]
39. Kracht, L.W.; Friese, M.; Herholz, K.; Schroeder, R.; Bauer, B.; Jacobs, A.; Heiss, W.D. Methyl-[11C]-l-methionine uptake as measured by positron emission tomography correlates to microvessel density inpatients with glioma. Eur. J. Nucl. Med. Mol. Imaging 2003, 30, 868–873. [CrossRef]
40. Langen, K.J.; Hamacher, K.; Weckesser, M.; Floeth, F.; Stoffels, G.; Bauer, D.; Coenen, H.H.; Pauleit, D.O-(2-[18F]fluoroethyl)-L-tyrosine: Uptake mechanisms and clinical applications. Nucl. Med. Biol. 2006, 33,287–294. [CrossRef]
199
Molecules 2020, 25, 1471
41. Galldiks, N.; Law, I.; Pope, W.B.; Arbizu, J.; Langen, K.J. The use of amino acid PET and conventional MRIfor monitoring of brain tumor therapy. Neuroimage Clin. 2017, 13, 386–394. [CrossRef] [PubMed]
42. Cicone, F.; Filss, C.P.; Minniti, G.; Rossi-Espagnet, C.; Papa, A.; Scaringi, C.; Galldiks, N.; Bozzao, A.;Shah, N.J.; Scopinaro, F.; et al. Volumetric assessment of recurrent or progressive gliomas: Comparisonbetween F-DOPA PET and perfusion-weighted MRI. Eur. J. Nucl. Med. Mol. Imaging 2015, 42, 905–915.[CrossRef]
43. Juhasz, C.; Dwivedi, S.; Kamson, D.O.; Michelhaugh, S.K.; Mittal, S. Comparison of amino acid positronemission tomographic radiotracers for molecular imaging of primary and metastatic brain tumors. Mol.Imaging 2014, 13. [CrossRef]
44. Uyttenhove, C.; Pilotte, L.; Theate, I.; Stroobant, V.; Colau, D.; Parmentier, N.; Boon, T.; Van den Eynde, B.J.Evidence for a tumoral immune resistance mechanism based on tryptophan degradation by indoleamine2,3-dioxygenase. Nat. Med. 2003, 9, 1269–1274. [CrossRef] [PubMed]
45. Batista, C.E.; Juhasz, C.; Muzik, O.; Kupsky, W.J.; Barger, G.; Chugani, H.T.; Mittal, S.; Sood, S.;Chakraborty, P.K.; Chugani, D.C. Imaging correlates of differential expression of indoleamine 2,3-dioxygenasein human brain tumors. Mol. Imaging Biol. 2009, 11, 460–466. [CrossRef] [PubMed]
46. Choudhary, G.; Langen, K.J.; Galldiks, N.; McConathy, J. Investigational PET tracers for high-grade gliomas.Q. J. Nucl. Med. Mol. Imaging 2018, 62, 281–294. [CrossRef] [PubMed]
47. Fuchs, B.C.; Bode, B.P. Amino acid transporters ASCT2 and LAT1 in cancer: Partners in crime?Semin. Cancer Biol. 2005, 15, 254–266. [CrossRef] [PubMed]
48. Scalise, M.; Pochini, L.; Console, L.; Losso, M.A.; Indiveri, C. The Human SLC1A5 (ASCT2) Amino AcidTransporter: From Function to Structure and Role in Cell Biology. Front. Cell Dev. Biol. 2018, 6, 96. [CrossRef]
49. Schuster, D.M.; Nanni, C.; Fanti, S.; Oka, S.; Okudaira, H.; Inoue, Y.; Sorensen, J.; Owenius, R.; Choyke, P.;Turkbey, B.; et al. Anti-1-amino-3-18F-fluorocyclobutane-1-carboxylic acid: Physiologic uptake patterns,incidental findings, and variants that may simulate disease. J. Nucl. Med. 2014, 55, 1986–1992. [CrossRef]
50. Hayes, A.R.; Jayamanne, D.; Hsiao, E.; Schembri, G.P.; Bailey, D.L.; Roach, P.J.; Khasraw, M.; Newey, A.;Wheeler, H.R.; Back, M. Utilizing 18F-fluoroethyltyrosine (FET) positron emission tomography (PET) todefine suspected nonenhancing tumor for radiation therapy planning of glioblastoma. Pract. Radiat. Oncol.2018, 8, 230–238. [CrossRef]
51. Kracht, L.W.; Miletic, H.; Busch, S.; Jacobs, A.H.; Voges, J.; Hoevels, M.; Klein, J.C.; Herholz, K.; Heiss, W.D.Delineation of brain tumor extent with [11C]L-methionine positron emission tomography: Local comparisonwith stereotactic histopathology. Clin. Cancer Res. 2004, 10, 7163–7170. [CrossRef] [PubMed]
52. Lopez, W.O.; Cordeiro, J.G.; Albicker, U.; Doostkam, S.; Nikkhah, G.; Kirch, R.D.; Trippel, M.;Reithmeier, T. Correlation of (18)F-fluoroethyl tyrosine positron-emission tomography uptake valuesand histomorphological findings by stereotactic serial biopsy in newly diagnosed brain tumors using arefined software tool. Onco Targets Ther. 2015, 8, 3803–3815. [CrossRef] [PubMed]
53. Pauleit, D.; Floeth, F.; Hamacher, K.; Riemenschneider, M.J.; Reifenberger, G.; Muller, H.W.; Zilles, K.;Coenen, H.H.; Langen, K.J. O-(2-[18F]fluoroethyl)-L-tyrosine PET combined with MRI improves thediagnostic assessment of cerebral gliomas. Brain 2005, 128, 678–687. [CrossRef] [PubMed]
54. Bogsrud, T.V.; Londalen, A.; Brandal, P.; Leske, H.; Panagopoulos, I.; Borghammer, P.; Bach-Gansmo, T.18F-Fluciclovine PET/CT in Suspected Residual or Recurrent High-Grade Glioma. Clin. Nucl. Med. 2019.[CrossRef] [PubMed]
55. Michaud, L.; Beattie, B.J.; Akhurst, T.; Dunphy, M.; Zanzonico, P.; Finn, R.; Mauguen, A.; Schoder, H.;Weber, W.A.; Lassman, A.B.; et al. (18)F-Fluciclovine ((18)F-FACBC) PET imaging of recurrent brain tumors.Eur. J. Nucl. Med. Mol. Imaging 2019. [CrossRef] [PubMed]
56. Tsuyuguchi, N.; Terakawa, Y.; Uda, T.; Nakajo, K.; Kanemura, Y. Diagnosis of Brain Tumors Using AminoAcid Transport PET Imaging with (18)F-fluciclovine: A Comparative Study with L-methyl-(11)C-methioninePET Imaging. Asia Ocean. J. Nucl. Med. Biol. 2017, 5, 85–94. [CrossRef] [PubMed]
57. Galldiks, N.; Ullrich, R.; Schroeter, M.; Fink, G.R.; Jacobs, A.H.; Kracht, L.W. Volumetry of [(11)C]-methioninePET uptake and MRI contrast enhancement in patients with recurrent glioblastoma multiforme. Eur. J. Nucl.Med. Mol. Imaging 2010, 37, 84–92. [CrossRef]
200

Molecules 2020, 25, 1471
58. Grosu, A.L.; Astner, S.T.; Riedel, E.; Nieder, C.; Wiedenmann, N.; Heinemann, F.; Schwaiger, M.; Molls, M.;Wester, H.J.; Weber, W.A. An interindividual comparison of O-(2-[18F]fluoroethyl)-L-tyrosine (FET)- andL-[methyl-11C]methionine (MET)-PET in patients with brain gliomas and metastases. Int. J. Radiat. Oncol.Biol. Phys. 2011, 81, 1049–1058. [CrossRef]
59. Becherer, A.; Karanikas, G.; Szabo, M.; Zettinig, G.; Asenbaum, S.; Marosi, C.; Henk, C.; Wunderbaldinger, P.;Czech, T.; Wadsak, W.; et al. Brain tumour imaging with PET: A comparison between [18F]fluorodopa and[11C]methionine. Eur. J. Nucl. Med. Mol. Imaging 2003, 30, 1561–1567. [CrossRef]
60. Kratochwil, C.; Combs, S.E.; Leotta, K.; Afshar-Oromieh, A.; Rieken, S.; Debus, J.; Haberkorn, U.; Giesel, F.L.Intra-individual comparison of (1)(8)F-FET and (1)(8)F-DOPA in PET imaging of recurrent brain tumors.Neuro Oncol. 2014, 16, 434–440. [CrossRef]
61. Lapa, C.; Linsenmann, T.; Monoranu, C.M.; Samnick, S.; Buck, A.K.; Bluemel, C.; Czernin, J.; Kessler, A.F.;Homola, G.A.; Ernestus, R.I.; et al. Comparison of the amino acid tracers 18F-FET and 18F-DOPA inhigh-grade glioma patients. J. Nucl. Med. 2014, 55, 1611–1616. [CrossRef] [PubMed]
62. Louis, D.N.; Perry, A.; Reifenberger, G.; von Deimling, A.; Figarella-Branger, D.; Cavenee, W.K.; Ohgaki, H.;Wiestler, O.D.; Kleihues, P.; Ellison, D.W. The 2016 World Health Organization Classification of Tumors ofthe Central Nervous System: A summary. Acta Neuropathol. 2016, 131, 803–820. [CrossRef] [PubMed]
63. Louis, D.N.; Ohgaki, H.; Wiestler, O.D.; Cavenee, W.K.; Burger, P.C.; Jouvet, A.; Scheithauer, B.W.; Kleihues, P.The 2007 WHO classification of tumours of the central nervous system. Acta Neuropathol. 2007, 114, 97–109.[CrossRef] [PubMed]
64. Pichler, R.; Dunzinger, A.; Wurm, G.; Pichler, J.; Weis, S.; Nussbaumer, K.; Topakian, R.; Aigner, R.M. Is therea place for FET PET in the initial evaluation of brain lesions with unknown significance? Eur. J. Nucl. Med.Mol. Imaging 2010, 37, 1521–1528. [CrossRef] [PubMed]
65. Hutterer, M.; Nowosielski, M.; Putzer, D.; Jansen, N.L.; Seiz, M.; Schocke, M.; McCoy, M.; Gobel, G.;la Fougere, C.; Virgolini, I.J.; et al. [18F]-fluoro-ethyl-L-tyrosine PET: A valuable diagnostic tool inneuro-oncology, but not all that glitters is glioma. Neuro Oncol. 2013, 15, 341–351. [CrossRef]
66. Jansen, N.L.; Graute, V.; Armbruster, L.; Suchorska, B.; Lutz, J.; Eigenbrod, S.; Cumming, P.; Bartenstein, P.;Tonn, J.C.; Kreth, F.W.; et al. MRI-suspected low-grade glioma: Is there a need to perform dynamic FET PET?Eur. J. Nucl. Med. Mol. Imaging 2012, 39, 1021–1029. [CrossRef]
67. Werner, J.M.; Stoffels, G.; Lichtenstein, T.; Borggrefe, J.; Lohmann, P.; Ceccon, G.; Shah, N.J.; Fink, G.R.;Langen, K.J.; Kabbasch, C.; et al. Differentiation of treatment-related changes from tumour progression: Adirect comparison between dynamic FET PET and ADC values obtained from DWI MRI. Eur. J. Nucl. Med.Mol. Imaging 2019, 46, 1889–1901. [CrossRef]
68. Kebir, S.; Fimmers, R.; Galldiks, N.; Schafer, N.; Mack, F.; Schaub, C.; Stuplich, M.; Niessen, M.;Tzaridis, T.; Simon, M.; et al. Late Pseudoprogression in Glioblastoma: Diagnostic Value of DynamicO-(2-[18F]fluoroethyl)-L-Tyrosine PET. Clin. Cancer Res. 2016, 22, 2190–2196. [CrossRef]
69. Popperl, G.; Gotz, C.; Rachinger, W.; Gildehaus, F.J.; Tonn, J.C.; Tatsch, K. Value of O-(2-[18F]fluoroethyl)-L-tyrosine PET for the diagnosis of recurrent glioma. Eur. J. Nucl. Med. Mol. Imaging 2004, 31, 1464–1470.[CrossRef]
70. Rachinger, W.; Goetz, C.; Popperl, G.; Gildehaus, F.J.; Kreth, F.W.; Holtmannspotter, M.; Herms, J.; Koch, W.;Tatsch, K.; Tonn, J.C. Positron emission tomography with O-(2-[18F]fluoroethyl)-l-tyrosine versus magneticresonance imaging in the diagnosis of recurrent gliomas. Neurosurgery 2005, 57, 505–511. [CrossRef]
71. Mihovilovic, M.I.; Kertels, O.; Hanscheid, H.; Lohr, M.; Monoranu, C.M.; Kleinlein, I.; Samnick, S.; Kessler, A.F.;Linsenmann, T.; Ernestus, R.I.; et al. O-(2-((18)F)fluoroethyl)-L-tyrosine PET for the differentiation of tumourrecurrence from late pseudoprogression in glioblastoma. J. Neurol. Neurosurg. Psychiatry 2019, 90, 238–239.[CrossRef] [PubMed]
72. Mehrkens, J.H.; Popperl, G.; Rachinger, W.; Herms, J.; Seelos, K.; Tatsch, K.; Tonn, J.C.; Kreth, F.W. The positivepredictive value of O-(2-[18F]fluoroethyl)-L-tyrosine (FET) PET in the diagnosis of a glioma recurrence aftermultimodal treatment. J. Neurooncol. 2008, 88, 27–35. [CrossRef] [PubMed]
73. Jena, A.; Taneja, S.; Gambhir, A.; Mishra, A.K.; D’Souza, M.M.; Verma, S.M.; Hazari, P.P.; Negi, P.; Jhadav, G.K.;Sogani, S.K. Glioma Recurrence Versus Radiation Necrosis: Single-Session Multiparametric Approach UsingSimultaneous O-(2-18F-Fluoroethyl)-L-Tyrosine PET/MRI. Clin. Nucl. Med. 2016, 41, e228–e236. [CrossRef][PubMed]
201

Molecules 2020, 25, 1471
74. Pyka, T.; Hiob, D.; Preibisch, C.; Gempt, J.; Wiestler, B.; Schlegel, J.; Straube, C.; Zimmer, C. Diagnosis ofglioma recurrence using multiparametric dynamic 18F-fluoroethyl-tyrosine PET-MRI. Eur. J. Radiol. 2018,103, 32–37. [CrossRef]
75. Galldiks, N.; Stoffels, G.; Filss, C.; Rapp, M.; Blau, T.; Tscherpel, C.; Ceccon, G.; Dunkl, V.; Weinzierl, M.;Stoffel, M.; et al. The use of dynamic O-(2-18F-fluoroethyl)-l-tyrosine PET in the diagnosis of patients withprogressive and recurrent glioma. Neuro Oncol. 2015, 17, 1293–1300. [CrossRef]
76. Ceccon, G.; Lohmann, P.; Stoffels, G.; Judov, N.; Filss, C.P.; Rapp, M.; Bauer, E.; Hamisch, C.; Ruge, M.I.;Kocher, M.; et al. Dynamic O-(2-18F-fluoroethyl)-L-tyrosine positron emission tomography differentiatesbrain metastasis recurrence from radiation injury after radiotherapy. Neuro Oncol. 2017, 19, 281–288.[CrossRef]
77. Tsuyuguchi, N.; Sunada, I.; Iwai, Y.; Yamanaka, K.; Tanaka, K.; Takami, T.; Otsuka, Y.; Sakamoto, S.; Ohata, K.;Goto, T.; et al. Methionine positron emission tomography of recurrent metastatic brain tumor and radiationnecrosis after stereotactic radiosurgery: Is a differential diagnosis possible? J. Neurosurg. 2003, 98, 1056–1064.[CrossRef]
78. Galldiks, N.; Stoffels, G.; Filss, C.P.; Piroth, M.D.; Sabel, M.; Ruge, M.I.; Herzog, H.; Shah, N.J.; Fink, G.R.;Coenen, H.H.; et al. Role of O-(2-(18)F-fluoroethyl)-L-tyrosine PET for differentiation of local recurrent brainmetastasis from radiation necrosis. J. Nucl. Med. 2012, 53, 1367–1374. [CrossRef]
79. Lizarraga, K.J.; Allen-Auerbach, M.; Czernin, J.; DeSalles, A.A.; Yong, W.H.; Phelps, M.E.; Chen, W.(18)F-FDOPA PET for differentiating recurrent or progressive brain metastatic tumors from late or delayedradiation injury after radiation treatment. J. Nucl. Med. 2014, 55, 30–36. [CrossRef]
80. Cicone, F.; Minniti, G.; Romano, A.; Papa, A.; Scaringi, C.; Tavanti, F.; Bozzao, A.; Maurizi Enrici, R.;Scopinaro, F. Accuracy of F-DOPA PET and perfusion-MRI for differentiating radionecrotic from progressivebrain metastases after radiosurgery. Eur. J. Nucl. Med. Mol. Imaging 2015, 42, 103–111. [CrossRef]
81. Terakawa, Y.; Tsuyuguchi, N.; Iwai, Y.; Yamanaka, K.; Higashiyama, S.; Takami, T.; Ohata, K. Diagnosticaccuracy of 11C-methionine PET for differentiation of recurrent brain tumors from radiation necrosis afterradiotherapy. J. Nucl. Med. 2008, 49, 694–699. [CrossRef] [PubMed]
82. Nihashi, T.; Dahabreh, I.J.; Terasawa, T. Diagnostic accuracy of PET for recurrent glioma diagnosis:A meta-analysis. AJNR Am. J. Neuroradiol. 2013, 34, 944–950. [CrossRef] [PubMed]
83. Minamimoto, R.; Saginoya, T.; Kondo, C.; Tomura, N.; Ito, K.; Matsuo, Y.; Matsunaga, S.; Shuto, T.;Akabane, A.; Miyata, Y.; et al. Differentiation of Brain Tumor Recurrence from Post-Radiotherapy Necrosiswith 11C-Methionine PET: Visual Assessment versus Quantitative Assessment. PLoS ONE 2015, 10, e0132515.[CrossRef]
84. Salber, D.; Stoffels, G.; Pauleit, D.; Oros-Peusquens, A.M.; Shah, N.J.; Klauth, P.; Hamacher, K.; Coenen, H.H.;Langen, K.J. Differential uptake of O-(2-18F-fluoroethyl)-L-tyrosine, L-3H-methionine, and 3H-deoxyglucosein brain abscesses. J. Nucl. Med. 2007, 48, 2056–2062. [CrossRef] [PubMed]
85. Alkonyi, B.; Barger, G.R.; Mittal, S.; Muzik, O.; Chugani, D.C.; Bahl, G.; Robinette, N.L.; Kupsky, W.J.;Chakraborty, P.K.; Juhasz, C. Accurate differentiation of recurrent gliomas from radiation injury by kineticanalysis of alpha-11C-methyl-L-tryptophan PET. J. Nucl. Med. 2012, 53, 1058–1064. [CrossRef] [PubMed]
86. Henderson, F.; Brem, S.; O’Rourke, D.M.; Nasrallah, M.; Buch, V.P.; Young, A.J.; Doot, R.K.; Pantel, A.;Desai, A.; Bagley, S.J.; et al. 18F-Fluciclovine PET to distinguish treatment-related effects from diseaseprogression in recurrent glioblastoma: PET fusion with MRI guides neurosurgical sampling. Neurooncol.Pract. 2019. [CrossRef]
87. Long, G.V.; Atkinson, V.; Lo, S.; Sandhu, S.; Guminski, A.D.; Brown, M.P.; Wilmott, J.S.; Edwards, J.;Gonzalez, M.; Scolyer, R.A.; et al. Combination nivolumab and ipilimumab or nivolumab alone in melanomabrain metastases: A multicentre randomised phase 2 study. Lancet Oncol. 2018, 19, 672–681. [CrossRef]
88. Galldiks, N.; Abdulla, D.S.Y.; Scheffler, M.; Schweinsberg, V.; Schlaak, M.; Kreuzberg, N.; Landsberg, J.;Lohmann, P.; Ceccon, G.; Werner, J.M.; et al. Treatment monitoring of immunotherapy and targeted therapyusing FET PET in patients with melanoma and lung cancer brain metastases: Initial experiences. J. Clin. Oncol.2019, 37, e13525. [CrossRef]
89. Kristin Schmitz, A.; Sorg, R.V.; Stoffels, G.; Grauer, O.M.; Galldiks, N.; Steiger, H.J.; Kamp, M.A.; Langen, K.J.;Sabel, M.; Rapp, M. Diagnostic impact of additional O-(2-[18F]fluoroethyl)-L-tyrosine ((18)F-FET) PETfollowing immunotherapy with dendritic cell vaccination in glioblastoma patients. Br. J. Neurosurg. 2019.[CrossRef]
202
Molecules 2020, 25, 1471
90. Galldiks, N.; Werner, J.M.; Tscherpel, C.; Fink, G.R.; Langen, K.J. Imaging findings following regorafenibin malignant gliomas: FET PET adds valuable information to anatomical MRI. Neurooncol. Adv. 2019, 1.[CrossRef]
91. Galldiks, N.; Kracht, L.W.; Burghaus, L.; Ullrich, R.T.; Backes, H.; Brunn, A.; Heiss, W.D.; Jacobs, A.H.Patient-tailored, imaging-guided, long-term temozolomide chemotherapy in patients with glioblastoma.Mol. Imaging 2010, 9, 40–46. [CrossRef] [PubMed]
92. Galldiks, N.; Kracht, L.W.; Burghaus, L.; Thomas, A.; Jacobs, A.H.; Heiss, W.D.; Herholz, K. Use of11C-methionine PET to monitor the effects of temozolomide chemotherapy in malignant gliomas. Eur. J.Nucl. Med. Mol. Imaging 2006, 33, 516–524. [CrossRef] [PubMed]
93. Herholz, K.; Kracht, L.W.; Heiss, W.D. Monitoring the effect of chemotherapy in a mixed glioma byC-11-methionine PET. J. Neuroimaging 2003, 13, 269–271. [CrossRef] [PubMed]
94. Galldiks, N.; Langen, K.J.; Holy, R.; Pinkawa, M.; Stoffels, G.; Nolte, K.W.; Kaiser, H.J.; Filss, C.P.;Fink, G.R.; Coenen, H.H.; et al. Assessment of treatment response in patients with glioblastoma usingO-(2-18F-fluoroethyl)-L-tyrosine PET in comparison to MRI. J. Nucl. Med. 2012, 53, 1048–1057. [CrossRef][PubMed]
95. Piroth, M.D.; Pinkawa, M.; Holy, R.; Klotz, J.; Nussen, S.; Stoffels, G.; Coenen, H.H.; Kaiser, H.J.;Langen, K.J.; Eble, M.J. Prognostic value of early [18F]fluoroethyltyrosine positron emission tomographyafter radiochemotherapy in glioblastoma multiforme. Int. J. Radiat. Oncol. Biol. Phys. 2011, 80, 176–184.[CrossRef] [PubMed]
96. Wyss, M.; Hofer, S.; Bruehlmeier, M.; Hefti, M.; Uhlmann, C.; Bartschi, E.; Buettner, U.W.; Roelcke, U. Earlymetabolic responses in temozolomide treated low-grade glioma patients. J. Neurooncol. 2009, 95, 87–93.[CrossRef]
97. Roelcke, U.; Wyss, M.T.; Nowosielski, M.; Ruda, R.; Roth, P.; Hofer, S.; Galldiks, N.; Crippa, F.; Weller, M.;Soffietti, R. Amino acid positron emission tomography to monitor chemotherapy response and predictseizure control and progression-free survival in WHO grade II gliomas. Neuro Oncol. 2016, 18, 744–751.[CrossRef]
98. Suchorska, B.; Unterrainer, M.; Biczok, A.; Sosnova, M.; Forbrig, R.; Bartenstein, P.; Tonn, J.C.; Albert, N.L.;Kreth, F.W. (18)F-FET-PET as a biomarker for therapy response in non-contrast enhancing glioma followingchemotherapy. J. Neurooncol. 2018, 139, 721–730. [CrossRef]
99. Galldiks, N.; Rapp, M.; Stoffels, G.; Dunkl, V.; Sabel, M.; Langen, K.J. Earlier diagnosis of progressive diseaseduring bevacizumab treatment using O-(2-18F-fluorethyl)-L-tyrosine positron emission tomography incomparison with magnetic resonance imaging. Mol. Imaging 2013, 12, 273–276. [CrossRef]
100. Morana, G.; Piccardo, A.; Garre, M.L.; Nozza, P.; Consales, A.; Rossi, A. Multimodal magnetic resonanceimaging and 18F-L-dihydroxyphenylalanine positron emission tomography in early characterization ofpseudoresponse and nonenhancing tumor progression in a pediatric patient with malignant transformationof ganglioglioma treated with bevacizumab. J. Clin. Oncol. 2013, 31, e1. [CrossRef]
101. Hutterer, M.; Nowosielski, M.; Putzer, D.; Waitz, D.; Tinkhauser, G.; Kostron, H.; Muigg, A.; Virgolini, I.J.;Staffen, W.; Trinka, E.; et al. O-(2-18F-fluoroethyl)-L-tyrosine PET predicts failure of antiangiogenic treatmentin patients with recurrent high-grade glioma. J. Nucl. Med. 2011, 52, 856–864. [CrossRef] [PubMed]
102. Galldiks, N.; Rapp, M.; Stoffels, G.; Fink, G.R.; Shah, N.J.; Coenen, H.H.; Sabel, M.; Langen, K.-J. Responseassessment of bevacizumab in patients with recurrent malignant glioma using [18F]Fluoroethyl-l-tyrosinePET in comparison to MRI. Eur. J. Nucl. Med. Mol. Imaging 2012, 40, 22–33. [CrossRef] [PubMed]
103. Galldiks, N.; Dunkl, V.; Ceccon, G.; Tscherpel, C.; Stoffels, G.; Law, I.; Henriksen, O.M.; Muhic, A.;Poulsen, H.S.; Steger, J.; et al. Early treatment response evaluation using FET PET compared to MRI inglioblastoma patients at first progression treated with bevacizumab plus lomustine. Eur. J. Nucl. Med. Mol.Imaging 2018, 45, 2377–2386. [CrossRef] [PubMed]
104. Schwarzenberg, J.; Czernin, J.; Cloughesy, T.F.; Ellingson, B.M.; Pope, W.B.; Grogan, T.; Elashoff, D.; Geist, C.;Silverman, D.H.; Phelps, M.E.; et al. Treatment response evaluation using 18F-FDOPA PET in patients withrecurrent malignant glioma on bevacizumab therapy. Clin. Cancer Res. 2014, 20, 3550–3559. [CrossRef]
105. Stupp, R.; Taillibert, S.; Kanner, A.; Read, W.; Steinberg, D.; Lhermitte, B.; Toms, S.; Idbaih, A.; Ahluwalia, M.S.;Fink, K.; et al. Effect of Tumor-Treating Fields Plus Maintenance Temozolomide vs MaintenanceTemozolomide Alone on Survival in Patients With Glioblastoma: A Randomized Clinical Trial. JAMA 2017,318, 2306–2316. [CrossRef]
203

Molecules 2020, 25, 1471
106. Bosnyak, E.; Barger, G.R.; Michelhaugh, S.K.; Robinette, N.L.; Amit-Yousif, A.; Mittal, S.; Juhasz, C. AminoAcid PET Imaging of the Early Metabolic Response During Tumor-Treating Fields (TTFields) Therapy inRecurrent Glioblastoma. Clin. Nucl. Med. 2018, 43, 176–179. [CrossRef]
107. Ceccon, G.; Lazaridis, L.; Stoffels, G.; Rapp, M.; Weber, M.; Blau, T.; Lohmann, P.; Kebir, S.; Herrmann, K.;Fink, G.R.; et al. Use of FET PET in glioblastoma patients undergoing neurooncological treatment includingtumour-treating fields: Initial experience. Eur. J. Nucl. Med. Mol. Imaging 2018, 45, 1626–1635. [CrossRef]
108. Chen, M.K.; Baidoo, K.; Verina, T.; Guilarte, T.R. Peripheral benzodiazepine receptor imaging in CNSdemyelination: Functional implications of anatomical and cellular localization. Brain 2004, 127, 1379–1392.[CrossRef]
109. Papadopoulos, V.; Baraldi, M.; Guilarte, T.R.; Knudsen, T.B.; Lacapere, J.J.; Lindemann, P.; Norenberg, M.D.;Nutt, D.; Weizman, A.; Zhang, M.R.; et al. Translocator protein (18kDa): New nomenclature for theperipheral-type benzodiazepine receptor based on its structure and molecular function. Trends Pharmacol.Sci. 2006, 27, 402–409. [CrossRef]
110. Schweitzer, P.J.; Fallon, B.A.; Mann, J.J.; Kumar, J.S. PET tracers for the peripheral benzodiazepine receptorand uses thereof. Drug Discov. Today 2010, 15, 933–942. [CrossRef]
111. Su, Z.; Roncaroli, F.; Durrenberger, P.F.; Coope, D.J.; Karabatsou, K.; Hinz, R.; Thompson, G.; Turkheimer, F.E.;Janczar, K.; Du Plessis, D.; et al. The 18-kDa mitochondrial translocator protein in human gliomas: An11C-(R)PK11195 PET imaging and neuropathology study. J. Nucl. Med. 2015, 56, 512–517. [CrossRef][PubMed]
112. Su, Z.; Herholz, K.; Gerhard, A.; Roncaroli, F.; Du Plessis, D.; Jackson, A.; Turkheimer, F.; Hinz, R.[(1)(1)C]-(R)PK11195 tracer kinetics in the brain of glioma patients and a comparison of two referencingapproaches. Eur. J. Nucl. Med. Mol. Imaging 2013, 40, 1406–1419. [CrossRef] [PubMed]
113. Albert, N.L.; Unterrainer, M.; Fleischmann, D.F.; Lindner, S.; Vettermann, F.; Brunegraf, A.; Vomacka, L.;Brendel, M.; Wenter, V.; Wetzel, C.; et al. TSPO PET for glioma imaging using the novel ligand (18)F-GE-180:First results in patients with glioblastoma. Eur. J. Nucl. Med. Mol. Imaging 2017, 44, 2230–2238. [CrossRef][PubMed]
114. Vomacka, L.; Albert, N.L.; Lindner, S.; Unterrainer, M.; Mahler, C.; Brendel, M.; Ermoschkin, L.; Gosewisch, A.;Brunegraf, A.; Buckley, C.; et al. TSPO imaging using the novel PET ligand [(18)F]GE-180: Quantificationapproaches in patients with multiple sclerosis. EJNMMI Res. 2017, 7, 89. [CrossRef] [PubMed]
115. Unterrainer, M.; Mahler, C.; Vomacka, L.; Lindner, S.; Havla, J.; Brendel, M.; Boning, G.; Ertl-Wagner, B.;Kumpfel, T.; Milenkovic, V.M.; et al. TSPO PET with [(18)F]GE-180 sensitively detects focal neuroinflammationin patients with relapsing-remitting multiple sclerosis. Eur. J. Nucl. Med. Mol. Imaging 2018, 45, 1423–1431.[CrossRef] [PubMed]
116. Sridharan, S.; Raffel, J.; Nandoskar, A.; Record, C.; Brooks, D.J.; Owen, D.; Sharp, D.; Muraro, P.A.; Gunn, R.;Nicholas, R. Confirmation of Specific Binding of the 18-kDa Translocator Protein (TSPO) Radioligand[(18)F]GE-180: A Blocking Study Using XBD173 in Multiple Sclerosis Normal Appearing White and GreyMatter. Mol. Imaging Biol. 2019, 21, 935–944. [CrossRef]
117. Unterrainer, M.; Fleischmann, D.F.; Diekmann, C.; Vomacka, L.; Lindner, S.; Vettermann, F.; Brendel, M.;Wenter, V.; Ertl-Wagner, B.; Herms, J.; et al. Comparison of (18)F-GE-180 and dynamic (18)F-FET PET in highgrade glioma: A double-tracer pilot study. Eur. J. Nucl. Med. Mol. Imaging 2019, 46, 580–590. [CrossRef]
118. Shields, A.F.; Grierson, J.R.; Dohmen, B.M.; Machulla, H.J.; Stayanoff, J.C.; Lawhorn-Crews, J.M.;Obradovich, J.E.; Muzik, O.; Mangner, T.J. Imaging proliferation in vivo with [F-18]FLT and positronemission tomography. Nat. Med. 1998, 4, 1334–1336. [CrossRef]
119. van Waarde, A.; Elsinga, P.H. Proliferation markers for the differential diagnosis of tumor and inflammation.Curr. Pharm. Des. 2008, 14, 3326–3339. [CrossRef]
120. Saga, T.; Kawashima, H.; Araki, N.; Takahashi, J.A.; Nakashima, Y.; Higashi, T.; Oya, N.; Mukai, T.; Hojo, M.;Hashimoto, N.; et al. Evaluation of primary brain tumors with FLT-PET: Usefulness and limitations.Clin. Nucl. Med. 2006, 31, 774–780. [CrossRef]
121. Jacobs, A.H.; Thomas, A.; Kracht, L.W.; Li, H.; Dittmar, C.; Garlip, G.; Galldiks, N.; Klein, J.C.; Sobesky, J.;Hilker, R.; et al. 18F-fluoro-L-thymidine and 11C-methylmethionine as markers of increased transport andproliferation in brain tumors. J. Nucl. Med. 2005, 46, 1948–1958. [PubMed]
204

Molecules 2020, 25, 1471
122. Li, Z.; Yu, Y.; Zhang, H.; Xu, G.; Chen, L. A meta-analysis comparing 18F-FLT PET with 18F-FDG PET forassessment of brain tumor recurrence. Nucl. Med. Commun. 2015, 36, 695–701. [CrossRef] [PubMed]
123. Chen, W.; Delaloye, S.; Silverman, D.H.; Geist, C.; Czernin, J.; Sayre, J.; Satyamurthy, N.; Pope, W.; Lai, A.;Phelps, M.E.; et al. Predicting treatment response of malignant gliomas to bevacizumab and irinotecan byimaging proliferation with [18F] fluorothymidine positron emission tomography: A pilot study. J. Clin. Oncol.2007, 25, 4714–4721. [CrossRef] [PubMed]
124. Schwarzenberg, J.; Czernin, J.; Cloughesy, T.F.; Ellingson, B.M.; Pope, W.B.; Geist, C.; Dahlbom, M.;Silverman, D.H.; Satyamurthy, N.; Phelps, M.E.; et al. 3′-deoxy-3′-18F-fluorothymidine PET and MRI forearly survival predictions in patients with recurrent malignant glioma treated with bevacizumab. J. Nucl.Med. 2012, 53, 29–36. [CrossRef] [PubMed]
125. Harris, R.J.; Cloughesy, T.F.; Pope, W.B.; Nghiemphu, P.L.; Lai, A.; Zaw, T.; Czernin, J.; Phelps, M.E.; Chen, W.;Ellingson, B.M. 18F-FDOPA and 18F-FLT positron emission tomography parametric response maps predictresponse in recurrent malignant gliomas treated with bevacizumab. Neuro Oncol. 2012, 14, 1079–1089.[CrossRef]
126. Nguyen, N.C.; Yee, M.K.; Tuchayi, A.M.; Kirkwood, J.M.; Tawbi, H.; Mountz, J.M. Targeted Therapy andImmunotherapy Response Assessment with F-18 Fluorothymidine Positron-Emission Tomography/MagneticResonance Imaging in Melanoma Brain Metastasis: A Pilot Study. Front. Oncol. 2018, 8, 18. [CrossRef]
127. Bell, C.; Dowson, N.; Fay, M.; Thomas, P.; Puttick, S.; Gal, Y.; Rose, S. Hypoxia imaging in gliomas with18F-fluoromisonidazole PET: Toward clinical translation. Semin. Nucl. Med. 2015, 45, 136–150. [CrossRef]
128. Rasey, J.S.; Koh, W.J.; Evans, M.L.; Peterson, L.M.; Lewellen, T.K.; Graham, M.M.; Krohn, K.A. Quantifyingregional hypoxia in human tumors with positron emission tomography of [18F]fluoromisonidazole:A pretherapy study of 37 patients. Int. J. Radiat. Oncol. Biol. Phys. 1996, 36, 417–428. [CrossRef]
129. Rajendran, J.G.; Krohn, K.A. F-18 fluoromisonidazole for imaging tumor hypoxia: Imaging themicroenvironment for personalized cancer therapy. Semin. Nucl. Med. 2015, 45, 151–162. [CrossRef]
130. Swanson, K.R.; Chakraborty, G.; Wang, C.H.; Rockne, R.; Harpold, H.L.; Muzi, M.; Adamsen, T.C.; Krohn, K.A.;Spence, A.M. Complementary but distinct roles for MRI and 18F-fluoromisonidazole PET in the assessmentof human glioblastomas. J. Nucl. Med. 2009, 50, 36–44. [CrossRef]
131. Kawai, N.; Maeda, Y.; Kudomi, N.; Miyake, K.; Okada, M.; Yamamoto, Y.; Nishiyama, Y.; Tamiya, T.Correlation of biological aggressiveness assessed by 11C-methionine PET and hypoxic burden assessed by18F-fluoromisonidazole PET in newly diagnosed glioblastoma. Eur. J. Nucl. Med. Mol. Imaging 2011, 38,441–450. [CrossRef] [PubMed]
132. Barajas, R.F.; Krohn, K.A.; Link, J.M.; Hawkins, R.A.; Clarke, J.L.; Pampaloni, M.H.; Cha, S. Glioma FMISOPET/MR Imaging Concurrent with Antiangiogenic Therapy: Molecular Imaging as a Clinical Tool in theBurgeoning Era of Personalized Medicine. Biomedicines 2016, 4, 24. [CrossRef] [PubMed]
133. Yamaguchi, S.; Hirata, K.; Toyonaga, T.; Kobayashi, K.; Ishi, Y.; Motegi, H.; Kobayashi, H.; Shiga, T.;Tamaki, N.; Terasaka, S.; et al. Change in 18F-Fluoromisonidazole PET Is an Early Predictor of the Prognosisin the Patients with Recurrent High-Grade Glioma Receiving Bevacizumab Treatment. PLoS ONE 2016, 11,e0167917. [CrossRef] [PubMed]
134. Piert, M.; Machulla, H.J.; Picchio, M.; Reischl, G.; Ziegler, S.; Kumar, P.; Wester, H.J.; Beck, R.; McEwan, A.J.;Wiebe, L.I.; et al. Hypoxia-specific tumor imaging with 18F-fluoroazomycin arabinoside. J. Nucl. Med. 2005,46, 106–113.
135. Postema, E.J.; McEwan, A.J.; Riauka, T.A.; Kumar, P.; Richmond, D.A.; Abrams, D.N.; Wiebe, L.I. Initialresults of hypoxia imaging using 1-alpha-D: -(5-deoxy-5-[18F]-fluoroarabinofuranosyl)-2-nitroimidazole(18F-FAZA). Eur. J. Nucl. Med. Mol. Imaging 2009, 36, 1565–1573. [CrossRef]
136. Mapelli, P.; Zerbetto, F.; Incerti, E.; Conte, G.M.; Bettinardi, V.; Fallanca, F.; Anzalone, N.; Di Muzio, N.;Gianolli, L.; Picchio, M. 18F-FAZA PET/CT Hypoxia Imaging of High-Grade Glioma Before and AfterRadiotherapy. Clin. Nucl. Med. 2017, 42, e525–e526. [CrossRef]
137. Ter-Pogossian, M.M.; Eichling, J.O.; Davis, D.O.; Welch, M.J. The measure in vivo of regional cerebral oxygenutilization by means of oxyhemoglobin labeled with radioactive oxygen-15. J. Clin. Investig. 1970, 49,381–391. [CrossRef]
205

Molecules 2020, 25, 1471
138. Ludemann, L.; Warmuth, C.; Plotkin, M.; Forschler, A.; Gutberlet, M.; Wust, P.; Amthauer, H. Brain tumorperfusion: Comparison of dynamic contrast enhanced magnetic resonance imaging using T1, T2, and T2*contrast, pulsed arterial spin labeling, and H2(15)O positron emission tomography. Eur. J. Radiol. 2009, 70,465–474. [CrossRef]
139. Gruner, J.M.; Paamand, R.; Kosteljanetz, M.; Broholm, H.; Hojgaard, L.; Law, I. Brain perfusion CT comparedwith (1)(5)O-H(2)O PET in patients with primary brain tumours. Eur. J. Nucl. Med. Mol. Imaging 2012, 39,1691–1701. [CrossRef]
140. Ogawa, T.; Uemura, K.; Shishido, F.; Yamaguchi, T.; Murakami, M.; Inugami, A.; Kanno, I.; Sasaki, H.;Kato, T.; Hirata, K.; et al. Changes of cerebral blood flow, and oxygen and glucose metabolism followingradiochemotherapy of gliomas: A PET study. J. Comput. Assist. Tomogr. 1988, 12, 290–297. [CrossRef]
141. Mineura, K.; Yasuda, T.; Kowada, M.; Ogawa, T.; Shishido, F.; Uemura, K. Positron emission tomographicevaluation of radiochemotherapeutic effect on regional cerebral hemocirculation and metabolism in patientswith gliomas. J. Neurooncol. 1987, 5, 277–285. [CrossRef]
142. Jain, R.K.; di Tomaso, E.; Duda, D.G.; Loeffler, J.S.; Sorensen, A.G.; Batchelor, T.T. Angiogenesis in braintumours. Nat. Rev. Neurosci. 2007, 8, 610–622. [CrossRef] [PubMed]
143. Levin, V.A.; Bidaut, L.; Hou, P.; Kumar, A.J.; Wefel, J.S.; Bekele, B.N.; Grewal, J.; Prabhu, S.; Loghin, M.;Gilbert, M.R.; et al. Randomized double-blind placebo-controlled trial of bevacizumab therapy for radiationnecrosis of the central nervous system. Int. J. Radiat. Oncol. Biol. Phys. 2011, 79, 1487–1495. [CrossRef][PubMed]
144. Jansen, M.H.; Veldhuijzen van Zanten, S.E.M.; van Vuurden, D.G.; Huisman, M.C.; Vugts, D.J.; Hoekstra, O.S.;van Dongen, G.A.; Kaspers, G.L. Molecular Drug Imaging: (89)Zr-Bevacizumab PET in Children with DiffuseIntrinsic Pontine Glioma. J. Nucl. Med. 2017, 58, 711–716. [CrossRef] [PubMed]
145. Veldhuijzen van Zanten, S.E.M.; Sewing, A.C.P.; van Lingen, A.; Hoekstra, O.S.; Wesseling, P.; Meel, M.H.;van Vuurden, D.G.; Kaspers, G.J.L.; Hulleman, E.; Bugiani, M. Multiregional Tumor Drug-Uptake Imagingby PET and Microvascular Morphology in End-Stage Diffuse Intrinsic Pontine Glioma. J. Nucl. Med. 2018,59, 612–615. [CrossRef]
146. Hsu, A.R.; Cai, W.; Veeravagu, A.; Mohamedali, K.A.; Chen, K.; Kim, S.; Vogel, H.; Hou, L.C.; Tse, V.;Rosenblum, M.G.; et al. Multimodality molecular imaging of glioblastoma growth inhibition withvasculature-targeting fusion toxin VEGF121/rGel. J. Nucl. Med. 2007, 48, 445–454.
147. Chen, K.; Cai, W.; Li, Z.B.; Wang, H.; Chen, X. Quantitative PET imaging of VEGF receptor expression.Mol. Imaging Biol. 2009, 11, 15–22. [CrossRef]
148. Cai, W.; Chen, K.; Mohamedali, K.A.; Cao, Q.; Gambhir, S.S.; Rosenblum, M.G.; Chen, X. PET of vascularendothelial growth factor receptor expression. J. Nucl. Med. 2006, 47, 2048–2056.
149. Rainer, E.; Wang, H.; Traub-Weidinger, T.; Widhalm, G.; Fueger, B.; Chang, J.; Zhu, Z.; Marosi, C.; Haug, A.;Hacker, M.; et al. The prognostic value of [(123)I]-vascular endothelial growth factor ([(123)I]-VEGF) inglioma. Eur. J. Nucl. Med. Mol. Imaging 2018, 45, 2396–2403. [CrossRef]
150. Wu, Y.L.; Ahn, M.J.; Garassino, M.C.; Han, J.Y.; Katakami, N.; Kim, H.R.; Hodge, R.; Kaur, P.; Brown, A.P.;Ghiorghiu, D.; et al. CNS Efficacy of Osimertinib in Patients With T790M-Positive Advanced Non-Small-CellLung Cancer: Data From a Randomized Phase III Trial (AURA3). J. Clin. Oncol. 2018, 36, 2702–2709.[CrossRef]
151. Pusch, S.; Krausert, S.; Fischer, V.; Balss, J.; Ott, M.; Schrimpf, D.; Capper, D.; Sahm, F.; Eisel, J.; Beck, A.C.;et al. Pan-mutant IDH1 inhibitor BAY 1436032 for effective treatment of IDH1 mutant astrocytoma in vivo.Acta Neuropathol. 2017, 133, 629–644. [CrossRef] [PubMed]
152. Mellinghoff, I.K.; Penas-Prado, M.; Peters, K.B.; Cloughesy, T.F.; Burris, H.A.; Maher, E.A.; Janku, F.;Cote, G.M.; Fuente, M.I.D.L.; Clarke, J.; et al. Phase 1 study of AG-881, an inhibitor of mutant IDH1/IDH2, inpatients with advanced IDH-mutant solid tumors, including glioma. J. Clin. Oncol. 2018, 36, 2002. [CrossRef]
153. Bublil, E.M.; Yarden, Y. The EGF receptor family: Spearheading a merger of signaling and therapeutics.Curr. Opin. Cell Biol. 2007, 19, 124–134. [CrossRef] [PubMed]
154. Hatanpaa, K.J.; Burma, S.; Zhao, D.; Habib, A.A. Epidermal growth factor receptor in glioma: Signaltransduction, neuropathology, imaging, and radioresistance. Neoplasia 2010, 12, 675–684. [CrossRef]
206
Molecules 2020, 25, 1471
155. Kelly, W.J.; Shah, N.J.; Subramaniam, D.S. Management of Brain Metastases in Epidermal Growth FactorReceptor Mutant Non-Small-Cell Lung Cancer. Front. Oncol. 2018, 8, 208. [CrossRef]
156. Weber, B.; Winterdahl, M.; Memon, A.; Sorensen, B.S.; Keiding, S.; Sorensen, L.; Nexo, E.; Meldgaard, P.Erlotinib accumulation in brain metastases from non-small cell lung cancer: Visualization by positron emissiontomography in a patient harboring a mutation in the epidermal growth factor receptor. J. Thorac. Oncol. 2011,6, 1287–1289. [CrossRef]
157. Tang, Y.; Hu, Y.; Liu, W.; Chen, L.; Zhao, Y.; Ma, H.; Yang, J.; Yang, Y.; Liao, J.; Cai, J.; et al.A radiopharmaceutical [(89)Zr]Zr-DFO-nimotuzumab for immunoPET with epidermal growth factorreceptor expression in vivo. Nucl. Med. Biol. 2019, 70, 23–31. [CrossRef]
158. Sun, J.; Cai, L.; Zhang, K.; Zhang, A.; Pu, P.; Yang, W.; Gao, S. A pilot study on EGFR-targeted molecularimaging of PET/CT With 11C-PD153035 in human gliomas. Clin. Nucl. Med. 2014, 39, e20–e26. [CrossRef]
159. Ulaner, G.A.; Lyashchenko, S.K.; Riedl, C.; Ruan, S.; Zanzonico, P.B.; Lake, D.; Jhaveri, K.; Zeglis, B.; Lewis, J.S.;O’Donoghue, J.A. First-in-Human Human Epidermal Growth Factor Receptor 2-Targeted Imaging Using(89)Zr-Pertuzumab PET/CT: Dosimetry and Clinical Application in Patients with Breast Cancer. J. Nucl. Med.2018, 59, 900–906. [CrossRef]
160. Tamura, K.; Kurihara, H.; Yonemori, K.; Tsuda, H.; Suzuki, J.; Kono, Y.; Honda, N.; Kodaira, M.; Yamamoto, H.;Yunokawa, M.; et al. 64Cu-DOTA-trastuzumab PET imaging in patients with HER2-positive breast cancer.J. Nucl. Med. 2013, 54, 1869–1875. [CrossRef]
161. van der Veen, E.L.; Bensch, F.; Glaudemans, A.; Lub-de Hooge, M.N.; de Vries, E.G.E. Molecular imaging toenlighten cancer immunotherapies and underlying involved processes. Cancer Treat. Rev. 2018, 70, 232–244.[CrossRef] [PubMed]
162. Decazes, P.; Bohn, P. Immunotherapy by Immune Checkpoint Inhibitors and Nuclear Medicine Imaging:Current and Future Applications. Cancers 2020, 12, 371. [CrossRef] [PubMed]
163. Cole, E.L.; Kim, J.; Donnelly, D.J.; Smith, R.A.; Cohen, D.; Lafont, V.; Morin, P.E.; Huang, R.Y.; Chow, P.L.;Hayes, W.; et al. Radiosynthesis and preclinical PET evaluation of (89)Zr-nivolumab (BMS-936558) in healthynon-human primates. Bioorg. Med. Chem. 2017, 25, 5407–5414. [CrossRef]
164. Bensch, F.; van der Veen, E.L.; Lub-de Hooge, M.N.; Jorritsma-Smit, A.; Boellaard, R.; Kok, I.C.; Oosting, S.F.;Schroder, C.P.; Hiltermann, T.J.N.; van der Wekken, A.J.; et al. (89)Zr-atezolizumab imaging as a non-invasiveapproach to assess clinical response to PD-L1 blockade in cancer. Nat. Med. 2018, 24, 1852–1858. [CrossRef][PubMed]
165. Niemeijer, A.N.; Leung, D.; Huisman, M.C.; Bahce, I.; Hoekstra, O.S.; van Dongen, G.; Boellaard, R.; Du, S.;Hayes, W.; Smith, R.; et al. Whole body PD-1 and PD-L1 positron emission tomography in patients withnon-small-cell lung cancer. Nat. Commun. 2018, 9, 4664. [CrossRef] [PubMed]
166. Donnelly, D.J.; Smith, R.A.; Morin, P.; Lipovsek, D.; Gokemeijer, J.; Cohen, D.; Lafont, V.; Tran, T.; Cole, E.L.;Wright, M.; et al. Synthesis and Biologic Evaluation of a Novel (18)F-Labeled Adnectin as a PET Radioligandfor Imaging PD-L1 Expression. J. Nucl. Med. 2018, 59, 529–535. [CrossRef]
167. Tumeh, P.C.; Harview, C.L.; Yearley, J.H.; Shintaku, I.P.; Taylor, E.J.; Robert, L.; Chmielowski, B.; Spasic, M.;Henry, G.; Ciobanu, V.; et al. PD-1 blockade induces responses by inhibiting adaptive immune resistance.Nature 2014, 515, 568–571. [CrossRef]
168. Pandit-Taskar, N.; Postow, M.; Hellmann, M.; Harding, J.; Barker, C.; O’Donoghue, J.; Ziolkowska, M.;Ruan, S.; Lyashchenko, S.; Tsai, F.; et al. First-in-human imaging with (89)Zr-Df-IAB22M2C anti-CD8minibody in patients with solid malignancies: Preliminary pharmacokinetics, biodistribution, and lesiontargeting. J. Nucl. Med. 2019. [CrossRef]
169. Antonios, J.P.; Soto, H.; Everson, R.G.; Moughon, D.L.; Wang, A.C.; Orpilla, J.; Radu, C.; Ellingson, B.M.;Lee, J.T.; Cloughesy, T.; et al. Detection of immune responses after immunotherapy in glioblastoma usingPET and MRI. Proc. Natl. Acad. Sci. USA 2017, 114, 10220–10225. [CrossRef]
170. Nair-Gill, E.D.; Shu, C.J.; Radu, C.G.; Witte, O.N. Non-invasive imaging of adaptive immunity using positronemission tomography. Immunol. Rev. 2008, 221, 214–228. [CrossRef]
171. Min, J.J.; Iyer, M.; Gambhir, S.S. Comparison of [18F]FHBG and [14C]FIAU for imaging of HSV1-tk reportergene expression: Adenoviral infection vs stable transfection. Eur. J. Nucl. Med. Mol. Imaging 2003, 30,1547–1560. [CrossRef] [PubMed]
207
Molecules 2020, 25, 1471
172. Keu, K.V.; Witney, T.H.; Yaghoubi, S.; Rosenberg, J.; Kurien, A.; Magnusson, R.; Williams, J.; Habte, F.;Wagner, J.R.; Forman, S.; et al. Reporter gene imaging of targeted T cell immunotherapy in recurrent glioma.Sci. Transl. Med. 2017, 9. [CrossRef] [PubMed]
173. Yan, H.; Parsons, D.W.; Jin, G.; McLendon, R.; Rasheed, B.A.; Yuan, W.; Kos, I.; Batinic-Haberle, I.; Jones, S.;Riggins, G.J.; et al. IDH1 and IDH2 mutations in gliomas. N. Engl. J. Med. 2009, 360, 765–773. [CrossRef][PubMed]
174. Dang, L.; White, D.W.; Gross, S.; Bennett, B.D.; Bittinger, M.A.; Driggers, E.M.; Fantin, V.R.; Jang, H.G.;Jin, S.; Keenan, M.C.; et al. Cancer-associated IDH1 mutations produce 2-hydroxyglutarate. Nature 2009, 462,739–744. [CrossRef]
175. Lu, C.; Ward, P.S.; Kapoor, G.S.; Rohle, D.; Turcan, S.; Abdel-Wahab, O.; Edwards, C.R.; Khanin, R.;Figueroa, M.E.; Melnick, A.; et al. IDH mutation impairs histone demethylation and results in a block to celldifferentiation. Nature 2012, 483, 474–478. [CrossRef]
176. Platten, M.; Schilling, D.; Bunse, L.; Wick, A.; Bunse, T.; Riehl, D.; Karapanagiotou-Schenkel, I.; Harting, I.;Sahm, F.; Schmitt, A.; et al. A mutation-specific peptide vaccine targeting IDH1R132H in patients withnewly diagnosed malignant astrocytomas: A first-in-man multicenter phase I clinical trial of the GermanNeurooncology Working Group (NOA-16). J. Clin. Oncol. 2018, 36, 2001. [CrossRef]
177. Suh, C.H.; Kim, H.S.; Paik, W.; Choi, C.; Ryu, K.H.; Kim, D.; Woo, D.C.; Park, J.E.; Jung, S.C.; Choi, C.G.;et al. False-Positive Measurement at 2-Hydroxyglutarate MR Spectroscopy in Isocitrate DehydrogenaseWild-Type Glioblastoma: A Multifactorial Analysis. Radiology 2019, 291, 752–762. [CrossRef]
178. Choi, C.; Ganji, S.K.; DeBerardinis, R.J.; Hatanpaa, K.J.; Rakheja, D.; Kovacs, Z.; Yang, X.L.; Mashimo, T.;Raisanen, J.M.; Marin-Valencia, I.; et al. 2-hydroxyglutarate detection by magnetic resonance spectroscopy inIDH-mutated patients with gliomas. Nat. Med. 2012, 18, 624–629. [CrossRef]
179. Chitneni, S.K.; Reitman, Z.J.; Gooden, D.M.; Yan, H.; Zalutsky, M.R. Radiolabeled inhibitors as probes forimaging mutant IDH1 expression in gliomas: Synthesis and preliminary evaluation of labeled butyl-phenylsulfonamide analogs. Eur. J. Med. Chem. 2016, 119, 218–230. [CrossRef]
180. Chitneni, S.K.; Yan, H.; Zalutsky, M.R. Synthesis and Evaluation of a (18)F-Labeled Triazinediamine Analoguefor Imaging Mutant IDH1 Expression in Gliomas by PET. ACS Med. Chem. Lett. 2018, 9, 606–611. [CrossRef]
181. Chitneni, S.K.; Reitman, Z.J.; Spicehandler, R.; Gooden, D.M.; Yan, H.; Zalutsky, M.R. Synthesis and evaluationof radiolabeled AGI-5198 analogues as candidate radiotracers for imaging mutant IDH1 expression in tumors.Bioorg. Med. Chem. Lett. 2018, 28, 694–699. [CrossRef] [PubMed]
182. Koyasu, S.; Shimizu, Y.; Morinibu, A.; Saga, T.; Nakamoto, Y.; Togashi, K.; Harada, H. Increased (14)C-acetateaccumulation in IDH-mutated human glioblastoma: Implications for detecting IDH-mutated glioblastomawith (11)C-acetate PET imaging. J. Neurooncol. 2019, 145, 441–447. [CrossRef] [PubMed]
183. Burger, J.A.; Kipps, T.J. CXCR4: A key receptor in the crosstalk between tumor cells and theirmicroenvironment. Blood 2006, 107, 1761–1767. [CrossRef]
184. Bian, X.W.; Yang, S.X.; Chen, J.H.; Ping, Y.F.; Zhou, X.D.; Wang, Q.L.; Jiang, X.F.; Gong, W.; Xiao, H.L.;Du, L.L.; et al. Preferential expression of chemokine receptor CXCR4 by highly malignant human gliomasand its association with poor patient survival. Neurosurgery 2007, 61, 570–579. [CrossRef] [PubMed]
185. Bailly, C.; Vidal, A.; Bonnemaire, C.; Kraeber-Bodere, F.; Cherel, M.; Pallardy, A.; Rousseau, C.; Garcion, E.;Lacoeuille, F.; Hindre, F.; et al. Potential for Nuclear Medicine Therapy for Glioblastoma Treatment. Front.Pharmacol. 2019, 10, 772. [CrossRef]
186. Lapa, C.; Luckerath, K.; Kleinlein, I.; Monoranu, C.M.; Linsenmann, T.; Kessler, A.F.; Rudelius, M.; Kropf, S.;Buck, A.K.; Ernestus, R.I.; et al. (68)Ga-Pentixafor-PET/CT for Imaging of Chemokine Receptor 4 Expressionin Glioblastoma. Theranostics 2016, 6, 428–434. [CrossRef]
187. Wernicke, A.G.; Edgar, M.A.; Lavi, E.; Liu, H.; Salerno, P.; Bander, N.H.; Gutin, P.H. Prostate-specificmembrane antigen as a potential novel vascular target for treatment of glioblastoma multiforme. Arch. Pathol.Lab. Med. 2011, 135, 1486–1489. [CrossRef]
188. Schwenck, J.; Tabatabai, G.; Skardelly, M.; Reischl, G.; Beschorner, R.; Pichler, B.; la Fougere, C. In vivovisualization of prostate-specific membrane antigen in glioblastoma. Eur. J. Nucl. Med. Mol. Imaging 2015,42, 170–171. [CrossRef]
208

Molecules 2020, 25, 1471
189. Unterrainer, M.; Niyazi, M.; Ruf, V.; Bartenstein, P.; Albert, N.L. The endothelial prostate-specific membraneantigen is highly expressed in gliosarcoma and visualized by [68Ga]-PSMA-11 PET: A theranostic outlookfor brain tumor patients? Neuro Oncol. 2017, 19, 1698–1699. [CrossRef]
190. Rahbar, K.; Ahmadzadehfar, H.; Kratochwil, C.; Haberkorn, U.; Schafers, M.; Essler, M.; Baum, R.P.;Kulkarni, H.R.; Schmidt, M.; Drzezga, A.; et al. German Multicenter Study Investigating 177Lu-PSMA-617Radioligand Therapy in Advanced Prostate Cancer Patients. J. Nucl. Med. 2017, 58, 85–90. [CrossRef]
© 2020 by the authors. Licensee MDPI, Basel, Switzerland. This article is an open accessarticle distributed under the terms and conditions of the Creative Commons Attribution(CC BY) license (http://creativecommons.org/licenses/by/4.0/).
209


molecules
Review
Approaches to PET Imaging of Glioblastoma
Lindsey R. Drake 1,2,*, Ansel T. Hillmer 1,2,3,4 and Zhengxin Cai 1,2
1 Yale PET Center, Yale University School of Medicine, New Haven, CT 06511, USA;[email protected] (A.T.H.); [email protected] (Z.C.)
2 Department of Radiology and Bioimaging Sciences, Yale University School of Medicine, New Haven,CT 06511, USA
3 Department of Psychiatry, Yale University School of Medicine, New Haven, CT 06511, USA4 Department of Biomedical Engineering, Yale School of Engineering and Applied Science, New Haven,
CT 06511, USA* Correspondence: [email protected]; Tel.: +1-203-737-2978
Academic Editor: Peter BrustReceived: 11 December 2019; Accepted: 23 January 2020; Published: 28 January 2020
Abstract: Glioblastoma multiforme (GBM) is the deadliest type of brain tumor, affecting approximatelythree in 100,000 adults annually. Positron emission tomography (PET) imaging provides an importantnon-invasive method of measuring biochemically specific targets at GBM lesions. These powerfuldata can characterize tumors, predict treatment effectiveness, and monitor treatment. This reviewwill discuss the PET imaging agents that have already been evaluated in GBM patients so far, andnew imaging targets with promise for future use. Previously used PET imaging agents include thetracers for markers of proliferation ([11C]methionine; [18F]fluoro-ethyl-L-tyrosine, [18F]Fluorodopa,[18F]fluoro-thymidine, and [18F]clofarabine), hypoxia sensing ([18F]FMISO, [18F]FET-NIM, [18F]EF5,[18F]HX4, and [64Cu]ATSM), and ligands for inflammation. As cancer therapeutics evolvetoward personalized medicine and therapies centered on tumor biomarkers, the developmentof complimentary selective PET agents can dramatically enhance these efforts. Newer biomarkersfor GBM PET imaging are discussed, with some already in use for PET imaging other cancersand neurological disorders. These targets include Sigma 1, Sigma 2, programmed death ligand1, poly-ADP-ribose polymerase, and isocitrate dehydrogenase. For GBM, these imaging agentscome with additional considerations such as blood–brain barrier penetration, quantitative modelingapproaches, and nonspecific binding.
Keywords: PET imaging; GBM; biomarkers; Sigma 1; Sigma 2; PD-L1; PARP; IDH
1. Introduction
Glioblastoma Multiforme (GBM) is a fast growing, invasive brain tumor that typically results indeath in the first 15 months after diagnosis [1]. It develops from glial cells, astrocytes or oligodendrocytes,and can evolve from lower-grade tumors or de novo. Previously, GBM was characterized as ‘gradeIV’ astrocytoma. Recently, the World Health Organization (WHO) updated the classification of braintumors to include genotypic markers, building on the histological markers considered previously [2].Glioblastoma can be classified by a single nucleotide polymorphism in the isocitrate dehydrogenase(IDH) gene as wild-type or mutant. Approximately 10% of glioblastomas are IDH-mutant [2].IDH-mutant status weakly predicts long-term survival (over 3 years post diagnosis) [3]. GBM tumorsare heterogenous in location (with 25%–43% incidence in frontal lobes), histopathology, and thetumor microenvironment [4]. The first line of treatment for GBM is surgery, followed by radiationand chemotherapy [1]. Temozolomide, a DNA alkylating agent is often used for chemotherapy.In 2015, the vascular endothelial growth factor inhibitor Bevacizumab was fast-tracked for use in GBMafter demonstrating efficacy in shrinking or halting tumor growth. However, it has failed to show
Molecules 2020, 25, 568; doi:10.3390/molecules25030568 www.mdpi.com/journal/molecules211

Molecules 2020, 25, 568
improvement in overall survival [5]. Patients with GBMs have a very low survival rate with very fewtreatment options, making this a particularly acute health challenge.
Medical imaging provides critical information for diagnosing, staging, and monitoring thetreatment of GBM. While formal diagnosis relies on histopathology and genetic markers for grading,structural magnetic resonance images (MRIs) are routinely acquired and can be used in guiding surgery.Additional structural MRI methods can accurately classify and grade tumors with high accuracy,though it has not been adopted yet as common practice [6]. Positron emission tomography (PET)imaging provides important complementary information to anatomical MRI data. In this functionaltype of imaging, biochemical information about the tumor and the tissue surrounding it can bemeasured non-invasively. GBMs typically are fast growing, giving an important role for specific PETradioligands to quantify proliferation. PET imaging is also uniquely positioned to identify ideal casesfor targeted treatments and evaluate treatment progression.
This article provides an overview of the novel imaging tracers used in PET imaging of braintumors. Discussion includes the strengths, limitations, and pitfalls of individual imaging biomarkerstrategies, and general challenges associated with PET imaging of brain tumors. We first providea brief overview of established PET imaging biomarkers (glycolysis, amino acid metabolism, DNAreplication, hypoxia, and inflammation), followed by newer imaging targets (Sigma 1/ 2, programmeddeath ligand 1, poly-ADP-ribose polymerase, and isocitrate dehydrogenase) with promise to imageglioblastoma lesions. None of these biomarkers are unique to glioblastoma, though their presence hasbeen found in resected brain tumors. This work concludes with important quantitative considerationsfor use of these imaging biomarkers in the evaluation and treatment of GBM patients.
2. Overview of PET Imaging Agents for Brain Tumor
2.1. Sustained Proliferation Markers: Glycolysis, Amino Acid Transportation, and DNA Replication
The classic approach to imaging tumors in general, and in application to GBM, has been toprobe the functional necessities of proliferation. These necessities include glucose metabolism, proteinsynthesis, and DNA replication. From a biochemical prospective, these functions highlight the ‘buildingblock’ small molecules that compose macromolecules: sugars, nucleotide bases, and amino acids.
Radionuclide-labeled forms of these building blocks have been employed to study these functionswith PET imaging. The gold standard of most cancer imaging is [18F]FDG (1), a fluorine-18 glucoseanalogue. This radiotracer is actively taken up by the glucose transporter and participates in the firststep of glucose metabolism (phosphorylation), then becomes trapped in the cell [7]. [18F]FDG PETallows for the functional imaging of glucose metabolism, a relative gold mine of information in mostcancers. However, the brain has naturally high uptake of [18F]FDG, which complicates interpretationof GBM lesions near gray matter. Further efforts to image proliferation through the ‘building block’strategy include neutral amino acid analogues ([11C]methionine (2); [18F]fluoro-ethyl-L-tyrosine (3);[18F]Fluorodopa (4)) and deoxynucleoside bases ([18F]fluoro-thymidine (5); and [18F]clofarabine (6))(Figure 1).
[11C]Methionine ([11C]MET) was developed shortly after [18F]FDG [8,9]; it was considered avaluable tracer because methionine, an essential amino acid, can be used in protein synthesis. BothL-and D-isomers were synthesized, and no difference in accumulation was observed [10]. This lackof selectivity between stereoisomers indicated that [11C]MET was not being incorporated for proteinsynthesis, as only L-amino acids are incorporated into proteins. Despite this, [11C]MET was stillused as an alternative to [18F]FDG PET imaging because it is more sensitive (see review [11]).[18F]fluoroethyl-tyrosine ([18F]FET) was developed as another amino acid based alternative to[18F]FDG [12]. Unlike [11C]MET, [18F]FET is a modified amino acid, which led to questions aboutthe radiotracer’s ability to be taken up into cells. In cellular experiments and tumor-bearing mice,it was found that [18F]FET is actively transported into cells [13]. The transporter responsible was lateridentified as l-amino acid transporter (LAT-1) [14]. [18F]FET PET combined with MRI can dramatically
212

Molecules 2020, 25, 568
improve glioma identification and tumor diagnosis [15]. In terms of the diagnostic performance, MRIalone yielded a 96% sensitivity and 53% specificity; the combined technique achieved 93% sensitivityand 94% specificity [15]. While MRI is the gold standard for diagnosis and tumor staging, [18F]FETPET imaging provides complementary information in the form of increased specificity.
Figure 1. Radiotracers for markers of cellular proliferation.
The nonessential amino acid and neurotransmitter dopamine has also been used as a PET tracerin the form of [18F]L-fluoro-dihydroxyphenylalanine ([18F]FDOPA), which becomes a dopamineanalogue in vivo after decarboxylation. [18F]Fluoro-dopamine can then be further taken up intovesicles by VMAT, or metabolized by monoamine oxidases or catechol-O-methyltransferase. This gives[18F]FDOPA a particular utility in neuroendocrine tumors [16] in addition to the obvious neurologicalapplication. [18F]FDOPA imaging in pre-operative glioma patients has shown a significant correlationbetween WHO grade and the volume of MRI contrast enhancement, volume of T2 hyperintensity,and [18F]FDOPA uptake (as SUVmax ratio of tumor to normal tissue) [17]. From this 45 patient cohort,a multivariate Cox regression suggested that [18F]FDOPA PET and age were significant prognosticfactors for overall survival [17]. A major limitation of [18F]FDOPA use is the radiosynthesis. One ofthe first described high yielding radiosynthesis involved electrophilic fluorination [18]. Electrophilicfluorination is not a desirable method for routine clinical production because of the hazardous nature ofF2 gas, however, improved syntheses were recently published involving nucleophilic fluorination [19].
Concurrent with the use of amino acid analogues, the deoxynucleoside base derivative[18F]fluorothymidine ([18F]FLT) was developed. [18F]FLT is trapped in tissues after phosphorylationby thymidine kinase [20]. This trapping was thought to be due to accumulation into growing DNAchains, as fluorothymidine was originally developed to terminate DNA, and used in HIV therapy.In reality, less than 1% of [18F]FLT was found to be incorporated in DNA in cellular studies, though itcorrelated highly with [3H]thymidine uptake [21]. Despite this lack of accumulation in DNA, [18F]FLTimaging confirms cellular uptake and correlates to Ki-67 expression on the corresponding resectedtumor tissue [22]. Thymidine kinase is a principal enzyme in the DNA salvage pathway, and is mostactive in G1 and S phases of the cell cycle [23]. Because of its lower uptake in normal brain than[18F]FDG, glioma patients underwent [18F]FLT imaging and a similar correlation was observed withproliferative tissue markers [24]. When [18F]FLT PET was used to monitor treatment in malignantglioma trials and compared to MRI responses, [18F]FLT-PET was more predictive of overall survivalthan MRI [25]. Despite this utility, [18F]FLT is less widely used because of nonspecific binding in
213

Molecules 2020, 25, 568
individuals [26], and because blood–brain barrier (BBB) penetration is limited, which limits its usespecifically for glioma imaging.
An alternative method to [18F]FLT, which is phosphorylated by thymidine kinase, is to targetdeoxycytidine kinase (dCK). The activity of dCK, TK, and the other deoxyribonucleoside kinases are toprovide an alternative pathway to de novo synthesis of DNA precursors [27]. Additionally, the activityof these kinases is critical for the activation of nucleoside analogues that are used for chemotherapy, likeclofarabine [28]. Clofarabine is a chemotherapy used in pediatric patients with relapsed or refectoryacute lymphoblastic leukemia. The radiolabeled [18F]clofarabine ([18F]CFA) has been evaluated inhealthy humans and found to be BBB permeable [29]. Biodistribution of [18F]CFA showed uptake inlymph nodes, consistent with known dCK activity being required for T- and B-cell development [30].In two patients with recurrent GBM, PET imaging with MRI was able to delineate specific regionsof immune activity [31]. In one individual, the post-treatment PET-MRI scan demonstrated a 300%increase in immune cells in the tumor microenvironment, with the tumor volume remaining consistent.This combined technique has been shown in this preliminary data set to be useful in differentiatingtumor progression from immune cell infiltration in a treatment monitoring scenario.
PET imaging of these classic markers of proliferation is useful to image GBM due to theirsimplistic design. However, changes in glucose metabolism, DNA replication, protein synthesis,and neurotransmitter homeostasis are not unique to cancers; they can describe a number of diseasestates. This generality makes these imaging approaches most appropriate for disease monitoring incancer treatments like chemotherapy and targeted radiation. For further discussion of these tracersand their prognostic value in brain tumors, see a recent systematic review [32].
2.2. Hypoxia-Sensing Tracers
The first-line treatment strategy for gliomas is surgical resection if possible, followed bychemotherapy and targeted radiation [33]. Chemotherapy and radiation are therapies that hinge oncell death by damaging DNA and initiating apoptosis. However, some tumors are resistant to thesestrategies. For example, it has been long known that poorly oxygenated tissue, or hypoxic tissue, is lesssensitive to radiation. Gray et al. confirmed in 1953 that X ray therapy was more effective in mice thatwere breathing oxygen at a higher pressures than normal atmosphere [34]. Hypoxia has become arecognized key feature of most solid tumors [35]. In a hypoxic tumor microenvironment, radiationtherapy could be more effective at a higher dose; however, this requires an accurate identification ofthat cell population.
PET radiotracers that sense oxygen levels in cells can be used to visualize hypoxia (Figure 2).[18F]Fluoromisoinodazole ([18F]FMISO; 7) contains a nitroimidazole which is reduced to RNO2 radicalafter entering a viable cell. In the presence of oxygen, it will be re-oxidized and diffuse from the cell.If the cell is hypoxic, however, the radiotracer will be trapped. This tracer was first evaluated in V-79cells using low O2 levels in the incubation to mimic hypoxia [36] and followed up with cancer modelsin animals [37]. Glioma patients have undergone [18F]FMISO PET imaging, though with limitedsuccess [38]. Chakhoyan et al. were able to build ptO2 maps from [18F]FMISO PET images and comparethem to perfusion weighted imaging (MRI) and 1H-MR mono-voxel magnetic resonance spectroscopy(MRS) [39]. The correspondence with MRI and MRS imaging confirms the direct relationship between[18F]FMISO and oxygen levels in tissue. However, Valk et al. observed retention of [18F]FMISO ina GBM subject and anaplastic astrocytoma subject, but no retention of [18F]FMISO in another GBMsubject [38]. [18F]FMISO PET imaging has a limited range in sensitivity between normoxic and hypoxictissue [40]. Additionally, BBB penetration is low for [18F]FMISO which does not make it attractive forglioma imaging.
There are multiple hypoxia radiotracers developed around the same time as [18F]FMISO including[18F]FET-NIM (8), [18F]EF5 (9), and [18F]HX4 (10) (see review [35]). All of these ligands use thenitroimidazole moiety to sense oxygen level in vivo, and the differences in the chemical structuresare primarily focused on the linker groups and location of fluorine-18 label (Figure 2). [18F]EF5
214
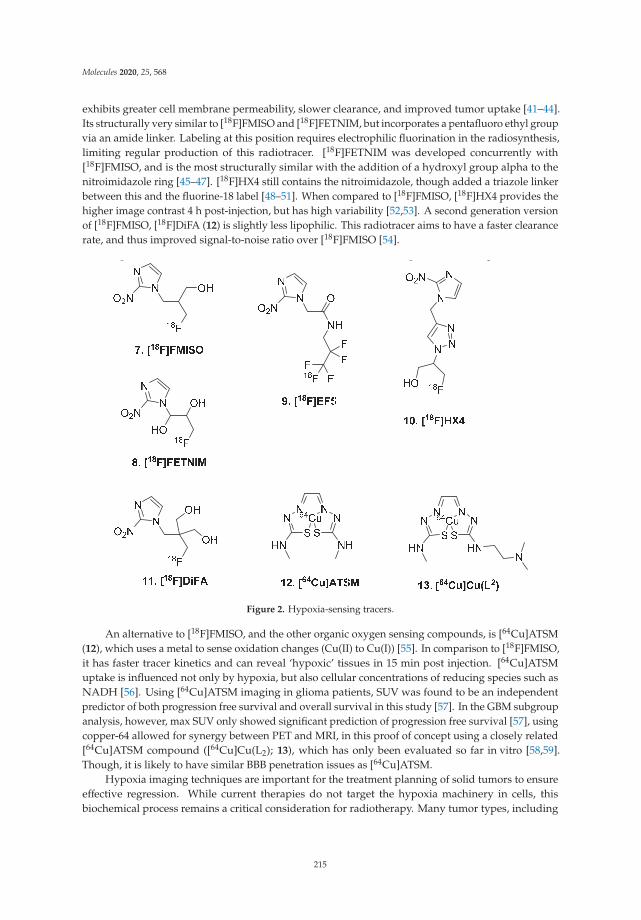
Molecules 2020, 25, 568
exhibits greater cell membrane permeability, slower clearance, and improved tumor uptake [41–44].Its structurally very similar to [18F]FMISO and [18F]FETNIM, but incorporates a pentafluoro ethyl groupvia an amide linker. Labeling at this position requires electrophilic fluorination in the radiosynthesis,limiting regular production of this radiotracer. [18F]FETNIM was developed concurrently with[18F]FMISO, and is the most structurally similar with the addition of a hydroxyl group alpha to thenitroimidazole ring [45–47]. [18F]HX4 still contains the nitroimidazole, though added a triazole linkerbetween this and the fluorine-18 label [48–51]. When compared to [18F]FMISO, [18F]HX4 provides thehigher image contrast 4 h post-injection, but has high variability [52,53]. A second generation versionof [18F]FMISO, [18F]DiFA (12) is slightly less lipophilic. This radiotracer aims to have a faster clearancerate, and thus improved signal-to-noise ratio over [18F]FMISO [54].
g g p
Figure 2. Hypoxia-sensing tracers.
An alternative to [18F]FMISO, and the other organic oxygen sensing compounds, is [64Cu]ATSM(12), which uses a metal to sense oxidation changes (Cu(II) to Cu(I)) [55]. In comparison to [18F]FMISO,it has faster tracer kinetics and can reveal ‘hypoxic’ tissues in 15 min post injection. [64Cu]ATSMuptake is influenced not only by hypoxia, but also cellular concentrations of reducing species such asNADH [56]. Using [64Cu]ATSM imaging in glioma patients, SUV was found to be an independentpredictor of both progression free survival and overall survival in this study [57]. In the GBM subgroupanalysis, however, max SUV only showed significant prediction of progression free survival [57], usingcopper-64 allowed for synergy between PET and MRI, in this proof of concept using a closely related[64Cu]ATSM compound ([64Cu]Cu(L2); 13), which has only been evaluated so far in vitro [58,59].Though, it is likely to have similar BBB penetration issues as [64Cu]ATSM.
Hypoxia imaging techniques are important for the treatment planning of solid tumors to ensureeffective regression. While current therapies do not target the hypoxia machinery in cells, thisbiochemical process remains a critical consideration for radiotherapy. Many tumor types, including
215

Molecules 2020, 25, 568
gliomas, are described as being hypoxic and utilize PET or MR imaging methods for treatmentplanning [60]. This method also serves to monitor treatment after targeted radiotherapies.
2.3. Inflammation
An important part of the immune response is inflammation and, like peripheral cancers,brain cancer cells will trigger this response. A histological analysis of lesions from 1265 patientswith glioblastoma multiforme identified the presence of lymphocytes and reactive astrocytes [61].Inflammation has been explored as a therapeutic target for such cases. Nonsteroidal anti-inflammatorydrugs (NSAIDs) have been evaluated to suppress the growth of tumor cells in vitro [62]. While NSAIDsare an inappropriate therapy for GBM because of the lack of targeting, inflammation is a characteristicof GBM pathology and could be useful for imaging.
Translocator protein (18 kDa), TSPO, is an integral mitochondrial membrane protein responsiblefor cholesterol transport and responds to cell stress. Broadly, TSPO is treated as a biomarker sensitive topro-inflammatory stimuli, and small molecule inhibitors of TSPO have been utilized in PET imaging [63].[11C]PK11195 (14, Figure 3) was developed for general use of inflammation imaging, and even inglioma patients [64]. Immunohistochemical experiments with patient tissue further confirmed increaseTSPO mRNA and protein levels [65]. Furthermore TSPO PET imaging was correlated to outcome [66].In a larger prospective trial which included tumor biopsy, imaging and histology were found tocorrelate, and BPND in high-grade gliomas was significantly higher than in low-grade astrocytomasand low-grade oligodendrogliomas [67]. Although second and third generation TSPO radioligandswith higher specific binding have since been developed, TSPO imaging in GBM has major limitationsincluding tumor heterogeneity and inability to distinguish signal caused by radiation therapy fromsignal due to the tumor microenvironment.
Figure 3. TSPO ligand.
3. New Biomarkers for GBM PET Imaging
New strategies for cancer therapeutics target proliferation (sigma 2), immunity (sigma 1,PD-L1), and genetic modification (PARP, IDH). PET imaging agents have developed in tandemwith advancement of these therapies. These therapies were initially designed to treat more prevalent,peripheral tumors. The nature of heterogeneity in brain tumors inspires the use of biomarkerspecific imaging agents, as opposed to the more general ligands for proliferation, hypoxia, andinflammation. Applications to brain cancers comes with the significant considerations of blood–brainbarrier penetration and effectiveness. The PET imaging agents discussed in the following section arenot yet utilized in human brain imaging but represent promising candidates for the new therapeuticand/or biomarker strategies.
3.1. Sigma 1
A key characteristic of GBMs is their invasiveness, which leads to the very low survival rate.Sigma 1 and sigma 2 receptors are expressed in the human tumor cell lines: C6 glioma, NIE-115neuroblastoma, and NG108-15 neuroblastoma- glioma hybrid [68]. While sigma 1 is associated with
216

Molecules 2020, 25, 568
invasiveness, sigma 2 receptors have been associated with proliferation. Both receptors are interestingPET imaging targets for glioblastoma.
Sigma 1 receptor (S1R) was identified as the site of action of the antipsychotic haloperidol [69].Its role in the CNS has been investigated for neurodegenerative disorders [70] in addition to GBM.The first PET ligand for S1R was [11C]1-(3,4-dimethoxyphenethyl)-4-(3-phenylpropyl)piperazine([11C]SA4503: 15, Figure 4) [71]. While it showed nanomolar affinity to S1R, itunfortunately has high affinities for other receptors, ion channels, and second messengersystems [72]. Both S1R and S2R have structural similarity to opiate receptors, which necessitatesspecificity and selectivity when designing ligands. Additionally, in the development offluorine-18 sigma-1 receptor ligands, very high binding affinity has corresponded to veryslow clearance rate. For example, [18F]1-3-fluoropropyl-4-((4-cyanophenoxy)-methyl)piperidine([18F]FPS; 16) [73] did not reach pseudo-equilibrium by 4 h in human [74]. Another ligand,[18F]6-(3-fluoropropyl)-3-(2-(azepan-1-yl)ethyl)benzo[d]thiazol-2(3H)-one ([18F]FTC-146; 17) was alsofound to be irreversible and not suitable for neuroimaging [75]. Recently, [18F](S)-Fluspidine (18) [76]was developed and evaluated in human [77]. The pharmacokinetics are improved, and with xenograftmouse models of glioblastoma have visible increases in radioligand binding.
(S)
Figure 4. Sigma 1 receptor radioligands.
3.2. Sigma 2
The amino acid and nucleoside base PET imaging approach is a classic, straightforward way toassess functional proliferation. The sigma-2 receptor (S2R; TMEM97) has recently been implicated incancer biology; S2R levels increased 5-fold in proliferating tumor cells compared to quiescent tumorcells [78]. This allows for radioligand design for a specific protein more akin to drug design. For anin-depth history of S2R ligand development, see references [79,80].
An early imaging effort for S2R was using 4-[125I]BP (19, Figure 5), a small molecule with highaffinity for both sigma 1 and 2 receptors [81]. Further efforts by these authors led to [125I]PIMBA(20), though this radioligand suffered from high background binding [82]. [18F]RHM-4 (21) wasdeveloped and demonstrated S2R overexpression in pancreatic cancer, though BBB penetration wasnot investigated [83]. The radioligand [18F]ISO (22) was also developed, structurally similar to 21
except lacking the aryl methoxy group [84]. A positive correlation is observed between 22 binding andtumor Ki67 expression [85]. In treatment monitoring of CDK4/6 inhibition plus endocrine therapy inbreast cancer xenograft animals, 22 was found to assess more delayed changes related to cell cyclearrest compared to [18F]FLT [86]. However, 22 is not taken up into the brain, based on organ residencestudies in rodent [85]. This has inspired alternative ligands with BBB penetration as the design goal.
217
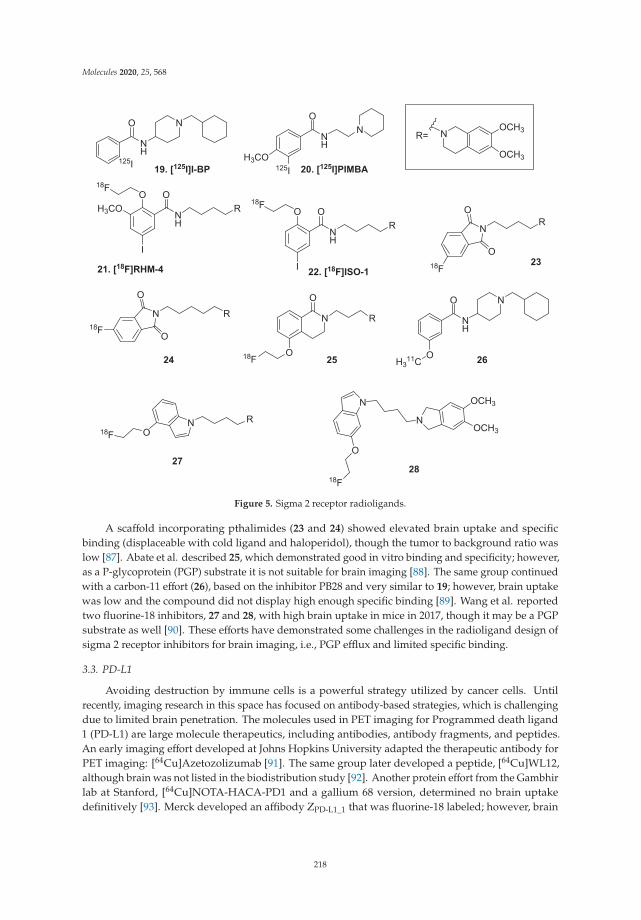
Molecules 2020, 25, 568
Figure 5. Sigma 2 receptor radioligands.
A scaffold incorporating pthalimides (23 and 24) showed elevated brain uptake and specificbinding (displaceable with cold ligand and haloperidol), though the tumor to background ratio waslow [87]. Abate et al. described 25, which demonstrated good in vitro binding and specificity; however,as a P-glycoprotein (PGP) substrate it is not suitable for brain imaging [88]. The same group continuedwith a carbon-11 effort (26), based on the inhibitor PB28 and very similar to 19; however, brain uptakewas low and the compound did not display high enough specific binding [89]. Wang et al. reportedtwo fluorine-18 inhibitors, 27 and 28, with high brain uptake in mice in 2017, though it may be a PGPsubstrate as well [90]. These efforts have demonstrated some challenges in the radioligand design ofsigma 2 receptor inhibitors for brain imaging, i.e., PGP efflux and limited specific binding.
3.3. PD-L1
Avoiding destruction by immune cells is a powerful strategy utilized by cancer cells. Untilrecently, imaging research in this space has focused on antibody-based strategies, which is challengingdue to limited brain penetration. The molecules used in PET imaging for Programmed death ligand1 (PD-L1) are large molecule therapeutics, including antibodies, antibody fragments, and peptides.An early imaging effort developed at Johns Hopkins University adapted the therapeutic antibody forPET imaging: [64Cu]Azetozolizumab [91]. The same group later developed a peptide, [64Cu]WL12,although brain was not listed in the biodistribution study [92]. Another protein effort from the Gambhirlab at Stanford, [64Cu]NOTA-HACA-PD1 and a gallium 68 version, determined no brain uptakedefinitively [93]. Merck developed an affibody ZPD-L1_1 that was fluorine-18 labeled; however, brain
218
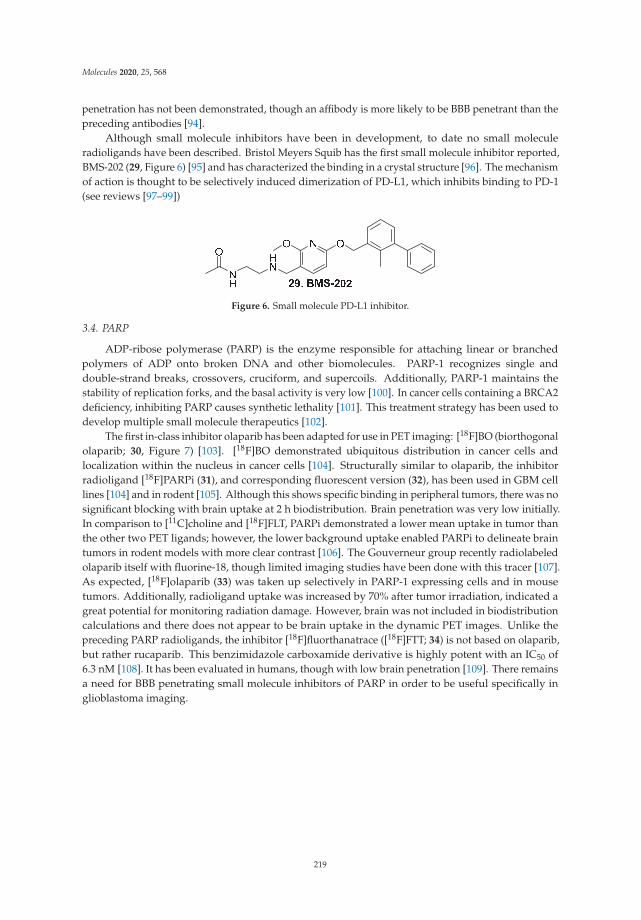
Molecules 2020, 25, 568
penetration has not been demonstrated, though an affibody is more likely to be BBB penetrant than thepreceding antibodies [94].
Although small molecule inhibitors have been in development, to date no small moleculeradioligands have been described. Bristol Meyers Squib has the first small molecule inhibitor reported,BMS-202 (29, Figure 6) [95] and has characterized the binding in a crystal structure [96]. The mechanismof action is thought to be selectively induced dimerization of PD-L1, which inhibits binding to PD-1(see reviews [97–99])
Figure 6. Small molecule PD-L1 inhibitor.
3.4. PARP
ADP-ribose polymerase (PARP) is the enzyme responsible for attaching linear or branchedpolymers of ADP onto broken DNA and other biomolecules. PARP-1 recognizes single anddouble-strand breaks, crossovers, cruciform, and supercoils. Additionally, PARP-1 maintains thestability of replication forks, and the basal activity is very low [100]. In cancer cells containing a BRCA2deficiency, inhibiting PARP causes synthetic lethality [101]. This treatment strategy has been used todevelop multiple small molecule therapeutics [102].
The first in-class inhibitor olaparib has been adapted for use in PET imaging: [18F]BO (biorthogonalolaparib; 30, Figure 7) [103]. [18F]BO demonstrated ubiquitous distribution in cancer cells andlocalization within the nucleus in cancer cells [104]. Structurally similar to olaparib, the inhibitorradioligand [18F]PARPi (31), and corresponding fluorescent version (32), has been used in GBM celllines [104] and in rodent [105]. Although this shows specific binding in peripheral tumors, there was nosignificant blocking with brain uptake at 2 h biodistribution. Brain penetration was very low initially.In comparison to [11C]choline and [18F]FLT, PARPi demonstrated a lower mean uptake in tumor thanthe other two PET ligands; however, the lower background uptake enabled PARPi to delineate braintumors in rodent models with more clear contrast [106]. The Gouverneur group recently radiolabeledolaparib itself with fluorine-18, though limited imaging studies have been done with this tracer [107].As expected, [18F]olaparib (33) was taken up selectively in PARP-1 expressing cells and in mousetumors. Additionally, radioligand uptake was increased by 70% after tumor irradiation, indicated agreat potential for monitoring radiation damage. However, brain was not included in biodistributioncalculations and there does not appear to be brain uptake in the dynamic PET images. Unlike thepreceding PARP radioligands, the inhibitor [18F]fluorthanatrace ([18F]FTT; 34) is not based on olaparib,but rather rucaparib. This benzimidazole carboxamide derivative is highly potent with an IC50 of6.3 nM [108]. It has been evaluated in humans, though with low brain penetration [109]. There remainsa need for BBB penetrating small molecule inhibitors of PARP in order to be useful specifically inglioblastoma imaging.
219

Molecules 2020, 25, 568
Figure 7. PARP ligands.
3.5. Isocitrate Dehydrogenase (IDH)
Through genome wide association studies (GWASs), the common mutation R132H, locatedon the isocitrate dehydrogenase (IDH) 1 gene, was found in more than 70% of grade II andIII astrocytomas, oligodendrogliomas, and glioblastomas that developed from these lower-gradelesions [110]. However, only 10% of glioblastomas are IDH mutant [1], and this is weakly associatedwith tumor aggressiveness [3]. IDH- mutant GBM has a significantly longer survival rate compared toIDH wild type, 31 months compared to 15 months with standard treatment.
The observed IDH mutation essentially eliminates all enzymatic activity [111]. In normal cells,IDH1 converts isocitrate to α-ketoglutarate and form NADPH, which maintains a pool of reducedglutathione and peroxiredoxin. When isocitrate cannot be converted to α-ketoglutarate, it insteadis converted to R(-)-2-hydroxyglutarate [112]. 2-Hyrdoxyglutarate and α-ketoglutarate are cofactorsfor many enzymes and their availability influences DNA methylation status. 2-HG inhibits 5mChydroxylase (TET2) and lysine demethylases (KDM) leading to demethylation of DNA and histone,respectively. This changes gene expression and thus tumorigenesis. R-2HG stimulates EgIN1, whichpromotes HIF1a degradation by hydroxylation [113]. Therapeutic inhibitors are being developed forIDH1 to influence this pathway and similarly slow tumorigenesis and promote survival.
Ivosidenib (AG-120) is the first in-class IDH1 reversible inhibitor [114]. In rats, some brainpenetration has been demonstrated, 4.1% after 50 mg/kg dose, which could indicate some effectivenessin glioblastoma. The phase I trial in low grade glioma subjects is ongoing (NCT03343197). Anotherinhibitor (IDH305) for mutant IDH1 is in development by Novartis, with strong data for bindingin brain homogenate [115]. In a phase I clinical trial, safety was evaluated in glioma, AML/MDS,and other/ non-CNS solid tumors with IDH mutation [116]. However, phase II trials of IDH305 inglioma has been withdrawn, possibly due to liver toxicity (NCT02977689 [117]).
Before small molecule inhibitors of IDH were available, PET radioligands were evaluatedfor their relationship to IDH mutation status. While [18F]FDOPA does not correlate with IDHmutation status [118], it appears that [18F]FET imaging does significantly associate with IDH mutationstatus [119–121], although there does not appear to be a biochemical relationship between [18F]FET
220

Molecules 2020, 25, 568
uptake and IDH mutation status. With the disclosure of small molecule IDH inhibitors came thepreliminary development of IDH-selective PET radioligands. Chitneni et al. utilized an iodine-131and fluorine-18 version (35, Figure 8) of AGI-5198; however, these compounds lacked selectivity formutant IDH over wild type [122]. In a follow up from the same group, [18F]triazinediamine (36)analogues were radiosynthesized, based on Enasidenib (AG-221) [123], The Kd (36) was calculated tobe 40 nM with a Bmax of 4426 gmol/mg in a mutant anaplastic astrocytoma cell line, which is promising.However, biodistribution studies showed bone uptake from radiolytic defluorination, so further designis required [123].
Figure 8. Isocitrate dehydrogenase (IDH) radioligands.
4. General Imaging Considerations
Brain PET imaging for any disease state is challenging. The blood–brain barrier (BBB) poses amajor obstacle for any successful radiotracer targeting glioblastoma. Even if the radiotracer enters thebrain, many compounds exhibit slow brain entry (i.e., small K1 values). Since glioblastoma lesionsoften compromise BBB, increased radioactivity concentrations at the lesion site may reflect increasednonspecific radiotracer instead of, or in addition to, increased target signal. For example, a combined[18F]FMISO PET and MRI study noted high uptake of [18F]FMISO in areas of BBB disruption aswell as in necrotic tissue [124]. This raises a challenge in quantification at a suspected glioblastomalesion. Kinetic modeling approaches incorporating dynamic data, in some cases, may help distinguishnonspecific signal from specific signal in some cases. Although these scanning protocols can requirelonger scanning time and possibly arterial blood sampling, the potential for improved quantificationof specific radiotracer uptake offers important benefits to evaluating diagnosis, staging, or treatmentefficacy that must be considered when using PET to image GBM.
Reference region approaches offer alternatives for quantitative analyses that may shorten thelength of scanning time and do not require arterial blood sampling. While such approaches have majorlimitations in cases of ubiquitously expressed targets, such as TSPO, in the case of brain tumor imagingthe reference region may be drawn as a larger region that is removed from the lesion. For example,in a case of [18F]FET imaging a fixed-size reference ROI was placed in hemispheres contralateralto tumorous tissue, which yielded fully image-derived measures that correlated with disease-freesurvival [125]. Image-derived input function allow for alternative non-invasive modeling approaches.For example, [18F]FMISO has no reference region, but image-derived tissue-to-blood ratios providereasonable proxies for measured parent radioactivity in venous blood [126]. Such approaches canmaintain quantitative accuracy while reducing logistical complexities introduced by full dynamicscans with blood sampling.
A final major obstacle for PET radiotracers imaging GBM is high nonspecific binding. For example,[18F]FMISO, [18F]FLT, and [64Cu]ATSM exhibit elevated nonspecific binding, which limits theirusefulness. Such radiotracers exhibit low signal to noise ratio (SNR), which makes it more difficult todifferentiate areas of low uptake from noise. In contrast, radiotracers with low nonspecific binding maybe amiable to reference region analysis if non-tumor brain regions exhibit negligible specific binding.
221
Molecules 2020, 25, 568
Off-target binding poses another related challenge. For example, sigma 1 and sigma 2 receptorshave significant structural similarities to opiate receptors. These challenges highlight the need forblocking studies with candidate radiotracers to confirm suitable sensitivity and specificity withouthigh nonspecific binding.
5. Conclusions
PET imaging provides important functional information about GBM tumors and surroundingtissue environment. Markers of proliferation, hypoxia, and inflammation have been used to image thelesions of GBM patients. Exciting new frontiers for PET imaging targets for GBM include PD-L1 forimmune status, PARP-1 for DNA damage, sigma 2 receptors as alternative markers of proliferation,and isocitrate dehydrogenase for tumorigenesis activity. These PET imaging targets have the potentialto enhance diagnosis, staging, and treatment approaches for GBM. As GBM PET imaging techniquesadvance, it is critical to consider blood brain barrier penetration and nonspecific binding in theevaluation of new radioligands.
Author Contributions: L.R.D. performed literature search and drafted the initial manuscript. Z.C. and A.T.H.revised and edited subsequent manuscript iterations. All authors have read and agreed to the published versionof the manuscript.
Funding: This research was supported by NIH grants K01AA024788, R21EB027872, R01AG058773. Z.C. is anArcher Foundation Research Scientist.
Conflicts of Interest: The authors declare no conflict of interest.
References
1. Glioblastoma Multiforme. Available online: https://www.aans.org/Patients/Neurosurgical-Conditions-and-Treatments/Glioblastoma-Multiforme (accessed on 15 November 2019).
2. Louis, D.N.; Perry, A.; Reifenberger, G.; Von Deimling, A.; Figarella-Branger, D.; Cavenee, W.K.; Ohgaki, H.;Wiestler, O.D.; Kleihues, P.; Ellison, D.W. The 2016 World Health Organization classification of tumors of thecentral nervous system: A summary. Acta Neuropathol. 2016, 131, 803–820. [CrossRef] [PubMed]
3. Amelot, A.; De Cremoux, P.; Quillien, V.; Polivka, M.; Adle-Biassette, H.; Lehmann-Che, J.; Francoise, L.;Carpentier, A.F.; George, B.; Mandonnet, E.; et al. IDH-mutation is a weak predictor of long-term survival inglioblastoma patients. PLoS ONE 2015, 10, e0130596. [CrossRef]
4. Perrin, S.L.; Samuel, M.S.; Koszyca, B.; Brown, M.P.; Ebert, L.M.; Oksdath, M.; Gomez, G.A. Glioblastomaheterogeneity and the tumour microenvironment: Implications for preclinical research and development ofnew treatments. Biochem. Soc. Trans. 2019, 47, 625–638. [CrossRef] [PubMed]
5. Ozdemir-Kaynak, E.; Qutub, A.A.; Yesil-Celiktas, O. Advances in Glioblastoma Multiforme Treatment: NewModels for Nanoparticle Therapy. Front. Physiol. 2018, 9. [CrossRef] [PubMed]
6. Reza, S.M.S.; Samad, M.D.; Shboul, Z.A.; Jones, K.A.; Iftekharuddin, K.M. Glioma grading using structuralmagnetic resonance imaging and molecular data. J. Med. Imaging 2019, 6, 024501. [CrossRef]
7. Som, P.; Atkins, H.L.; Bandoypadhyay, D.; Fowler, J.S.; MacGregor, R.R.; Matsui, K.; Oster, Z.H.; Sacker, D.F.;Shiue, C.Y.; Turner, H.; et al. A fluorinated glucose analog, 2-fluoro-2-deoxy-D-glucose (F-18): Nontoxictracer for rapid tumor detection. J. Nucl Med. 1980, 21, 670–675. [CrossRef]
8. Langstrom, B.; Lundqvist, H. The preparation of carbon-11-labeled methyl iodide and its use in the synthesisof carbon-11-labeled methyl-L-methionine. Int. J. Appl. Radiat. Isot. 1976, 27, 357–363. [CrossRef]
9. Comar, D.; Cartron, J.C.; Maziere, M.; Marazano, C. Labeling and metabolism of methionine-methyl-11C.Eur. J. Nucl. Med. 1976, 1, 11–14. [CrossRef]
10. Schober, O.; Duden, C.; Meyer, G.J.; Muller, J.A.; Hundeshagen, H. Non selective transport of[11C-methyl]-L-and D-methionine into a malignant glioma. Eur J. Nucl. Med. 1987, 13, 103–105. [CrossRef]
11. Singhal, T.; Narayanan, T.K.; Jain, V.; Mukherjee, J.; Mantil, J. 11C-L-methionine positron emission tomographyin the clinical management of cerebral gliomas. Mol. Imaging Biol. 2008, 10, 1–18.
12. Wester, H.J.; Herz, M.; Weber, W.; Heiss, P.; Senekowitsch-Schmidtke, R.; Schwaiger, M.; Stocklin, G. Synthesisand radiopharmacology of O-(2-[18F]fluoroethyl)-L-tyrosine for tumor imaging. J. Nucl. Med. 1999, 40,205–212. [PubMed]
222
Molecules 2020, 25, 568
13. Heiss, P.; Mayer, S.; Herz, M.; Wester, H.-J.; Schwaiger, M.; Senekowitsch-Schmidtke, R. Investigation oftransport mechanism and uptake kinetics of O-(2-[18F]fluoroethyl)-L-tyrosine in vitro and in vivo. J. Nucl.Med. 1999, 40, 1367–1373. [PubMed]
14. Habermeier, A.; Graf, J.; Sandhoefer, B.F.; Boissel, J.P.; Roesch, F.; Closs, E.I. System L amino acid transporterLAT1 accumulates O-(2-fluoroethyl)-L-tyrosine (FET). Amino Acids 2015, 47, 335–344. [CrossRef] [PubMed]
15. Pauleit, D.; Floeth, F.; Hamacher, K.; Riemenschneider, M.J.; Reifenberger, G.; Muller, H.-W.; Zilles, K.;Coenen, H.H.; Langen, K.-J. O-(2-[18F]fluoroethyl)-L-tyrosine PET combined with MRI improves thediagnostic assessment of cerebral gliomas. Brain 2005, 128, 678–687. [CrossRef]
16. Minn, H.; Kauhanen, S.; Seppanen, M.; Nuutila, P. 18F-FDOPA: A multiple-target molecule. J. Nucl. Med.2009, 50, 1915–1918. [CrossRef]
17. Patel, C.B.; Fazzari, E.; Chakhoyan, A.; Yao, J.; Raymond, C.; Nguyen, H.; Manoukian, J.; Nguyen, N.;Pope, W.; Cloughesy, T.F.; et al. 18F-FDOPA PET and MRI characteristics correlate with degree of malignancyand predict survival in treatment-naive gliomas: A cross-sectional study. J. Neuro-Oncol. 2018, 139, 399–409.[CrossRef]
18. Chirakal, R.; Firnau, G.; Garnett, E. High yield synthesis of 6-[18F] fluoro-L-dopa. J. Nucl. Med. 1986, 27,417–421.
19. Mossine, A.V.; Tanzey, S.S.; Brooks, A.F.; Makaravage, K.J.; Ichiishi, N.; Miller, J.M.; Henderson, B.D.;Skaddan, M.B.; Sanford, M.S.; Scott, P.J.H. One-pot synthesis of high molar activity 6-[18F]fluoro-L-DOPA byCu-mediated fluorination of a BPin precursor. Org. Biomol. Chem. 2019. Ahead of Print. [CrossRef]
20. Rasey, J.S.; Grierson, J.R.; Wiens, L.W.; Kolb, P.D.; Schwartz, J.L. Validation of FLT uptake as a measure ofthymidine kinase-1 activity in A549 carcinoma cells. J. Nucl. Med. 2002, 43, 1210–1217.
21. Toyohara, J.; Waki, A.; Takamatsu, S.; Yonekura, Y.; Magata, Y.; Fujibayashi, Y. Basis of FLT as a cellproliferation marker: Comparative uptake studies with [3H] thymidine and [3H] arabinothymidine, andcell-analysis in 22 asynchronously growing tumor cell lines. Nucl. Med. Biol. 2002, 29, 281–287. [CrossRef]
22. Vesselle, H.; Grierson, J.; Muzi, M.; Pugsley, J.M.; Schmidt, R.A.; Rabinowitz, P.; Peterson, L.M.;Vallieres, E.; Wood, D.E. In vivo validation of 3’deoxy-3’-[18F]fluorothymidine ([18F]FLT) as a proliferationimaging tracer in humans: Correlation of [18F]FLT uptake by positron emission tomography with Ki-67immunohistochemistry and flow cytometry in human lung tumors. Clin. Cancer Res. 2002, 8, 3315–3323.[PubMed]
23. Been, L.B.; Suurmeijer, A.J.H.; Cobben, D.C.P.; Jager, P.L.; Hoekstra, H.J.; Elsinga, P.H. [18F]FLT-PET inoncology: Current status and opportunities. Eur. J. Nucl. Med. Mol. Imaging 2004, 31, 1659–1672. [CrossRef][PubMed]
24. Yamamoto, Y.; Ono, Y.; Aga, F.; Kawai, N.; Kudomi, N.; Nishiyama, Y. Correlation of 18F-FLT uptake withtumor grade and Ki-67 immunohistochemistry in patients with newly diagnosed and recurrent gliomas.J. Nucl. Med. 2012, 53, 1911–1915. [CrossRef] [PubMed]
25. Chen, W.; Delaloye, S.; Silverman, D.H.S.; Geist, C.; Czernin, J.; Sayre, J.; Satyamurthy, N.; Pope, W.; Lai, A.;Phelps, M.E.; et al. Predicting treatment response of malignant gliomas to bevacizumab and irinotecan byimaging proliferation with [18F] fluorothymidine positron emission tomography: A pilot study. J. Clin.Oncol. 2007, 25, 4714–4721. [CrossRef] [PubMed]
26. Shields, A.F. PET imaging with 18F-FLT and thymidine analogs: Promise and pitfalls. J. Nucl. Med. 2003, 44,1432–1434.
27. Arner, E.S.; Eriksson, S. Mammalian deoxyribonuclease kinases. Pharmacol. Ther. 1995, 67, 155–186.[CrossRef]
28. Ghanem, H.; Kantarjian, H.; Ohanian, M.; Jabbour, E. The role of clofarabine in acute myeloid leukemia.Leuk. Lymphoma 2013, 54, 688–698. [CrossRef]
29. Barrio, M.J.; Spick, C.; Radu, C.G.; Lassmann, M.; Eberlein, U.; Allen-Auerbach, M.; Schiepers, C.; Slavik, R.;Czernin, J.; Herrmann, K. Human biodistribution and radiation dosimetry of 18F-clofarabine, a PET probetargeting the deoxyribonucleoside salvage pathway. J. Nucl. Med. 2017, 58, 374–378. [CrossRef]
30. Toy, G.; Austin, W.R.; Liao, H.-I.; Cheng, D.; Singh, A.; Campbell, D.O.; Ishikawa, T.-o.; Lehmann, L.W.;Satyamurthy, N.; Phelps, M.E.; et al. Requirement for deoxycytidine kinase in T and B lymphocytedevelopment. Proc. Natl. Acad. Sci. USA 2010, 107, 5551–5556. [CrossRef]
223
Molecules 2020, 25, 568
31. Antonios, J.P.; Soto, H.; Everson, R.G.; Moughon, D.L.; Wang, A.C.; Orpilla, J.; Radu, C.; Ellingson, B.M.;Lee, J.T.; Cloughesy, T.; et al. Detection of immune responses after immunotherapy in glioblastoma usingPET and MRI. Proc. Natl. Acad. Sci. USA. 2017, 114, 10220–10225. [CrossRef]
32. Treglia, G.; Muoio, B.; Trevisi, G.; Mattoli, M.V.; Albano, D.; Bertagna, F.; Giovanella, L. DiagnosticPerformance and Prognostic Value of PET/CT with Different Tracers for Brain Tumors: A Systematic Reviewof Published Meta-Analyses. Int. J. Mol. Sci. 2019, 20, 4669. [CrossRef] [PubMed]
33. Omuro, A.; DeAngelis, L.M. Glioblastoma and other malignant gliomas: A clinical review. JAMA J. Am.Med. Assoc. 2013, 310, 1842–1850. [CrossRef] [PubMed]
34. Gray, L.H.; Conger, A.D.; Ebert, M.; Hornsey, S.; Scott, O. The concentration of oxygen dissolved in tissues atthe time of irradiation as a factor in radiotherapy. Br. J. Radiol. 1953, 26, 638–648. [CrossRef] [PubMed]
35. Horsman, M.R.; Mortensen, L.S.; Petersen, J.B.; Busk, M.; Overgaard, J. Imaging hypoxia to improveradiotherapy outcome. Nat. Rev. Clin. Oncol. 2012, 9, 674–687. [CrossRef]
36. Rasey, J.S.; Grunbaum, Z.; Magee, S.; Nelson, N.J.; Olive, P.L.; Durand, R.E.; Krohn, K.A. Characterization ofradiolabeled fluoromisonidazole as a probe for hypoxic cells. Radiat. Res. 1987, 111, 292–304. [CrossRef]
37. Rasey, J.S.; Koh, W.-J.; Grierson, J.R.; Grunbaum, Z.; Krohn, K.A. Radiolabeled fluoromisonidazole as animaging agent for tumor hypoxia. Int. J. Radiat. Oncol. Biol. Phys. 1989, 17, 985–991. [CrossRef]
38. Valk, P.E.; Mathis, C.A.; Prados, M.D.; Gilbert, J.C.; Budinger, T.F. Hypoxia in human gliomas: Demonstrationby PET with fluorine-18-fluoromisonidazole. J. Nucl Med. 1992, 33, 2133–2137.
39. Chakhoyan, A.; Guillamo, J.-S.; Collet, S.; Kauffmann, F.; Delcroix, N.; Lechapt-Zalcman, E.; Constans, J.-M.;Petit, E.; MacKenzie, E.T.; Barre, L.; et al. FMISO-PET-derived brain oxygen tension maps: Application toglioblastoma and less aggressive gliomas. Sci. Rep. 2017, 7, 1–9. [CrossRef]
40. Bell, C.; Dowson, N.; Fay, M.; Thomas, P.; Puttick, S.; Gal, Y.; Rose, S. Hypoxia imaging in gliomas with18F-fluoromisonidazole PET: Toward clinical translation. Semin. Nucl. Med. 2015, 45, 136–150. [CrossRef]
41. Koch, C.J.; Scheuermann, J.S.; Divgi, C.; Judy, K.D.; Kachur, A.V.; Freifelder, R.; Reddin, J.S.; Karp, J.;Stubbs, J.B.; Hahn, S.M.; et al. Biodistribution and dosimetry of 18F-EF5 in cancer patients with preliminarycomparison of 18F-EF5 uptake versus EF5 binding in human glioblastoma. Eur. J. Nucl. Med. Mol. Imaging2010, 37, 2048–2059. [CrossRef]
42. Komar, G.; Seppanen, M.; Eskola, O.; Lindholm, P.; Gronroos, T.J.; Forsback, S.; Sipila, H.; Evans, S.M.;Solin, O.; Minn, H. 18F-EF5: A new PET tracer for imaging hypoxia in head and neck cancer. J. Nucl. Med.2008, 49, 1944–1951. [CrossRef]
43. Ziemer, L.S.; Evans, S.M.; Kachur, A.V.; Shuman, A.L.; Cardi, C.A.; Jenkins, W.T.; Karp, J.S.; Alavi, A.;Dolbier, W.R.; Koch, C.J. Noninvasive imaging of tumor hypoxia in rats using the 2-nitroimidazole 18F-EF5.Eur. J. Nucl. Med. Mol. Imaging 2003, 30, 259–266. [CrossRef]
44. Dolbier, W.R., Jr.; Li, A.-R.; Koch, C.J.; Shiue, C.-Y.; Kachur, A.V. [18F]-EF5, a marker for PET detectionof hypoxia: Synthesis of precursor and a new fluorination procedure. Appl. Radiat. Isot. 2001, 54, 73–80.[CrossRef]
45. Lehtioe, K.; Oikonen, V.; Nyman, S.; Groenroos, T.; Roivainen, A.; Eskola, O.; Minn, H. Quantifying tumourhypoxia with fluorine-18 fluoroerythronitroimidazole ([18F]FETNIM) and PET using the tumour to plasmaratio. Eur. J. Nucl. Med. Mol. Imaging 2003, 30, 101–108. [CrossRef]
46. Gronroos, T.; Eskola, O.; Lehtio, K.; Minn, H.; Marjamaki, P.; Bergman, J.; Haaparanta, M.; Forsback, S.;Solin, O. Pharmacokinetics of [18F]FETNIM: A potential hypoxia marker for PET. J. Nucl. Med. 2001, 42,1397–1404. [PubMed]
47. Yang, D.J.; Wallace, S.; Cherif, A.; Li, C.; Gretzer, M.B.; Kim, E.E.; Podoloff, D.A. Development of F-18-labeledfluoroerythronitroimidazole as a PET agent for imaging tumor hypoxia. Radiology 1995, 194, 795–800.[CrossRef]
48. Verwer, E.E.; Windhorst, A.D.; Boellaard, R.; Verwer, E.E.; Zegers, C.M.L.; van, E.W.; Lambin, P.; Wierts, R.;Mottaghy, F.M.; Mottaghy, F.M.; et al. Pharmacokinetic modeling of a novel hypoxia PET tracer [(18)F]HX4in patients with non-small cell lung cancer. EJNMMI Phys. 2016, 3, 30. [CrossRef]
49. Dubois, L.J.; Lieuwes, N.G.; Janssen, M.H.M.; Peeters, W.J.M.; Windhorst, A.D.; Walsh, J.C.; Kolb, H.C.;Oellers, M.C.; Bussink, J.; van Dongen, G.A.M.S.; et al. Preclinical evaluation and validation of [18F]HX4, apromising hypoxia marker for PET imaging. Proc. Natl. Acad. Sci. USA. 2011, 108, 14620–14625. [CrossRef]
224

Molecules 2020, 25, 568
50. Van Loon, J.; Janssen, M.H.M.; Oellers, M.; Aerts, H.J.W.L.; Dubois, L.; Hochstenbag, M.; Dingemans, A.-M.C.;Lalisang, R.; Brans, B.; Windhorst, B.; et al. PET imaging of hypoxia using [18F]HX4: A phase I trial. Eur. J.Nucl. Med. Mol. Imaging 2010, 37, 1663–1668. [CrossRef]
51. Doss, M.; Zhang, J.J.; Belanger, M.-J.; Stubbs, J.B.; Hostetler, E.D.; Alpaugh, K.; Kolb, H.C.; Yu, J.Q.Biodistribution and radiation dosimetry of the hypoxia marker 18F-HX4 in monkeys and human determinedby using whole-body PET/CT. Nucl. Med. Commun. 2010, 31, 1016–1024. [CrossRef]
52. Wack, L.J.; Moennich, D.; van Elmpt, W.; Zegers, C.M.L.; Troost, E.G.C.; Zips, D.; Thorwarth, D. Comparisonof [18F]-FMISO, [18F]-FAZA and [18F]-HX4 for PET imaging of hypoxia - a simulation study. Acta Oncol.2015, 54, 1370–1377. [CrossRef] [PubMed]
53. Peeters, S.G.J.A.; Zegers, C.M.L.; Lieuwes, N.G.; van Elmpt, W.; Eriksson, J.; van Dongen, G.A.M.S.; Dubois, L.;Lambin, P. A Comparative Study of the Hypoxia PET Tracers [18F]HX4, [18F]FAZA, and [18F]FMISO in aPreclinical Tumor Model. Int. J. Radiat. Oncol. Biol. Phys. 2015, 91, 351–359. [CrossRef] [PubMed]
54. Watanabe, S.; Shiga, T.; Hirata, K.; Magota, K.; Okamoto, S.; Toyonaga, T.; Higashikawa, K.; Yasui, H.;Kobayashi, J.; Nishijima, K.-I.; et al. Biodistribution and radiation dosimetry of the novel hypoxia PET probe[18F]DiFA and comparison with [18F]FMISO. EJNMMI Res. 2019. [CrossRef] [PubMed]
55. Dunphy, M.P.S.; Lewis, J.S. Radiopharmaceuticals in preclinical and clinical development for monitoring oftherapy with PET. J. Nucl. Med. 2009, 50, 106S–121S. [CrossRef] [PubMed]
56. Floberg, J.M.; Wang, L.; Bandara, N.; Rashmi, R.; Mpoy, C.; Garbow, J.R.; Rogers, B.E.; Patti, G.J.; Schwarz, J.K.Altering cellular reducing potential changes 64Cu-ATSM signal with or without hypoxia. J. Nucl. Med. 2019.[CrossRef] [PubMed]
57. Toriihara, A.; Yoneyama, T.; Kitazume, Y.; Tateishi, U.; Ohtake, M.; Tateishi, K.; Kawahara, N.;Hino-Shishikura, A.; Inoue, T. Prognostic implications of (62)Cu-diacetyl-bis (N(4)-methylthiosemicarbazone)PET/CT in patients with glioma. Ann. Nucl Med. 2018, 32, 264–271. [CrossRef]
58. Xie, D.; Kim, S.; Kohli, V.; Banerjee, A.; Yu, M.; Enriquez, J.S.; Luci, J.J.; Que, E.L. Hypoxia-Responsive19F MRI Probes with Improved Redox Properties and Biocompatibility. Inorg. Chem. 2017, 56, 6429–6437.[CrossRef]
59. Xie, D.; King, T.L.; Banerjee, A.; Kohli, V.; Que, E.L. Exploiting Copper Redox for 19F MagneticResonance-Based Detection of Cellular Hypoxia. J. Am. Chem. Soc. 2016, 138, 2937–2940. [CrossRef]
60. Challapalli, A.; Carroll, L.; Aboagye, E.O. Molecular mechanisms of hypoxia in cancer. Clin. Transl. Imaging2017, 5, 225–253. [CrossRef]
61. Burger, P.C.; Vogel, F.S.; Green, S.B.; Strike, T.A. Glioblastoma multiforme and anaplastic astrocytoma.Pathologic criteria and prognostic implications. Cancer 1985, 56, 1106–1111. [CrossRef]
62. King, J.G., Jr.; Khalili, K. Inhibition of human brain tumor cell growth by the anti-inflammatory drug,flurbiprofen. Oncogene 2001, 20, 6864–6870. [CrossRef] [PubMed]
63. Roncaroli, F.; Su, Z.; Herholz, K.; Gerhard, A.; Turkheimer, F.E. TSPO expression in brain tumours: Is TSPO atarget for brain tumour imaging? Clin. Transl. Imaging 2016, 4, 145–156. [CrossRef] [PubMed]
64. Pappata, S.; Cornu, P.; Samson, Y.; Prenant, C.; Benavides, J.; Scatton, B.; Crouzel, C.; Hauw, J.; Syrota, A. PETstudy of carbon-11-PK 11195 binding to peripheral type benzodiazepine sites in glioblastoma: A case report.J. Nucl. Med. 1991, 32, 1608–1610. [PubMed]
65. Miettinen, H.; Kononen, J.; Haapasalo, H.; Helén, P.; Sallinen, P.; Harjuntausta, T.; Helin, H.; Alho, H.Expression of peripheral-type benzodiazepine receptor and diazepam binding inhibitor in humanastrocytomas: Relationship to cell proliferation. Cancer Res. 1995, 55, 2691–2695. [PubMed]
66. Vlodavsky, E.; Soustiel, J.F. Immunohistochemical expression of peripheral benzodiazepine receptors inhuman astrocytomas and its correlation with grade of malignancy, proliferation, apoptosis and survival. J.Neuro-Oncol. 2007, 81, 1–7. [CrossRef]
67. Su, Z.; Roncaroli, F.; Durrenberger, P.F.; Coope, D.J.; Karabatsou, K.; Hinz, R.; Thompson, G.; Turkheimer, F.E.;Janczar, K.; Du Plessis, D. The 18-kDa mitochondrial translocator protein in human gliomas: An 11C-(R)PK11195 PET imaging and neuropathology study. J. Nucl. Med. 2015, 56, 512–517. [CrossRef]
68. Vilner, B.J.; John, C.S.; Bowen, W.D. Sigma-1 and sigma-2 receptors are expressed in a wide variety of humanand rodent tumor cell lines. Cancer Res. 1995, 55, 408–413.
69. Megalizzi, V.; Decaestecker, C.; Debeir, O.; Spiegl-Kreinecker, S.; Berger, W.; Lefranc, F.; Kast, R.E.; Kiss, R.Screening of anti-glioma effects induced by sigma-1 receptor ligands: Potential new use for old anti-psychiatricmedicines. Eur. J. Cancer 2009, 45, 2893–2905. [CrossRef]
225

Molecules 2020, 25, 568
70. Jia, H.; Zhang, Y.; Huang, Y. Imaging sigma receptors in the brain: New opportunities for diagnosis ofAlzheimer’s disease and therapeutic development. Neurosci. Lett. 2019, 691, 3–10. [CrossRef]
71. Toyohara, J.; Kobayashi, T.; Mita, S.; Ishiwata, K. Application of [11C]SA4503 to selection of novel σ1 selectiveagonists. Nucl. Med. Biol. 2012, 39, 1117–1121. [CrossRef]
72. Matsuno, K.; Nakazawa, M.; Okamoto, K.; Kawashima, Y.; Mita, S. Binding properties of SA4503, a noveland selective σ1 receptor agonist. Eur. J. Pharmacol. 1996, 306, 271–279. [CrossRef]
73. Lee Collier, T.; O’Brien, J.C.; Waterhouse, R.N. Synthesis of[18F]-1-(3-Fluoropropyl)-4-(4-cyanophenoxymethyl)-piperidine: A potential sigma-1 receptor radioligandfor PET. J. Label. Compd. Radiopharm. 1996, 38, 785–794. [CrossRef]
74. Waterhouse, R.N.; Chang, R.C.; Atuehene, N.; Collier, T.L. In vitro and in vivo binding of neuroactive steroidsto the sigma-1 receptor as measured with the positron emission tomography radioligand [18F]FPS. SYNAPSE2007, 61, 540–546. [CrossRef] [PubMed]
75. James, M.L.; Shen, B.; Zavaleta, C.L.; Nielsen, C.H.; Mesangeau, C.; Vuppala, P.K.; Chan, C.; Avery, B.A.;Fishback, J.A.; Matsumoto, R.R.; et al. New Positron Emission Tomography (PET) Radioligand for Imagingσ-1 Receptors in Living Subjects. J. Med. Chem. 2012, 55, 8272–8282. [CrossRef] [PubMed]
76. Kranz, M.; Bergmann, R.; Kniess, T.; Belter, B.; Neuber, C.; Cai, Z.; Deng, G.; Fischer, S.; Zhou, J.; Huang, Y.; et al.Bridging from brain to tumor imaging: (S)-(-)- and (R)-(+)-[18F]fluspidine for investigation of sigma-1receptors in tumor-bearing mice. Molecules 2018, 23, 702. [CrossRef]
77. Kranz, M.; Sattler, B.; Wüst, N.; Deuther-Conrad, W.; Patt, M.; Meyer, P.; Fischer, S.; Donat, C.; Wünsch, B.;Hesse, S. Evaluation of the enantiomer specific biokinetics and radiation doses of [18F] fluspidine—A newtracer in clinical translation for imaging of σ1 receptors. Molecules 2016, 21, 1164. [CrossRef]
78. Wheeler, K.T.; Wang, L.M.; Wallen, C.A.; Childers, S.R.; Cline, J.M.; Keng, P.C.; Mach, R.H. Sigma-2 receptorsas a biomarker of proliferation in solid tumours. Br. J. Cancer 2000, 82, 1223–1232. [CrossRef]
79. Zeng, C.; McDonald, E.S.; Mach, R.H. Molecular probes for imaging the sigma-2 receptor: In vitro andin vivo imaging studies. Handb. Exp. Pharmacol. 2017, 244, 309–330. [CrossRef]
80. Mach, R.H.; Zeng, C.; Hawkins, W.G. The σ2 Receptor: A Novel Protein for the Imaging and Treatment ofCancer. J. Med. Chem. 2013, 56, 7137–7160. [CrossRef]
81. John, C.S.; Wilner, B.J.; Gulden, M.E.; Efange, S.M.N.; Langason, R.B.; Moody, T.W.; Bowen, W.D. Synthesisand pharmacological characterization of 4-[125I]-N-(N-benzylpiperidin-4-yl)-4-iodobenzamide: A highaffinity or receptor ligand for potential imaging of breast cancer. Cancer Res. 1995, 55, 3022–3027.
82. John, C.S.; Bowen, W.D.; Fisher, S.J.; Lim, B.B.; Geyer, B.C.; Vilner, B.J.; Wahl, R.L.Synthesis, in vitro pharmacologic characterization, and preclinical evaluation ofN-[2-(1’-piperidinyl)ethyl]-3-[125I]iodo-4-methoxybenzamide (P[125I]MBA) for imaging breast cancer. Nucl.Med. Biol. 1999, 26, 377–382. [CrossRef]
83. Kashiwagi, H.; McDunn, J.E.; Simon, P.O., Jr.; Goedegebuure, P.S.; Xu, J.; Jones, L.; Chang, K.;Johnston, F.; Trinkaus, K.; Hotchkiss, R.S.; et al. Selective sigma-2 ligands preferentially bind to pancreaticadenocarcinomas: Applications in diagnostic imaging and therapy. Mol. Cancer 2007, 6, 48. [CrossRef][PubMed]
84. Dehdashti, F.; Laforest, R.; Gao, F.; Shoghi, K.I.; Aft, R.L.; Nussenbaum, B.; Kreisel, F.H.; Bartlett, N.L.;Cashen, A.; Wagner-Johnston, N.; et al. Assessment of cellular proliferation in tumors by PET using 18F-ISO-1.J. Nucl. Med. 2013, 54, 350–357. [CrossRef] [PubMed]
85. Shoghi, K.I.; Xu, J.; Su, Y.; He, J.; Rowland, D.; Yan, Y.; Garbow, J.R.; Tu, Z.; Jones, L.A.; Higashikubo, R.; et al.Quantitative receptor-based imaging of tumor proliferation with the sigma-2 ligand [18F]ISO-1. PLoS ONE2013, 8, e74188. [CrossRef]
86. Elmi, A.; Makvandi, M.; Weng, C.-C.; Hou, C.; Mach, R.H.; Mankoff, D.A.; Clark, A.S. Cell-ProliferationImaging for Monitoring Response to CDK4/6 Inhibition Combined with Endocrine-Therapy in Breast Cancer:Comparison of [(18)F]FLT and [(18)F]ISO-1 PET/CT. Clin. Cancer Res. 2019, 25, 3063–3073. [CrossRef]
87. Nguyen, V.H.; Pham, T.; Fookes, C.; Berghofer, P.; Greguric, I.; Arthur, A.; Mattner, F.; Rahardjo, G.; Davis, E.;Howell, N.; et al. Synthesis and biological characterization of 18F-SIG343 and 18F-SIG353, novel and highselectivity σ2 radiotracers, for tumor imaging properties. EJNMMI Res. 2013, 3, 80. [CrossRef]
88. Abate, C.; Selivanova, S.V.; Muller, A.; Kramer, S.D.; Schibli, R.; Marottoli, R.; Perrone, R.; Berardi, F.; Niso, M.;Ametamey, S.M. Development of 3,4-dihydroisoquinolin-1(2H)-one derivatives for the Positron EmissionTomography (PET) imaging of σ2 receptors. Eur. J. Med. Chem. 2013, 69, 920–930. [CrossRef]
226

Molecules 2020, 25, 568
89. Selivanova, S.V.; Toscano, A.; Abate, C.; Berardi, F.; Muller, A.; Kramer, S.D.; Schibli, R.; Ametamey, S.M.Synthesis and pharmacological evaluation of 11C-labeled piperazine derivative as a PET probe for sigma-2receptor imaging. Nucl. Med. Biol. 2015, 42, 399–405. [CrossRef]
90. Wang, L.; Ye, J.; He, Y.; Deuther-Conrad, W.; Zhang, J.; Zhang, X.; Cui, M.; Steinbach, J.; Huang, Y.;Brust, P.; et al. 18F-Labeled indole-based analogs as highly selective radioligands for imaging sigma-2receptors in the brain. Bioorg. Med. Chem. 2017, 25, 3792–3802. [CrossRef]
91. Lesniak, W.G.; Chatterjee, S.; Gabrielson, M.; Lisok, A.; Wharram, B.; Pomper, M.G.; Nimmagadda, S. PD-L1Detection in Tumors Using [(64)Cu]Atezolizumab with PET. Bioconjug Chem. 2016, 27, 2103–2110. [CrossRef]
92. Chatterjee, S.; Lesniak, W.G.; Lisok, A.; Wharram, B.; Kumar, D.; Gabrielson, M.; Miller, M.S.; Sikorska, E.;Pomper, M.G.; Gabelli, S.B.; et al. Rapid PD-L1 detection in tumors with PET using a highly specific peptide.Biochem. Biophys. Res. Commun. 2017, 483, 258–263. [CrossRef]
93. Mayer, A.T.; Gambhir, S.S.; Mayer, A.T.; Natarajan, A.; Gambhir, S.S.; Gordon, S.R.; Maute, R.L.;McCracken, M.N.; Weissman, I.L.; Gordon, S.R.; et al. Practical Immuno-PET Radiotracer DesignConsiderations for Human Immune Checkpoint Imaging. J. Nucl. Med. 2017, 58, 538–546.
94. Gonzalez, T.D.E.; Meng, X.; McQuade, P.; Rubins, D.; Klimas, M.; Zeng, Z.; Connolly, B.M.; Miller, P.J.;O’Malley, S.S.; Lin, S.-A.; et al. In Vivo Imaging of the Programmed Death Ligand 1 by (18)F PET. J. Nucl.Med. 2017, 58, 1852–1857. [CrossRef]
95. Miller, M.M.; Mapelli, C.; Allen, M.P.; Bowsher, M.S.; Boy, K.M.; Gillis, E.P.; Langley, D.R.; Mull, E.;Poirier, M.A.; Sanghvi, N. Macrocyclic inhibitors of the PD-1/PD-L1 and CD80 (B7-1)/PD-L1 protein/proteininteractions. US9308236B2, 7 July 2016.
96. Zak, K.M.; Grudnik, P.; Guzik, K.; Zieba, B.J.; Musielak, B.; Dömling, A.; Dubin, G.; Holak, T.A. Structuralbasis for small molecule targeting of the programmed death ligand 1 (PD-L1). Oncotarget 2016, 7, 30323–30335.[CrossRef]
97. Konstantinidou, M.; Zarganes-Tzitzikas, T.; Domling, A.; Magiera-Mularz, K.; Holak, T.A.; Holak, T.A.Immune Checkpoint PD-1/PD-L1: Is There Life Beyond Antibodies? Angew. Chem. Int. Ed. Engl. 2018, 57,4840–4848. [CrossRef]
98. Chen, T.; Li, Q.; Liu, Z.; Chen, Y.; Feng, F.; Sun, H. Peptide-based and small synthetic molecule inhibitors onPD-1/PD-L1 pathway: A new choice for immunotherapy? Eur. J. Med. Chem. 2019, 161, 378–398. [CrossRef]
99. Lee, H.T.; Lee, S.H.; Heo, Y.-S. Molecular interactions of antibody drugs targeting PD-1, PD-L1, and CTLA-4in immuno-oncology. Molecules 2019, 24, 1190. [CrossRef]
100. Kim, M.Y.; Zhang, T.; Kraus, W.L. Poly(ADP-ribosyl)ation by PARP-1: ‘PAR-laying’ NAD+ into a nuclearsignal. Genes Dev. 2005, 19, 1951–1967. [CrossRef]
101. Ray Chaudhuri, A.; Nussenzweig, A. The multifaceted roles of PARP1 in DNA repair and chromatinremodelling. Nat. Rev. Mol. Cell Biol. 2017, 18, 610–621. [CrossRef]
102. Jain, P.G.; Patel, B.D. Medicinal chemistry approaches of poly ADP-Ribose polymerase 1 (PARP1) inhibitorsas anticancer agents—A recent update. Eur. J. Med. Chem. 2019, 165, 198–215. [CrossRef]
103. Reiner, T.; Lacy, J.; Keliher, E.J.; Yang, K.S.; Ullal, A.; Kohler, R.H.; Vinegoni, C.; Weissleder, R. Imagingtherapeutic PARP inhibition in vivo through bioorthogonally developed companion imaging agents. Neoplasia2012, 14, 169–177. [CrossRef]
104. Irwin, C.P.; Portorreal, Y.; Brand, C.; Zhang, Y.; Desai, P.; Salinas, B.; Weber, W.A.; Reiner, T. PARPi-FL-afluorescent PARP1 inhibitor for glioblastoma imaging. Neoplasia 2014, 16, 432–440. [CrossRef] [PubMed]
105. Carney, B.; Carlucci, G.; Salinas, B.; Di Gialleonardo, V.; Kossatz, S.; Vansteene, A.; Longo, V.A.; Bolaender, A.;Chiosis, G.; Keshari, K.R. Non-invasive PET imaging of PARP1 expression in glioblastoma models. Mol.Imaging Biol. 2016, 18, 386–392. [CrossRef] [PubMed]
106. Kossatz, S.; Carney, B.; Schweitzer, M.; Carlucci, G.; Miloushev, V.Z.; Maachani, U.B.; Rajappa, P.; Keshari, K.R.;Pisapia, D.; Weber, W.A.; et al. Biomarker-Based PET Imaging of Diffuse Intrinsic Pontine Glioma in MouseModels. Cancer Res. 2017, 77, 2112. [CrossRef] [PubMed]
107. Wilson, T.C.; Xavier, M.-A.; Knight, J.; Verhoog, S.; Torres, J.B.; Mosley, M.; Hopkins, S.L.; Wallington, S.;Allen, P.D.; Kersemans, V.; et al. PET Imaging of PARP Expression Using 18F-Olaparib. J. Nucl. Med. 2019,60, 504–510. [CrossRef]
108. Zhou, D.; Chu, W.; Xu, J.; Jones, L.A.; Peng, X.; Li, S.; Chen, D.L.; Mach, R.H. Synthesis, [18F] radiolabeling,and evaluation of poly (ADP-ribose) polymerase-1 (PARP-1) inhibitors for in vivo imaging of PARP-1 usingpositron emission tomography. Bioorg. Med. Chem. 2014, 22, 1700–1707. [CrossRef]
227

Molecules 2020, 25, 568
109. Michel, L.S.; Dyroff, S.; Brooks, F.J.; Spayd, K.J.; Lim, S.; Engle, J.T.; Phillips, S.; Tan, B.; Wang-Gillam, A.;Bognar, C.; et al. PET of Poly (ADP-Ribose) Polymerase Activity in Cancer: Preclinical Assessment and FirstIn-Human Studies. Radiology 2016, 282, 453–463. [CrossRef]
110. Yan, H.; Parsons, D.W.; Jin, G.; McLendon, R.; Rasheed, B.A.; Yuan, W.; Kos, I.; Batinic-Haberle, I.; Jones, S.;Riggins, G.J.; et al. IDH1 and IDH2 Mutations in Gliomas. New Engl. J. Med. 2009, 360, 765–773. [CrossRef]
111. Sanson, M.; Marie, Y.; Paris, S.; Idbaih, A.; Laffaire, J.; Ducray, F.; El Hallani, S.; Boisselier, B.; Mokhtari, K.;Hoang-Xuan, K. Isocitrate dehydrogenase 1 codon 132 mutation is an important prognostic biomarker ingliomas. J. Clin. Oncol. 2009, 27, 4150–4154. [CrossRef]
112. Ye, D.; Ma, S.; Xiong, Y.; Guan, K.-L. R-2-hydroxyglutarate as the key effector of IDH mutations promotingoncogenesis. Cancer Cell 2013, 23, 274–276. [CrossRef]
113. Kaminska, B.; Czapski, B.; Guzik, R.; Krol, S.K.; Gielniewski, B. Consequences of IDH1/2 mutations ingliomas and an assessment of inhibitors targeting mutated IDH proteins. Molecules 2019, 24, 968. [CrossRef]
114. Popovici-Muller, J.; Lemieux, R.M.; Artin, E.; Saunders, J.O.; Salituro, F.G.; Travins, J.; Cianchetta, G.; Cai, Z.;Zhou, D.; Cui, D.; et al. Discovery of AG-120 (Ivosidenib): A First-in-Class Mutant IDH1 Inhibitor for theTreatment of IDH1 Mutant Cancers. ACS Med. Chem. Lett. 2018, 9, 300–305. [CrossRef] [PubMed]
115. Cho, Y.S.; Levell, J.R.; Liu, G.; Caferro, T.; Sutton, J.; Shafer, C.M.; Costales, A.; Manning, J.R.; Zhao, Q.;Sendzik, M.; et al. Discovery and Evaluation of Clinical Candidate IDH305, a Brain Penetrant Mutant IDH1Inhibitor. ACS Med. Chem. Lett. 2017, 8, 1116–1121. [CrossRef] [PubMed]
116. DiNardo, C.D.; Schimmer, A.D.; Yee, K.W.L.; Hochhaus, A.; Kraemer, A.; Carvajal, R.D.; Janku, F.; Bedard, P.;Carpio, C.; Wick, A.; et al. A Phase I Study of IDH305 in Patients with Advanced Malignancies IncludingRelapsed/Refractory AML and MDS That Harbor IDH1R132 Mutations. Blood 2016, 128, 1073. [CrossRef]
117. Chi, A.S. Trial of IDH305 in IDH1 Mutant Grade II or III Glioma. Available online: https://clinicaltrials.gov/ct2/show/NCT02977689 (accessed on 30 September 2019).
118. Cicone, F.; Carideo, L.; Scaringi, C.; Arcella, A.; Giangaspero, F.; Scopinaro, F.; Minniti, G. 18F-DOPA uptakedoes not correlate with IDH mutation status and 1p/19q co-deletion in glioma. Ann. Nucl. Med. 2019, 33,295–302. [CrossRef]
119. Blanc-Durand, P.; Van Der Gucht, A.; Verger, A.; Langen, K.-J.; Dunet, V.; Bloch, J.; Brouland, J.-P.;Nicod-Lalonde, M.; Schaefer, N.; Prior, J.O. Voxel-based 18F-FET PET segmentation and automatic clusteringof tumor voxels: A significant association with IDH1 mutation status and survival in patients with gliomas.PLoS ONE 2018, 13, e0199379. [CrossRef]
120. Unterrrainer, M.; Winkelmann, I.; Suchorska, B.; Giese, A.; Wenter, V.; Kreth, F.W.; Herms, J.; Bartenstein, P.;Tonn, J.C.; Albert, N.L. Biological tumour volumes of gliomas in early and standard 20-40 min 18F-FETPET images differ according to IDH mutation status. Eur. J. Nucl. Med. Mol. Imaging 2018, 45, 1242–1249.[CrossRef]
121. Verger, A.; Stoffels, G.; Bauer, E.K.; Lohmann, P.; Blau, T.; Fink, G.R.; Neumaier, B.; Shah, N.J.; Langen, K.-J.;Galldiks, N. Static and dynamic 18F-FET PET for the characterization of gliomas defined by IDH and 1p/19qstatus. Eur. J. Nucl. Med. Mol. Imaging 2018, 45, 443–451. [CrossRef]
122. Chitneni, S.K.; Reitman, Z.J.; Spicehandler, R.; Gooden, D.M.; Yan, H.; Zalutsky, M.R. Synthesis and evaluationof radiolabeled AGI-5198 analogues as candidate radiotracers for imaging mutant IDH1 expression in tumors.Bioorg. Med. Chem. Lett. 2018, 28, 694–699. [CrossRef]
123. Chitneni, S.K.; Yan, H.; Zalutsky, M.R. Synthesis and Evaluation of a 18F-Labeled Triazinediamine Analoguefor Imaging Mutant IDH1 Expression in Gliomas by PET. ACS Med. Chem. Lett. 2018, 9, 606–611. [CrossRef]
124. Preibisch, C.; Shi, K.; Kluge, A.; Lukas, M.; Wiestler, B.; Goettler, J.; Gempt, J.; Ringel, F.; Al Jaberi, M.;Schlegel, J.; et al. Characterizing hypoxia in human glioma: A simultaneous multimodal MRI and PET study.NMR Biomed. 2017, 30, e3775. [CrossRef]
228

Molecules 2020, 25, 568
125. Thiele, F.; Ehmer, J.; Piroth, M.D.; Eble, M.J.; Coenen, H.H.; Kaiser, H.-J.; Schaefer, W.M.; Buell, U.; Boy, C.The quantification of dynamic FET PET imaging and correlation with the clinical outcome in patients withglioblastoma. Phys. Med. Biol. 2009, 54, 5525–5539. [CrossRef] [PubMed]
126. Muzi, M.; Peterson, L.M.; O’Sullivan, J.N.; Fink, J.R.; Rajendran, J.G.; McLaughlin, L.J.; Muzi, J.P.;Mankoff, D.A.; Krohn, K.A. 18F-fluoromisonidazole quantification of hypoxia in human cancer patientsusing image-derived blood surrogate tissue reference regions. J. Nucl. Med. 2015, 56, 1223–1228. [CrossRef][PubMed]
© 2020 by the authors. Licensee MDPI, Basel, Switzerland. This article is an open accessarticle distributed under the terms and conditions of the Creative Commons Attribution(CC BY) license (http://creativecommons.org/licenses/by/4.0/).
229


MDPISt. Alban-Anlage 66
4052 BaselSwitzerland
Tel. +41 61 683 77 34Fax +41 61 302 89 18
www.mdpi.com
Molecules Editorial OfficeE-mail: [email protected]
www.mdpi.com/journal/molecules


MDPI St. Alban-Anlage 66 4052 Basel Switzerland
Tel: +41 61 683 77 34 Fax: +41 61 302 89 18
www.mdpi.com ISBN 978-3-03936-721-4
Copyright © 2022 FDOKUMEN