Detection of inter-hemispheric asymmetries of brain perfusion in SPECT

IOP PUBLISHING PHYSICS IN MEDICINE AND BIOLOGY
Phys. Med. Biol. 53 (2008) 4595–4604 doi:10.1088/0031-9155/53/17/009
Accuracy of quantitative reconstructions inSPECT/CT imaging
S Shcherbinin1, A Celler1, T Belhocine2, R Vanderwerf2 and A Driedger2
1 Department of Radiology, University of British Columbia, 366-828 West 10th Avenue,Vancouver BC, V5Z 1L8, Canada2 Department of Nuclear Medicine, London Health Sciences Centre, 375 South Street,PO Box 5375, London ON, N6A 4G5, Canada
E-mail: [email protected]
Received 4 April 2008, in final form 18 June 2008Published 4 August 2008Online at stacks.iop.org/PMB/53/4595
AbstractThe goal of this study was to determine the quantitative accuracy of ourOSEM-APDI reconstruction method based on SPECT/CT imaging for Tc-99m, In-111, I-123, and I-131 isotopes. Phantom studies were performedon a SPECT/low-dose multislice CT system (Infinia-Hawkeye-4 slice, GEHealthcare) using clinical acquisition protocols. Two radioactive sourceswere centrally and peripherally placed inside an anthropometric Thoraxphantom filled with non-radioactive water. Corrections for attenuation, scatter,collimator blurring and collimator septal penetration were applied and theircontribution to the overall accuracy of the reconstruction was evaluated.Reconstruction with the most comprehensive set of corrections resulted inactivity estimation with error levels of 3–5% for all the isotopes.
(Some figures in this article are in colour only in the electronic version)
1. Introduction
Accurate quantitation of activity distribution is one of the key elements for unsealedradiotherapy procedures (Flux et al 2006). With increased availability of hybrid imaging,simultaneous assessment of organ anatomy and function has become clinically both feasibleand practical. More importantly, such dual-modality imaging allows for advanced dataprocessing, which may potentially lead to fully quantitative measurement of radiotracerdistribution in tumors, more accurate than is possible with other currently available methods.
The main limitation of SPECT/CT in providing quantitative information about the activitydistribution is related to the severe degradation of the acquired data by different physics effects(Tsui et al 1998, El Fakhri et al 2000, King et al 2004, Buvat 2007). These image-degradingfactors include attenuation and scattering of photons as they pass through different layers of
0031-9155/08/174595+10$30.00 © 2008 Institute of Physics and Engineering in Medicine Printed in the UK 4595

4596 S Shcherbinin et al
tissue, and resolution loss due to collimator blurring. The relative impact of these phenomenaon the SPECT quantitative accuracy was investigated, for instance, by El Fakhri et al (2000),Buvat et al (2000) and He et al (2005).
Incorporation of an accurate description of physics phenomena into reconstructionalgorithms serves as an effective way to improve quantitative characteristics of the recoveredimage. In hybrid SPECT/CT imaging systems, the spatial distribution of attenuationcoefficients is obtained from CT scans (e.g., Hasegawa et al (2002) and Hasegawa andZaidi (2006)). The collimator blurring can be described by a 3D Gaussian function.However, accurate modeling of photons scattered through non-uniform media still represents achallenging task (Zaidi and Koral 2006) even when using patient-specific CT-based attenuationmaps. Because the behavior of scattered photons depends on electron density in every pointof the scanned object, its calculation is very expensive in terms of computation time. BothMonte Carlo simulations (Veklerov et al 1988, Floyd et al 1989, Bowsher and Floyd 1991,Lazaro et al 2005) and analytical integration of the Klein–Nishina formula (Cao et al 1994,Riauka and Gortel 1994, Wells et al 1998) are affected by this factor.
Our analytical photon distribution (APD) method (Wells et al 1998) of scatter modelinguses the later approach where noiseless scatter projections are analytically calculatedusing the Klein–Nishina formula. Our method utilizes 3D CT-based attenuation maps toestimate attenuation and scatter of propagating photons without any simplifications regardinghomogeneousity of patient tissues or physics of photons propagation through non-uniformmedia (see the list of assumptions below). Neither ‘effective scatter source estimations’(ESSE) (Frey and Tsui 1996) nor ‘effective scatter source images’ (ESSI) (Bai et al 2000) areemployed.
The techniques used to shorten the computation time for our quantitative imagereconstruction (which includes attenuation, scatter and resolution recovery corrections) are asfollows.
• Only first- and second-order Compton as well as Rayleigh scatter components are directlycalculated using the Klein–Nishina formula. If necessary, to correct for photons thatscattered more than twice, the scaling factor matching experimental and APD-computedprojections may be introduced (Vandervoort et al 2005).
• A substantial part of the calculations can be performed just once and saved as camera-dependent look-up tables to be used in any later acquired patient study (Wells et al1998). Fast calculation of these look-up tables is performed using the advanced numericalintegration techniques (Humphries et al 2007).
• Additionally, a substantial improvement in calculation time and computer memoryrequirements is achieved by using interpolated scatter point spread functions—APD-interpolated (APDI) method (Vandervoort et al 2005).
• While attenuation and resolution recovery corrections are incorporated directly intothe system matrix, the scatter component is included only in the forward step of theMLEM/OSEM algorithm.
Experimental validation of this technique performed previously using Tc-99m and cardiacphantom data demonstrated errors of quantitative estimation of activity concentration below4% (Vandervoort et al 2007).
A broad, long-term objective of our research is to create a practical methodology thatwould enable quantitative data acquisition and image reconstruction for clinical oncologyapplications, subsequently leading to accurate and patient specific dosimetry calculations forinternal radiation therapy procedures. The goal of this particular study was to determine thequantitative accuracy of SPECT reconstructions that can be achieved in a clinical environment

Accuracy of quantitative reconstructions in SPECT/CT imaging 4597
Table 1. Parameters and results of sample quantitative SPECT studies with physical phantoms.
Study Radiotracer Camera Results of absolute quantitation
He et al (2005) In-111 GE Discovery VH/Hawkeye 2–12% errors for 6 and 20 ml spheresde Wit et al (2006) Ho-166 ADAC Vertex MCD 1–13% errors for 220 ml cylindrical containersDu et al (2006) I-123 Siemens E.cam 2% errors for regions of brain phantomKoral et al (2007) I-131 Prism 3000 1–24% errors for 7–135 ml spheresVandervoort et al (2007) Tc-99m Siemens E.cam 4% errors for 18 ml heart chamber
for four different radioisotopes (Tc-99m, I-123, I-131 and In-111) commonly used in oncologywhen utilizing consistent acquisition and reconstruction protocols. In particular, 99mTc-MDPbone scan, 131/123I-MIBG and 111In-Octreoscan in oncological indications (i.e. detection ofbone metastases, neuroendocrine tumors) were considered. Some of these isotopes (I-123, I-131) emitting high-energy photons contribute to the so-called crosstalk effect when theseenergetic photons scatter and get recorded in the imaging energy window, and increasebackground due to collimator septal penetration. So, the algorithm previously developed forTc-99m (Vandervoort et al 2005, 2007) needed to be modified to meet these new requirements.
Several recent studies were devoted to the investigation of absolute quantitation of SPECTusing physical phantoms (e.g., He et al (2005), de Wit et al (2006), Du et al (2006), Koral et al(2007) and Vandervoort et al (2007)). These studies, however, were performed using a varietyof different cameras, different correction techniques and different methods for determinationof an absolute activity (table 1).
In contrast, all our phantom experiments were performed using one and the same integratedSPECT/CT system, the Infinia-Hawkeye-4 SPECT/CT camera, with identical acquisitionmatrices and camera rotations. One and the same reconstruction OSEM-APDI scheme(Vandervoort et al 2005) with attenuation (AC), scatter (SC) and resolution recovery (RR)corrections was applied. For both iodine isotopes (I-123 and I-131) emitting high-energy(>500 keV) photons, an identical approach was used to correct the data for crosstalk andcollimator septal penetration.
In our measurements of absolute activity, we did not assume that the shape of theinvestigated object is known, as in clinical situations the boundaries between tumors andhealthy tissues often are not well defined and cannot be easily estimated from the CT scans.Instead, we applied two different thresholds to reconstructed images: one to determine thetotal activity in the object (tumor) and the second to estimate the volume (number of voxels)occupied by the object, and compared the resulting values of the activity and volume with thetrue ones.
2. Methods
2.1. Experiments
Our experimental setup was designed to model clinical SPECT/CT studies for oncologicalindications. Accordingly, two identical cylindrical bottles (diameter 26 mm, height 60 mm,volume 32 ml each), containing investigated activity, played the role of tumors. Thesetwo radioactive sources were placed at different depths (one central source and one peripheralsource) in the thorax phantom (Data Spectrum Corp.), which in our experiments was filled withcold (non-radioactive) water. Experiments were set up with Tc-99m, I-123, I-131 and In-111isotopes to simulate different clinical studies such as 99mTc-MDP bone scan for detection
4598 S Shcherbinin et al
Table 2. Parameters of acquisition experiments.
Radiotracer Tc-99m I-123 I-131 In-111
Detector LEHR LEHR HEGP MEGPNumber of frames 90 90 90 90Number of camera stops 45 45 45 45Angular step (grad) 4 4 4 4Acquisition time per frame (s) 30 30 30 30Lower energy window (keV) 126.0–154.0 143.1–174.9 327.6–400.4 153.9–188.1
220.5–269.5Upper energy window (keV) – 180.0–220.0 405.0–495.0 –Matrix dimension 128 128 128 128Pixel size, mm 4.42 4.42 4.42 4.42Activity in bottle 1 (MBq) 10.24 3.64 13.89 13.98Activity in bottle 2 (MBq) 10.24 3.60 13.99 13.59Number of counts per projection detected in lower window 14 300 7500 14 300 28 700Number of counts per projection detected in upper window – 4600 5800 –
of bone metastases, and 123I-MIBG, 131I-MIBG and 111In-Octreoscan for evaluation ofneuroendocrine tumors. Our experimental configuration was intended to replicate oncologicalstudies which are characterized by high tumor uptake with very low or practically no activityin the background.
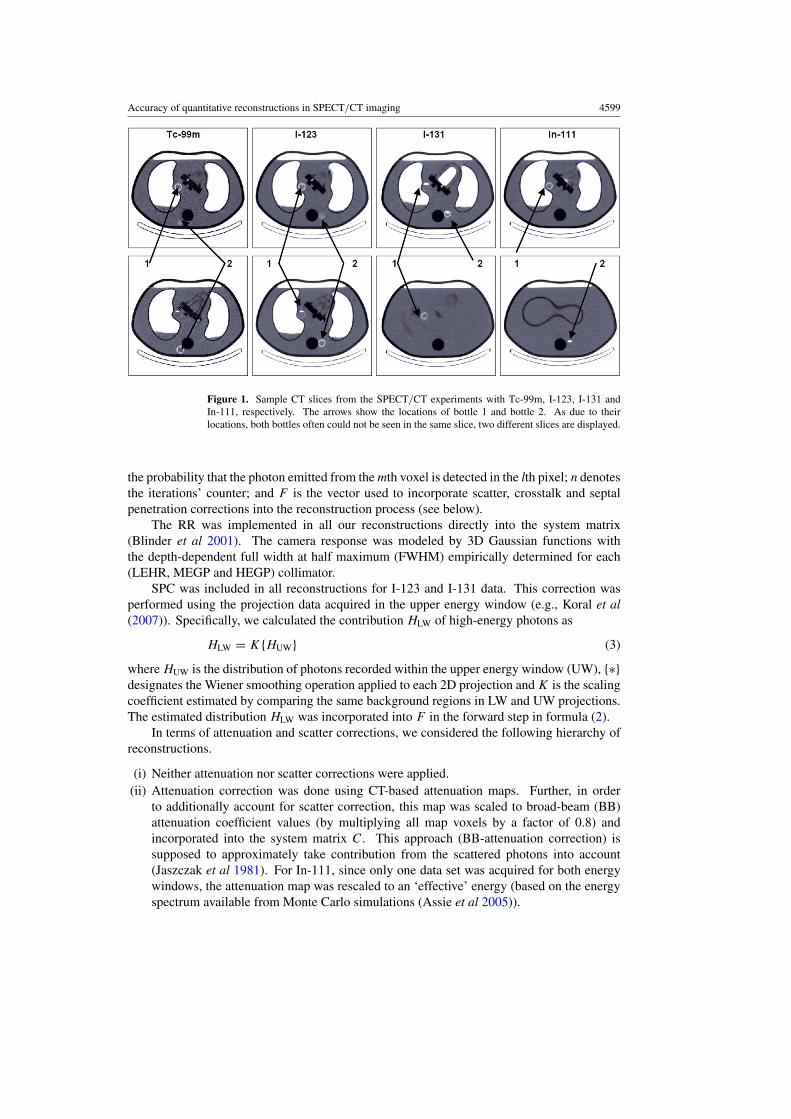
The experimental data were acquired on the Infinia-Hawkeye-4 (GE Healthcare), anintegrated SPECT/low-dose multislice CT system (2.5 mA; 140 kVp), using conventionalclinical protocols. For each isotope, the energy windows were set according to clinicalprotocols used for 99mTc-MDP bone scan, 131/123I-MIBG and 111In-Octreoscan. For I-123and I-131 data, a second energy window was established to measure intensity of high-energyphotons, to be used in crosstalk and collimator septal penetration correction (SPC). Detailedinformation about our experimental setup is presented in table 2. The locations of bottlesinside the phantom are shown in figure 1.
To translate the measured counts into the absolute values of reconstructed activities, weperformed calibration experiments. For each isotope, a planar 5 min scan was performedusing a point source (calibrated using the well counter) and placed in air at a distance of about20 cm from the detector surface. The acquisition matrices and energy windows were exactlythe same as for the corresponding phantom studies.
2.2. Reconstruction algorithms
From these experimental data, we reconstructed a series of 3D images using the ordered subsetsexpectation maximization method (OSEM) with 4-12 iterations and 5-10 subsets includingdifferent sets of corrections. The system of algebraic equations,
CX = Y, (1)
modeling the SPECT acquisition process, was solved using the following iterative formula:
X(n+1)j = X
(n)j∑
i∈� Cij
∑
i∈�
Cij
Yi∑k CikX
(n)k + Fi
(2)
where X corresponds to the unknown vector of activity distribution; Y is the vectorcorresponding to the measured projection data; Clm is the system matrix element representing
Accuracy of quantitative reconstructions in SPECT/CT imaging 4599
Figure 1. Sample CT slices from the SPECT/CT experiments with Tc-99m, I-123, I-131 andIn-111, respectively. The arrows show the locations of bottle 1 and bottle 2. As due to theirlocations, both bottles often could not be seen in the same slice, two different slices are displayed.
the probability that the photon emitted from the mth voxel is detected in the lth pixel; n denotesthe iterations’ counter; and F is the vector used to incorporate scatter, crosstalk and septalpenetration corrections into the reconstruction process (see below).
The RR was implemented in all our reconstructions directly into the system matrix(Blinder et al 2001). The camera response was modeled by 3D Gaussian functions withthe depth-dependent full width at half maximum (FWHM) empirically determined for each(LEHR, MEGP and HEGP) collimator.
SPC was included in all reconstructions for I-123 and I-131 data. This correction wasperformed using the projection data acquired in the upper energy window (e.g., Koral et al(2007)). Specifically, we calculated the contribution HLW of high-energy photons as
HLW = K{HUW} (3)
where HUW is the distribution of photons recorded within the upper energy window (UW), {∗}designates the Wiener smoothing operation applied to each 2D projection and K is the scalingcoefficient estimated by comparing the same background regions in LW and UW projections.The estimated distribution HLW was incorporated into F in the forward step in formula (2).
In terms of attenuation and scatter corrections, we considered the following hierarchy ofreconstructions.
(i) Neither attenuation nor scatter corrections were applied.(ii) Attenuation correction was done using CT-based attenuation maps. Further, in order
to additionally account for scatter correction, this map was scaled to broad-beam (BB)attenuation coefficient values (by multiplying all map voxels by a factor of 0.8) andincorporated into the system matrix C. This approach (BB-attenuation correction) issupposed to approximately take contribution from the scattered photons into account(Jaszczak et al 1981). For In-111, since only one data set was acquired for both energywindows, the attenuation map was rescaled to an ‘effective’ energy (based on the energyspectrum available from Monte Carlo simulations (Assie et al 2005)).

4600 S Shcherbinin et al
(iii) The CT-based attenuation map was normalized to narrow-beam (NB) attenuationcoefficients (therefore, attenuation correction did not account for scattered photons)and incorporated into the system matrix C. The distribution of scattered photons wasaccurately computed using the analytical APDI method (Wells et al 1998, Vandervoortet al 2005) from the initial activity reconstruction and the CT-based attenuation map, andincorporated into the F component in formula (2) (Vandervoort et al 2005). In summary,AC and RR were implemented directly into the system matrix C, and scatter and septalpenetration components were estimated separately using the above-described methodsand incorporated (as vector F) only into the forward step of OSEM. Accordingly, thecorrection vector F in formula (2) contains scatter components for Tc-99m and In-111,and both scatter and high-energy components for I-123 and I-131 cases.
In all reconstructions, 5-10 subsets and 4-12 OSEM iterations were used. In case (iii), weperformed four OSEM iterations with the BB map and no scatter correction. Then, we usedAPDI and the NB map to calculate the scatter component; additionally, we conducted furthereight iterations with scatter correction included in the vector F . When a CT-based attenuationmap is used, such a single update of the scatter component leads to more quantitatively accurateresults than achieved with multiple scatter updates.
2.3. Data analysis
In order to perform a quantitative analysis of our reconstructions, we applied two 3D thresholdsto each image. The thresholds were based on the average over eight voxels maximum in eachinvestigated region (corresponding to the bottle location). The total activity A in the containerwas measured by integrating all counts inside the volume of interest (VOI) determined by thethreshold set at 1% level. In this VOI-1%, basically all the counts originating from a givenobject are included. The measured total volume V of each object was estimated as a numberof voxels with counts equal to or larger than 20.0% of the averaged maximum. According toour preliminary tests, the VOI-20% allows us for relatively better determination of volumesthan can be done using other thresholds.
3. Results
In tables 3 and 4, the results for quantification of activities (�A, %) and volumes (�V, %) aredetailed for the 1% threshold (VOI-1%) and the 20% threshold (VOI-20%), respectively. Inboth tables, the relative differences between the true and measured activities (�A = (‘true’ A −‘measured’ A)/‘true’ A) and between true and estimated volumes of bottles (�V = (‘true’ V −‘measured’ V)/‘true’ V) are displayed. The ‘true’ V was determined as a number of voxelscorresponding to the volume (32 ml) of sources. We also visually confronted the calculatedareas of sources and corresponding fragments of CT scans. The first row in these two tablescorresponds to the reconstructions with RR and SPC (for I-123 and I-131 isotopes), butwithout either AC or SC. The second row presents the results of reconstructions with a CT-based attenuation map scaled to the BB values. The third row of each table summarizes theresults obtained using our most sophisticated procedure which employs RR, CSP, NB-basedAC and APDI-based SC.
The results presented in table 3 clearly indicate that the highest accuracy of activitydetermination was achieved for OSEM-APDI reconstructions which included corrections forall image-degrading factors. For all Tc-99m, In-111, I-131 and I-123 isotopes, the relativeerrors between the ‘true activities’ and the reconstructed ‘measured activities’ were about5% of the total activity values as determined by the VOI-1% (row 3, table 3). However, the

Accuracy of quantitative reconstructions in SPECT/CT imaging 4601
Table 3. Comparison of quantitative accuracy of different reconstruction schemes. The relativedifferences between the true and calculated activities (�A, %) and volumes (�V, %) as obtainedwith VOI-1% for the central (1) and the peripheral (2) sources are presented.
Tc-99m I-123 I-131 In-111
AC SC Vial 1 2 1 2 1 2 1 2
– – �A, % −84.3 −71.2 −81.8 −75.0 −73.7 −69.3 −80.7 −74.8�V, % 216 261 325 460 537 556 375 530
BB – �A, % −21.4 1.3 −17.9 0.3 −16.6 −6.7 −18.4 −1.3�V, % 287 328 302 386 469 512 401 494
NB APDI �A, % −2.9 3.6 −4.1 5.1 −4.0 3.3 −4.5 3.5�V, % 152 135 140 156 325 434 207 206
Table 4. Comparison of quantitative accuracy of different reconstruction schemes. The relativedifferences between the true and calculated activities (�A, %) and volumes (�V, %) as obtainedwith VOI-20% for the central (1) and the peripheral (2) sources are presented.
Tc-99m I-123 I-131 In-111
AC SC Vial 1 2 1 2 1 2 1 2
– – �A, % −89.8 −76.7 −87.4 −81.8 −84.0 −79.4 −86.4 −81.2�V, % −34 7 −18 0 −9 6 −4 21
BB – �A, % −41.1 −19.2 −39.8 −25.4 −46.7 −36.5 −42.0 −26.7�V, % −9 9 −9 1 −4 7 −1 18
NB APDI �A, % −18.6 −10.8 −19.9 −12.0 −31.4 −25.7 −24.1 −16.9�V, % −7 −1 −9 −7 −6 0 −5 −1
volumes of sources were overestimated by a factor of 2.5–5.5 when the same threshold wasused for volume determination. As expected, the total reconstructed activity was significantlyunderestimated in images reconstructed without attenuation correction, (row 1, table 3). Whenattenuation correction but no accurate scatter correction is applied (BB attenuation map), theerrors strongly depend on the location of the sources: one could almost accidentally achievelow or high accuracy levels. In our experiments these errors ranged from 0.3% to 21.4%(row 2, table 3).
For all considered cases, the threshold of 20% allowed us to estimate the volume of thesource with errors lower than 9% (row 3, table 4). Even after applying all the corrections, thisthreshold does not provide an accurate activity estimate and the total activity inside VOI-20%differed from the true values by 11–31%. The dependences of the accuracy of quantification(�A and �V) on the values of thresholds for Tc-99m, I-123, I-131 and In-111 are detailed infigure 2.
4. Discussion
For both SPECT and PET techniques, the accurate measurement of tracer distribution intonormal and abnormal structures is critical for diagnostic and treatment purposes (Thierens etal 2005).
In clinically realistic situations, when the volume of the source cannot be preciselydetermined, the definition of ‘quantitation’ might mean two different things: the accurateestimation of total activity and the volume of the source. In our phantom study, we used an

4602 S Shcherbinin et al
Figure 2. Dependence of �A (upper row) and �V (lower row) on the threshold (%) forOSEM-APDI reconstructions. The solid line corresponds to source 1 and the dashed line tosource 2.
integrated SPECT/CT system allowing a high-quality CT-based AC together with SC, RRand SPC. In addition, the CT unit of our hybrid camera was useful for anatomic localizationof Tc-99m, I-123, I-131 and In-111 sources located centrally and peripherally to simulatemediastinal and spinal metastases, respectively.
Our results demonstrate that these two characteristics, namely activity and volume, cannotbe reliably determined when using the same threshold. We found, however, that the imagesobtained from our OSEM-APDI reconstruction method, which includes corrections for mostof the physical processes, become relatively independent of the characteristics of the isotopeand the detection system. This feature allowed us to use a consistent set of thresholds todetermine the total activities and volumes for both investigated objects and for all isotopes.We achieved the errors about 5% for determination of the total activity at the 1% threshold,and <9% errors for determination of the volume at 20% threshold for all isotopes in centrallyand peripherally located sources.
However, these results are based on four experiments with only eight identical 32 ml activesources placed inside inactive background. The absence of spill-in effect from background andusage of sources of identical size and shape allowed us to use simple and identical quantificationtechniques for all active containers. Quantification of smaller (with size less than ∼3∗FWHM)sources may require different thresholds (King et al 1991). The presence of backgroundactivity and spill-in effect will require more sophisticated procedures, for example, adaptivethresholds including an uptake/background ratio. As was mentioned above, we compared the‘true’ and ‘measured’ volumes as total number of voxels without explicitly detecting edges ofsources which are assumed to be unknown. The determination of the ‘true’ volume as numberof voxels located inside known boundaries may change the calculated values of �V.
As seen in tables 3 and 4 (row 3), the reconstructed activities of the sources locatedperipherally (near the spine of the phantom) were 5–9% higher than those located in thecenter of the phantom. We explain these differences by the inaccuracies of the CT-basedattenuation maps which may be critical when the source is located near the boundary betweenmaterials with different attenuation coefficients such as water and lung (source 1) or waterand spine (source 2). To confirm that statement, we performed additional tests reconstructing
Accuracy of quantitative reconstructions in SPECT/CT imaging 4603
the digital data created by Monte Carlo simulations with Tc-99m activity. In these tests, ournumerical phantom exactly modeled the experimental one. When the same attenuation mapwas used for data creation and reconstruction, the differences between activities reconstructedin the objects at different locations were only 0.1%, but slight misalignment of the attenuationmap and the emission data by 1 voxel (4.4 mm) led to the difference of 5–7% betweenthese activities. Such misalignment may be related to errors in rescaling the CT imagematrix to that of the attenuation map or can occur when CT and NM cameras are not perfectlyregistered. Attenuation correction with quality control (ACQC) will be useful for correction ofmisalignment between CT (transmission) and NM (emission) data on integrated SPECT/CTsystems (Chen et al 2006, Fricke et al 2004). In addition, in our phantom experiment,potential errors in rescaling the attenuation coefficients for the teflon (spine) should be takeninto consideration. According to Watson et al (2006), such errors may occur when performingquantitative PET/CT analysis with phantoms containing several man-made materials.
5. Conclusions
Our OSEM-APDI reconstruction procedure for quantitative SPECT-CT imaging demonstratedan accurate determination of the absolute activity and volume for Tc-99m, I-123, I-131 andIn-111. CT-based attenuation correction and resolution recovery were directly incorporatedinto the system matrix, while scatter and septal penetration components were separatelycalculated and incorporated into the forward step of the reconstruction process. Fromfour phantom experiments with eight active sources of identical size and shape surroundedby inactive background, we recovered 95–105% of the true total activity by using a 1%threshold, and 91–100% of the true source volume by using a 20% threshold irrespective ofthe isotope/detector and source location. Further clinical simulations are needed to validateour encouraging results.
References
Assie K, Gardin I, Vera P and Buvat I 2005 Validation of the Monte Carlo simulator GATE for indium-111 imagingPhys. Med. Biol. 50 3113–25
Bai C, Zeng G L and Gullberg G T 2000 A slice-by-slice blurring model and kernel evaluation using the Klein–Nishinaformula for 3D scatter compensation in parallel and converging beam SPECT Phys. Med. Biol. 45 1275–307
Blinder S, Celler A, Wells R G, Thompson D and Harrop R 2001 Experimental verification of 3D detector responsecompensation using the OSEM reconstruction method IEEE Nucl. Sci. Symp. Rec. pp 2174–8
Bowsher J E and Floyd C E Jr 1991 Treatment of Compton scattering in maximum-likelihood, expectationmaximization reconstructions of SPECT images J. Nucl. Med. 32 1285–91
Buvat I 2007 Quantification in emission tomography: challenges, solutions, and performance Nucl. Instrum. MethodsPhys. Res. A 571 10–3
Buvat I, Soret M, Hapdey S, Riddell C, Benali H and Di Paola R 2000 Respective importance of scatter, collimatorresponse, and partial volume effect corrections for accurate quantification 123I dopamine receptor imaging IEEENucl. Sci Symp. Rec. pp 13/15–13/19
Cao Z-J, Frey E C and Tsui B M W 1994 A scatter model for parallel and converging beam SPECT based on theKlein–Nishina formula IEEE Trans. Nucl. Sci. 41 1594–600
Chen J, Caputlu-Wilson S F, Shi H, Galt J R, Faber T L and Garcia E V 2006 Automated quality control of emission-transmission misalignment for attenuation correction in myocardial perfusion imaging with SPECT-CT systemsJ. Nucl. Cardiol. 13 43–9
de Wit T C, Xiao J, Nijsen J F W, van het Schip F D, Staelens S G, van Rijk P P and Beekman F J 2006 Hybrid scattercorrection applied to quantitative holmium-166 SPECT Phys. Med. Biol. 51 4773–87
Du Y, Tsui B M W and Frey E C 2006 Model-based compensation for quantitative 123I brain SPECT Imaging Phys.Med. Biol. 51 1269–82

4604 S Shcherbinin et al
El Fakhri G, Buvat I, Benali H, Todd-Pokropek A and Di Paola R 2000 Relative impact of scatter, collimator response,attenuation, and finite spatial resolution corrections in cardiac SPECT J. Nucl. Med. 41 1400–8
Floyd C E, Jaszczak R J and Coleman R E 1989 InverseMonte Carlo: a unified reconstruction algorithm IEEE Trans.Nucl. Sci. 32 779–85
Flux G, Bardies M, Monsieurs M, Savolainen S, Strand S-E and Lassmann M 2006 The impact of PET and SPECTon dosimetry for targeted radionuclide therapy Z. Med. Phys. 16 47–59
Frey E C and Tsui B M W 1996 A new method for modelling the spatially-variant, object dependent scatter responsefunction in SPECT IEEE Nucl. Sci. Symp. Rec. pp 1305–7
Fricke H, Fricke E, Weise R, Kammeier A, Lindner O and Burchert W 2004 A method to remove artifacts inattenuation-corrected myocardial perfusion SPECT Introduced by misalignment between emission scan andCT-derived attenuation maps J. Nucl. Med. 45 1619–25
Gilland D R, Jaczszak R J, Turkington T G, Greer K L and Coleman R E 1994 Volume and activity quantitation withiodine-123 SPECT J. Nucl. Med. 35 1707–13
Hasegawa B H, Wong K H, Iwata K, Barber W C, Hwang A B, Sakdinawat A E, Ramaswamy M, Price D C andHawkins R A 2002 Dual-modality imaging of cancer with SPECT/CT Technol. Cancer Res. Treat. 1 417–508
Hasegawa B H and Zaidi H 2006 Dual-Modality imaging: more than the sum of its components Quantitative Analysisin Nuclear Medicine Imaging ed H Zaidi (Berlin: Springer) pp 35–81
He B, Du Y, Song X, Segars W P and Frey E C 2005 A Monte Carlo and physical phantom evaluation of quantitativeIn-111 SPECT Phys. Med. Biol. 50 4169–85
Humphries T, Celler A and Trummer M R 2007 Improved numerical integration for analytical photon distributioncalculation in SPECT IEEE Nucl. Sci. Symp. Rec. pp 3548–54
Jaszczak R, Coleman R and Whitehead F 1981 Physical factors affecting quantitative measurements using camera-based single photon emission computed tomography (SPECT) IEEE Trans. Nucl. Sci. NS-28 69–79
King M A, Glick S J, Pretorius P H, Wells R G, Gifford H C, Narayanan M V and Farncombe T 2004 Attenuation,scatter, and spatial resolution compensation in SPECT Emission Tomography. The Fundamentals of PET andSPECT ed M N Wernick and J N Aarsvold (New York: Academic) pp 473–98
King M A, Long D T and Brill A B 1991 SPECT volume quantitation: influence of spatial resolution, source sizeand shape, and voxel size Med. Phys. 18 1016–24
Koral K F, Yendiki A and Dewaraja Y K 2007 Recovery of total I-131 activity within focal volumes using SPECTand 3D OSEM Phys. Med. Biol. 52 777–90
Lazaro D, El Bitar Z, Breton V, Hill D and Buvat I 2005 Fully 3D Monte Carlo reconstruction in SPECT: a feasibilitystudy Phys. Med. Biol. 50 3739–54
Riauka T and Gortel Z 1994 Photon propagation and detection in single-photon computed emission tomography—ananalytical approach Med. Phys. 21 1311–21
Thierens H M, Monsieurs M A and Bacher K 2005 Patient dosimetry in radionuclide therapy: the whys and thewherefores Nucl. Med. Commun. 26 593–9
Tsui B M W, Frey E C, LaCroix K J, Lalush D S, McCartney W H, King M A and Gullberg G T 1998 Quantitativemyocardial perfusion SPECT J. Nucl. Cardiol. 5 507–22
Vandervoort E J, Celler A and Harrop R 2007 Implementation of an iterative scatter correction, the influence ofattenuation map quality and their effect on absolute quantitation in SPECT Phys. Med. Biol. 52 1527–45
Vandervoort E J, Celler A, Wells R G, Blinder S, Dixon K L and Pang Y 2005 Implementation of an analyticallybased scatter correction in SPECT reconstructions IEEE Trans. Nucl. Sci. 52 645–53
Veklerov E, Llacer J and Hoffman E 1988 MLE reconstruction of a brain phantom using a Monte Carlo transitionmatrix and a statistical stopping rule IEEE Trans. Nucl. Sci. 35 603–7
Watson C C, Rappoport V, Faul D, Townsend D W and Carney J P 2006 A method for calibrating the CT-basedattenuation correction of PET in human tissues IEEE Trans. Nucl. Sci. 53 102–7
Wells R G, Celler A and Harrop R 1998 Analytical calculation of photon distribution in SPECT projections IEEETrans. Nucl. Sci. 45 3202–14
Zaidi H and Koral K F 2006 Scatter correction strategies in emission tomography Quantitative Analysis in NuclearMedicine Imaging ed H Zaidi (Berlin: Springer) pp 205–35
Zeng G L, Bai C and Gullberg G T 1999 A projector/backprojector with slice-to-slice blurring for efficient three-dimensional scatter modeling IEEE Trans. Med. Imaging 18 722–32
Copyright © 2022 FDOKUMEN