Diagnostic Accuracy of Ultrasonographic Respiratory ... - MDPI
22
Citation: Kim, D.-W.; Chung, S.; Kang, W.-S.; Kim, J. Diagnostic Accuracy of Ultrasonographic Respiratory Variation in the Inferior Vena Cava, Subclavian Vein, Internal Jugular Vein, and Femoral Vein Diameter to Predict Fluid Responsiveness: A Systematic Review and Meta-Analysis. Diagnostics 2022, 12, 49. https://doi.org/10.3390/ diagnostics12010049 Academic Editor: Po-Hsiang Tsui Received: 30 November 2021 Accepted: 22 December 2021 Published: 27 December 2021 Publisher’s Note: MDPI stays neutral with regard to jurisdictional claims in published maps and institutional affil- iations. Copyright: © 2021 by the authors. Licensee MDPI, Basel, Switzerland. This article is an open access article distributed under the terms and conditions of the Creative Commons Attribution (CC BY) license (https:// creativecommons.org/licenses/by/ 4.0/). diagnostics Article Diagnostic Accuracy of Ultrasonographic Respiratory Variation in the Inferior Vena Cava, Subclavian Vein, Internal Jugular Vein, and Femoral Vein Diameter to Predict Fluid Responsiveness: A Systematic Review and Meta-Analysis Do-Wan Kim 1,† , Seungwoo Chung 2,† , Wu-Seong Kang 3, * and Joongsuck Kim 3 1 Department of Thoracic and Cardiovascular Surgery, Chonnam National University Hospital, Chonnam National University Medical School, Gwangju 61469, Korea; [email protected] 2 Department of Critical Care Medicine, Gyeongsang National University Changwon Hospital, Changwon 51472, Korea; [email protected] 3 Department of Trauma Surgery, Jeju Regional Trauma Center, Cheju Halla General Hospital, Jeju 63127, Korea; [email protected] * Correspondence: [email protected] † These authors contributed equally to this work. Abstract: This systematic review and meta-analysis aimed to investigate the ultrasonographic varia- tion of the diameter of the inferior vena cava (IVC), internal jugular vein (IJV), subclavian vein (SCV), and femoral vein (FV) to predict fluid responsiveness in critically ill patients. Relevant articles were obtained by searching PubMed, EMBASE, and Cochrane databases (articles up to 21 October 2021). The number of true positives, false positives, false negatives, and true negatives for the index test to predict fluid responsiveness was collected. We used a hierarchical summary receiver operating char- acteristics model and bivariate model for meta-analysis. Finally, 30 studies comprising 1719 patients were included in this review. The ultrasonographic variation of the IVC showed a pooled sensitivity and specificity of 0.75 and 0.83, respectively. The area under the receiver operating characteristics curve was 0.86. In the subgroup analysis, there was no difference between patients on mechanical ventilation and those breathing spontaneously. In terms of the IJV, SCV, and FV, meta-analysis was not conducted due to the limited number of studies. The ultrasonographic measurement of the variation in diameter of the IVC has a favorable diagnostic accuracy for predicting fluid responsiveness in critically ill patients. However, there was insufficient evidence in terms of the IJV, SCV, and FV. Keywords: fluid responsiveness; inferior vena cava; internal jugular vein; subclavian vein; femoral vein; ultrasonography 1. Introduction Achieving a satisfactory response to fluid replacement in critically ill patients has remained a challenging issue [1–4]. An insufficient fluid volume can lead to low cardiac output (CO), which may result in reduced tissue perfusion [1,2]. However, excessive fluid infusion might also be detrimental. As depicted by the Frank–Starling curve, an increase in preload does not correspond to an equal increase in stroke volume (SV) when it reaches the maximum slope and plateau [5]. Excessive fluid volume is a significant risk factor for acute lung injury, bowel edema, and compartment syndrome [6,7]. Therefore, it is crucial to determine whether the patient needs additional fluid or not. However, it is not easy to precisely predict fluid responsiveness before fluid administration because the etiology of shock associated with diverse aspects of fluid balance is difficult to ascertain. This is despite the fact that many clinical manifestations of shock such as low blood pressure, tachycardia, altered mental state, cool clammy skin, or low urine output have been described [8]. To evaluate fluid responsiveness, information about the increase in SV after fluid challenge Diagnostics 2022, 12, 49. https://doi.org/10.3390/diagnostics12010049 https://www.mdpi.com/journal/diagnostics
-
Upload
khangminh22 -
Category
Documents
-
view
1 -
download
0
Transcript of Diagnostic Accuracy of Ultrasonographic Respiratory ... - MDPI

�����������������
Citation: Kim, D.-W.; Chung, S.;
Kang, W.-S.; Kim, J. Diagnostic
Accuracy of Ultrasonographic
Respiratory Variation in the Inferior
Vena Cava, Subclavian Vein, Internal
Jugular Vein, and Femoral Vein
Diameter to Predict Fluid
Responsiveness: A Systematic
Review and Meta-Analysis.
Diagnostics 2022, 12, 49.
https://doi.org/10.3390/
diagnostics12010049
Academic Editor: Po-Hsiang Tsui
Received: 30 November 2021
Accepted: 22 December 2021
Published: 27 December 2021
Publisher’s Note: MDPI stays neutral
with regard to jurisdictional claims in
published maps and institutional affil-
iations.
Copyright: © 2021 by the authors.
Licensee MDPI, Basel, Switzerland.
This article is an open access article
distributed under the terms and
conditions of the Creative Commons
Attribution (CC BY) license (https://
creativecommons.org/licenses/by/
4.0/).
diagnostics
Article
Diagnostic Accuracy of Ultrasonographic Respiratory Variationin the Inferior Vena Cava, Subclavian Vein, Internal JugularVein, and Femoral Vein Diameter to Predict FluidResponsiveness: A Systematic Review and Meta-AnalysisDo-Wan Kim 1,† , Seungwoo Chung 2,† , Wu-Seong Kang 3,* and Joongsuck Kim 3
1 Department of Thoracic and Cardiovascular Surgery, Chonnam National University Hospital, ChonnamNational University Medical School, Gwangju 61469, Korea; [email protected]
2 Department of Critical Care Medicine, Gyeongsang National University Changwon Hospital, Changwon51472, Korea; [email protected]
3 Department of Trauma Surgery, Jeju Regional Trauma Center, Cheju Halla General Hospital, Jeju 63127, Korea;[email protected]
* Correspondence: [email protected]† These authors contributed equally to this work.
Abstract: This systematic review and meta-analysis aimed to investigate the ultrasonographic varia-tion of the diameter of the inferior vena cava (IVC), internal jugular vein (IJV), subclavian vein (SCV),and femoral vein (FV) to predict fluid responsiveness in critically ill patients. Relevant articles wereobtained by searching PubMed, EMBASE, and Cochrane databases (articles up to 21 October 2021).The number of true positives, false positives, false negatives, and true negatives for the index test topredict fluid responsiveness was collected. We used a hierarchical summary receiver operating char-acteristics model and bivariate model for meta-analysis. Finally, 30 studies comprising 1719 patientswere included in this review. The ultrasonographic variation of the IVC showed a pooled sensitivityand specificity of 0.75 and 0.83, respectively. The area under the receiver operating characteristicscurve was 0.86. In the subgroup analysis, there was no difference between patients on mechanicalventilation and those breathing spontaneously. In terms of the IJV, SCV, and FV, meta-analysis was notconducted due to the limited number of studies. The ultrasonographic measurement of the variationin diameter of the IVC has a favorable diagnostic accuracy for predicting fluid responsiveness incritically ill patients. However, there was insufficient evidence in terms of the IJV, SCV, and FV.
Keywords: fluid responsiveness; inferior vena cava; internal jugular vein; subclavian vein; femoralvein; ultrasonography
1. Introduction
Achieving a satisfactory response to fluid replacement in critically ill patients hasremained a challenging issue [1–4]. An insufficient fluid volume can lead to low cardiacoutput (CO), which may result in reduced tissue perfusion [1,2]. However, excessive fluidinfusion might also be detrimental. As depicted by the Frank–Starling curve, an increase inpreload does not correspond to an equal increase in stroke volume (SV) when it reachesthe maximum slope and plateau [5]. Excessive fluid volume is a significant risk factor foracute lung injury, bowel edema, and compartment syndrome [6,7]. Therefore, it is crucialto determine whether the patient needs additional fluid or not. However, it is not easy toprecisely predict fluid responsiveness before fluid administration because the etiology ofshock associated with diverse aspects of fluid balance is difficult to ascertain. This is despitethe fact that many clinical manifestations of shock such as low blood pressure, tachycardia,altered mental state, cool clammy skin, or low urine output have been described [8]. Toevaluate fluid responsiveness, information about the increase in SV after fluid challenge
Diagnostics 2022, 12, 49. https://doi.org/10.3390/diagnostics12010049 https://www.mdpi.com/journal/diagnostics
Diagnostics 2022, 12, 49 2 of 22
is useful. Invasive methods used in the past include the Swan–Ganz catheter, whichdirectly measures capillary wedge pressure, and has been the gold standard for CO or SVmeasurement [9]. However, it is a substantially invasive and difficult procedure, especiallyin patients with cardiovascular instability [4,9]. Therefore, to overcome the shortcomingsof the Swan–Ganz measurement method, a pulse wave analysis method that attempts tomeasure CO or SV has been proposed [10]. Other minimally invasive and non-invasivemethods such as arterial pulse wave analysis also have several limitations in terms ofartifact validation, arterial compliance, alteration in vasomotor tone, or non-pulsatileblood flow [10]. Moreover, the above-mentioned techniques are unable to predict fluidresponsiveness before the fluid challenge.
Recently, several researchers have applied a point-of-care ultrasound for critically illpatients [11]. Ultrasonography is non-invasive, and its cost is relatively low. It can measureSV effectively [11]. In addition, ultrasonography can detect the variation of IVC diameter(∆IVC), which reflects the cardiac preload [11,12]. By measuring the cardiac preload, it ispossible to predict volume status and fluid responsiveness. The measurement of the IVCdiameter is easily performed via a subxiphoid view even by non-highly trained operators,whereas measuring the SV via an echocardiogram requires an experienced intensivistor cardiologist. In addition, the internal jugular vein (IJV), subclavian vein (SCV), andfemoral vein (FV) are easier to visualize because they are more superficial than the IVC.The diameter of the IVC varies with inspiration and expiration [12]. In patients whobreathe spontaneously, intrathoracic pressure decreases during inspiration; this results inaccelerated venous return. During expiration, intrathoracic pressure increases, and venousreturn decreases [12]. Consequently, the IVC diameter decreases during inspiration andincreases during expiration. When mechanical ventilation is employed, this phenomenonreverses. However, the ∆IVC is not always visible in patients with obesity, intraabdominalfluid collection, or bowel gas. Thus, other large veins might be used as alternatives in suchpatients.
To date, several meta-analyses have demonstrated that ∆IVC showed favorable out-comes [12,13]. However, these evaluated data up to 2017, and many more studies have beenpublished since then. Moreover, there has been no systematic review and meta-analysisregarding other large veins such as the IJV, SCV, or FV. To update the evidence on ∆IVC andexplore its alternatives, we conducted a systematic review and meta-analysis for respiratoryvariation in the diameters of the IVC, IJV, SCV, and FV.
2. Materials and Methods2.1. Published Study Search and Selection Criteria
This study was performed according to the Preferred Reporting Items for System-atic Reviews and Meta-Analysis of Diagnostic Test Accuracy (PRISMA-DTA) statementpublished study search and selection criteria [14]. The preset protocol of this study wasregistered on PROSPERO (CRD42020206037, https://www.crd.york.ac.uk/prospero/, lastaccessed date: 21 October 2021). Relevant articles were obtained by searching PubMed, EM-BASE, and Cochrane databases through 21 October 2021. These databases were searchedusing the following keywords: “((subclavian vein) OR (inferior vena cava) OR (internaljugular vein) OR (femoral vein)) AND ((fluid responsiveness) OR volume) AND (diameterOR collapsibility OR measurement) AND (ultrasonography OR ultrasound OR sonographyOR sonographic OR (point of care))”. We also manually searched the reference lists ofrelevant articles. The titles and abstracts of all searched articles were screened for exclu-sion. Review articles and previous meta-analyses were also screened to obtain additionaleligible studies. The search results were then reviewed and articles were included if thestudy investigated the diagnostic accuracy of the IVC, SCV, IJV, and FV to predict fluidresponsiveness.
The inclusion criteria for diagnostic test accuracy (DTA) reviews were as follows:(1) the study population included patients who received fluid replacement due to sepsis,hypovolemia, or circulatory failure; (2) an ultrasonographic measurement of the respiratory

Diagnostics 2022, 12, 49 3 of 22
variability of the IVC, SCV, IJV, and FV diameter was performed as an index test; (3) teststhat enabled measurement of fluid responsiveness were performed for reference standard;(4) the primary outcome of the study was the diagnostic accuracy of ultrasonographic respi-ratory variability of the diameters of IVC, SCV, IJV, and FV to predict fluid responsiveness;(5) adequate information was provided to build a 2-by-2 contingency table consisting oftrue positive (TP), false positive (FP), false negative (FN), and true negative (TN) outcomes.Articles that involved another disease, those that did not provide 2-by-2 contingency tableinformation, non-original articles, non-human studies, pediatric studies, or those publishedin a language other than English were excluded.
2.2. Data Extraction
Data from all eligible studies were extracted by two investigators. Extracted data fromeach of the eligible studies included: the first author’s name, year of publication, studylocation, study design and period, number of patients analyzed, measured vein, indextest, threshold of index test, reference standard, device used for the reference standard,threshold of reference standard, and fluid responsiveness. The number of TP, FP, FN, andTN for the index test in predicting fluid responsiveness were collected. If the eligible studyreported multiple thresholds and accuracy of the index test, we extracted the subset withoptimal threshold or highest performance.
2.3. Quality Assessment
All studies were independently reviewed by two investigators. Disagreements con-cerning the study selection and data extraction were resolved by consensus. As recom-mended by the Cochrane Collaboration, the Quality Assessment of Diagnostic AccuracyStudies (QUADAS)-2 tool was used to evaluate the risk of bias in DTA [15]. Disagree-ments in this regard were resolved by discussion with the third independent author. TheQUADAS-2 assesses four domains for bias and applicability as follows: (1) patient selection;(2) index test; (3) reference standard; (4) flow and timing.
2.4. Statistical Analysis
For statistical analysis using meta-analysis, we used the “metandi” and “midas” mod-ules of Stata version 17.0 (Stata Corporation, College Station, TX, USA) and “mada” packageof the R programming language, version 4.0.3 (R foundation, Vienna, Austria). QUADAS-2assessment was performed using Review Manager Software 5.4 (The Cochrane Collabo-ration, Oxford, Copenhagen, Denmark). We constructed a 2-by-2 contingency table (TP,FP, FN, TN) by calculating or extracting from each primary study. For rigorous statisticalanalysis and heterogeneity across the studies, we used both the hierarchical summaryreceiver operating characteristics (HSROC) model [16] and the bivariate model [17]. Abivariate mixed-effects regression model for the synthesis of diagnostic test data and thederived logit estimates of sensitivity, specificity, and respective variances was used toconstruct a hierarchical summary ROC curve [17]. The HSROC model assumes that thereis an underlying ROC curve in each study with parameters that characterize the accuracyand asymmetry of the curve [16]. An area under the ROC curve (AUROC) close to 1 and0.5 indicated a strong test and poor test, respectively. Results with p-values < 0.05 wereconsidered statistically significant. To investigate the heterogeneity, I2 was calculated fromresults as I2 = 100% × (Q − df)/Q, where Q is Cochran’s heterogeneity statistics and dfis the degree of freedom [18]. I2 lies between 0% and 100%. A value of 0% indicates noobserved heterogeneity and values greater than 50% are considered to indicate substantialheterogeneity. To detect the threshold effect, Spearman’s correlation coefficient betweensensitivity and specificity was calculated after logit transformation. The HSROC shape(asymmetry) parameter was β (beta), where β = 0 corresponds to a symmetric ROC curve inwhich the diagnostic odds ratio does not vary along the curve [16]. Due to the trade-off be-tween sensitivity and specificity, we used bivariate random-effects modeling of sensitivityand specificity as we expected that this pair of performance measures will be interdepen-

Diagnostics 2022, 12, 49 4 of 22
dent. We used the bivariate box plot that describes the degree of interdependence includingthe central location and identification of any outliers [19]. The inner oval represents themedian distribution while the outer oval represents the 95% confidence bound. The skew-ness provides indirect evidence of some threshold variability [19]. A multiple univariablebivariate meta-regression was conducted to investigate the possible source of heterogeneity.Covariates were manipulated as mean-centered continuous or dichotomous (yes = 1. No =0) fixed effects. Publication bias was first assessed visually using a scatter plot. We used thediagnostic log odds ratio (lnDOR), which should have a symmetrical funnel shape whenpublication bias is absent [20]. Formal testing for publication bias was conducted by theregression of lnDOR against the square root of the effective sample size, with p < 0.05 forthe slope coefficient indicating significant asymmetry [20].
3. Results3.1. Selection and Characteristics
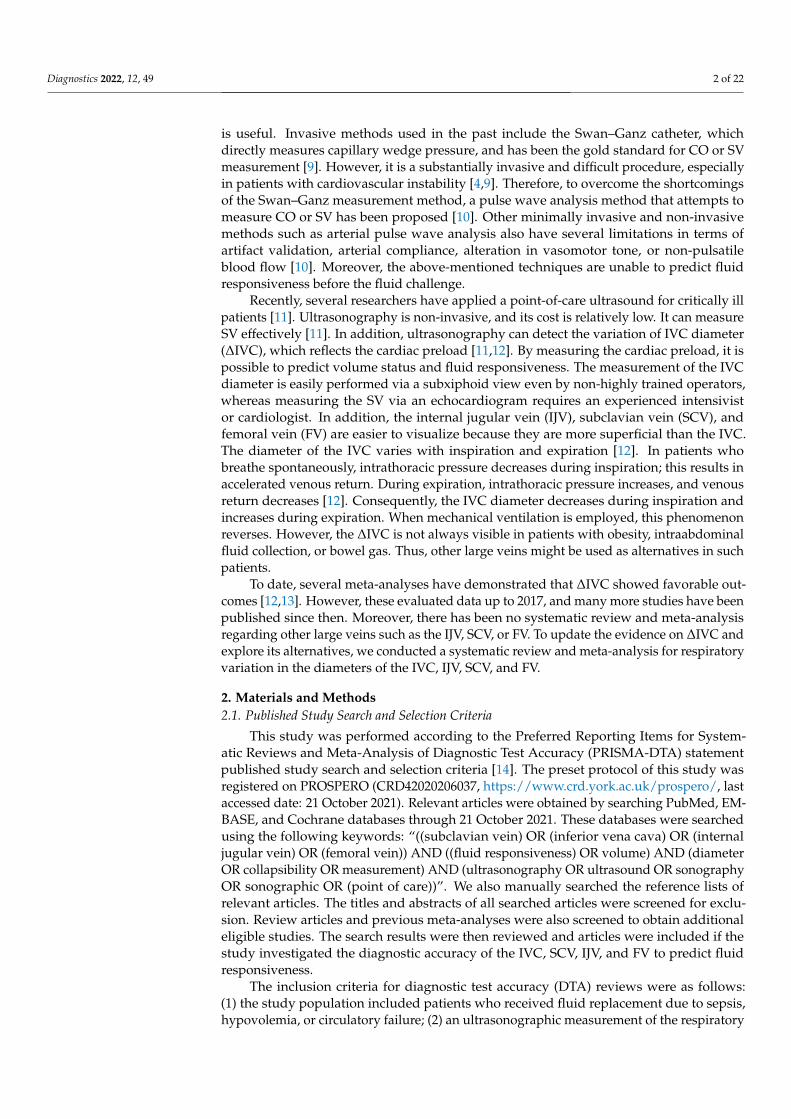
A total of 1587 studies were identified through searching databases. After removingduplicates, 1136 studies were retrieved. We excluded 1044 studies through a title andabstract review because they were non-original (n = 236), studied other diseases (n = 575),were non-human studies (n = 11), or were written in a non-English language (n = 71). Wereviewed 92 full-text articles. After the full-text review, 62 articles were excluded due toinsufficient data (n = 36), lack of 2-by-2 data (n = 25), and not being original (n = 1). Finally,30 studies [21–50] comprising 1719 patients were included in this review (Figure 1); detailedinformation about the eligible studies is shown in Table 1. In cases of the IJV [29,36,42], FV(was not detected), and SCV [41], we were not able to conduct the meta-analysis due to aninsufficient number of studies. Two studies [36,42] reported on both the IVC and IJV. Heet al. [45] reported on three subsets according to tidal volume (TV) (6 mL/kg, 9 mL/kg,12 mL/kg) and the subset of 9 mL/kg TV showed the highest AUROC. Thus, we extractedthe subset of 9 mL/kg TV. Three studies [39,40,48] reported on subsets of patients withstandardized breathing and spontaneous breathing. We extracted subsets of spontaneousbreathing because other studies included only patients with spontaneous breathing. Corlet al. [44] reported results obtained by both experts and novices. We extracted the results ofexperts because other studies were conducted by experts. One study by Blavius [50] was acomparative study between artificial intelligence and human. We extracted the result of thetraining dataset by humans because the number of test datasets was much smaller than thetest set (20 vs. 175). Caplan et al. [48] reported different results according to the measuringsite (1, 2, 3, and 5 cm apart from the aortocaval junction). We extracted a subset of 3 cmfrom the aortocaval junction because it was similar to other eligible studies.

Diagnostics 2022, 12, 49 5 of 22
Table 1. Main characteristics of the eligible studies.
Author Year TargetVein
IndexTest
Device(IndexTest)
Measure Site ReferenceStandard
Device(ReferenceStandard)
SettingThreshold(ReferenceStandard)
FluidChallenge MV MV
SettingStudy
Design Location StudyPeriod
Barbier[21] 2004 IVC IVC-d US,
M-mode
Just upstreamof the origin
of hepaticvein
CI ECHOICU, adult,MV, septic
shockCI = 15%
7ml/kg 4%modified fluid
gelatin over30 min
yes
Tidal = 8.5± 1.5
mL/kg,PEEP = 4± 2 cm
H2O
Obs FranceJanuary
2003–July2003
Feissel[22] 2004 IVC IVC-v US,
M-mode
Approximately3 cm from the
RACO ECHO
ICU, adult,MV, septic
shockCO = 15%
8 mL/kg of6%
hydroxyethylstarch over 20
min
yesTidal = 8
to 10mL/kg
Obs USA NR
Moretti[23] 2010 IVC IVC-d US,
M-mode
2 cmupstream ofthe origin ofhepatic vein
SVVtranspulmonary
thermodilu-tion
ICU, adult,MV, SAH CI = 15%
7 mL/kg of6%
hydroxyethylstarch over 30
min
yes
Tidal = 8mL/kg,
PEEP = 5cm H2O
Obs ItalyAugust
2008–July2009
Machare-Delgado
[24]2011 IVC IVC-d US,
M-mode
2 cmupstream ofthe origin ofhepatic vein
SVI ECHO
ICU,vasopressordependentwith MV
SVI = 10% 500 mL NSover 10 min yes
Tidal = 8mL/kg,PEEP =
6.8 ± 2.8cm H2O
Obs USA NR
Muller[25] 2012 IVC IVC-c US,
M-mode
2–3 cmupstream ofthe origin ofhepatic vein
VTI ECHO
ICU, adult,spontaneous
breathingwith ACF
subaorticVTI = 10%
500 mL of 6%hydroxyethylstarch over 15
min
no Obs France
April2009–April2011
Lanspa[26] 2013 IVC IVC-c US,
M-mode
0.5–3 cmupstream ofthe origin ofhepatic vein
CI ECHO
ICU, adult,septic shock,spontaneous
breathing
CI = 15%
10 mL/kg ofcrystalloid
over a periodof less than 20
min
no Obs USA
January2010–April2011
Charbonneau[27] 2014 IVC IVC-d US,
M-mode
Just upstreamof the origin
of hepaticvein
CI ECHOICU, adult,
septic shockwith MV
CO = 15%
7 mL/kg of6%
hydroxyethylstarch over 15
min
yesTidal = 8
to 10mL/kg
Obs France NR

Diagnostics 2022, 12, 49 6 of 22
Table 1. Cont.
Author Year TargetVein
IndexTest
Device(IndexTest)
Measure Site ReferenceStandard
Device(ReferenceStandard)
SettingThreshold(ReferenceStandard)
FluidChallenge MV MV
SettingStudy
Design Location StudyPeriod
de Valk[28] 2014 IVC IVC-c US,
M-mode
3 cmupstream ofthe origin ofhepatic vein
SBPNon-invasive
BPmeasurement
ED, adult,spontaneous
breathingwith sign of
shock
SBP =10mmHg
500 mL NSover 15 min no Obs Netherlands NR
Guarracino[29] 2014 IJV IJV-d US,
M-modeAt the cricoidcartilage level CI PRAM ICU, adult,
sepsis, MV CI = 15%7 mL/kg ofcrystalloid
over 30 minyes
Tidal = 6to 8
mL/kg,PEEP = 6cm H2O
Obs USA
October2012–
December2013
Airapetian[30] 2015 IVC IVC-c US,
M-mode
2 cmupstream ofthe origin ofhepatic vein
CO ECHO
ICU, adult,spontaneous
breathingdecided toperformvolume
expansion
CO = 10%PLR, 500 mLNS over 15
minno Obs France NR
deOliveira
[31]2016 IVC IVC-d US,
M-mode
Just upstreamof the origin
of hepaticvein
VTI ECHO
ICU, adult,MV,
immediateperioperativeperiod withinthe first 24 h
VTI = 15% 500 mL NSover 15 min yes Tidal = 8
mL/kg Obs Brazil
February2013–
September2014
Sobczk[32] 2016 IVC IVC-d US,
M-mode
Just upstreamof the origin
of hepaticvein
CO ECHO
ICU, adult,coronarybypass
grafting, MV
CO = 15% 250 mL NS yes
Tidal = 8mL/kg,PEEP =4.5 cmH2O
Obs Poland NR
Theerawit[33] 2016 IVC IVC-d US,
M-mode
2 cmupstream ofthe origin ofhepatic vein
CO Vigileo/FloTracmonitor
ICU, adult,septic shock CO = 15%
1000 mL ofcrystalloidover 1 h or500 mL ofcolloid (6%
hydroxyethylstarch or 5%
humanalbumin) over
30 min
yes
Tidal ≥ 8mL/kg,
PEEP = 8to 10 cm
H2O
Obs Thailand
November2012–
December2013

Diagnostics 2022, 12, 49 7 of 22
Table 1. Cont.
Author Year TargetVein
IndexTest
Device(IndexTest)
Measure Site ReferenceStandard
Device(ReferenceStandard)
SettingThreshold(ReferenceStandard)
FluidChallenge MV MV
SettingStudy
Design Location StudyPeriod
Zhang[34] 2016 IVC IVC-d US,
M-mode
2 cmupstream ofthe origin ofhepatic vein
SVI Vigileo/FloTracmonitor
OR, adult,Anesthesia forgastrointesti-nal surgery,ASA I or II
SVI = 15%
7 mL/kg of6%
hydroxyethylstarch over 30
min
yesTidal = 8
to 10mL/kg
Obs China NR
Corl [35] 2017 IVC IVC-c US,M-mode
Just upstreamof the origin
of hepaticvein
CI NICOM
ICU, adult,spontaneous
breathing,acute
circulatoryfailure
CI = 10%3 min PLR,500 mL NS
bolusno Obs
USA,two hos-
pitals
August2014–July
2016
Haliloglu[36] 2017 IVC IVC-c US,
B-mode
IVC—0.5 to3cm upstreamof the origin
of hepaticvein
CI USCOM
ICU, adult,sepsis,
spontaneousbreathing
CI = 15% PLR no Obs Turkey NR
IJV IJV-c US,B-mode
IJV—at thecricoid
cartilage levelCI USCOM
ICU, adult,sepsis,
spontaneousbreathing
CI = 15% PLR no Obs Turkey NR
Lu [37] 2017 IVC IVC-d US,M-mode
2 cmupstream ofthe origin ofhepatic vein
CI PiCCOICU, adult,
septic shock,MV
CI = 10% 200 mL NSover 10 min yes
Tidal = 8to 10
mL/kg,PEEP = 5to 12 cm
H2O
Obs China
January2012–
December2015
Piskin[38] 2017 IVC IVC-d US NR CI ECHO ICU, adult,
MV CI = 15% PLR yes Tidal = 8mL/kg Obs Turkey
April2016–
November2016
Preau [39] 2017 IVC IVC-c US,M-mode
1.5 to 2 cmupstream ofthe origin ofhepatic vein
SVI ECHO
ICU, adult,spontaneous
breathing,sepsis, acutecirculatory
failure
SVI = 10%500 mL of 4%gelatin over
30 minno Obs
France,two hos-
pitals
November2011–
January2014

Diagnostics 2022, 12, 49 8 of 22
Table 1. Cont.
Author Year TargetVein
IndexTest
Device(IndexTest)
Measure Site ReferenceStandard
Device(ReferenceStandard)
SettingThreshold(ReferenceStandard)
FluidChallenge MV MV
SettingStudy
Design Location StudyPeriod
Bortolotti[40] 2018 IVC IVC-c US
1.5 to 2 cmupstream ofthe origin ofhepatic vein
VTI ECHO
ICU, adult,spontaneous
breathing,infection,
acutecirculatory
failure,cardiac
arrythmia
VTI = 10%500 mL of 4%gelatin over
30 minno Obs
France,two hos-
pitals
May2012–May
2015
Giraud[41] 2018 SCV SCV-c US,
M-mode Clavicle CO PiCCO ICU, adult,MV CO = 15% 500 mL NS
over 10 min yes NR Obs Swiss 2009–2010
Ma [42] 2018 IVC IVC-v US,M-mode
2cm fromright atrium SV Vigileo/FloTrac
monitor
ICU, adultwho
underwentcardiacsurgery,
circulatoryinstability
SV = 15%PLR, 500 mLGelofusine
over 300 minyes
Tidal = 8mL/kg,
PEEP = 5cm H2O
Obs China
August2016–
December2016
IJV IJV-v US,M-mode
At the cricoidcartilage level SV Vigileo/FloTrac
monitor
ICU, adultwho
underwentcardiacsurgery,
circulatoryinstability
SV = 15%PLR, 500 mLGelofusine
over 300 minyes
Tidal = 8mL/kg,
PEEP = 5cm H2O
Obs China
August2016–Dec
ember2016
Wang [43] 2018 IVC IVC-v US,M-mode
2 cm fromright atrium CI PiCCO
ICU, adult,MV, postpneu-
monectomy,requiring
fluidresuscitation
CI = 15%
7 mL/kg of6%
hydroxyethylstarch over 30
min
yes
Tidal = 8to 12
mL/kg,PEEP = 5to 10 cm
H2O
Obs China
August2014–
December2016
Corl [44] 2019 IVC IVC-c US,B-mode
3 cm fromright atrium CI NICOM
ICU, adult,acute
circulatoryfailure,
spontaneousbreathing
CI = 10% 500 mL NSbolus no Obs USA
November2016–July
2018

Diagnostics 2022, 12, 49 9 of 22
Table 1. Cont.
Author Year TargetVein
IndexTest
Device(IndexTest)
Measure Site ReferenceStandard
Device(ReferenceStandard)
SettingThreshold(ReferenceStandard)
FluidChallenge MV MV
SettingStudy
Design Location StudyPeriod
He [45] 2019 IVC IVC-d US,M-mode
2 to 3 cm fromright atrium VTI ECHO
OR, adult,general
anesthesia,electivesurgery
mechanicalventilation
VTI = 15%6 mL/kg of4% gelatin
over 10 minyes
Tidal = 6,9, 12
mL/kgObs China
June 2018–September
2018
Yao [46] 2019 IVC IVC-d US,B-mode
2 to 3 cm fromright atrium CO CNAP ICU, adult,
MV CO = 10% PLR yes
Tidal = 7.6mL/kg(respon-der), 7.8mL/kg(non-
responder);PEEP = 5cm H2O
Obs China
December2017–March2018
Zhang[47] 2019 IVC IVC-d US,
M-mode
Just upstreamof the origin
of thesupraheptic
vein
VTI ECHO
ICU, adult,MV, need of
an assessmentof fluid re-
sponsiveness
VTI = 10% PLR yes NR Obs ChinaJuly 2018–January
2019
Caplan[48] 2020 IVC IVC-c US,
B-mode
1, 3, 4, 5 cmfrom
aortocavaljunction
SVI ECHO
ICU, adult,sepsis, acutecirculatoryfailure, two
cohort(normal sinusrhythm andarrythmia),
spontaneousbreathing
SVI = 10%500 mL of 4%gelatin over
30 minno Obs France
November2011–May
2015
McGregor[49] 2020 IVC IVC-c US,
B-mode2 to 3 cm fromright atrium VTI ECHO
ED, adult, IVfluid required,spontaneous
breathing
VTI = 10%250–500 mLNS over 15min or less
no Obs UK NR

Diagnostics 2022, 12, 49 10 of 22
Table 1. Cont.
Author Year TargetVein
IndexTest
Device(IndexTest)
Measure Site ReferenceStandard
Device(ReferenceStandard)
SettingThreshold(ReferenceStandard)
FluidChallenge MV MV
SettingStudy
Design Location StudyPeriod
Blavius[50] 2021 IVC IVC-c US NR CI
Non-invasivecardiac output
monitoring
ICU, adult,critically ill
patients,spontaneous
breathing
CI = 10% 500 mL NSbolus no Obs USA NR
IVC, inferior vena cava; IJV, internal jugular vein; SCV, subclavian vein; IVC-d, IVC distensibility; IVC-c, IVC collapsibility; IVC-v, IVC variability; IJV-d, IJV distensibility, IJV-c,collapsibility; IJV-v, IJV variability; SCV-c, SCV collapsibility; ECHO, echocardiography; PRAM, pressure recording analytical method; NICOM, non-invasive cardiac output monitoring;PiCCO, pulse index continuous cardiac output; USCOM, ultrasonic cardiac output monitor; CNAP, continuously monitored by continuous non-invasive arterial pressure; PLR, passiveleg raising; US, ultrasound; SVV, stroke volume variation; SVI, stroke volume index; SBP, systolic blood pressure; VTI, velocity time integral; CO, cardiac output; CI, cardiac index;ICU, intensive care unit; ED, emergency department; OR, operating room; MV, mechanical ventilation; PEEP, positive end expiratory pressure; SAH, subarachnoid hemorrhage; Obs,observational study; NR, not reported.

Diagnostics 2022, 12, 49 11 of 22
Diagnostics 2022, 12, x FOR PEER REVIEW 5 of 23
Figure 1. Flow diagram for identification of eligible studies. Figure 1. Flow diagram for identification of eligible studies.
3.2. Clinical Characteristics of Patients
All 30 eligible studies were summarized in Table 1. Twenty-eight studies [21–28,30–40,42–50] comprised the measurement of the IVC. Only three studies [29,36,42] comprisedthat of the IJV and one study [41] comprised that of the SCV. In our searches, there wasno relevant study that comprised measurements of the FV. Twenty-three studies used theM-mode of ultrasonography [21–35,37,39,41–43,45,47,50]. Seventeen studies used echocar-diography as a reference standard [21,22,24–27,30–32,38–40,45,47–49]. Four studies used in-vasive devices that extracted the waveform in arteries [29,33,34,42]. Ten studies comprisedpatients with sepsis [21,22,26,27,29,33,36,37,39,48] and 18 comprised those on mechanicalventilation [21–24,27,29,31–34,37,38,41–43,45–47]. In the eligible studies, the ∆IVC was mea-sured in three ways: first, the IVC collapsibility [25,26,28,30,35,36,39,40,44,48–50] denotes(maximal IVC diameter—minimal IVC diameter) / IVC diameter (maximum); second,the IVC distensibility [21,23,24,27,31–34,37,38,45–47] denotes (maximal IVC diameter—minimal IVC diameter)/minimal IVC diameter; third, the IVC variability [22,42,43] denotes(maximal IVC diameter—minimal IVC diameter)/(minimal IVC diameter + maximal IVCdiameter)/2). ∆IVC was measured near the origin of the hepatic vein via the subxiphoidview in all eligible studies. The IJV diameter was measured at the level of the cricoidcartilage. The SCV diameter was measured at the level of the clavicle.
3.3. DTA Review
The diagnostic test accuracy of eligible studies was summarized in Table 2. Thethreshold of index test (∆IVC) ranged from 11.1 to 49%. The pooled sensitivity of ∆IVC in 28eligible studies [21–28,30–40,42–50] was 0.75 (95% CI, 0.68–0.80, I2 = 73.8%) and the pooledspecificity was 0.83 (95% CI, 0.79–0.86, I2 = 41.6%; Figure 2). The pooled positive likelihood

Diagnostics 2022, 12, 49 12 of 22
ratio was 4.37 (95% CI, 3.58–5.33, I2 = 10.7%) and the pooled negative likelihood ratio was0.30 (95% CI, 0.24–0.39, I2 = 75.8%). The pooled diagnostic odds ratio was 14.3 (95% CI,10.1–20.4, I2 = 100%). The summary ROC curve (SROC) with prediction and confidencecontours is depicted in Figure 3. The AUROC was 0.86 (95% CI, 0.83–0.89, I2 = 93%).To evaluate the degree of interdependence, we used a bivariate boxplot that plotted thecorrelation of logit-transformed sensitivity and specificity (Figure 4). Seven studies wereoutliers, in that these were outside the 95% confidence interval area [21–24,26,27,30]. Inthe test for threshold effect, Spearman’s rank correlation rho was −0.20 (p = 0.30). HSROCasymmetry parameter, β, was −0.676 (p = 0.237). Therefore, we concluded that there wasno threshold effect.
Table 2. Diagnostic test accuracy of eligible studies.
Author Year Target Vein TP FP FN TN Sen Spe AUROC n Threshold(Index Test)
Barbier [21] 2004 IVC 9 1 1 9 0.90 0.90 0.910 20 ∆IVC = 18%Feissel [22] 2004 IVC 14 1 2 22 0.88 0.96 NR 39 ∆IVC = 12%Moretti [23] 2010 IVC 12 0 5 12 0.71 1.00 0.902 29 ∆IVC = 16%
Machare-Delgado [24] 2011 IVC 8 8 0 9 1.00 0.53 0.816 25 ∆IVC = 12%Muller [25] 2012 IVC 14 4 6 16 0.70 0.80 0.770 40 ∆IVC = 40%Lanspa [26] 2013 IVC 5 3 0 6 1.00 0.67 0.840 14 ∆IVC = 15%
Charbonneau [27] 2014 IVC 10 7 16 11 0.38 0.61 0.430 44 ∆IVC = 21%de Valk [28] 2014 IVC 10 11 2 22 0.83 0.67 0.741 45 ∆IVC = 36.5%
Guarracino [29] 2014 IJV 24 1 6 19 0.80 0.95 0.915 50 ∆IJV = 18%Airapetian [30] 2015 IVC 9 1 20 29 0.31 0.97 0.620 59 ∆IVC = 49%de Oliveira [31] 2016 IVC 6 0 3 11 0.67 1.00 0.840 20 ∆IVC = 16%
Sobczk [32] 2016 IVC 20 3 4 8 0.83 0.73 0.739 35 ∆IVC = 18%Theerawit [33] 2016 IVC 12 3 4 10 0.75 0.77 0.688 29 ∆IVC = 10.7%
Zhang [34] 2016 IVC 18 1 8 13 0.69 0.93 0.850 40 ∆IVC = 46%Corl [35] 2017 IVC 53 12 8 51 0.87 0.81 0.840 124 ∆IVC = 25%
Haliloglu [36] 2017 IVC 18 3 5 18 0.78 0.86 0.825 44 ∆IVC = 35%IJV 18 3 5 18 0.78 0.86 0.825 44 ∆IJV = 36%
Lu [37] 2017 IVC 18 5 9 17 0.67 0.77 0.805 49 ∆IVC = 20%Piskin [38] 2017 IVC 32 4 8 28 0.80 0.88 0.928 72 ∆IVC = 23.08%Preau [39] 2017 IVC 38 5 12 35 0.76 0.88 0.820 90 ∆IVC = 31%
Bortolotti [40] 2018 IVC 19 4 10 22 0.66 0.85 0.820 55 ∆IVC = 37%Giraud [41] 2018 SCV 9 1 0 10 1.00 0.91 0.970 20 ∆SVC = 13.4%
Ma [42] 2018 IVC 30 5 5 30 0.86 0.86 0.830 70 ∆IVC = 13.39%IJV 32 6 3 29 0.91 0.83 0.880 70 ∆IJV = 12.99%
Wang [43] 2018 IVC 8 1 2 7 0.80 0.88 0.860 18 ∆IVC = 15%Corl [44] 2019 IVC–expert 38 9 6 32 0.86 0.78 0.820 85 ∆IVC = 25%
IVC-novice 35 13 9 28 0.70 0.68 0.690 85 ∆IVC = 25%He [45] 2019 IVC-tidal 6mL/kg 26 10 12 31 0.68 0.76 0.710 79 ∆IVC = 11.1%
IVC-tidal 9mL/kg 21 5 17 36 0.55 0.88 0.790 79 ∆IVC = 15.3%IVC-tidal12mL/kg 20 5 18 36 0.53 0.88 0.730 79 ∆IVC = 13.4%
Yao [46] 2019 IVC 17 3 20 27 0.46 0.90 0.702 67 ∆IVC = 25.6%Zhang [47] 2019 IVC 47 6 10 38 0.82 0.86 0.815 101 ∆IVC = 14.5%Caplan [48] 2020 IVC 31 9 10 31 0.76 0.77 0.820 81 ∆IVC = 20%
McGregor [49] 2020 IVC 9 4 10 7 0.47 0.64 0.464 30 ∆IVC = 40%Blavius [50] 2021 IVC—training set 71 19 13 72 0.85 0.79 0.820 175 ∆IVC = 25%
IVC—test set 8 0 1 11 0.89 1.00 0.940 20 ∆IVC = 25%
IVC, inferior vena cava; IJV, internal jugular vein; SCV, subclavian vein; TP, true positive; FP, false positive;FN, false negative; TN, true negative; Sen, sensitivity; Spe, specificity; AUROC, area under receiver operatorcharacteristic curve; ∆IVC, respiratory variation of inferior vena cava diameter; ∆IJV, respiratory variation ofinternal jugular vein diameter; ∆SCV, respiratory variation of subclavian vein diameter.

Diagnostics 2022, 12, 49 13 of 22Diagnostics 2022, 12, x FOR PEER REVIEW 13 of 23
Figure 2. Forest plot for pooled sensitivity and specificity of respiratory variability of IVC diame-ter.
Figure 2. Forest plot for pooled sensitivity and specificity of respiratory variability of IVC diameter.
Diagnostics 2022, 12, x FOR PEER REVIEW 14 of 23
Figure 3. Summary ROC curve of respiratory variability of IVC diameter.
Figure 4. Bivariate boxplot of respiratory variability of IVC diameter.
3.4. Meta-Regression, Subgroup Analysis, and Evaluation of Heterogeneity The univariable meta-regression and subgroup analysis using possible confounders
are summarized in Table 3. We conducted the subgroup analysis according to possible confounders as follows: ΔIVC, IVC collapsibility index, reference test, ICU admission, sep-sis, fluid infusion, mechanical ventilation, and the heterogeneity on a bivariate boxplot. In
Figure 3. Summary ROC curve of respiratory variability of IVC diameter.

Diagnostics 2022, 12, 49 14 of 22
Diagnostics 2022, 12, x FOR PEER REVIEW 14 of 23
Figure 3. Summary ROC curve of respiratory variability of IVC diameter.
Figure 4. Bivariate boxplot of respiratory variability of IVC diameter.
3.4. Meta-Regression, Subgroup Analysis, and Evaluation of Heterogeneity The univariable meta-regression and subgroup analysis using possible confounders
are summarized in Table 3. We conducted the subgroup analysis according to possible confounders as follows: ΔIVC, IVC collapsibility index, reference test, ICU admission, sep-sis, fluid infusion, mechanical ventilation, and the heterogeneity on a bivariate boxplot. In
Figure 4. Bivariate boxplot of respiratory variability of IVC diameter.
3.4. Meta-Regression, Subgroup Analysis, and Evaluation of Heterogeneity
The univariable meta-regression and subgroup analysis using possible confoundersare summarized in Table 3. We conducted the subgroup analysis according to possibleconfounders as follows: ∆IVC, IVC collapsibility index, reference test, ICU admission,sepsis, fluid infusion, mechanical ventilation, and the heterogeneity on a bivariate boxplot.In the meta-regression test, there was no significance of any of the moderators. There wasno statistical significance in meta-regression. As in the previous meta-analysis conducted bySi et al. [13], we divided two groups who underwent MV. One group underwent MV withTV ≥ 8 mL/kg or positive end expiratory pressure (PEEP) ≤ 5 cm H2O [21–23,27,31,32,34,38,42,45]. The other group underwent MV with TV < 8 mL/kg or PEEP > 5 cm H2O [24,33,37,43,46]. There was no statistical significance in the meta-regression test (p = 0.31). We alsoconducted a subgroup analysis according to inliers (within 95% CI) [25,28,31–40,42–50]and outliers [21–24,26,27,30] on a bivariate boxplot, and the meta-regression showed nosignificant difference (p = 0.83).
Table 3. Meta-regression and subgroup analysis of respiratory variability of IVC diameter.
Subgroup by ModeratorPooled
Sen (95%CI)
PooledSpe (95%
CI)
PooledPLR (95%
CI)
PooledNLR (95%
CI)
PooledDOR (95%
CI)
AUROC(95% CI)
Meta-Regression
Test(p Value)
∆IVC ≥ 20% 0.07yes (k = 16)
[25,27,28,30,34–40,44,46,48–50]0.70
(0.61–0.78)0.81
(0.78–0.85)3.86
(3.12–4.76)0.36
(0.27–0.48) 10 (7–16) 0.84(0.80–0.87)
no (k = 12) [21–24,26,31–33,42,43,45,47] 0.81(0.72–0.88)
0.85(0.77–0.91)
5.42(3.61–8.14)
0.22(0.15–0.33) 25 (14–42) 0.90
(0.87–0.92)Using IVC collapsibility index 0.58
yes (k = 12)[25,26,28,30,35,36,39,40,44,48–50]
0.76(0.65–0.84)
0.81(0.76–0.86)
4.10(3.30–5.10)
0.30(0.20–0.43) 14 (9–22) 0.85
(0.82–0.88)no (k = 16)
[21–24,27,31–34,37,38,42,43,45–47]0.74
(0.65–0.81)0.85
(0.79–0.90)5.06
(3.36–7.55)0.31
(0.22–0.42) 17 (9–31) 0.87(0.84–0.90)
Using echocardiography as a referencetest 0.68
yes (k= 17)[21,22,24–27,30–32,36,38–40,45,47–49]
0.73(0.63–0.81)
0.83(0.77–0.88)
4.39(3.13–6.14)
0.33(0.24–0.46) 13 (8–24) 0.86
(0.83–0.89)
no (k = 11) [23,28,33–35,37,42–44,46,50] 0.78(0.69–0.85)
0.82(0.77–0.87)
4.40(3.40–5.80)
0.27(0.19–0.37) 16 (10–26) 0.87
(0.84–0.90)

Diagnostics 2022, 12, 49 15 of 22
Table 3. Cont.
Subgroup by ModeratorPooled
Sen (95%CI)
PooledSpe (95%
CI)
PooledPLR (95%
CI)
PooledNLR (95%
CI)
PooledDOR (95%
CI)
AUROC(95% CI)
Meta-Regression
Test(p Value)
ICU patient 0.22yes (k = 24)
[21–27,29–33,35–44,46–48,50]0.76
(0.69–0.82)0.83
(0.80–0.86)4.60
(3.80–5.50)0.28
(0.22–0.37) 16 (11–23) 0.87(0.83–0.89)
no (ED, OR) (k = 4) [28,34,45,49] 0.62(0.50–0.73)
0.80(0.66–0.89)
3.00(1.70–5.30)
0.48(0.35–0.66) 6 (3–14) 0.70
(0.66–0.74)Sepsis patients 0.81
yes (k = 9) [21,22,26,27,33,36,37,39,48] 0.75(0.63–0.83)
0.82(0.73–0.88)
4.13(2.52–6.76)
0.31(0.20–0.49) 13 (5–33) 0.87
(0.83–0.92)no (k = 19)
[23–25,28–32,34,35,38,40–47,49,50]0.75
(0.66–0.82)0.84
(0.79–0.88)4.77
(3.77–6.03)0.30
(0.22–0.40) 16 (11–23) 0.88(0.84–0.90)
Fluid challenge 0.34
PLR only (k = 4) [36,38,46,47] 0.73(0.57–0.85)
0.88(0.80–0.92)
5.90(3.60–9.50)
0.30(0.18–0.52) 19 (8–44) 0.89
(0.86–0.91)Fluid infusion (k = 24)[21–35,37,39–45,48–50]
0.75(0.68–0.81)
0.82(0.77–0.86)
4.15(3.31–5.22)
0.31(0.23–0.40) 14 (9–20) 0.86
(0.83–0.89)Mechanical Ventilation 0.58
yes (k16)[21–24,27,31–34,37,38,42,43,45–47]
0.74(0.65–0.81)
0.85(0.79–0.90)
5.06(3.39–7.54)
0.31(0.22–0.42) 17 (9–31) 0.87 (0.848–
0.90)no (k = 12)
[25,26,28,30,35,36,39,40,44,48–50]0.76
(0.65–0.84)0.81
(0.76–0.86)4.10
(3.30–5.10)0.30
(0.20–0.43) 14 (9–22) 0.85(0.82–0.88)
Mechanical Ventilation Setting (k = 15)[21–24,27,31–34,37,38,42,43,45,46] 0.31
Tidal < 8mL/kg or PEEP > 5 mmHg(k = 5) [24,33,37,43,46]
0.73(0.52–0.87)
0.77(0.62–0.88)
3.24(1.97–5.3)
0.35(0.19–0.64) 9 (4–21) 0.82
(0.35–0.97)Tidal ≥ 8mL/kg or PEEP ≤ 5 mmHg(k = 10) [21–23,27,31,32,34,38,42,45]
0.74(0.63–0.83
0.88(0.81–0.93)
6.19 (3.55–10.80)
0.29(0.19–0.45) 21 (9–52) 0.90
(0.17–1.00)Bivariate boxplot 0.83
inlier (k = 21) [21–24,26,27,30] 0.75(0.70–0.80)
0.83(0.79–0.86)
4.32(3.60–5.20)
0.30(0.24–0.37) 14 (10–20) 0.86
(0.42–0.98)
outlier (k = 7) [25,28,29,31–50] 0.80(0.48–0.95)
0.87(0.66–0.96)
6.02 (2.20–16.42)
0.23(0.07–0.73) 27 (5–142) 0.91
(0.17–1.00)
∆IVC, respiratory variation of inferior vena cava; IVC, inferior vena cava; ICU, intensive care unit; ED, emergencydepartment; OR, operating room; PLR, passive leg raising test; PEEP, positive end-expiratory pressure; CI,confidence interval; Sen, sensitivity; Spe, specificity; PLR, positive likelihood ratio; NLR, negative likelihood ratio;DOR, diagnostic odds ratio; AUROC, area under receiver operating characteristic curve.
3.5. Publication Bias
In Deek’s funnel plot using the diagnostic odds ratio, there was no asymmetry onvisual inspection (Figure 5). There was also no statistically significant asymmetry (p = 0.66).
Diagnostics 2022, 12, x FOR PEER REVIEW 16 of 23
Tidal ≥ 8mL/kg or PEEP ≤ 5 mmHg (k = 10) [21–23,27,31,32,34,38,42,45]
0.74 (0.63–0.83
0.88 (0.81–0.93)
6.19 (3.55–10.80)
0.29 (0.19–0.45)
21 (9–52) 0.90 (0.17–
1.00) Bivariate boxplot 0.83
inlier (k = 21) [21–24,26,27,30]0.75 (0.70–
0.80) 0.83 (0.79–
0.86) 4.32 (3.60–
5.20) 0.30 (0.24–
0.37) 14 (10–20)
0.86 (0.42–0.98)
outlier (k = 7) [25,28,29,31–50] 0.80 (0.48–
0.95) 0.87 (0.66–
0.96) 6.02 (2.20–
16.42) 0.23 (0.07–
0.73) 27 (5–142)
0.91 (0.17–1.00)
ΔIVC, respiratory variation of inferior vena cava; IVC, inferior vena cava; ICU, intensive care unit; ED, emergency department; OR, operating room; PLR, passive leg raising test; PEEP, positive end-expiratory pressure; CI, confidence interval; Sen, sensitivity; Spe, specificity; PLR, positive likeli-hood ratio; NLR, negative likelihood ratio; DOR, diagnostic odds ratio; AUROC, area under re-ceiver operating characteristic curve.
3.5. Publication Bias In Deek’s funnel plot using the diagnostic odds ratio, there was no asymmetry on
visual inspection (Figure 5). There was also no statistically significant asymmetry (p = 0.66).
Figure 5. Asymmetry test for publications bias.
3.6. Quality Assessment The details of the quality assessment are depicted in Figure 6. In terms of patient
selection, the risk of bias was unclear in nine studies (30.0%) [21,22,33,35,40,41,45,48,50]. Consequently, these studies showed no consecutive patient selection or no description ofit. In other domains of QUDAS-2 assessment, all studies showed a low risk of bias.
Figure 5. Asymmetry test for publications bias.

Diagnostics 2022, 12, 49 16 of 22
3.6. Quality Assessment
The details of the quality assessment are depicted in Figure 6. In terms of patientselection, the risk of bias was unclear in nine studies (30.0%) [21,22,33,35,40,41,45,48,50].Consequently, these studies showed no consecutive patient selection or no description of it.In other domains of QUDAS-2 assessment, all studies showed a low risk of bias.
Diagnostics 2022, 12, x FOR PEER REVIEW 17 of 23
(a)
(b)
Figure 6. Risk of bias and applicability concerns graph (a) and summary (b): review authors’ judgements about each domain presented as percentages across included studies. Figure 6. Risk of bias and applicability concerns graph (a) and summary (b): review authors’
judgements about each domain presented as percentages across included studies.

Diagnostics 2022, 12, 49 17 of 22
4. Discussion
Our results suggest that the diagnostic accuracy of ultrasonographic ∆IVC for predict-ing fluid responsiveness is acceptable. The pooled sensitivity, specificity, positive likelihoodratio, negative likelihood ratio, diagnostic odds ratio, and AUROC of ∆IVC were 0.75, 0.83,4.37, 0.30, 14.3, and 0.86, respectively. In the subgroup analysis, there was no differencebetween patients on MV and those breathing spontaneously. Despite the systematic review,we found only three studies on the IJV and one on the FV. We found no study on the SCV.There was insufficient evidence to support the diametric measurement of these large veinsas an alternative to that of the IVC. More prospective studies are warranted, which shouldconsider the threshold of the index test and the heterogeneity of the reference standard.
Recently, several previous systematic reviews and meta-analyses were conducted toinvestigate the diagnostic accuracy of ∆IVC. Orso et al. [12], in a meta-analysis including20 studies with ∆IVC, reported that the pooled sensitivity, specificity, and AUROC were0.71, 0.75, and 0.71, respectively. They included several studies of pediatric patients,whereas we excluded these studies. Si et al. [13], in a meta-analysis including 12 studiescomprising only patients on MV, reported a sensitivity, specificity, and AUROC of 0.73,0.82, and 0.85, respectively. In our subgroup analysis, studies comprising patients onMV showed a sensitivity, specificity, and AUROC of 0.74, 0.85, and 0.87, respectively,whereas studies comprising patients with spontaneous breathing showed similar results,with a sensitivity, specificity, and AUROC of 0.75, 0.81, and 0.85, respectively. Si et al. [13]concluded that ∆IVC was a poor predictor in patients with TV < 8 mL/kg or PEEP > 5 cmH2O through subgroup analysis (k = 6) (sensitivity, specificity, and AUROC of 0.66, 0.68,and 0.70, respectively). However, in our subgroup analysis (k = 5), ∆IVC in this settingshowed better results, which were a sensitivity, specificity, and AUROC of 0.73, 0.77, and0.82, respectively. In our analysis, similar to that of Si et al. [13], the performance of ∆IVCwas higher in patients with TV ≥ 8 mL/kg or PEEP ≤ 5 cm H2O (sensitivity, specificity,and AUROC of 0.74, 0.88, and 0.90), but the meta-regression test did not show a significantdifference (p = 0.31). Overall, compared with previous meta-analyses [12,13], we updatedour interpretation with data from 11 studies that have been published since 2018. However,two studies [51,52] in the previous meta-analyses by Orso et al. [12] and one study [53]in the other meta-analysis by Si et al. [13] did not have 2-by-2 contingency data in ourrecalculation. Thus, we excluded these three studies. Only one previous meta-analysisinvestigated the IVC diameter, without a delineation of respiratory variation [54]. Theyanalyzed two case–control and three before-and-after studies. They found a significantlylower diameter of the IVC in hypovolemic status and the mean difference was 6.3 mm(95% CI, 6.0–6.5). However, this effect size is apparently too small to use in clinical practice.Indeed, the inherent size of the IVC may vary in each patient. Similar static index tests,such as central venous pressure, showed no clinical significance in the previous study [55].Since this study was published, there has been no meta-analysis investigating the IVCdiameter alone. In common with ∆IVC, a more dynamic index would be appropriate forevaluating volume status.
Due to the limited number of studies that met our inclusion criteria, we did not conductthe meta-analysis for the IJV, SCV, and FV. We found only three studies that evaluated theIJV [29,36,42]. The specificity, sensitivity, and AUROC of these studies were sufficientlyhigh for predicting fluid responsiveness. The AUROC of the IJV ranged from 0.825 to 0.915.The AUROC of the SCV was also sufficient, with a value of 0.970. Both the IJV and the SCVare located in proximity of the right atrium. Thus, these would be alternative vessels toinvestigate. However, the FV would be limited due to its distance from the right atrium.One eligible study in our meta-analysis reported a strong correlation between IVC-CI andIJV-CI (r = 0.976, n = 44) [36]. One study that was excluded because there was no fluidchallenge, reporting a moderately strong correlation between IVC-CI and SCV-CI (r = 0.781,n = 34) [56]. In the case of the FV, only one study was excluded because it reported only amodest correlation between IVC-CI and FV-CI (r = 0.642, 57) [57]. In future reviews, the IJVand SCV need to be further investigated.

Diagnostics 2022, 12, 49 18 of 22
In the eligible studies of our meta-analysis, several conventional reference standardswere used after fluid loading to determine the fluid responsiveness. The increase in CO orSV was considered as a response to fluid replacement. Therefore, the accurate measurementof CO or SV is crucial. To measure CO or SV, the most reliable method is the insertion of aSwan–Ganz catheter [4]. This involves an injection of ice-cold water into the right atriumthrough a pulmonary artery catheter and measurement of CO or SV using the temperaturechange [58]. It measures SvO2 to reflect accurate, real-time change in hemodynamics [59].However, it is a difficult technique to perform in practice, especially if indicated often, andhas limitations because it is invasive and even more difficult to perform in the presence ofarrhythmias, pulmonary infarction, or catheter injury with vascular complications [60]. Inour analysis, no study used a Swan–Ganz catheter as a reference standard. Another wayto measure CO or SV is to extract the arterial waveform. Since the SV is estimated usingthe area under the dicrotic notch at the start of the rise of arterial pressure, the SV can becalculated for every heartbeat [59,61]. VigileoTM (Edwards life science, Irvine, CA, USA),MostCare™ (Vytech, Padova, Italy) using PRAM (Pressure Recording Analytical Method),and PiCCO® (Pulsion Medical Systems, Munich, Germany), which uses blood pressurewaveforms, were proposed as less invasive methods [60,61]. These involve the insertion ofa central venous catheter and a relatively small-sized device, approximately 4–5 Fr, into theartery, and allow the monitoring of continuous values even when the patient is unstable.The arterial waveform analysis method is less invasive than the Swan–Ganz method.However, re-calibration is required every 6–12 h in the case of vascular elasticity, aorticinsufficiency, or inaccurate arterial pressure waveforms [60,61]. The method of measuringCO or SV using echocardiography involves measuring the velocity-time integral using thediameter of the left ventricular outlet and Doppler ultrasound [62]. Echocardiography isuseful because it can also provide the differential diagnosis of cardiac dysfunction andhypovolemia by measuring chamber size and cardiac function. However, it is not able todetect continuous changes like the Swan–Ganz catheter and should be performed by anexpert who has a high level of experience in general [63]. The bioimpedance method canmeasure the CO or SV only by direct contact [64]. The fluctuation of the volume of thebody with pulsatile changes results in electrical impedance, and the variation of the systolicperiod is measured, allowing the value of the CO or SV to be monitored [65]. However,reliability is limited in some critically ill patients, and appropriate improvements are likelyto be necessary in future studies. Evidence for the superiority of one method over anotherfrom the above techniques is limited [10]. We assumed that these reference standards havesimilar diagnostic accuracy.
Our analysis has several limitations. First, all eligible studies were observational.Second, several eligible studies have an unclear risk of bias in terms of patient selection.Third, the threshold of the index test varied and there was considerable heterogeneity. Toovercome this issue, we investigated the correlation between sensitivity and specificity todetect the threshold effect. Fourth, the reference standard was heterogeneous. We alsoconducted a meta-regression test to evaluate the heterogeneity. Fifth, both patients on MVand those breathing spontaneously were included, although the physiology of the twois antonymous. We conducted a meta-regression, which showed no significance. Sixth,we did not find sufficient eligible studies involving the IJV and SCV. We found only threestudies on the IJV. We did not conduct the meta-analysis due to statistical instability. Wefound no study that measured the respiratory variation of the FV diameter. Future studiesare needed to investigate and correct the above deficiencies. Seventh, there would exista “grey zone” to discriminate response to fluid resuscitation even though the ∆IVC isan easy-to-determine quantitative variable. Thus, integrating an additional qualitativesonographic evaluation may be more helpful in future study [66]. Finally, we includedonly published original articles and those written in English. This would be expected tointroduce publication bias; however, this was not noted in our analysis.

Diagnostics 2022, 12, 49 19 of 22
5. Conclusions
Our systematic review and meta-analysis suggest that the ultrasonographic measure-ment of the respiratory variation in the diameter of the IVC has a favorable diagnosticaccuracy for predicting fluid responsiveness in critically ill patients. However, we con-cluded that there is insufficient evidence in the case of the IJV, SCV, and FV diameters tohave clinical application.
Author Contributions: Conceptualization, D.-W.K., S.C. and W.-S.K.; methodology, W.-S.K.; software,W.-S.K.; validation, D.-W.K., S.C. and W.-S.K.; formal analysis, W.-S.K..; investigation, D.-W.K., S.C.and W.-S.K.; resources, D.-W.K., S.C. and W.-S.K.; data curation, D.-W.K., S.C. and W.-S.K.; writing—original draft preparation, D.-W.K., S.C., W.-S.K. and J.K.; writing—review and editing, D.-W.K.,S.C., W.-S.K. and J.K.; visualization, W.-S.K.; supervision, W.-S.K.; project administration, W.-S.K. Allauthors have read and agreed to the published version of the manuscript.
Funding: This work was supported by the Korea Medical Device Development Fund grant fundedby the Korea government (the Ministry of Science and ICT; Ministry of Trade, Industry and Energy;Ministry of Health and Welfare; and Ministry of Food and Drug Safety) (KMDF_PR_20200901_0095),Chonnam National University Hospital Biomedical Research Institute (CRI18013-1) and by grantNRF-2021R1I1A3047390 through the National Research Foundation of Korea.
Institutional Review Board Statement: Not applicable.
Informed Consent Statement: Not applicable.
Data Availability Statement: Not applicable.
Conflicts of Interest: The authors declare no conflict of interest.
References1. Ansari, B.M.; Zochios, V.; Falter, F.; Klein, A.A. Physiological controversies and methods used to determine fluid responsiveness:
A qualitative systematic review. Anaesthesia 2016, 71, 94–105. [CrossRef]2. Bednarczyk, J.M.; Fridfinnson, J.A.; Kumar, A.; Blanchard, L.; Rabbani, R.; Bell, D.; Funk, D.; Turgeon, A.F.; Abou-Setta, A.M.;
Zarychanski, R. Incorporating dynamic assessment of fluid responsiveness into goal-directed therapy: A systematic review andmeta-analysis. Crit. Care Med. 2017, 45, 1538–1545. [CrossRef] [PubMed]
3. Evans, L.; Rhodes, A.; Alhazzani, W.; Antonelli, M.; Coopersmith, C.M.; French, C.; Machado, F.R.; McIntyre, L.; Ostermann, M.;Prescott, H.C.; et al. Surviving sepsis campaign: International guidelines for management of sepsis and septic shock 2021. Crit.Care Med. 2021, 49, e1063–e1143. [CrossRef]
4. Harvey, S.; Harrison, D.A.; Singer, M.; Ashcroft, J.; Jones, C.M.; Elbourne, D.; Brampton, W.; Williams, D.; Young, D.; Rowan, K.Assessment of the clinical effectiveness of pulmonary artery catheters in management of patients in intensive care (PAC-Man): Arandomised controlled trial. Lancet 2005, 366, 472–477. [CrossRef]
5. Jacob, R.; Dierberger, B.; Kissling, G. Functional significance of the Frank-Starling mechanism under physiological and patho-physiological conditions. Eur. Heart J. 1992, 13 (Suppl. E), 7–14. [CrossRef] [PubMed]
6. Joseph, B.; Azim, A.; Zangbar, B.; Bauman, Z.; O’Keeffe, T.; Ibraheem, K.; Kulvatunyou, N.; Tang, A.; Latifi, R.; Rhee, P. Improvingmortality in trauma laparotomy through the evolution of damage control resuscitation: Analysis of 1030 consecutive traumalaparotomies. J. Trauma Acute Care Surg. 2017, 82, 328–333. [CrossRef] [PubMed]
7. Cannon, J.W.; Khan, M.A.; Raja, A.S.; Cohen, M.J.; Como, J.J.; Cotton, B.A.; Dubose, J.J.; Fox, E.E.; Inaba, K.; Rodriguez, C.J.; et al.Damage control resuscitation in patients with severe traumatic hemorrhage: A practice management guideline from the EasternAssociation for the Surgery of Trauma. J. Trauma Acute Care Surg. 2017, 82, 605–617. [CrossRef]
8. Kalla, M.; Herring, N.J.S. Physiology of shock and volume resuscitation. Surgery 2013, 31, 545–551.9. Chatterjee, K.J.C. The Swan-Ganz catheters: Past, present, and future: A viewpoint. Circulation 2009, 119, 147–152. [CrossRef]10. Saugel, B.; Kouz, K.; Scheeren, T.W.L.; Greiwe, G.; Hoppe, P.; Romagnoli, S.; de Backer, D. Cardiac output estimation using pulse
wave analysis-physiology, algorithms, and technologies: A narrative review. Br. J. Anaesth. 2021, 126, 67–76. [CrossRef]11. Pourmand, A.; Pyle, M.; Yamane, D.; Sumon, K.; Frasure, S.E. The utility of point-of-care ultrasound in the assessment of volume
status in acute and critically ill patients. World J. Emerg. Med. 2019, 10, 232–238. [CrossRef]12. Orso, D.; Paoli, I.; Piani, T.; Cilenti, F.L.; Cristiani, L.; Guglielmo, N. Accuracy of ultrasonographic measurements of inferior
vena cava to determine fluid responsiveness: A systematic review and meta-analysis. J. Intensive Care Med. 2020, 35, 354–363.[CrossRef]
13. Si, X.; Xu, H.; Liu, Z.; Wu, J.; Cao, D.; Chen, J.; Chen, M.; Liu, Y.; Guan, X. Does respiratory variation in inferior vena cava diameterpredict fluid responsiveness in mechanically ventilated patients? A systematic review and meta-analysis. Anesth. Analg. 2018,127, 1157–1164. [CrossRef] [PubMed]

Diagnostics 2022, 12, 49 20 of 22
14. McInnes, M.D.F.; Moher, D.; Thombs, B.D.; McGrath, T.A.; Bossuyt, P.M.; Clifford, T.; Cohen, J.F.; Deeks, J.J.; Gatsonis, C.; Hooft, L.;et al. Preferred reporting items for a systematic review and meta-analysis of diagnostic test accuracy studies: The PRISMA-DTAstatement. JAMA 2018, 319, 388–396. [CrossRef] [PubMed]
15. Whiting, P.F.; Rutjes, A.W.; Westwood, M.E.; Mallett, S.; Deeks, J.J.; Reitsma, J.B.; Leeflang, M.M.; Sterne, J.A.; Bossuyt, P.M.QUADAS-2: A revised tool for the quality assessment of diagnostic accuracy studies. Ann. Intern. Med. 2011, 155, 529–536.[CrossRef] [PubMed]
16. Rutter, C.M.; Gatsonis, C.A. A hierarchical regression approach to meta-analysis of diagnostic test accuracy evaluations. Stat.Med. 2001, 20, 2865–2884. [CrossRef]
17. Reitsma, J.B.; Glas, A.S.; Rutjes, A.W.; Scholten, R.J.; Bossuyt, P.M.; Zwinderman, A.H. Bivariate analysis of sensitivity andspecificity produces informative summary measures in diagnostic reviews. J. Clin. Epidemiol. 2005, 58, 982–990. [CrossRef][PubMed]
18. Higgins, J.P.; Thompson, S.G.; Deeks, J.J.; Altman, D.G. Measuring inconsistency in meta-analyses. BMJ 2003, 327, 557–560.[CrossRef]
19. Dwamena, B. A Midas Retouch Regarding Diagnostic Meta-Analysis. In Proceedings of the 2014 Stata Conference, Boston, MA,USA, 31 July–1 August 2014.
20. Deeks, J.J.; Macaskill, P.; Irwig, L. The performance of tests of publication bias and other sample size effects in systematic reviewsof diagnostic test accuracy was assessed. J. Clin. Epidemiol. 2005, 58, 882–893. [CrossRef]
21. Barbier, C.; Loubières, Y.; Schmit, C.; Hayon, J.; Ricôme, J.L.; Jardin, F.; Vieillard-Baron, A. Respiratory changes in inferior venacava diameter are helpful in predicting fluid responsiveness in ventilated septic patients. Intensive Care Med. 2004, 30, 1740–1746.[CrossRef]
22. Feissel, M.; Michard, F.; Faller, J.P.; Teboul, J.L. The respiratory variation in inferior vena cava diameter as a guide to fluid therapy.Intensive Care Med. 2004, 30, 1834–1837. [CrossRef]
23. Moretti, R.; Pizzi, B. Inferior vena cava distensibility as a predictor of fluid responsiveness in patients with subarachnoidhemorrhage. Neurocrit. Care 2010, 13, 3–9. [CrossRef] [PubMed]
24. Machare-Delgado, E.; Decaro, M.; Marik, P.E. Inferior vena cava variation compared to pulse contour analysis as predictors offluid responsiveness: A prospective cohort study. J. Intensive Care Med. 2011, 26, 116–124. [CrossRef] [PubMed]
25. Muller, L.; Bobbia, X.; Toumi, M.; Louart, G.; Molinari, N.; Ragonnet, B.; Quintard, H.; Leone, M.; Zoric, L.; Lefrant, J.Y. Respiratoryvariations of inferior vena cava diameter to predict fluid responsiveness in spontaneously breathing patients with acute circulatoryfailure: Need for a cautious use. Crit. Care 2012, 16, R188. [CrossRef] [PubMed]
26. Lanspa, M.J.; Grissom, C.K.; Hirshberg, E.L.; Jones, J.P.; Brown, S.M. Applying dynamic parameters to predict hemodynamicresponse to volume expansion in spontaneously breathing patients with septic shock. Shock 2013, 39, 155–160. [CrossRef][PubMed]
27. Charbonneau, H.; Riu, B.; Faron, M.; Mari, A.; Kurrek, M.M.; Ruiz, J.; Geeraerts, T.; Fourcade, O.; Genestal, M.; Silva, S. Predictingpreload responsiveness using simultaneous recordings of inferior and superior vena cavae diameters. Crit. Care 2014, 18, 473.[CrossRef]
28. De Valk, S.; Olgers, T.J.; Holman, M.; Ismael, F.; Ligtenberg, J.J.; Ter Maaten, J.C. The caval index: An adequate non-invasiveultrasound parameter to predict fluid responsiveness in the emergency department? BMC Anesthesiol. 2014, 14, 114. [CrossRef]
29. Guarracino, F.; Ferro, B.; Forfori, F.; Bertini, P.; Magliacano, L.; Pinsky, M.R. Jugular vein distensibility predicts fluid responsivenessin septic patients. Crit. Care 2014, 18, 647. [CrossRef]
30. Airapetian, N.; Maizel, J.; Alyamani, O.; Mahjoub, Y.; Lorne, E.; Levrard, M.; Ammenouche, N.; Seydi, A.; Tinturier, F.; Lobjoie, E.;et al. Does inferior vena cava respiratory variability predict fluid responsiveness in spontaneously breathing patients? Crit. Care2015, 19, 400. [CrossRef]
31. De Oliveira, O.H.; Freitas, F.G.; Ladeira, R.T.; Fischer, C.H.; Bafi, A.T.; Azevedo, L.C.; Machado, F.R. Comparison betweenrespiratory changes in the inferior vena cava diameter and pulse pressure variation to predict fluid responsiveness in postoperativepatients. J. Crit. Care 2016, 34, 46–49. [CrossRef]
32. Sobczyk, D.; Nycz, K.; Andruszkiewicz, P.; Wierzbicki, K.; Stapor, M. Ultrasonographic caval indices do not significantlycontribute to predicting fluid responsiveness immediately after coronary artery bypass grafting when compared to passive legraising. Cardiovasc. Ultrasound 2016, 14, 23. [CrossRef] [PubMed]
33. Theerawit, P.; Morasert, T.; Sutherasan, Y. Inferior vena cava diameter variation compared with pulse pressure variation aspredictors of fluid responsiveness in patients with sepsis. J. Crit. Care 2016, 36, 246–251. [CrossRef] [PubMed]
34. Zhang, X.; Feng, J.; Zhu, P.; Luan, H.; Wu, Y.; Zhao, Z. Ultrasonographic measurements of the inferior vena cava variation as apredictor of fluid responsiveness in patients undergoing anesthesia for surgery. J. Surg. Res. 2016, 204, 118–122. [CrossRef]
35. Corl, K.A.; George, N.R.; Romanoff, J.; Levinson, A.T.; Chheng, D.B.; Merchant, R.C.; Levy, M.M.; Napoli, A.M. Inferior vena cavacollapsibility detects fluid responsiveness among spontaneously breathing critically-ill patients. J. Crit. Care 2017, 41, 130–137.[CrossRef]
36. Haliloglu, M.; Bilgili, B.; Kararmaz, A.; Cinel, I. The value of internal jugular vein collapsibility index in sepsis. Ulusal travma veacil cerrahi dergisi. Turk. J. Trauma Emerg. Surg. 2017, 23, 294–300. [CrossRef]
37. Lu, N.; Xi, X.; Jiang, L.; Yang, D.; Yin, K. Exploring the best predictors of fluid responsiveness in patients with septic shock. TheAm. J. Emerg. Med. 2017, 35, 1258–1261. [CrossRef]

Diagnostics 2022, 12, 49 21 of 22
38. Piskin, Ö.; Öz, I. Accuracy of pleth variability index compared with inferior vena cava diameter to predict fluid responsiveness inmechanically ventilated patients. Medicine 2017, 96, e8889. [CrossRef]
39. Preau, S.; Bortolotti, P.; Colling, D.; Dewavrin, F.; Colas, V.; Voisin, B.; Onimus, T.; Drumez, E.; Durocher, A.; Redheuil, A.; et al.Diagnostic accuracy of the inferior vena cava collapsibility to predict fluid responsiveness in spontaneously breathing patientswith sepsis and acute circulatory failure. Crit. Care Med. 2017, 45, e290–e297. [CrossRef] [PubMed]
40. Bortolotti, P.; Colling, D.; Colas, V.; Voisin, B.; Dewavrin, F.; Poissy, J.; Girardie, P.; Kyheng, M.; Saulnier, F.; Favory, R.; et al.Respiratory changes of the inferior vena cava diameter predict fluid responsiveness in spontaneously breathing patients withcardiac arrhythmias. Ann. Intensive Care 2018, 8, 79. [CrossRef] [PubMed]
41. Giraud, R.; Abraham, P.S.; Brindel, P.; Siegenthaler, N.; Bendjelid, K. Respiratory changes in subclavian vein diameters predictsfluid responsiveness in intensive care patients: A pilot study. J. Clin. Monit. Comput. 2018, 32, 1049–1055. [CrossRef]
42. Ma, G.G.; Hao, G.W.; Yang, X.M.; Zhu, D.M.; Liu, L.; Liu, H.; Tu, G.W.; Luo, Z. Internal jugular vein variability predicts fluidresponsiveness in cardiac surgical patients with mechanical ventilation. Ann. Intensive Care 2018, 8, 6. [CrossRef]
43. Wang, Y.; Jiang, Y.; Wu, H.; Wang, R.; Wang, Y.; Du, C. Assessment of fluid responsiveness by inferior vena cava diametervariation in post-pneumonectomy patients. Echocardiography 2018, 35, 1922–1925. [CrossRef] [PubMed]
44. Corl, K.A.; Azab, N.; Nayeemuddin, M.; Schick, A.; Lopardo, T.; Zeba, F.; Phillips, G.; Baird, G.; Merchant, R.C.; Levy, M.M.; et al.Performance of a 25% inferior vena cava collapsibility in detecting fluid responsiveness when assessed by novice versus expertphysician sonologists. J. Intensive Care Med. 2020, 35, 1520–1528. [CrossRef]
45. He, F.; Li, X.; Thapa, S.; Li, C.; Luo, J.; Dai, W.; Liu, J. Evaluation of volume responsiveness by pulse pressure variability andinferior vena cava dispensability index at different tidal volumes by mechanical ventilation. Braz. J. Med. Biol. Res./Rev. Bras.Pesqui. Med. Biol. 2019, 52, e8827. [CrossRef] [PubMed]
46. Yao, B.; Liu, J.Y.; Sun, Y.B.; Zhao, Y.X.; Li, L.D. The value of the inferior vena cava area distensibility index and its diameter ratiofor predicting fluid responsiveness in mechanically ventilated patients. Shock 2019, 52, 37–42. [CrossRef] [PubMed]
47. Zhang, H.; Zhang, Q.; Chen, X.; Wang, X.; Liu, D. Respiratory variations of inferior vena cava fail to predict fluid responsivenessin mechanically ventilated patients with isolated left ventricular dysfunction. Ann. Intensive Care 2019, 9, 113. [CrossRef]
48. Caplan, M.; Durand, A.; Bortolotti, P.; Colling, D.; Goutay, J.; Duburcq, T.; Drumez, E.; Rouze, A.; Nseir, S.; Howsam, M.;et al. Measurement site of inferior vena cava diameter affects the accuracy with which fluid responsiveness can be predicted inspontaneously breathing patients: A post hoc analysis of two prospective cohorts. Ann. Intensive Care 2020, 10, 168. [CrossRef]
49. McGregor, D.; Sharma, S.; Gupta, S.; Ahmed, S.; Harris, T. Emergency department non-invasive cardiac output study (EDNICO):An accuracy study. Scand. J. Trauma Resusc. Emerg. Med. 2020, 28, 8. [CrossRef]
50. Blaivas, M.; Blaivas, L.; Philips, G.; Merchant, R.; Levy, M.; Abbasi, A.; Eickhoff, C.; Shapiro, N.; Corl, K. Development of adeep learning network to classify inferior vena cava collapse to predict fluid responsiveness. J. Ultrasound Med. Off. J. Am. Inst.Ultrasound Med. 2021, 40, 1495–1504. [CrossRef] [PubMed]
51. Vignon, P.; Repessé, X.; Bégot, E.; Léger, J.; Jacob, C.; Bouferrache, K.; Slama, M.; Prat, G.; Vieillard-Baron, A. Comparison ofechocardiographic indices used to predict fluid responsiveness in ventilated patients. Am. J. Respir. Crit. Care Med. 2017, 195,1022–1032. [CrossRef]
52. Brun, C.; Zieleskiewicz, L.; Textoris, J.; Muller, L.; Bellefleur, J.P.; Antonini, F.; Tourret, M.; Ortega, D.; Vellin, A.; Lefrant, J.Y.; et al.Prediction of fluid responsiveness in severe preeclamptic patients with oliguria. Intensive Care Med. 2013, 39, 593–600. [CrossRef]
53. Baker, A.K.; Partridge, R.J.; Litton, E.; Ho, K.M. Assessment of the plethysmographic variability index as a predictor of fluidresponsiveness in critically ill patients: A pilot study. Anaesth. Intensive Care 2013, 41, 736–741. [CrossRef]
54. Dipti, A.; Soucy, Z.; Surana, A.; Chandra, S. Role of inferior vena cava diameter in assessment of volume status: A meta-analysis.Am. J. Emerg. Med. 2012, 30, 1414–1419. [CrossRef]
55. Marik, P.E.; Cavallazzi, R. Does the central venous pressure predict fluid responsiveness? An updated meta-analysis and a pleafor some common sense. Crit. Care Med. 2013, 41, 1774–1781. [CrossRef]
56. Kent, A.; Bahner, D.P.; Boulger, C.T.; Eiferman, D.S.; Adkins, E.J.; Evans, D.C.; Springer, A.N.; Balakrishnan, J.M.; Valiyaveedan, S.;Galwankar, S.C.; et al. Sonographic evaluation of intravascular volume status in the surgical intensive care unit: A prospectivecomparison of subclavian vein and inferior vena cava collapsibility index. J. Surg. Res. 2013, 184, 561–566. [CrossRef]
57. Kent, A.; Patil, P.; Davila, V.; Bailey, J.K.; Jones, C.; Evans, D.C.; Boulger, C.T.; Adkins, E.; Balakrishnan, J.M.; Valiyaveedan, S.;et al. Sonographic evaluation of intravascular volume status: Can internal jugular or femoral vein collapsibility be used in theabsence of IVC visualization? Ann. Thorac. Med. 2015, 10, 44–49. [CrossRef] [PubMed]
58. Monnet, X.; Teboul, J.L. Transpulmonary thermodilution: Advantages and limits. Crit. Care 2017, 21, 147. [CrossRef] [PubMed]59. Kobe, J.; Mishra, N.; Arya, V.K.; Al-Moustadi, W.; Nates, W.; Kumar, B. Cardiac output monitoring: Technology and choice. Ann.
Card. Anaesth. 2019, 22, 6–17. [CrossRef]60. Marqué, S.; Cariou, A.; Chiche, J.D.; Squara, P. Comparison between Flotrac-Vigileo and Bioreactance, a totally noninvasive
method for cardiac output monitoring. Crit. Care 2009, 13, R73. [CrossRef] [PubMed]61. Litton, E.; Morgan, M. The PiCCO monitor: A review. Anaesth. Intensive Care 2012, 40, 393–409. [CrossRef] [PubMed]62. Gorrasi, J.; Pazos, A.; Florio, L.; Américo, C.; Lluberas, N.; Parma, G.; Lluberas, R. Cardiac output measured by transthoracic
echocardiography and Swan-Ganz catheter. A comparative study in mechanically ventilated patients with high positive end-expiratory pressure. Rev. Bras. Ter. Intensiva 2019, 31, 474–482. [CrossRef] [PubMed]

Diagnostics 2022, 12, 49 22 of 22
63. Mercado, P.; Maizel, J.; Beyls, C.; Titeca-Beauport, D.; Joris, M.; Kontar, L.; Riviere, A.; Bonef, O.; Soupison, T.; Tribouilloy, C.; et al.Transthoracic echocardiography: An accurate and precise method for estimating cardiac output in the critically ill patient. Crit.Care 2017, 21, 136. [CrossRef] [PubMed]
64. Kupersztych-Hagege, E.; Teboul, J.L.; Artigas, A.; Talbot, A.; Sabatier, C.; Richard, C.; Monnet, X. Bioreactance is not reliablefor estimating cardiac output and the effects of passive leg raising in critically ill patients. Br. J. Anaesth. 2013, 111, 961–966.[CrossRef]
65. Lee, S.; Lee, S.H.; Chang, B.C.; Shim, J.K. Efficacy of goal-directed therapy using bioreactance cardiac output monitoring aftervalvular heart surgery. Yonsei Med. J. 2015, 56, 913–920. [CrossRef] [PubMed]
66. Trauzeddel, R.F.; Ertmer, M.; Nordine, M.; Groesdonk, H.V.; Michels, G.; Pfister, R.; Reuter, D.; Scheeren, T.W.L.; Berger, C.;Treskatsch, S. Perioperative echocardiography-guided hemodynamic therapy in high-risk patients: A practical expert approachof hemodynamically focused echocardiography. J. Clin. Monit. Comput. 2021, 35, 229–243. [CrossRef] [PubMed]