
The Role of PET/CT and SPECT/CT in Oncology Drug Development
39
Draft Date: October 25, 2022 PET and SPECT/CT The Role of PET/CT and SPECT/CT in Oncology Drug Development Authors: *Karen A Kurdziel, MD; [email protected] ; 301-443-0622 Liza Lindenberg, MD; [email protected] Esther Mena, MD; [email protected] Baris Turkbey MD; [email protected] Peter Choyke, MD; [email protected] Affilliation (all) Molecular Imaging Program, Center for Cancer Research National Cancer Institute, National Institutes of Health 10 Center Drive; B3B Bethesda, MD 20892 *Corresponding Author i
-
Upload
independent -
Category
Documents
-
view
3 -
download
0
Transcript of The Role of PET/CT and SPECT/CT in Oncology Drug Development

Draft Date: October 25, 2022 PET and SPECT/CT
The Role of PET/CT and SPECT/CT in Oncology Drug Development
Authors:
*Karen A Kurdziel, MD; [email protected]; 301-443-0622
Liza Lindenberg, MD; [email protected]
Esther Mena, MD; [email protected]
Baris Turkbey MD; [email protected]
Peter Choyke, MD; [email protected]
Affilliation (all)
Molecular Imaging Program, Center for Cancer Research
National Cancer Institute, National Institutes of Health
10 Center Drive; B3B
Bethesda, MD 20892
*Corresponding Author
i

Draft Date: October 25, 2022 PET and SPECT/CT
Keywords:
Molecular Imaging
Oncology
PET/CT
Prostate Cancer
Radioimmunoscintigraphy
SPECT/CT
ii

Draft Date: October 25, 2022 PET and SPECT/CT
Abbreviations
18F-FACBC18F-anti-1-amino-3-fluorocyclobutane-1-carboxylic acid
18F-FDG 2-deoxy-2-[18F]fluoro-D-glucose
5-FU 5-fluorouracil
ADCC antibody-dependent cell cytotoxicity
BPH Benign Prostate hypertrophy
CT Computed Tomography
FdUrd Fluoro-2’-deoxyuridine
Furd Fluorouridine
IHC immunohistochemical
MRI Magnetic Resonance Imaging
PET Positron Emission Tomography
PSMA Prostate Specific Membrane Antigen
SPECT Single Photon Emission Tomography
SUV Standardized Uptake Value
TCA TriCarboxylic Acid
THU tetrahydrouridine
iii

Draft Date: October 25, 2022 PET and SPECT/CT
Abstract
Understanding the hallmarks of cancer is valuable in advancing drug development to fight the
disease. With the advent of molecular imaging, non-invasive in vivo visualization of physiology
and functional pathways allow for multiple levels of disease and therapy assessment beyond
tumor size measurements offered by conventional anatomic scans. Radiolabeling targeted
molecules can provide insight into tumor interactions within the body and may help guide
therapeutic constructs. Traditionally, radiolabeled probes have been useful for staging and
diagnosis but they can also be created to monitor and identify drug targets and pharmaceutical
biodistribution among other novel approaches. Radiotracers can be imaged either through
single photon emission computed tomography (SPECT) or positron emission tomography (PET),
with advantages and limitations to both. Adding CT to either modality is an added benefit for
anatomic localization and attenuation correction. In this review, we will briefly discuss several
molecular imaging agents, which target metabolism (18F-FDG, 18F-FACBC, 11C acetate),
proliferation (18F-FLT, 18F-5FU, 18F-FdCyd), and cancer specific drug receptors (111In-morab009,
111In-trastuzumab, 89Zr-panutumumab). Molecular imaging is a powerful tool that one day, may
be employed to personalize treatment and dosing strategies and predict anticancer therapy
outcomes.
iv

Draft Date: October 25, 2022 PET and SPECT/CT
Introduction
In 2000, Hanahan and Weinberg proposed six “Hallmarks of Cancer”, which
include: achieving limitless replicative potential, sustaining
angiogenesis, evading apoptosis, establishing self-sufficiency in growth
signals and insensitivity to anti-growth signals, and developing tissue
invasion and metastasis capabilities[1].These hallmarks identified
features of cancer cells that set them apart from normal cells. In 2011,
Hanahan and Weinberg updated their original hallmarks with additional
features, reflecting advances in knowledge since the original article
[2]. Most cancer therapies target one or more of these processes, yet
response is still typically assessed simply by anatomic changes (i.e.
changes in tumor diameter). While conventional anatomic imaging depicts
these architectural changes with high fidelity, these are often late
findings and provide no insight into the mechanism by which the physical
changes were achieved. Molecular Imaging offers the possibility of non-
invasive in vivo visualization of physiology and functional pathways at
the cellular level. This provides a means for real time assessment of
the molecular techniques by which tumors succumb to and evade targeted
therapy.
Radiolabeling targeted molecules is a highly sensitive method of
detecting specific attributes of a tumor. Moreover, the biodistribution
and kinetics of the uptake of the targeted agent carry additional
information. There are two types of radioactive isotopes commonly used
1

Draft Date: October 25, 2022 PET and SPECT/CT
for in vivo molecular imaging probes. Single photon emission decay
results in the production of charateristic gamma rays that can be
detected either with a planar “gamma camera” or single photon emission
computed tomography (SPECT), which provides cross sectional imaging.
The other type of radioactive isotope is a positron emitter, which emits
positron that rapidly undergoes an annihilation reaction with an
electron resulting in two gamma rays per radioactive decay,
approximately 1800 apart. The coincidence circuitry of a positron
emission tomography (PET) camera takes advantage of these physical decay
properties, giving it intrinsic advantages in sensitivity and resolution
compared with SPECT, but both are still in wide use. They are both
often combined with computed tomography (CT) to provide both molecular
and anatomic imaging fused into one study. The differences between
SPECT and PET will be discussed in more detail in a later section.
Unlike drugs that are administered at therapeutic levels, the high
sensitivity of PET and SPECT cameras means that radiolabeled probes can
be administered at doses 1/100th to 1/1000th of the therapy dose, a
phenomenon that has given rise to the term “tracer” to describe these
agents. The chemical composition of the radiotracer determines what
functional process can be monitored. Routine clinical radiotracer
imaging studies using single photon emitting nuclides include: 99mTc
sestamibi or tetrofosimin for cardiac perfusion, 99mTc-
methylenediphosphonate (MDP) for bone imaging, 99mTc DTPA or MAG3 for
2

Draft Date: October 25, 2022 PET and SPECT/CT
renal function, 99mTc mebrofenin for hepatobiliary imaging, 123I for
thyroid disease, 111In octreotide and 123/131I MIBG for neuroendocrine tumor
imaging and 111In-granulocyte imaging for infection, among others. For
PET imaging, 18F-fluorodeoxyglucose (FDG), a glucose analog, has become
part of the routine clinical work-up for many cancers. 18F-Sodium
Fluoride bone scans are also emerging as PET tracers that provide highly
sensitive information on the status of bone metastases.
While most radiotracers are directed at diagnosis and staging, more
recently, radiotracers are being developed to monitor specific pathways,
identify potential drug targets, determine if a drug is hitting the
desired target, discriminate between premalignant and malignant states,
guide appropriate therapy and risk stratify patients. In this review, we
will briefly review several molecular imaging agents, which target
metabolism (18F-FDG, 18F-FACBC, 11C acetate ), proliferation (18F-FLT, 18F-
5FU, 18F-FdCyd), and cancer specific drug receptors (111In-morab009, 111In-
trastuzumab).
PET or SPECT?
As previously mentioned, radiotracers used clinically are generally
categorized as either gamma emitters or positron emitters. Radiotracers
which undergo gamma decay, emitting one or more characteristic gamma
photons, which can be imaged with a gamma camera (also known as the
3

Draft Date: October 25, 2022 PET and SPECT/CT
Anger camera, named after its inventor, Hal Anger [3], who designed it
in 1957 at the University of California, Berkeley). The gamma camera’s
circuitry is able to estimate the location from which gamma photons are
released and differentiate among the energies of the photons, allowing
it to selectively image photons of a pre-defined energy distribution.
This permits simultaneous imaging of several gamma isotopes, or the
detection of only photons with a characteristic energy arising from a
radioisotope of interest. A gamma camera consists of one or more flat
scintillation detectors optically coupled to an array of photomultiplier
tubes (which amplify the signal). A major limitation of gamma cameras is
their inability to accurately localize photons that are not
perpendicular to the detector. To improve photon localization, lead
collimators are used to restrict access to the detector, allowing only
perpendicular photons to reach the detector face. The tradeoff is a
large reduction in the number of detectable photons (<1% of the emitted
photons reach the detector) and a limited spatial resolution of 1-2 cm.
The development of tomographic gamma cameras, designated single-photon
computed tomography (SPECT), enabled 3-dimensional imaging with
tomographic sectioning of the body, similar to computed tomography but
at much lower spatial resolution.
In contrast to single photon emitters, a positron (anti-electron) of a
characteristic energy is emitted as anti-matter from the nucleus of a
PET radioisotope. While the energies of the positrons differ among PET
4

Draft Date: October 25, 2022 PET and SPECT/CT
isotopes, this energy determines the distance it can move before
annihilating, hence influencing the achievable spatial resolution for a
particular PET emitter. The emitted positron is short lived and rapidly
encounters an electron, which causes matter-anti-matter annihilation
resulting in the production of two 511-keV photons, emitted in
approximately opposite directions. It is the detection of these photons
which creates a PET image. A positron emission detection camera
(positron emission tomography or PET) incorporates a coincidence
detection circuitry that only collects photons of ~511 keV which reach
the detector more or less simultaneously. This creates a series of lines
of response that can be used to generate an image but does not require
collimation. This results in a substantial (~10 fold) improvement in
sensitivity for PET imaging. While positron emitting radioisotopes can
be imaged with gamma cameras (using high energy collimators which
further limit the number of photons reaching the detector), the use of
PET technology provides for higher sensitivity and resolution imaging
when compared with SPECT. This does however, come at the expense of more
costly equipment. The cost of detector materials in PET scanners is also
high and thus, in order to reduce costs, a smaller field of view is
utilized compared to SPECT. Nonetheless, the increased sensitivity of
PET allows for faster counting at each “station” allowing PET to be even
more efficient in scanning times than SPECT.
5

Draft Date: October 25, 2022 PET and SPECT/CT
Despite the benefits of PET technology, gamma camera imaging retains its
strengths. The choice of modality is dependent on the clinical question,
radiotracer availability, and the chemistry involved in radiolabeling
the desired compound. The inclusion of CT within the camera gantry is
available for both modalities and allows for both tumor localization and
a means of attenuation correction [4, 5], which are both necessary for
quantitating tumor uptake.
Imaging Tumor Metabolism
2-deoxy-2-[18F]fluoro-D-glucose (18F-FDG)
2-deoxy-2-[18F]fluoro-D-glucose (18F-FDG) is the most widely used
clinical PET radiopharmaceutical. As a glucose analog, its uptake
correlates with glucose transport and metabolism. Due to the high
glycolysis rates of many tumors, 18F-FDG PET/CT has enabled oncologists
to better diagnose, stage and monitor many malignancies. However many
benign conditions (i.e. inflammation) also show increased 18F-FDG
uptake, and not all malignancies demonstrate up-regulated glucose
metabolism, thus are not well served by 18F-FDG PET/CT. Prostate cancer,
in particular, exhibits variable uptake of 18F-FDG making it unreliable.
Several investigational PET radiotracers targeting alternative metabolic
pathways, including 11C-acetate [6, 7] and 18F-anti-1-amino-3-
fluorocyclobutane-1-carboxylic acid (18F-FACBC) [8-10], have shown some
promise in prostate cancer imaging.
6
Draft Date: October 25, 2022 PET and SPECT/CT
11C-acetate
As a common metabolic intermediate, radiolabeled acetate has been used
as a biomarker of lipid and cholesterol synthesis for many years. [11]
{Howard, 1977 #31} Recent studies have shown that 11C-acetate PET/CT
imaging may be useful in patients with certain malignancies, including
prostate cancer [12]. 11C-acetate is a naturally occurring compound that
is converted to acetyl-CoA, which is a substrate for the tricarboxylic
acid (TCA) cycle. It then becomes incorporated into cholesterol and
fatty acids. The mechanism by which 11C-acetate is taken up in cancer
cells is still unclear, but it is postulated that acetate is involved in
cytoplasmic lipid synthesis and becomes incorporated into the cell
membrane of tumor cells. Because prostate cancers rely more on fatty
acid metabolism than glycolysis, 11C-acetate is a promising method for
identifying prostate cancer. In a pilot study, Oyama et al. [13] imaged
22 prostate cancer patients with 11C-acetate, and showed accumulation of
the tracer in all primary tumors, albeit with variable uptake values
(Standardized Uptake Value (SUV) ranging from 3.27 to 9.87), and 11C-
acetate was more sensitive than 18F-FDG PET (SUV ranging from 1.97 to
6.34). Furthermore, 11C-acetate was superior for the detection of lymph
node metastases, demonstrating increased uptake in five patients. 18F-
FDG was positive in only two of the five patients. However, using
immunohistochemistry, a recent study found [7], no correlation between
11C-acetate uptake and fatty acid synthase, which is the enzyme that
7
Draft Date: October 25, 2022 PET and SPECT/CT
converts acetate to acetyl-CoA, casting some doubt on the mechanism by
which 11C-acetate is taken up in prostate cancer.
In radiotracer imaging, the physiological distribution of the tracer
plays a large role in the clinical utility. In humans, 11C-acetate PET
imaging shows accumulation/excretion of tracer in the pancreas and
intestines and thus, has minimal bladder uptake, facilitating pelvic
imaging, unlike 18F-FDG which is excreted by the kidney into the
bladder.
While 11C-acetate uptake appears to be greater in the tumor than in the
normal tissue, acetate is not cancer specific. In one study, [7] there
was a significant difference (p<0.001) between tumor uptake (mean SUV of
4.4) and normal prostate tissue (mean SUV 2.1) but there was also
significant overlap in uptake values between benign prostate hypertrophy
(BPH) and tumor foci; therefore focal uptake does not necessarily
indicate tumor. Despite this non-specificity, most of the 11C-acetate
false positive findings were in regions of BPH which were correctly
categorized by MR. Fig. 1 Thus, a combination of these technologies (via
sequential imaging or using the recently developed PET/MR camera) may
overcome this limitation. In addition to accumulation in BPH, Kato et
al. [14] found the physiologic uptake of 11C-acetate to increase with
age. Metabolic changes in prostate tumors following androgen ablation
have also been studied in vitro with a marked suppression of 11C-acetate
uptake observed after anti-androgen therapy. [15]
8

Draft Date: October 25, 2022 PET and SPECT/CT
In the evaluation of prostate cancer recurrence, 11C-acetate showed a
higher sensitivity than 18F-FDG for local and regional lymph node
metastases. In the study by Sandblom et al. [16] in 20 patients with
increasing PSA after radical prostatectomy, recurrence was detected with
11C-acetate in 75% of the patients while 15% of the cases showed false-
positive uptake. While11C-acetate PET can detect both primary and
metastatic prostate cancer, its widespread clinical use is greatly
hindered by the short half-life of 11C (~20 minutes), which limits its
availability and restricts its use to facilities with on-site cyclotrons
and radiochemistry laboratories.
18F FACBC
Amino acids are clearly an important part of tumor metabolism and are
required for growth of the tumor. Several synthetic peptides have been
synthesized and radiolabeled in an attempt to exploit the increased
transport of amino acids in cancer for imaging purposes. The active
pharmaceutical ingredient of [18F]-FACBC is 1-amino-3-fluorocyclobutane-
1-carboxylic acid in the ‘anti’ configuration. This is a synthetic
amino- acid L-leucine analogue [17, 18] whose uptake by prostate
carcinoma cells is likely mediated via sodium-dependent amino acid
transporters. [19] 18F -FACBC, is not incorporated into proteins, but is
thought to accumulate in cancer cells, making it a promising molecular
imaging agent. It was initially reported to have utility in the
9

Draft Date: October 25, 2022 PET and SPECT/CT
evaluation of primary and metastatic cancers in the brain, [20, 21] due
to its low brain background uptake and high uptake by brain tumors. More
recently, it has been reported to be useful in assessing metastatic or
recurrent prostate cancers in the prostate bed, lymph nodes and bone.
[8-10, 22-24] Nye et. al. [25] reported the biodistribution of 18F -
FACBC in 6 healthy volunteers, showing slow bladder accumulation, with
only about 3.2% (range: 1.1% to 7.4%) urinary tract excretion. Unlike
18F-FDG which rapidly accumulates in the bladder and ultimately
demonstrates much higher uptake than the prostate (leading to
reconstruction artifacts), the concentration of 18F -FACBC in the
bladder approaches that of the prostate (at ~15 minutes), enabling good
differentiation between the two(Fig. 2).
A pilot study of 18F-FACBC conducted by Emory University included
15 subjects with recently diagnosed or recurrent prostate cancer. [10]
After dynamic acquisition of 18F-FACBC images, correct identification of
focal malignancy was achieved in 40 of 48 prostate sextants: moreover,
recurrence was successfully detected in all four subjects with recurrent
disease. Pelvic nodal status correlated with 18F-FACBC findings in 7 of
9 subjects. Even though occasional low-level uptake was seen in benign
inguinal lymph nodes, (as it can also be seen in 11C-acetate imaging),
the maximum SUV of malignant adenopathy was significantly higher than
that of uninvolved nodes. Fig.3 depicts uptake in benign lymph nodes in
patients who were imaged with 11C-acetate or 18F-FACBC. With regard to
evaluating localized prostate cancer, similar to 11C-acetate, there is
10

Draft Date: October 25, 2022 PET and SPECT/CT
overlap in the uptake in BPH nodule and tumor, making it impossible to
differentiate using PET alone. When spatially compared with MRI; however
BPH nodules can be clearly identified. Fig.4
More recent data from Schuster et al., [9] in the setting of biochemical
failure (rising PSA following prostatectomy or definitive radiation),
suggests that 18F-FACBC (sensitivity of 89% in the prostate bed)
outperforms the currently FDA-approved SPECT tracer Prostascint
(sensitivity of 69% in the prostate bed), which binds to an
intracellular prostate specific membrane antigen (PSMA) receptor.
Imaging Proliferation
Unlimited proliferation is a hallmark of cancer that has been the target
of therapy development for decades. Thus, there is great interest in
assessing cellular proliferation. Most methods focus on increased DNA
synthesis. The radiotracer most widely used to study proliferation is
3'-deoxy-3'-18F fluorothymidine (18F-FLT) [26-28].
18F- FLT is a structural analog of the DNA nucleotide, thymidine.
Normally, thymidine is taken up by cells and phosphorylated, a process
mediated by thymidine kinase, before being incorporated into DNA.
Analogs of thymidine, such as FLT, behave similarly but instead of being
incorporated into DNA, accumulate in the cytoplasm. As such, 18F-FLT
has the potential to reflect tumor proliferation. Studies have shown
that 18F-FLT uptake correlates with Ki-67 (rho=0.83) [29] and, to a
11

Draft Date: October 25, 2022 PET and SPECT/CT
lesser extent with thymidine kinase, rho=0.65 the putative enzyme for
trapping 18F- FLT within the cell; however it does not correlate well
with thymidine kinase enzymatic activity. [30]
Data suggest that 18F-FLT uptake is reduced in inflammation, potentially
making it a useful adjunct for 18F-FDG-positive lesions suspected of
being false positives [31, 32]. Thus, 18F-FLT PET/CT is being studied in
a variety of cancer types to monitor therapy and differentiate benign
inflammatory conditions from residual malignancy. Preliminary data shows
that 18F- FLT PET/CT has a higher specificity, when compared with 18F-
FDG, in lymphoma [33], lung cancer [34, 35], brain tumor [36, 37] and
head and neck cancers [38-40]. Preliminary data from patients with
lymphoma supports this concept. Fig. 5 depicts a patient with a history
of lymphoma and an 18F-FDG-positive lesion, which was negative on 18F-FLT
PET/CT and was confirmed by biopsy to be inflammation.
As cancer therapies often target DNA synthesis, radiopharmaceutical
imaging provides a method to visualize the distribution of such drugs.
The goal of drug therapy is to deliver an adequate amount of active drug
to the tumor while minimizing exposure to normal tissue. Once the active
drug is in the bloodstream, delivery to the tumor and normal tissues is
initially defined by relative perfusion. Drug penetration in solid
tumors can be limited by factors influencing perfusion such as high
interstitial pressure, vascular heterogeneity and regional necrosis.
Once the drug reaches the tumor, it may or may not specifically
12

Draft Date: October 25, 2022 PET and SPECT/CT
accumulate. Imaging radiolabeled drugs provide a means to non-invasively
visualize the drug distribution based on perfusion and retention over
time and can thereby, estimate tumor drug concentrations.
5-fluorouracil (5-FU)
5-fluorouracil (5-FU) was introduced as a member of a class of antitumor
fluoropyrimidines in 1957 [41] and remains in use today. Its major
cytotoxic mechanisms include inhibition of thymidylate synthetase and
interference with DNA and protein synthesis, as a result of conversion
to a ribose nucleoside and substitution into RNA [42].
5-FU was radiolabeled with 18F and its uptake correlated with response
to 5- FU therapy [43]; however, 5-FU is rapidly catabolized in vivo into
metabolites that also demonstrate efficacy. Because PET imaging cannot
differentiate between the parent radiopharmaceutical and its
radiolabeled metabolites 18F-5-FU is limited as an imaging agent [44,
45].
18F-5-Fluoro-2’-deoxycytidine (18F -FdCyd)
The nucleoside analogue 5-Fluoro-2’-deoxycytidine (FdCyd) is a DNA
methyltransferase inhibitor currently being evaluated clinically;
however, the therapeutic benefits are only observed in a minority of
patients. Most patients experience toxicity, so designing a patient
selection strategy that identifies likely responders is important [46].
13

Draft Date: October 25, 2022 PET and SPECT/CT
By establishing a method of evaluating the biodistribution of the drug
and its ability to be taken up by tumor cells, 18F -FdCyd may improve
patient selection.
PET imaging of the pyrimidines has been hindered by background
radioactivity produced by catabolism. In vivo, FdCyd is rapidly
metabolized into 5-Fluoro-2’-deoxyuridine (FdUrd), 5-Fluorouracil (FU),
and 5-Fluorouridine (FUrd) [47], all of which cause toxic side effects
and all of which are radiolabeled. Co-administration of
tetrahydrouridine (THU) inhibits the converting enzyme, cytidine
deaminase, [48] and impedes this catabolism.
By co-administering radiolabeled 18F-FdCyd and THU, the rapid metabolism
of FdCyd is inhibited and PET imaging can be used to estimate FdCyd
delivery to the tumor. As the specific activity (MBq/ug) of the
radiopharmaceutical injected is known, measuring the total tumor
activity (MBq) over time provides an estimate of the total drug
accumulation.
Imaging with 18F -FdCyd may confirm tumor uptake and thus help identify
patients who are responsive to the parent drug, FdCyd. In cases of
treatment failure, 18F -FdCyd can determine if failure is due to
inadequate drug delivery or poor tumor retention. Fig. 6 shows the
tumor uptake of FdCyd when co-administered with THU.
Tumor Targeted Agents
14

Draft Date: October 25, 2022 PET and SPECT/CT
111In-CHX-A”-DTPA-trastuzumab
The most common forms of tumor-targeted imaging are antibody based.
Trastuzumab (Herceptin, Roche Laboratories) was one of the first
receptor specific antibodies introduced as a therapy. Trastuzumab
targets the HER2 receptor, a 185 kD membrane-bound receptor which
interacts with members of the EGFR family and other ligands [49]. These
receptors stimulate intracellular signal transduction pathways involved
in the control of cell growth. HER2 is over-expressed in a variety of
epithelial tumors; approximately 25-30% breast and ovarian cancers, 35-
45% of all pancreatic adenocarcinomas and up to 80% of colorectal
carcinomas [49, 50]. In a study of >100 human tumor xenografts, over-
expression of HER2 was also shown to be common in uterine cervix (67%),
gastric (75%), prostate (50%) cancers and adenocarcinoma of the lung
(67%). Over-expression of this oncogene is associated with poor
prognosis and aggressive tumor attributes [51, 52]. As a humanized
monoclonal antibody targeting the HER2 receptor, trastuzumab gained FDA
approval in 1998 for the treatment of advanced stage HER2 over-
expressing tumors.
Trastuzumab as a monotherapy has resulted in a response rate of 12-20%
in metastatic breast cancer participants [53]. The therapeutic efficacy
of trastuzumab has been improved when combined with chemotherapy [54,
55]. In spite of these apparent benefits, large numbers of patients fail
to respond to treatment and/or relapse after a short period on therapy.
15

Draft Date: October 25, 2022 PET and SPECT/CT
Patient selection in these trials is based on immunohistochemical (IHC)
staining of biopsy samples for HER2 expression. Patients with a scoring
of 2+ or 3+ are selected for treatment with trastuzumab [49, 56]. A
consequence of this screening criterion is that only a low percentage of
patients may be eligible for trastuzumab therapy and tumors that don’t
express HER2 to a significant extent are unlikely to respond to therapy.
For example, of the 1480 patients screened in one clinical trial, only
222 patients (15%) met the 2+/3+ scoring criteria while 280 (18.9%)
patients presenting with a score of 1+ were ineligible. [57] Thus, in
this study approximately 30% of patients expressed IHC detectable HER2
within their tumors. But, the existing methods of establishing HER2
expression have limitations. The IHC assessment of tumor samples is
somewhat subjective and some patients with zero or 1+ expression
actually have higher expression levels than were previously thought.
Fluorescent in situ hybridization (FISH) results are stated
ratiometrically rather than subjectively by the 1+, 2+, 3+ designation.
The ability to image trastuzumab could define the extent of HER2
expression in primary lesions but also define secondary lesions with
HER2 expression.
To create an imaging agent from trastuzumab, the antibody is chelated
with a chemical linker such as CHX-A’’-DTPA [58] to enable the
attachment of radioisotope. Because of its long clearance time,
trastuzumab has been radiolabeled with a long acting radioisotope, 111In
(111In-CHX-A”-DTPA-trastuzumab). Initial human studies demonstrated high 16

Draft Date: October 25, 2022 PET and SPECT/CT
uptake in metastatic foci for patients whose primary tumor expressed
HER2. Fig. 7 While the uptake is appreciated on planar views, it is
better localized on the SPECT images. Due to the limited quantitative
capabilities of SPECT, estimates of tumor drug concentration can only be
made if there is a “standard” aliquot of the radiolabel, of known
activity (measured in a dose calibrator), placed in the imaging field of
view. By measuring the number of counts in the tumor on the SPECT image,
it is possible to manually calculate the tumor activity using the
measured counts obtained from imaging the standard and the known
activity of the injected dose. Further normalization to the patient
weight results in a SPECT standard uptake value (SUV) equivalent
measure, which permits comparison between different imaging sessions and
among different patients. Using a very similar chelated antibody, it is
possible to treat such tumors with radioimmunoconjugates [59, 60] or
other receptor targeted cytotoxic “payloads”[58, 61] which may enable
unique treatment options for tumors with lower expression of HER2.
111In-MorAb009
The same chelating conjugate has also been applied to another targeted
IgG monoclonal antibody, amatuximab (Morphtek), which targets the cell
surface marker, mesothelin. Mesothelin is a cytoplasmic membrane
glycoprotein believed to be involved in cell adhesion and tumor
metastasis [62]. While low levels of this glycoprotein are also noted in
some normal tissues, marked over-expression is found in many tumors,
17

Draft Date: October 25, 2022 PET and SPECT/CT
particularly pancreatic adenocarcinomas and mesotheliomas. Malignancies
associated with mesothelin expression generally have poor prognosis.
Preclinical studies demonstrating antibody-dependent cell cytotoxicity
(ADCC) with amatuximab indicate strong potential as an anticancer agent,
and clinical studies are underway. The radiolabeled construct, 111In-CHX-
A”-DTPA-amatuximab, [63] demonstrated good tumor uptake in mice and it
is predicted that SPECT imaging of mesothelin distribution may provide
insight to the antibody’s efficacy and enhance dosing strategies for
amatuximab.
Antibody binding to shed antigen in the circulation can decrease
radiotracer availability for the target tumor, so initial studies were
performed by pre-injecting un-labeled (“cold”) antibody to saturate this
shed mesothelin. Based on prior experience with other antibodies, this
was expected to improve the likelihood of radiotracer binding to tumor
(as opposed to the shed fraction). The addition of small amounts of
cold antibody may also increase tumor specific binding by occupying non-
specific binding sites throughout the body. The amount of cold antibody
to be co-administered for optimal imaging is difficult to predict. Too
much cold antibody can saturate the tumor specific binding sites,
leaving none open for the tracer dose of radiolabeled antibody. Pre-
administration of cold antibody also confounds the measurement of
amatuximab tumor binding as only the radiolabeled antibody is imaged,
possibly resulting in a large fraction of the binding potential not
18
Draft Date: October 25, 2022 PET and SPECT/CT
imaged. In preliminary clinical studies, while high uptake was found in
some tumor sites, the uptake in other tumors known to express mesothelin
was low [Fig. 8] suggesting that too many of the tumor specific binding
sites are occupied by the non-radiolabeled drug.
Conclusion
Radiotracers have the potential to advance knowledge of the complex
methods cancer employs to survive in the body. Not only can imaging
provide valuable insight into the quantitative biodistribution of
anticancer therapies, it may allow for personalized treatment and dosing
strategies. Radiotracers allow non-invasive interrogation of the tumor.
The choice of radiolabeled drug, imaging modality and complexity of the
image data analyses are dependent on the question to be answered.
However, before radiotracers can be considered “surrogate” biomarkers
(i.e. have the ability to predict outcome), the imaging data they
provide must be shown to be reliably quantifiable, reproducible, and
relate to relevant physiological processes. There are numerous targeted
radiotracers under evaluation (just a handful were discussed in this
review) and progress is being made towards validating them as surrogate
imaging markers, which should lead to the successful integration into
the drug development paradigm.
19

Draft Date: October 25, 2022 PET and SPECT/CT
20
Draft Date: October 25, 2022 PET and SPECT/CT
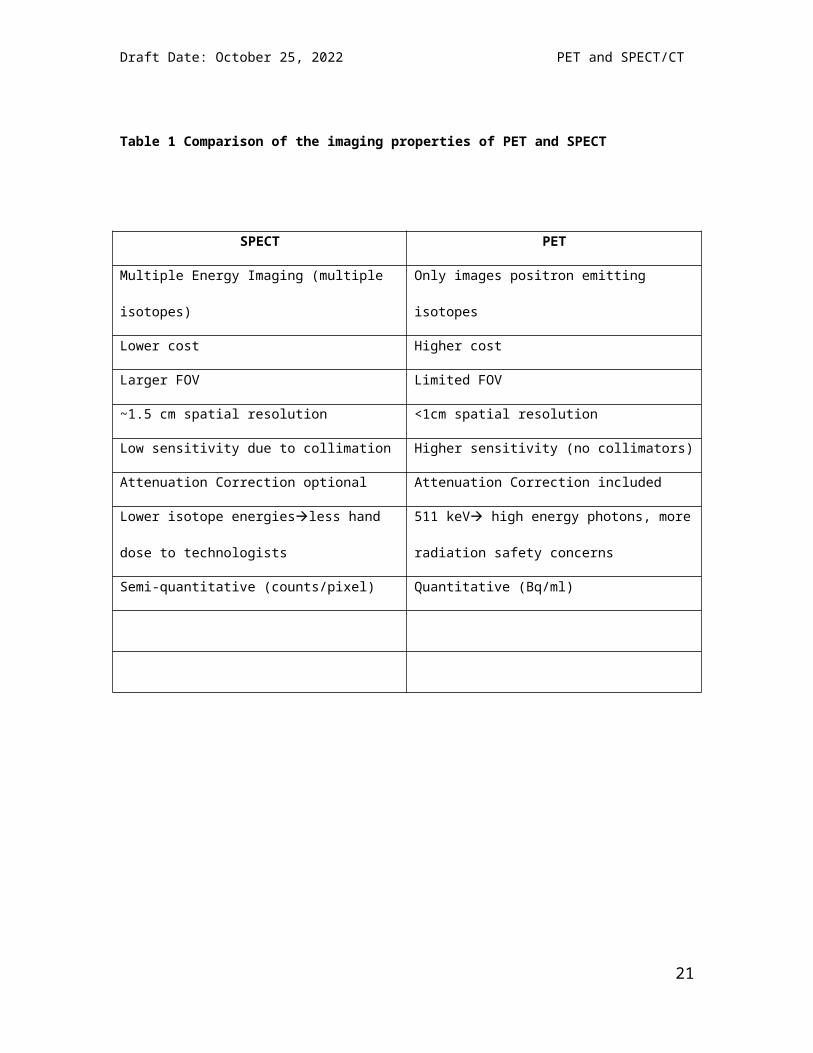
Table 1 Comparison of the imaging properties of PET and SPECT
SPECT PET
Multiple Energy Imaging (multiple
isotopes)
Only images positron emitting
isotopes
Lower cost Higher cost
Larger FOV Limited FOV
~1.5 cm spatial resolution <1cm spatial resolution
Low sensitivity due to collimation Higher sensitivity (no collimators)
Attenuation Correction optional Attenuation Correction included
Lower isotope energiesless hand
dose to technologists
511 keV high energy photons, more
radiation safety concerns
Semi-quantitative (counts/pixel) Quantitative (Bq/ml)
21

Draft Date: October 25, 2022 PET and SPECT/CT
FIGURE 1:
MRI (top), 11C-acetate PET (middle) and Fused PET/CT (bottom) axial
images of the prostate in a patient with prostate cancer. Crosshairs and
red arrow show the histology confirmed tumor, while the blue arrow shows
uptake in BPH nodules. The overlap in tumor and BPH uptake make it
impossible to differentiate the 2 based on 11C-acetate PET/CT alone.
22

Draft Date: October 25, 2022 PET and SPECT/CT
FIGURE 2
Representative coronal CT (upper row) and 18F-FACBC PET (bottom row)
images at 10 minutes and 26 minutes post injection, showing the ability
to distinctly differentiation between activity in the bladder and the
prostate. At the latter time points on the time activity curve (B), the
activity in the bladder is essentially equal to that in the prostate.
23

Draft Date: October 25, 2022 PET and SPECT/CT
Figure 3
58-year-old man with a serum PSA of 5.41ng/dl. Large field of view (A)
and zoomed (B) 18F-FACBC PET images demonstrate uptake in bilateral
central gland (blue arrows in B) and in the left mid peripheral zone
(orange arrow). Axial T2W MRI (C) demonstrates findings suggesting
benign prostate hyperplasia (BPH) in central gland bilaterally (blue
arrows in C) and a hypointense focus suspicious for tumor (orange arrow
in C). Histopathology revealed BPH in central gland bilaterally, however
left central gland also included a small Gleason 3+3 tumor focus (inked
in green in D) and right central gland included a small focus of atrophy
(inked in brown in D), which were not visualized either by PET or MRI.
Moreover, the left sided uptake area in PET, which was deemed as a tumor
at MRI, was found to include high grade prostatic intraepithelial
neoplasia at histopathology (inked in black in D).
24
Draft Date: October 25, 2022 PET and SPECT/CT
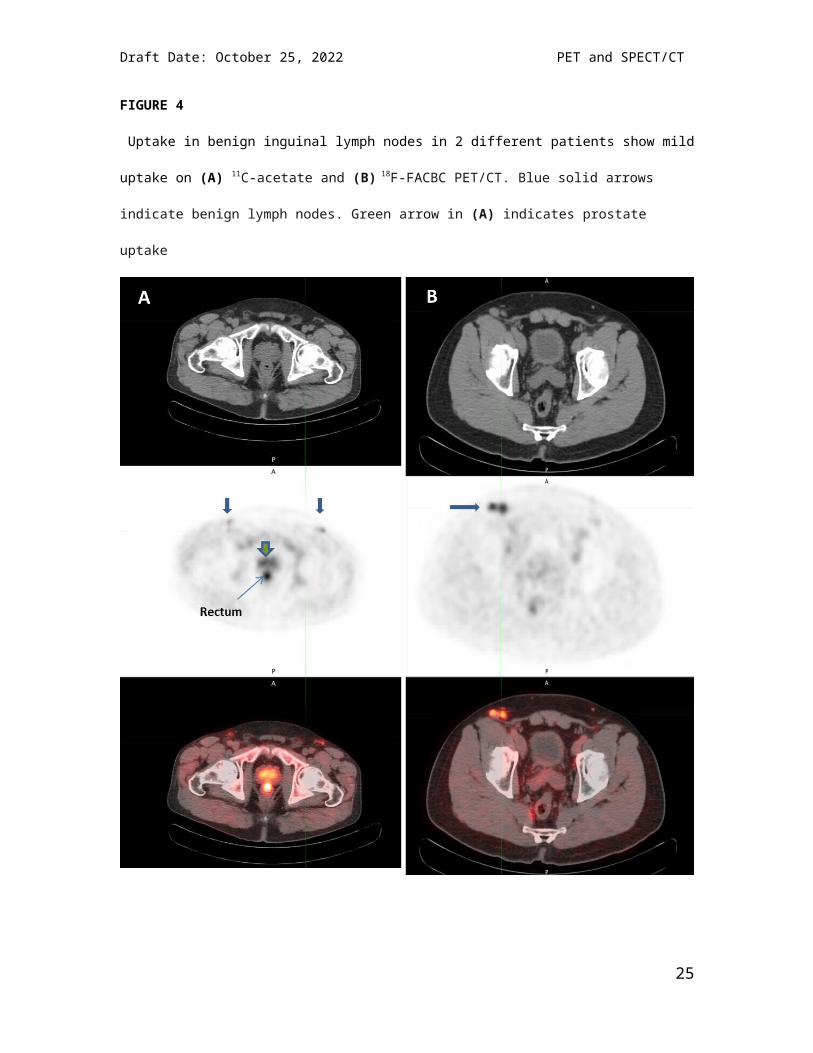
FIGURE 4
Uptake in benign inguinal lymph nodes in 2 different patients show mild
uptake on (A) 11C-acetate and (B) 18F-FACBC PET/CT. Blue solid arrows
indicate benign lymph nodes. Green arrow in (A) indicates prostate
uptake
25

Draft Date: October 25, 2022 PET and SPECT/CT
FIGURE 5
19 year old female status post therapy for peripheral T-cell lymphoma
presented with 18F-FDG positive (SUV 6.9) intercostal soft tissue mass
which shows little to no increased uptake on the 18F-FLT images. Biopsy
showed acute inflammation.
26
Draft Date: October 25, 2022 PET and SPECT/CT
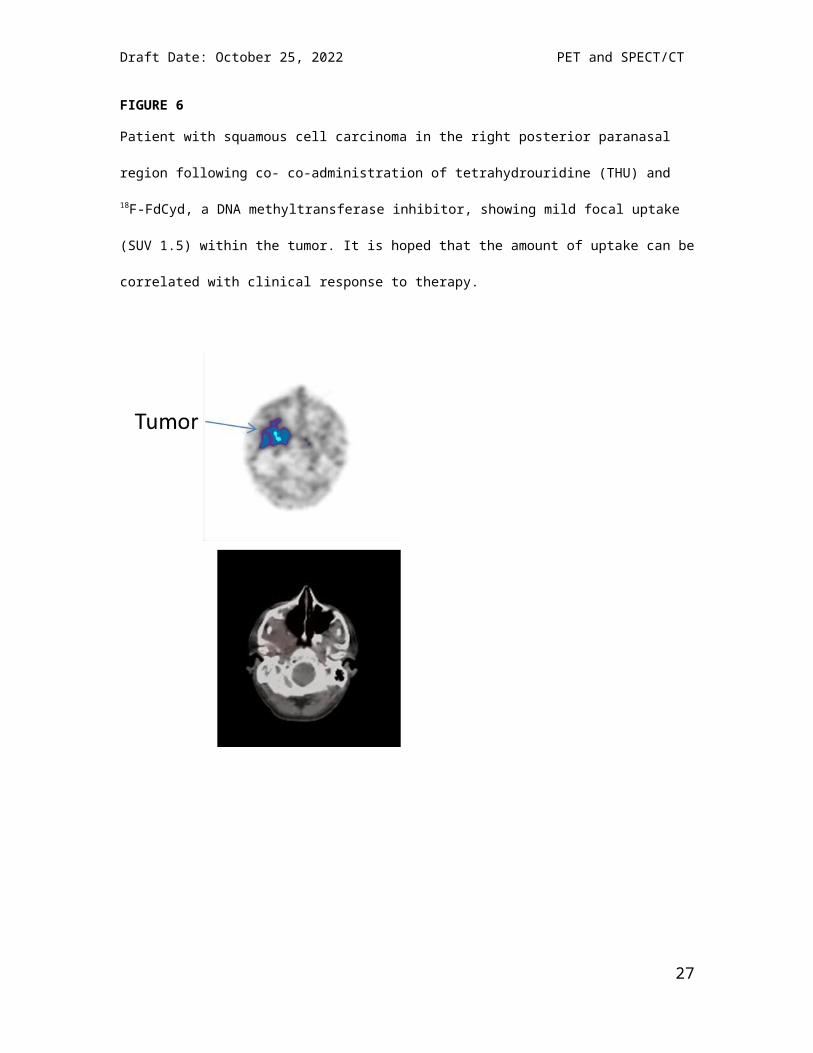
FIGURE 6
Patient with squamous cell carcinoma in the right posterior paranasal
region following co- co-administration of tetrahydrouridine (THU) and
18F-FdCyd, a DNA methyltransferase inhibitor, showing mild focal uptake
(SUV 1.5) within the tumor. It is hoped that the amount of uptake can be
correlated with clinical response to therapy.
27

Draft Date: October 25, 2022 PET and SPECT/CT
FIGURE 7
68 year old female with post-menopausal left Stage IV breast
adenocarcinoma with metastasis to the left axilla (and lungs—not shown)
Histology of the primary tumor was ER/PR negative, HER-2 positive.
Axial and coronal SPECT (top) and CT (bottom) images performed 48 hours
after 111In-trastuzummab injection shows uptake in the left axillary node
(crosshairs)
28
Draft Date: October 25, 2022 PET and SPECT/CT
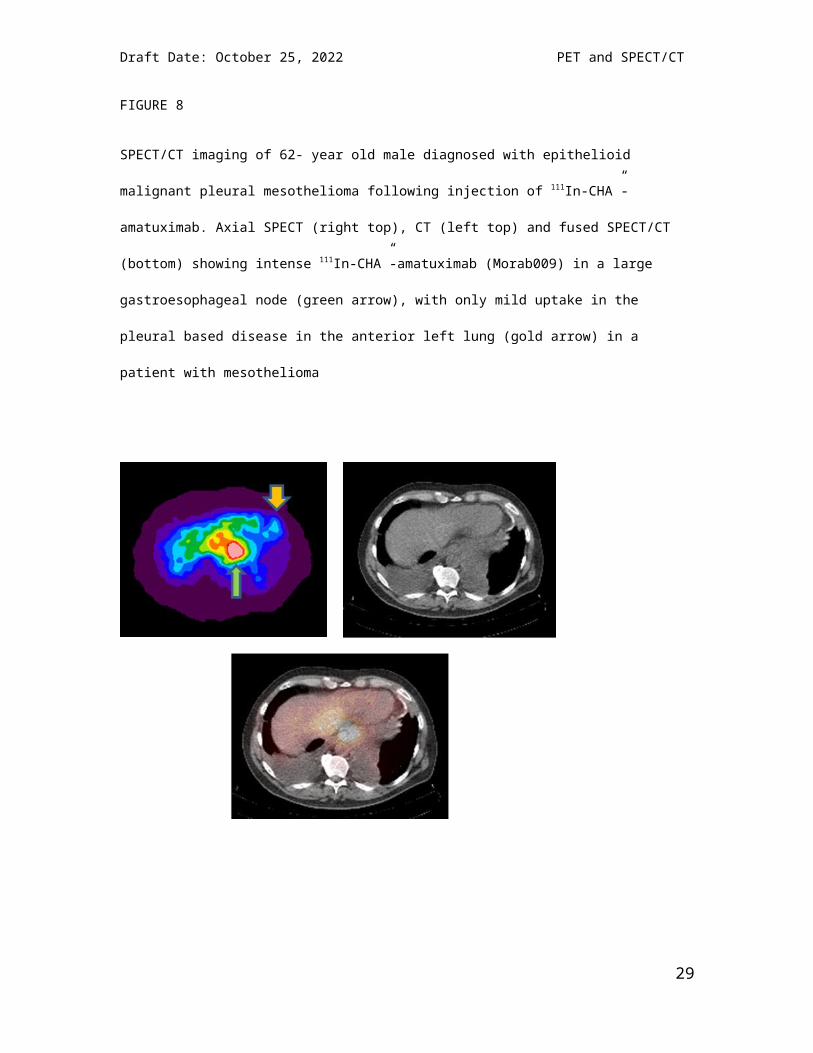
FIGURE 8
SPECT/CT imaging of 62- year old male diagnosed with epithelioid
malignant pleural mesothelioma following injection of 111In-CHA”-
amatuximab. Axial SPECT (right top), CT (left top) and fused SPECT/CT
(bottom) showing intense 111In-CHA”-amatuximab (Morab009) in a large
gastroesophageal node (green arrow), with only mild uptake in the
pleural based disease in the anterior left lung (gold arrow) in a
patient with mesothelioma
29

Draft Date: October 25, 2022 PET and SPECT/CT
References
1. Hanahan, D. and R.A. Weinberg, The hallmarks of cancer. Cell, 2000. 100(1): p. 57-70.
2. Hanahan, D. and R.A. Weinberg, Hallmarks of cancer: the next generation. Cell, 2011. 144(5): p. 646-74.
3. Anger, H.O., Use of a gamma-ray pinhole camera for in vivo studies. Nature, 1952. 170(4318): p. 200-1.
4. Eichling, J.O., C.S. Higgins, and M.M. Ter-Pogossian, Determination of radionuclide concentrations with positron CT scanning (PETT): concise communication. J Nucl Med, 1977. 18(8): p. 845-7.
5. Ohyama, N., et al., Advanced Data Acquisition Methods for Quantitative Single Photon Emission CT. IEEE Trans Med Imaging, 1984. 3(4): p. 187-92.
6. Kotzerke, J., et al., Carbon-11 acetate positron emission tomography can detect local recurrence of prostate cancer. Eur J NuclMed Mol Imaging, 2002. 29(10): p. 1380-4.
7. Mena, E., et al., 11C-Acetate PET/CT in Localized Prostate Cancer: A Study with MRI and Histopathologic Correlation. J Nucl Med, 2012.53(4): p. 538-45.
8. Schuster, D.M., et al., Initial experience with the radiotracer anti-1-amino-3-[18F]Fluorocyclobutane-1-carboxylic acid (anti-[ 18F]FACBC) with PET in renal carcinoma. Mol Imaging Biol, 2009.11(6): p. 434-8.
9. Schuster, D.M., et al., Detection of recurrent prostate carcinoma with anti-1-amino-3-18F-fluorocyclobutane-1-carboxylic acid PET/CT and 111In-capromab pendetide SPECT/CT. Radiology, 2011. 259(3): p. 852-61.
10. Schuster, D.M., et al., Initial experience with the radiotracer anti-1-amino-3-18F-fluorocyclobutane-1-carboxylic acid with PET/CT in prostate carcinoma. J Nucl Med, 2007. 48(1): p. 56-63.
11. Howard, B.V., Acetate as a carbon source for lipid synthesis in cultured cells. Biochim Biophys Acta, 1977. 488(1): p. 145-51.
30

Draft Date: October 25, 2022 PET and SPECT/CT
12. Yoshimoto, M., et al., Characterization of acetate metabolism in tumor cells in relation to cell proliferation: acetate metabolism in tumor cells. Nucl Med Biol, 2001. 28(2): p. 117-22.
13. Oyama, N., et al., 11C-acetate PET imaging of prostate cancer. J Nucl Med, 2002. 43(2): p. 181-6.
14. Kato, T., et al., Accumulation of [11C]acetate in normal prostate and benign prostatic hyperplasia: comparison with prostate cancer. EurJ Nucl Med Mol Imaging, 2002. 29(11): p. 1492-5.
15. Oyama, N., et al., 11C-Acetate PET Imaging of Prostate Cancer: Detection of Recurrent Disease at PSA Relapse. J Nucl Med, 2003. 44(4): p. 549-555.
16. Sandblom, G., et al., Positron emission tomography with C11-acetate for tumor detection and localization in patients with prostate-specific antigen relapse after radical prostatectomy. Urology, 2006. 67(5): p. 996-1000.
17. Martarello, L., et al., Synthesis of syn- and anti-1-amino-3-[18F]fluoromethyl-cyclobutane-1-carboxylic acid (FMACBC), potential PET ligands for tumor detection. J Med Chem, 2002. 45(11): p. 2250-9.
18. McConathy, J., et al., Improved synthesis of anti-[18F]FACBC: improved preparation of labeling precursor and automated radiosynthesis. Appl Radiat Isot, 2003. 58(6): p. 657-66.
19. Okudaira, H., et al., Putative transport mechanism and intracellular fate of trans-1-amino-3-18F-fluorocyclobutanecarboxylic acidin human prostate cancer. J Nucl Med, 2011. 52(5): p. 822-9.
20. Shoup, T.M., et al., Synthesis and evaluation of [18F]1-amino-3-fluorocyclobutane-1-carboxylic acid to image brain tumors. J Nucl Med, 1999. 40(2): p. 331-8.
21. Yu, W., et al., Stereoselective synthesis and biological evaluation of syn-1-amino-3-[18F]fluorocyclobutyl-1-carboxylic acid as a potential positron emission tomography brain tumor imaging agent. Bioorg MedChem, 2009. 17(5): p. 1982-90.
22. Oka, S., et al., A preliminary study of anti-1-amino-3-18F-fluorocyclobutyl-1-carboxylic acid for the detection of prostate cancer. J Nucl Med, 2007. 48(1): p. 46-55.
23. Oka, S., et al., Transport mechanisms of trans-1-amino-3-fluoro[1-(14)C]cyclobutanecarboxylic acid in prostate cancer cells. Nucl Med Biol, 2011.
31

Draft Date: October 25, 2022 PET and SPECT/CT
24. Savir-Baruch, B., et al., Pilot Evaluation of Anti-1-amino-2-[(18)F] fluorocyclopentane-1-carboxylic acid (anti-2-[(18)F] FACPC) PET-CT in Recurrent Prostate Carcinoma. Mol Imaging Biol, 2011. 13(6): p. 1272-7.
25. Nye, J.A., et al., Biodistribution and radiation dosimetry of the synthetic nonmetabolized amino acid analogue anti-18F-FACBC in humans. J Nucl Med, 2007. 48(6): p. 1017-20.
26. Salskov, A., et al., FLT: measuring tumor cell proliferation in vivo with positron emission tomography and 3'-deoxy-3'-[18F]fluorothymidine. Semin Nucl Med, 2007. 37(6): p. 429-39.
27. Shields, A.F., et al., Imaging proliferation in vivo with [F-18]FLTand positron emission tomography. Nat Med, 1998. 4(11): p. 1334-6.
28. Toyohara, J., et al., Basis of FLT as a cell proliferation marker: comparative uptake studies with [H-3]thymidine and [H-3]arabinothymidine, and cell-analysis in 22 asynchronously growing tumor cell lines. Nuclear Medicine And Biology, 2002. 29(3):p. 281-287.
29. Vesselle, H., et al., In vivo validation of 3'deoxy-3'-[(18)F]fluorothymidine ([(18)F]FLT) as a proliferation imaging tracer in humans: correlation of [(18)F]FLT uptake by positron emission tomography with Ki-67 immunohistochemistry and flow cytometry in human lung tumors. Clin Cancer Res, 2002. 8(11): p. 3315-23.
30. Brockenbrough, J.S., et al., Tumor 3'-deoxy-3'-(18)F-fluorothymidine ((18)F-FLT) uptake by PET correlates with thymidine kinase1 expression: static and kinetic analysis of (18)F-FLT PET studies in lung tumors. J Nucl Med, 2011. 52(8): p. 1181-8.
31. Han, D., et al., Comparison of (18)F-Fluorothymidine and (18)F-Fluorodeoxyglucose PET/CT in Delineating Gross Tumor Volume by Optimal Threshold in Patients with Squamous Cell Carcinoma of Thoracic Esophagus. Int J Radiat Oncol Biol Phys, 2009.
32. van Waarde, A. and P.H. Elsinga, Proliferation markers for the differential diagnosis of tumor and inflammation. Curr Pharm Des, 2008. 14(31): p. 3326-339.
33. Kasper, B., et al., Functional diagnosis of residual lymphomas after radiochemotherapy with positron emission tomography comparing FDG- and FLT-PET. Leuk Lymphoma, 2007. 48(4): p. 746-53.
32

Draft Date: October 25, 2022 PET and SPECT/CT
34. Muzi, M., et al., Kinetic analysis of 3'-deoxy-3'-fluorothymidine PETstudies: validation studies in patients with lung cancer. J Nucl Med, 2005. 46(2): p. 274-82.
35. Vesselle, H., et al., Lung cancer proliferation correlates with [F-18]fluorodeoxyglucose uptake by positron emission tomography. Clin Cancer Res, 2000. 6(10): p. 3837-44.
36. Muzi, M., et al., Kinetic analysis of 3'-deoxy-3'-18F-fluorothymidine in patients with gliomas. J Nucl Med, 2006. 47(10): p. 1612-21.
37. Spence, A.M., et al., NCI-sponsored trial for the evaluation of safety and preliminary efficacy of FLT as a marker of proliferation in patients with recurrent gliomas: safety studies. Mol Imaging Biol, 2008. 10(5): p. 271-80.
38. Hoshikawa, H., et al., Comparison of FLT-PET and FDG-PET for visualization of head and neck squamous cell cancers. Mol Imaging Biol, 2011. 13(1): p. 172-7.
39. Menda, Y., et al., Kinetic analysis of 3'-deoxy-3'-(18)F-fluorothymidine ((18)F-FLT) in head and neck cancer patients before and early after initiation of chemoradiation therapy. J Nucl Med, 2009. 50(7): p. 1028-35.
40. Linecker, A., et al., Uptake of (18)F-FLT and (18)F-FDG in primary head and neck cancer correlates with survival. Nuklearmedizin-Nuclear Medicine, 2008. 47(2): p. 80-5; quiz N12.
41. Heidelberger, C., et al., Fluorinated Pyrimidines, a New Class of Tumour-Inhibitory Compounds. Nature, 1957. 179(4561): p. 663-666.
42. Seki, K., et al., A novel and efficient synthesis of [2-11C]5-fluorouracil for prognosis of cancer chemotherapy. J Pharm Pharm Sci, 2007. 10(2): p. 212-6.
43. Brix, G., et al., Assessment of the biodistribution and metabolismof 5-fluorouracil as monitored by F-19 MRI and F-18 PET: A comparative animal study. Journal of Nuclear Medicine, 1996. 37(5): p. 1116-1116.
44. Bading, J.R., et al., Kinetic modeling of 5-fluorouracil anabolismin colorectal adenocarcinoma: a positron emission tomography study in rats. Cancer Res, 2003. 63(13): p. 3667-74.
45. Dimitrakopoulou-Strauss, A., et al., Intravenous and intra-arterial oxygen-15-labeled water and fluorine-18-labeled fluorouracil in
33

Draft Date: October 25, 2022 PET and SPECT/CT
patients with liver metastases from colorectal carcinoma. J Nucl Med,1998. 39(3): p. 465-73.
46. Beumer, J.H., et al., Concentrations of the DNA methyltransferase inhibitor 5-fluoro-2'-deoxycytidine (FdCyd) and its cytotoxic metabolites in plasma of patients treated with FdCyd and tetrahydrouridine (THU). Cancer Chemother Pharmacol, 2008. 62(2): p. 363-8.
47. Newman, E.M. and D.V. Santi, Metabolism and mechanism of action of 5-fluorodeoxycytidine. Proc Natl Acad Sci U S A, 1982. 79(21): p. 6419-23.
48. Kreis, W., et al., Effect of tetrahydrouridine on the clinical pharmacology of 1-beta-D-arabinofuranosylcytosine when both drugs arecoinfused over three hours. Cancer Res, 1988. 48(5): p. 1337-42.
49. Pegram, M.D., G. Pauletti, and D.J. Slamon, HER-2/neu as a predictive marker of response to breast cancer therapy. Breast Cancer Res Treat, 1998. 52(1-3): p. 65-77.
50. Menard, S., et al., HER2 overexpression in various tumor types, focussing on its relationship to the development of invasive breast cancer.Annals of Oncology, 2001. 12: p. 15-19.
51. Kim, Y.S., et al., HER-2/neu overexpression as a poor prognostic factor for patients with metastatic breast cancer undergoing high-dose chemotherapy with autologous stem cell transplantation. Clinical Cancer Research, 2001. 7(12): p. 4008-4012.
52. Lohrisch, C. and M. Piccart, An overview of HER2. Seminars in Oncology, 2001. 28(6): p. 3-11.
53. Emens, L.A. and N.E. Davidson, Trastuzumab in breast cancer. Oncology-New York, 2004. 18(9): p. 1117-1128.
54. Chumsri, S., et al., Pathologic Complete Response to Preoperative Sequential Doxorubicin/Cyclophosphamide and Single-AgentTaxane With or Without Trastuzumab in Stage II/III HER2-Positive Breast Cancer. Clinical Breast Cancer, 2010. 10(1): p. 40-45.
55. Montemurro, F., et al., A phase II study of three-weekly docetaxeland weekly trastuzumab in HER2-overexpressing advanced breast cancer.Oncology, 2004. 66(1): p. 38-45.
56. Slamon, D. and M. Pegram, Rationale for trastuzumab (Herceptin) in adjuvant breast cancer trials. Seminars in Oncology, 2001. 28(1): p. 13-19.
34

Draft Date: October 25, 2022 PET and SPECT/CT
57. Cobleigh, M.A., et al., Multinational study of the efficacy and safety of humanized anti-HER2 monoclonal antibody in women who have HER2-overexpressing metastatic breast cancer that has progressed after chemotherapy for metastatic disease. Journal of Clinical Oncology, 1999. 17(9): p. 2639-2648.
58. Wilbur, D.S., et al., Synthesis and radiolabeling of a new biotin-CHX-A" derivative for use with In-111, Y-90 or Bi-213 in tumor pretargeting. Journal of Nuclear Medicine, 2000. 41(5): p.120p-120p.
59. Adams, G.P., et al., Alpha-emitting radioisotopes conjugated to anti-HER2/neu diabodies for the radioimmunotherapy of solid tumors. Abstracts of Papers of the American Chemical Society, 2003. 225: p. U265-U265.
60. Milenic, D.E., et al., alpha-particle radioimmunotherapy of disseminated peritoneal disease using a Pb-212-labeled radioimmunoconjugate targeting HER2. Cancer Biotherapy and Radiopharmaceuticals, 2005. 20(5): p. 557-568.
61. Chen, K.C., et al., Modeling recombinant immunotoxin efficacies in solid tumors. Ann Biomed Eng, 2008. 36(3): p. 486-512.
62. Hassan, R., et al., Phase I Clinical Trial of the Chimeric Anti-Mesothelin Monoclonal Antibody MORAb-009 in Patients with Mesothelin-Expressing Cancers. Clinical Cancer Research, 2010. 16(24):p. 6132-6138.
63. Shin, I.S., et al., Effect of chelator conjugation level and injection dose on tumor and organ uptake of In-111-labeled MORAb-009, an anti-mesothelin antibody. Nuclear Medicine and Biology, 2011. 38(8): p. 1119-1127.
35