
Quantitative Analysis of Myocardial Perfusion SPECT Anatomically Guided by Coregistered 64-Slice...
10
Quantitative Analysis of Myocardial Perfusion SPECT Anatomically Guided by Coregistered 64-Slice Coronary CT Angiography Piotr J. Slomka 1,2 , Victor Y. Cheng 1 , Damini Dey 1,2 , Jonghye Woo 1 , Amit Ramesh 1 , Serge Van Kriekinge 1,2 , Yasuzuki Suzuki 1 , Yaron Elad 3 , Ronald Karlsberg 3 , Daniel S. Berman 1,2 , and Guido Germano 1,2 1 Departments of Imaging and Medicine, Cedars-Sinai Medical Center, Los Angeles, California; 2 Department of Medicine, David Geffen School of Medicine at UCLA, Los Angeles, California; and 3 Cardiovascular Medical Group, Beverly Hills, California Sequential testing by coronary CT angiography (CTA) and myocardial perfusion SPECT (MPS) obtained on stand-alone scanners may be needed to diagnose coronary artery disease in equivocal cases. We have developed an automated technique for MPS–CTA registration and demonstrate its utility for im- proved MPS quantification by guiding the coregistered phys- iologic (MPS) with anatomic CTA information. Methods: Automated registration of MPS left ventricular (LV) surfaces with CTA coronary trees was accomplished by iterative mini- mization of voxel differences between presegmented CTA volumes and motion-frozen MPS data. Studies of 35 sequen- tial patients (26 men; mean age, 67 6 12 y) with 64-slice cor- onary CTA, MPS, and available results of the invasive coronary angiography performed within 3 mo were retrospec- tively analyzed. Three-dimensional coronary vessels and CTA slices were extracted and fused with quantitative MPS results mapped on LV surfaces and MPS coronary regions. Automat- ically coregistered CTA images and extracted trees were used to correct the MPS contours and to adjust the standard vascu- lar region definitions for MPS quantification. Results: Auto- mated coregistration of MPS and coronary CTA had the success rate of 96% as assessed visually; the average errors were 4.3 6 3.3 mm in translation and 1.5 6 2.6 degrees in ro- tation on stress and 4.2 6 3.1 mm in translation and 1.7 6 3.2 degrees in rotation on rest. MPS vascular region definition was adjusted in 17 studies, and LV contours were adjusted in 11 studies using coregistered CTA images as a guide. CTA-guided myocardial perfusion analysis, compared with standard MPS analysis, resulted in improved area under the receiver-operating-characteristic (ROC) curves for the detec- tion of right coronary artery (RCA) and left circumflex artery (LCX) lesions (0.84 6 0.08 vs. 0.70 6 0.11 for LCX, P 5 0.03, and 0.92 6 0.05 vs. 0.75 6 0.09 for RCA, P 5 0.02). Conclu- sion: Software image coregistration of stand-alone coronary CTA and MPS obtained on separate scanners can be per- formed rapidly and automatically, allowing CTA-guided con- tour and vascular territory adjustment on MPS for improved quantitative MPS analysis. Key Words: myocardial perfusion imaging; CT angiography; im- age registration; image fusion; coronary artery disease; image quantification; SPECT J Nucl Med 2009; 50:1621–1630 DOI: 10.2967/jnumed.109.063982 Recent advances in cardiac coronary CT angiography (CTA) have allowed the precise localization and classifi- cation of coronary artery plaques (1) and the depiction of coronary anatomy. At the same time, myocardial perfusion SPECT (MPS) continues to be a mainstream imaging modality for the detection and estimation of the severity of ischemia caused by coronary lesions. Although either CTA or MPS will frequently produce adequate diagnostic information for the referring physician, a subset of patients undergoes sequential testing by both modalities because of inconclusive results obtained by 1 of the tests (2,3). In such cases, imaging results are often challenging to interpret because of the presence of artifacts or equivocal findings in at least 1 modality. It has been suggested that the visual analysis of fused MPS and coronary CTA images can synergistically improve the diagnostic value of sequential combined imaging (4), and manual tools for the purpose of combined visual analysis have been developed (5). However, the need for the interactive alignment complicates clinical protocols, introduces manual steps, and reduces practical usability of such tools. Furthermore, current coronary CTA and MPS image fusion tools were proposed solely to improve sub- jective visual analysis and do not take advantage of the available CTA anatomic information, which can be used to refine quantitative MPS results. In this work, we aimed to develop a novel and practical tool for rapid automatic coregistration, visualization, and combined quantification of coronary CTA and MPS obtained from stand-alone scanners in different scanning sessions. Furthermore, we showed that coregistered MPS–CTA data can be used to improve quantitative MPS analysis. Received Mar. 6, 2009; revision accepted Jun. 23, 2009. For correspondence or reprints contact: Piotr Slomka, Cedars-Sinai Medical Center, Department of Imaging, #A047 8700 Beverly Blvd., Los Angeles, CA 90048. E-mail: [email protected] COPYRIGHT ª 2009 by the Society of Nuclear Medicine, Inc. FUSION OF CORONARY CTA AND CARDIAC SPECT • Slomka et al. 1621
-
Upload
independent -
Category
Documents
-
view
1 -
download
0
Transcript of Quantitative Analysis of Myocardial Perfusion SPECT Anatomically Guided by Coregistered 64-Slice...

Quantitative Analysis of Myocardial PerfusionSPECT Anatomically Guided by Coregistered64-Slice Coronary CT Angiography
Piotr J. Slomka1,2, Victor Y. Cheng1, Damini Dey1,2, Jonghye Woo1, Amit Ramesh1, Serge Van Kriekinge1,2,Yasuzuki Suzuki1, Yaron Elad3, Ronald Karlsberg3, Daniel S. Berman1,2, and Guido Germano1,2
1Departments of Imaging and Medicine, Cedars-Sinai Medical Center, Los Angeles, California; 2Department of Medicine,David Geffen School of Medicine at UCLA, Los Angeles, California; and 3Cardiovascular Medical Group, Beverly Hills, California
Sequential testing by coronary CT angiography (CTA) andmyocardial perfusion SPECT (MPS) obtained on stand-alonescanners may be needed to diagnose coronary artery diseasein equivocal cases. We have developed an automated techniquefor MPS–CTA registration and demonstrate its utility for im-proved MPS quantification by guiding the coregistered phys-iologic (MPS) with anatomic CTA information. Methods:Automated registration of MPS left ventricular (LV) surfaceswith CTA coronary trees was accomplished by iterative mini-mization of voxel differences between presegmented CTAvolumes and motion-frozen MPS data. Studies of 35 sequen-tial patients (26 men; mean age, 67 6 12 y) with 64-slice cor-onary CTA, MPS, and available results of the invasivecoronary angiography performed within 3 mo were retrospec-tively analyzed. Three-dimensional coronary vessels and CTAslices were extracted and fused with quantitative MPS resultsmapped on LV surfaces and MPS coronary regions. Automat-ically coregistered CTA images and extracted trees were usedto correct the MPS contours and to adjust the standard vascu-lar region definitions for MPS quantification. Results: Auto-mated coregistration of MPS and coronary CTA had thesuccess rate of 96% as assessed visually; the average errorswere 4.3 6 3.3 mm in translation and 1.5 6 2.6 degrees in ro-tation on stress and 4.2 6 3.1 mm in translation and 1.7 6 3.2degrees in rotation on rest. MPS vascular region definitionwas adjusted in 17 studies, and LV contours were adjustedin 11 studies using coregistered CTA images as a guide.CTA-guided myocardial perfusion analysis, compared withstandard MPS analysis, resulted in improved area under thereceiver-operating-characteristic (ROC) curves for the detec-tion of right coronary artery (RCA) and left circumflex artery(LCX) lesions (0.84 6 0.08 vs. 0.70 6 0.11 for LCX, P 5 0.03,and 0.92 6 0.05 vs. 0.75 6 0.09 for RCA, P 5 0.02). Conclu-sion: Software image coregistration of stand-alone coronaryCTA and MPS obtained on separate scanners can be per-formed rapidly and automatically, allowing CTA-guided con-tour and vascular territory adjustment on MPS for improvedquantitative MPS analysis.
Key Words: myocardial perfusion imaging; CT angiography; im-age registration; image fusion; coronary artery disease; imagequantification; SPECT
J Nucl Med 2009; 50:1621–1630DOI: 10.2967/jnumed.109.063982
Recent advances in cardiac coronary CT angiography(CTA) have allowed the precise localization and classifi-cation of coronary artery plaques (1) and the depiction ofcoronary anatomy. At the same time, myocardial perfusionSPECT (MPS) continues to be a mainstream imagingmodality for the detection and estimation of the severityof ischemia caused by coronary lesions. Although eitherCTA or MPS will frequently produce adequate diagnosticinformation for the referring physician, a subset of patientsundergoes sequential testing by both modalities because ofinconclusive results obtained by 1 of the tests (2,3). In suchcases, imaging results are often challenging to interpretbecause of the presence of artifacts or equivocal findings inat least 1 modality.
It has been suggested that the visual analysis of fusedMPS and coronary CTA images can synergistically improvethe diagnostic value of sequential combined imaging(4), and manual tools for the purpose of combined visualanalysis have been developed (5). However, the need forthe interactive alignment complicates clinical protocols,introduces manual steps, and reduces practical usability ofsuch tools. Furthermore, current coronary CTA and MPSimage fusion tools were proposed solely to improve sub-jective visual analysis and do not take advantage of theavailable CTA anatomic information, which can be used torefine quantitative MPS results.
In this work, we aimed to develop a novel and practicaltool for rapid automatic coregistration, visualization, andcombined quantification of coronary CTA and MPS obtainedfrom stand-alone scanners in different scanning sessions.Furthermore, we showed that coregistered MPS–CTA datacan be used to improve quantitative MPS analysis.
Received Mar. 6, 2009; revision accepted Jun. 23, 2009.For correspondence or reprints contact: Piotr Slomka, Cedars-Sinai
Medical Center, Department of Imaging, #A047 8700 Beverly Blvd., LosAngeles, CA 90048.
E-mail: [email protected] ª 2009 by the Society of Nuclear Medicine, Inc.
FUSION OF CORONARY CTA AND CARDIAC SPECT • Slomka et al. 1621
MATERIALS AND METHODS
Patient SelectionBetween October 2005 and May 2007, we identified retrospec-
tively 40 consecutive patients who underwent myocardial MPS,CTA, and invasive coronary angiography (ICA) within a 90-dperiod at Cedars-Sinai Medical Center (site A) or a neighboringoutpatient imaging center (Cardiovascular Medical Group) (siteB). The number of scans in which both CTA and MPS wereperformed was estimated at 5%210% of the MPS volume at bothsites, and requiring ICA results further reduced the eligiblepopulation in this study. For 2 patients, the relevant imaging datacould not be retrieved from the image archive, and these caseswere excluded. A total of 22 patients were imaged for theevaluation of symptoms (either chest pain or dyspnea; 8 had priormyocardial infarction). The remaining 16 patients were asymp-tomatic. The imaging indications were for post–myocardial in-farction (3 cases) or post–percutaneous coronary intervention (3cases) risk stratification and for risk stratification without priorevent (10 cases). Furthermore, 3 patients were excluded fromfurther analysis because of coronary artery bypass graft surgery,which would present difficulty in the assessment of whetherischemia would be expected in the distribution of bypassed vesselsin which regions subtended by proximal branch vessels may beischemic despite open grafts to the distal vessel. The remaining 35patients (26 men, 9 women; mean age, 67 6 12 y) were included inour analysis. In 5 cases, CTA and MPS were performed on the sameday; in 20 cases, CTA was performed after MPS (range, 1–49 d;median, 9 d); and in 10 cases, MPS was performed after CTA (range,1–73 d; median, 13 d). Table 1 contains patient characteristics. Thisstudy was approved by the Institutional Review Boards at Cedars-Sinai Medical Center and Cardiovascular Medical Group.
CT Image AcquisitionBecause the presence of coronary calcium can significantly affect
CTA image quality, CT unenhanced scans were obtained, andAgatston CT calcium scores were computed on a ScImage work-station (6,7) (site A) or with SmartScore software (AdvantageWorkstation; GE Healthcare) (site B). Coronary CTA was performedon the SOMATOM Definition dual-source CT (DSCT) scanner(Siemens Medical Systems) (site A) or LightSpeed VCT 64-sliceCT scanner (GE Healthcare) (site B). A prescan b-blockade, with atarget heart rate less than 60 beats/min for VCT and less than 70beats/min for DSCT, was performed, and an unenhanced coronarycalcium scan was obtained. Electrocardiogram (ECG)-gated helicalCTA was performed during a 9- to 12-s breath hold by power-injecting 90–100 mL of intravenous contrast. The following werescanning parameters: heart rate–dependent pitch; 0.33 s (DSCT) to
0.35 s (VCT) gantry rotation time; detector collimation, 0.625 mm;tube voltage, 120 kVp; and tube current, 300–700 mAs. ECG-baseddose modulation 40%280% of the cardiac cycle was used to limitradiation dose.
Coronary CTA Image ReconstructionRetrospectively gated reconstruction of raw CTA data was
performed at 40%280% of the R-R interval using the followingparameters: 0.6- to 0.75-mm slice thickness, 250-mm field ofview, and 512 · 512 matrix. Coronary arterial trees were extractedfrom the best-quality phase using vendors’ software and trans-ferred to a Windows workstation for MPS–CTA fusion.
CTA Image EvaluationCoronary visual analysis was performed with Circulation soft-
ware packages (Siemens Medical Systems) and an AdvantageWorkstation (version 7.1; GE Healthcare). An experienced clinicalcoronary CTA reader (with .300 previous coronary CTA inter-pretations), unaware of MPS and ICA results, assessed all coro-nary segments greater than or equal to 1.5 mm in diameter byevaluating standard axial images, oblique multiplanar reforma-tions, oblique maximum-intensity projections, or centerline-basedcurved multiplanar reformations (8). Each segment was visuallyevaluated for the presence and degree of stenosis. Any stenosisnarrowing the luminal diameter by at least 50% or at least 70%was recorded. If a segment could not be assessed because ofartifacts, no stenosis was recorded.
ICA Image Acquisition and EvaluationICA was performed with a standard catheterization technique.
All ICA acquisitions used the same iodinated contrast (Visipaque;GE Healthcare). After ICA, a clinical interventional cardiologist,unaware of coronary CTA and MPS results, evaluated acquiredimages on an offline display station. For each coronary segmentgreater than or equal to 1.5 mm in diameter, this cardiologistdetermined by visual inspection whether luminal diameter nar-rowing $50% or $70% was present. For the purposes of com-parison with MPS and CTA data, left main stenosis $50% wasconsidered as significant for the left anterior descending artery andleft circumflex artery (LCX) territories; the ramus intermediusvessel, if present, was assigned to the LCX territory. Angiographicfindings are presented in Table 2.
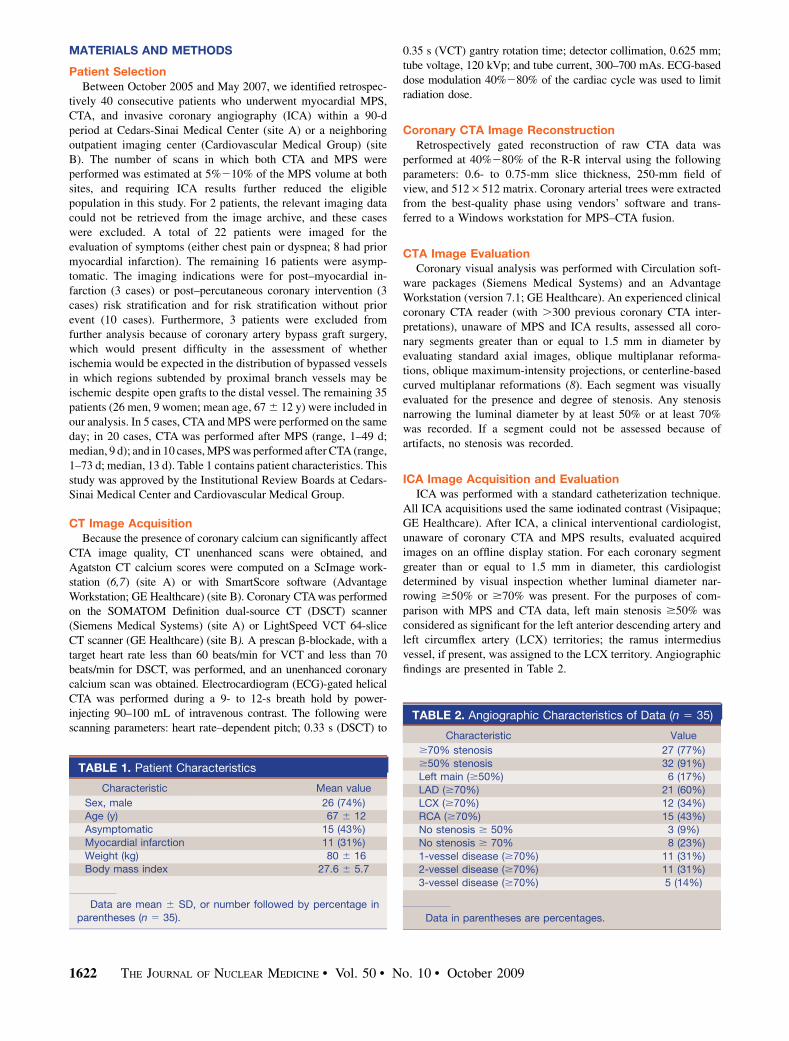
TABLE 1. Patient Characteristics
Characteristic Mean value
Sex, male 26 (74%)Age (y) 67 6 12
Asymptomatic 15 (43%)
Myocardial infarction 11 (31%)
Weight (kg) 80 6 16Body mass index 27.6 6 5.7
Data are mean 6 SD, or number followed by percentage in
parentheses (n 5 35).
TABLE 2. Angiographic Characteristics of Data (n 5 35)
Characteristic Value
$70% stenosis 27 (77%)
$50% stenosis 32 (91%)Left main ($50%) 6 (17%)
LAD ($70%) 21 (60%)
LCX ($70%) 12 (34%)
RCA ($70%) 15 (43%)No stenosis $ 50% 3 (9%)
No stenosis $ 70% 8 (23%)
1-vessel disease ($70%) 11 (31%)2-vessel disease ($70%) 11 (31%)
3-vessel disease ($70%) 5 (14%)
Data in parentheses are percentages.
1622 THE JOURNAL OF NUCLEAR MEDICINE • Vol. 50 • No. 10 • October 2009

MPS ProtocolStudies were performed at the 2 participating sites with the
same dual-isotope (thallium–technetium) protocol previously de-scribed (9). MPS acquisitions were performed with noncircularorbits, obtaining 64 projections over 180� (45� right anterioroblique to 45� left posterior oblique). Images were acquired onPhilips CardioMD, Philips Forte, and Siemens e.cam cameras in1- or 2-d protocols. A stress scan was obtained with exercise, anadenosine injection, or an adenosine–walk protocol (10). All imageswere subject to standard clinical quality control measures, and allwere reconstructed at site B. No attenuation or scatter correction wasused. Gated images were reconstructed with filtered backprojectionand a Butterworth filter (cutoff, 0.83 cycles/cm; order, 5) to theoriginal transverse orientation. Patients from site A had 16-framegated MPS, and patients from site B had 8-frame gated MPS.
Image ProcessingAn overview of image processing is presented in Figure 1.Motion-Frozen Processing. Gated images were processed with
a motion-frozen algorithm as previously described (11) to providestatic MPS images in end-diastolic (ED) phase to match the diastoliccardiac phase of coronary CTA. Briefly, in the motion-frozentechnique, derived left ventricular (LV) contours (12–14) are usedin combination with a thin-plate spline image warping (15,16).
Automated Registration. The primary difficulty in accurateregistration of MPS with coronary CTA is that different anatomicfeatures appear on these images. Therefore, standard automatedregistration procedures (17) are prone to large errors. In particular,there could be severe perfusion defects present on MPS imagesthat are not visualized in the myocardium on the CTA scan, whichcan present difficulties for generic registration algorithms. Toprovide a robust registration approach, we registered preseg-mented MPS volumes using the LV segmentation algorithm ofquantitative gated SPECT (14) and the additional segmentation ofthe blood-pool region, derived from the MPS LV definition. Inaddition, to match cardiac phases between MPS and coronaryCTA, we aligned coronary CTA–reconstructed slices in diastolicphases with segmented motion-frozen slices of SPECT createdfrom gated images. For both CTA and MPS, transverse imageorientation was used during the registration process.
The MPS–CTA registration algorithm was implemented asfollows. We initially aligned the center of mass of the segmentedleft ventricle on MPS with the geometric center of the recon-structed coronary CTA image domain. Subsequently, we performed
iterative registration between CTA and segmented (LV, blood-pool)MPS images to find the transformation T that maps the sourcevolume J (CTA) into correspondence with target volume I (MPS).We considered 6 rigid-body parameters for the MPS–CTA regis-tration, assuming the cardiac phases are matched. SI was thesegmented MPS volume, which consisted of blood-pool, wall, andbackground regions. We used the sum of squared differences as asimilarity measure and replaced the original MPS intensities withpreassigned values for the blood pool, myocardium, and surround-ing structures, which are derived from average Hounsfield unitvalues recorded by CTA in these regions. The proposed registra-tion cost function E is given by
Eðx; TðxÞÞ 5
ZV
ðSIðx 1 TðxÞÞ 2 J � GsðxÞÞ2dx;
where * denotes the convolution operator, Gs is gaussian kernelwith SD s, and V is the image volume. We applied gaussianfiltering (with 3-mm kernel) to the CTA volume to suppress noiseand match image resolution to MPS. To minimize the costfunction, we used iterative gradient descent and used a coarse-to-fine multiresolution scheme (3 levels) that helped to avoid localminima while achieving computational efficiency and robustness.We used the Insight Toolkit registration libraries (18) for theimplementation of the iterative registration. All algorithms wereimplemented in C11.
Validation of Automatic Registration. The automatic registra-tion algorithm was assessed qualitatively and quantitatively for all35 cases (total of 70 stress and rest datasets). Quantitative erroranalysis was performed by comparison to the expert manualalignment. The manual alignment parameters (3 translations and3 rotations) were recorded for the comparison with the automatedregistration. Visual alignment was performed without knowledgeof the automatic results.
Vessel Extraction and 3-Dimensional (3D) Visualization. Forthe 3D visualization of coronary vessels superimposed with MPSsurfaces, we used the processing information obtained fromcoronary CTA analysis on the vendors’ workstation. Subsequently,volume rendering was performed in OpenGL with 2-dimensional/3D textures and preassigned color tables with varying red-green-blue intensities and opacities to maximize the contrast opacity,provide realistic display (blood/tissue, pink/red; calcium, white),and minimize the influence of neighboring tissue such as fat(19).
FIGURE 1. Overview of image pro-cessing. CCTA 5 coronary CTA.
FUSION OF CORONARY CTA AND CARDIAC SPECT • Slomka et al. 1623

Segmented CTA voxel maps could then be directly rendered in3 dimensions with OpenGL methods within quantitative perfusionSPECT (QPS) and within the same coordinates as the epicardial3D surface display with overlaid MPS function and perfusioninformation. We used a level-of-detail rendering technique: ahigh-resolution image for final static display and a lower resolu-tion during the user interaction and manipulation. In both cases, a3D bounding box was used to speed up the volume rendering ofcoronary arteries. The bounding box was directly computed fromthe coronary mask or from the coronary tree coordinates. Therendering was integrated with the standard 3D MPS epicardialsurfaces. Raw perfusion information of quantitative blackout mapscould be displayed on the epicardial surface. Stress and restimages had the same coronary CTA image superimposed. Thesesegmented coronary trees derived from CTA were used only fordisplay purposes and were not used in any way during the imageregistration process. The image registration algorithm was basedon only the original transverse datasets.
CTA-Guided MPS Contour and Territory Adjustment. Fusedcoronary CTA and MPS images were evaluated with overlaidcontours in multiplanar orientations (both cardiac axis and or-thogonal views) in the fusion page of the QPS program. Ifdiscrepancies between the MPS valve plane position and thelocation on CTA could be seen on the fused images, the contourwas manually adjusted in the standard Manual QPS page withMask and Constrain options; subsequently, a new contour wasverified by the CTA fusion. Next, the default vascular territoryboundaries were overlaid with the 3D LV MPS surfaces, withcolor-coded perfusion information and with a coregistered vol-ume-rendered segmented 3D coronary tree as described above.Vascular territories could then be adjusted segment by segment(based on a 17-segment American Heart Association model),using anatomic information provided by the coronary CTA. IfMPS contours or vascular territories needed to be adjusted on thebasis of the comparison with CTA, the quantitative MPS analysiswas repeated with modified contours and territories.
MPS perfusion analysis was performed individually for eachvessel with the Group function in QPS, in which 17 segments areassigned to a vascular territory on the basis of the perfusion-defectpattern (20,21). The portion of the total perfusion deficit (TPD)corresponding to a given territory was used for the automatedquantification in each vessel, with the threshold of 2% as previ-ously established (21). The MPS quantification results wererecorded before and after adjustments based on the fused coronarydata.
Statistical AnalysisAll continuous variables are expressed as mean 6 SD. Paired
t tests were used to compare differences in paired continuous data,and McNemar tests were used to compare differences in paireddiscrete data. For unpaired continuous data, 1-way ANOVA wasused. All statistical tests were 2-tailed, and a P value of less than0.05 was considered significant. Receiver-operating-characteristic(ROC) curves were constructed and compared using the Analyze-It 2.09 software, which implemented the Delong–Delong methodfor ROC comparisons (22).
RESULTS
Of 35 cases with all 3 scans (CTA, MPS, and ICA)available, 20 patients underwent CTA after MPS and 15
underwent MPS after CTA. In cases in which CTA wasperformed after MPS, 11 had equivocal reversible defectson visual evaluation of MPS (interpreted as probablynormal, borderline, or probably abnormal), and 9 werereferred for CTA because the caretaking physician believeddefects seen on MPS were discordant with the patient’sclinical status or suspected multivessel disease. In cases inwhich patients underwent MPS after CTA, 7 had at least1 nondiagnostic major coronary segment on CTA, and 4had maximal luminal stenosis in the LAD estimated at 50%and considered of borderline significance. Additionally, 4patients were referred for MPS after CTA because thephysician requested an assessment of hypoperfusion.
Baseline Findings
In the 35 cases studied, the unenhanced CT calciumscore was available in 33 cases. In these cases, the averagewas 942 6 1,530 (range, 0–7,781). Heavy calcification(score . 500) was present in 15 of 33 datasets. In addition,10 cases demonstrated motion artifacts on CTA. Interpre-tation difficulties were noted in 9 cases. The presence ofsignificant CT disease was noted in 27 of 35 studies, with 6LCX lesions, 11 right coronary artery (RCA) lesions, 21LAD lesions, and 2 left main lesions.
MPS ejection fractions were 57.4% 6 14% (range,32%283%) on stress and 57.2% 6 14 (range, 25%283%)on rest. Transischemic dilation was 1.15 6 0.14 (range,0.96–1.4). Visually, MPS findings were assessed as normal in3 cases, as probably normal in 3 cases, borderline in 6 cases,probably abnormal in 1 case, and abnormal in 22 cases.Quantitatively, TPD was 16.5% 6 12.7% on stress (range,0%244%) and 5.6% 6 8.1% on rest (range, 0%225%).
Registration Algorithm
The execution speed of automated registration was ap-proximately 1–2 s per study on a 3.0-GHz Pentium (Intel)dual-core computer. The automatic volume registration ofmotion-frozen MPS with CTA was successful in 33 of 35stress and 34 of 35 rest studies as assessed qualitatively,with an overall success rate of 96%. In 1 patient, because ofthe unusually high blood-pool contrast intensity on coro-nary CTA, registration failed for both stress and reststudies; the error occurred because of inadequate matchingof assigned blood-pool contrast with the actual CT value inthe blood-pool region. All 3 failed cases were women withsmall hearts (motion-frozen stress diastolic volumes, 29–52mL on MPS). These results were easily corrected by inter-active alignment. The quantitative registration errors ob-tained by comparison with the expert observer alignment areshown in Table 3. There were no significant differencesbetween errors in different directions or between studiesfrom 2 different systems. The errors ranged from 0 to 10 mm.Figure 2 shows an example of the fused images obtained bythe automated coregistration of MPS with CTA.
1624 THE JOURNAL OF NUCLEAR MEDICINE • Vol. 50 • No. 10 • October 2009

Contour and Territory Adjustments
MPS vascular region definitions were adjusted in 17studies, and LV contours (valve plane location) were adjustedin 11 studies using coregistered coronary CTA images as aguide. The territory adjustment modified perfusion results fora specific vessel but not the overall perfusion deficit per study.The MPS contour adjustment modified overall TPD perfu-sion results in 7 of 35 (20%) of the cases by more than 2%.The territory adjustments modified perfusion in a specificvessel but did not change the global perfusion measure perstudy.
Combined Performance for Coronary Artery Disease(CAD) Detection
The areas under the ROC curve for the detection ofdisease in specific vessels are shown in Table 4, andcorresponding ROC curves are shown in Figure 3. Sensi-tivities and specificities for the detection of disease in LAD,LCX, and LAD arteries were 67% and 50%, 67% and 83%,and 67% and 60%, respectively, for MPS and 76% and71%, 75% and 100%, and 87% and 85%, respectively, forCTA-guided MPS (P 5 0.025 for RCA). CTA-guided MPS
analysis correctly identified 17 of 21 LAD, 9 of 12 LCX,and 13 of 15 RCA lesions corresponding to $70% stenosison invasive angiography, compared with 17 of 21, 6 of 12,and 10 of 15, respectively, by CTA alone and with 14 of 21,8 of 12, and 10 of 15, respectively, by MPS quantificationunaided by CTA. If a simple either/or (CTA or CTA-guidedMPS) positive criterion was applied for the detection ofsignificant disease, the number of detected lesions in-creased to 19 of 21 for LAD, to 10 of 12 for LCX, andto 13 to 15 for RCA. Anatomic CTA-guided MPS reducedthe number of discordant cases between CTA and quanti-tative MPS from 12 to 9 for LAD, from 8 to 5 for LCX, andfrom 12 to 6 for RCA. CTA-guided MPS agreed withangiography in 4 of 9 discordant cases for LAD, 4 of 5cases for LCX, and 3 of 6 for RCA.
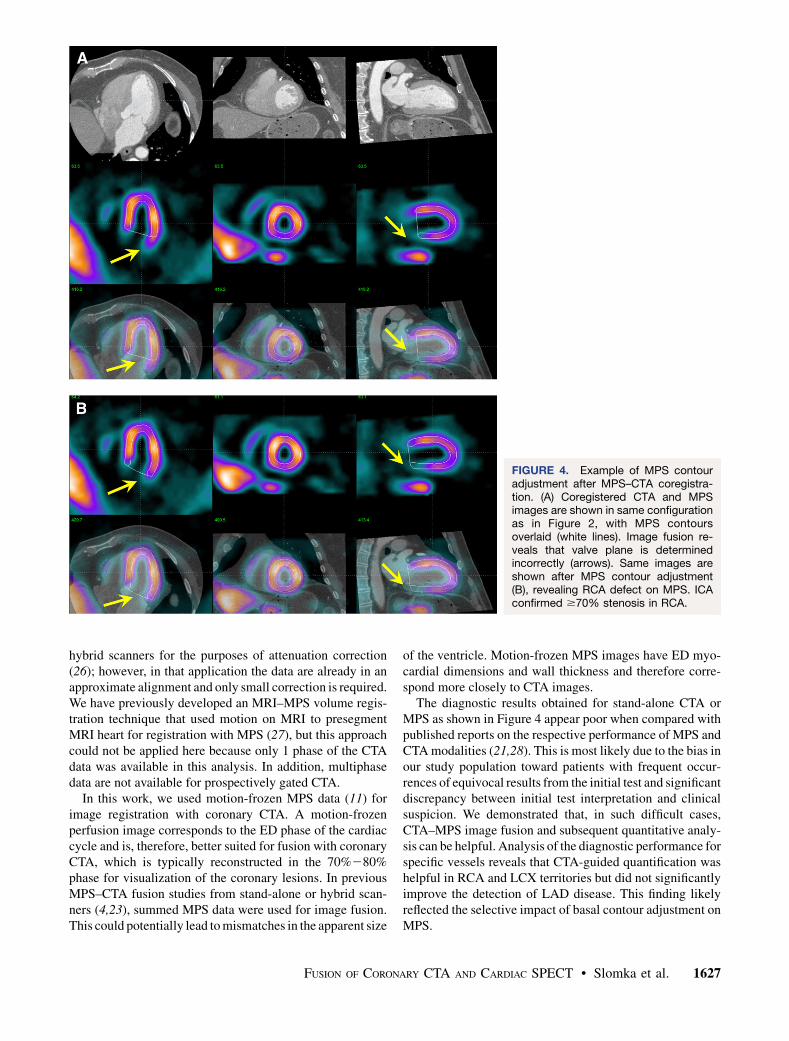
In Figure 4, we show an example of MPS contouradjustment (valve plane position) based on MPS fusion.In Figure 5, we demonstrate an example of contouradjustment and territory adjustment, which was performedafter visual inspection of coregistered MPS–CTA imagesand quantitative MPS results obtained before and afterthese adjustments.
TABLE 3. Accuracy of Automated Alignment of SPECT and Coronary CTA for Translations and Rotations
Study
Translations (mm) Rotations (degrees)
x y z xy xz yz
Rest 4.1 6 3.5 4.0 6 3.6 3.0 6 2.5 2.4 6 3.5 1.4 6 3.3 1.3 6 2.6
Stress 4.4 6 3.3 4.4 6 3.4 3.4 6 2.4 2.3 6 3.3 1.2 6 3.0 1.7 6 3.2
Data are mean 6 SD (n 5 35 for each rest and stress).
FIGURE 2. Automated volume align-ment of CTA and MPS. Rows from topto bottom show in multiplanar orienta-tions original CTA images (A), originalMPS images (B), fused unregisteredMPS and CTA images (C), and sameimages after automated volume regis-tration (D). Subsequently, 3D transfor-mation parameters obtained fromvolume registration can be used to alignassociated coronary trees with MPSsurfaces.
FUSION OF CORONARY CTA AND CARDIAC SPECT • Slomka et al. 1625

DISCUSSION
Software image fusion of coronary CTA and MPS has beenproposed before to improve visual analysis of combined datafrom separate (4,5) or hybrid scanners (23). Our workintroduces several novel technical concepts related to thisapplication, namely fully automatic registration, the im-provement of MPS quantification based on coregisteredCTA, and the use of motion-frozen MPS data. We demon-strated that accurate and robust automatic image registrationof motion-frozen MPS and coronary CTA can be performedfor data obtained on stand-alone scanners in as short as 1–2 s,with a success rate of 96%. Previous studies of MPS–coronary CTA fusion required manual alignment of theimage data (4,5); it is likely that the automatic registrationwill allow MPS–CTA cardiac fusion in clinical practicewhenever both datasets are available. We demonstrated thatMPS contours—specifically the mitral valve plane posi-tion—can be adjusted on the basis of the CTA anatomicvolume data. Furthermore, we showed that the computerizedMPS vascular region definitions can be modified on the basisof coregistered coronary CTA anatomy; subsequently, thequantitative results can be reassigned to the correct territo-ries, resulting in improved diagnostic performance, espe-cially for LCX and RCA lesions.
A previous report of the clinical application of CTA–MPS image fusion, compared with side-by-side analysis of
stand-alone CTA and MPS, demonstrated that the correla-tion of stenosed segments with perfusion lesions allowedthe significant reduction of equivocal findings (4). In ourwork, we show that CT-guided adjustment of contours andterritories on MPS after image coregistration increases thediagnostic performance (area under the ROC curves) for thedetection of coronary disease. Overall accuracy may beimproved further by a combined visual analysis schemethat takes into account the relative size and the severity ofthe stenosis and the presence of artifacts on either of the 2scans in a given location. When stand-alone CTA or MPS isinsufficient to diagnose or localize CAD, CTA-guided MPSquantification can have an important role in increasingoverall accuracy by lowering the number of discrepantfindings. Because we studied a biased population with ahigh prevalence of equivocal results on the initial imagingtest, we expect that most of the general MPS populationwill not significantly benefit from CTA-mediated contourand territory adjustments of MPS.
Although the automatic coregistration designed for coro-nary CTA and MPS volumes and CTA-guided MPS analysishave not been previously proposed, some related work hasbeen reported. Faber et al. (24) developed a method ofregistration of 3D coronary anatomy reconstructed frominvasive coronary angiography with MPS surfaces (24).They used a surface-to-point matching technique (25), whichwas modified to use coronary vessel information. Conceiv-ably, such a registration approach could also be applied to thecoronary CTA data; however, several of the arteries (RCA,left main) can be positioned some distance away from themyocardium, compromising the robustness of this approach.Furthermore, errors or branch omissions during vessel ex-traction could cause misregistration of the data. The use ofvolume data in our approach has the added advantage ofallowing MPS contour verification by anatomic CTAvolume(Fig. 5), which would not be possible when only coronarytree data are coregistered. Others have previously proposedregistration of MPS and unenhanced CT data obtained by
TABLE 4. Areas Under ROC Curves for Detection ofCAD ($70% Luminal Stenosis) in Individual Vessels
Areas underROC curve LAD LCX RCA
MPS 0.74 6 0.08 0.70 6 0.11 0.75 6 0.09CTA 0.76 6 0.09 0.75 6 0.09 0.81 6 0.07
CTA-guided
MPS
0.78 6 0.08 0.84 6 0.08* 0.92 6 0.05*
*Significantly different from MPS.
FIGURE 3. ROC curves for disease detection in individual vessels by partial TPD per vessel in stand-alone MPS (blue) andCTA-guided MPS (pink) for LAD (left), LCX (middle), and RCA (right) vascular territories. CTA-guided MPS significantly differentfrom stand-alone MPS.
1626 THE JOURNAL OF NUCLEAR MEDICINE • Vol. 50 • No. 10 • October 2009
hybrid scanners for the purposes of attenuation correction(26); however, in that application the data are already in anapproximate alignment and only small correction is required.We have previously developed an MRI–MPS volume regis-tration technique that used motion on MRI to presegmentMRI heart for registration with MPS (27), but this approachcould not be applied here because only 1 phase of the CTAdata was available in this analysis. In addition, multiphasedata are not available for prospectively gated CTA.
In this work, we used motion-frozen MPS data (11) forimage registration with coronary CTA. A motion-frozenperfusion image corresponds to the ED phase of the cardiaccycle and is, therefore, better suited for fusion with coronaryCTA, which is typically reconstructed in the 70%280%phase for visualization of the coronary lesions. In previousMPS–CTA fusion studies from stand-alone or hybrid scan-ners (4,23), summed MPS data were used for image fusion.This could potentially lead to mismatches in the apparent size
of the ventricle. Motion-frozen MPS images have ED myo-cardial dimensions and wall thickness and therefore corre-spond more closely to CTA images.
The diagnostic results obtained for stand-alone CTA orMPS as shown in Figure 4 appear poor when compared withpublished reports on the respective performance of MPS andCTA modalities (21,28). This is most likely due to the bias inour study population toward patients with frequent occur-rences of equivocal results from the initial test and significantdiscrepancy between initial test interpretation and clinicalsuspicion. We demonstrated that, in such difficult cases,CTA–MPS image fusion and subsequent quantitative analy-sis can be helpful. Analysis of the diagnostic performance forspecific vessels reveals that CTA-guided quantification washelpful in RCA and LCX territories but did not significantlyimprove the detection of LAD disease. This finding likelyreflected the selective impact of basal contour adjustment onMPS.
FIGURE 4. Example of MPS contouradjustment after MPS–CTA coregistra-tion. (A) Coregistered CTA and MPSimages are shown in same configurationas in Figure 2, with MPS contoursoverlaid (white lines). Image fusion re-veals that valve plane is determinedincorrectly (arrows). Same images areshown after MPS contour adjustment(B), revealing RCA defect on MPS. ICAconfirmed $70% stenosis in RCA.
FUSION OF CORONARY CTA AND CARDIAC SPECT • Slomka et al. 1627

This study analyzed the MPS–CTA data obtained by stand-alone scanners in 2 separate imaging sessions. Hybrid MPS–coronary CTA (23) or PET–coronary CTA imaging (29)performed in 1 session has been proposed for PET/CT scan-ners equipped with multislice CT. However, although hybriddual-modality imaging has been established in oncology (30),it is not used routinely in cardiac imaging because of thedifficulty in predicting a priori which patients would benefitfrom such combined examination (31). Instead, a sequentialapproach is often applied in clinical practice, with additionalscans (CTA or MPS) performed only if the results of the initialmodality are equivocal—as was the situation in our retrospec-tive analysis. In addition, even if MPS–CTA scans are obtainedon a hybrid scanner, with data from both modalities in similar
anatomic positions, software coregistration is still requiredbecause of mismatches in the respiratory phases (23). Becausesoftware registration can reliably bring MPS and CTA dataacquired on different scanners into appropriate alignment asdemonstrated in this work, the most practical approach foroverall clinical effectiveness and the minimization of the costand radiation dose may be the sequential scanning as presentedhere, facilitated by software tools for automatic image regis-tration and combined image analysis.
Mean estimated radiation dose from the CT (CTA andcoronary calcium scoring scan) was 19.7 mSv. For the dual-isotope stress–rest MPS scans, the estimated radiation dosehas been reported to be 24 mSv for injected radiopharma-ceutical activity similar to our protocol (32). The 2 scans
FIGURE 5. Example of MPS contour and territory adjustment based on CTA in 72-y-old male patient. Original coronary CTAimages (A) were interpreted to show nonsignificant, ,50% proximal RCA lesion and significant LAD lesion. CTA and MPSimages were coregistered and indicated need for contour adjustment (as shown in Fig. 4). Quantification after contouradjustment reveals 3% defect in typical RCA territory (yellow arrow) and defect between LAD and LCX (red arrow) (B). Afteradjustments of coronary territory on the basis of superimposed CTA coronary tree, MPS lesion is assigned to LAD (C). ICArevealed 50%269% RCA lesion and 90% LAD lesion. In this case, CTA-guided analysis allowed identification of additional RCAlesion in MPS and reassignment of second defect from LAD/LCX to LAD.
1628 THE JOURNAL OF NUCLEAR MEDICINE • Vol. 50 • No. 10 • October 2009

were not obtained at the same time. Imaging teams at bothsites have significantly reduced coronary CTA radiationdose by acquiring with prospective ECG gating whenpossible (33,34) and using a patient-specific algorithm toselect the optimal dose-lowering combination for retro-spectively gated acquisitions, with a resulting mean esti-mated CTA radiation dose of 2–5.8 mSv for prospectivegating and 8 mSv for retrospective gating (33–35). Addi-tionally, we have changed our standard MPS protocol to99mTc-sestamibi for both stress and rest (estimated radia-tion dose for this protocol, 10 mSv) (32). Thus, it ispossible to perform a combined CTA and MPS study withthe total dose less than 20 mSv, even with CTA retrospec-tive gating. It should be emphasized that patients underwenteither coronary CTA or stress–rest MPS first and onlyproceeded with dual scanning because of equivocal findingsin the first scan or discrepancy between scan results andclinician assessment of patient status (typically in ,10% ofthe total patient population).
This study has several limitations. Although we providedfully automated quantitative analysis and automated imageregistration, the contour definitions and vascular territorywere manually guided by the coregistered CTA anatomy;however, it is feasible that this adjustment can be auto-mated in the future if automatic segmentation of CTA scanis performed. The success of registration depends onsuccessful MPS contour determination. If the contours areincorrectly determined, causing the LV shape to be grosslydistorted, the automatic registration could fail. We per-formed the analysis in a retrospective fashion, and thereforedata selection was biased by clinical conditions that led toperformance of invasive angiography, MPS, and CTA,which occurs in a minority of patients undergoing evalu-ation for CAD. However, these data likely represent typicalcases in which the CTA-guided MPS quantification couldbe clinically useful.
CONCLUSION
Software coregistration of coronary CTA and MPS im-ages obtained on separate scanners can be acquired rapidlyand automatically, allowing CTA-guided contour and vas-cular territory adjustment on MPS for improved quantita-tive MPS analysis.
ACKNOWLEDGMENTS
Cedars-Sinai Medical Center receives or may receiveroyalties for the licensure of software, including softwarefor quantitative assessment of myocardial perfusion and forMPS CT fusion, a portion of which is distributed to some ofthe authors of this manuscript.
REFERENCES
1. Leber AW, Becker A, Knez A, et al. Accuracy of 64-slice computed tomography
to classify and quantify plaque volumes in the proximal coronary system: a
comparative study using intravascular ultrasound. J Am Coll Cardiol. 2006;47:
672–677.
2. Berman DS, Hachamovitch R, Shaw LJ, et al. Roles of nuclear cardiology,
cardiac computed tomography, and cardiac magnetic resonance: assessment of
patients with suspected coronary artery disease. J Nucl Med. 2006;47:74–82.
3. Hendel R, Patel M, Kramer C, et al. Appropriateness criteria for cardiac
computed tomography and cardiac magnetic resonance imaging. J Am Coll
Cardiol. 2006;48:1475–1497.
4. Gaemperli O, Schepis T, Valenta I, et al. Cardiac image fusion from stand-alone
SPECT and CT: clinical experience. J Nucl Med. 2007;48:696–703.
5. Gaemperli O, Schepis T, Kalff V, et al. Validation of a new cardiac image fusion
software for three-dimensional integration of myocardial perfusion SPECT and
stand-alone 64-slice CT angiography. Eur J Nucl Med Mol Imaging. 2007;34:
1097–1106.
6. Agatston AS, Janowitz WR, Hildner FJ, Zusmer NR, Viamonte M, Detrano R.
Quantification of coronary artery calcium using ultrafast computed tomography.
J Am Coll Cardiol. 1990;15:827–832.
7. Berman DS, Wong ND, Gransar H, et al. Relationship between stress-induced
myocardial ischemia and atherosclerosis measured by coronary calcium tomog-
raphy. J Am Coll Cardiol. 2004;44:923–930.
8. Ferencik M, Ropers D, Abbara S, et al. Diagnostic accuracy of image
postprocessing methods for the detection of coronary artery stenoses by using
multidetector CT. Radiology. 2007;243:696–702.
9. Berman DS, Kiat H, Friedman JD, et al. Separate acquisition rest thallium-201/
stress technetium-99m sestamibi dual-isotope myocardial perfusion single-
photon emission computed tomography: a clinical validation study. J Am Coll
Cardiol. 1993;22:1455–1464.
10. Berman DS, Kang X, Hayes SW, et al. Adenosine myocardial perfusion single-
photon emission computed tomography in women compared with men: impact
of diabetes mellitus on incremental prognostic value and effect on patient
management. J Am Coll Cardiol. 2003;41:1125–1133.
11. Slomka PJ, Nishina H, Berman DS, et al. ‘‘Motion-frozen’’ display and
quantification of myocardial perfusion. J Nucl Med. 2004;45:1128–1134.
12. Germano G, Kavanagh PB, Berman DS. An automatic approach to the analysis,
quantitation and review of perfusion and function from myocardial perfusion
SPECT images. Int J Card Imaging. 1997;13:337–346.
13. Germano G, Erel J, Lewin H, Kavanagh PB, Berman DS. Automatic quantitation
of regional myocardial wall motion and thickening from gated technetium-99m
sestamibi myocardial perfusion single-photon emission computed tomography.
J Am Coll Cardiol. 1997;30:1360–1367.
14. Germano G, Kiat H, Kavanagh PB, et al. Automatic quantification of ejection
fraction from gated myocardial perfusion SPECT. J Nucl Med. 1995;36:
2138–2147.
15. Bookstein FL. Principal warps: thin-plate splines and the decomposition of
deformations. IEEE Trans Pattern Anal Machine Intell. 1989;11:567–585.
16. Slomka PJ, Dey D, Przetak C, Aladl UE, Baum RP. Automated 3-dimensional
registration of stand-alone 18F-FDG whole-body PET with CT. J Nucl Med.
2003;44:1156–1167.
17. Viola P, Wells WM. Alignment by maximization of mutual information. Int J
Comput Vis. 1997;24:137–154.
18. Ibanez L, Schroeder W, Ng L, Cates J. The ITK Software Guide. Kitware; 2003.
Available at: http://www.itk.org/ItkSoftwareGuide.pdf. Accessed July 28, 2009.
19. Levin D, Aladl UE, Germano G, Slomka P. Techniques for efficient, real-time,
3D visualization of multimodality cardiac data using consumer graphics
hardware. Comput Med Imaging Graph. 2004;28:471–483.
20. Sharir T, Germano G, Waechter PB, et al. A new algorithm for the quantitation of
myocardial perfusion SPECT. II: validation and diagnostic yield. J Nucl Med.
2000;41:720–727.
21. Slomka PJ, Nishina H, Berman DS, et al. Automated quantification of
myocardial perfusion SPECT using simplified normal limits. J Nucl Cardiol.
2005;12:66–77.
22. DeLong ER, DeLong DM, Clarke-Pearson DL. Comparing the areas under two
or more correlated receiver operating characteristic curves: a nonparametric
approach. Biometrics. 1988;44:837–845.
23. Rispler S, Keidar Z, Ghersin E, et al. Integrated single-photon emission
computed tomography and computed tomography coronary angiography for the
assessment of hemodynamically significant coronary artery lesions. J Am Coll
Cardiol. 2007;49:1059–1067.
24. Faber TL, Santana CA, Garcia EV, et al. Three-dimensional fusion of coronary
arteries with myocardial perfusion distributions: clinical validation. J Nucl Med.
2004;45:745–753.
25. Besl P, McKay N. A method for registration of 3D shapes. IEEE Trans Pattern
Anal Mach Intell. 1992;14:239–256.
26. Guetter C, Wacker M, Xu C, Hornegger J. Registration of cardiac SPECT/CT
data through weighted intensity co-occurrence priors. Lect Notes Comput Sci.
2007;4791:725–733.
FUSION OF CORONARY CTA AND CARDIAC SPECT • Slomka et al. 1629

27. Aladl UE, Hurwitz GA, Dey D, Levin D, Drangova M, Slomka PJ. Automated
image registration of gated cardiac single-photon emission computed tomog-
raphy and magnetic resonance imaging. J Magn Reson Imaging. 2004;19:
283–290.
28. Delago A, Min JK, Halamert E, et al. Diagnostic performance of 64-
multidetector row coronary computed tomographic angiography for evaluation
of coronary artery stenosis in individuals without known coronary artery disease:
results from the prospective multicenter ACCURACY (Assessment by Coronary
Computed Tomographic Angiography of Individuals Undergoing Invasive
Coronary Angiography) trial. J Am Coll Cardiol. 2008;52:1733–1735.
29. Di Carli MF, Dorbala S, Hachamovitch R. Integrated cardiac PET-CT for
the diagnosis and management of CAD. J Nucl Cardiol. 2006;13:139–
144.
30. Townsend DW. Dual-modality imaging: combining anatomy and function.
J Nucl Med. 2008;49:938–955.
31. Slomka PJ, Berman DS, Germano G. Applications and software techniques for
integrated cardiac multimodality imaging. Expert Rev Cardiovasc Ther. 2008;6:
27–41.
32. Einstein AJ. Radiation risk from coronary artery disease imaging: how do
different diagnostic tests compare? Heart. 2008;94:1519–1521.
33. Gutstein A, Wolak A, Lee CJ, et al. Predicting success of prospective and
retrospective gating with dual-source coronary computed tomography angiog-
raphy: development of selection criteria and initial experience. J Cardiovasc
Comput Tomogr. 2008;2:81–90.
34. Gopal A, Mao SS, Karlsberg D, et al. Radiation reduction with prospective ECG-
triggering acquisition using 64-multidetector computed tomographic angiogra-
phy. Int J Cardiovasc Imaging. 2009;25:405–416.
35. Gutstein A, Dey D, Cheng V, et al. Algorithm for radiation dose reduction with helical
dual source coronary computed tomography in clinical practice. J Cardiovasc Comput
Tomogr. 2008;2:311–322.
1630 THE JOURNAL OF NUCLEAR MEDICINE • Vol. 50 • No. 10 • October 2009