A Spatio-Temporal Deconvolution Method to Improve Perfusion CT Quantification
Upload
independentCategory
view
3download
0
1042 AJR:199, November 2012
pancreas thanks to the development of the per-fusion CT technique [8–13]. The feasibility of perfusion CT for evaluating prostate tumors has been shown by only a few studies [14–16]. The reason is technical: The lack of con-trast resolution makes identification of cancer on unenhanced CT scans impossible, with the consequent inability to center the perfusion vol-ume on the malignant areas [17]. It is only with scanners able to cover a volume of at least 4 cm (i.e., 64-MDCT) that it has become possible to analyze almost the entire gland and to calculate functional indexes. At the time of this arti-cle, only one recent feasibility study, one that was without pathologic correlation, using a 64-MDCT scanner had been published [18].
The aim of our study was to prospectively compare quantitative perfusion CT parame-ters and immunohistologic markers of angio-genesis in the diagnosis of prostate cancer.
Perfusion MDCT of Prostate Cancer: Correlation of Perfusion CT Parameters and Immunohistochemical Markers of Angiogenesis
Marcello Osimani1Davide Bellini1Claudio Di Cristofano2
Giovanni Palleschi3
Vincenzo Petrozza2
Antonio Carbone3
Andrea Laghi1
Osimani M, Bellini D, Di Cristofano C, et al.
1Department of Radiological Sciences, Oncology and Pathology, “Sapienza” University of Rome, Via Franco Faggiana, 1668, Polo Pontino, Latina 04100, Italy. Address correspondence to M. Osimani ([email protected]).
2Department of Medical-Surgical Sciences and Biotechnologies, “Sapienza” University of Rome, Polo Pontino, Latina, Italy.
3Department of Urology, “Sapienza” University of Rome, Polo Pontino, Latina, Italy.
Genitour inar y Imaging • Or ig ina l Research
AJR 2012; 199:1042–1048
0361–803X/12/1995–1042
© American Roentgen Ray Society
The assumption that angiogenesis is a key factor in the growth and metastatic spread of several tu-mors, including prostate cancer
[1], encouraged researchers to find new drugs targeting tumor vascularization [2, 3]. For these reasons, monitoring changes in vessel pattern is currently a fundamental concern in oncology, and microvessel density (MVD) is considered a gold standard method to measure angiogenesis or aggressiveness of many can-cers [4, 5]. Unfortunately, the systematic biop-tic assessment of these parameters is not fea-sible in routine clinical practice [6]. This is the reason for the interest in the development of functional imaging techniques able to nonin-vasively quantify tumor microcirculation [7].
In recent years, CT has been investigated to assess angiogenesis in malignant lesions of the lung, colon and rectum, liver, esophagus, and
Keywords: angiogenesis, angiogenesis immunohisto-chemical markers, mean vascular area, mean vascular density, perfusion CT, prostate cancer
DOI:10.2214/AJR.11.8267
Received November 21, 2011; accepted after revision March 8, 2012.
OBJECTIVE. The aim of our study was to correlate perfusion MDCT parameters and im-munohistochemical markers of angiogenesis in prostate cancer.
SUBJECTS AND METHODS. Twenty-two patients scheduled for radical surgical prostatectomy because of biopsy-proven prostate cancer underwent perfusion CT on a 64-MDCT scanner. Eight contiguous 5-mm sections were acquired at 1-second intervals for 45 seconds followed by three additional scans every 10 seconds after the administration of 80 mL of iodinated contrast medium (350 mg I/mL). Blood volume, blood flow, mean transit time, and permeability surface-area product were calculated, dividing each slice into nine square regions. Values obtained were correlated with the mean microvessel density (MVD) and mean vascular area of corresponding areas on histologic macrosections.
RESULTS. The mean values of the perfusion parameters detected on all square fields of pa-tients with prostate cancer, benign hyperplasia, chronic prostatitis, and healthy tissue were, re-spectively, 18.36 ± 6.30, 19.49 ± 8.46, 19.67 ± 11.44, and 20.32 ± 4.53 mL/min/100 g for blood flow; 8.45 ± 2.75, 6.21 ± 4.32, 4.94 ± 2.31, and 5.44 ± 2.67 mL/100 mg for blood volume; 19.19 ± 4.45, 18.74 ± 4.91, 16.24 ± 4.12, and 16.37 ± 4.83 seconds for mean transit time; and 26.34 ± 11.88, 18.67 ± 9.15, 18.08 ± 7.72, and 19.93 ± 7.22 mL/min/100 g for permeability surface-area product. Both blood volume and the permeability surface-area product of cancerous squares showed the highest correlation with mean MVD and mean vascular area (0.618 [p < 0.01] and 0.614 [p < 0.01], respectively) and the highest area under the curve (0.769 and 0.708).
CONCLUSION. Our results show that blood volume and permeability surface-area prod-uct measurements obtained with perfusion CT have the highest correlation with immunohisto-chemical markers of angiogenesis in prostate cancer.
Osimani et al.Perfusion CT of Prostate Cancer
Genitourinary ImagingOriginal Research

AJR:199, November 2012 1043
Perfusion CT of Prostate Cancer
Subjects and MethodsPopulation Study
Between July 2009 and February 2011, 24 con-secutive men (mean age, 58.3 years; age range, 48–70 years; mean body weight, 78.2 kg) with trans rectal ul-trasound–guided biopsy-proven prostate cancer with a Gleason score of 7 (3 + 4 or 4 + 3) who were sched-uled to undergo radical prostatectomy were prospec-tively included in the study. Patients with a previous allergic reaction to IV iodinated contrast medium, pa-tients with renal disease that disallowed contrast-en-hanced MDCT (serum creatinine level > 1.9 mg/dL), and patients scheduled for neoadjuvant combination chemotherapy-radiation treatment before surgery were excluded from the study. Each included patient received an information sheet that clarified the details of the study and emphasized that CT was primarily for radiologic research and secondarily for cancer staging. Patients were also informed about radiation exposure: The estimated effective radiation dose de-livered during the entire perfusion CT examination (≈ 10 mSv) would be twice the dose typically delivered for a diagnostic abdominopelvic CT examination (6 mSv) (ImPACT CT Dose Calculator, version 0.99, Medical Devices Agency).
The study protocol adhered to the guidelines of the Declaration of Helsinki and was approved by the local ethics board.
CT TechniqueAll patients were examined using a 64-MDCT
scanner (LightSpeed VCT, GE Healthcare) an av-erage of 3 weeks after prostate biopsy. Before scan-ning, 20 mg of butyl scopolamine (Buscopan, Boeh-ringer Ingelheim) was IV injected to reduce bowel peristalsis. Unenhanced abdominopelvic CT scans were initially acquired to obtain unenhanced images and to localize the prostate gland. The scanning pa-rameters were as follows: collimation, 0.625 mm; slice reconstruction thickness, 2.5 mm; pitch, 1.375; rotation time, 0.6 second; and 100 kVp. The tube current–time product ranged from 100 to 500 mAs using an automatic tube current modulation system (SmartmA and AutomA, GE Healthcare) and set-ting the noise index at 28. One supervising radiolo-gist, who had 14 years’ experience in body CT, se-lected a perfusion CT volume on the prostatic region excluding the apex and base of the prostate to match exactly the same volume as pathologic analysis.
For the perfusion CT protocol, all patients were IV injected with an 80-mL bolus of nonionic iodin-ated contrast medium with a concentration of 350 mg I/mL (iobitridol [Xenetix 350, Guerbet]) using an automatic double-head injector (Empower-CTA, E-Z-EM). Contrast medium was injected at a fixed flow rate of 5 mL/s through a plastic IV catheter (18-gauge) placed in an antecubital vein followed by a flush of saline solution (40 mL at 5 mL/s).
Eight contiguous 5-mm slices were obtained at 1-second intervals using a cine mode acquisition (100 kV, 180 mA, 4-cm scanning FOV, 512 × 512 mm matrix). This acquisition began 10 seconds af-ter the start of the IV injection of contrast medium to enable acquisition of baseline unenhanced imag-es and continued for a total of 45 seconds during the first pass, assuming that contrast medium is only in the vascular compartment with a maximum error of 15% [19]. These scans were followed by three ad-ditional 1-second scans with a 10-second interval to quantify the amount of contrast medium that filtered into the interstitial compartment (permeability sur-face-area product value, PS) on the basis of St. Law-rence and Lee’s adiabatic approximation [20] and according to the following equation:
PS = –BF [ln(1 – E)],
where BF is flow and E is the fraction of contrast material that leaks into the interstitium from the vascular space. Perfusion CT examination was fol-lowed by an abdominopelvic examination without the injection of any additional amount of contrast medium that started with a delay of 85 seconds af-ter the beginning of the IV injection and was per-formed using the following parameters: collima-tion, 0.625 mm; slice reconstruction thickness, 2.5 mm; pitch, 1.375; rotation time, 0.6 second; and 120 kV. The tube current–time product ranged from 200 to 800 mAs (SmartmA and AutomA) and the noise index was 28. The aim of this final scan was to verify distant spread of the tumor, and a report was issued according to our daily clinical practice.
Analysis of Perfusion CT ImagesThe entire perfusion CT protocol dataset (384
images per patient) and raw data were transferred to a workstation (Advantage Windows 4.4, GE Healthcare) equipped with dedicated software based on distributed parameter analysis (prostate proto-col, Perfusion 4.0, GE Healthcare). One radiologist, who had 20 years’ experience in abdominal CT and 4 years’ experience in perfusion CT, viewed and an-alyzed the images. A processing threshold between –200 and 120 HU was chosen to optimize analysis of the soft tissue on the basis of software presets. An arterial input was defined placing a circular region of interest (average area, 7 mm2) within the best-visualized artery (iliac) on the selected image. The software automatically derived a smoothed arterial time-enhancement curve, and colorimetric maps of blood flow (BF), blood volume (BV), mean transit time (MTT), and permeability surface-area product were generated for each section, with each pixel rep-resenting a parameter value.
Quantitative measurements of BF, BV, MTT, and permeability surface-area product for both tu-mor and glandular tissue were obtained and record-
ed by manually defining on each section a grid with nine square regions of interest (Fig. 1). The number of squares was arbitrarily kept low to simplify cor-relation with histology and to avoid a huge or re-dundant data sample for each patient.
Radical Prostatectomy Specimen ProcessingFrom 1 to 5 days after CT examinations, all pa-
tients underwent radical prostatectomy surgery. Em-bedded specimens were sent to our pathology unit and pathologists examined the entire sample.
In each case we obtained histologic macrosec-tions (5 mm thickness) matching exactly the same eight planes of CT images by the following meth-od: The apex and base of the resected prostate were amputated at a thickness of approximately 5 mm and these margins were submitted as 4-mm-thick conization slices in the vertical parasagittal plane. The remaining specimens were serially sectioned at 5 mm thickness by knife to create transverse sec-tions perpendicular to the long axis of the prostate from its apex to the tip of the seminal vesicles.
A pathologist and radiologist took care, in consensus, to ensure that the histologic sections matched the level where perfusion CT had been performed. This was achieved by measuring the distance from the prostate apex to base (cranio-caudal) and the distance from the urethra after the prostate apex and base were cut off.
A grid with nine squares, similar to the one used for analyzing CT images, was manually drawn on each histopathologic macrosection and corre-sponding fields were analyzed. Any potential mac-rosection tissue shrinkage due to formalin fixation was taken into account to enable sampling at the level corresponding to the section at which perfu-sion CT had been performed. The pathologist and radiologist settled differences in consensus in the corresponding squares.
Morphologic and Immunohistochemical AnalysesHistopathologic and immunohistochemical anal-
yses were performed in whole prostate tissues. We evaluated the prostate macrosections and all nine-field grid squares separately. For each case we iden-tified cancerous square fields; benign square fields, in which benign prostatic hyperplasia (BPH) or chronic prostatitis (prostatic inflammatory infil-trates) was assessed as the prevalent tissue change pattern (> 40% of the square field); healthy squares, which did not exhibit morphologic modifications, a cancer pattern, or a prevalent BPH or chronic pros-tatitis pattern (< 40%). These squares were consid-ered as the control group for the statistical analysis.
In our preliminary study we voluntarily excluded prostatic intraepithelial neoplasia (PIN) and atypi-cal small gland proliferation to avoid confounding perfusion CT results in precancerous lesions.

1044 AJR:199, November 2012
Osimani et al.
Immunohistochemical analysis was performed on serial tissue macrosections (mean thickness, 4 µm) using anti-CD34 antibody (Clone QBEnd/10, Leica Microsystems) by manual protocol.
The following parameters were assessed using an automated image analyzer (D-Sight, Menarini Diagnostics) that counted automatically the endo-thelial anti-CD34 antibody expression, as previous-ly described by other authors [21]. We evaluated the number of vessels (MVD) and mean vascular area to avoid a possible count bias due to the complex ge-ometry of the neovessels that were analyzed on 2D plans in the whole area of each square field.
Statistical Correlation AnalysisStatistical analyses were performed using ded-
icated software (SPSS, version 13.0, SPSS) for Microsoft Windows. Mean values (with SDs) of MVD, mean vascular area, and all perfusion pa-rameters were calculated for each square field. The one-way analysis of variance was used to analyze statistical differences of immunohisto-logical and perfusion parameters between benign and neoplastic squares. The analysis of variance test (F statistic) was positive the p value was less than 0.05. A two-tailed Spearman rank correla-tion analysis was performed between each per-fusion CT parameter, MVD, and mean vascular area counts in neoplastic square fields. Finally, re-ceiver operating characteristic (ROC) curves were calculated to find which perfusion CT parameter
reveals the best diagnostic accuracy level in the differentiation between the benign pattern and the tumoral pattern in each square. Statistical signifi-cance was assigned at the 5% level.
ResultsStatistical correlation between the radiolog-
ic and pathologic results of 22 patients (mean prostate-specific antigen value, 12.32 ± 6.60 ng/mL) was performed. We excluded two pa-tients because the CT volume (4 cm) was in-sufficient to cover the entire prostate gland ex-cluding the base and apex (coverage failure, 8% [2/24]). No blooding artifact was detected on images. A total of 1584 square fields were analyzed (mean square area, 181.36 mm2; range, 17.06–280.02 mm2) on CT and histo-logic sections (Fig. 1).
Pathologists found a morphologic pattern of prostate cancer in 196 of 1584 square fields (12.3%), BPH in 461 (29.1%), and chronic prostatitis in 285 (17.9%). Of the 1584 square fields, 504 (31.8%) were considered healthy because neither morphologic changes nor a prevalent BPH or chronic prostatitis pattern was found and 138 square fields (8.7%) were excluded from the analysis because of evi-dence of PIN or atypical small gland prolif-eration lesions. The mean perfusion CT pa-rameters (BF, BV, MTT, and permeability surface-area product) and mean histologic
parameters (MVD and mean vascular area) for each lesion group (prostate cancer, BPH, chronic prostatitis, and healthy areas) are sum-marized in Table 1.
Immunohistochemical ResultsThe mean MVD and mean vascular area
values calculated in fields with adenocarci-noma (prostate cancer) were, respectively, 70.78 and 0.018 mm2, and 54.91 and 0.024 mm2 in the chronic prostatitis areas. Squares with normal, healthy tissues showed mild MVD and mean vascular area values that were between those of BPH and chronic prostatitis—60.51 and 0.015 mm2, respec-tively. Despite an increase in MVD and a decrease in mean vascular area observed in tumor fields compared with nonneoplastic ar-eas, we did not test whether there is a corre-lation between MVD or mean vascular area and tumor areas in the immunohistochemical analysis. SD values are reported in Table 1.
CT and Immunohistochemical Statistical Correlations
An analysis of variance revealed more no-ticeable significant differences in BV (p < 0.01), MTT (p < 0.05), and permeability sur-face-area product (p < 0.01) and a moderate difference in MVD (p = 0.03) between be-nign and healthy square fields in comparison
TABLE 1: Perfusion CT Parameters and Histologic Parameters in Different Prostate Tissues
Histologic Diagnosis
CT Perfusion Histologya
Blood Flow (mL/min/100 g)
Blood Volume (mL/100 mg)
Mean Transit Time (s)
Permeability Surface-Area Product
(mL/min/100 g)
Mean Microvascular Density
(No. of Vessels/1 mm2)Mean Vascular Area
(Area of Vessels/1 mm2)
Prostate cancer (n = 196)
Mean ± SD 18.36 ± 6.30 8.45 ± 2.75 19.19 ± 4.45 26.34 ± 11.88 70.78 ± 41.9 0.0184 ± 0.01
Maximum 32.33 13.43 28.58 47.84 162.51 0.0436
Minimum 6.10 3.09 10.05 10.02 1.44 0.0004
Benign prostate hyperplasia (n =461)
Mean ± SD 19.49 ± 8.46 6.21 ± 4.32 18.74 ± 4.91 18.67 ± 9.15 64.96 ± 37.6 0.0171 ± 0.01
Maximum 59.78 43.63 32.31 58.15 159.90 0.0429
Minimum 7.28 1.52 7.84 4.72 0.25 0.0001
Chronic prostatitis (n = 285)
Mean ± SD 19.67 ± 11.44 4.94 ± 2.31 16.24 ± 4.12 18.08 ± 7.72 54.91 ± 28.5 0.0244 ± 0.09
Maximum 102.87 17.64 25.76 44.48 117.17 1
Minimum 8.67 1.84 6.84 6.38 0.15 0
Healthy fieldsb (n = 504)
Mean ± SD 20.32 ± 4.53 5.44 ± 2.67 16.37 ± 4.83 19.93 ± 7.22 60.51 ± 34.89 0.0159 ± 0.009
Maximum 27.1 10.43 25.76 37.56 110.55 0.031
Minimum 10.62 1.96 9.88 7.34 12.63 0.004aCalculated using an automatic microvessels counter.bFields showing no morphologic modifications, no cancer pattern, no prevalent BPH or chronic prostatitis pattern (< 40%).

AJR:199, November 2012 1045
Perfusion CT of Prostate Cancer
with neoplastic square fields. BF and mean vascular area showed no significant differ-ence between healthy and benign square fields and malignant square fields (p = 0.73 and p = 0.62, respectively).
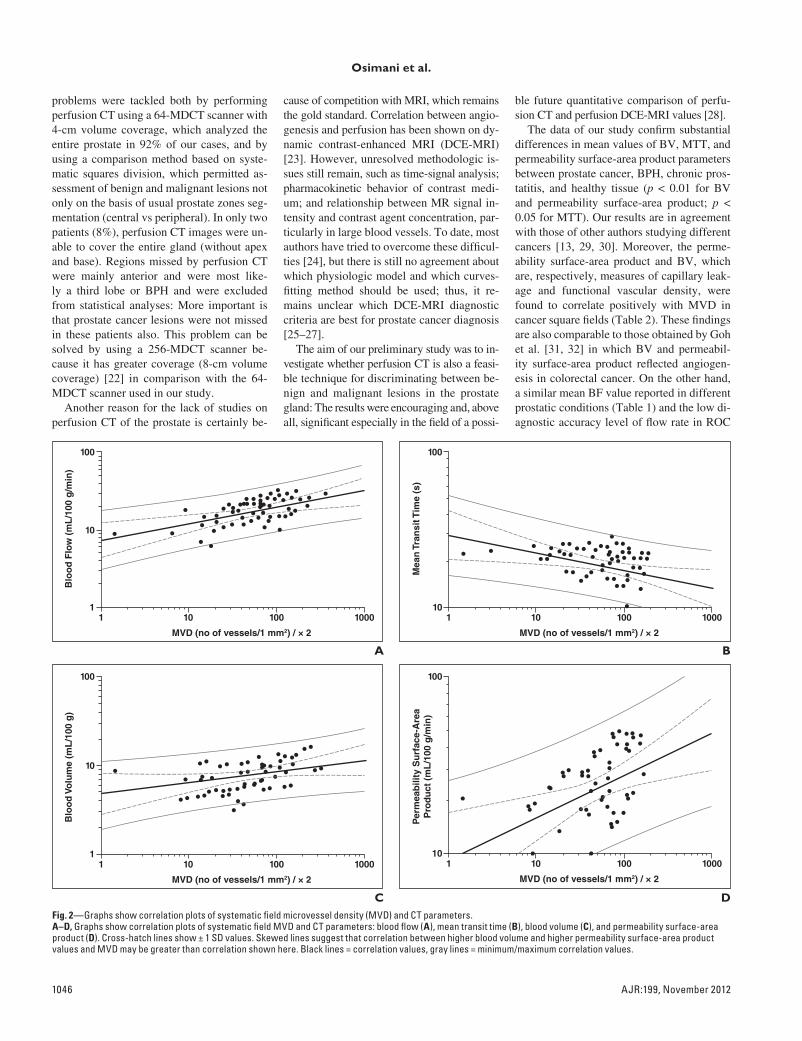
A two-tailed Spearman rank correlation analysis showed the highest correlation level between BV and permeability surface-area prod-uct measurements of prostate cancer squares (0.618 and 0.614, respectively) (Table 2 and Fig. 2), whereas MTT was inversely correlat-ed (–0.475) and BF was moderately correlated
with MVD with a lower statistical significance level (p > 0.05). A similar situation resulted with the correlation between CT parameters and mean vascular area in neoplastic squares.
BV and the permeability surface-area product showed the highest area under the curve (AUC) values in ROC analysis (0.769 and 0.708, re-spectively). These results suggest that BV and permeability surface-area product parameters may allow distinguishing between benign and malignant lesions. BF and MTT showed the lowest AUC values (0.495 and 0.599) and did
not differ significantly in the diagnosis of can-cer. These results are shown in Figure 3.
DiscussionFew reports on perfusion CT of prostate
cancer are available in the literature [16]. The main reason is probably related to the difficul-ty in evaluating this gland on CT images [15], which do not allow a morphologic distinction between the central and peripheral zones and do not allow direct visualization of suspected malignant lesions on unenhanced scans. These
Fig. 1—Representative results of 63-year-old man with one left-sided cancer area (arrows) on prostatic peripheral region.A, Perfusion analysis. Color blood flow map, obtained with dedicated software application, shows confounding increase in flow (red areas) both in neoplastic lesion as we expected, and in contralateral benign region on right side (lower specificity); see text for explanation. B, Perfusion analysis. Color blood volume map shows increase in blood volume (red areas) in tumor corresponding to countered region on macrosections. C, Prostate macrosection after immunohistochemical staining using anti-CD34 antibody; high density of microvessels corresponds to brownest area (arrow).D, Perfusion analysis. Color map of mean transit time shows reduction in values in tumor (blue areas).E, Perfusion analysis. Color map of permeability surface-area product shows increase in permeability (red areas) in peripheral area of cancer.F, Photomicrograph (H and E) of prostate macrosection allows tumor, (arrow) to be identified. Perfusion maps show lesion (arrows, A, B, D, and E) corresponding to this macrosection.
TABLE 2: Spearman Rank Correlation Coefficient and p Values for Vascular and Histologic Parameters in Cancer Squares
Hisotology
CT Perfusion
Blood Flow (mL/min/100 g) Blood Volume (mL/100 mg) Mean Transit Time (s)Permeability Surface-Area Product
(mL/min/100 g)
r p r p r p r p
Mean microvessel density 0.310 0.079 0.618 0.000 −0.475 0.007 0.614 0.001
Mean vascular area 0.304 0.085 0.626 0.000 −0.503 0.004 0.650 0.000
Note—The analysis showed the highest correlation level between blood volume and permeability surface-area product measurements of prostate cancer squares (0.618 and 0.614, respectively).
1046 AJR:199, November 2012
Osimani et al.
problems were tackled both by performing perfusion CT using a 64-MDCT scanner with 4-cm volume coverage, which analyzed the entire prostate in 92% of our cases, and by using a comparison method based on syste-matic squares division, which permitted as-sessment of benign and malignant lesions not only on the basis of usual prostate zones seg-mentation (central vs peripheral). In only two patients (8%), perfusion CT images were un-able to cover the entire gland (without apex and base). Regions missed by perfusion CT were mainly anterior and were most like-ly a third lobe or BPH and were excluded from statistical analyses: More important is that prostate cancer lesions were not missed in these patients also. This problem can be solved by using a 256-MDCT scanner be-cause it has greater coverage (8-cm volume coverage) [22] in comparison with the 64-MDCT scanner used in our study.
Another reason for the lack of studies on perfusion CT of the prostate is certainly be-
cause of competition with MRI, which remains the gold standard. Correlation between angio-genesis and perfusion has been shown on dy-namic contrast-enhanced MRI (DCE-MRI) [23]. However, unresolved methodologic is-sues still remain, such as time-signal analysis; pharmacokinetic behavior of contrast medi-um; and relationship between MR signal in-tensity and contrast agent concentration, par-ticularly in large blood vessels. To date, most authors have tried to overcome these difficul-ties [24], but there is still no agreement about which physiologic model and which curves-fitting method should be used; thus, it re-mains unclear which DCE-MRI diagnostic criteria are best for prostate cancer diagnosis [25–27].
The aim of our preliminary study was to in-vestigate whether perfusion CT is also a feasi-ble technique for discriminating between be-nign and malignant lesions in the prostate gland: The results were encouraging and, above all, significant especially in the field of a possi-
ble future quantitative comparison of perfu-sion CT and perfusion DCE-MRI values [28].
The data of our study confirm substantial differences in mean values of BV, MTT, and permeability surface-area product parameters between prostate cancer, BPH, chronic pros-tatitis, and healthy tissue (p < 0.01 for BV and permeability surface-area product; p < 0.05 for MTT). Our results are in agreement with those of other authors studying different cancers [13, 29, 30]. Moreover, the perme-ability surface-area product and BV, which are, respectively, measures of capillary leak-age and functional vascular density, were found to correlate positively with MVD in cancer square fields (Table 2). These findings are also comparable to those obtained by Goh et al. [31, 32] in which BV and permeabil-ity surface-area product reflected angiogen-esis in colorectal cancer. On the other hand, a similar mean BF value reported in different prostatic conditions (Table 1) and the low di-agnostic accuracy level of flow rate in ROC
11
10
Blo
od
Flo
w (
mL
/100
g/m
in)
MVD (no of vessels/1 mm2) / × 2
100
10 100 1000
11
Blo
od
Vo
lum
e (m
L/1
00 g
)
MVD (no of vessels/1 mm2) / × 2
100
10
10 100 1000
110
Mea
n T
ran
sit T
ime
(s)
MVD (no of vessels/1 mm2) / × 2
100
10 100 1000
110
Per
mea
bili
ty S
urf
ace-
Are
aP
rod
uct
(m
L/1
00 g
/min
)
MVD (no of vessels/1 mm2) / × 2
100
10 100 1000
A
CFig. 2—Graphs show correlation plots of systematic field microvessel density (MVD) and CT parameters.A–D, Graphs show correlation plots of systematic field MVD and CT parameters: blood flow (A), mean transit time (B), blood volume (C), and permeability surface-area product (D). Cross-hatch lines show ± 1 SD values. Skewed lines suggest that correlation between higher blood volume and higher permeability surface-area product values and MVD may be greater than correlation shown here. Black lines = correlation values, gray lines = minimum/maximum correlation values.
B
D

AJR:199, November 2012 1047
Perfusion CT of Prostate Cancer
analysis (0.495) suggest that this parameter is unable to distinguish between benign and malignant lesions.
This lack of an association between BF and cancer may be currently explained only on the basis of preliminary results in animals treat-ed with antiangiogenic drugs. In those stud-ies, BF may reflect the flow in established large vessels rather than in microcirculation [33]. Consequently, BV, rather than BF, may be more accurate in assessing vessel density growth. This result differs from that of an ex-isting perfusion CT study in prostate cancer, in which BF was a significant parameter [14]. A possible explanation for this discrepancy is that the authors did not compare perfusion val-ues in other prostatic diseases (i.e., BPH) and did not correlate their results with MVD.
BF also did not correlate with mean vascu-lar area as opposed to BV and permeability surface-area product; these findings suggest that BV and permeability surface-area prod-uct reflect the main features of prostate malig-nant tumor vascularity, which include numer-ous and poorly formed vessels (high BV and MVD) with high permeability to macromole-cules (high permeability surface-area product) and, on the other hand, intermittent or unstable flow due to both transient rises in already raised interstitial pressure (low BF value) and multi-ple arteriovenous shunts (low MTT value) [34].
An important restraint was also consid-ered in our study: the increased BPH blood
afflux and the significant overlap in MVD values of BPH and prostate cancer [35]. For this reason we performed ROC analysis us-ing, as gold standard, a pathologist’s analy-sis of all fields to test whether perfusion CT would be good at exceeding MVD “in vivo” limits and which parameter was accurate in cancer detection. BV and permeability sur-face-area product resulted again as the major descriptors of prostate cancer lesions as we can see by the AUC fitted curves in Figure 3 (0.769 and 0.708, respectively).
We noticed this feature in color maps cor-responding to BV and permeability surface-area product while positioning regions of interest and performing a histologic match: This is clear in Figure 1 in which higher and well-delineated hot spots on the BV map cor-respond to cancer lesions on histologic ma-crosections. Moreover, permeability sur-face-area product values were highest on the peripheral region of the lesion (red areas in Fig. 1). In this area, several authors have identified an overlap between autologous vascularization of the gland and new vessel growth of the tumor—a so-called “inflamma-tory pattern.” This feature is considered es-sential to angiogenesis and creates a gellike matrix that provides a favorable microenvi-ronment for subsequent ingrowth of new cap-illary buds [36, 37]. We considered this fea-ture as further confirmation of the feasibility of perfusion CT in the prostate gland, but we believe that other studies with a dedicated study design must be carried out to test the sensitivity and specificity of the technique, relative thresholds of parameters, and above all correlation with tumor size.
Our study had a number of limitations. Our population was composed of patients with pros-tate cancer and a healthy control group was not included. However, we performed perfusion analysis also on benign and healthy squares and those data were used for comparison.
We experienced inherent difficulties in comparing pathologic sections and CT imag-es, but a supervising radiologist and patholo-gist, in consensus, took special care to match the histopathologic specimens with CT maps thanks to the use of a systematic and repro-ducible field-grid method. This approach makes an interobserver agreement calculation less significant and we decided to not calcu-late this parameter because no sensitivity or specificity values were assessed: This may be considered as a minor limit of the study. Moreover, we decided to include only patients with a Gleason score of 7 (4 + 3, 3 + 4) and we did not assess, in this preliminary study, the
influence of tumor size, necrosis, fibrosis, and mucification. Finally, because of the lack of long-term follow-up, the prognostic value of perfusion parameters was not evaluated.
Concerning clinical routine implementa-tion of perfusion CT, the additional radiation dose decreases the number of eligible patients especially when a first diagnosis is required. Presently, our perfusion CT study may pro-vide baseline values (particularly BV and per-meability surface-area product) that may be well suited for monitoring tumor response to radiation therapies [38] or to antiangiogenic agents such as bevacizumab, docetaxel, and prednisone [2, 3]. Perfusion CT data may also be used for future delineation of intraprostatic subvolumes for intensity-modulated radiation therapy, which is difficult to do with paramet-ric maps of DCE-MRI [39]. Finally, our re-sults are also encouraging for the development of a 3D perfusion CT computer-aided diagno-sis (CAD) system for the detection of prostate cancer (theoretically more simple to develop in comparison with an MRI CAD [28, 40, 41].
In conclusion, our preliminary results sug-gest that perfusion CT using a 64-MDCT scanner is a feasible technique for assessing prostate cancer vascularization. BV and per-meability surface-area product values have the highest correlation with immunohistochemi-cal markers of angiogenesis in prostate can-cer. The possible clinical role, at the moment, seems to be monitoring tumor response to an-tiangiogenic drug or radiation therapy; howev-er, before routine implementation, additional studies on larger series are needed.
AcknowledgmentWe thank Valeria Panebianco of the De-
partment of Radiological Sciences, Oncol-ogy and Pathology, “Sapienza” University of Rome for the contribution to text editing about prostate MRI.
References 1. Kai L, Wang J, Ivanovic M, et al. Targeting prostate
cancer angiogenesis through metastasis- associated
protein 1 (MTA1). Prostate 2011; 71:268–280
2. Aragon-Ching JB, Dahut WL. VEGF inhibitors
and prostate cancer therapy. Curr Mol Pharmacol
2009; 2:161–168
3. Kluetz PG, Figg WD, Dahut WL. Angiogenesis
inhibitors in the treatment of prostate cancer. Ex-
pert Opin Pharmacother 2010; 11:233–247
4. Bunsiripaiboon P, Sornmayura P, Wilasrusmee C,
et al. The prognostic significance of microvessel
density in intrahepatic cholangiocarcinoma. J
Med Assoc Thai 2010; 93:66–72
5. Erbersdobler A, Isbarn H, Dix K, et al. Prognostic
1.0
0.8
0.6
0.4
0.2
0.0
0.0 0.2
BFBVMTTPermeability Surface-Area ProductReference Line
0.41 – Specificity
Sen
siti
vity
0.6 0.8 1.0
Fig. 3—Receiver operating characteristic (ROC) plot. Closer ROC curve is near upper left corner and shows higher overall accuracy of test (100% sensitivity, 100% specificity, and highest area under curve [AUC]) [42]. In ROC graph, blood volume (BV) and permeability surface-area product curves had highest AUC values suggesting that these parameters can be used to discriminate between benign and malignant lesions on prostate gland. BF = blood flow, MTT = mean transit time.

1048 AJR:199, November 2012
Osimani et al.
value of microvessel density in prostate cancer: a tis-
sue microarray study. World J Urol 2010; 28:687–692
6. Cuenod CA, Fournier L, Balvay D, et al. Tumor
angiogenesis: pathophysiology and implications
for contrast-enhanced MRI and CT assessment.
Abdom Imaging 2006; 31:188–193
7. Padhani AR, Harvey CJ, Cosgrove DO. Angio-
genesis imaging in the management of prostate
cancer. Nat Clin Pract Urol 2005; 2:596–607
8. Chen TW, Yang ZG, Wang QL, et al. Whole tu-
mour quantitative measurement of first-pass per-
fusion of oesophageal squamous cell carcinoma
using 64-row multidetector computed tomogra-
phy: correlation with microvessel density. Eur J
Radiol 2011; 79:218–223
9. Jiang NC, Han P, Zhou CK, Zheng JL, Shi HS,
Xiao J. Dynamic enhancement patterns of soli-
tary pulmonary nodules at multi-detector row CT
and correlation with vascular endothelial growth
factor and microvessel density. Ai Zheng 2009;
28:164–169
10. Feng ST, Sun CH, Li ZP, et al. Evaluation of an-
giogenesis in colorectal carcinoma with multide-
tector-row CT multislice perfusion imaging. Eur J
Radiol 2009; 75:191–196
11. Faggioni L, Neri E, Bartolozzi C. CT perfusion of
head and neck tumors: how we do it. AJR 2010;
194:62–69
12. Ng CS, Wang X, Faria SC, Lin E, Charnsangavej
C, Tannir NM. Perfusion CT in patients with
metastatic renal cell carcinoma treated with inter-
feron. AJR 2010; 194:166–171
13. Yang HF, Du Y, Ni JX, et al. Perfusion computed
tomography evaluation of angiogenesis in liver
cancer. Eur Radiol 2010; 20:1424–1430
14. Henderson E, Milosevic MF, Haider MA, et al.
Functional CT imaging of prostate cancer. Phys
Med Biol 2003; 48:3085–3100
15. Win Z, Ariff B, Harvey CJ, et al. Comparative
study of experienced vs non-experienced radiolo-
gists in assessing parametric CT images of the
response of the prostate gland to radiotherapy. Br
J Radiol 2008; 81:572–576
16. Ives EP, Burke MA, Edmonds PR, et al. Quanti-
tative computed tomography perfusion of pros-
tate cancer: correlation with whole-mount pathol-
ogy. Clin Prostate Cancer 2005; 4:109–112
17. Tawfik AM, Nour-Eldin NE, Naguib NN, et al.
CT perfusion measurements of head and neck car-
cinoma from single section with largest tumor di-
mensions or average of multiple sections: agree-
ment between the two methods and effect on
intra- and inter-observer agreement. Eur J Radiol
2011 Dec 7 [Epub ahead of print]
18. Korporaal JG, van den Berg CA, Jeukens CR, et al.
Dynamic contrast-enhanced CT for prostate can-
cer: relationship between image noise, voxel size,
and repeatability. Radiology 2010; 256:976–984
19. Purdie TG, Henderson E, Lee TY. Functional CT
imaging of angiogenesis in rabbit VX2 soft tissue.
Phys Med Biol 2001; 46:3161–3175
20. St. Lawrence KS, Lee TY. An adiabatic approxi-
mation to the tissue homogeneity model for water
exchange in the brain. I. Theoretical derivation. J
Cereb Blood Flow Metab 1998; 18:1365–1377
21. Beliën JA, Somi S, de Jong JS, van Diest PJ, Baak
JP. Fully automated microvessel counting and hot
spot selection by image processing of whole tu-
mour sections in invasive breast cancer. J Clin
Pathol 1999; 52:184–192
22. Dorn F, Muenzel D, Meier R, Poppert H, Rum-
meny EJ, Huber A. Brain perfusion CT for acute
stroke using a 256-slice CT: improvement of diag-
nostic information by large volume coverage. Eur
Radiol 2011; 21:1803–1810
23. Alonzi R, Padhani AR, Allen C. Dynamic con-
trast enhanced MRI in prostate cancer. Eur J Ra-
diol 2007; 63:335–350
24. Scherr MK, Seitz M, Muller-Lisse UG, et al. MR-
perfusion (MRP) and diffusion-weighted imaging
(DWI) in prostate cancer: quantitative and model-
based gadobenate dimeglumine MRP parameters
in detection of prostate cancer. Eur J Radiol 2010;
76:359–366
25. Franiel T, Hamm B, Hricak H. Dynamic contrast-
enhanced magnetic resonance imaging and phar-
macokinetic models in prostate cancer. Eur Ra-
diol 2011; 21:616–626
26. Oto A, Kayhan A, Jiang Y, et al. Prostate cancer:
differentiation of central gland cancer from be-
nign prostatic hyperplasia by using diffusion-
weighted and dynamic contrast-enhanced MR
imaging. Radiology 2010; 257:715–723
27. Franiel T, Lüdemann L, Rudolph B, et al. Evalua-
tion of normal prostate tissue, chronic prostatitis,
and prostate cancer by quantitative perfusion
analysis using a dynamic contrast-enhanced in-
version-prepared dual-contrast gradient echo se-
quence. Invest Radiol 2008; 43:481–487
28. Carreira GC, Gemeinhardt O, Gorenflo R, et al.
Limitations of the permeability-limited compart-
ment model in estimating vascular permeability
and interstitial volume fraction in DCE-MRI.
Magn Reson Imaging 2011; 29:639–649
29. Ungersma SE, Pacheco G, Ho C, et al. Vessel im-
aging with viable tumor analysis for quantifica-
tion of tumor angiogenesis. Magn Reson Med
2011; 65:889–899
30. Bellomi M, Viotti S, Preda L, D’Andrea G, Bonel-
lo L, Petralia G. Perfusion CT in solid body-tu-
mours. Part II. Clinical applications and future
development. Radiol Med 2010; 115:858–874
31. Goh V, Halligan S, Taylor SA, et al. Differentia-
tion between diverticulitis and colorectal cancer:
quantitative CT perfusion measurements versus
morphologic criteria—initial experience. Radiol-
ogy 2007; 242:456–462
32. Goh V, Halligan S, Daley F, et al. Colorectal tumor
vascularity: quantitative assessment with multide-
tector CT—do tumor perfusion measurements re-
flect angiogenesis? Radiology 2008; 249:510–517
33. Kan Z, Phongkitkarun S, Koyabashi S, et al.
Functional CT for quantifying tumor perfusion in
antiangiogenic therapy in a rat model. Radiology
2005; 237:151–158
34. Gabra P, Shen G, Xuan J, Lee TY. Arterio-venous
anastomoses in mice affect perfusion measure-
ments with dynamic contrast enhanced CT. Physi-
ol Meas 2010; 31:249–260
35. Oyen RH. Dynamic contrast-enhanced MRI of
the prostate: is this the way to proceed for charac-
terization of prostatic carcinoma? Eur Radiol
2003; 13:921–924
36. Gerlowski LE, Jain RK. Microvascular permea-
bility of normal and neoplastic tissues. Microvasc
Res 1986; 31:288–305
37. Jain RK. Transport of molecules across tumor vas-
culator. Cancer Metastasis Rev 1987; 6:559–593
38. Harvey CJ, Blomley MJ, Dawson P, et al. Function-
al CT imaging of the acute hyperemic response to
radiation therapy of the prostate gland: early experi-
ence. J Comput Assist Tomogr 2001; 25:43–49
39. Schmuecking M, Boltze C, Geyer H, et al. Dynamic
MRI and CAD vs. choline MRS: where is the detec-
tion level for a lesion characterisation in prostate
cancer? Int J Radiat Biol 2009; 85:814–824
40. Sung YS, Kwon HJ, Park BW, et al. Prostate can-
cer detection on dynamic contrast-enhanced
MRI: computer-aided diagnosis versus single per-
fusion parameter maps. AJR 2011; 197:1122–1129
41. Beyersdorff D, Lüdemann L, Dietz E, Galler D,
Marchot P, Franiel T. Dynamic contrast-enhanced
MRI of the prostate: comparison of two different
post-processing algorithms [in German]. Rofo
2011; 183:456–461
42. Zweig MH, Campbell G. Receiver-operating
characteristic (ROC) plots: a fundamental evalua-
tion tool in clinical medicine. Clin Chem 1993;
39:561–577
Copyright © 2022 FDOKUMEN