Effects of Smoking Marijuana on Brain Perfusion and Cognition
Upload
khangminh22Category
view
0download
0
brainsciences
Article
Perfusion and Metabolic Neuromonitoring duringVentricular Taps in Infants with Post-HemorrhagicVentricular Dilatation
Ajay Rajaram 1,2,* , Lawrence C. M. Yip 1,2 , Daniel Milej 1,2 , Marianne Suwalski 1,2,Matthew Kewin 1, Marcus Lo 1, Jeffrey J. L. Carson 1,2 , Victor Han 3, Soume Bhattacharya 3,Mamadou Diop 1,2, Sandrine de Ribaupierre 2,4 and Keith St. Lawrence 1,2
1 Imaging Program, Lawson Health Research Institute, London, ON N6A 4V2, Canada;[email protected] (L.C.M.Y.); [email protected] (D.M.); [email protected] (M.S.);[email protected] (M.K.); [email protected] (M.L.); [email protected] (J.J.L.C.);[email protected] (M.D.); [email protected] (K.S.L.)
2 Department of Medical Biophysics, Schulich School of Medicine and Dentistry, Western University, London,ON N6A 3K7, Canada; [email protected]
3 Division of Neonatal-Perinatal Medicine, Department of Pediatrics, London Health Sciences Centre, London,ON N6A 3K7, Canada; [email protected] (V.H.); [email protected] (S.B.)
4 Department of Clinical Neurological Sciences, London Health Sciences Centre, London,ON N6A 5W9, Canada
* Correspondence: [email protected]
Received: 22 June 2020; Accepted: 13 July 2020; Published: 15 July 2020�����������������
Abstract: Post-hemorrhagic ventricular dilatation (PHVD) is characterized by a build-up of cerebralspinal fluid (CSF) in the ventricles, which increases intracranial pressure and compresses braintissue. Clinical interventions (i.e., ventricular taps, VT) work to mitigate these complications throughCSF drainage; however, the timing of these procedures remains imprecise. This study presentsNeonatal NeuroMonitor (NNeMo), a portable optical device that combines broadband near-infraredspectroscopy (B-NIRS) and diffuse correlation spectroscopy (DCS) to provide simultaneousassessments of cerebral blood flow (CBF), tissue saturation (StO2), and the oxidation state ofcytochrome c oxidase (oxCCO). In this study, NNeMo was used to monitor cerebral hemodynamicsand metabolism in PHVD patients selected for a VT. Across multiple VTs in four patients, no significantchanges were found in any of the three parameters: CBF increased by 14.6 ± 37.6% (p = 0.09), StO2 by1.9 ± 4.9% (p = 0.2), and oxCCO by 0.4 ± 0.6 µM (p = 0.09). However, removing outliers resultedin significant, but small, increases in CBF (6.0 ± 7.7%) and oxCCO (0.1 ± 0.1 µM). The results ofthis study demonstrate NNeMo’s ability to provide safe, non-invasive measurements of cerebralperfusion and metabolism for neuromonitoring applications in the neonatal intensive care unit.
Keywords: near-infrared spectroscopy; diffuse correlation spectroscopy; premature brain injury;hydrocephalus; intraventricular hemorrhaging; ventricular tap; neuromonitoring; cerebral blood flow;metabolism; cytochrome c oxidase
1. Introduction
Premature birth, defined as a gestational period less than 37 weeks, occurs in 8% of infants inCanada [1]. Those born with lower birthweights (<1500 g) are at an increased risk of neurologicalcomplications, including deficits in cognition and behaviour as well as a higher incidence of major motordisorders (e.g., cerebral palsy) [2]. The largest contributor to preterm brain injury is intraventricularhemorrhaging (IVH). The pathogenesis of IVH involves the combination of an immature cerebral
Brain Sci. 2020, 10, 452; doi:10.3390/brainsci10070452 www.mdpi.com/journal/brainsci

Brain Sci. 2020, 10, 452 2 of 13
vascular anatomy (i.e., a highly vascularized germinal matrix) and poor cerebral blood flow (CBF)regulation [3,4]. It is believed that IVH elicits an inflammatory response, followed by fibrosis andsubsequent obstruction of cerebral spinal fluid (CSF) drainage [5]. This can lead to accumulation ofCSF, increased intracranial pressure (ICP), and dilatation of the entire ventricular system, referred to aspost-hemorrhagic ventricular dilatation (PHVD).
PHVD is a major complication in severe cases of IVH (Grade III and higher), where morethan 50% of the lateral ventricles are experiencing a bleed [6,7]. Due to a progressively increasingICP, any delay in treatment can result in white matter atrophy and neurologic deterioration [4,8].Cranial ultrasound (cUS) is the current gold standard in diagnosing and monitoring the progressionof PHVD through ventricular measurements such as the ventricular index (VI), anterior horn width(AHW), and thalamo-occipital distance (TOD) [9]. Given these measures, there is still some debateover the timing of clinical intervention [10]. An early approach used by many European centres relieson ventricular measurements before patients are symptomatic. Intervention consists of a varietyof techniques to drain CSF, including external ventricular drains (EVD), lumbar punctures (LP),and ventricular taps (VT), among others. [11]. In comparison, many North American centres employ alater approach where treatment is initiated depending on the ventricular index and clinical signs (e.g.,increased ICP, head circumference, ventricle size, tense fontanelle, etc.) [12,13]; similar techniques arethen implemented to drain CSF.
The discrepancy in the timing of clinical intervention is largely due to a lack of adequatemonitoring techniques to quantify PHVD progression and treatment efficacy. Recent work haselucidated the benefits of hemodynamic and metabolic neuromonitoring surrounding the developmentof PHVD [14,15]. These metrics have shown potential to act as prognostic markers of PHVD symptomsand could better indicate when to implement CSF drainage strategies. Measurements of CBF bytranscranial doppler (TCD) have proven robust in premature infants; however, continuous monitoringis not ideal as TCD is operator-dependent and only measures macrovascular changes in bloodflow [16,17]. Biomedical optics instead provide a safe, non-invasive technique ideal for longitudinalbrain monitoring at the bedside [3,18–20].
This study presents an in-house built brain monitoring system referred to as NNeMo (NeonatalNeuroMonitor) that is capable of simultaneous measurement of cerebral perfusion, tissue saturation,and oxygen metabolism at the bedside through combining two optical techniques. Broadbandnear-infrared spectroscopy (B-NIRS) uses near-infrared light to measure absorption properties of tissuethat can be used to estimate the concentrations of oxy and deoxyhemoglobin, from which the cerebraltissue saturation (StO2) can be calculated [21]. B-NIRS can also provide a direct measurement ofcerebral metabolism by monitoring absorption changes in the oxidation state of cytochrome c oxidase(oxCCO), which is directly related to mitochondrial ATP production in the electron transport chain [22].Diffuse correlation spectroscopy (DCS) is an emerging technique that provides continuous monitoringof CBF by analyzing dynamic light scatter from red blood cells [23]. DCS has been validated againstmultiple modalities, including dynamic contrast-enhanced NIRS, Positron Emission Tomography withoxygen-15 (15O) labelled water, and Arterial spin labelling MRI [24–26]. NNeMo combines B-NIRSand DCS technology to simultaneously monitor CBF, StO2, and oxCCO.
This study presents the clinical translation of NNeMo to monitor PHVD infants in the neonatalintensive care unit (NICU) undergoing CSF drainage via ventricular taps. Previous work usingcontrast-enhanced NIRS reported a small increase in CBF after the VT, but with no concurrent changein cerebral energy metabolism [14]. However, only single time-point measurements before and afterthe procedure were acquired due to the need to inject a contrast agent (indocyanine green). Here,we present continuous bedside monitoring of cerebral perfusion and metabolism in PHVD patientsundergoing a VT, with the goal of assessing any potential treatment-related changes in CBF andoxCCO. Based on the magnitude of CBF changes previously reported [14], it was hypothesized thatCSF drainage would lead to a modest increase in CBF, but with minimal impact on oxCCO.

Brain Sci. 2020, 10, 452 3 of 13
2. Materials and Methods
2.1. Patient Population
This study was approved by the Western University Health Sciences Research Ethics Board(Project Identification Code: 17828), which adheres to the guidelines of the Canadian Tri-Council PolicyStatement: Ethical Conduct for Research Involving Humans. Patients with PHVD were enrolled afterobtaining parental consent. The initial IVH was diagnosed by cranial ultrasound (cUS) and gradedaccording to the Papile scale [5]. The decision to perform a ventricular tap was based on standard ofcare, including clinical evidence (apnea, bradycardia, full fontanelles) and increased ventricle size asmeasured by cUS.
2.2. Study Design
Infants receiving a VT were monitored throughout the procedure with NNeMo (Figure 1a). Prior tosurgical setup, optical probes were placed on the infant’s scalp above the frontoparietal cortex and heldin place by a custom-built probe holder (Figure 1b). Two optical probes (one for the B-NIRS and onefor the DCS) delivered light to the scalp. Source power levels were maintained within ANSI standardsfor skin exposure. A common detection fiber bundle was used to collect diffusely reflected light thathad propagated through the head. The DCS and B-NIRS systems collected light at source-detectordistances (SDD) of 2 and 3 cm, respectively, to ensure adequate brain interrogation (Figure 1c). As anadditional precaution, a phototherapy eye shield was employed to avoid exposing the subject’s eyes tothe light sources.
Brain Sci. 2020, 10, x FOR PEER REVIEW 3 of 13
2. Materials and Methods
2.1. Patient Population
This study was approved by the Western University Health Sciences Research Ethics Board (Project Identification Code: 17828), which adheres to the guidelines of the Canadian Tri-Council Policy Statement: Ethical Conduct for Research Involving Humans. Patients with PHVD were enrolled after obtaining parental consent. The initial IVH was diagnosed by cranial ultrasound (cUS) and graded according to the Papile scale [5]. The decision to perform a ventricular tap was based on standard of care, including clinical evidence (apnea, bradycardia, full fontanelles) and increased ventricle size as measured by cUS.
2.2. Study Design
Infants receiving a VT were monitored throughout the procedure with NNeMo (Figure 1a). Prior to surgical setup, optical probes were placed on the infant’s scalp above the frontoparietal cortex and held in place by a custom-built probe holder (Figure 1b). Two optical probes (one for the B-NIRS and one for the DCS) delivered light to the scalp. Source power levels were maintained within ANSI standards for skin exposure. A common detection fiber bundle was used to collect diffusely reflected light that had propagated through the head. The DCS and B-NIRS systems collected light at source-detector distances (SDD) of 2 and 3 cm, respectively, to ensure adequate brain interrogation (Figure 1c). As an additional precaution, a phototherapy eye shield was employed to avoid exposing the subject’s eyes to the light sources.
(a)
(b)
(c)
Figure 1. (a) Neonatal NeuroMonitor (NNeMo) combining broadband near-infrared spectroscopy (B-NIRS) and diffuse correlation spectroscopy (DCS) techniques. (b) Optical fibers affixed to an infant’s head using a 3D-printed probe holder. A phototherapy eye shield was used as a safety precaution. (c) Optical fiber schematic showing two optical sources and a common detection fiber (SDD: DCS 2 cm; B-NIRS 3 cm).
Figure 1. (a) Neonatal NeuroMonitor (NNeMo) combining broadband near-infrared spectroscopy(B-NIRS) and diffuse correlation spectroscopy (DCS) techniques. (b) Optical fibers affixed to an infant’shead using a 3D-printed probe holder. A phototherapy eye shield was used as a safety precaution.(c) Optical fiber schematic showing two optical sources and a common detection fiber (SDD: DCS 2 cm;B-NIRS 3 cm).

Brain Sci. 2020, 10, 452 4 of 13
Following sterilization of the surgical site, a VT was performed by a pediatric neurosurgeon.A needle was inserted into the lateral ventricles (Figure 2a) to allow for CSF drainage (Figure 2b).Following sufficient CSF removal, as determined by the clinician, the needle was removed and gentlepressure was applied to the needle insertion site. Optical data were collected throughout the VT,extending a minimum of 10 min prior to and following the procedure. B-NIRS and DCS data wereacquired sequentially at a sampling rate of 250 ms and each dataset was averaged to achieve a finaltemporal resolution of 7 s.
Brain Sci. 2020, 10, x FOR PEER REVIEW 4 of 13
Following sterilization of the surgical site, a VT was performed by a pediatric neurosurgeon. A needle was inserted into the lateral ventricles (Figure 2a) to allow for CSF drainage (Figure 2b). Following sufficient CSF removal, as determined by the clinician, the needle was removed and gentle pressure was applied to the needle insertion site. Optical data were collected throughout the VT, extending a minimum of 10 min prior to and following the procedure. B-NIRS and DCS data were acquired sequentially at a sampling rate of 250 ms and each dataset was averaged to achieve a final temporal resolution of 7 s.
(a)
(b)
Figure 2. (a) Pediatric neurosurgeon inserting a needle into the ventricle and (b) draining cerebral spinal fluid (CSF) from the patient. Optical probes were affixed to the patient’s head throughout the procedure.
2.3. Instrumentation
NNeMo was constructed by combining B-NIRS and DCS modalities using a multiplexing shutter system controlled by custom software developed in LabView (2017 SP1, National Instruments, Austin, TX, USA) and MATLAB (R2018b, MathWorks, Natick, MI, USA) [27]. The acquisition times of both the B-NIRS and DCS were set to 250 ms (4 Hz). The shutter system cycled between the two subsystems in 3-s intervals. A total of 12 data points were acquired in each interval and averaged for both B-NIRS and DCS measurements. A 0.5-s delay was added between the intervals to account for shutter transition times and to avoid overlap between the B-NIRS and DCS data.
The B-NIRS light source was a 20-W halogen bulb (Hl-2000-HP, Ocean Optics, Delay Beach, FL, USA) that was filtered from 600 to 1000 nm and coupled into a custom optical fiber bundle (2.4 mm diameter, 30 µM core, 0.55 numerical aperture ((NA), Loptek, Berlin, Germany) that directed the light to the head. Light from the interrogated tissue was collected by 3 fiber bundles (2 mm diameter, 30 µm core, 0.55 NA, Loptek, Berlin, Germany) that were linearly aligned at the entrance of the spectrometer (iDus 420, Andor, Oxford Instruments, Abingdon, UK; 548–1085 nm bandwidth; 1.65 nm resolution; P&P Optica, Waterloo, ON, Canada). For DCS, light from a long coherence laser (DL785-100s, CrystaLaser, Reno, NV, USA) was coupled into a fiber bundle (4 × 200 µm core diameter, 0.22 NA, Loptek, Berlin, Germany) and directed towards the head. Light was collected by 4 single-mode fibers (8 µm core diameter, 0.12 NA, Loptek, Berlin, Germany) and coupled to a four-channel single photon counting module (SPCM-AQR-15-FC, Excelitas Technologies, Montreal, QC, Canada). The output from each detector was fed into an edge-detecting counter on a PCIe-6612 counter/timer data acquisition board (National Instruments) [28]. Photon counts were recorded and processed using in-house developed software (LabVIEW, MATLAB) [29]. For each detector, the software generated intensity autocorrelation curves at 50 delay times ranging from 1 µs to 1 ms.
Figure 2. (a) Pediatric neurosurgeon inserting a needle into the ventricle and (b) draining cerebralspinal fluid (CSF) from the patient. Optical probes were affixed to the patient’s head throughoutthe procedure.
2.3. Instrumentation
NNeMo was constructed by combining B-NIRS and DCS modalities using a multiplexing shuttersystem controlled by custom software developed in LabView (2017 SP1, National Instruments, Austin,TX, USA) and MATLAB (R2018b, MathWorks, Natick, MI, USA) [27]. The acquisition times of both theB-NIRS and DCS were set to 250 ms (4 Hz). The shutter system cycled between the two subsystems in3-s intervals. A total of 12 data points were acquired in each interval and averaged for both B-NIRS andDCS measurements. A 0.5-s delay was added between the intervals to account for shutter transitiontimes and to avoid overlap between the B-NIRS and DCS data.
The B-NIRS light source was a 20-W halogen bulb (Hl-2000-HP, Ocean Optics, Delay Beach, FL,USA) that was filtered from 600 to 1000 nm and coupled into a custom optical fiber bundle (2.4 mmdiameter, 30 µM core, 0.55 numerical aperture ((NA), Loptek, Berlin, Germany) that directed the lightto the head. Light from the interrogated tissue was collected by 3 fiber bundles (2 mm diameter,30 µm core, 0.55 NA, Loptek, Berlin, Germany) that were linearly aligned at the entrance of thespectrometer (iDus 420, Andor, Oxford Instruments, Abingdon, UK; 548–1085 nm bandwidth; 1.65 nmresolution; P&P Optica, Waterloo, ON, Canada). For DCS, light from a long coherence laser (DL785-100s,CrystaLaser, Reno, NV, USA) was coupled into a fiber bundle (4 × 200 µm core diameter, 0.22 NA,Loptek, Berlin, Germany) and directed towards the head. Light was collected by 4 single-mode fibers(8 µm core diameter, 0.12 NA, Loptek, Berlin, Germany) and coupled to a four-channel single photoncounting module (SPCM-AQR-15-FC, Excelitas Technologies, Montreal, QC, Canada). The output fromeach detector was fed into an edge-detecting counter on a PCIe-6612 counter/timer data acquisitionboard (National Instruments) [28]. Photon counts were recorded and processed using in-housedeveloped software (LabVIEW, MATLAB) [29]. For each detector, the software generated intensityautocorrelation curves at 50 delay times ranging from 1 µs to 1 ms.

Brain Sci. 2020, 10, 452 5 of 13
For use in the NICU, the optical fibers were designed to be lightweight and flexible, with a 90◦
bend at the patient end to further minimize weight on the infant. A 3D-printed fiber probe holder(5 × 2 × 1 cm; Flexible Resin, Form 2, Formlabs, Somerville, MA, USA) was designed to secure thethree optical probes (2 emission, 1 detection) to the patient’s forehead using a soft and flexible basematerial with a non-abrasive strap (Figure 1b).
2.4. Data Processing
2.4.1. NIRS Analysis: Quantifying StO2 and Changes in oxCCO Concentration
Prior to clinical measurements, a reference spectrum was acquired using a pinhole attenuator tocharacterize the spectral properties of the optical system. In addition, a measurement of the dark noisewas acquired to characterize ambient light conditions. For the clinical NIRS data, each reflectancespectrum, R(λ), was corrected for the reference and dark count spectra as follows:
R(λ) = log10
(spectrumλ − darkλre f erenceλ − darkλ
), (1)
where spectrumλ refers to the clinical measurement at wavelength λ.To quantify chromophore concentrations, while accounting for the contribution of light scatter,
a derivative approach was utilized [18,30,31]. First and second derivatives of R(λ) were calculatedand fit to the solution of the diffusion approximation for a semi-infinite homogeneous medium [19].Light absorption (Equation (2)) and scattering (Equation (3)) parameters were input into the solutionas follows [30]:
µa(λ) = WF·εH2O(λ) + Hbb·εHb(λ) + HbOb
2·εHbO2(λ), (2)
where WF is the tissue water fraction, Hbb and HbO2b are baseline concentrations of deoxyhemoglobin
and oxyhemoglobin in µM, and ε refers to the unique extinction coefficient for each chromophore.
µs′ = A
(λ
800(nm)
)−α, (3)
where α is the scattering power and A is the µs’ value at λ = 800 nm. Reflectance spectra measured atbaseline were analyzed with a multi-parameter fitting algorithm based on a constrained least-squareminimization using a custom MATLAB function (fminsearchbnd). Briefly, second derivative R(λ)spectra were fit by the model between 815 and 845 nm to obtain WF. The WF value was incorporatedinto the second derivative fit from 680 to 800 nm to determine Hbb. Lastly, WF and Hbb were used inthe analysis of the first derivative spectrum. The fitting procedure extended from 680 to 845 nm toobtain an estimate of HbO2
b [30].Following baseline analysis, a modified Beer–Lambert law based on the UCLn algorithm
(Equation (4)) was used to calculate changes in hemoglobin and oxCCO concentrations for theduration of the study [22].
∆HbO2
∆Hb∆oxCCO
= 1DP
εHbO2(λ1) εHb(λ1) εoxCCO(λ1)
......
...εHbO2(λn) εHb(λn) εoxCCO(λn)
−1
×
∆A(λ1)
...∆A(λn)
, (4)
where ∆HbO2, ∆Hb, and ∆oxCCO are relative changes from baseline in oxy-hemoglobin,deoxy-hemoglobin, and the oxidation state of cytochrome c oxidase. The differential pathlength(DP) was set to 4.39 based on previous literature [32,33] and corrected for the wavelength dependency

Brain Sci. 2020, 10, 452 6 of 13
of the pathlength [34]. ∆A represents the measured change in attenuation. Relative and baselinemeasures of hemoglobin were combined to determine the tissue saturation as follows [27]:
StO2 =
(HbOb
2 + ∆HbO2)
(Hbb + ∆Hb) +(HbOb
2 + ∆HbO2) . (5)
2.4.2. DCS Analysis: Relative Measure of CBF
Acquired normalized intensity autocorrelation data were converted to electric field autocorrelationdata following the Siegert relation [35,36]:
g2(ρ, τ) = 1 + β
∣∣∣G1(ρ, τ)∣∣∣2
〈I(ρ, τ)〉2. (6)
where g2(ρ,τ) is the measured normalized intensity autocorrelation, β is the coherence factor, G1(ρ,τ) isthe electric field autocorrelation function, and <I(ρ,τ)> is the averaged detected intensity. The parameterρ refers to the SDD and τ is the correlation time. G1 was modeled using the solution to the diffusionapproximation for a semi-infinite homogenous medium and assuming the motion of light scattererscan be characterized by a pseudo-Brownian motion [35,37,38]. Fitting was conducted for ρ = 2 cmand using the dynamic µa measurements obtained by B-NIRS. A constant value for µs’ of 8 cm−1 wasused in accordance with recent literature [39]. Fitting each autocorrelation curve provided an index ofcerebral blood flow (CBFi).
2.5. Statistical Analysis
All data are presented as mean ± standard deviation (range) unless otherwise noted. Since thetapping duration varied between procedures, the perfusion, oxygen saturation, and metabolic datacollected for each VT were temporally normalized to the average tap duration to obtain mean timecourses. For pre- and post-VT statistics, data were limited to two minutes prior to needle insertionand following needle removal to avoid motion artifacts. To assess the overall change in CBFi, StO2,and oxCCO due to a VT, a one-tailed paired t-test was used to compare pre- and post-VT measurements.Potential outliers were identified as points greater than q3 + w× (q3− q1) or less than q1 −w × (q3 − q1)in the box plots, where w represents the whisker length and q indicates the quartile number. Statisticswere repeated excluding any outliers. A matched pairs power analysis was conducted using theG*Power 3 software (v3.1.9.7, Düsseldorf, Germany) to calculate the total sample size required toachieve significance [40]. Statistical significance was based on a p-value < 0.05; power was set to 0.8.
3. Results
Optical measurements were acquired during 14 ventricular taps across four patients (one female,three males, gestational age 25.0 to 37.6 weeks, mean = 29.2 ± 5.6 weeks). Data from four eventswere excluded due to excessive patient motion. A further three B-NIRS datasets were excluded dueto ambient light contamination. DCS data acquired during these periods were not impacted andremained in the analysis. A total of 10 ventricular taps were analyzed for CBFi, and seven for StO2 andoxCCO. Clinical parameters are displayed in Table 1.
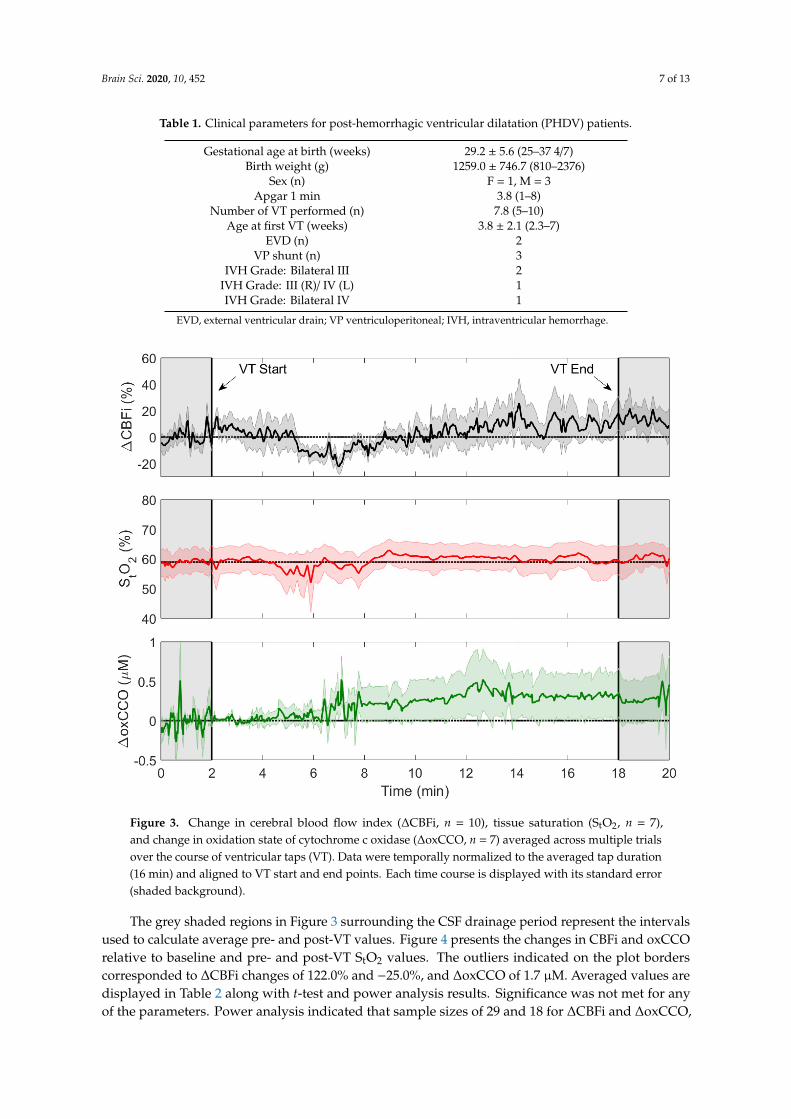
Infants were monitored continuously throughout the ventricular tap, spanning needle insertionand CSF drainage. Ventricular tap duration varied across the interventions with an average durationof 16.1 ± 7.7 min (range: 8.75 to 29.25 min). Average time courses of CBFi, StO2, and oxCCO duringthe tapping procedure are displayed in Figure 3.
Brain Sci. 2020, 10, 452 7 of 13
Table 1. Clinical parameters for post-hemorrhagic ventricular dilatation (PHDV) patients.
Gestational age at birth (weeks) 29.2 ± 5.6 (25–37 4/7)Birth weight (g) 1259.0 ± 746.7 (810–2376)
Sex (n) F = 1, M = 3Apgar 1 min 3.8 (1–8)
Number of VT performed (n) 7.8 (5–10)Age at first VT (weeks) 3.8 ± 2.1 (2.3–7)
EVD (n) 2VP shunt (n) 3
IVH Grade: Bilateral III 2IVH Grade: III (R)/ IV (L) 1IVH Grade: Bilateral IV 1
EVD, external ventricular drain; VP ventriculoperitoneal; IVH, intraventricular hemorrhage.
Brain Sci. 2020, 10, x FOR PEER REVIEW 7 of 13
Infants were monitored continuously throughout the ventricular tap, spanning needle insertion and CSF drainage. Ventricular tap duration varied across the interventions with an average duration of 16.1 ± 7.7 min (range: 8.75 to 29.25 min). Average time courses of CBFi, StO2, and oxCCO during the tapping procedure are displayed in Figure 3.
Figure 3. Change in cerebral blood flow index (ΔCBFi, n = 10), tissue saturation (StO2, n = 7), and change in oxidation state of cytochrome c oxidase (ΔoxCCO, n = 7) averaged across multiple trials over the course of ventricular taps (VT). Data were temporally normalized to the averaged tap duration (16 min) and aligned to VT start and end points. Each time course is displayed with its standard error (shaded background).
The grey shaded regions in Figure 3 surrounding the CSF drainage period represent the intervals used to calculate average pre- and post-VT values. Figure 4 presents the changes in CBFi and oxCCO relative to baseline and pre- and post-VT StO2 values. The outliers indicated on the plot borders corresponded to ΔCBFi changes of 122.0% and −25.0%, and ΔoxCCO of 1.7 µM. Averaged values are displayed in Table 2 along with t-test and power analysis results. Significance was not met for any of the parameters. Power analysis indicated that sample sizes of 29 and 18 for ΔCBFi and ΔoxCCO, respectively, would be required to achieve significance. A significant increase was found for both ΔCBFi and ΔoxCCO if outliers were excluded.
Figure 3. Change in cerebral blood flow index (∆CBFi, n = 10), tissue saturation (StO2, n = 7),and change in oxidation state of cytochrome c oxidase (∆oxCCO, n = 7) averaged across multiple trialsover the course of ventricular taps (VT). Data were temporally normalized to the averaged tap duration(16 min) and aligned to VT start and end points. Each time course is displayed with its standard error(shaded background).
The grey shaded regions in Figure 3 surrounding the CSF drainage period represent the intervalsused to calculate average pre- and post-VT values. Figure 4 presents the changes in CBFi and oxCCOrelative to baseline and pre- and post-VT StO2 values. The outliers indicated on the plot borderscorresponded to ∆CBFi changes of 122.0% and −25.0%, and ∆oxCCO of 1.7 µM. Averaged values aredisplayed in Table 2 along with t-test and power analysis results. Significance was not met for anyof the parameters. Power analysis indicated that sample sizes of 29 and 18 for ∆CBFi and ∆oxCCO,

Brain Sci. 2020, 10, 452 8 of 13
respectively, would be required to achieve significance. A significant increase was found for both∆CBFi and ∆oxCCO if outliers were excluded.Brain Sci. 2020, 10, x FOR PEER REVIEW 8 of 13
Figure 4. Boxplots showing changes in CBFi (a) and oxCCO (c) following ventricular tap and StO2 (b) before and after the tap. Results are based on the difference between pre- and post-VT measurements that were averaged over 2-min periods. Individual data points are displayed; outliers are indicated by the crosses on the borders and represent ΔCBFi values of 122% and −25% and ΔoxCCO of 1.7 µM.
Table 2. Average changes following VT relative to baseline, t-test, and power analysis.
Statistical parameter ΔCBFi (%) ΔStO2 (%) ΔoxCCO (µM)
Average change 14.6 ± 37.6 1.9 ± 4.9 0.4 ± 0.6
p-value 0.09 0.20 0.09
Required sample size for significance1 29 45 18
Average change excluding outliers 6.0 ± 7.7 - 0.1 ± 0.1
p-value excluding outliers 0.05 - 0.02
1 Power analysis with G*Power 3 [40], (Power = 0.8; error probability 0.05).
4. Discussion
The purpose of this study was to implement the recently developed Neonatal NeuroMonitor (NNeMo) to assess cerebral hemodynamics and metabolism during ventricular taps in patients with post-hemorrhagic ventricular dilatation. Compared with commercial NIRS devices that focus on monitoring StO2, the goal of implementing NNeMo was to assess the direct impact of a VT on CBF, as measured by DCS, and cerebral oxygen metabolism, as determined by monitoring oxCCO with B-NIRS. Both methods provide continuous recordings, which enabled CBFi and oxCCO to be monitored throughout the tapping procedure (Figure 3).
In hydrocephalus, decreases in cerebral perfusion are expected to precede changes in metabolism and clinical symptoms [41]. In agreement with this concept, reductions in CBF have been shown to impact metabolism only when CBF drops below a certain threshold [27,42]. During a VT, as the ventricle volume and ICP decrease, perfusion is expected to improve. The possibility of concurrent changes in metabolism would therefore depend on the extent to which CBF is improved by the VT. A large increase in oxCCO following a VT would suggest that the mitochondria were oxygen-limited prior to the procedure, implying that the intervention could have been performed earlier [43]. In this study, it was anticipated that a VT would improve CBF, but the magnitude of the perfusion increase would likely not be sufficient to have an effect on oxCCO. Following 10 VTs, a non-significant increase was found in ΔCBFi (14.6 ± 37.6%, p = 0.09) and ΔoxCCO (0.4 ± 0.6 µM, p = 0.09), while little change was observed in ΔStO2 (1.9 ± 4.9%, p = 0.2). Power analysis indicated that achieving significance for these relatively small increases would require a sample size of 29 for ΔCBFi and 18 for ΔoxCCO. Removing the outliers in the ΔCBFi (n = 2) and ΔoxCCO (n = 1) datasets did
a b c
Figure 4. Boxplots showing changes in CBFi (a) and oxCCO (c) following ventricular tap and StO2 (b)before and after the tap. Results are based on the difference between pre- and post-VT measurementsthat were averaged over 2-min periods. Individual data points are displayed; outliers are indicated bythe crosses on the borders and represent ∆CBFi values of 122% and −25% and ∆oxCCO of 1.7 µM.
Table 2. Average changes following VT relative to baseline, t-test, and power analysis.
Statistical Parameter ∆CBFi (%) ∆StO2 (%) ∆oxCCO (µM)
Average change 14.6 ± 37.6 1.9 ± 4.9 0.4 ± 0.6p-value 0.09 0.20 0.09
Required sample size for significance 1 29 45 18Average change excluding outliers 6.0 ± 7.7 - 0.1 ± 0.1
p-value excluding outliers 0.05 - 0.021 Power analysis with G*Power 3 [40], (Power = 0.8; error probability 0.05).
4. Discussion
The purpose of this study was to implement the recently developed Neonatal NeuroMonitor(NNeMo) to assess cerebral hemodynamics and metabolism during ventricular taps in patients withpost-hemorrhagic ventricular dilatation. Compared with commercial NIRS devices that focus onmonitoring StO2, the goal of implementing NNeMo was to assess the direct impact of a VT on CBF,as measured by DCS, and cerebral oxygen metabolism, as determined by monitoring oxCCO withB-NIRS. Both methods provide continuous recordings, which enabled CBFi and oxCCO to be monitoredthroughout the tapping procedure (Figure 3).
In hydrocephalus, decreases in cerebral perfusion are expected to precede changes in metabolismand clinical symptoms [41]. In agreement with this concept, reductions in CBF have been shownto impact metabolism only when CBF drops below a certain threshold [27,42]. During a VT, as theventricle volume and ICP decrease, perfusion is expected to improve. The possibility of concurrentchanges in metabolism would therefore depend on the extent to which CBF is improved by the VT.A large increase in oxCCO following a VT would suggest that the mitochondria were oxygen-limitedprior to the procedure, implying that the intervention could have been performed earlier [43]. In thisstudy, it was anticipated that a VT would improve CBF, but the magnitude of the perfusion increasewould likely not be sufficient to have an effect on oxCCO. Following 10 VTs, a non-significant increasewas found in ∆CBFi (14.6 ± 37.6%, p = 0.09) and ∆oxCCO (0.4 ± 0.6 µM, p = 0.09), while little changewas observed in ∆StO2 (1.9 ± 4.9%, p = 0.2). Power analysis indicated that achieving significancefor these relatively small increases would require a sample size of 29 for ∆CBFi and 18 for ∆oxCCO.Removing the outliers in the ∆CBFi (n = 2) and ∆oxCCO (n = 1) datasets did result in significant

Brain Sci. 2020, 10, 452 9 of 13
increases in both parameters; however, the average changes remained small (6.0 ± 7.7% for ∆CBFi and0.1 ± 0.1 µM for ∆oxCCO).
Several studies have investigated the potential impact of CSF drainage on cerebral hemodynamicsin PHVD patients. An increase in CBF velocity was found by Doppler ultrasound across sevenpatients [44], and stable oxCCO, as measured by NIRS, in 23 infants receiving a VT or lumbar puncture(LP) [45]. In an earlier study, Casaer et al. reported that oxCCO increased in infants with grade3 or 4 IVH who received an LP if patients had clinical signs of elevated ICP (i.e., increased headcircumference, bulged fontanel, n = 4), but not if these symptoms were absent (n = 4) [46,47]. Similarly,elevated cerebral oxygenation has been reported during cerebrospinal fluid removal, which wasinterpreted as evidence of increased CBF [45,48,49]. Previous work by our group measured absoluteCBF and the cerebral metabolic rate of oxygen (CMRO2) before and following a VT using dynamiccontrast-enhanced NIRS [14]. A significant increase in CBF (15.6%) across 20 VTs was found with nochange in CMRO2. In general, evidence of increased CBF following CSF removal has been consistentacross studies. The lack of a metabolic response can be explained by the modest perfusion increase,indicating that the reduction in CBF prior to the VT was not sufficient to impede oxygen delivery [18,31].The results of the current study complement these findings as the average increases in CBFi andoxCCO were small and only reached significance after removing outliers. It is important to note thatthe technologies used across studies to monitor cerebral perfusion and oxygen metabolism are quitedifferent, yet the findings are similar.
Compared with McLachlan et al. [14], the use of the hybrid B-NIRS/DCS system had theadvantages of not requiring an injection of an exogenous contrast agent to assess cerebral perfusionand metabolism and providing continuous monitoring of these parameters throughout the tappingprocedure. The combination of B-NIRS and DCS in NNeMo was achieved using a multiplexing shuttersystem to prevent crosstalk between the two techniques. The intensity of the light from the DCS laseris large enough to easily saturate the B-NIRS spectrometer, which impedes its ability to detect therelatively small spectral features of oxCCO. Conversely, broadband light from the B-NIRS light sourceis highly incoherent, which can degrade the temporal correlation of dynamic light scattering used byDCS to measure CBFi [50]. These issues can be overcome by cycling data acquisition between the twotechniques. In this study, a sample rate of 4 Hz for both systems with an overall cycling time of 7 swas considered sufficient, given the procedure was between 10 to 30 min in duration. It should benoted, however, that the multiplexing shutter system has the flexibility to achieve higher temporalresolutions if required. Both systems are capable of sampling rates up to 10 Hz, which could beused for instance to capture blood flow pulsatility [28]. The minimum cycling time would be on theorder of 300 ms, accounting for shutter opening and closing times of less than 50 ms [51]. Alternately,truly simultaneous measurements could be achieved using optical filters to selectively block B-NIRSand DCS light sources from the opposing detectors. Recent works describing hybrid B-NIRS/DCS andtime-resolved NIRS/DCS systems utilizing bandpass and notch filters have been proposed [50,52,53].
In this clinical application, the two major sources of signal contamination were motion artifactsand ambient light. Maintaining adequate probe contact with the scalp was challenging on infantswith PHVD as the head is distended due to the enlarged ventricles. As CSF is drained during a VT,head circumference decreases, which can loosen the straps holding the probes to the head. To mitigatethis issue, the probes were placed on the forehead above the frontoparietal cortex, where there isminimal change in head circumference. In addition, the elastic property of the strap used to hold theprobes in place helped maintain good contact throughout the procedure. To minimize motion artifacts,an NICU nurse gently restrained the patient’s head during the VT. Other sources of motion were therepositioning of the infant in the cot for needle insertion and the application of pressure to the headafter the needle was retracted (Figure 2). As a result, data analysis was limited to 2-min windowsimmediately prior to and following the VT. This short period prevented monitoring for possiblelong-term changes after the VT, despite NNeMo’s measurement stability over extended durations [27].In three experiments, subjects were located in an environment with excessive ambient light, as reflected

Brain Sci. 2020, 10, 452 10 of 13
by greater dark count measurements acquired by B-NIRS. Since oxCCO only contributes approximately10% of the total spectral signal [22], it was necessary to remove B-NIRS datasets in which the darkcount was deemed excessive. In contrast, ambient light did not have the same impact on the DCSmeasurements due to the stronger intensity of the laser and therefore these datasets were included inthe analysis.
Another potential source of error with optical neuromonitoring methods is the effect of scalpcontamination. The influence of the scalp is considerably less in infants compared with adults,and within this study its effects were mitigated using appropriate source-detector distances for B-NIRS(SDD = 3 cm) and DCS (SDD = 2 cm) [54]. An additional source of signal contamination unique tohydrocephalus is possible light loss in the enlarged ventricle as the cortical mantle becomes increasinglythin. Our group demonstrated that this effect could distort absorption spectra as the thickness ofthe cortical mantle approaches 1 cm [14]. This likely did not have a significant effect on the CBFimeasurements since the SDD was 2 cm. The NIRS spectra were, however, acquired with SDD = 3 cm,which would increase the chance of light loss in the ventricles. The excellent agreement in meanbaseline StO2 values from the current and previous study—58.4 ± 9.7% compared to 58.9 ± 2.7% fromreference [14]—indicates that cortical thickness did not have a significant effect.
Future work will investigate a potential correlation of hemodynamic changes with subsequentmarkers of brain injury. Comparison to clinical outcomes has the potential to establish clinicalthresholds of perfusion/metabolic change and could aid in describing VT efficacy or in gauging braininjury severity during the progression of PHVD.
5. Conclusions
In summary, this feasibility study presents an optical system capable of providing real-timemonitoring of cerebral perfusion and oxygen metabolism in the NICU. In this application, cerebralblood flow and metabolic changes monitored throughout VTs were small and only reached significanceafter removing outliers. These results are in good agreement with previous studies. Considering thatthe hybrid optical system is portable and completely non-invasive, it is well suited for neuromonitoringin PHVD patients who may be suspected of larger cerebral hemodynamic changes based onclinical symptoms.
Author Contributions: Conceptualization, K.S.L., S.d.R., M.D., S.B., and V.H.; methodology, A.R., L.C.M.Y., M.K.,M.L., J.J.L.C.; software, A.R., L.C.M.Y., D.M., M.K.; formal analysis, A.R., D.M.; investigation, A.R., D.M., M.S.;data curation, A.R., M.K., M.L.; writing—original draft preparation, A.R., D.M., M.S., K.S.L.; writing—review andediting, A.R., L.C.M.Y., D.M., M.S., M.K., M.L., J.J.L.C., V.H., S.B., M.D., S.d.R., K.S.L.; supervision, K.S.L., S.d.R.,M.D., S.B., and V.H.; funding acquisition, K.S.L. All authors have read and agreed to the published version ofthe manuscript.
Funding: This research was funded by Canadian Institutes of Health Research (CGP-14171) and National Scientificand Engineering Research Council (CHRP 478470).
Acknowledgments: The authors would like to acknowledge the newborns and their families who participated inthe study and thank Gemma Bale for help in implementing the UCLn algorithm.
Conflicts of Interest: The authors declare no conflict of interest. The funders had no role in the design of thestudy; in the collection, analyses, or interpretation of data; in the writing of the manuscript, or in the decision topublish the results.
References
1. Canadian Institute for Health Information. Highlights of 2010–2011 Selected Indicators Describing theBirthing Process in Canada. 2012; pp. 1–10. Available online: https://secure.cihi.ca/estore/productSeries.htm?pc=PCC226 (accessed on 10 July 2020).
2. Volpe, J.J. Brain injury in premature infants: A complex amalgam of destructive and developmentaldisturbances. Lancet Neurol. 2009, 8, 110–124. [CrossRef]

Brain Sci. 2020, 10, 452 11 of 13
3. Lin, P.Y.; Hagan, K.; Fenoglio, A.; Grant, P.E.; Franceschini, M.A. Reduced cerebral blood flow and oxygenmetabolism in extremely preterm neonates with low-grade germinal matrix- intraventricular hemorrhage.Sci. Rep. 2016, 6, 25903. [CrossRef] [PubMed]
4. Bassan, H. Intracranial Hemorrhage in the Preterm Infant: Understanding It, Preventing It. Clin. Perinatol.2009, 36, 737–762. [CrossRef] [PubMed]
5. Cherian, S.; Whitelaw, A.; Thoresen, M.; Love, S. The Pathogenesis of Neonatal Post-hemorrhagicHydrocephalus. Brain Pathol. 2006. [CrossRef] [PubMed]
6. Klinger, G.; Osovsky, M.; Boyko, V.; Sokolover, N.; Sirota, L.; Lerner-Geva, L.; Reichman, B. Risk factorsassociated with post-hemorrhagic hydrocephalus among very low birth weight infants of 24–28 weeksgestation. J. Perinatol. 2016, 36, 557–563. [CrossRef]
7. Christian, E.A.; Jin, D.L.; Attenello, F.; Wen, T.; Cen, S.; Mack, W.J.; Krieger, M.D.; McComb, J.G. Trends inhospitalization of preterm infants with intraventricular hemorrhage and hydrocephalus in the United States,2000–2010. J. Neurosurg. Pediatr. 2016, 17, 260–269. [CrossRef]
8. Cizmeci, M.N.; de Vries, L.S.; Ly, L.G.; van Haastert, I.C.; Groenendaal, F.; Kelly, E.N.; Traubici, J.; Whyte, H.E.;Leijser, L.M. Periventricular Hemorrhagic Infarction in Very Preterm Infants: Characteristic SonographicFindings and Association with Neurodevelopmental Outcome at Age 2 Years. J. Pediatr. 2020, 217, 79–85.[CrossRef]
9. Brouwer, M.J.; de Vries, L.S.; Groenendaal, F.; Koopman, C.; Pistorius, L.R.; Mulder, E.J.H.; Benders, M.J.N.L.New Reference Values for the Neonatal Cerebral Ventricles. Radiology 2012, 262. [CrossRef] [PubMed]
10. De Vries, L.S.; Groenendaal, F.; Liem, K.D.; Heep, A.; Brouwer, A.J.; Van’T Verlaat, E.; Benavente-Fernández, I.;Van Straaten, H.L.; Van Wezel-Meijler, G.; Smit, B.J.; et al. Treatment thresholds for intervention inposthaemorrhagic ventricular dilation: A randomised controlled trial. Arch. Dis. Child. Fetal Neonatal Ed.2019. [CrossRef] [PubMed]
11. Cizmeci, M.N.; Khalili, N.; Claessens, N.H.P.; Groenendaal, F.; Liem, K.D.; Heep, A.; Benavente-Fernández, I.;van Straaten, H.L.M.; van Wezel-Meijler, G.; Steggerda, S.J.; et al. Assessment of Brain Injury and BrainVolumes after Posthemorrhagic Ventricular Dilatation: A Nested Substudy of the Randomized ControlledELVIS Trial. J. Pediatr. 2019, 208, 191–197. [CrossRef]
12. Leijser, L.M.; Miller, S.P.; Van Wezel-Meijler, G.; Brouwer, A.J.; Traubici, J.; Van Haastert, I.C.; Whyte, H.E.;Groenendaal, F.; Kulkarni, A.V.; Han, K.S.; et al. Posthemorrhagic ventricular dilatation in preterm infantsWhen best to intervene? Neurology 2018. [CrossRef] [PubMed]
13. Lo, M.; Kishimoto, J.; Eagleson, R.; Bhattacharya, S.; de Ribaupierre, S. Does ventricular volume affect theneurodevelopmental outcome in infants with intraventricular hemorrhage? Child Nerv. Syst. 2020, 36,569–575. [CrossRef]
14. McLachlan, P.J.; Kishimoto, J.; Diop, M.; Milej, D.; Lee, D.S.C.; de Ribaupierre, S.; St. Lawrence, K.Investigating the effects of cerebrospinal fluid removal on cerebral blood flow and oxidative metabolism ininfants with post-hemorrhagic ventricular dilatation. Pediatr. Res. 2017, 82, 634–641. [CrossRef] [PubMed]
15. Kishimoto, J.; Fenster, A.; Lee, D.S.C.; de Ribaupierre, S. Quantitative 3-D head ultrasound measurements ofventricle volume to determine thresholds for preterm neonates requiring interventional therapies followingposthemorrhagic ventricle dilatation. J. Med. Imaging 2018, 5. [CrossRef] [PubMed]
16. Polito, A.; Ricci, Z.; Di Chiara, L.; Giorni, C.; Iacoella, C.; Sanders, S.P.; Picardo, S. Cerebral blood flow duringcardiopulmonary bypass in pediatric cardiac surgery: The role of transcranial Doppler—A systematic reviewof the literature. Cardiovasc. Ultrasound 2006, 4, 47. [CrossRef] [PubMed]
17. Baker, W.B.; Balu, R.; He, L.; Kavuri, V.C.; Busch, D.R.; Amendolia, O.; Quattrone, F.; Frangos, S.;Maloney-Wilensky, E.; Abramson, K.; et al. Continuous non-invasive optical monitoring of cerebralblood flow and oxidative metabolism after acute brain injury. J. Cereb. Blood Flow Metab. 2019, 39, 1469–1485.[CrossRef] [PubMed]
18. Diop, M.; Kishimoto, J.; Toronov, V.; Lee, D.S.C.; St. Lawrence, K. Development of a combined broadbandnear-infrared and diffusion correlation system for monitoring cerebral blood flow and oxidative metabolismin preterm infants. Biomed. Opt. Express 2015, 6, 3907–3918. [CrossRef]
19. Chock, V.Y.; Variane, G.F.T.; Netto, A.; Van Meurs, K.P. NIRS improves hemodynamic monitoring anddetection of risk for cerebral injury: Cases in the neonatal intensive care nursery. J. Matern. Neonatal Med.2020, 33, 1802–1810. [CrossRef]

Brain Sci. 2020, 10, 452 12 of 13
20. Bale, G.; Taylor, N.; Mitra, S.; Sudakou, A.; de Roever, I.; Meek, J.; Robertson, N.; Tachtsidis, I. Near-InfraredSpectroscopy Measured Cerebral Blood Flow from Spontaneous Oxygenation Changes in Neonatal BrainInjury. In Oxygen Transport to Tissue XLI; Ryu, P.-D., LaManna, J.C., Harrison, D.K., Lee, S.-S., Eds.; SpringerInternational Publishing: Cham, Switzerland, 2020; pp. 3–9, ISBN 978-3-030-34461-0.
21. Kewin, M.; Rajaram, A.; Milej, D.; Abdalmalak, A.; Morrison, L.; Diop, M.; St Lawrence, K. Evaluation ofhyperspectral NIRS for quantitative measurements of tissue oxygen saturation by comparison to time-resolvedNIRS. Biomed. Opt. Express 2019, 10, 4789–4802. [CrossRef]
22. Bale, G.; Elwell, C.E.; Tachtsidis, I. From Jöbsis to the present day: A review of clinical near-infraredspectroscopy measurements of cerebral cytochrome-c-oxidase. J. Biomed. Opt. 2016, 21. [CrossRef]
23. Buckley, E.M.; Parthasarathy, A.B.; Grant, P.E.; Yodh, A.G.; Franceschini, M.A. Diffuse correlation spectroscopyfor measurement of cerebral blood flow: Future prospects. Neurophotonics 2014, 1, 011009. [CrossRef][PubMed]
24. He, L.; Baker, W.B.; Milej, D.; Kavuri, V.C.; Mesquita, R.C.; Busch, D.R.; Abramson, K.; Jiang, Y.J.; Diop, M.; StLawrence, K.; et al. Noninvasive continuous optical monitoring of absolute cerebral blood flow in criticallyill adults. Neurophotonics 2018, 5, 045006. [CrossRef] [PubMed]
25. Pham, T.; Tgavalekos, K.; Sassaroli, A.; Blaney, G.; Fantini, S. Quantitative measurements of cerebral bloodflow with near-infrared spectroscopy. Biomed. Opt. Express 2019, 10, 2117. [CrossRef] [PubMed]
26. Durduran, T.; Zhou, C.; Buckley, E.M.; Kim, M.N.; Yu, G.; Choe, R.; Gaynor, J.W.; Spray, T.L.; Durning, S.M.;Mason, S.E.; et al. Optical measurement of cerebral hemodynamics and oxygen metabolism in neonates withcongenital heart defects. J. Biomed. Opt. 2010, 15, 037004. [CrossRef]
27. Rajaram, A.; Bale, G.; Kewin, M.; Morrison, L.B.; Tachtsidis, I.; St. Lawrence, K.; Diop, M. Simultaneousmonitoring of cerebral perfusion and cytochrome c oxidase by combining broadband near-infraredspectroscopy and diffuse correlation spectroscopy. Biomed. Opt. Express 2018, 9, 2588–2603. [CrossRef]
28. Wang, D.; Parthasarathy, A.B.; Baker, W.B.; Gannon, K.; Kavuri, V.; Ko, T.; Schenkel, S.; Li, Z.; Li, Z.;Mullen, M.T.; et al. Fast blood flow monitoring in deep tissues with real-time software correlators.Biomed. Opt. Express 2016, 7, 776–797. [CrossRef]
29. Khalid, M.; Milej, D.; Rajaram, A.; Abdalmalak, A.; Morrison, L.; Diop, M.; St. Lawrence, K. Development ofa stand-alone DCS system for monitoring absolute cerebral blood flow. Biomed. Opt. Express 2019, 10, 4607.[CrossRef]
30. Diop, M.; Wright, E.; Toronov, V.; Lee, T.-Y.; St Lawrence, K. Improved light collection and wavelet de-noisingenable quantification of cerebral blood flow and oxygen metabolism by a low-cost, off-the-shelf spectrometer.J. Biomed. Opt. 2014, 19, 057007. [CrossRef]
31. Arora, R.; Ridha, M.; Lee, D.S.C.; Elliott, J.; Rosenberg, H.C.; Diop, M.; Lee, T.Y.; St. Lawrence, K. Preservationof the metabolic rate of oxygen in preterm infants during indomethacin therapy for closure of the ductusarteriosus. Pediatr. Res. 2013, 73, 713–718. [CrossRef]
32. Wyatt, J.S.; Cope, M.; Delpy, D.T.; Richardson, C.E.; Edwards, A.D.; Wray, S.; Reynolds, E.O. Quantitation ofcerebral blood volume in human infants by near-infrared spectroscopy. J. Appl. Physiol. 1990, 68, 1086–1091.[CrossRef]
33. Duncan, A.; Meek, J.H.; Clemence, M.; Elwell, C.E.; Tyszczuk, L.; Cope, M.; Delpy, D. Optical pathlengthmeasurements on adult head, calf and forearm and the head of the newborn infant using phase resolvedoptical spectroscopy. Phys. Med. Biol. 1995, 40, 295–304. [CrossRef] [PubMed]
34. Essenpreis, M.; Elwell, C.E.; Cope, M.; van der Zee, P.; Arridge, S.R.; Delpy, D.T. Spectral dependence oftemporal point spread functions in human tissues. Appl. Opt. 1993, 32, 418. [CrossRef] [PubMed]
35. Verdecchia, K.; Diop, M.; Morrison, L.B.; Lee, T.-Y.; St. Lawrence, K. Assessment of the best flow model tocharacterize diffuse correlation spectroscopy data acquired directly on the brain. Biomed. Opt. Express 2015,6, 4288. [CrossRef]
36. Lemieux, P.-A.; Durian, D.J. Investigating non-Gaussian scattering processes by using nth -order intensitycorrelation functions. J. Opt. Soc. Am. A 1999, 16, 1651. [CrossRef]
37. Cheung, C.; Culver, J.P.; Takahashi, K.; Greenberg, J.H.; Yodh, A.G. In vivo cerebrovascular measurementcombining diffuse near-infrared absorption and correlation spectroscopies. Phys. Med. Biol. 2001, 46,2053–2065. [CrossRef] [PubMed]

Brain Sci. 2020, 10, 452 13 of 13
38. Verdecchia, K.; Diop, M.; Lee, T.-Y.; St. Lawrence, K. Quantifying the cerebral metabolic rate of oxygen bycombining diffuse correlation spectroscopy and time-resolved near-infrared spectroscopy. J. Biomed. Opt.2013, 18, 27007. [CrossRef] [PubMed]
39. Milej, D.; He, L.; Abdalmalak, A.; Baker, W.B.; Anazodo, U.C.; Diop, M.; Dolui, S.; Kavuri, V.C.; Pavlosky, W.;Wang, L.; et al. Quantification of cerebral blood flow in adults by contrast-enhanced near-infraredspectroscopy: Validation against MRI. J. Cereb. Blood Flow Metab. 2019. [CrossRef]
40. Faul, F.; Erdfelder, E.; Lang, A.-G.; Buchner, A. G*Power 3: A flexible statistical power analysis program forthe social, behavioral, and biomedical sciences. Behav. Res. Methods 2007, 39, 175–191. [CrossRef]
41. Richards, H.K.; Bucknall, R.M.; Jones, H.C.; Pickard, J.D. Uncoupling of LCBF and LCGU in two differentmodels of hydrocephalus: A review. Child Nerv. Syst. 1995, 11, 288–292. [CrossRef]
42. Cooper, J.A.; Tichauer, K.M.; Boulton, M.; Elliott, J.; Diop, M.; Arango, M.; Lee, T.-Y.; St Lawrence, K.Continuous monitoring of absolute cerebral blood flow by near-infrared spectroscopy during global andfocal temporary vessel occlusion. J. Appl. Physiol. 2011, 110, 1691–1698. [CrossRef]
43. Bale, G.; Mitra, S.; De Roever, I.; Sokolska, M.; Price, D.; Bainbridge, A.; Gunny, R.; Uria-avellanal, C.;Kendall, G.S.; Meek, J.; et al. Oxygen dependency of mitochondrial metabolism indicates outcome ofnewborn brain injury. J. Cereb. Blood Flow Metab. 2018. [CrossRef] [PubMed]
44. Hopman, J.C.; Klaessens, J.H.; Feuth, T.; Sengers, R.C.; Liem, K.D. Cerebral hemodynamics and oxygenationafter serial CSF drainage in infants with PHVD. Brain Dev. 2007, 29, 623–629. [CrossRef]
45. Soul, J.S.; Eichenwald, E.; Walter, G.; Volpe, J.J.; Du Plessis, A.J. CSF Removal in Infantile PosthemorrhagicHydrocephalus Results in Significant Improvement in Cerebral Hemodynamics. Pediatr. Res. 2004, 55,872–876. [CrossRef]
46. Casaer, P.; Siebenthal, K.; van der Vlugt, A.; Lagae, L.; Devlieger, H. Cytochrome aa3 and Intracranial Pressurein Newborn Infants; A Near Infrared Spectroscopy Study. Neuropediatrics 1992, 23, 111. [CrossRef] [PubMed]
47. Von Siebenthai, S.K.; Van Der Vlugt, A.; Devlieger, H.; Casaer, P. Effect of Changes in Intracranial Pressureon Cytochrome aa3 (Cytaa3) and haemoglobinvolume (Hbvol): A Near Infrared Spectroscopy (NIRS).Pediatr. Res. 1992, 32, 612. [CrossRef]
48. Norooz, F.; Urlesberger, B.; Giordano, V.; Weninger, M.; Berger, A.; Olischar, M. Decompressingposthaemorrhagic ventricular dilatation significantly improves regional cerebral oxygen saturation inpreterm infants. Acta Paediatr. 2015, 104, 663–669. [CrossRef]
49. Bembich, S.; Cont, G.; Bua, J.; Paviotti, G.; Demarini, S. Pediatric Neurology Cerebral Hemodynamics DuringNeonatal Cerebrospinal Fluid Removal. Pediatr. Neurol. 2019, 94, 70–73. [CrossRef]
50. Rajaram, A.; St. Lawrence, K.; Diop, M. Development of a hybrid broadband NIRS/diffusion correlationspectroscopy system to monitor preterm brain injury. In Proceedings of the SPIE BIOS, AdvancedBiomedical and Clinical Diagnostic and Surgical Guidance Systems XV, San Francisco, CA, USA, 28 January–2 February 2017. [CrossRef]
51. Diop, M.; Elliott, J.T.; Tichauer, K.M.; Lee, T.Y.; St. Lawrence, K. A broadband continuous-wave multichannelnear-infrared system for measuring regional cerebral blood flow and oxygen consumption in newbornpiglets. Rev. Sci. Instrum. 2009, 80, 54302. [CrossRef]
52. Milej, D.; Shahid, M.; Abdalmalak, A.; Rajaram, A.; Diop, M.; St. Lawrence, K. Characterizing DynamicCerebral Vascular Reactivity using a Hybrid System Combining Time-Resolved Near-Infrared and DiffuseCorrelation Spectroscopy. Biomed. Opt. Express 2020. [CrossRef]
53. Giovannella, M.; Contini, D.; Pagliazzi, M.; Pifferi, A.; Spinelli, L.; Erdmann, R.; Donat, R.; Rocchetti, I.;Rehberger, M.; König, N.; et al. BabyLux device: A diffuse optical system integrating diffuse correlationspectroscopy and time-resolved near- infrared spectroscopy for the neuromonitoring of the prematurenewborn brain. Neurophotonics 2019, 6. [CrossRef]
54. Milej, D.; Rajaram, A.; Abdalmalak, A.; Khalid, M.; Shahid, M.; Kewin, M.; St. Lawrence, K. AssessingExtracerebral Signal Contamination in Optical Measurements of Cerebral Blood Flow and Oxygenation.In Proceedings of the European Conference on Biomedical Optics, Clinical and Preclinical Optical DiagnosticsII, Munich, Germany, 23–25 June 2019. [CrossRef]
© 2020 by the authors. Licensee MDPI, Basel, Switzerland. This article is an open accessarticle distributed under the terms and conditions of the Creative Commons Attribution(CC BY) license (http://creativecommons.org/licenses/by/4.0/).
Copyright © 2022 FDOKUMEN