Adenosine Signaling Promotes Regeneration of Pancreatic β Cells In Vivo
10
Cell Metabolism Article Adenosine Signaling Promotes Regeneration of Pancreatic b Cells In Vivo Olov Andersson, 1, * Bruce A. Adams, 2 Daniel Yoo, 1 Gregory C. Ellis, 1 Philipp Gut, 1 Ryan M. Anderson, 1,3 Michael S. German, 2 and Didier Y.R. Stainier 1, * 1 Department of Biochemistry and Biophysics, Program in Developmental and Stem Cell Biology and Program in Genetics and Human Genetics, Diabetes Center, Institute for Regeneration Medicine and Liver Center, University of California, San Francisco, 1550 4th Street, San Francisco, CA 94158, USA 2 Department of Medicine, Diabetes Center, and Institute for Regeneration Medicine, University of California San Francisco, 35 Medical Center Way, San Francisco, CA 94143, USA 3 Present address: Wells Center for Pediatric Research, 635 Barnhill Drive, MS #2053, Indianapolis, IN 46202, USA *Correspondence: [email protected] (O.A.), [email protected] (D.Y.R.S.) DOI 10.1016/j.cmet.2012.04.018 SUMMARY Diabetes can be controlled with insulin injections, but a curative approach that restores the number of insulin-producing b cells is still needed. Using a zebrafish model of diabetes, we screened 7,000 small molecules to identify enhancers of b cell regen- eration. The compounds we identified converge on the adenosine signaling pathway and include exoge- nous agonists and compounds that inhibit degrada- tion of endogenously produced adenosine. The most potent enhancer of b cell regeneration was the adenosine agonist 5 0 -N-ethylcarboxamidoadenosine (NECA), which, acting through the adenosine receptor A2aa, increased b cell proliferation and accelerated restoration of normoglycemia in zebra- fish. Despite markedly stimulating b cell proliferation during regeneration, NECA had only a modest effect during development. The proliferative and glucose- lowering effect of NECA was confirmed in diabetic mice, suggesting an evolutionarily conserved role for adenosine in b cell regeneration. With this whole-organism screen, we identified components of the adenosine pathway that could be therapeuti- cally targeted for the treatment of diabetes. INTRODUCTION Diabetes is characterized by elevated blood glucose levels, a consequence of insufficient insulin supply and/or insulin resis- tance. Although diabetes can be treated with injections of insulin, a curative approach that increases life expectancy and reduces morbidity is an unmet medical need. Despite mechanistic differences, both type 1 and late-stage type 2 diabetes feature depletion of b cells, the insulin-producing cells of the pancreas. Experimental ablation of b cells by chemical treatment or partial pancreatectomy in rodents is followed by significant recovery of the b cell mass, indicating that the adult pancreas has the capacity to regenerate (reviewed by Bonner-Weir et al., 2010). This regenerative capacity could potentially be exploited therapeutically—if the underlying mechanisms were better understood. Indeed, although the transcriptional cascade that regulates b cell formation is fairly well characterized (reviewed by Pan and Wright, 2011), the extrinsic signals that regulate b cell regeneration remain unclear (reviewed by Halban et al., 2010). Several signals can increase b cell formation, by stimulating b cell neogenesis and/or proliferation. For example, hepatocyte growth factor, insulin-like growth factor I, and placental lactogen can increase b cell proliferation (reviewed by Ackermann and Gannon, 2007), while exendin-4 (a synthetic analog of glucagon-like peptide 1) (Xu et al., 1999; Lavine and Attie, 2010) or a combination of epidermal growth factor and gastrin (Krakowski et al., 1999; Rooman and Bouwens, 2004) has been reported to increase both the proliferation of b cells and their formation from ductal progenitors. However, recent find- ings in mice suggest that ductal progenitors do not contribute significantly to b cell neogenesis in adult organisms, and that combined epidermal growth factor and gastrin are not in fact efficient promoters of b cell neogenesis (Solar et al., 2009). In addition, most of these factors are peptide hormones, which affect a multitude of cellular processes and need to be adminis- tered by injection. There is therefore a need for small-molecule therapeutics that can specifically promote b cell regeneration and ideally be taken orally. Studies of factors affecting b cell regeneration in vivo have traditionally been based on hypothesis-driven selection of candi- date factors or on preliminary findings from in vitro screens. However, the candidate approach is biased, and in vitro screens cannot replicate the endogenous micro- and macroenviron- ments of a living organism—such as communication between different cell types and tissues, the existence of different types of endocrine progenitors, and physiological responses to b cell depletion. Unbiased screens performed in vivo are therefore warranted. The zebrafish model is particularly good for studying pancreatic development in vivo. First, the simplicity of its organ structures, e.g., the zebrafish embryo has only one pancreatic islet during the first week of development and allows rapid anal- ysis of cellular changes (reviewed by Kinkel and Prince, 2009). Second, zebrafish embryos are amenable to efficient transgene- sis and drug delivery. The zebrafish model is thus ideal for the Cell Metabolism 15, 885–894, June 6, 2012 ª2012 Elsevier Inc. 885
Transcript of Adenosine Signaling Promotes Regeneration of Pancreatic β Cells In Vivo
Cell Metabolism
Article
Adenosine Signaling PromotesRegeneration of Pancreatic b Cells In VivoOlov Andersson,1,* Bruce A. Adams,2 Daniel Yoo,1 Gregory C. Ellis,1 Philipp Gut,1 Ryan M. Anderson,1,3
Michael S. German,2 and Didier Y.R. Stainier1,*1Department of Biochemistry and Biophysics, Program in Developmental and Stem Cell Biology and Program in Genetics and Human
Genetics, Diabetes Center, Institute for Regeneration Medicine and Liver Center, University of California, San Francisco, 1550 4th Street,San Francisco, CA 94158, USA2Department of Medicine, Diabetes Center, and Institute for Regeneration Medicine, University of California San Francisco,
35 Medical Center Way, San Francisco, CA 94143, USA3Present address: Wells Center for Pediatric Research, 635 Barnhill Drive, MS #2053, Indianapolis, IN 46202, USA*Correspondence: [email protected] (O.A.), [email protected] (D.Y.R.S.)
DOI 10.1016/j.cmet.2012.04.018
SUMMARY
Diabetes can be controlled with insulin injections, buta curative approach that restores the number ofinsulin-producing b cells is still needed. Using azebrafish model of diabetes, we screened �7,000small molecules to identify enhancers of b cell regen-eration. The compounds we identified converge onthe adenosine signaling pathway and include exoge-nous agonists and compounds that inhibit degrada-tion of endogenously produced adenosine. Themost potent enhancer of b cell regeneration was theadenosine agonist 50-N-ethylcarboxamidoadenosine(NECA), which, acting through the adenosinereceptor A2aa, increased b cell proliferation andaccelerated restoration of normoglycemia in zebra-fish. Despite markedly stimulating b cell proliferationduring regeneration, NECA had only a modest effectduring development. The proliferative and glucose-lowering effect of NECA was confirmed in diabeticmice, suggesting an evolutionarily conserved rolefor adenosine in b cell regeneration. With thiswhole-organism screen, we identified componentsof the adenosine pathway that could be therapeuti-cally targeted for the treatment of diabetes.
INTRODUCTION
Diabetes is characterized by elevated blood glucose levels,
a consequence of insufficient insulin supply and/or insulin resis-
tance. Although diabetes can be treatedwith injections of insulin,
a curative approach that increases life expectancy and reduces
morbidity is an unmet medical need. Despite mechanistic
differences, both type 1 and late-stage type 2 diabetes feature
depletion of b cells, the insulin-producing cells of the pancreas.
Experimental ablation of b cells by chemical treatment or partial
pancreatectomy in rodents is followed by significant recovery
of the b cell mass, indicating that the adult pancreas has
the capacity to regenerate (reviewed by Bonner-Weir et al.,
C
2010). This regenerative capacity could potentially be exploited
therapeutically—if the underlying mechanisms were better
understood. Indeed, although the transcriptional cascade that
regulates b cell formation is fairly well characterized (reviewed
by Pan and Wright, 2011), the extrinsic signals that regulate
b cell regeneration remain unclear (reviewed by Halban et al.,
2010).
Several signals can increase b cell formation, by stimulating
b cell neogenesis and/or proliferation. For example, hepatocyte
growth factor, insulin-like growth factor I, and placental lactogen
can increase b cell proliferation (reviewed by Ackermann and
Gannon, 2007), while exendin-4 (a synthetic analog of
glucagon-like peptide 1) (Xu et al., 1999; Lavine and Attie,
2010) or a combination of epidermal growth factor and gastrin
(Krakowski et al., 1999; Rooman and Bouwens, 2004) has
been reported to increase both the proliferation of b cells and
their formation from ductal progenitors. However, recent find-
ings in mice suggest that ductal progenitors do not contribute
significantly to b cell neogenesis in adult organisms, and that
combined epidermal growth factor and gastrin are not in fact
efficient promoters of b cell neogenesis (Solar et al., 2009). In
addition, most of these factors are peptide hormones, which
affect a multitude of cellular processes and need to be adminis-
tered by injection. There is therefore a need for small-molecule
therapeutics that can specifically promote b cell regeneration
and ideally be taken orally.
Studies of factors affecting b cell regeneration in vivo have
traditionally been based on hypothesis-driven selection of candi-
date factors or on preliminary findings from in vitro screens.
However, the candidate approach is biased, and in vitro screens
cannot replicate the endogenous micro- and macroenviron-
ments of a living organism—such as communication between
different cell types and tissues, the existence of different types
of endocrine progenitors, and physiological responses to b cell
depletion. Unbiased screens performed in vivo are therefore
warranted. The zebrafish model is particularly good for studying
pancreatic development in vivo. First, the simplicity of its organ
structures, e.g., the zebrafish embryo has only one pancreatic
islet during the first week of development and allows rapid anal-
ysis of cellular changes (reviewed by Kinkel and Prince, 2009).
Second, zebrafish embryos are amenable to efficient transgene-
sis and drug delivery. The zebrafish model is thus ideal for the
ell Metabolism 15, 885–894, June 6, 2012 ª2012 Elsevier Inc. 885
A
B C D
E
Figure 1. A Chemical Screen for b Cell Regeneration
(A) Schema for the b cell regeneration screen. The pancreatic b cells are
conditionally targeted for ablation from 3-4 dpf by using b cell-specific
expression of nitroreductase (Tg[ins:CFP-NTR]), which converts metronida-
zole (MTZ) into a cytotoxic product. After washing away theMTZ, the larvae are
placed in 96-well plates and exposed to 2–50 mM of the compounds in 1%
DMSO. After 2 days of recovery, from 4-6 dpf, b cell regeneration can be
easily quantified in double-transgenic larvae, Tg(ins:CFP-NTR);Tg(ins:Kaede),
because Kaede labels the b cells with bright fluorescence.
(B) Picture of a control Tg(ins:Kaede) larva at 6 dpf that was not affected by the
MTZ treatment (because it does not express NTR) and therefore displays
a typical number of b cells, as visualized with the microscope used for
screening. The inset displays a magnified view of the pancreatic islet (outlined
by the dashed square).
(C) Tg(ins:CFP-NTR);Tg(ins:Kaede) larva (6 dpf) following b cell ablation with
MTZ from 3-4 dpf and vehicle treatment from 4-6 dpf. Typically, these control
larvae have three to seven b cells at this stage.
(D) Tg(ins:CFP-NTR);Tg(ins:Kaede) larva following b cell ablation with MTZ
from 3-4 dpf and treatment with the hit compound NECA from 4-6 dpf. This
particular larva contains too many b cells to count without the use of confocal
microscopy.
(E) The hit compounds converge on adenosine signaling/metabolism by
targeting adenosine kinase (A-134974), adenosine receptors (NECA), and
phosphodiesterase 3/4 (Cilostamide and Zardaverine). Compounds that
increased b cell regeneration more than 2-fold after 2 days of treatment are
labeled in red. After rescreening all activators of adenosine signaling contained
in the Sigma LOPAC library, we found that an adenosine deaminase inhibitor
(EHNA) and another nonselective adenosine agonist (IB-MECA) (labeled in
blue) could also increase b cell regeneration, although less than 2-fold. See
also Figure S1.
Cell Metabolism
Adenosine Signaling Promotes b Cell Regeneration
efficient transgenic-based and cost-effective screening of small-
molecule libraries in vivo (reviewed by Zon and Peterson, 2005).
Indeed, several chemical screens in zebrafish have identified
drugs that are now in clinical development (North et al., 2007;
Yu et al., 2008).
Here, we screened �7,000 compounds in a transgenic zebra-
fish model of b cell regeneration in which a conditionally toxic
protein is expressed in b cells (Curado et al., 2007; Pisharath
et al., 2007). This screening approach allowed us to discover
compounds that promote b cell regeneration regardless of
cellular mechanism, e.g., proliferation (Dor et al., 2004), neogen-
esis (Inada et al., 2008; Xu et al., 2008), or transdifferentiation
(Zhou et al., 2008; Thorel et al., 2010), and thus does not restrict
the discovery of hit compounds. We then used secondary
assays to pinpoint the precise mechanisms of action. Finally,
we tested the most promising hit compound in a mouse model
886 Cell Metabolism 15, 885–894, June 6, 2012 ª2012 Elsevier Inc.
of diabetes to assess the relevance of the findings to b cell regen-
eration in adult mammals. Using this three-pronged approach,
we found that the most potent enhancers of b cell regeneration
activate the adenosine signaling pathway and increase b cell
regeneration by promoting b cell proliferation.
RESULTS
In Vivo Chemical Screen for b Cell RegenerationWe performed a chemical screen for enhancers of b cell regen-
eration by using a zebrafish model in which b cells are ablated
by nitroreductase (NTR), an enzyme that converts the chemical
metronidazole (MTZ) to a toxic product that induces b cell
apoptosis (Curado et al., 2007; Pisharath et al., 2007). Impor-
tantly, b cell mass recovers onceMTZ is removed from thewater,
and the zebrafish survive to adulthood. Using this system, we
ablated the b cells 3 to 4 days postfertilization (dpf) (at which
stage each larva has �35 b cells) and then treated the larvae
with the compounds from 4 to 6 dpf, when all the structures of
the mature pancreas are present (Figure 1A). The transgenic
larvae we used for this screen express a fusion protein of cyan
fluorescent protein (CFP) andNTR under the control of the insulin
promoter,Tg(ins:CFP-NTR). BecauseCFP is onlyweakly fluores-
cent, we crossed the Tg(ins:CFP-NTR) line with another trans-
genic line that expresses the brightly fluorescent protein Kaede
under the control of the insulin promoter, Tg(ins:Kaede). By treat-
ing these double-transgenic Tg(ins:CFP-NTR);Tg(ins:Kaede)
larvae with MTZ from 3 to 4 dpf, we ablated essentially all
b cells and could easily follow the ensuing b cell regeneration.
At 4 dpf, we washed out MTZ and transferred the larvae to
96-well plates for treatment with the compounds. After allowing
b cells to regenerate for 2 days in the presence of chemicals
from the libraries, we analyzed b cell regeneration by evaluating
the number of Tg(ins:Kaede)-positive b cells. At 6 dpf, control
larvae carrying only the Tg(ins:Kaede) transgene were not
affected by MTZ and had a normal number of b cells (Figure 1B),
whereasMTZ-treatedTg(ins:CFP-NTR);Tg(ins:Kaede) larvaehad
only a few b cells (Figure 1C). Compounds found to increase the
b cell regenerative response in MTZ-treated Tg(ins:CFP-NTR);
Tg(ins:Kaede) larvae (see example in Figure 1D) were retested
and, if warranted, further analyzed at a range of concentrations.
Following this schema, we used �100,000 larvae to identify
enhancers of b cell regeneration by screening 7,186 compounds,
including FDA-approved drugs, natural products, and uncharac-
terized compounds (see Table S1 online).
The Most Potent Enhancers of b Cell RegenerationConverge on the Adenosine PathwayIn our screen, we defined the threshold for a hit compound as
a doubling of the number of b cells after 2 days of regeneration,
i.e., from �5 b cells in vehicle-treated larvae to R10 b cells in
chemical-treated larvae. We identified five compounds that
could double the number of b cells after 2 days of treatment.
Interestingly, four of these five compounds converge on the
adenosine signaling pathway and are predicted to augment the
signaling output of the pathway (Figure 1E): (1) 50-N-ethylcarbox-amidoadenosine (NECA), a nonspecific adenosine agonist that
activates adenosine G protein-coupled receptor (GPCR)
signaling; (2) A-134974, an adenosine kinase inhibitor that blocks
A
B C D
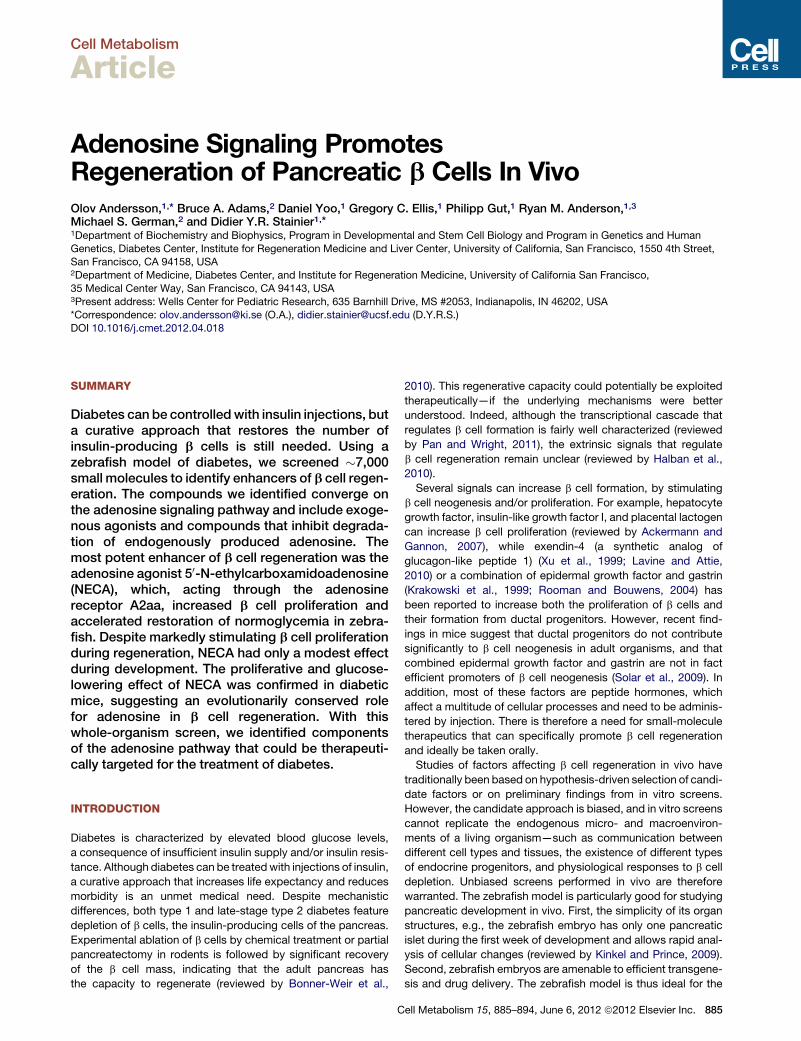
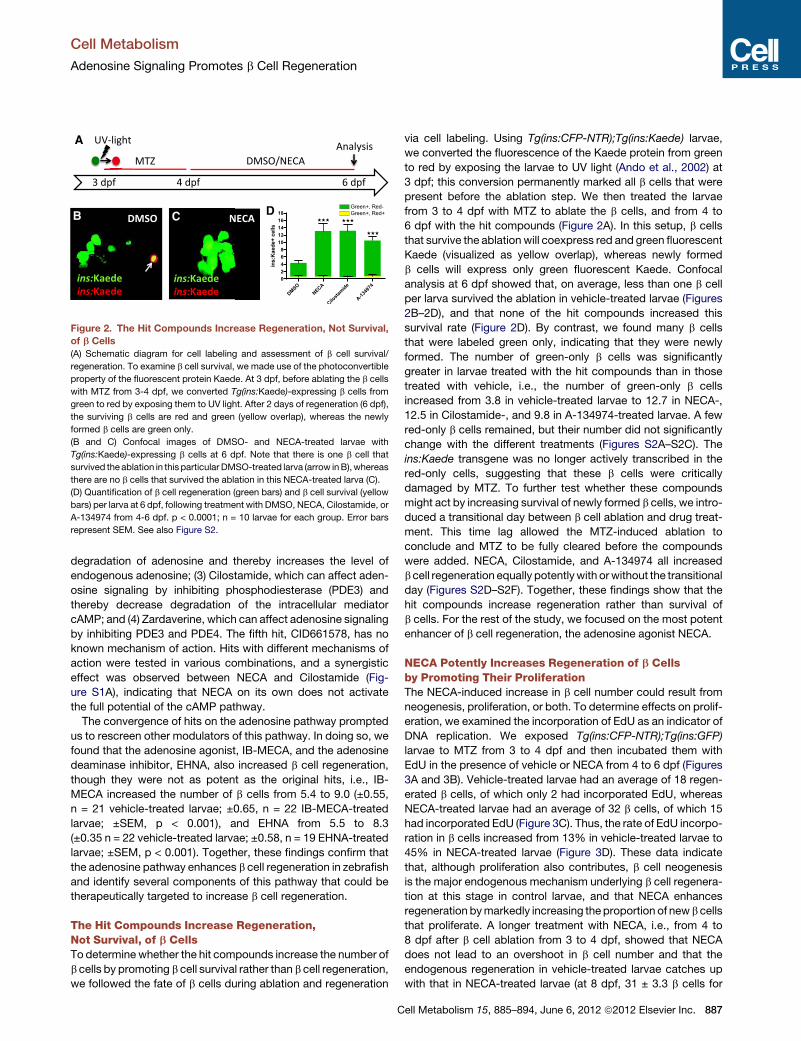
Figure 2. The Hit Compounds Increase Regeneration, Not Survival,
of b Cells
(A) Schematic diagram for cell labeling and assessment of b cell survival/
regeneration. To examine b cell survival, we made use of the photoconvertible
property of the fluorescent protein Kaede. At 3 dpf, before ablating the b cells
with MTZ from 3-4 dpf, we converted Tg(ins:Kaede)-expressing b cells from
green to red by exposing them to UV light. After 2 days of regeneration (6 dpf),
the surviving b cells are red and green (yellow overlap), whereas the newly
formed b cells are green only.
(B and C) Confocal images of DMSO- and NECA-treated larvae with
Tg(ins:Kaede)-expressing b cells at 6 dpf. Note that there is one b cell that
survived theablation in this particular DMSO-treated larva (arrow inB),whereas
there are no b cells that survived the ablation in this NECA-treated larva (C).
(D) Quantification of b cell regeneration (green bars) and b cell survival (yellow
bars) per larva at 6 dpf, following treatment with DMSO, NECA, Cilostamide, or
A-134974 from 4-6 dpf. p < 0.0001; n = 10 larvae for each group. Error bars
represent SEM. See also Figure S2.
Cell Metabolism
Adenosine Signaling Promotes b Cell Regeneration
degradation of adenosine and thereby increases the level of
endogenous adenosine; (3) Cilostamide, which can affect aden-
osine signaling by inhibiting phosphodiesterase (PDE3) and
thereby decrease degradation of the intracellular mediator
cAMP; and (4) Zardaverine, which can affect adenosine signaling
by inhibiting PDE3 and PDE4. The fifth hit, CID661578, has no
known mechanism of action. Hits with different mechanisms of
action were tested in various combinations, and a synergistic
effect was observed between NECA and Cilostamide (Fig-
ure S1A), indicating that NECA on its own does not activate
the full potential of the cAMP pathway.
The convergence of hits on the adenosine pathway prompted
us to rescreen other modulators of this pathway. In doing so, we
found that the adenosine agonist, IB-MECA, and the adenosine
deaminase inhibitor, EHNA, also increased b cell regeneration,
though they were not as potent as the original hits, i.e., IB-
MECA increased the number of b cells from 5.4 to 9.0 (±0.55,
n = 21 vehicle-treated larvae; ±0.65, n = 22 IB-MECA-treated
larvae; ±SEM, p < 0.001), and EHNA from 5.5 to 8.3
(±0.35 n = 22 vehicle-treated larvae; ±0.58, n = 19 EHNA-treated
larvae; ±SEM, p < 0.001). Together, these findings confirm that
the adenosine pathway enhances b cell regeneration in zebrafish
and identify several components of this pathway that could be
therapeutically targeted to increase b cell regeneration.
The Hit Compounds Increase Regeneration,Not Survival, of b CellsTo determine whether the hit compounds increase the number of
b cells by promoting b cell survival rather than b cell regeneration,
we followed the fate of b cells during ablation and regeneration
C
via cell labeling. Using Tg(ins:CFP-NTR);Tg(ins:Kaede) larvae,
we converted the fluorescence of the Kaede protein from green
to red by exposing the larvae to UV light (Ando et al., 2002) at
3 dpf; this conversion permanently marked all b cells that were
present before the ablation step. We then treated the larvae
from 3 to 4 dpf with MTZ to ablate the b cells, and from 4 to
6 dpf with the hit compounds (Figure 2A). In this setup, b cells
that survive the ablation will coexpress red and green fluorescent
Kaede (visualized as yellow overlap), whereas newly formed
b cells will express only green fluorescent Kaede. Confocal
analysis at 6 dpf showed that, on average, less than one b cell
per larva survived the ablation in vehicle-treated larvae (Figures
2B–2D), and that none of the hit compounds increased this
survival rate (Figure 2D). By contrast, we found many b cells
that were labeled green only, indicating that they were newly
formed. The number of green-only b cells was significantly
greater in larvae treated with the hit compounds than in those
treated with vehicle, i.e., the number of green-only b cells
increased from 3.8 in vehicle-treated larvae to 12.7 in NECA-,
12.5 in Cilostamide-, and 9.8 in A-134974-treated larvae. A few
red-only b cells remained, but their number did not significantly
change with the different treatments (Figures S2A–S2C). The
ins:Kaede transgene was no longer actively transcribed in the
red-only cells, suggesting that these b cells were critically
damaged by MTZ. To further test whether these compounds
might act by increasing survival of newly formed b cells, we intro-
duced a transitional day between b cell ablation and drug treat-
ment. This time lag allowed the MTZ-induced ablation to
conclude and MTZ to be fully cleared before the compounds
were added. NECA, Cilostamide, and A-134974 all increased
b cell regeneration equally potentlywith orwithout the transitional
day (Figures S2D–S2F). Together, these findings show that the
hit compounds increase regeneration rather than survival of
b cells. For the rest of the study, we focused on the most potent
enhancer of b cell regeneration, the adenosine agonist NECA.
NECA Potently Increases Regeneration of b Cellsby Promoting Their ProliferationThe NECA-induced increase in b cell number could result from
neogenesis, proliferation, or both. To determine effects on prolif-
eration, we examined the incorporation of EdU as an indicator of
DNA replication. We exposed Tg(ins:CFP-NTR);Tg(ins:GFP)
larvae to MTZ from 3 to 4 dpf and then incubated them with
EdU in the presence of vehicle or NECA from 4 to 6 dpf (Figures
3A and 3B). Vehicle-treated larvae had an average of 18 regen-
erated b cells, of which only 2 had incorporated EdU, whereas
NECA-treated larvae had an average of 32 b cells, of which 15
had incorporated EdU (Figure 3C). Thus, the rate of EdU incorpo-
ration in b cells increased from 13% in vehicle-treated larvae to
45% in NECA-treated larvae (Figure 3D). These data indicate
that, although proliferation also contributes, b cell neogenesis
is the major endogenous mechanism underlying b cell regenera-
tion at this stage in control larvae, and that NECA enhances
regeneration bymarkedly increasing theproportion of newb cells
that proliferate. A longer treatment with NECA, i.e., from 4 to
8 dpf after b cell ablation from 3 to 4 dpf, showed that NECA
does not lead to an overshoot in b cell number and that the
endogenous regeneration in vehicle-treated larvae catches up
with that in NECA-treated larvae (at 8 dpf, 31 ± 3.3 b cells for
ell Metabolism 15, 885–894, June 6, 2012 ª2012 Elsevier Inc. 887

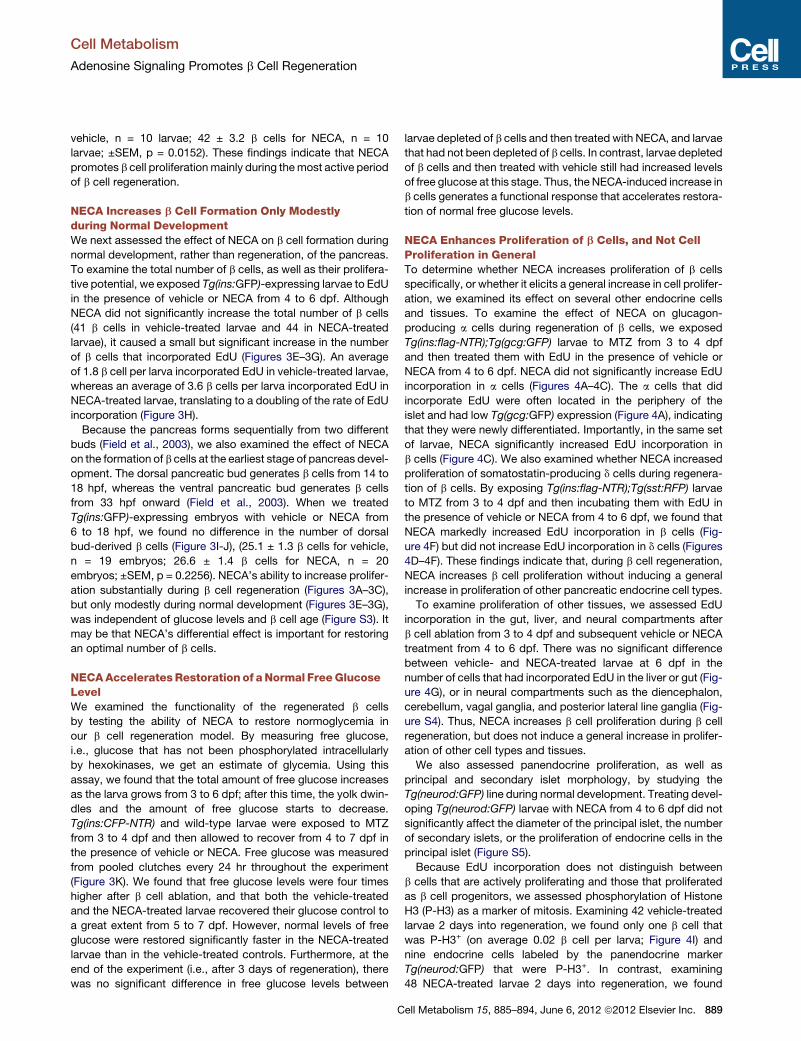
Figure 3. NECA Has a Modest Effect on Normal b Cell Development but Strongly Accelerates b Cell Regeneration
(A–D) Tg(ins:GFP);Tg(ins:CFP-NTR) larvae were treated with MTZ from 3-4 dpf to ablate the b cells and subsequently treated with DMSO/NECA and EdU during
regeneration from 4-6 dpf. EdU was developed in red, and nuclei were counterstained with topro (in blue). (A) Confocal image of a 6 dpf DMSO-treated larva
displaying one b cell that had incorporated EdU (arrow) during regeneration from 4-6 dpf. (B) Confocal image of a 6 dpf NECA-treated larva displaying ten b cells
that had incorporated EdU (arrows) during regeneration from 4-6 dpf. (C) Quantification of the total number of b cells (green bars) and b cells that had incorporated
EdU (white bars) per larva during DMSO or NECA treatment from 4-6 dpf during b cell regeneration. (D) Rate of EdU incorporation, displayed as the percentage of
b cells that incorporated EdU. n = 18 larvae for each group.
(E–H) Tg(ins:GFP) larvae were treated with DMSO/NECA and EdU from 4-6 dpf to assess EdU incorporation in b cells during normal development. EdU was
developed in red, and nuclei were counterstained with topro (in blue). (E) Confocal image of a 6 dpf DMSO-treated larva showing no EdU incorporation in its b cells
between 4 and 6 dpf of normal development. (F) Confocal image of a 6 dpf NECA-treated larva displaying one b cell that had incorporated EdU between 4 and 6
dpf of normal development. (G) Quantification of the total number of b cells (green bars) and b cells that had incorporated EdU (white bars) per larva during DMSO
or NECA treatment from 4-6 dpf of normal development. (H) Rate of EdU incorporation, displayed as the percentage of b cells that incorporated EdU. n = 25 larvae
for DMSO treated, and n = 32 larvae for NECA treated.
(I and J) During normal development of the dorsal pancreatic bud, Tg(ins:GFP) embryos were treated with DMSO or NECA from 6-18 hpf. Nuclei were coun-
terstained with topro (blue). (I) Confocal projection of a DMSO-treated Tg(ins:GFP) embryo at 18 hpf. (J) Confocal projection of a NECA-treated Tg(ins:GFP)
embryo at 18 hpf. We observed no significant difference in the number of b cells.
(K) Free glucose levels during b cell regeneration in the presence of DMSO or NECA. After being treated with MTZ from 3-4 dpf, the larvae either had an islet
depleted of b cells owing to the expression of Tg(ins:CFP-NTR) (NTR), or a normal islet because they were wild-type (WT). The larvae were subsequently treated
with DMSO or NECA from 4-7 dpf. Free glucose levels were significantly lower in NTR larvae treated with NECA (green line) than in NTR larvae treated with DMSO
(yellow line), after treatment for 2 days (from 1,164 to 820 pmol/larva, p = 0.0031) and 3 days (from 681 to 498 pmol/larva, p = 0.0292) days. n = 40 larvae (four pools
of ten larvae) per data point. Error bars represent SEM. See also Figure S3.
Cell Metabolism
Adenosine Signaling Promotes b Cell Regeneration
888 Cell Metabolism 15, 885–894, June 6, 2012 ª2012 Elsevier Inc.
Cell Metabolism
Adenosine Signaling Promotes b Cell Regeneration
vehicle, n = 10 larvae; 42 ± 3.2 b cells for NECA, n = 10
larvae; ±SEM, p = 0.0152). These findings indicate that NECA
promotes b cell proliferationmainly during themost active period
of b cell regeneration.
NECA Increases b Cell Formation Only Modestlyduring Normal DevelopmentWe next assessed the effect of NECA on b cell formation during
normal development, rather than regeneration, of the pancreas.
To examine the total number of b cells, as well as their prolifera-
tive potential, we exposed Tg(ins:GFP)-expressing larvae to EdU
in the presence of vehicle or NECA from 4 to 6 dpf. Although
NECA did not significantly increase the total number of b cells
(41 b cells in vehicle-treated larvae and 44 in NECA-treated
larvae), it caused a small but significant increase in the number
of b cells that incorporated EdU (Figures 3E–3G). An average
of 1.8 b cell per larva incorporated EdU in vehicle-treated larvae,
whereas an average of 3.6 b cells per larva incorporated EdU in
NECA-treated larvae, translating to a doubling of the rate of EdU
incorporation (Figure 3H).
Because the pancreas forms sequentially from two different
buds (Field et al., 2003), we also examined the effect of NECA
on the formation of b cells at the earliest stage of pancreas devel-
opment. The dorsal pancreatic bud generates b cells from 14 to
18 hpf, whereas the ventral pancreatic bud generates b cells
from 33 hpf onward (Field et al., 2003). When we treated
Tg(ins:GFP)-expressing embryos with vehicle or NECA from
6 to 18 hpf, we found no difference in the number of dorsal
bud-derived b cells (Figure 3I-J), (25.1 ± 1.3 b cells for vehicle,
n = 19 embryos; 26.6 ± 1.4 b cells for NECA, n = 20
embryos; ±SEM, p = 0.2256). NECA’s ability to increase prolifer-
ation substantially during b cell regeneration (Figures 3A–3C),
but only modestly during normal development (Figures 3E–3G),
was independent of glucose levels and b cell age (Figure S3). It
may be that NECA’s differential effect is important for restoring
an optimal number of b cells.
NECAAcceleratesRestoration of aNormal FreeGlucoseLevelWe examined the functionality of the regenerated b cells
by testing the ability of NECA to restore normoglycemia in
our b cell regeneration model. By measuring free glucose,
i.e., glucose that has not been phosphorylated intracellularly
by hexokinases, we get an estimate of glycemia. Using this
assay, we found that the total amount of free glucose increases
as the larva grows from 3 to 6 dpf; after this time, the yolk dwin-
dles and the amount of free glucose starts to decrease.
Tg(ins:CFP-NTR) and wild-type larvae were exposed to MTZ
from 3 to 4 dpf and then allowed to recover from 4 to 7 dpf in
the presence of vehicle or NECA. Free glucose was measured
from pooled clutches every 24 hr throughout the experiment
(Figure 3K). We found that free glucose levels were four times
higher after b cell ablation, and that both the vehicle-treated
and the NECA-treated larvae recovered their glucose control to
a great extent from 5 to 7 dpf. However, normal levels of free
glucose were restored significantly faster in the NECA-treated
larvae than in the vehicle-treated controls. Furthermore, at the
end of the experiment (i.e., after 3 days of regeneration), there
was no significant difference in free glucose levels between
C
larvae depleted of b cells and then treated with NECA, and larvae
that had not been depleted of b cells. In contrast, larvae depleted
of b cells and then treated with vehicle still had increased levels
of free glucose at this stage. Thus, the NECA-induced increase in
b cells generates a functional response that accelerates restora-
tion of normal free glucose levels.
NECA Enhances Proliferation of b Cells, and Not CellProliferation in GeneralTo determine whether NECA increases proliferation of b cells
specifically, or whether it elicits a general increase in cell prolifer-
ation, we examined its effect on several other endocrine cells
and tissues. To examine the effect of NECA on glucagon-
producing a cells during regeneration of b cells, we exposed
Tg(ins:flag-NTR);Tg(gcg:GFP) larvae to MTZ from 3 to 4 dpf
and then treated them with EdU in the presence of vehicle or
NECA from 4 to 6 dpf. NECA did not significantly increase EdU
incorporation in a cells (Figures 4A–4C). The a cells that did
incorporate EdU were often located in the periphery of the
islet and had low Tg(gcg:GFP) expression (Figure 4A), indicating
that they were newly differentiated. Importantly, in the same set
of larvae, NECA significantly increased EdU incorporation in
b cells (Figure 4C). We also examined whether NECA increased
proliferation of somatostatin-producing d cells during regenera-
tion of b cells. By exposing Tg(ins:flag-NTR);Tg(sst:RFP) larvae
to MTZ from 3 to 4 dpf and then incubating them with EdU in
the presence of vehicle or NECA from 4 to 6 dpf, we found that
NECA markedly increased EdU incorporation in b cells (Fig-
ure 4F) but did not increase EdU incorporation in d cells (Figures
4D–4F). These findings indicate that, during b cell regeneration,
NECA increases b cell proliferation without inducing a general
increase in proliferation of other pancreatic endocrine cell types.
To examine proliferation of other tissues, we assessed EdU
incorporation in the gut, liver, and neural compartments after
b cell ablation from 3 to 4 dpf and subsequent vehicle or NECA
treatment from 4 to 6 dpf. There was no significant difference
between vehicle- and NECA-treated larvae at 6 dpf in the
number of cells that had incorporated EdU in the liver or gut (Fig-
ure 4G), or in neural compartments such as the diencephalon,
cerebellum, vagal ganglia, and posterior lateral line ganglia (Fig-
ure S4). Thus, NECA increases b cell proliferation during b cell
regeneration, but does not induce a general increase in prolifer-
ation of other cell types and tissues.
We also assessed panendocrine proliferation, as well as
principal and secondary islet morphology, by studying the
Tg(neurod:GFP) line during normal development. Treating devel-
oping Tg(neurod:GFP) larvae with NECA from 4 to 6 dpf did not
significantly affect the diameter of the principal islet, the number
of secondary islets, or the proliferation of endocrine cells in the
principal islet (Figure S5).
Because EdU incorporation does not distinguish between
b cells that are actively proliferating and those that proliferated
as b cell progenitors, we assessed phosphorylation of Histone
H3 (P-H3) as a marker of mitosis. Examining 42 vehicle-treated
larvae 2 days into regeneration, we found only one b cell that
was P-H3+ (on average 0.02 b cell per larva; Figure 4I) and
nine endocrine cells labeled by the panendocrine marker
Tg(neurod:GFP) that were P-H3+. In contrast, examining
48 NECA-treated larvae 2 days into regeneration, we found
ell Metabolism 15, 885–894, June 6, 2012 ª2012 Elsevier Inc. 889
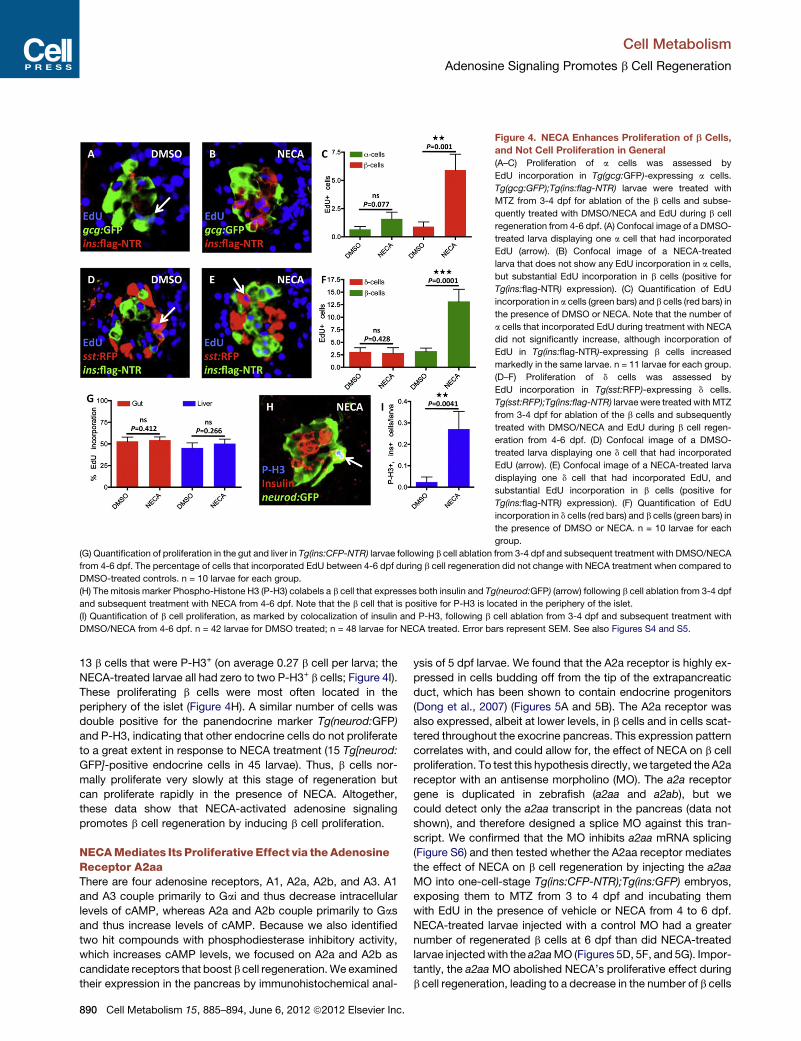
Figure 4. NECA Enhances Proliferation of b Cells,
and Not Cell Proliferation in General
(A–C) Proliferation of a cells was assessed by
EdU incorporation in Tg(gcg:GFP)-expressing a cells.
Tg(gcg:GFP);Tg(ins:flag-NTR) larvae were treated with
MTZ from 3-4 dpf for ablation of the b cells and subse-
quently treated with DMSO/NECA and EdU during b cell
regeneration from 4-6 dpf. (A) Confocal image of a DMSO-
treated larva displaying one a cell that had incorporated
EdU (arrow). (B) Confocal image of a NECA-treated
larva that does not show any EdU incorporation in a cells,
but substantial EdU incorporation in b cells (positive for
Tg(ins:flag-NTR) expression). (C) Quantification of EdU
incorporation in a cells (green bars) and b cells (red bars) in
the presence of DMSO or NECA. Note that the number of
a cells that incorporated EdU during treatment with NECA
did not significantly increase, although incorporation of
EdU in Tg(ins:flag-NTR)-expressing b cells increased
markedly in the same larvae. n = 11 larvae for each group.
(D–F) Proliferation of d cells was assessed by
EdU incorporation in Tg(sst:RFP)-expressing d cells.
Tg(sst:RFP);Tg(ins:flag-NTR) larvae were treated withMTZ
from 3-4 dpf for ablation of the b cells and subsequently
treated with DMSO/NECA and EdU during b cell regen-
eration from 4-6 dpf. (D) Confocal image of a DMSO-
treated larva displaying one d cell that had incorporated
EdU (arrow). (E) Confocal image of a NECA-treated larva
displaying one d cell that had incorporated EdU, and
substantial EdU incorporation in b cells (positive for
Tg(ins:flag-NTR) expression). (F) Quantification of EdU
incorporation in d cells (red bars) and b cells (green bars) in
the presence of DMSO or NECA. n = 10 larvae for each
group.
(G) Quantification of proliferation in the gut and liver in Tg(ins:CFP-NTR) larvae following b cell ablation from 3-4 dpf and subsequent treatment with DMSO/NECA
from 4-6 dpf. The percentage of cells that incorporated EdU between 4-6 dpf during b cell regeneration did not change with NECA treatment when compared to
DMSO-treated controls. n = 10 larvae for each group.
(H) The mitosis marker Phospho-Histone H3 (P-H3) colabels a b cell that expresses both insulin and Tg(neurod:GFP) (arrow) following b cell ablation from 3-4 dpf
and subsequent treatment with NECA from 4-6 dpf. Note that the b cell that is positive for P-H3 is located in the periphery of the islet.
(I) Quantification of b cell proliferation, as marked by colocalization of insulin and P-H3, following b cell ablation from 3-4 dpf and subsequent treatment with
DMSO/NECA from 4-6 dpf. n = 42 larvae for DMSO treated; n = 48 larvae for NECA treated. Error bars represent SEM. See also Figures S4 and S5.
Cell Metabolism
Adenosine Signaling Promotes b Cell Regeneration
13 b cells that were P-H3+ (on average 0.27 b cell per larva; the
NECA-treated larvae all had zero to two P-H3+ b cells; Figure 4I).
These proliferating b cells were most often located in the
periphery of the islet (Figure 4H). A similar number of cells was
double positive for the panendocrine marker Tg(neurod:GFP)
and P-H3, indicating that other endocrine cells do not proliferate
to a great extent in response to NECA treatment (15 Tg[neurod:
GFP]-positive endocrine cells in 45 larvae). Thus, b cells nor-
mally proliferate very slowly at this stage of regeneration but
can proliferate rapidly in the presence of NECA. Altogether,
these data show that NECA-activated adenosine signaling
promotes b cell regeneration by inducing b cell proliferation.
NECAMediates Its ProliferativeEffect via theAdenosineReceptor A2aaThere are four adenosine receptors, A1, A2a, A2b, and A3. A1
and A3 couple primarily to Gai and thus decrease intracellular
levels of cAMP, whereas A2a and A2b couple primarily to Gas
and thus increase levels of cAMP. Because we also identified
two hit compounds with phosphodiesterase inhibitory activity,
which increases cAMP levels, we focused on A2a and A2b as
candidate receptors that boost b cell regeneration.We examined
their expression in the pancreas by immunohistochemical anal-
890 Cell Metabolism 15, 885–894, June 6, 2012 ª2012 Elsevier Inc.
ysis of 5 dpf larvae. We found that the A2a receptor is highly ex-
pressed in cells budding off from the tip of the extrapancreatic
duct, which has been shown to contain endocrine progenitors
(Dong et al., 2007) (Figures 5A and 5B). The A2a receptor was
also expressed, albeit at lower levels, in b cells and in cells scat-
tered throughout the exocrine pancreas. This expression pattern
correlates with, and could allow for, the effect of NECA on b cell
proliferation. To test this hypothesis directly, we targeted the A2a
receptor with an antisense morpholino (MO). The a2a receptor
gene is duplicated in zebrafish (a2aa and a2ab), but we
could detect only the a2aa transcript in the pancreas (data not
shown), and therefore designed a splice MO against this tran-
script. We confirmed that the MO inhibits a2aa mRNA splicing
(Figure S6) and then tested whether the A2aa receptor mediates
the effect of NECA on b cell regeneration by injecting the a2aa
MO into one-cell-stage Tg(ins:CFP-NTR);Tg(ins:GFP) embryos,
exposing them to MTZ from 3 to 4 dpf and incubating them
with EdU in the presence of vehicle or NECA from 4 to 6 dpf.
NECA-treated larvae injected with a control MO had a greater
number of regenerated b cells at 6 dpf than did NECA-treated
larvae injectedwith the a2aaMO (Figures 5D, 5F, and 5G). Impor-
tantly, the a2aa MO abolished NECA’s proliferative effect during
b cell regeneration, leading to a decrease in the number of b cells

Figure 5. The Adenosine Receptor A2aa Mediates the Regenerative
Effect of NECA
(A) Confocal image of the expression of the A2a adenosine receptors in a 5 dpf
larva. The 2F11 antibody marks the extrapancreatic duct (epd) as well as the
endocrine islet (outlined by the dashed line). High expression of A2a is found in
cells budding off the epd (arrow), and low expression is found in insulin-ex-
pressing b cells (dashed arrow) and cells scattered throughout the exocrine
pancreas.
(B) For clarity, a magnified view of (A), without the red color, is displayed.
(C–G) Tg(ins:GFP);Tg(ins:CFP-NTR) embryos were injected with a control MO
or an a2aa MO at the one-cell stage and subsequently treated with MTZ from
3-4 dpf to ablate the b cells, and DMSO/NECA and EdU during b cell regen-
eration from 4-6 dpf. (C) Confocal image of a DMSO-treated control MO-
injected larva displaying one b cell that had incorporated EdU (arrow). (D)
Confocal image of a NECA-treated control MO-injected larva displaying four
b cells that had incorporated EdU (arrows). (E) Confocal image of a DMSO-
treated a2aa MO-injected larva where no b cells had incorporated EdU. (F)
Cell Metabolism
Adenosine Signaling Promotes b Cell Regeneration
C
that incorporated EdU (Figures 5C–5G). The a2aaMOalso signif-
icantly decreased the number of b cells that incorporated EdU
in vehicle-treated controls (from 2.5 to 0.3), suggesting that
adenosine constitutes an endogenous signal that promotes
b cell proliferation during regeneration (Figures 5C, 5E, and
5G). Together, these data indicate that NECA signals via the
A2aa receptor to mediate its proliferative effect during b cell
regeneration in zebrafish.
NECA Stimulates b Cell Proliferation and Regenerationin MiceTo determine whether NECA’s effect is conserved across
species, we assessed NECA’s ability to increase b cell prolifera-
tion in isolated mouse islets. After 4 days in culture, twice as
many b cells were labeled by P-H3 in the NECA-treated islets
than in the vehicle-treated ones (Figure 6A), with NECA treat-
ment increasing the percentage of P-H3-positive b cells even
at a low concentration.
We also investigated whether NECA could increase b cell
regeneration in amousemodel of diabetes. To do so, we injected
mice with streptozotocin (STZ) to deplete their b cells and then
treated the mice with daily injections of NECA or vehicle. Fed-
blood glucose levels were determined at 0, 4, and 8 days after
the start of NECA treatment. By day 8, blood glucose levels
were 30% lower in NECA-treated mice than vehicle-treated
ones (Figure 6B). They were also significantly decreased after
15 days of NECA treatment (Figure 6C), at which time both fed
and fasted blood glucose levels were decreased to an equal
extent in NECA-treated compared to vehicle-treated mice.
Importantly, after 15 days of treatment, the b cell mass was eight
times larger in NECA-treated than in vehicle-treated mice (Fig-
ures 6D, 6F, and 6G). Moreover, the b cells in NECA-treated
mice were also eight times more likely to be Ki67+, indicating
that they were proliferating at a higher rate (Figures 6E and
6G). There was no difference in the weight of the mice based
on treatment, neither at the start nor at the end of the experi-
ments (data not shown), indicating that the mice were not gener-
ally affected by NECA treatment. Together, these data indicate
that NECA can improve management of b cell trauma by
enhancing b cell regeneration via proliferation—not only in ze-
brafish larvae, but also in adult mice.
DISCUSSION
In this study we identified five compounds that increase b cell
regeneration in zebrafish. Interestingly, despite using a large-
scale, unbiased screening approach, we found that four of
these compounds converge on the activation of the adenosine
signaling pathway. Findings from complementary assays
showed that the adenosine pathway promotes b cell regenera-
tion by increasing b cell proliferation. Because the screen was
Confocal image of a NECA-treated a2aa MO-injected larva where no b cells
had incorporated EdU. (G) Quantification of the total number of b cells and the
number of b cells that incorporated EdU per larva during DMSO or NECA
treatment of control MO-injected or a2aa MO-injected embryos. p values in
black refer to Tg(ins:GFP)+, EdU+ cells, whereas the p value in green refers to
total number of Tg(ins:GFP)+ cells. n = 11–25 larvae per group. Error bars
represent SEM. See also Figure S6.
ell Metabolism 15, 885–894, June 6, 2012 ª2012 Elsevier Inc. 891
A B C
D E F G
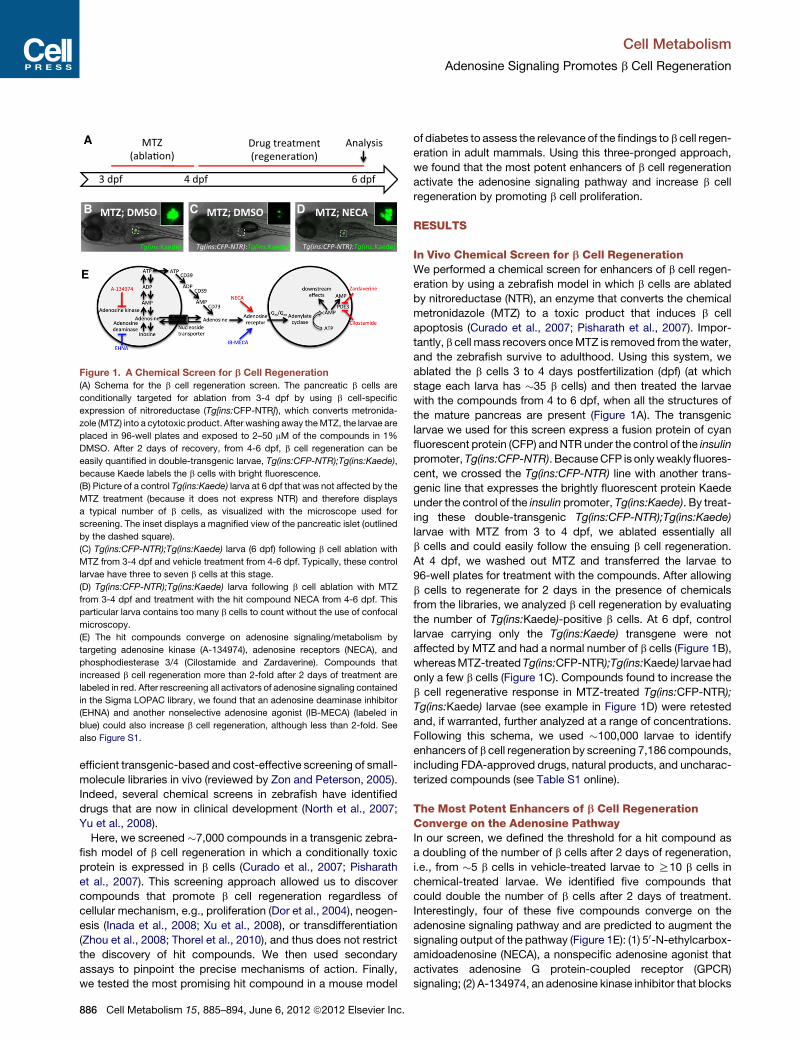
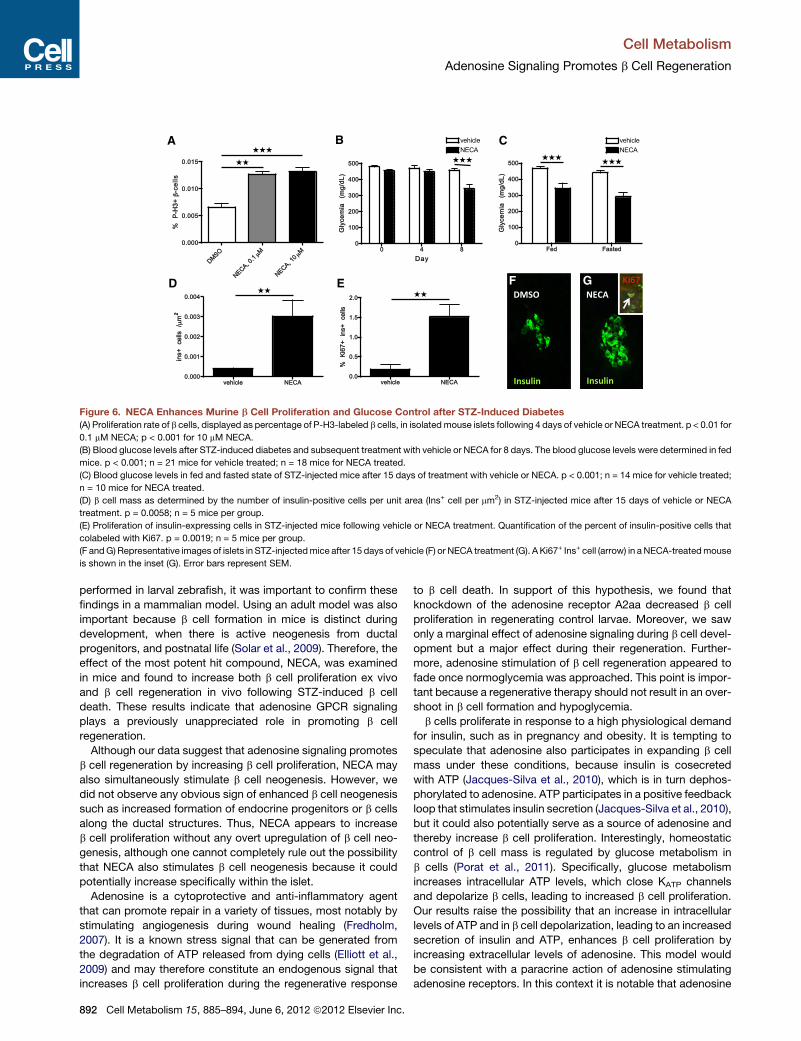
Figure 6. NECA Enhances Murine b Cell Proliferation and Glucose Control after STZ-Induced Diabetes
(A) Proliferation rate of b cells, displayed as percentage of P-H3-labeled b cells, in isolatedmouse islets following 4 days of vehicle or NECA treatment. p < 0.01 for
0.1 mM NECA; p < 0.001 for 10 mM NECA.
(B) Blood glucose levels after STZ-induced diabetes and subsequent treatment with vehicle or NECA for 8 days. The blood glucose levels were determined in fed
mice. p < 0.001; n = 21 mice for vehicle treated; n = 18 mice for NECA treated.
(C) Blood glucose levels in fed and fasted state of STZ-injected mice after 15 days of treatment with vehicle or NECA. p < 0.001; n = 14 mice for vehicle treated;
n = 10 mice for NECA treated.
(D) b cell mass as determined by the number of insulin-positive cells per unit area (Ins+ cell per mm2) in STZ-injected mice after 15 days of vehicle or NECA
treatment. p = 0.0058; n = 5 mice per group.
(E) Proliferation of insulin-expressing cells in STZ-injected mice following vehicle or NECA treatment. Quantification of the percent of insulin-positive cells that
colabeled with Ki67. p = 0.0019; n = 5 mice per group.
(F andG) Representative images of islets in STZ-injectedmice after 15 days of vehicle (F) or NECA treatment (G). A Ki67+ Ins+ cell (arrow) in a NECA-treatedmouse
is shown in the inset (G). Error bars represent SEM.
Cell Metabolism
Adenosine Signaling Promotes b Cell Regeneration
performed in larval zebrafish, it was important to confirm these
findings in a mammalian model. Using an adult model was also
important because b cell formation in mice is distinct during
development, when there is active neogenesis from ductal
progenitors, and postnatal life (Solar et al., 2009). Therefore, the
effect of the most potent hit compound, NECA, was examined
in mice and found to increase both b cell proliferation ex vivo
and b cell regeneration in vivo following STZ-induced b cell
death. These results indicate that adenosine GPCR signaling
plays a previously unappreciated role in promoting b cell
regeneration.
Although our data suggest that adenosine signaling promotes
b cell regeneration by increasing b cell proliferation, NECA may
also simultaneously stimulate b cell neogenesis. However, we
did not observe any obvious sign of enhanced b cell neogenesis
such as increased formation of endocrine progenitors or b cells
along the ductal structures. Thus, NECA appears to increase
b cell proliferation without any overt upregulation of b cell neo-
genesis, although one cannot completely rule out the possibility
that NECA also stimulates b cell neogenesis because it could
potentially increase specifically within the islet.
Adenosine is a cytoprotective and anti-inflammatory agent
that can promote repair in a variety of tissues, most notably by
stimulating angiogenesis during wound healing (Fredholm,
2007). It is a known stress signal that can be generated from
the degradation of ATP released from dying cells (Elliott et al.,
2009) and may therefore constitute an endogenous signal that
increases b cell proliferation during the regenerative response
892 Cell Metabolism 15, 885–894, June 6, 2012 ª2012 Elsevier Inc.
to b cell death. In support of this hypothesis, we found that
knockdown of the adenosine receptor A2aa decreased b cell
proliferation in regenerating control larvae. Moreover, we saw
only a marginal effect of adenosine signaling during b cell devel-
opment but a major effect during their regeneration. Further-
more, adenosine stimulation of b cell regeneration appeared to
fade once normoglycemia was approached. This point is impor-
tant because a regenerative therapy should not result in an over-
shoot in b cell formation and hypoglycemia.
b cells proliferate in response to a high physiological demand
for insulin, such as in pregnancy and obesity. It is tempting to
speculate that adenosine also participates in expanding b cell
mass under these conditions, because insulin is cosecreted
with ATP (Jacques-Silva et al., 2010), which is in turn dephos-
phorylated to adenosine. ATP participates in a positive feedback
loop that stimulates insulin secretion (Jacques-Silva et al., 2010),
but it could also potentially serve as a source of adenosine and
thereby increase b cell proliferation. Interestingly, homeostatic
control of b cell mass is regulated by glucose metabolism in
b cells (Porat et al., 2011). Specifically, glucose metabolism
increases intracellular ATP levels, which close KATP channels
and depolarize b cells, leading to increased b cell proliferation.
Our results raise the possibility that an increase in intracellular
levels of ATP and in b cell depolarization, leading to an increased
secretion of insulin and ATP, enhances b cell proliferation by
increasing extracellular levels of adenosine. This model would
be consistent with a paracrine action of adenosine stimulating
adenosine receptors. In this context it is notable that adenosine

Cell Metabolism
Adenosine Signaling Promotes b Cell Regeneration
has recently been shown to constitute a homeostatic signal that
regulates proliferation of hematopoietic progenitors in
Drosophila (Mondal et al., 2011), which, in light of our findings,
suggests that adenosine has a more widespread role in main-
taining tissue homeostasis than previously appreciated.
We identified inhibitors of PDE3 and PDE4 as enhancers of
b cell regeneration, suggesting that signaling via GPCRs coupled
to Gas (which stimulates cAMP production) promotes b cell
regeneration, in agreement with previous studies (reviewed by
Ackermann andGannon, 2007). Of the four adenosine receptors,
A2a and A2b are the ones that couple primarily to Gas. In zebra-
fish, we detected high expression of the A2a receptor in cells
budding off the extrapancreatic duct, a known source of endo-
crine progenitors (Dong et al., 2007), and low expression in
b cells. This expression pattern correlates with that in the rat
pancreas (Novak et al., 2008) and could explain NECA’s effect.
In support of this notion, injection of a MO targeting the A2aa
receptor abolished NECA’s ability to stimulate regeneration of
b cells. Therefore, it will be important to examine whether
NECA or specific A2a receptor agonists are the most efficient
promoters of b cell regeneration and proliferation in mammalian
models of diabetes.
Interestingly, NECA has been tested as a potential immuno-
modulator in mouse models of type 1 diabetes, in which it
improved glucose homeostasis (Nemeth et al., 2007). b cell
proliferation was not assessed in that study, and the data were
interpreted as showing that NECA signals via the A2b receptor
to increase b cell survival by modulating the immune response.
Moreover, adenosine and agonists of the A2a receptor improved
glucose homeostasis after transplantation of islets to diabetic
mice (Chhabra et al., 2010; Nitta et al., 2009), an effect that has
been attributed to increased survival of the islet grafts (in the
absence of data on b cell regeneration or proliferation). Another
report suggests that the A2b receptor mediates the immuno-
modulatory effects of adenosine that can potentially regulate
b cell survival, on the basis of a link between SNPs in the A2b
locus and proinflammatory markers in diabetics (Figler et al.,
2011). However, we found that NECA stimulates proliferation
of mouse b cells both ex vivo and in vivo following STZ-induced
diabetes, supporting a direct effect on b cells and not a relay
mechanism via the immune system. Because our data show
that the potent regenerative effect of NECA occurs via an A2a-
dependent proliferative effect, and not via survival, we suggest
that the A2a and A2b receptors have distinct functions that might
both be favorable in the event of b cell damage.
A recent report has shown that inhibition of adenosine kinase
promotes rodent and porcine b cell proliferation (Annes et al.,
2012). We also identified an adenosine kinase inhibitor in our
screen, but chose to focus our investigation on the adenosine
agonist NECA because it was the most potent enhancer of
b cell regeneration in our assay. Because NECA is a receptor
agonist and knockdown of the adenosine receptor A2aa
abolishes NECA’s ability to stimulate b cell proliferation, we
propose that adenosine signals via receptors at the cell surface
to generate a response that increases b cell proliferation.
However, Annes et al. propose a nuclear role for adenosine
kinase in promoting b cell proliferation. It is thus possible that
adenosine signaling has acquired several independent mecha-
nisms by which it can promote b cell proliferation.
C
The zebrafish model has been successfully used to conduct
large-scale chemical screens for rapid identification of relevant
signaling pathways in a variety of biological contexts. By using
zebrafish for chemical screening in a regeneration context, we
identified compounds that activate the adenosine pathway as
enhancers of b cell regeneration, findings that we subsequently
confirmed in a mouse model of diabetes. The next step is to
translate these findings, with the overarching goal of developing
therapies for diabetes.
EXPERIMENTAL PROCEDURES
Chemical Screening
The b cells were ablated in Tg(ins:CFP-NTR);Tg(ins:Kaede) larvae through
treatment with 10 mM MTZ (Sigma) dissolved in egg water supplemented
with 1% DMSO (Sigma) and 0.2 mM 1-phenyl-2-thiourea (to inhibit pigment
formation; TCI America) from 3-4 dpf. The larvae were subsequently trans-
ferred to 96-well plates for 2 days of chemical treatment, i.e., four larvae per
well in a volume of 400 ml with 2–50 mM of the compounds from the chemical
libraries. At 6 dpf, the larvae were anesthetized with Tricaine, and the number
of b cells was counted using a wide-field Zeiss Z.1 inverted microscope.
Zebrafish Experiments
Immunohistochemistry was performed according to standard procedures and
analyzed using a Zeiss LSM5 Pascal confocal microscope. The whole endo-
crine portion of the pancreas was scanned through in every examined larva.
Confocal stacks were analyzed using the ImageJ64 software. Proliferation
was assessed by adding 10 mM EdU to the egg water, and by using the
Click-iT EdU imaging kit (Invitrogen). Free glucose was determined by grinding
larvae in groups of ten and using a glucose assay kit (BioVision). Knockdown of
a2aa was performed by injection of 5 ng of a MO targeting the first coding
exon-intron splice junction, (50-30) AGAAACACCCTTCACTCACCTAAGC
(Gene Tools), at the one-cell stage. The standard control MO, (50-30) CCTCTTACCTCAGTTACAATTTATA (Gene Tools), was used as a reference.
Mouse Experiments
For the ex vivo proliferation assay, picked islets were randomly dispersed in
6-well plates and treated with 0, 0.1, or 10 mM NECA for 4 days, then fixed
and stained with anti-insulin and anti-P-H3. To induce diabetes, mice were
injected intraperitoneally with 150 mg/kg STZ after a 4 hr fast once per day
for two consecutive days. Tail vein blood was measured with a portable gluc-
ometer (FreeStyle Lite blood glucose monitoring system, Abbott Diabetes
Care). Only mice that became diabetic based on fed blood glucose values
of >300 mg glucose/dl were used. Mice were given daily intraperitoneal
injections of PBS (vehicle) or 0.003 mg/kg NECA. Cryosections 10 mm thick
were made from the whole pancreas, and every fortieth section was stained
for insulin and Ki67 for assessment of b cell mass and proliferation.
Statistical Analysis
Statistical analyses were carried out by one-tailed t tests when two groups
were analyzed, ANOVA when more than two groups were analyzed, and
displayed as ±SEM. The glucose values in Figure 6 were analyzed with
a Mann-Whitney test due to nonnormal distribution of values, because a few
blood glucose values reached the maximum level that the glucometer could
record and were therefore assigned 500 mg/dL.
SUPPLEMENTAL INFORMATION
Supplemental Information includes six figures, one table, Supplemental
Experimental Procedures, and Supplemental References and can be found
with this article at doi:10.1016/j.cmet.2012.04.018.
ACKNOWLEDGMENTS
We thank Vinh Nguyen and Katherine Yang for technical assistance with the
mouse experiments; Alethia Villasenor, Dan Hesselson, Jennifer Hampton,
ell Metabolism 15, 885–894, June 6, 2012 ª2012 Elsevier Inc. 893
Cell Metabolism
Adenosine Signaling Promotes b Cell Regeneration
and Tamsin Lindstrom for critical reading of the manuscript; and Matthias
Hebrok for feedback during the project. We thank the SMDC at UCSF for
advice as well as for the Iconix and the Microsource Spectrum small molecule
libraries, and Tao Zhong for the Vanderbilt Collection. O.A. thanks theWenner-
Gren Fellows program for support. R.M.A. was supported by an advanced
postdoctoral fellowship from the JDRF. This work was supported in part by
grants from the NIH (b cell biology consortium, U01DK089541, principal inves-
tigator M.S.G.; R01DK075032 to D.Y.R.S.), the JDRF (16-2007-428 to M.S.G.;
26-2008-636 to D.Y.R.S.), and the Packard Foundation to D.Y.R.S.
Received: August 3, 2011
Revised: February 7, 2012
Accepted: April 18, 2012
Published online: May 17, 2012
REFERENCES
Ackermann, A.M., and Gannon, M. (2007). Molecular regulation of pancreatic
beta-cell mass development,maintenance, and expansion. J.Mol. Endocrinol.
38, 193–206.
Ando, R., Hama, H., Yamamoto-Hino, M., Mizuno, H., andMiyawaki, A. (2002).
An optical marker based on the UV-induced green-to-red photoconversion of
a fluorescent protein. Proc. Natl. Acad. Sci. USA 99, 12651–12656.
Annes, J.P., Ryu, J.H., Lam, K., Carolan, P.J., Utz, K., Hollister-Lock, J.,
Arvanites, A.C., Rubin, L.L., Weir, G., and Melton, D.A. (2012). Adenosine
kinase inhibition selectively promotes rodent and porcine islet beta-cell repli-
cation. Proc. Natl. Acad. Sci. USA 109, 3915–3920.
Bonner-Weir, S., Li, W.C., Ouziel-Yahalom, L., Guo, L., Weir, G.C., and
Sharma, A. (2010). Beta-cell growth and regeneration: replication is only part
of the story. Diabetes 59, 2340–2348.
Chhabra, P., Wang, K., Zeng, Q., Jecmenica, M., Langman, L., Linden, J.,
Ketchum, R.J., and Brayman, K.L. (2010). Adenosine A(2A) agonist administra-
tion improves islet transplant outcome: evidence for the role of innate immunity
in islet graft rejection. Cell Transplant. 19, 597–612.
Curado, S., Anderson, R.M., Jungblut, B., Mumm, J., Schroeter, E., and
Stainier, D.Y. (2007). Conditional targeted cell ablation in zebrafish: a new
tool for regeneration studies. Dev. Dyn. 236, 1025–1035.
Dong, P.D., Munson, C.A., Norton, W., Crosnier, C., Pan, X., Gong, Z.,
Neumann, C.J., and Stainier, D.Y. (2007). Fgf10 regulates hepatopancreatic
ductal system patterning and differentiation. Nat. Genet. 39, 397–402.
Dor, Y., Brown, J., Martinez, O.I., and Melton, D.A. (2004). Adult pancreatic
beta-cells are formed by self-duplication rather than stem-cell differentiation.
Nature 429, 41–46.
Elliott, M.R., Chekeni, F.B., Trampont, P.C., Lazarowski, E.R., Kadl, A., Walk,
S.F., Park, D., Woodson, R.I., Ostankovich, M., Sharma, P., et al. (2009).
Nucleotides released by apoptotic cells act as a find-me signal to promote
phagocytic clearance. Nature 461, 282–286.
Field,H.A.,Dong,P.D.,Beis,D.,andStainier,D.Y. (2003). Formationof thediges-
tive system in zebrafish. II. Pancreas morphogenesis. Dev. Biol. 261, 197–208.
Figler, R.A., Wang, G., Srinivasan, S., Jung, D.Y., Zhang, Z., Pankow, J.S.,
Ravid, K., Fredholm, B., Hedrick, C.C., Rich, S.S., et al. (2011). Links between
insulin resistance, adenosine A2B receptors, and inflammatory markers in
mice and humans. Diabetes 60, 669–679.
Fredholm, B.B. (2007). Adenosine, an endogenous distress signal, modulates
tissue damage and repair. Cell Death Differ. 14, 1315–1323.
Halban, P.A., German, M.S., Kahn, S.E., and Weir, G.C. (2010). Current status
of islet cell replacement and regeneration therapy. J. Clin. Endocrinol. Metab.
95, 1034–1043.
Inada, A., Nienaber, C., Katsuta, H., Fujitani, Y., Levine, J., Morita, R., Sharma,
A., andBonner-Weir, S. (2008). Carbonic anhydrase II-positive pancreatic cells
are progenitors for both endocrine and exocrine pancreas after birth. Proc.
Natl. Acad. Sci. USA 105, 19915–19919.
Jacques-Silva, M.C., Correa-Medina, M., Cabrera, O., Rodriguez-Diaz, R.,
Makeeva, N., Fachado, A., Diez, J., Berman, D.M., Kenyon, N.S., Ricordi,
C., et al. (2010). ATP-gated P2X3 receptors constitute a positive autocrine
894 Cell Metabolism 15, 885–894, June 6, 2012 ª2012 Elsevier Inc.
signal for insulin release in the human pancreatic beta cell. Proc. Natl. Acad.
Sci. USA 107, 6465–6470.
Kinkel, M.D., and Prince, V.E. (2009). On the diabetic menu: zebrafish as
a model for pancreas development and function. Bioessays 31, 139–152.
Krakowski, M.L., Kritzik, M.R., Jones, E.M., Krahl, T., Lee, J., Arnush, M., Gu,
D., Mroczkowski, B., and Sarvetnick, N. (1999). Transgenic expression of
epidermal growth factor and keratinocyte growth factor in beta-cells results
in substantial morphological changes. J. Endocrinol. 162, 167–175.
Lavine, J.A., and Attie, A.D. (2010). Gastrointestinal hormones and the regula-
tion of beta-cell mass. Ann. N Y Acad. Sci. 1212, 41–58.
Mondal, B.C., Mukherjee, T., Mandal, L., Evans, C.J., Sinenko, S.A., Martinez-
Agosto, J.A., and Banerjee, U. (2011). Interaction between differentiating cell-
and niche-derived signals in hematopoietic progenitor maintenance. Cell 147,
1589–1600.
Nemeth, Z.H., Bleich, D., Csoka, B., Pacher, P., Mabley, J.G., Himer, L., Vizi,
E.S., Deitch, E.A., Szabo, C., Cronstein, B.N., et al. (2007). Adenosine receptor
activation ameliorates type 1 diabetes. FASEB J. 21, 2379–2388.
Nitta, T., Itoh, T., Matsuoka, N., Mera, T., Kojima, D., Nakano, M., Yamashita,
Y., and Yasunami, Y. (2009). Prevention of early loss of transplanted islets in
the liver of mice by adenosine. Transplantation 88, 49–56.
North, T.E., Goessling, W., Walkley, C.R., Lengerke, C., Kopani, K.R., Lord,
A.M., Weber, G.J., Bowman, T.V., Jang, I.H., Grosser, T., et al. (2007).
Prostaglandin E2 regulates vertebrate haematopoietic stem cell homeostasis.
Nature 447, 1007–1011.
Novak, I., Hede, S.E., and Hansen, M.R. (2008). Adenosine receptors in rat and
human pancreatic ducts stimulate chloride transport. Pflugers Arch. 456,
437–447.
Pan, F.C., and Wright, C. (2011). Pancreas organogenesis: from bud to plexus
to gland. Dev. Dyn. 240, 530–565.
Pisharath, H., Rhee, J.M., Swanson, M.A., Leach, S.D., and Parsons, M.J.
(2007). Targeted ablation of beta cells in the embryonic zebrafish pancreas
using E. coli nitroreductase. Mech. Dev. 124, 218–229.
Porat, S., Weinberg-Corem, N., Tornovsky-Babaey, S., Schyr-Ben-Haroush,
R., Hija, A., Stolovich-Rain, M., Dadon, D., Granot, Z., Ben-Hur, V., White,
P., et al. (2011). Control of pancreatic beta cell regeneration by glucose
metabolism. Cell Metab. 13, 440–449.
Rooman, I., and Bouwens, L. (2004). Combined gastrin and epidermal growth
factor treatment induces islet regeneration and restores normoglycaemia in
C57Bl6/J mice treated with alloxan. Diabetologia 47, 259–265.
Solar, M., Cardalda, C., Houbracken, I., Martin, M., Maestro, M.A., De Medts,
N., Xu, X., Grau, V., Heimberg, H., Bouwens, L., et al. (2009). Pancreatic
exocrine duct cells give rise to insulin-producing beta cells during embryogen-
esis but not after birth. Dev. Cell 17, 849–860.
Thorel, F., Nepote, V., Avril, I., Kohno, K., Desgraz, R., Chera, S., and Herrera,
P.L. (2010). Conversion of adult pancreatic alpha-cells to beta-cells after
extreme beta-cell loss. Nature 464, 1149–1154.
Xu, G., Stoffers, D.A., Habener, J.F., and Bonner-Weir, S. (1999). Exendin-4
stimulates both beta-cell replication and neogenesis, resulting in increased
beta-cell mass and improved glucose tolerance in diabetic rats. Diabetes
48, 2270–2276.
Xu, X., D’Hoker, J., Stange, G., Bonne, S., De Leu, N., Xiao, X., Van de
Casteele, M., Mellitzer, G., Ling, Z., Pipeleers, D., et al. (2008). Beta cells
can be generated from endogenous progenitors in injured adult mouse
pancreas. Cell 132, 197–207.
Yu, P.B., Hong, C.C., Sachidanandan, C., Babitt, J.L., Deng, D.Y., Hoyng, S.A.,
Lin, H.Y., Bloch, K.D., and Peterson, R.T. (2008). Dorsomorphin inhibits BMP
signals required for embryogenesis and iron metabolism. Nat. Chem. Biol. 4,
33–41.
Zhou, Q., Brown, J., Kanarek, A., Rajagopal, J., andMelton, D.A. (2008). In vivo
reprogramming of adult pancreatic exocrine cells to beta-cells. Nature 455,
627–632.
Zon, L.I., and Peterson, R.T. (2005). In vivo drug discovery in the zebrafish. Nat.
Rev. Drug Discov. 4, 35–44.