PROPOSED GEOTHERMAL SPA AND CROP DRYING
33
GEOTHERMAL TRAINING PROGRAMME Reports 2013 Orkustofnun, Grensasvegur 9, Number 9 IS-108 Reykjavik, Iceland DIRECT USE OF GEOTHERMAL ENERGY IN MENENGAI, KENYA: PROPOSED GEOTHERMAL SPA AND CROP DRYING Samuel Kinyanjui Geothermal Development Company P.O. Box 100746 Nairobi 00101 KENYA [email protected], [email protected] ABSTRACT Direct use of geothermal heat as an energy source has significant economic and environmental benefits. Its use increases the utilisation efficiency of geothermal resources compared to electricity generation only. The use of geothermal heat in Menengai, Kenya, for bathing and drying of agricultural crops is proposed is this report. A geothermal spa of 2800 m 2 in water surface area, requiring 35 kg/s of geothermal flow is designed. Three location scenarios of the lagoon in Menengai field are evaluated with regard to pipeline cost. Conventionally heated swimming pools including an outdoor pool, indoor pool, steam room, wading pool and three hot tubs with a total water surface of 700 m 2 utilising 55 kg/s of 130 ° C geothermal fluid are analysed. Utilisation of geothermal heat for drying is demonstrated through the design of a 30 m 3 mobile grain crop dryer comprised of a drying chamber, water-air heat exchanger and a blower. For air re-circulation purposes, a diversion valve from the tunnel to the bed dryer is provided for. The dryer requires 2 kg/s of 130 ° C geothermal water and has a capacity of 3 ton/hr of grains. 1. INTRODUCTION Direct use of geothermal hot water as an energy source has significant economic and greenhouse gas emission benefits and also reduces the demand for electricity. Geothermal heat has been utilized since ancient times, mainly for bathing purposes. In Kenya, direct use has been on a relatively small scale, primarily in heating greenhouses, crop drying and bathing. In recent years, the government of Kenya has given more priority to the development of the geothermal resources in Kenya, and Menengai is one of the fields under development. Menengai geothermal field is a high-temperature field located along the Kenya Rift valley, north of Lake Nakuru and south of Lake Bogoria. The Geothermal Development Company (GDC) has been carrying out drilling activities in the field and the first well, MW-01, successfully discharged in May 2011. The field is characterised by an elliptical caldera of 11.5 km in major axis (Kipng’ok, 2012), mainly covered by volcanic rocks which erupted from centres associated with the Menengai volcano. The field is in Nakuru, the fourth largest town in Kenya and a major agricultural centre in the country. 109
-
Upload
khangminh22 -
Category
Documents
-
view
0 -
download
0
Transcript of PROPOSED GEOTHERMAL SPA AND CROP DRYING

GEOTHERMAL TRAINING PROGRAMME Reports 2013 Orkustofnun, Grensasvegur 9, Number 9 IS-108 Reykjavik, Iceland DIRECT USE OF GEOTHERMAL ENERGY IN MENENGAI, KENYA:
PROPOSED GEOTHERMAL SPA AND CROP DRYING
Samuel Kinyanjui Geothermal Development Company
P.O. Box 100746 Nairobi 00101 KENYA
[email protected], [email protected]
ABSTRACT
Direct use of geothermal heat as an energy source has significant economic and environmental benefits. Its use increases the utilisation efficiency of geothermal resources compared to electricity generation only. The use of geothermal heat in Menengai, Kenya, for bathing and drying of agricultural crops is proposed is this report. A geothermal spa of 2800 m2 in water surface area, requiring 35 kg/s of geothermal flow is designed. Three location scenarios of the lagoon in Menengai field are evaluated with regard to pipeline cost. Conventionally heated swimming pools including an outdoor pool, indoor pool, steam room, wading pool and three hot tubs with a total water surface of 700 m2 utilising 55 kg/s of 130°C geothermal fluid are analysed. Utilisation of geothermal heat for drying is demonstrated through the design of a 30 m3 mobile grain crop dryer comprised of a drying chamber, water-air heat exchanger and a blower. For air re-circulation purposes, a diversion valve from the tunnel to the bed dryer is provided for. The dryer requires 2 kg/s of 130°C geothermal water and has a capacity of 3 ton/hr of grains.
1. INTRODUCTION
Direct use of geothermal hot water as an energy source has significant economic and greenhouse gas emission benefits and also reduces the demand for electricity. Geothermal heat has been utilized since ancient times, mainly for bathing purposes. In Kenya, direct use has been on a relatively small scale, primarily in heating greenhouses, crop drying and bathing. In recent years, the government of Kenya has given more priority to the development of the geothermal resources in Kenya, and Menengai is one of the fields under development. Menengai geothermal field is a high-temperature field located along the Kenya Rift valley, north of Lake Nakuru and south of Lake Bogoria. The Geothermal Development Company (GDC) has been carrying out drilling activities in the field and the first well, MW-01, successfully discharged in May 2011. The field is characterised by an elliptical caldera of 11.5 km in major axis (Kipng’ok, 2012), mainly covered by volcanic rocks which erupted from centres associated with the Menengai volcano. The field is in Nakuru, the fourth largest town in Kenya and a major agricultural centre in the country.
109

Kinyanjui 110 Report 9 The agricultural sector is the largest contributor to the country´s GDP. It accounts for 24% of the country´s GDP (FAO, 2011) with seventy five per cent of the population directly or indirectly employed in this sector (Government of the Republic of Kenya, 2013). The food crops subsector contributes up to 32% of the agricultural GDP, with maize crops contributing about 15%. The other subsectors are industrial crops, horticulture, livestock and fisheries. Sixty five per cent of the total agricultural export is coffee and tea as the principal exports (KNBS, 2008). Flowers and horticultural products are also important foreign exchange income. Drying of maize, tea and vegetables is done for storage purposes. The government of Kenya, through the National Cereals and Produce Board in Nakuru, dries maize in silo bins using diesel while tea is dried in major tea factories using wood or diesel. Coffee seeds have been majorly dried in the sun.
Tourism is the third largest contributor to the country's GDP after agriculture and manufacturing, providing 10% of the country's GDP (KNBS, 2008). The main tourist attractions are the country's world renowned national parks and beaches. Lake Nakuru, which is near Menengai geothermal field, is also a major tourist site, hosting over 300,000 foreign tourists annually, as shown in Figure 1. Menengai caldera and Lake Nakuru National Park are the major tourist attraction sites in Nakuru County. The caldera peak offers a panoramic view of the surrounding areas including Nakuru Town. Lake Nakuru, a Ramsar site, located a few kilometres south of the Caldera, is famous for being the first successful Rhino Sanctuary in Kenya and
a habitat for flamingos. There is a potential to package Lake Nakuru National Park together with the Menengai caldera and Lord Egerton Fort as tourist attraction sites under an ecotourism project. Menengai caldera is already attracting many local and foreign non-paying visitors. The possibilities for direct utilization around Menengai are diverse and depend to a large extent on the economic activities in the area. Crop drying and bathing are some of the potential applications. The aim of this project is twofold:
1) To propose a design for a geothermal spa in Menengai; and 2) To evaluate the use of geothermal heat in drying agricultural crops and to design a pilot grain
dryer. 2. GEOTHERMAL SPAS AND SWIMMING POOLS 2.1 Background Bathing is one of the earliest known uses of geothermal heat. Bathing in geothermal water is not only known to be a recreational activity today, but has therapeutic effects on the human body. Relaxation and stress relief, cleansing, socialization and musculoskeletal disorders are among the many factors as
FIGURE 1: Tourists visiting Lake Nakuru (Source: Ministry of tourism, 2010)
1999 2000 2001 2002 2003 2004 2005 2006 2007 2008180
200
220
240
260
280
300
320
340
360
Num
ber o
f tou
rists
in th
ousa
nds
Year

Report 9 111 Kinyanjui
to why millions of people around the world visit and enjoy the benefits of hot water in spas. Apart from offering these benefits, the spa is also a viable business venture. Other health benefits derived from bathing in geothermal water include treatment of high blood pressure, skin diseases, diseases of the nervous system and relieving the symptoms of rheumatism. The mineral composition of geothermal waters, especially silica, has also been proven to have considerable healing effects for psoriasis skin disease (Pétursdóttir and Kristjánsson, 1995). Different guests visit and take baths in public bathing places and meet others from different quotas, hence enriching their social lives. Steam baths and saunas have also been designed to utilize geothermal fluids. Relaxing in these facilities is associated with enormous health benefits including:
• Improved blood circulation; • Cleaning and rejuvenating the skin; • Eased muscle tension; • Promotes feeling of relaxation and well-being; and • Enhances detoxification processes.
The use of geothermal energy to heat swimming pools is a common practice, especially in cold countries such as Iceland where over 90% of the swimming pools are geothermally heated all year round (Orkustofnun, 2013). 2.2 Icelandic Blue Lagoon and Olkaria geothermal spa The Icelandic Blue Lagoon, located in Svartsengi geothermal field, has an average temperature of 37°C, pH 7.5 and about 2.5% salinity (Pétursdóttir and Kristjánsson, 1995). It was gradually formed as an accident from disposed geothermal water. Currently, it gets the geothermal water from reservoirs with temperatures of 240°C in Svartsengi geothermal field, composed of 65% sea water and 35% fresh water (Ólafsson and Sigurgeirsson, 2003). The lagoon covers a water surface area of 4000 m2 and the brine at 150°C flows at a rate of 40 l/s. It has a health clinic and, in total, the lagoon receives over 500,000 guests a year (internal communication). In Olkaria field, a recently constructed geothermal spa utilises brine from a re-injection pipeline. It is comprised of two interconnected lagoons for cooling and flow regulation, a main bathing lagoon, 70 m in diameter, and a fourth children’s pond, 10 m wide. The brine temperature is maintained at 30-35°C (Mangi, 2012) in the bathing pond. The Mývatn baths in north Iceland utilise geothermal water from shallow wells. The water is cooled in a tank and then flows by gravity to the bathing lagoon. The temperature is regulated and maintained at 37°C. The baths cover a surface area of 2000 m2 and are supplied by hot geothermal water at 15-20 l/s. 2.3 Proposed geothermal spa in Menengai
2.3.1 Source of geothermal water The source of geothermal water for bathing in the spa is considered to be Well MW-03 which has a low wellhead pressure and a flow rate of 16 kg/s (GDC, 2013). Utilizing brine from Well MW-01 is also a possibility or from central separators in the future.

Kinyanjui 112 Report 9
2.3.2 Silica scaling Silica scaling is a universal challenge in the exploitation of geothermal fields producing brines and has largely inhibited the use of waste heat from discharge waters in these fields (Jamieson, 1984). The solubility of silica decreases with a decrease in temperature. As opposed to carbonate, silica deposition is controlled by kinetics and can begin on the surface in several minutes or hours after reaching super saturation (Kashpura and Potapov, 2000). Similarly, silica scales are harder to remove mechanically. Results based on Well MW-01 (Kipng’ok, 2011) indicate that amorphous silica precipitation will not occur until it is cooled below 88°C (Figure 2). If the temperature of the transported brine in the pipeline is maintained above this amorphous silica saturation temperature, then problems of silica scaling are avoided. Analysis done on Well MW-03 (GDC, 2013) indicate that the water is under saturated with respect to amorphous silica even at lower temperatures, and there is no calcite scaling for temperatures below 120°C (Figure 3). Chemical analyses for Well MW-03, carried out in October 2012 at ambient temperature, indicate a fluid pH of 8.6 and a silica concentration of 362 mg/kg (Table 1). Calcite deposition is predicted to occur, in minimal amounts only, according to chemical analysis and interpretation done on Well MW-03 (GDC, 2013). 2.3.3 Location of the geothermal spa in the field Three location scenarios for the spa in
Menengai field are considered in this report, as shown in Figure 4: locations A, B and C. The hot water delivery pipeline, cooling pond, main bathing pond and the pumping pond are designed for the three scenarios. The pipeline design and pumping for both the brine supply and the re-injection pipelines are evaluated for the different scenarios. The sizes of the ponds are the same for all three scenarios. The assumptions made are:
FIGURE 2: Silica concentrations in Well MW-01 during one step adiabatic boiling (Kipng’ok, 2011)
FIGURE 3: Calcite and amorphous silica saturation state during one step adiabatic boiling of Well MW-03
(GDC, 2013)
0 50 100 150 200 250 300 350
0
200
400
600
800
1000
1200
1400
1600
Temperature (°C)
SiO
2 con c
entr a
t ion s
(ppm
)
Amorphous silica solubility curve
Quartz solubility
curve
MenengaiWell
MW-01

Report 9 113 Kinyanjui
• The source of the geothermal fluid is assumed to be from Well MW-03 and no pumping will be required to supply the geothermal water to the spa;
• For all the scenarios, the re-injection point is near Well MW-02; and
• The cost of the pipes used is estimated from prevailing market prices in Kenya.
Scenario A: The spa is located at point A (Figure 4). This is approximately 3 km from the cold water pump site, near the main entrance to the field. The proposal for this location is based on the fact that this is close to the main entrance and, therefore, convenient for visitors to the spa. The area is fairly flat and has ample space to accommodate the bathing facilities envisaged. Scenario B: Under this scenario, the bathing lagoon is located at point B near the caldera rim next to the road exiting into Kabarak, about 1.5 km away from Well MW-01. This location provides a relatively good view of the crater and the caldera. The location has lava outcrops on the surface, creating a more serene and natural atmosphere. This location has about 3000–4000 m2 of relatively flat surface area available. Scenario C: The bathing lagoon is located at point C, about 1 km away from Well MW-02. Since the assumed re-injection point is at Well MW-02 then there is no requirement for a brine supply pipeline, should the spa get its supply from the separated brine. A provision for tee-off along the brine pipeline is sufficient. However in this design, a supply pipeline route is considered from Well MW-03. An area of 7000 m2 is proposed for the spa, including the changing rooms, shopping space, restaurantand parking area. The X and Y co-ordinates indicated in Table 2 are generated from an AutoCAD map used in the distance transform method to calculate the pipe length and the best possible pipeline route.
TABLE 1: Chemicals results for Well MW-03 carried out in October 2013 at 20°C (GDC, 2013)
Parameter Value Unit pH 8.6 SiO2 362 mg/kg TDS 6580 ppm WHP 0.7 bar-g
FIGURE 4: A map of Menengai caldera showing possible spa locations, labelled A, B and C

Kinyanjui 114 Report 9 2.3.4 Spa size and layout The pipelines, both for supply and re-injection, were designed and an optimum pipe diameter obtained. The geothermal fluid is first delivered into a cooling pond and then into the bathing pond before it is pumped to the cold re-injection point. A stainless steel heat exchanger coil is installed in the cooling pond. This offers two advantages: it will aid in cooling the pond as well as in heating up fresh cold water to be used in the steam room, showers and at the waterfall. A surface area of water of 2800 m2 is considered in this design to accommodate 1000 bathers, allowing each bather 2.8 m2 of water surface area. The average depth of the deepest section is 1.5 m while the shallow section is 0.5 m, hence an average depth of 1 m. The brine exits the pond at approximately 33°C. The cooling pond shall be 16 m in diameter and 2 m deep. The layout is as shown in Figure 5. 2.3.5 Pipeline design Pipe diameter optimiza-tion, based on minimum cost, topology and route selection was considered. Route selection was done using the distance trans-form method. An upward flow of up to 30% was allowed for a pipe route going uphill. Heat losses were calculated assuming an insulation thickness of 0.05 m rock wool and a pipe setup as shown in Figure 6. The summary of monthly weather data for Nakuru used in this report is indicated in Table 3.
TABLE 2: Coordinates of the proposed locations and elevations (see Appendix I)
Coordinates Elevations (m) X Y
Scenario A 8509 9728 1820 Scenario B 3082 5626 2000 Scenario C 3805 9010 1940 MW-02 (proposed for re-injection) 4630 9493 1900 MW-03 7096 7062 1940
FIGURE 5: Proposed design layout of the geothermal spa
TABLE 3: Summary of monthly weather data for Nakuru (Source: RETScreen, 2011)
Month Air Temp. °C
Relative Humidity
%
Wind Speed
m/s Jan 18.45 57.6 3.809 Feb 19.2 51.9 3.792 Mar 19.95 56.9 3.965 Apr 18.75 71.4 2.37 May 17.3 74.2 1.811 Jun 17.85 73.4 1.556 Jul 16.8 72.9 1.515
Aug 17.1 72.3 1.616 Sep 17.3 68.6 2.237 Oct 17.5 70.8 1.893 Nov 17.2 74.6 3.154 Dec 16.8 65.7 1.926
Average 17.85 67.5 2.47
FIGURE 6: An insulated pipe
V-1
V-2
V-3
V-4
I-1
Pump
E-2
V-5
V-6
V-7
Fresh water
To the showers
To w
ater
fall
Pumping pond
Bathing lagoon
Safe
ty o
verf
low
Cooling pond
Geothermal water
V-1 Main control valveV-2 Safety overflow valveE-2 Heat exchangerV-4 3-way plug valveS-1 Strainer

Report 9 115 Kinyanjui
The total cost of a pipeline is a parameter used for selecting the optimum diameter. Increase in pipe diameter results in an increase in the total capital cost and, at the same time, decreases the pumping cost. Optimum pipe diameter was obtained from the following cost calculations:
𝐶𝐶𝑡𝑡 = 𝐶𝐶𝑐𝑐 + 𝐶𝐶𝑎𝑎(1 (1 + 𝑖𝑖)⁄ 𝑇𝑇)/𝑖𝑖 (1)
where Ct = Total cost; Cc = Capital cost;
Ca = Annual cost; i = Interest rate; and T = Life time.
The capital costs were calculated from:
𝐶𝐶𝑐𝑐 = 𝐿𝐿𝑝𝑝𝑘𝑘𝑝𝑝 + 𝑛𝑛𝑏𝑏𝑘𝑘𝑏𝑏 + 𝑛𝑛𝑐𝑐𝑘𝑘𝑐𝑐 + 𝑛𝑛𝑢𝑢𝑘𝑘𝑢𝑢 + 𝑛𝑛𝑣𝑣𝑘𝑘𝑣𝑣 + 𝑛𝑛𝑑𝑑𝑘𝑘𝑑𝑑 + 𝐿𝐿𝑝𝑝𝑘𝑘𝑖𝑖 (2)
where Lp = Pipe length (m); kp = Cost of pipe (USD/m);
nb = Number of bends; kc = Cost of a bend (USD/bend); nc = Number of connections; kc = Cost of a connection (USD/connection);
nu = Number of expansion units; ku = Cost of an expansion unit (USD/expansion unit); nv = Number of valves; kv = Cost of a valve (USD/valve); nd = Number of pumps; kd = Cost of a pump (USD/pump); and ki = Cost of insulation material (USD/m).
Annual cost was calculated from:
𝐶𝐶𝑎𝑎 = 𝑘𝑘𝑒𝑒𝑂𝑂ℎ𝑃𝑃 (3)
Where Oh = Operating hours in a year; ke = Cost of electrical energy (USD/kWh); and P = Power of the pump (kW). Pump power was calculated from:
𝑃𝑃 = 𝑔𝑔𝑔𝑔𝐻𝐻𝑡𝑡𝑡𝑡𝑡𝑡 𝑄𝑄 ŋ⁄ (4)
where g = Acceleration due to gravity (m/s2);
ρ = Density of the fluid (kg/m3); Htot = Total head (m); Q = Volumetric flow rate (m3/s); and η = Pump efficiency.
The total head is given from the sum of pressure drop caused by friction and the static head due to the elevation difference:
𝐻𝐻𝑡𝑡𝑡𝑡𝑡𝑡 = �𝐻𝐻𝑓𝑓 + ∆𝑍𝑍� (5)
where Hf = Friction head (m); and
∆Z = Elevation difference between end and start points (m). The velocity, v had to be calculated, in order to determine 𝐻𝐻𝑓𝑓:

Kinyanjui 116 Report 9
𝑣𝑣 = 𝑄𝑄/(𝜋𝜋𝐷𝐷𝑖𝑖𝑖𝑖2
4) (6)
where Din = Inner pipe diameter (m). The equivalent length, taking into account the pressure drop in fittings and valves, was calculated from:
𝐿𝐿𝑒𝑒 = 𝐿𝐿𝑝𝑝 + 𝑛𝑛𝑏𝑏ℎ𝑏𝑏𝐷𝐷𝑖𝑖𝑖𝑖 + 𝑛𝑛𝑐𝑐ℎ𝑐𝑐𝐷𝐷𝑖𝑖𝑖𝑖 + 𝑛𝑛𝑢𝑢ℎ𝑢𝑢𝐷𝐷𝑖𝑖𝑖𝑖 + 𝑛𝑛𝑣𝑣ℎ𝑣𝑣𝐷𝐷𝑖𝑖𝑖𝑖 (7)
where Lp = Pipe length (m); hb = Ratio of equivalent length to pipe diameter for bends; hc = Ratio of equivalent length to pipe diameter for connections; hu = Ratio of equivalent length to pipe diameter for expansion units; and hv = Ratio of equivalent length to pipe diameter for valves.
The Reynolds number was calculated from:
𝑅𝑅𝑅𝑅 =𝑔𝑔𝑣𝑣 𝐷𝐷𝑖𝑖𝑖𝑖𝜇𝜇
(8)
where µ = Dynamic viscosity of the fluid (kg/ms). If 𝑅𝑅𝑅𝑅 ≤ 2100, then
𝑓𝑓 = 64/𝑅𝑅𝑅𝑅 (9) If 𝑅𝑅𝑅𝑅 ≥ 5000, then
𝑓𝑓 = 0.25/(𝑙𝑙𝑙𝑙𝑔𝑔10 �€
3.7𝐷𝐷𝑖𝑖𝑖𝑖+
5.74𝑅𝑅𝑅𝑅0.9�)
2 (10)
where f = Friction factor; and € = Absolute roughness of the pipe (m). The friction head was calculated from:
𝐻𝐻𝑓𝑓 = 𝑓𝑓𝑣𝑣2𝐿𝐿𝑒𝑒/(2𝑔𝑔𝐷𝐷𝑖𝑖𝑖𝑖) (11) 2.3.6 Energy requirements for the spa The heat transfer from the open pond occurs in the following ways:
• Convection; • Evaporation; • Radiation; • Conduction; and • Rain.
Heat loss due to convection, 𝑄𝑄𝑐𝑐, in W/m2:
𝑄𝑄𝑐𝑐 = ℎ𝑐𝑐𝑡𝑡(𝑇𝑇𝑤𝑤 − 𝑇𝑇𝑎𝑎) (12)
where hco = Heat transfer coefficient (W/m2°C); Tw = Water temperature (°C); and Ta = Air temperature (°C).
From Rimsha-Doncenko equations, ℎ𝑐𝑐𝑡𝑡:
ℎ𝑐𝑐𝑡𝑡 = 𝐾𝐾 + 1.88𝑉𝑉 (13)

Report 9 117 Kinyanjui
where K = Constant dependent on the temperatures (W/m2°C); and V = Wind speed at 2 m height (m/s).
𝐾𝐾 = 3.89 + 0.17(𝑇𝑇𝑤𝑤 − 𝑇𝑇𝑎𝑎) (14) Heat loss due to evaporation, 𝑄𝑄𝑒𝑒 in W/m2:
𝑄𝑄𝑒𝑒 = (1.56𝐾𝐾 + 2.93𝑉𝑉)(𝑅𝑅𝑤𝑤 − 𝑅𝑅𝑎𝑎) (15) where ew = Partial pressure of steam at surface (mbar); and
ea = Partial pressure of steam in air (mbar). Heat loss due to radiation, 𝑄𝑄𝑟𝑟 in W/m2:
𝑄𝑄𝑟𝑟 = (4.186(�13.18 ∗ 10−9𝑇𝑇𝑎𝑎4(0.46− 0.06𝑅𝑅𝑎𝑎0.5) − 𝐺𝐺𝑡𝑡(1 − 𝑎𝑎)� (1 − 0.012𝑁𝑁2)
+ 13.18 ∗ 10−9�𝑇𝑇𝑤𝑤4 − 𝑇𝑇𝑎𝑎4�) (16)
where Go = Sun’s radiation in clear weather;
a = Natural reflection of water; and N = Cloudiness factor (0-8). For design purposes we consider the case giving highest energy requirements which is when 𝐺𝐺𝑡𝑡= 0 and 𝑁𝑁=0. Heat loss due to conduction is calculated by estimating the heat loss through the walls and bottom of the pool. Heat loss due to rain is calculated as the amount of energy needed to heat the rain from the ambient temperature to the pool temperature. These losses are expected to be relatively small. Heat loss from pipes: An insulated pipe, as shown in Figure 6, was considered. Heat loss per unit length from insulated pipes is given by:
𝑄𝑄 = 𝛱𝛱𝐷𝐷3𝑈𝑈 ∗ (𝑇𝑇𝑖𝑖𝑖𝑖 − 𝑇𝑇𝑡𝑡𝑢𝑢𝑡𝑡) (17)
where D3 = Outer diameter including insulation (m); U = Overall heat transfer coefficient based on outside of the insulated pipe (W/m2°C); Tin = Fluid temperature (°C); and Tout = Outside air temperature (°C).
1𝑈𝑈
= ��𝐷𝐷3
𝐷𝐷1ℎ𝑖𝑖𝑖𝑖� + �
𝐷𝐷3 ln �𝐷𝐷2𝐷𝐷1�
2𝑘𝑘𝑝𝑝𝑖𝑖𝑝𝑝𝑒𝑒� + �
𝐷𝐷3 ln �𝐷𝐷3𝐷𝐷2�
2𝑘𝑘𝑖𝑖𝑖𝑖𝑖𝑖� +
1ℎ𝑡𝑡𝑢𝑢𝑡𝑡
� (18)
where hin = Heat transfer coefficient inside the pipe; D1, D2, D3 = Diameters as shown in Figure 6 (m); kpipe = Thermal conductivity of the pipe material (W/m°C); kins = Thermal conductivity of the insulation material (W/m°C); and hout = Heat transfer coefficient outside the pipe (W/m2°C).
2.4 Results of pipeline design A pipeline from MW-03, which is a liquid dominated well (GDC, 2013), was designed to the proposed spa locations in the three scenarios. The supply pipeline is insulated while the re-injection pipeline from the pumping pond is not. In this report, the cost of pumping to a distance of 1 km to a high point from

Kinyanjui 118 Report 9 Well MW-03, requiring one pumping unit at 60 kg/s, was estimated and used to obtain the optimum diameter at the minimum cost for the supply pipeline which was found to be 200 mm (Figure 7).
Temperature drop, with and without insulation of the supply pipeline in scenario C, the longest pipeline in the three scenarios, was calculated using Equations 17 and 18. This was found to be over 17°C without insulation and 2°C with 50 mm thick insulation, for the 4600 m as shown in Figure 8; therefore, there is a need for insulation. Using the X and Y co-ordinates from Table 2, the distance transform algorithm was used to obtain the shortest appropriate pipeline route (Appendix I) and the pipeline cost was determined. Table 4 shows the results of the pipeline cost analysis for the three scenarios. Scenario C has the lowest cost because of its location near the assumed re-injection point, hence a shorter pipeline needed for re-injection. A comparison of the supply, re-injection and the total pipeline costs for the three scenarios is shown in Figure 9. Scenario B has the highest total pipeline cost. Scenario A is 12% cheaper than B while scenario C is 32% cheaper than scenario B.
TABLE 4: Pipeline length, diameter and capital cost for the three scenarios
Supply pipeline (Insulated)
Re-injection (Un-insulated) Total cost
(USD) Length (m)
Pipe diameter
(m)
Cost (USD)
Length (m)
Pipe diameter
(m)
Cost (USD)
Scenario A 3000 0.2 210,000 4700 0.2 290,000 500,000 Scenario B 4500 0.2 305,000 4200 0.2 260,000 565,000 Scenario C 4600 0.2 320,000 1000 0.2 65,000 385,000
Scenario A requires a pump between the spa and the re-injection point. The cost of the pump and pipe supports cost is not included in the pipeline cost analysis shown in Table 4 and Figure 9. Calculations were done for heat transfer in the cooling and bathing ponds, using Equations 12 to 16, and the results are as shown in Table 5.
FIGURE 7: Optimum diameter selection based on minimum cost
FIGURE 8: Temperature drop in insulated and un-insulated pipes of different diameter
0 100 200 300 400 500
0
200,000
400,000
600,000
800,000
1,000,000
Total
Cos
t in
USD
Pipe diameter in mm
Optimum point
50 100 150 200 250 300 350 400 450 5000
5
10
15
20
25
30
35
40
Tem
pera
ture
dro
p (o C)
Pipe diamter in mm
Insulated Un-insulated

Report 9 119 Kinyanjui
Geothermal hot water flows into the cooling pond at a 130°C and drops to a 100°C where it is retained for 3 hours. It flows by gravity through a 150 mm diameter pipe at 35 l/s to the bathing pond. Three submersible drainage pumps (Figure 10) are installed in the bathing pond to re-circulate and mix the water, preventing it from forming layers along the depth of the lagoon, with varying temperatures and therefore, assisting in achieving uniform temparatures in the lagoon. The retention time in the main lagoon is found to be 23 hours at 35°C; flow is by gravity into the pumping pond.
TABLE 5: Main geothermal spa parameters
Mass flow bathing
pond (kg/s)
Area bathing
pond (m2)
Area cooling pond (m2)
Retention time
bathing pond (hrs)
Retention time cooling
pond (hrs)
Temp bathing
pond (°C)
Temp geo in (°C)
33.8 2827 201.1 23 2.9 35 130
A stainless steel pipe loop, 30 m long and 40 mm in diameter, is installed in the cooling pond as a heat exchanger to heat up cold water from 18°C to 55°C at a flow rate of 8 l/s. This heated fresh water is pumped through the steam jets in the steam room and is also used in the showers before the visitors can take a bath in the lagoon. Scale deposits on the stainless steel loop are expected on the outer side of the pipes and will be cleaned regularly. The piping into the shower is done using high pressure PVC pipes.
FIGURE 9: Comparisons of pipeline costs for
the three scenarios
FIGURE 10: Designed spa layout and pipe work
Scenario A Scenario B Scenario C0
50,000100,000150,000200,000250,000300,000350,000400,000450,000500,000550,000600,000
Cost
(USD
)
Supply line Re-injection line Total

Kinyanjui 120 Report 9 A 15 kW pump is used to pressurize the heated fresh water through the steam jets in the steam room. Table 6 shows the designed details of the spa and the steam room.
TABLE 6: Designed details and specifications of the spa
Facility Parameter Units Value
Bathing lagoon Temperature
Retention time Flow rate
°C hours kg/s
35 23 35
Steam room
Dimensions Material
m -
2.1 by 3 by 2 Concrete
Pumps Motor rating Flow rate
kW m3/hr
15 15
Steam jets
Pressure Flow rates Number
bar l/s -
2 0.6 9
Water fall Flow rate Dimensions
l/s m
1 4 m high
The retention time in the cooling pond is 3 hours while in the bathing pond it is 23 hours. This allows for aging of the water allowing polymerisation. Various sampling points will be provided in the pipeline between the cooling pond and the bathing lagoon. 3. GEOTHERMAL POOL HEATING Open-air swimming pools are heated to extend the swimming time or to maintain a temperature that is comfortable to the swimmer. Heating of swimming pools by solar energy has existed for many decades with the technology now well established (Ruiz and Martinez, 2009). However, solar heating is limited due to its intermittence and its un-availability at night. The collectors have to be exposed to the sun, thus requiring relatively large installation areas on the surface, which is not appealing to nature. Control of solar heating is also a challenge. The size of a swimming pool is largely guided by the number of bathers it can support. According to Halldórsson (1975), the space required for each individual is dependent upon pool depth. International standards for training professional swimmers and swimming competitions also give a guide on the minimum size requirements of a pool (Perkins, 1988). In Iceland the total annual water consumption in geothermal heated swimming pools is estimated to be 6.9 million m3 which corresponds to an energy use of 1,300 TJ per year. The specific water and energy demand is about 220 m3 of geothermal water or 40,000 MJ of energy for heating 1 m2 pool surface area (Orkustofnun, 2013). 3.1 Water re-circulation and cleaning Re-circulation of the pool water is the only means that ensures it is cleaned of dirt, that pathogenic bacteria are removed, and that an even pH is maintained in the pool. A range of recommended parameters for swimming pools is shown in Table 7. Most pools are fitted with skimmers or have a deck level channel to help skim the top layer of floating debris. By use of hand held nets and strainer baskets, big solid particles can be mechanically removed. Many particles are not removed using this method, so filtration is required. The filter is made of multiple layers of sand that vary in size. When the water flows through the sand, solid particles are filtered out.

Report 9 121 Kinyanjui
Swimming pools need to be chemically treated to maintain pool water balance and hygiene. Chemicals for swimming pools include various kinds of sanitizers and disinfectants which control the growth of bacterial and algae matter in the pool water. The pH is controlled using either an acid or a basic compound. Chlorine is added to control algal and bacterial growth, waterborne illnesses, cloudy water and insufficient sanitation of the water. A balance tank is provided for in all swimming pools to hold the excess water from the pool and provide a pumping point for re-circulating the water, as shown in Figure 11.
The swimming pools considered in this design include a main outdoor swimming pool, an indoor swimming pool, three hot baths, a wading pool, a steam room, a shallow pool and a waterfall (Figure 12), all heated geothermally. All the water is re-circulated. The physical location of the swimming pools is different from the location of the geothermal spa described earlier. The location is not stated in this report, but a
location that could suit these swimming pool facilities is in the geothermal complex headquarters. The significant heat loss from the swimming pools due to evaporation, conduction, convection and rain is calculated as described in chapter 2.3.6. The calculations are based on monthly average climate conditions, given in Table 3. Figure 13 shows a pie which indicates the highest heat loss from a swimming pool is due to evaporation losses, while loss due to rain is the least. The turnover of the pool water is 4 hours based on the standards and other parameters shown in Table 7 (Perkins, 1988). Heating a swimming pool is largely dependent on weather conditions and the size of the pool. The total energy required for heating the swimming pools is dependent largely on the wind speed rather than air temperature. The months of January to March and November require the most heating energy. The least required thermal energy is in the month of July as shown in Figure 14.
TABLE 7: Recommended range of swimming pool water parameters (EUSSA, 2010)
Parameter Range
Appearance Clear and free from suspended matter pH 7.2 – 8.0 Total hardness 50 – 400 mg/l Total alkalinity 75 – 200 mg/l Total dissolved solids Less than 500 mg/l
FIGURE 11: Swimming pool circulation layout

Kinyanjui 122 Report 9
Figure 15 shows the required geothermal flow rates for various designed swimming pools. The geothermal flow rate required for heating the indoor pool water is the least and remains constant throughout the year. This is because the indoor pool is not affected by the outside wind which varies throughout the year. The geothermal flow required for heating the waterfall is constant throughout the year because the water is more exposed than the pool water as it falls down and this exposure factor has more influence than the wind. The outdoor main pool is the most affected by weather variations.
FIGURE 14: Variations of air temperature and wind speed and energy requirements for pool heating in a year
FIGURE 15: Flow rate requirements in the various pools in a year
The average thermal power required to heat all the swimming facilities is 9 MWth. This energy is extracted through heat exchangers from geothermal water at 130°C, exiting at 90°C. The highest thermal power required is 11 MWth between January and March which are the windiest months of the year. The total mass flow required is 55 kg/s. Table 8 shows the main accessories and equipment for the various swimming pools considered and designed in this report. The turnover mainly depends on the type of facility and its volume.
FIGURE 12: Various swimming pools
FIGURE 13: Various means of heat loss from the swimming pool

Report 9 123 Kinyanjui
TABLE 8: Main accessories and equipment for the swimming pool installations
Main Shallow Wading Indoor Hot tub 1 Massage tub Hot tub 2 Area (m²) 313 113 38 113 18 36 18 Volume (m³) 469 79 1 101 18 36 18 Turnover (hr) 4.0 4.0 0.2 3.0 1.0 1.0 1.0 Flowrate (m³/hr) 117 20 5 34 18 36 18 Sand filters 4No CX900 1No CX800 1No CX500 2NoCX800 1No CX800 2No CX800 1No CX800 No. of inlets 17 3 1 5 3 6 3 Vol. balance tank (m³) 24 4 1 6 1 2 1
Pumps 2No 28kw DE65/20
1No 1.2kw SLL 400
1No 0.6kw DM3
2No 1kw SLL 300
1No 1kw SLL 300
2No 1kw SLL 300
1No 1kw SLL 300
Chlorinator (gms/hr) 79 14 4 23 13 25 13
Type of chlorinator M4921 1.kw BMSC20
120w BMSC20
120w BMSC26
160w BMSC20
120w BMSC26
160w BMSC20
120w Table 9 shows the details of the swimming pools. The total combined water surface area of all the swimming facilities is 670 m2.
TABLE 9: The details of the swimming pool facilities designed
General details: Total land area 4700 m2 Total water surface area 670 m2
Main outdoor pool
L: 25 m W: 12.5 m Maximum depth 2 m Area 313 m2 Minimum depth 1 m Volume 469 m3 Temperature 29°C
Indoor pool L: 15 m W: 7.5 m Uniform depth 0.9 m
Temperature 30°C Area 113 m2 Volume 101 m3
Shallow/game pool
Radius: 6 m Uniform depth 0.7 m Area 113 m2 Temperature 33°C Volume 79 m3 With a water slide of 51 m track length
Wading pool Radius: 3.4 m Uniform depth 0.25 m
Temperature 37°C Area 38 m2 Volume 1 m3
Hot tubs: Depth of 1 m With 6 massage jets High temperature
1. 35°C Radius: 2.4 m, kidney shaped 2. 36°C Radius: 3.4 m, kidney shaped 3. 40°C Radius: 2.4 m, kidney shaped
Steam room L: 4 m, W: 3 m Temperature 55°C 9 steam jets
Waterfall Height: 4 m, width: 3 m Temperature 39°C . 3.2 Heat exchangers Heat exchangers are usually designed to maximize the surface area that exists between two fluids. Selection of heat exchangers in this design is done by considering the flow rates and temperature differences. Water-water plate heat exchangers are designed for each pool having a separate heating and cleaning system. Table 10 shows the various specifications for heat exchangers for each swimming facility considered in this report

Kinyanjui 124 Report 9 4. COST ANALYSIS OF THE GEOTHERMAL SPA AND CONCLUSIONS 4.1 Cost analysis The main parameters usually evaluated in an economic analysis include PV (Present Value), NPV (Net Present Value), and IRR (Internal Rate of Return). These are based on two basic adages of finance, according to Breadley et al. (2011) which are “a dollar today is worth more than a dollar tomorrow” and “a risky dollar is worth less than a safe one”. In any investment, there is the opportunity cost which is foregone by investing in the project rather than in another one. The rate of return of the foregone project is called the discount rate, r.
TABLE 10: Water-water heat exchanger details
Pool type
Side
Temp. in
(°C)
Temp. out (°C)
Pressure drop (kPa)
Water volume /
Unit (l)
Max. working pressure
(bar)
Max. working
temp. (°C)
LMTD (K)
Surface area (m2)
Hot bath 1 (37°C) A 120 90 4.74 0.063 25 180 78.32 0.13 B 18 35 9.33 0.084 25 180
Hot bath 2 (42°C) A 120 90 6.58 0.063 25 180 75.93 0.13 B 18 40 8.05 0.084 25 180
Indoor pool A 120 90 0.12 0.063 25 180 80.2 0.13 B 18 31 0.44 0.084 25 180
Main pool A 120 90 188.61 0.24 16 180 81.13 0.19 B 18 29 932.22 0.3 16 180
Massage tub A 120 90 16.5 0.063 25 180 77.85 0.13 B 18 36 30.37 0.084 25 180
Wading pool A 120 90 19.68 0.063 25 180 77.37 0.13 B 18 37 32.75 0.084 25 180 Shallow pool with slide
A 120 90 125.63 0.063 25 180 79.26 0.13 B 18 33 313.56 0.084 25 180
Waterfall A 120 90 6.58 0.063 25 180 74.96 0.13 B 18 42 6.83 0.084 25 180 The Present Value (PV) of a delayed payoff is found by multiplying the payoff (C1) by a discount factor as:
𝑃𝑃𝑉𝑉 = 𝐷𝐷𝑖𝑖𝐷𝐷𝐷𝐷𝑙𝑙𝐷𝐷𝑛𝑛𝐷𝐷 𝑓𝑓𝑎𝑎𝐷𝐷𝐷𝐷𝑙𝑙𝑓𝑓 ∗ 𝐶𝐶1 (19) The discount factor is expressed as:
𝐷𝐷𝑖𝑖𝐷𝐷𝐷𝐷𝑙𝑙𝐷𝐷𝑛𝑛𝐷𝐷 𝑓𝑓𝑎𝑎𝐷𝐷𝐷𝐷𝑙𝑙𝑓𝑓 = 1/(1 + 𝑓𝑓) (20) To calculate the present value, the expected future payoffs are discounted by the rate of return offered by comparable investment alternatives (i.e. the discount rate). To calculate the Present Value, the cash flows every year (C1, C2, C3,) are discounted by an appropriate discount rate:
𝑃𝑃𝑉𝑉 =𝐶𝐶1
(1 + 𝑓𝑓1)+
𝐶𝐶2(1 + 𝑓𝑓2)2
+𝐶𝐶3
(1 + 𝑓𝑓3)3+ ⋯ (21)
To find the Net Present Value we have:
𝑁𝑁𝑃𝑃𝑉𝑉 = 𝐶𝐶0 + 𝑃𝑃𝑉𝑉 (22)
where C0 = Initial investment. Internal Rate of Return (IRR) is the value of the discounted cash flow (DCF) rate of return that forces the NPV to zero in the period considered. IRR is evaluated by means of iterative calculation from the equation:

Report 9 125 Kinyanjui
𝑁𝑁𝑃𝑃𝑉𝑉𝐼𝐼𝑅𝑅𝑅𝑅 = 𝐶𝐶0 + �𝐶𝐶𝑖𝑖
(1 + 𝐼𝐼𝑅𝑅𝑅𝑅)𝑖𝑖
𝑛𝑛
𝑖𝑖=1= 0 (23)
where n = Number of years considered (project life). The economic analysis is done for the geothermal spa with an assumed project life of 10 years. In this cost analysis, the following assumptions were made:
• An average price of a ticket for an adult bather is 6 US dollars per visit and increases at 5% per year.
• The spa operates 330 days, paying for 30 days of maintenance in a year. • The average number of visitors in a year increases by 30%. Visitors in the first year of operation
number 25% of the annual number of tourists currently visiting Lake Nakuru National Park. • The variable and running costs increase at 15% annually. • The cost of exploration and well drilling is not considered. The price of hot geothermal is assumed
to be charged per volume consumed, irrespective of temperature drop. In this report it was assumed as 0.5 USD/m3. This is a very rough estimation of the price of fresh water in Kenya when sold in bulk for industrial use.
• The discount rate in this report is assumed to be 12%. This is based on the central bank of Kenya Treasury bond coupon rate for a 10 year maturation period, as of August 2013. Treasury bonds are considered as the opportunity cost in this report work.
• This analysis does not consider the main pipeline costs. The spa project is assumed to generate revenue after one year of initial capital expenditures for construction work. If the start-up year is 2015, then the following financial analysis is done. The preliminary analysis indicates that the cash flow will be positive after running the project for 2 years (Figure 16). The NPV curve at a 12% discount rate returns a positive value in the year 2019, five years after the assumed project start. This is according to a cumulative present value analysis (Figure 17). With a project life of 10 years, the indication is that the project is viable. According to the analysis, the IRR is 40% for a project life of 10 years. This is higher than the discount rate, indicating the viability of the project. After the 5th year, the IRR analysis indicates a higher rate than the discount rate, as shown in Figure 18.
FIGURE 17: Cumulative present values
FIGURE 18: Internal rate of return
-1000
-500
0
500
1000
1500
2000
2500
2014
2015
2016
2017
2018
2019
2020
2021
2022
2023
2024
USD
(tho
usan
d)
Year
NPV, 12%
-5%
0%
5%
10%
15%
20%
25%
30%
35%
40%
45%
2014
2015
2016
2017
2018
2019
2020
2021
2022
2023
2024
IRR,
FIGURE 16: Cash flows -1000
-500
0
500
1000
1500
2000
2014
2015
2016
2017
2018
2019
2020
2021
2022
2023
2024
USD
(tho
usan
d)
Year

Kinyanjui 126 Report 9 4.2 Conclusions A geothermal spa was designed for Menengai geothermal field. There are other factors that may contribute to the site location of the spa other than the pipeline cost alone as considered in this report. Financial gains, leisure as well as utilisation of the available resources which could not otherwise have been utilised, are some of the advantages in the construction of a spa. The nearness of Menengai geothermal field to Lake Nakuru provides an opportunity to attract more visitors as the distance between is relatively short. The fact that Menengai already attracts visitors, students, scholars and other professionals is a key indicator of the potential that exists in the field. This preliminary research work indicates that design and construction of a spa in Menengai is possible and could offer various benefits, among them financial. Health tourism will be greatly promoted whereby the tourists spend their spare time improving their health and wellbeing. With geothermal sites and power plants attracting visitors, scholar and students, this forms a potential for many tourists to visit the health spa. Heating of a conventionally circulated swimming pool was also discussed. Further research on silica scaling, the financial perspective and additional sources of geothermal water is recommended. 5. GEOTHERMAL CROP DRYING 5.1 Background Drying is one of the oldest methods of preserving food, and it is fairly simple, safe and can be done all year round if it done indoors under controlled conditions. It entails the removal of moisture from the product. Each type of crop has its own drying requirements. Some of the crops which require drying are cereals, tea, vegetables and fruits which are extensively grown in Kenya and are dried to a moisture content of below 13%. In addition to crops, fish and meat products also require drying for preservation purposes. Maize is the largest cereal grain grown in the Rift Valley regions and is sun dried on a small scale, while on a large scale, diesel power is used at government or privately owned grain drying and storage
facilities. Maize has continued to be the most important food crop in Kenya, playing an integral role in national food security. Kenya produces around 3 million tonnes of maize per year (Figure 19); about 15% is sold directly to the National Cereals and Produce Board and large millers. The total area under maize cultivation as of the end of 2003 stood at 1.6 million hectares (KNBS). Maize growing in Kenya is concentrated in the Rift Valley districts of Trans Nzoia, UasinGishu and Nakuru (Figure 20). The region is often referred to as the ‘Granary of Kenya’ (EPZA, 2005). Tea and coffee are dehydrated as part of their manufacturing process. This is done
at the processing factories. Vegetables are dehydrated to enhance their storage, minimise losses and enhance their availability during dry weather spells.
FIGURE 19: Maize production in Kenya (KNBS, 2012)
1998 1999 2000 2001 2002 2003 2004 2005 2006 20072000000
2200000
2400000
2600000
2800000
3000000
3200000
3400000
Maiz
e pro
ducti
on (M
etric
tons
)
Year
Report 9 127 Kinyanjui
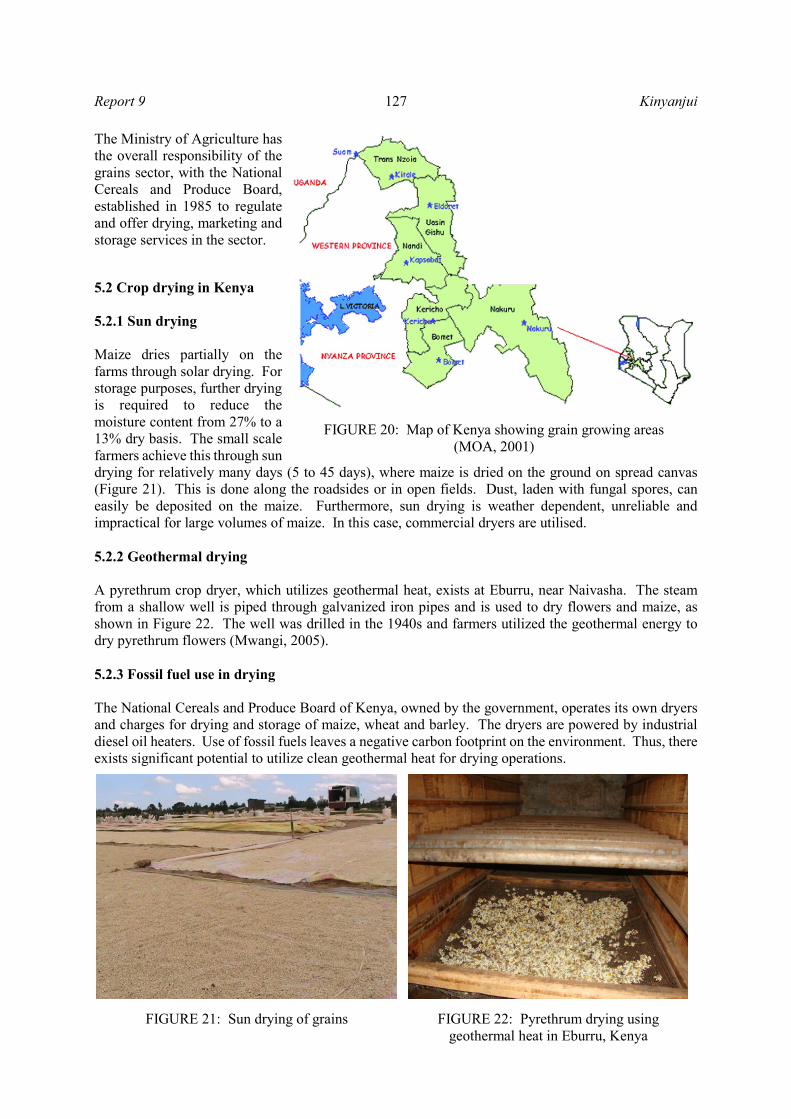
The Ministry of Agriculture has the overall responsibility of the grains sector, with the National Cereals and Produce Board, established in 1985 to regulate and offer drying, marketing and storage services in the sector. 5.2 Crop drying in Kenya 5.2.1 Sun drying Maize dries partially on the farms through solar drying. For storage purposes, further drying is required to reduce the moisture content from 27% to a 13% dry basis. The small scale farmers achieve this through sun drying for relatively many days (5 to 45 days), where maize is dried on the ground on spread canvas (Figure 21). This is done along the roadsides or in open fields. Dust, laden with fungal spores, can easily be deposited on the maize. Furthermore, sun drying is weather dependent, unreliable and impractical for large volumes of maize. In this case, commercial dryers are utilised. 5.2.2 Geothermal drying A pyrethrum crop dryer, which utilizes geothermal heat, exists at Eburru, near Naivasha. The steam from a shallow well is piped through galvanized iron pipes and is used to dry flowers and maize, as shown in Figure 22. The well was drilled in the 1940s and farmers utilized the geothermal energy to dry pyrethrum flowers (Mwangi, 2005). 5.2.3 Fossil fuel use in drying The National Cereals and Produce Board of Kenya, owned by the government, operates its own dryers and charges for drying and storage of maize, wheat and barley. The dryers are powered by industrial diesel oil heaters. Use of fossil fuels leaves a negative carbon footprint on the environment. Thus, there exists significant potential to utilize clean geothermal heat for drying operations.
FIGURE 21: Sun drying of grains
FIGURE 22: Pyrethrum drying using geothermal heat in Eburru, Kenya
FIGURE 20: Map of Kenya showing grain growing areas (MOA, 2001)

Kinyanjui 128 Report 9 A privately owned drying firm, Lesiolo Grain Dryers, also based in Nakuru, provides drying services and post-harvest management of grains including wheat, maize, barley and sorghum. It has a combined storage capacity of 80,000 metric tons and 6 dryers of capacities ranging from 10 to 100 tons, all using industrial diesel oil. In addition, it has two mobile dryers of 13 tons capacity each, which are either operated from a tractor PTO or diesel powered with a 200 litre fuel tank capacity, operating in a temperature range of 40 to 60°C. 5.3 Theory of grain drying The main objective of drying agricultural products is to reduce the moisture content to certain levels that allow safe storage over an extended period of time. It also brings about a reduction in weight and volume, minimizing packaging, storage and transportation costs (Kavak Akpinar et al., 2006). Thermal drying is most commonly used and involves the vaporisation of moisture within the product by the application of heat with subsequent evaporation from the product. Thus, in thermal drying, there is simultaneous heat and mass transfer. Drying is an energy intensive operation. In most industrialized countries, the energy used in drying accounts for 7–15% of the nation’s industrial energy, often with relatively low thermal efficiencies ranging from 25% to 50% (Kavak Akpinar et al., 2006). Agricultural crop drying has been reported to account for about 12 to 20% of the energy consumption in the agricultural sector (Liviu and Badea, 2009). During the drying process, food materials undergo physical, chemical, and biological changes which can affect some natural attributes like texture, colour, flavour, and nutritional value. Changes in colour and flavour are most important to crops like tea, fruits and vegetables. The drying process influences these factors and, therefore, the quality of the final product. Drying of grains is mainly divided into four broad categories: low-temperature drying using unheated air; medium-temperature drying, below 43°C for seeds and below 60 °C for grains to be milled; high-temperature drying where kernel temperatures are maintained below 82°C for animal feeds; and combination drying using both low and high temperatures (FAO, 2008). The optimum grain drying temperature depends on the dryer type, the grains species and the grain quality requirements. The importance of a dryer is to supply the product with more heat than is available under ambient conditions, thereby increasing the vapour pressure of the moisture held within the crop and decreasing significantly the relative humidity of the drying air and increasing its moisture carrying capacity, ensuring sufficiently low equilibrium moisture content. 5.3.1 Drying kinetics Thermal drying involves two simultaneous actions: a heat transfer process by which the moisture content of the solid is reduced and a mass transfer process where there is fluid displacement within the structure of the solid towards its surface and evaporation. The quality and quantity of energy as well as heat and mass transfer should be investigated throughout the drying processes. 5.3.2 Water activity Water activity (aw) is the ratio of the vapour pressure of water in a material to the vapour pressure of pure water at the same temperature. The water activity of a sample is equal to the relative humidity of air, when there is equilibrium of vapour pressure and temperature. Water activity is temperature dependent. Temperature changes water activity due to changes in water binding, dissociation of water, solubility of solutes in water, or the state of the matrix.
𝑎𝑎𝑤𝑤 =𝑝𝑝𝑝𝑝𝑡𝑡
(24)

Report 9 129 Kinyanjui
where p = Vapour pressure of water in the product; and po = Vapour pressure of pure water at the same temperature. Water activity affects the shelf life, safety, texture, flavour, and smell of foods and it is the most important factor in controlling spoilage. 5.3.3 Moisture content Moisture content of a substance is expressed as a percentage by weight on a wet or dry basis. The moisture content is presented as relative to dry basis, because the dry basis concept is the common basis in the drying research area. A commonly used simple model, assuming that the resistance for water transport is all over the surface of the particle, is represented by an equation analogous to Newton’s law of cooling, the Lewis equation (Lewis, 1921):
𝑑𝑑𝑑𝑑𝑑𝑑𝑑𝑑
= −𝑘𝑘(𝑑𝑑−𝑑𝑑𝑒𝑒𝑒𝑒) (25)
where M = Moisture content; Meq = Equilibrium moisture content; θ = Time; and k = Drying constant dependent on the product. The moisture content attained by a product with respect to a set of atmospheric temperatures and relative humidity is called the equilibrium moisture content. In such conditions, the grain moisture is in equilibrium with the surrounding air. Moisture storage requirements for some grains is shown in Table 11. According to Henderson and Pabis (1961):
𝑑𝑑𝑓𝑓𝑖𝑖𝑖𝑖𝑎𝑎𝑓𝑓 −𝑑𝑑𝑒𝑒𝑒𝑒
𝑑𝑑𝑖𝑖𝑖𝑖𝑖𝑖𝑡𝑡𝑖𝑖𝑎𝑎𝑓𝑓 − 𝑑𝑑𝑒𝑒𝑒𝑒= 𝑅𝑅−𝑘𝑘𝑘𝑘 (26)
where Minitial = Initial moisture content; and Mfinal = Final moisture content. 5.4 Grain dryers Grain dryers can either be unheated air dryers or heated air dryers:
Unheated or natural air-drying is usually performed in a storage bin for a relatively small volume of grain. The period of drying is very much dependent on the weather and could take relatively long to completely dry. Turning of grains is usually performed to ensure uniform and continuous drying. Heated air dryers can be deep bed dryers or thin layer dryers. In deep bed drying, the condition of the drying air at any point in the grain mass changes with time and the depth of the grain bed. The rate of drying is slower when compared to thin layer drying of grain. The heat should not be more or less than the required amount for evaporation to avoid hardening, discolouration or other unsuitable outcomes (Tesha, 2006).
The most common shapes in deep bed drying are round or rectangular. For efficient operation of deep bed dryers, the air flow rate of 2.94 - 3.92 m³/minute per tonne is recommended. An air flow rate that
TABLE 11: Moisture requirement for storage of grains
Crop Moisture content for storage (% w.b) For one year
storage For two year
storage Maize 13 11 Wheat 13-14 11-12 Barley 13 11

Kinyanjui 130 Report 9 is above 3.92 m³/minute per tonne may result in uneven drying and is expensive in operation. If the moisture content of grains is up to 18%, the layer depth of grain should be limited to 3 m and, above 18%, the moisture depth recommended is 2.5 m. The net perforated area of the floor should be 15% of the total floor area. An air velocity of 300 m/minute through opening is preferable. Thin layer drying refers to the grain drying process in which all grains are fully exposed to the drying air under constant drying conditions. Most commercial dryers are designed on thin layer drying principles. In this case, two periods of drying are usually encountered: the constant drying rate where the rate of evaporation under any given set of air condition is independent of the solid and is essentially the same as the rate of evaporation from a free liquid surface under the same conditions; the falling rate period enters after the constant drying rate period and corresponds to the drying cycle where the product surface is no longer wet and continually decreases until the surface is dry. 5.5 Factors influencing the quality of dried product Several factors affect the quality of dried product. These include quality of raw material, drying rate and drying temperature. 5.5.1 Raw material quality Agricultural materials can be either hygroscopic (absorbing moisture from the air) or non-hygroscopic. The quality of the dried product can only be as good as the material from which it was derived. Food products like fish and meat products are usually sensitive and heavily dependent on the raw material quality. Fruit products can be sliced to obtain better and more evenly dried products. 5.5.2 Drying rate A very fast drying rate can cause shrinkage while a slow rate could result in loss rehydration capacity or increase costs. The drying rate is dependent upon several factors, namely air temperature, air flow rate, relative humidity, exposure time, variety and size of grain, initial moisture content, and grain depth. The rate of drying increases with the rise of air temperature. According to Henderson and Pabis (1961) the air rate has no observable effect on thin layer drying of wheat when air flow is turbulent. However, for paddy rice and maize, it has been found that the air rate has an effect on the rate of drying. Increasing air humidity decreases the rate of drying while the increase in exposure time of drying air in a single pass increases the drying rate. The empirical drying equation for maize is:
𝑑𝑑𝑒𝑒𝑒𝑒 = 0.01 ∗ �𝐿𝐿𝑁𝑁(1 − 𝑓𝑓ℎ𝑎𝑎𝑎𝑎𝑏𝑏)
−8.65 ∙ 10−5(𝑇𝑇𝑎𝑎𝑎𝑎𝑏𝑏 + 49.810)�
11.8634
(27)
where rhamb = Relative humidity of ambient air; and Tamb = Ambient temperature (°C). 5.5.3 Drying temperature Different products have an optimum drying temperature. Very high temperatures lead to distortion of the chemical composition or may even result in ‘cooking’ the product. The optimum temperature for maize drying is 49°C. Tea is dried at a temperature range of 60-100°C, depending on the desired flavour. A very high drying temperature for fish can also lead to case hardening, which may be prevented by controlling the relative humidity and temperature of the drying air (Sotocinal, 1992).

Report 9 131 Kinyanjui
5.6 Mass and heat balances The rate of air flow required for drying may be calculated by making a heat balance. The heated air drying system is represented in Figure 23.
FIGURE 23: Heated air drying system where c1 = Air flow rate (m3/hr); w1, w2, w3 = Humidity ratios of ambient, heated and exhaust air, respectively (kg/kg); rh1, rh2, rh3 = Relative humidity of ambient, heated and exhaust air, respectively; t1, t2, t3 = Temperature of ambient, heated and exhaust air, respectively; wd = Weight of bone dry grain in the dryer (kg); x1, x2 = Initial and final moisture contents of grain (kg/kg); tg1, tg2 = Initial and final grain temperatures (°C); and v1 = Specific volume of air (m3/kg). Heat supplied by drying air, 𝑞𝑞𝑎𝑎 is given by:
𝑞𝑞𝑎𝑎 = �(0.24 + 0.45𝑤𝑤1) ∗ 𝐺𝐺𝑡𝑡(𝐷𝐷3 − 𝐷𝐷2)𝑑𝑑� ∗ 4.187 (28)
where qa = Heat supplied by air (kJ); θ = Drying time (hours); and G0 = Rate of air supply (kg/hr). Heat required for evaporation of moisture from the grain, 𝑞𝑞1 is given by:
𝑞𝑞1 = 𝑤𝑤𝑑𝑑(𝑥𝑥1 − 𝑥𝑥2)𝜆𝜆 (29)
where q1 = Heat required for operation (kJ); and λ = Average value of latent heat of vaporisation of moisture from the grain (kJ/kg). Sensible heat required to raise the grain temperature is given by:
𝑞𝑞0 = 𝑤𝑤𝑑𝑑𝐷𝐷𝑔𝑔�𝐷𝐷𝑔𝑔2 − 𝐷𝐷𝑔𝑔1� + 𝑤𝑤𝑑𝑑𝐷𝐷𝑤𝑤�𝐷𝐷𝑔𝑔2 − 𝐷𝐷𝑔𝑔1�𝑥𝑥1 (30)
where q0 = Sensible heat required to raise the temperature of the grain and its moisture (kJ); and cg, cw = Specific heats of grain and water, respectively (kJ/kg°C). The overall mass and energy balances in a drying system give information on dryer performance and parameters of dryer design.
Heater
Dryerwd
x2, tg2
x1, tg1
Airamb Heated air
c1, v1, w1, rh1, t1 t2, w2, rh2
Exhaust airt3, w3, rh3

Kinyanjui 132 Report 9 Using energy and mass balance:
𝑞𝑞𝑎𝑎 = 𝑞𝑞1 + 𝑞𝑞0 (31) And solving for 𝐺𝐺𝑡𝑡:
𝐺𝐺𝑡𝑡 =𝑊𝑊𝑑𝑑[(𝑥𝑥1 − 𝑥𝑥2)𝜆𝜆 + 𝐷𝐷𝑔𝑔�𝐷𝐷𝑔𝑔2 − 𝐷𝐷𝑔𝑔1� + 𝐷𝐷𝑤𝑤�𝐷𝐷𝑔𝑔2 − 𝐷𝐷𝑔𝑔1�𝑥𝑥1]
�(0.24 + 0.45𝑤𝑤1) ∗ (𝐷𝐷3 − 𝐷𝐷2)𝑑𝑑� ∗ 4.187 (32)
and
𝐺𝐺 = 𝐺𝐺𝑡𝑡 ∗ 𝑣𝑣1 (33)
where v1 = Specific volume of humid air (m3/kg). Fuel consumption rate:
𝑓𝑓𝑎𝑎𝐷𝐷𝑅𝑅𝑑𝑑𝑖𝑖𝑒𝑒𝑖𝑖𝑒𝑒𝑓𝑓 =𝑞𝑞𝑎𝑎
ŋ ∗ ŋ𝑏𝑏 ∗ ŋ𝑒𝑒𝑒𝑒 ∗ 𝐶𝐶𝑖𝑖 (34)
where ratediesel = Fuel rate (kg/hr); Cn = Calorific value of fuel (kJ/kg); η = Efficiency of the heating system; ηb = Efficiency of boiler; and ηex = Efficiency of the heat exchanger. Design of fan and blowers Selection and design of a centrifugal blower is done for a given airflow rate and static pressure. Specific speed (Ns) for the specific static pressure, air flow rate and designed motor speed are found by:
𝑁𝑁𝑖𝑖 =𝑁𝑁�𝑄𝑄 𝑃𝑃𝑖𝑖0.75 (35)
where N = Speed of the motor (rpm); Q = Air flow rate (cubic feet/min); and Ps = Static pressure (inches of water). The type of air moving unit which would operate at high efficiency is determined at or near peak efficiency at the calculated specific speed, from fan efficiency curves (Appendix II). If more than one type of air moving unit has good efficiency, a final selection can be based on other factors such as relative cost, size and shape of space available and the characteristics of the air flow path (Shirbhate, 2013). The typical value of the pressure coefficient, Ψ, is found by interpolation, for the type of fan or blower selected and the value of specific speed, NS. The impeller diameter is found from:
𝛹𝛹 =2.35 ∙ 108𝑃𝑃𝑖𝑖
𝑁𝑁2𝑑𝑑2 (36)
where ψ = Pressure coefficient; and d = Diameter of the impellor (inches). The typical value of the flow coefficient is found from the fan characteristics table and the width is calculated as follows:
𝑊𝑊 =175𝑄𝑄𝛷𝛷𝑁𝑁𝑑𝑑2
(37)
where W = Width of the impellor (inches); and 𝛷𝛷 = Flow coefficient.

Report 9 133 Kinyanjui
Geothermal heating requirement The heat supplied by air is equivalent to the heat energy from geothermal. The total amount of geothermal supplied, 𝐺𝐺𝑅𝑅𝑙𝑙𝑎𝑎𝑎𝑎𝑡𝑡𝑢𝑢𝑖𝑖𝑡𝑡 is given by:
𝐺𝐺𝑅𝑅𝑙𝑙𝑎𝑎𝑎𝑎𝑡𝑡𝑢𝑢𝑖𝑖𝑡𝑡 = 𝑞𝑞𝑎𝑎 ∗ (𝑇𝑇𝑖𝑖𝑖𝑖 − 𝑇𝑇𝑡𝑡𝑢𝑢𝑡𝑡) ∗ 𝐷𝐷𝑤𝑤 (38)
where Geoamount = Total amount of geothermal utilised (kg); Tin = Entry temperature of geothermal in the heat exchanger; and Tout = Exit temperature of geothermal in the heat exchanger. The geothermal flow rate, �̇�𝑚 in kg/s is given by:
�̇�𝑚 = �𝐺𝐺𝑅𝑅𝑙𝑙𝑎𝑎𝑎𝑎𝑡𝑡𝑢𝑢𝑖𝑖𝑡𝑡3600 ∗ 𝑑𝑑
� (39)
For diesel use, the total cost of diesel fuel in USD is given by:
𝐶𝐶𝑙𝑙𝐷𝐷𝐷𝐷𝑑𝑑𝑖𝑖𝑒𝑒𝑖𝑖𝑒𝑒𝑓𝑓 = 𝑓𝑓𝑎𝑎𝐷𝐷𝑅𝑅𝑑𝑑𝑖𝑖𝑒𝑒𝑖𝑖𝑒𝑒𝑓𝑓 ∗ 𝑑𝑑 ∗ 𝑝𝑝𝑓𝑓𝑖𝑖𝐷𝐷𝑅𝑅𝑑𝑑𝑖𝑖𝑒𝑒𝑖𝑖𝑒𝑒𝑓𝑓 (40)
where pricediesel = Price of diesel (USD/l). The cost of geothermal in USD is calculated from:
𝐶𝐶𝑙𝑙𝐷𝐷𝐷𝐷𝑔𝑔𝑒𝑒𝑡𝑡 = 𝐺𝐺𝑅𝑅𝑙𝑙𝑎𝑎𝑎𝑎𝑡𝑡𝑢𝑢𝑖𝑖𝑡𝑡 ∗ 𝑝𝑝𝑓𝑓𝑖𝑖𝐷𝐷𝑅𝑅𝑔𝑔𝑒𝑒𝑡𝑡 (41)
where pricegeo = Price of geothermal (USD/kg). 5.7 Design of a geothermal crop dryer 5.7.1 Type, size and shape The design of a heated grain dryer varies with the method of drying, whether a static deep bed batch dryer or the continuous flow batch dryers (mixing or non-mixing type). A static batch dryer is designed in this research work. The components include the drying chamber, air distribution system, indirect air heating system and the blower. The capacity of the dryer is 20 tons of maize at ambient air conditions. The tunnel/bed type of the dryer is adopted in this design in order to accommodate a wide variety of agricultural products, with minimal modification to the air flow duct and temperature regulation. The thickness of the grain layer exposed is limited to the depth of each tray and fixed to 10 cm. The dryer shall be a tunnel type where the air is blown from the side of the drying chamber and flows along the trays. This is appropriate when drying high moisture products and air re-circulation is necessary. When the air direction is vertical from below, then it is a bed dryer and the choice depends on the type of crop being dried. This also allows for comparing the efficiency of the heat exchanger for both air flow types. An air diversion valve is provided for changing the air flow from tunnel to the bottom of the drying trays. 5.7.2 Drying tea, fruits and vegetables The processing steps in manufacturing black tea are plucking, withering, maceration, fermentation and drying. Withering reduces the moisture content to about 70% wet basis. It is then dried for about 1 or 2 hours depending on the desired flavour, at a temperature range of 70 to 120°C to a moisture content of 3% (Temple et al., 2000). According to Panchariya et al. (2002), the air velocity is considered to be 0.25 to 0.65 m/s or less. Fruits and vegetables are considered shrinkable products after drying. The drying kinetics used in this design are based on experimental work by Kowalski and Mierzwa (2013), with an air temperature of 50°C and air flow velocity of up to 1.2 m/s. These parameters for drying tea and vegetables are used to predict the energy requirements by using the model of the designed tunnel dryer.

Kinyanjui 134 Report 9 5.7.3 Air recirculation The drying temperature depends upon the characteristics of the products. The air can be circulated with the help of a fan and blown in counter-current direction to the flow of the solid (Maharjan, 1995). If the temperatures are too high, the food products may cook or may cause case hardening where moisture is trapped inside the product. On the other hand, too low drying temperatures slow down the drying time and may lead to spoilage of moisture sensitive products like fish and meat products. During the initial drying stages, the moisture evaporates quickly from the product. When the surface moisture is lost, the outside begins to feel dry and the rate of evaporation slows down as the product warms up. It becomes important to recirculate the relatively humid air and prevent case hardening. In drying at a temperature of 49°C and air exiting at 43°C, we have the air properties during the drying process shown in Appendix III. The ambient air is 19°C with 67% relative humidity. The recirculated air properties are as shown in the process labelled “B” in Appendix III at 49°C and 42% relative humidity. This will require 25% fresh ambient air resulting in energy saving while maintaining the product. The designed pilot dryer for drying maize is shown in Figure 24 and the details for the trays are shown in Figure 25.
FIGURE 24: Designed crop dryer
FIGURE 25: Details of the designed drying trays

Report 9 135 Kinyanjui
In drying maize, air is blown into the heat exchanger at an ambient temperature of 19°C and heated to 65°C, and exits the drying chamber at 49°C. Control of geothermal flow into the water-air heat exchanger is then necessary, depending on the product being dried. The design model was run for different maize capacities and different drying hours to determine the variations in the required flow rate as shown in Figures 26 and 27. Figure 26 shows the variation of geothermal flow rate for different drying times for maize grains. Drying time is dictated by the amount of moisture to be removed and the type of product. For a higher volume of products, it is recommended to use a longer drying time when using relatively small pipe diameters or when the geothermal mass flow is not sufficient. The geothermal flow rate decreases exponentially with an increase in drying time as shown in Figure 27. The amount of heat energy required for various weights of maize is shown in Figure 28.
FIGURE 26: Variation of mass flow for different masses of maize
FIGURE 27: Mass flow against time for various grain capacities
Both the rates of geothermal usage and diesel usage increase lineally with an increase in the mass of grains being dried as shown in Figure 29.
FIGURE 28: Heat energy requirement for various masses of grains
FIGURE 29: Geothermal flow rate and diesel consumption rates for drying different masses of
grains
5 10 15 20 25 30 35 400
5
10
15
20
25
30
35
40
45
Geo_
flow
rate
(kg/
s)
Drying time (hours)
100 Metric tons 200 Metric tons 500 Metric tons
0 200 400 600 800 10000
50
100
150
200
250
300
350
Ener
gy X
106 (k
J)
Mass of maize (tons)0 200 400 600 800 1000
-5
0
5
10
15
20
25
30
35
40 geothermal flow rate
Mass of Grains (Metric tons)
Geo_
flow
rate
(kg/
s )
0
200
400
600
800
1000 diesel consumption rate
Diesel consumption rate (litres/hr )
Kinyanjui 136 Report 9
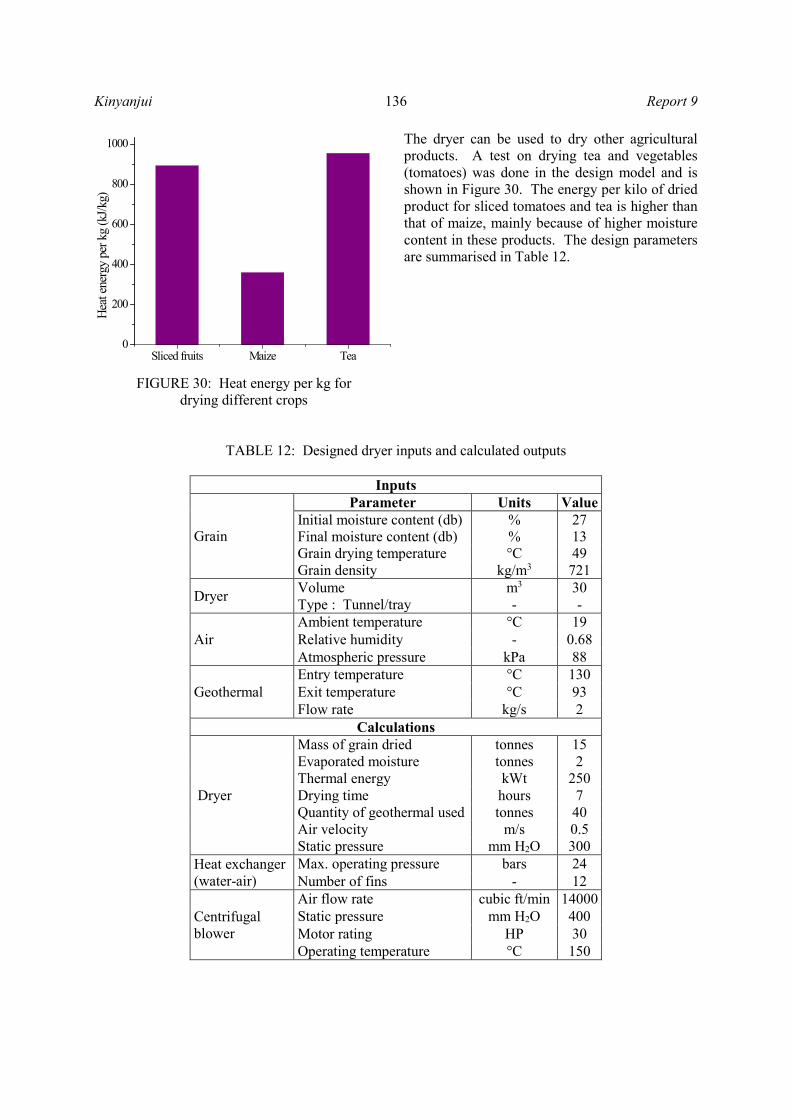
The dryer can be used to dry other agricultural products. A test on drying tea and vegetables (tomatoes) was done in the design model and is shown in Figure 30. The energy per kilo of dried product for sliced tomatoes and tea is higher than that of maize, mainly because of higher moisture content in these products. The design parameters are summarised in Table 12.
TABLE 12: Designed dryer inputs and calculated outputs
Inputs
Grain
Parameter Units Value Initial moisture content (db) % 27 Final moisture content (db) % 13 Grain drying temperature °C 49 Grain density kg/m3 721
Dryer Volume m3 30 Type : Tunnel/tray - -
Air Ambient temperature °C 19 Relative humidity - 0.68 Atmospheric pressure kPa 88
Geothermal Entry temperature °C 130 Exit temperature °C 93 Flow rate kg/s 2
Calculations Dryer
Mass of grain dried tonnes 15 Evaporated moisture tonnes 2 Thermal energy kWt 250 Drying time hours 7 Quantity of geothermal used tonnes 40 Air velocity m/s 0.5 Static pressure mm H2O 300
Heat exchanger (water-air)
Max. operating pressure bars 24 Number of fins - 12
Centrifugal blower
Air flow rate cubic ft/min 14000 Static pressure mm H2O 400 Motor rating HP 30 Operating temperature °C 150
FIGURE 30: Heat energy per kg for drying different crops
Sliced fruits Maize Tea0
200
400
600
800
1000
Heat
ener
gy p
er k
g (k
J/kg)

Report 9 137 Kinyanjui
6. CONCLUSIONS A geothermal crop dryer was designed and the energy required to dry grains was evaluated. The same dryer can be used for drying more crop varieties and can be experimented upon. Air re-circulation is a means of saving energy and maintaining high drying quality and can be implemented as indicated in this report. The recommendation from this work, is to evaluate the drying efficiency of this dryer against drying various crops and do a cost comparison with diesel. The quality of the dried crops with regard to nutrients and shrinkage properties should be analysed and reported. Cascaded application with drying should be studied further among other applications.
ACKNOWLEDGEMENTS I would like to thank my employer, Geothermal Development Company, for granting me the opportunity to attend this training programme. I am also grateful to the former director, Dr. Ingvar B. Fridleifsson and the current director Mr. Lúdvík S. Georgsson, for the successful organization of the programme. Many thanks go to my supervisors, Dr. Árni Ragnarsson and Prof. Sigurjón Arason for their good guidance, for sharing their knowledge and for supervision of this work. My thanks also go to Mr. Jóhann F. Kristjánsson for his assistance. Sincere thanks to Ms. Thórhildur Ísberg, Mr. Ingimar G. Haraldsson, Ms. Málfrídur Ómarsdóttir and Mr. Markús A.G. Wilde for their useful help during the training period. I am grateful to the UNU Fellows for the time we have had together. Special thanks to my wife Dorcas M. Ndirangu for her support, love, encouragement, prayers and endurance during my stay in Iceland. Thanks to Almighty God for giving me wisdom and the strength.
NOMENCLATURE KNBS = Kenya National Bureau of Statistics; MOA = Ministry of Agriculture; EUSPA = European Union of swimming pool and spa associations; GDC = Geothermal Development Company; GDP = Gross Domestic Product; FAO = Food and Agriculture Organisation; NCPB = National Cereals and Produce Board; and USD = US dollars.
REFERENCES Breadley, R., Myers S., and Allen 2011: Principles of corporate finance (10thed.). McGraw-Hill, Ltd., NY, 969 pp. EPZA, 2005: Grain production in Kenya 2005. Export Processing Zone Authority, website: www.epzakenya.com.

Kinyanjui 138 Report 9 EUSSA, 2010: Domestic swimming pool water 2010. European Union Swimming and Spa Association, website: www.eusaswim.eu/Documentation/downloads/Paper-on-water-quality.pdf. FAO, 2008: Basic principles of grain drying. Food and Agriculture Organisation, website: www.fao.org/home/en/. FAO, 2011: Situation analysis: improving food safety in the maize value chain in Kenya. Food and Agriculture Organisation, website: www.fao.org/home/en/. GDC, 2013: Well MW-03 discharge chemistry report. Geothermal Development Company, Kenya, unpublished report, 12 pp. Government of the Republic of Kenya, 2013: Kenya Vision 2030. Website: www.vision2030.go.ke Halldórsson, G., 1975: Heating and cleaning of water in swimming pools. Sigurdur Thoroddsen Consulting Engineers, report ST 75 071 (in Icelandic), 63 pp. Henderson, S.M., and Pabis, S., 1961: Grain drying theory I. Temperature effect on drying coefficient. J. Agriculture Engineering Res., 6-3, 169-174. Jamieson, R.E., 1984: Simulation of the silica scaling process. Proceedings of the 6th New Zealand Geothermal Workshop, Auckland University, Auckland, NZ, 135-140. Kashpur, V.N., and Popatov, V.V., 2000: Study of the amorphous silica scales formation at the Mutnovskoe hydrothermal field (Russia). Proceedings of the 25th Workshop on Geothermal Reservoir Engineering Stanford University, Stanford, Ca, 7 pp. Kavak Akpinar, E., Bicer, Y., Cetinkaya, Y., 2006: Modelling of thin layer drying of parsley leaves in a convective dryer and under open sun. Research Gate, website: www.reasearchgate.net. Kevin, D., Rafferty, P.E., and Gene, C., 1991: Heat exchangers. In: Lienau, P.J., and Lunis, B.C. (editors), Geothermal direct use engineering and design guidebook. Geo-Heat Centre, Institute of Technology, Klamath Falls, 247-261. Kipng’ok, J.K., 2011: Fluid chemistry, feed zones and boiling in the first geothermal exploration well at Menengai, Kenya. Report 15 in: Geothermal training in Iceland 2011. UNU-GTP, Iceland, 281-302. KNBS, 2012: Maize production in Kenya. Kenya Bureau of Statistics, website: www.knbs.or.ke/. Kowalski, S.J., and Mierzwa, D., 2013: Numerical analysis of drying kinetics for shrinkable products such as fruits and vegetables. J. Food Engineering, 114-4, 522-529. Lewis, W.K., 1921: The rate of drying of solid materials. Ind. Eng. Chem., 13-5, 427-432. Liviu, G., and Badea, L., 2009: Aspects into the use of renewable energy sources in cereals drying process. Proceedings of the 8th WSEAS International Conference on Signal Processing, Robotics and Automation 2009, 74-77. Maharjan R., 1995: Design of a dryer and a swimming pool using geothermal water. Report 7 in: Geothermal training in Iceland 1995. UNU-GTP, Iceland, 155-184. Mangi P., 2012: Geothermal resource optimization: a case of the geothermal health spa and demonstration centre at the Olkaria geothermal project. Presented at Short Course VII on Exploration

Report 9 139 Kinyanjui
for Geothermal Resources, organized by UNU-GTP, GDC and KenGen, at Lake Bogoria and Lake Naivasha, Kenya,10 pp. MOA, 2001: Grain growing areas in Kenya. Ministry of Agriculture, Kenya. Mwangi:, M., 2005: Lectures on geothermal in Kenya and Africa. UNU-GTP, Iceland, Report 4, 58 pp. Ólafsson, J.H., and Sigurgeirsson, B., 2003: The Blue Lagoon and psoriasis. Blue Lagoon Ltd., 12 pp. Orkustofnun, 2013: Bathing and recreation. Website: www.nea.is/geothermal/direct-utilization /bathing--recreation. Panchariya, P.C., Popovic, D., and Sharma, A.L., 2002: Thin-layer modelling of black tea drying process. J. Food Engineering, 52-4, 349-357. Perkins, P.H., 1988: Swimming pools. Elsevier Applied Science Publishers Ltd., London, 370 pp. Pétursdóttir, S., and Kristjánsson, J.K., 1995: The relationship between physical and chemical conditions and low microbial diversity in the Blue Lagoon geothermal lake in Iceland. FEMS Microbiology Ecology, 19-1, 39-45. RETScreen, 2011: Retscreen international – Empowering cleaner energy decisions. Natural Resources Canada, website: http://www.retscreen.net/ang/home.php Ruiz, E., and Martınez, P.J., 2009: Analysis of an open-air swimming pool solar heating system by using an experimentally validated TRNSYS model. Universidad Miguel Hernandez, Edificio Torreblanca, Elche, Spain, 8 pp. Shirbhate, D.V., 2013: Design and study of grain dryer. Scribd, website: www.scribd.com/doc/7370568/Design-Study-of-Grain-Dryer, 101 pp. Sotocinal, A.S., 1992: Design and testing of a natural convection solar fish dryer. McGill University Montreal, Department of Agricultural Engineering, MSc thesis, 202 pp. Temple S.J., Tambala S.T., and Boxtel A.J.B., 2000: Monitoring and control of fluid-bed drying of tea. Control Engineering Practice, 8, 165-173. Tesha, 2006: Utilization of brine water for copra drying in Lahendong geothermal field, Indonesia. Report 20 in: Geothermal training in Iceland 2006. UNU-GTP, 453-470.

Kinyanjui 140 Report 9
APPENDIX I: Results of variable distance transform for pipe route selection
FIGURE 1: Map showing pipe route for supply (a) and re-injection (b) under scenario A
FIGURE 2: Map showing pipe route for supply (a) and re-injection (b) under scenario B
FIGURE 3: Map showing pipe route for supply (a) and re-injection (b) under scenario C
a)
a)
a)
b)
b)
b)

Report 9 141 Kinyanjui
APPENDIX II: Shedd’s curve showing resistance of grains to air flow
FIGURE 1: Resistance of grains to airflow (Shedd’s characteristic curve, 1953)
APPENDIX III: Air properties during the drying process
FIGURE 1: Psychometric chart indicating air properties under re-circulation