Capillary electrophoresis and mass spectrometry for screening of metabolic disorders in newborns
Review
Marlene LacroixVéréna PoinsotClara FournierFrançois Couderc
Laboratoire des IMRCP,UMR 5623, ERT 1046,Université Paul Sabatier,Toulouse, France
Laser-induced fluorescence detection schemes forthe analysis of proteins and peptides using capillaryelectrophoresis
Over the past few years, a large number of studies have been prepared that describe theanalysis of peptides and proteins using capillary electrophoresis (CE) and laser-inducedfluorescence (LIF). These studies have focused on two general goals: (i) development ofautomatic, selective and quick separation and detection of mixtures of peptides or pro-teins; (ii) generation of new methods of quantitation for very low concentrations (nm andsubnanomolar) of peptides. These two goals are attained with the use of covalent label-ling reactions using a variety of dyes that can be readily excited by the radiation from acommonly available laser or via the use of noncovalent labelling (immunoassay using alabelled antibody or antigen or noncovalent dye interactions). In this review article, wesummarize the works which were performed for protein and peptide analysis via CE-LIF.
Keywords: Capillary electrophoresis / Laser-induced fluorescence / Peptides / Proteins / ReviewDOI 10.1002/elps.200410414
Contents
1 Introduction . . . . . . . . . . . . . . . . . . . . . . . . . . 26082 Dyes covalently bound to peptides or
proteins . . . . . . . . . . . . . . . . . . . . . . . . . . . . . 26092.1 NDA . . . . . . . . . . . . . . . . . . . . . . . . . . . . . . . . 26092.1.1 Substance P (SP). . . . . . . . . . . . . . . . . . . . . . 26092.1.2 Other peptide studies . . . . . . . . . . . . . . . . . . 26102.1.3 Postcolumn derivatisation . . . . . . . . . . . . . . 26102.2 5-Furoylquinoline-3-carboxaldehyde (FQ). . 26112.2.1 Chemical reaction studies . . . . . . . . . . . . . . 26112.2.2 Precolumn and on-column protein labelling 26122.2.3 Single cell analysis . . . . . . . . . . . . . . . . . . . . 26132.3 (4-Carboxybenzoyl)quinoline-
2-carboxaldehyde (CBQCA) . . . . . . . . . . . . . 26132.4 FITC . . . . . . . . . . . . . . . . . . . . . . . . . . . . . . . . 26132.5 Other covalent labels . . . . . . . . . . . . . . . . . . 26142.5.1 4-Chloro-7-nitro-2,1,3-benzoxadiazole
(NBD-Cl) . . . . . . . . . . . . . . . . . . . . . . . . . . . . . 26142.5.2 5-Bromomethylfluorescein (5-BMF) and
5 or 6-iodoacetamidofluorescein (IAF) . . . . . 26152.5.3 Iodoacetyl Lissamine rhodamine B . . . . . . . 2615
2.5.4 Rhodamine based dyes . . . . . . . . . . . . . . . . 26152.5.5 6-Aminoquinolyl-N-hydroxysuccinimidyl
carbamate (AQC). . . . . . . . . . . . . . . . . . . . . . 26152.5.6 Near-infrared (NIR) dyes . . . . . . . . . . . . . . . . 26153 Peptide or protein labelling using immuno-
assays or noncovalent dye labelling . . . . . . 26163.1 CE-based immunoassays/LIF . . . . . . . . . . . 26163.2 Noncovalent dye labelling. . . . . . . . . . . . . . . 26184 Native fluorescence. . . . . . . . . . . . . . . . . . . . 26195 Conclusion. . . . . . . . . . . . . . . . . . . . . . . . . . . 26206 References. . . . . . . . . . . . . . . . . . . . . . . . . . . 2620
1 Introduction
CE with laser-induced fluorescence (LIF) is a powerfulanalytical technique for the analysis of peptides and pro-teins. While many papers describing the topic of proteinquantitation using MS for the quantitative studies of pro-teins or peptides have been published [1], a large numberof workers have reported that CE-LIF can be used as analternative to such sophisticated analytical instrumentsfor quantitative study of peptides and proteins. We notethat, in spite of the significant interest in this topic, wehave not been able to find a review article that describesthe current state-of-the-art in this rapidly moving field.Some review articles have presented a brief summary ofthe use of LIF detection after CE separation. As anexample, Kasicka has presented the details of some ofthe recent developments (from 1999 to 2003) in the anal-ysis of peptides using CE [2–4], and other authors have
Correspondence: Prof. François Couderc, Université PaulSabatier, IMRCP-UMR5623-ERT 1046, 118 Route de Narbonne,F-31062 Toulouse, FranceE-mail: [email protected]: 133-(0)5-6155-8155
Abbreviations: cIEF, capillary isoelectric focusing; FQ, 5-furoyl-quinoline-3-carboxaldehyde; NDA, naphthalene-2,3-dicarboxal-dehyde; OPA, ortho-phthaldehyde
2608 Electrophoresis 2005, 26, 2608–2621
2005 WILEY-VCH Verlag GmbH & Co. KGaA, Weinheim

Electrophoresis 2005, 26, 2608–2621 CE-LIF of peptides and proteins 2609
presented short discussions [5, 6]. In this article, we willreview the different strategies which have been proposedfor the quantitation of proteins and peptides using CE orHPLC and LIF. Since many peptides or proteins do notexhibit native fluorescence, several different approacheswere used and are described below:(i) The main approach is the derivatization of peptides
using a fluorescent dye, which reacts with the aminefunction or the thiol function. Closely related to thisapproach is the monitoring of the native fluorescenceof tyrosine and tryptophan.
(ii) The noncovalent interactions between a fluorescentlylabelled antibody and a peptide (or a protein) or be-tween a protein and a dye can be used to obtain flu-orescent adducts.
(iii) Capillary IEF (cIEF) can be employed to monitorlabelled proteins.
2 Dyes covalently bound to peptides orproteins
Many reports describe the separation and detection ofcovalently and fluorescently labelled proteins or peptides.In most instances, a fluorogenic dye which is weakly flu-orescent but fluoresces strongly after a reaction with aprimary amine function of the N-terminus of a peptide or alysine is used. Naphthalene-2,3-dicarboxaldehyde (NDA)is perhaps the most commonly used fluorogenic dye.
2.1 NDA
A typical example of the use of NDA for quantitation is theanalysis of opiate peptides using HPLC or mHPLC, whichwas reported over 10 years ago [7, 8]. The derivatizationreaction of this dye is presented in Fig. 1. This reactionrequires cyanide ions or thiol in the reaction media.
Figure 1. Reaction 1.
The stability of NDA derivatives is much greater than ortho-phthaldehyde (OPA) derivatives [9, 10], and these deriva-tives can be excited with a diode laser emitting at 405 nm[11] or an HeCd laser working at 442 nm [12]. MS was usedto determine the different degradation products of NDA/b-mercaptoethanol-labelled amino acids [13]. The predomi-nant degradation product observed under most reactionconditionswasanonfluorescent lactamformof theoriginallyfluorescent isoindole derivative. It was further observed that
NDA can react with methanol to form a more stable fluores-cent methoxyisoindole, shedding new light on the basis forenhanced stability of these derivatives in methanol.
2.1.1 Substance P (SP)
NDA was used for the quantitation of SP a neuropeptidewith the sequence Arg-Pro-Lys-Pro-Gln-Gln-Phe-Phe-Gly-Leu-Met-NH2 which is an important compound inneurochemistry. SP is a neurokinin which is involved in theregulation of emotions. Recent developments with SPantagonists have demonstrated its importance in severalmodels of disease that span from asthma to chronic
Figure 2. Separation of SP identified from saliva by CE-LIF after precolumn NDA labelling. (A) Saliva sample(without spiking), (B) SP-spiked saliva sample and (C)blank preparation. Peak attributed to SP is indicated withan arrow and eluted at 8.6 min. Concentration of SP in thesample was calculated to be approximately 3 nM. Experi-mental conditions: fused-silica capillary, 60 cm (50 cminjection to detection), 100 mm ID; separation voltage,13 kV; electrokinetic injection, 10 s at 5 kV; run buffer,0.45 mg/mL hydroxypropylmethylcellulose in 10% ACN/90% 18.8 mM borate (pH 9.3); detection, LIF with 442 nmexcitation. Derivatization in a vial containing 3 mL 20 mM
potassium cyanide in 12.5 mM borate buffer (pH 9), 10 mL1 mM NDA in methanol and 40 mL sample solution wereadded. The sample consists in 2 mL saliva loaded into aBond-Elut C18 solid-phase extraction cartridge andeluted with 2 mL each of 0.1% TFA and 50/50 ACN/water.SP was eluted in 2 mL ACN [18].
2005 WILEY-VCH Verlag GmbH & Co. KGaA, Weinheim
CE
and
CE
C
2610 M. Lacroix et al. Electrophoresis 2005, 26, 2608–2621
bronchitis and cystitis, and from inflammatory bowel dis-ease to migraine, emesis, depression, pain and seizures[14]. CE-LIF was thought to be a good alternative todetect very low level of concentrations (mM-pM) of thispeptide and its metabolic hydrolytic peptides. Freed et al.[15] investigated the metabolism of SP in rat striatum (it isperfused at 100 mM) by microdialysis sampling associatedto CE-LIF. The rat striatum was perfused for 5 h at 0.2 mL/min, and its metabolism was followed for over 13 h.
The resulting samples were derivatized before separation,then separated and detected by cyclodextrin-modifiedEKC. Cyclodextrin provides an increase of the sensitivity ofthe fluorescence detection (CE buffer: 80mM sodiumcholate, 8 mM sulfobutyl ether (IV) b-cyclodextrin,N-tris-(hydroxymethyl)methyl-2-aminoethanesulfonic acid100 mM, pH 7.5). The authors note that SP rapidly degradedto form the fragments (3–11), (1–9), (1–4) and, to a lesserextent (1–7). The metabolites reached steady-state levels2–3 h after addition of SP. We can note that the detectedconcentrations of SP and its metabolites are in the range ofmM-nM. Then SP metabolism was investigated upon expo-sure to a cell culture model of the blood-brain barrier(monolayer of bovine brain microvessel endothelial cells)and its metabolism was followed as a function of time over a5 h period. The resulting samples were treated and sepa-rated as above. It was observed that SP rapidly degraded toproduce the N-terminal (1–9), (1–4) and (1–7) and C-terminal(2–11) and (3–11) fragments [16]. Then, itwas demonstratedthat SP crosses the endothelial cells in both the apical-to-basolateral and basolateral-to-apical directions through anactive transport mechanism. SP is transported from theapical side via transcytosis. Moreover, the N-terminal (1–4)and C-terminal (3–11) peptides fragments were found topermeate the endothelial cells from the apical side [17].Frerichs et al. [18] worked on much lower concentration ofSP, an LOD of 100 pM is reported. These authors used arunning buffer consisting in 0.45 mg/mL hydroxy-propylmethylcellulose in 10% ACN, 90% 18.8 mM boratebuffer (pH 9.3). The separation was run at 13kV and injec-tion was done electrokinetically at 5 kV for 10 s. Figure 2presents the separation of SP in saliva.
2.1.2 Other peptide studies
Enterostatin (Val-Pro-Asp-Pro-Arg) is a pentapeptide thatis involved in appetite regulation and insulin secretion. Itand two other pentapeptides belonging to the enterostatinfamily (i.e., Ala-Pro-Gly-Pro-Arg and Val-Pro-Gly-Pro-Arg)were separated by MEKC (50 mm sodium borate (pH 9.0),25 mM SDS) using 10% methanol as an organic modifier[19]. LODs of 4.8 mM for enterostatin were obtained usingCE-LIF with an RSD of 4.0% (n = 5) in a human cere-
brospinal fluid (CSF). Twenty-three human CSF sampleswere analyzed. The level of enterostatin ranged from 24 to51 mM with a mean (6SEM) value of 41.7 6 2.0 mM.
Lillard et al. [20] employed an on-line in capillary derivati-zation with NDA to study the amines from individual atrialgland vesicles of Aplysia californica. They note that thebioactive peptides (peptide A and B, califin A and B), well-known to be in atrial gland vesicles, were detected in lysedvesicle samples fractionated with HPLC. These peptideswere also observed in single-vesicle runs with CE-LIF.
RP electrochromatography using porous polymer mono-liths was used to study NDA-labelled peptides [21]. Theaimof the study was to investigate efficient and rapid separa-tions to the emerging field of proteomics as well as in theclinical and pharmaceutical area. Using negatively andpositively charged novel UV-initiated acrylate-based po-rous polymer monoliths in capillaries, the authors showefficiencies in the range of 65 000–371 000 plates/m for Leuand Ile labelled with NDA. Negatively charged laurylmonoliths were also cast in a 25 mm deep, 50 mm wide,8 cm long microchannel of glass chips. The electro-chromatographic separation was run in a solution of 35%ACN, 65% phosphate pH 7, with an electric field of 1200 V/cm. The separation of GGYR, RYLGYL, and RVYIHPI wasfollowed by LIF detection (diode laser 413nm).
2.1.3 Postcolumn derivatization
Postcolumn derivatization using NDA as a derivatizingagent is a well-established technique with CE-LIF. As anexample, Gilman and Ewing [22, 23] derivatized the sampleat the output of a CE capillary, and demonstrated that thesensitivity obtained for a protein is better than that obtainedwith amino acids, most likely because of the multiple label-ling of the lysine functions. In another study a high decreasein sensitivity was observed for (Ala)2 and (Ala)4 peptidescompared with Ala. These authors [24] indicate that theirresults agree with the relative photochemical properties ofthe labelled peptides. It was previously shown that averagephoton yield of OPA-Ala derivative was about 13 photonsper molecule whereas that of OPA-(Ala)n is 0.2 photons permolecule [25]. This is in accordance with the observedresults obtained with NDA-labelled species.
A sheath flow reactor for postcolumn fluorescence deri-vatization of proteins was recently described by Dovichi etal. [26]. As in previous investigations, the authors use NDAand b-mercaptoethanol (which were added in the sheathbuffer). The labelled proteins were detected by LIF with anargon-ion laser beam at 488 nm. A column efficiency of450 000 plates/m was obtained without stacking. GoodLODs for a number of standard proteins were determined
2005 WILEY-VCH Verlag GmbH & Co. KGaA, Weinheim
Electrophoresis 2005, 26, 2608–2621 CE-LIF of peptides and proteins 2611
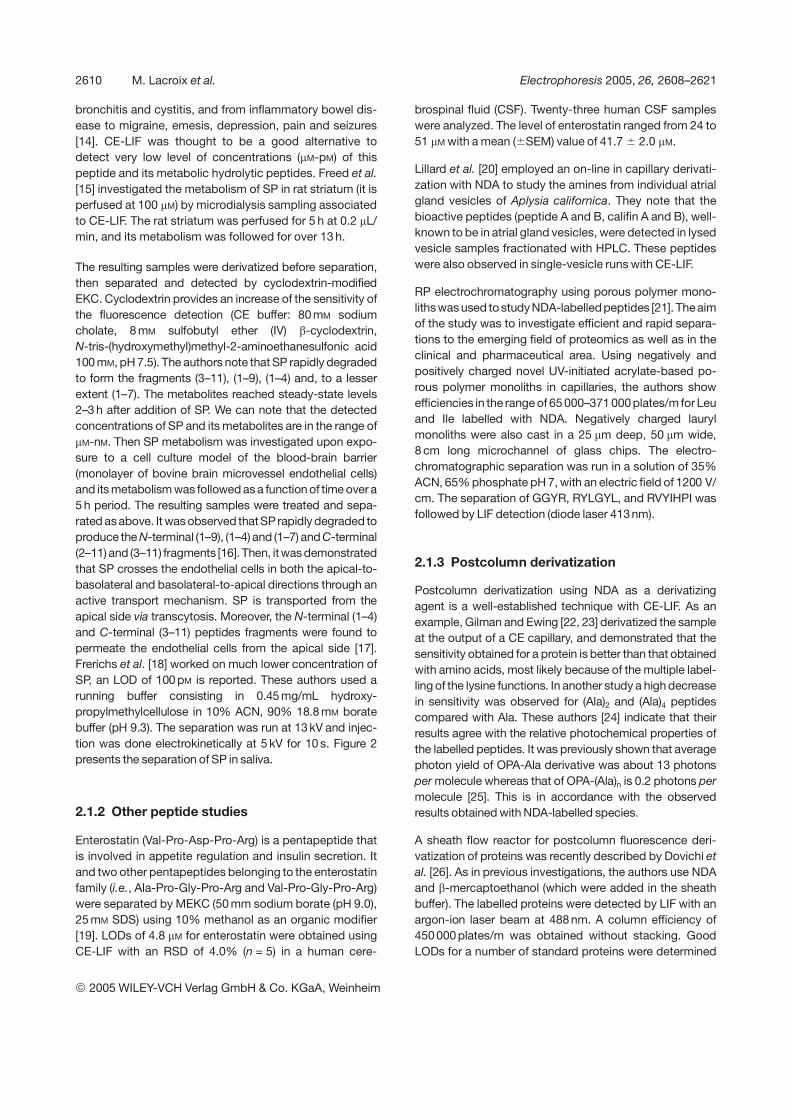
to be from 8 to 32 nM and it was shown that the sensitivityis poorer in acidic CE buffers than at high pH. A proteinextract from HT29 human colon cancer cells and trypticpeptides were analysed. Separation of standard proteinsusing this postcolumn derivatization is shown in Fig. 3.
Figure 3. (A) Schematic of the sheath flow postcolumnreactor from Dovichi’s laboratory. (B) CE separation of (1)myoglobin (2.5 mM), (2) a-lactalbumin (5.0 mM), (3) b-lacto-globulin B (5.0 mM), (4) b-lactoglobulin A (5.0 mM), (5) BSA(2.0 mM) with postcolumn fluorescence derivatization withNDA. CE experimental conditions: running buffer, 50 mM
borate buffer (pH 9.5); separation, 300 V/cm; electro-kinetic injection, 100 V/cm for 5 s; (a) 0.5 cm, (b) 3 cm, (c)6 cm between derivatization solution reservoir and wastereservoir. The derivatization mixture consists of 1 mM NDA,8 mM b-mercaptoethanol, 30% methanol and 70% boratebuffer (100 mm). The reaction distance was fixed at 3 mm,and the reaction time was manipulated by adjusting thelinear flow rate of the sheath fluid, which is determined bythe height difference between the derivatization solutionreservoir and the waste reservoir. An Ar ion laser 12 mW,488 nm was used for this experiment [26].
A more sophisticated arrangement using a microchip devicewhich integrates tryptic hydrolysis, electrophoretic separa-tion of the reactants from the products and postseparationlabelling of proteins and peptides prior to LIF detection wasrecently described by Ramsey and co-workers [27]. Thetryptic digestion of oxidised insulin B-chain was performedin15 minunder stopped flow conditions ina heated channel,the separation was completed in 1 min.
The lab-on-a-chip device was also used recently to digestpicomoles of proteins with a 30 nL enzyme microreactor[28]. In this case, a monolithic capillary column, which wasprepared by in situ polymerization of glycidyl methacrylateand ethylene dimethacrylate in a capillary (column effi-ciencies . 300 000 plates/m), was used to separate thetryptic peptides. Highly efficient digestion of standardsa-lactalbumin was done. The overall analysis, includingdigestion and separation, required only about 16 min.
2.2 5-Furoylquinoline-3-carboxaldehyde (FQ)
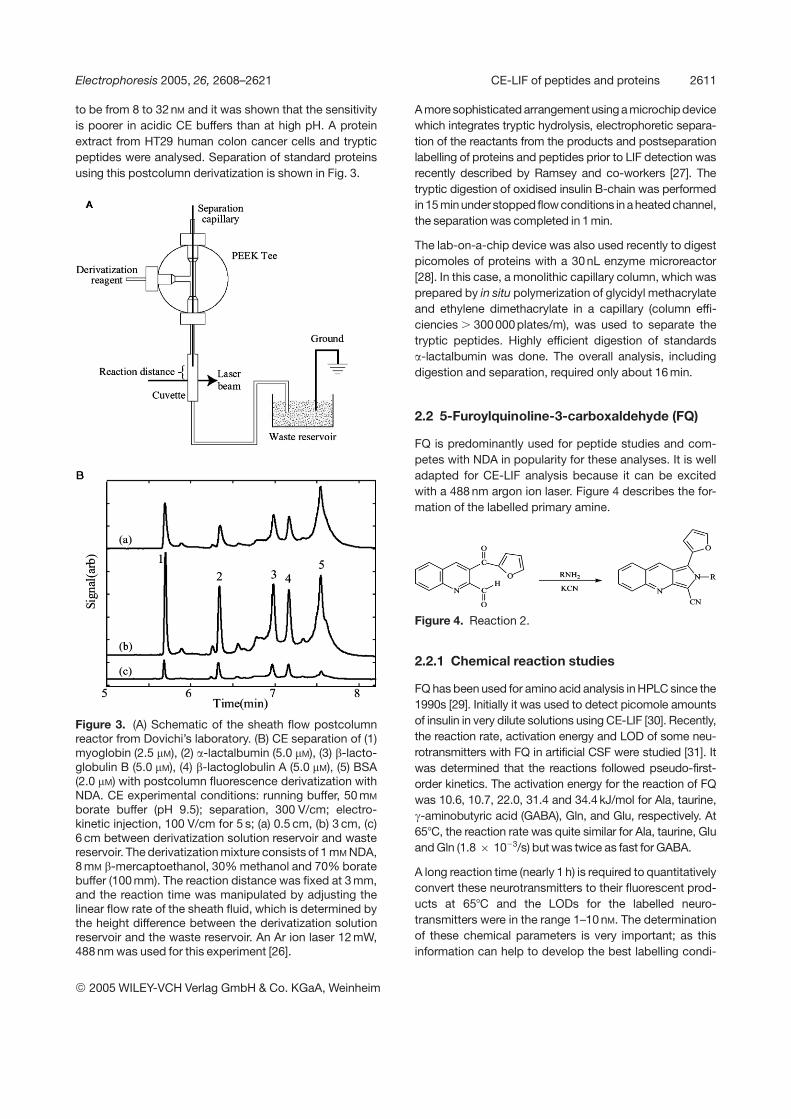
FQ is predominantly used for peptide studies and com-petes with NDA in popularity for these analyses. It is welladapted for CE-LIF analysis because it can be excitedwith a 488 nm argon ion laser. Figure 4 describes the for-mation of the labelled primary amine.
Figure 4. Reaction 2.
2.2.1 Chemical reaction studies
FQ has been used for amino acid analysis in HPLC since the1990s [29]. Initially it was used to detect picomole amountsof insulin in very dilute solutions using CE-LIF [30]. Recently,the reaction rate, activation energy and LOD of some neu-rotransmitters with FQ in artificial CSF were studied [31]. Itwas determined that the reactions followed pseudo-first-order kinetics. The activation energy for the reaction of FQwas 10.6, 10.7, 22.0, 31.4 and 34.4 kJ/mol for Ala, taurine,g-aminobutyric acid (GABA), Gln, and Glu, respectively. At657C, the reaction rate was quite similar for Ala, taurine, Gluand Gln (1.8 6 1023/s) but was twice as fast for GABA.
A long reaction time (nearly 1 h) is required to quantitativelyconvert these neurotransmitters to their fluorescent prod-ucts at 657C and the LODs for the labelled neuro-transmitters were in the range 1–10 nM. The determinationof these chemical parameters is very important; as thisinformation can help to develop the best labelling condi-
2005 WILEY-VCH Verlag GmbH & Co. KGaA, Weinheim
2612 M. Lacroix et al. Electrophoresis 2005, 26, 2608–2621
tions (although few kinetic and thermodynamic studiesexist for these derivatization reactions, they are very usefulas they provide valuable information about course of thereaction). For the derivatization of ovalbumin [32] with FQ,the reaction rate and number of labelled groups increasedat elevated temperatures. At 657C, 6 6 2.5 labels wereattached after 5 min. This point underlines the problem ofprecolumn labelling, as more than one peak for a com-pound is frequently observed. The labelling reaction wasdemonstrated to occur in two steps. In the first step, theprotein unfolds to make lysine residues accessible. In thesecond step, the reagents react with the e-amine of thelysine residues. The authors used CE-LIF to characterizethe reaction mixture. The apparent activation energy wasmeasured for the labelling reaction, which was 57 6 12 kJ/mol for the reaction performed in the separation buffer. Theaddition of 2 M thiourea with 6 M urea to the reaction result-ed in a modest decrease in the apparent activation energyto 42 6 2 kJ/mol. The addition of 2.5 M or higher con-centration of ethanol decreased the apparent activationenergy to 32 6 2 kJ/mol. In consequence, the activationenergy for protein labelling is dominated by denaturation ofthe protein, which can be eliminated using denaturingreagents during the labelling reaction.
2.2.2 Precolumn and on-column proteinlabelling
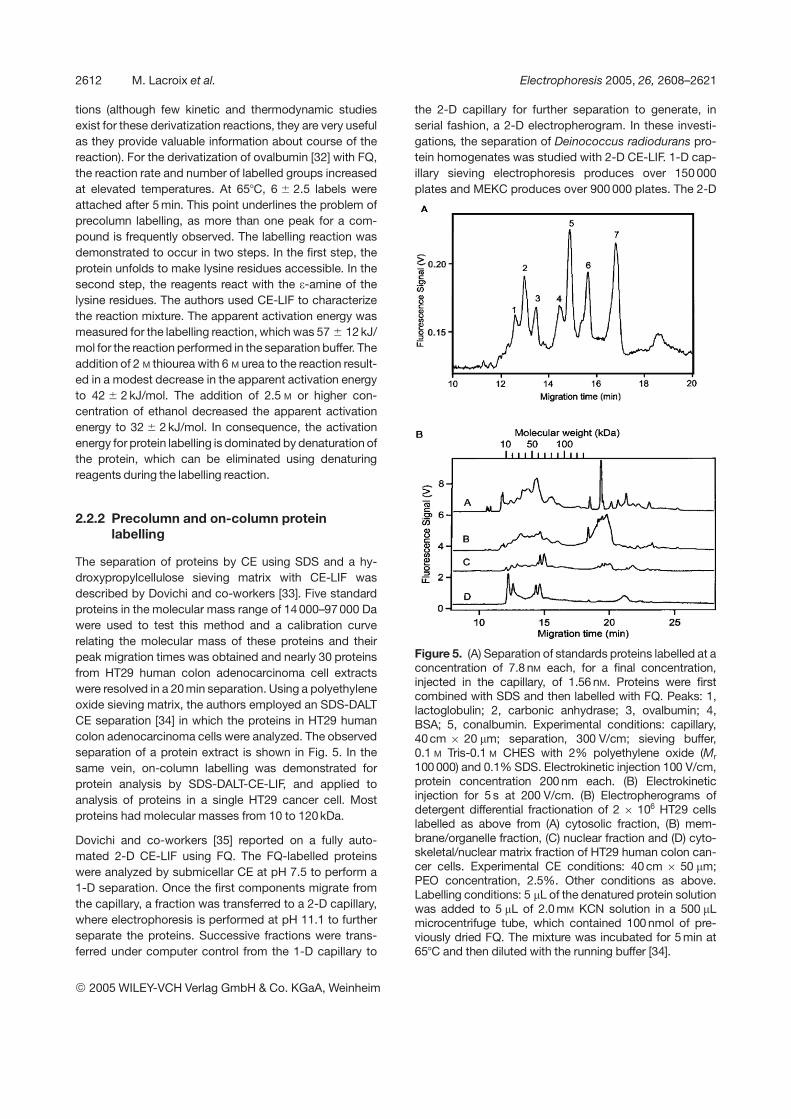
The separation of proteins by CE using SDS and a hy-droxypropylcellulose sieving matrix with CE-LIF wasdescribed by Dovichi and co-workers [33]. Five standardproteins in the molecular mass range of 14 000–97 000 Dawere used to test this method and a calibration curverelating the molecular mass of these proteins and theirpeak migration times was obtained and nearly 30 proteinsfrom HT29 human colon adenocarcinoma cell extractswere resolved in a 20 min separation. Using a polyethyleneoxide sieving matrix, the authors employed an SDS-DALTCE separation [34] in which the proteins in HT29 humancolon adenocarcinoma cells were analyzed. The observedseparation of a protein extract is shown in Fig. 5. In thesame vein, on-column labelling was demonstrated forprotein analysis by SDS-DALT-CE-LIF, and applied toanalysis of proteins in a single HT29 cancer cell. Mostproteins had molecular masses from 10 to 120 kDa.
Dovichi and co-workers [35] reported on a fully auto-mated 2-D CE-LIF using FQ. The FQ-labelled proteinswere analyzed by submicellar CE at pH 7.5 to perform a1-D separation. Once the first components migrate fromthe capillary, a fraction was transferred to a 2-D capillary,where electrophoresis is performed at pH 11.1 to furtherseparate the proteins. Successive fractions were trans-ferred under computer control from the 1-D capillary to
the 2-D capillary for further separation to generate, inserial fashion, a 2-D electropherogram. In these investi-gations, the separation of Deinococcus radiodurans pro-tein homogenates was studied with 2-D CE-LIF. 1-D cap-illary sieving electrophoresis produces over 150 000plates and MEKC produces over 900 000 plates. The 2-D
Figure 5. (A) Separation of standards proteins labelled at aconcentration of 7.8 nM each, for a final concentration,injected in the capillary, of 1.56 nM. Proteins were firstcombined with SDS and then labelled with FQ. Peaks: 1,lactoglobulin; 2, carbonic anhydrase; 3, ovalbumin; 4,BSA; 5, conalbumin. Experimental conditions: capillary,40cm 6 20 mm; separation, 300 V/cm; sieving buffer,0.1 M Tris-0.1 M CHES with 2% polyethylene oxide (Mr
100 000) and 0.1% SDS. Electrokinetic injection 100 V/cm,protein concentration 200 nm each. (B) Electrokineticinjection for 5 s at 200 V/cm. (B) Electropherograms ofdetergent differential fractionation of 2 6 106 HT29 cellslabelled as above from (A) cytosolic fraction, (B) mem-brane/organelle fraction, (C) nuclear fraction and (D) cyto-skeletal/nuclear matrix fraction of HT29 human colon can-cer cells. Experimental CE conditions: 40 cm 6 50 mm;PEO concentration, 2.5%. Other conditions as above.Labelling conditions: 5 mL of the denatured protein solutionwas added to 5 mL of 2.0 mM KCN solution in a 500 mLmicrocentrifuge tube, which contained 100 nmol of pre-viously dried FQ. The mixture was incubated for 5 min at657C and then diluted with the running buffer [34].
2005 WILEY-VCH Verlag GmbH & Co. KGaA, Weinheim
Electrophoresis 2005, 26, 2608–2621 CE-LIF of peptides and proteins 2613
separation has a spot capacity of approximately 550.Over 150 components are partially resolved from thehomogenate. In the 1-D separation, the resolution waslimited by the diffusion of proteins during the longseparation period and in the 2-D separation by the com-bination of a long fraction-transfer time and shortseparation period [36].
In a similar study, on-column FQ labelling was used for thebacterial proteome study of six Staphylococcus species[37]. A water-soluble protein fraction was injected onto acapillary, then FQ was injected and allowed to react withthe protein mixture, producing fluorescent products thatwere separated by submicellar CE and detected by LIF. Alow-ionic strength sample buffer was employed with abrief electrophoretic step to stack slow moving anionicproteins at the reagent-sample interface which were thenpreferentially labelled. By reversing the order of sampleinjection and labelling reagent, fast moving cationic pro-teins were preferentially labelled. When the pH of thesample buffer was adjusted, proteins with different pI wereselectively labelled. Under such analytical conditions,electrophoresis fingerprints were generated for the water-soluble protein fraction resulting in protein patterns whichwere used to construct a phylogenetic tree.
The effects of fluorescent labelling on the pI values of pro-teins using cIEF with LIF detection were investigated usinggreen fluorescent protein (GFP) which was labelled by FQ,which is a neutral dye. The pI changes in GFP’s FQ-label-led products were determined. Different products with pIvalues shifted towards a low pH were determined androutine detection of 10 pM of FQ-labelled protein was rea-lised whereas traditional slab-gel IEF with silver staindetection gives LODs of 0.1 mM in the same samples [38].
2.2.3 Single cell analysis
As a model, single HT29 human colon adenocarcinomacell was introduced into a fused-silica capillary and lysed,and the protein content was fluorescently labelled withthe FQ. The labelled proteins were separated by CE in asubmicellar buffer and several dozen proteins wereresolved. Protein expression varied significantly betweencells, but the average expression was consistent with thatobserved from a protein extract prepared from 106 cells
[39]. A similar study was realised with Caenorhabditiselegans embryo, 20 components were resolved in the22 min separation [40].
2.3 (4-Carboxybenzoyl)quinoline-2-carboxaldehyde (CBQCA)
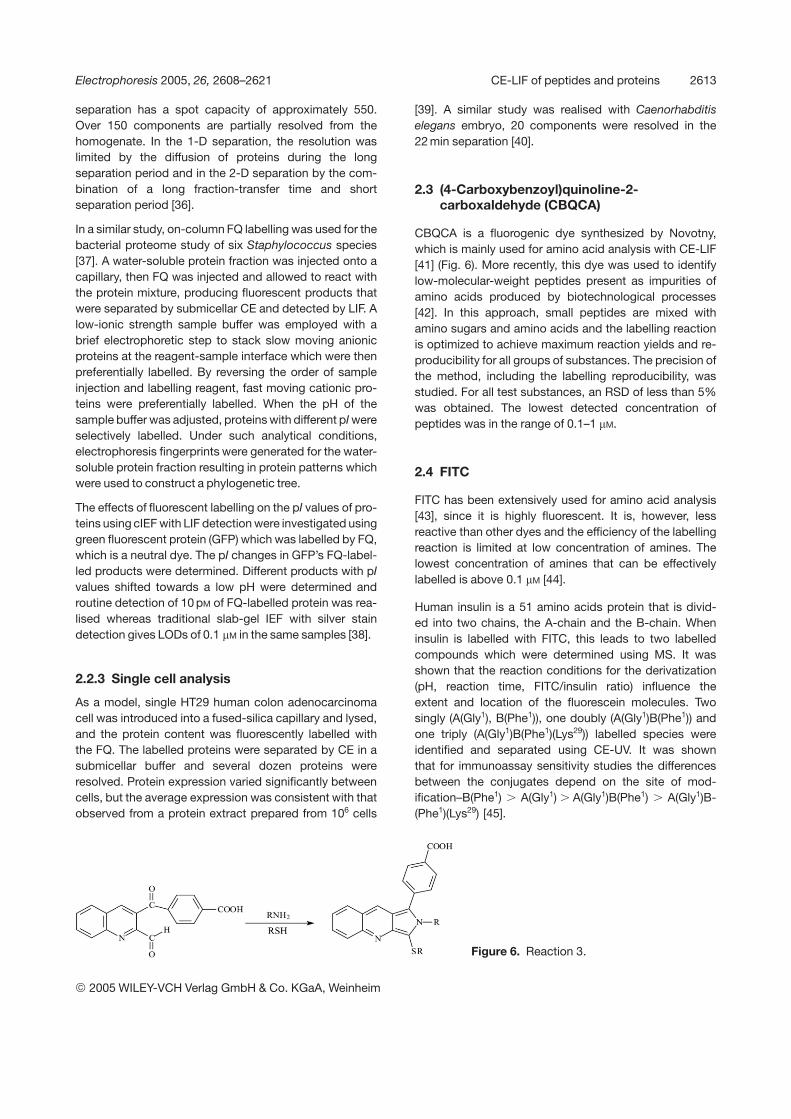
CBQCA is a fluorogenic dye synthesized by Novotny,which is mainly used for amino acid analysis with CE-LIF[41] (Fig. 6). More recently, this dye was used to identifylow-molecular-weight peptides present as impurities ofamino acids produced by biotechnological processes[42]. In this approach, small peptides are mixed withamino sugars and amino acids and the labelling reactionis optimized to achieve maximum reaction yields and re-producibility for all groups of substances. The precision ofthe method, including the labelling reproducibility, wasstudied. For all test substances, an RSD of less than 5%was obtained. The lowest detected concentration ofpeptides was in the range of 0.1–1 mM.
2.4 FITC
FITC has been extensively used for amino acid analysis[43], since it is highly fluorescent. It is, however, lessreactive than other dyes and the efficiency of the labellingreaction is limited at low concentration of amines. Thelowest concentration of amines that can be effectivelylabelled is above 0.1 mM [44].
Human insulin is a 51 amino acids protein that is divid-ed into two chains, the A-chain and the B-chain. Wheninsulin is labelled with FITC, this leads to two labelledcompounds which were determined using MS. It wasshown that the reaction conditions for the derivatization(pH, reaction time, FITC/insulin ratio) influence theextent and location of the fluorescein molecules. Twosingly (A(Gly1), B(Phe1)), one doubly (A(Gly1)B(Phe1)) andone triply (A(Gly1)B(Phe1)(Lys29)) labelled species wereidentified and separated using CE-UV. It was shownthat for immunoassay sensitivity studies the differencesbetween the conjugates depend on the site of mod-ification–B(Phe1) . A(Gly1) . A(Gly1)B(Phe1) . A(Gly1)B-(Phe1)(Lys29) [45].
Figure 6. Reaction 3.
2005 WILEY-VCH Verlag GmbH & Co. KGaA, Weinheim
2614 M. Lacroix et al. Electrophoresis 2005, 26, 2608–2621
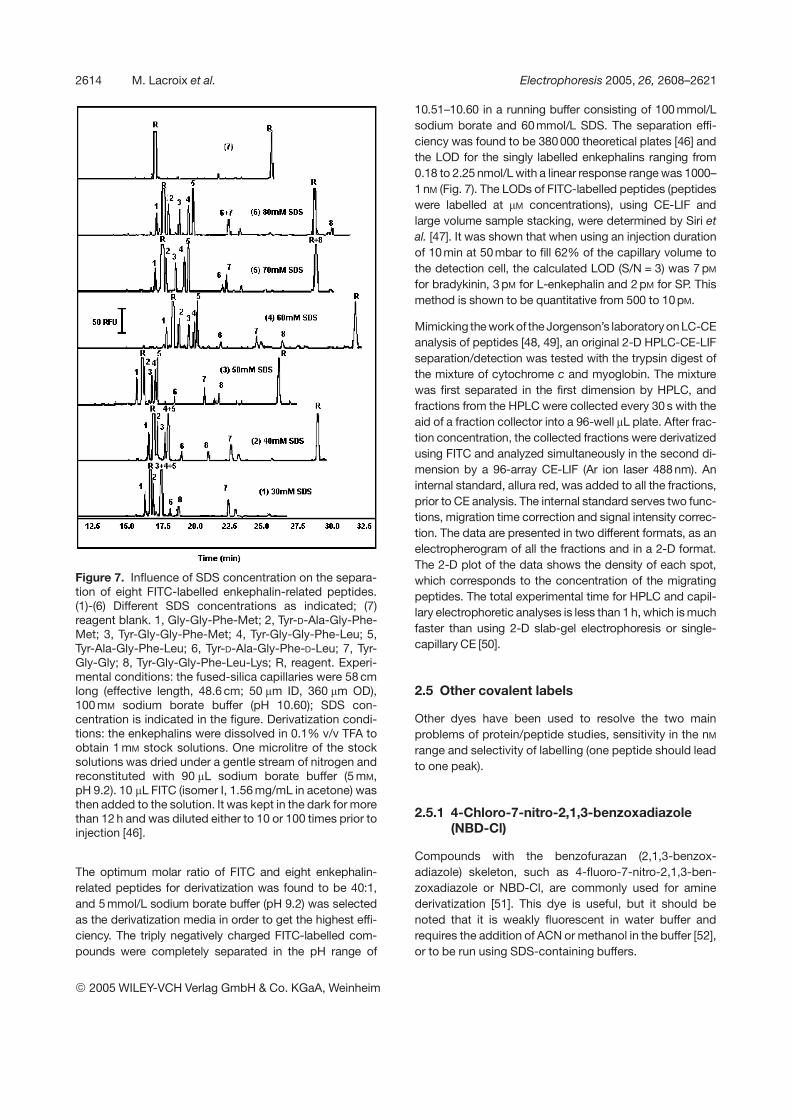
Figure 7. Influence of SDS concentration on the separa-tion of eight FITC-labelled enkephalin-related peptides.(1)-(6) Different SDS concentrations as indicated; (7)reagent blank. 1, Gly-Gly-Phe-Met; 2, Tyr-D-Ala-Gly-Phe-Met; 3, Tyr-Gly-Gly-Phe-Met; 4, Tyr-Gly-Gly-Phe-Leu; 5,Tyr-Ala-Gly-Phe-Leu; 6, Tyr-D-Ala-Gly-Phe-D-Leu; 7, Tyr-Gly-Gly; 8, Tyr-Gly-Gly-Phe-Leu-Lys; R, reagent. Experi-mental conditions: the fused-silica capillaries were 58 cmlong (effective length, 48.6 cm; 50 mm ID, 360 mm OD),100 mM sodium borate buffer (pH 10.60); SDS con-centration is indicated in the figure. Derivatization condi-tions: the enkephalins were dissolved in 0.1% v/v TFA toobtain 1 mM stock solutions. One microlitre of the stocksolutions was dried under a gentle stream of nitrogen andreconstituted with 90 mL sodium borate buffer (5 mM,pH 9.2). 10 mL FITC (isomer I, 1.56 mg/mL in acetone) wasthen added to the solution. It was kept in the dark for morethan 12 h and was diluted either to 10 or 100 times prior toinjection [46].
The optimum molar ratio of FITC and eight enkephalin-related peptides for derivatization was found to be 40:1,and 5 mmol/L sodium borate buffer (pH 9.2) was selectedas the derivatization media in order to get the highest effi-ciency. The triply negatively charged FITC-labelled com-pounds were completely separated in the pH range of
10.51–10.60 in a running buffer consisting of 100 mmol/Lsodium borate and 60mmol/L SDS. The separation effi-ciency was found to be 380000 theoretical plates [46] andthe LOD for the singly labelled enkephalins ranging from0.18 to 2.25 nmol/L with a linear response range was 1000–1 nM (Fig. 7). The LODs of FITC-labelled peptides (peptideswere labelled at mM concentrations), using CE-LIF andlarge volume sample stacking, were determined by Siri etal. [47]. It was shown that when using an injection durationof 10min at 50mbar to fill 62% of the capillary volume tothe detection cell, the calculated LOD (S/N = 3) was 7 pM
for bradykinin, 3 pM for L-enkephalin and 2 pM for SP. Thismethod is shown to be quantitative from 500 to 10pM.
Mimicking the work of the Jorgenson’s laboratory on LC-CEanalysis of peptides [48, 49], an original 2-D HPLC-CE-LIFseparation/detection was tested with the trypsin digest ofthe mixture of cytochrome c and myoglobin. The mixturewas first separated in the first dimension by HPLC, andfractions from the HPLC were collected every 30 s with theaid of a fraction collector into a 96-well mL plate. After frac-tion concentration, the collected fractions were derivatizedusing FITC and analyzed simultaneously in the second di-mension by a 96-array CE-LIF (Ar ion laser 488nm). Aninternal standard, allura red, was added to all the fractions,prior to CE analysis. The internal standard serves two func-tions, migration time correction and signal intensity correc-tion. The data are presented in two different formats, as anelectropherogram of all the fractions and in a 2-D format.The 2-D plot of the data shows the density of each spot,which corresponds to the concentration of the migratingpeptides. The total experimental time for HPLC and capil-lary electrophoretic analyses is less than 1 h, which is muchfaster than using 2-D slab-gel electrophoresis or single-capillary CE [50].
2.5 Other covalent labels
Other dyes have been used to resolve the two mainproblems of protein/peptide studies, sensitivity in the nM
range and selectivity of labelling (one peptide should leadto one peak).
2.5.1 4-Chloro-7-nitro-2,1,3-benzoxadiazole(NBD-Cl)
Compounds with the benzofurazan (2,1,3-benzox-adiazole) skeleton, such as 4-fluoro-7-nitro-2,1,3-ben-zoxadiazole or NBD-Cl, are commonly used for aminederivatization [51]. This dye is useful, but it should benoted that it is weakly fluorescent in water buffer andrequires the addition of ACN or methanol in the buffer [52],or to be run using SDS-containing buffers.
2005 WILEY-VCH Verlag GmbH & Co. KGaA, Weinheim
Electrophoresis 2005, 26, 2608–2621 CE-LIF of peptides and proteins 2615
Synthetic derivatives of peptidic hypophysis neuro-hormones (vasopressin and oxytocin) and human insulinand its octapeptide fragment were analyzed after NBD-Clderivatization. A suitable composition of backgroundelectrolytes was selected on the basis of the calculatedpH dependence of the effective charge of the analyzedpeptides. The NBD-ionizable peptides were separated in0.5 M acetic acid, pH 2.5. The best separation of non-ionogenic peptides was achieved in alkaline 20 mM Tris,5 mM H3PO4, 50 mM SDS, pH 8.8, and the detection levelof peptides was around 15.8 nM [53].
2.5.2 5-Bromomethylfluorescein (5-BMF) and 5or 6-iodoacetamidofluorescein (IAF)
5-BMF, which is excited by a 488 nm argon ion laser andfluoresces at 515 nm, was used to label cysteinyl-glycine,g-glutamyl-cysteine, glutathione and (g-glutamylcystei-nyl)-2-glycine. Concentrations as low as 25 nM weredetected for glutathione; it was noted that the sensitivityfor detection of (g-glutamylcysteinyl)-2-glycine wassomewhat lower. The method is simple and should facil-itate the study of small volumes of extracts obtained frombiological tissue [54]. 5-IAF was also used for glutathionestudy [55, 56], an identical work using 6-IAF was realizedby Bayle et al. [57].
2.5.3 Iodoacetyl Lissamine rhodamine B
The utility of cIEF was demonstrated via an enzyme assayusing trypsin. The authors labelled the synthetic non-apeptide, H-Gly-Cys-His-Glu-Ala-Arg-Ala-Glu-Glu-OH,with an iodoacetyl derivative of Lissamine rhodamine B(Lrb) at the thiol group of the cysteine residue. Trypsin wasthen used to catalyze the cleavage of the Arg-Ala bond ofthe labelled substrate, which focused at pH 4.8, and lib-erated a shortened labelled product, H-Gly-Cys (Lrb)-His-Glu-Ala-Arg-OH that focused at pH 6.9. The productpeptide was determined using cIEF-LIF (using the 590 nmline of a He-Cd laser) in the range 3–300 pM with an RSDof 5.5% (n = 5). The incubation of trypsin with the labelledsubstrate for 10 min at 377C allowed the determination of50–250 pg of trypsin, with an RSD of 5.3% (n = 5) [58].
2.5.4 Rhodamine-based dyes
Nineteen fluorescent pH standards or pI markers rangingfrom pH 3.64 to 10.12 were developed to be used in cIEFusing LIF detection. Tetra- to tridecapeptides containingone cysteine residue were designed to focus sharply attheir respective pI by including amino acids that containcharged side chains. The Cys residues were labelled by
an iodoacetylated derivative of tetramethylrhodamine.The pI markers were subjected to cIEF for 10–15 min incoated capillaries under conditions of low electroosmosisand were detected by means of a scanning LIF detectorat a subpicomolar level [59]. Fluorescent synthetic pep-tides (6-carboxyfluorescein succinimidyl ester, rhoda-mine green carboxylic acid succinimidyl ester, rhodaminegreen X, succinimidyl ester) were conjugated to bioana-lytes such as nucleic acids and antibodies, processed in ahybridization or binding assay, and then chemicallyreleased prior to detection by cIEF and LIF detection. Atwo-step cIEF method in coated capillaries using saltmobilization was used that produces high peak effi-ciencies and good assay reproducibility. The concentra-tion by focusing aspect of cIEF, which allows for the entirecapillary to be filled with sample, enables LODs in the pmrange. The simultaneous multiple detection of 11 differentfocusing entities was achieved [60].
2.5.5 6-Aminoquinolyl-N-hydroxysuccinimidylcarbamate (AQC)
Insulin was labelled using an in-capillary derivatizationprocedure in a borate buffer pH 8.9, which was achievedby successive introduction of plugs of sample and AQCreagent followed by application of a voltage (30 kV). Dueto the electric field, the differential transport velocitiespermit the distinct zones to penetrate each other. Theefficiency of the derivatization reaction depends onreagent/sample molar ratio and plug lengths. A singlepeak of insulin was obtained with a high reagent/samplemolar ratio of 68. The tagged derivative peak intensitywas determined using CE-LIF (HeCd 325 nm laser). Theefficiency was improved when reagent solution timeinjection was at least twice higher than that of insulinsample. The validation of the method showed a goodlinearity between the corrected area of the derivativepeak and insulin concentrations. Good RSDs of themigration times (2.3%) and the corrected areas (4.6%)were obtained for the tagged derivative. An efficientderivatisation and separation of a mixture of insulin andtwo glycated forms of insulin was obtained using thetechnique. The LOD of insulin derivatized in the capillarywas 0.5 mM [61]. We can add that AQC dye is weaklyexcited using 325 nm laser wavelength. Figure 8 illus-trates the results.
2.5.6 Near-infrared (NIR) dyes
NIR dyes are very promising for the analysis of biologicalsamples, because an NIR wavelength (e.g., 785 nm)allows for minimization of interferences from moleculeswhich exhibit native fluorescence in the sample.
2005 WILEY-VCH Verlag GmbH & Co. KGaA, Weinheim

2616 M. Lacroix et al. Electrophoresis 2005, 26, 2608–2621
Figure 8. (A) Schematic representation of the in-capillarymicroreaction between AQC and insulin before (A) andafter reaction (B). (B) In-capillary derivatization andseparation of a mixture of insulin and two of its glycatedforms: P1, P3. Separation conditions: 80 mM sodiumborate buffer pH 8.9-ACN (90:10, v/v); applied voltage,130 kV; temperature, 407C; injection: mixture of insulin,monoglycated and diglycated forms 34 mM each, 2 s, thenAQC 7.0 mM, 4 s (A); 34 mM insulin, 2 s, then AQC 1.1 mM,4 s (B); 34 mM P1, 2 s, then AQC 1.1 mM, 4 s (C); 34 mM P3,2 s, then AQC 1.1 mM, 4 s (D); blank: injection of 10 mM
borate buffer pH 8.9, 2 s, then AQC 7.0 mM, 4 s (E) [61].
As an example of the use of an NIR dye, a novel NIR flu-orescent dye (NN382, LICOR, Inc.) was evaluated with sixAngiotensin-I (Ang-I) variants. The derivatisation of thepeptides was achieved under aqueous conditions using
2.5–500 pmol Ang-I in 50 mL samples with concentrationsthat vary from 50 nM to 10 mM. The fluorescence responsewas linear over a 200-fold range and the authors claimedthat the LOD ranged from 100 to 300 zmol for the six Ang-Ivariants. Modest separation of the labelled peptides wasrealized using a simple buffer containing 50 mM phos-phate pH 7.2 [62].
3 Peptide or protein labelling usingimmunoassays or noncovalent dyelabelling
3.1 CE-based immunoassays/LIF
CE-based immunoassays using LIF detection has beenthe subject of several recent detailed reviews [63, 64].German and Kennedy described a competitive immu-noassay for the determination of glucagon in biologicalmixtures. In this assay, fluorescein-conjugated glucagonis mixed with the sample followed by addition of anti-glucagon antibody. Free and antibody-bound, taggedglucagon could be separated in 3 s. Quantitative deter-mination of glucagons was obtained and an LOD of760 pM was estimated. The assay was combined with apreviously developed competitive immunoassay for insu-lin to produce a simultaneous immunoassay for bothpeptides. This method was used to determine glucagoncontent of islets of Langerhans [65]. This work wasimproved using a capillary RP LC coupled on-line to thecompetitive CE immunoassay to improve concentrationsensitivity and to provide a means for detecting multiplespecies that cross-react with antibody. Five-microlitersamples were injected onto a 4 cm long by 50 mm IDRPLC column. The sample was desorbed by gradientelution, mixed on-line with the fluorescently labelled glu-cagon and antiglucagon antibody, incubated in a con-tinuous-flow reaction capillary and analyzed by CE-LIFwith flow-gated injection. Preconcentration achieved byRPLC allowed improvement in the LOD from 760 to 20 pM.Addition of the RPLC column also allowed multiple cross-reactive species to be differentiated by first separatingthem via chromatography and then detecting them withthe immunoassay [66].
Another competitive immunoassay was investigated forneuropeptide Y (NPY) utilizing polyclonal antisera as theimmunoreagent and fluorescein-labelled NPY as the tra-cer. The assay was performed with on-line mixing ofreagents, automated injections and a 3 s separation time,and had an LOD of 850 pM. To detect NPY at lower con-centrations, the assay was coupled as described abovefor RP capillary LC. In this case the concentration LODwas improved to 40 pM. NPY could be measured in push-
2005 WILEY-VCH Verlag GmbH & Co. KGaA, Weinheim
Electrophoresis 2005, 26, 2608–2621 CE-LIF of peptides and proteins 2617
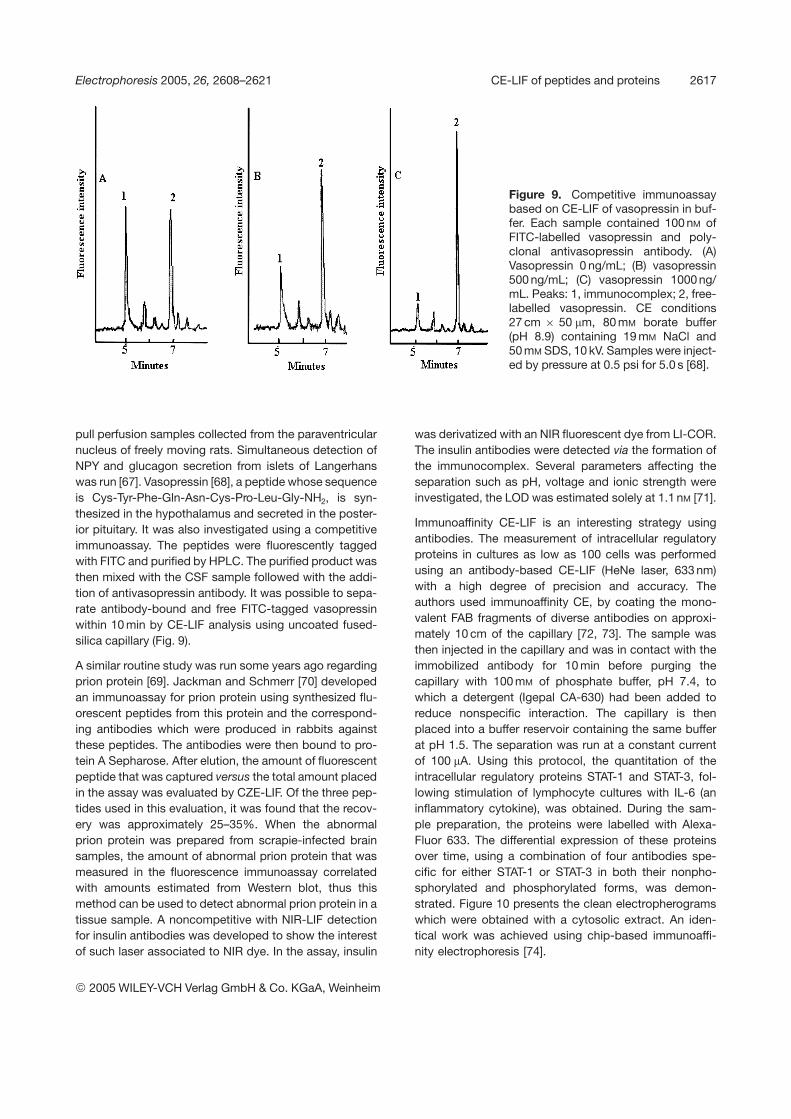
Figure 9. Competitive immunoassaybased on CE-LIF of vasopressin in buf-fer. Each sample contained 100 nM ofFITC-labelled vasopressin and poly-clonal antivasopressin antibody. (A)Vasopressin 0 ng/mL; (B) vasopressin500 ng/mL; (C) vasopressin 1000 ng/mL. Peaks: 1, immunocomplex; 2, free-labelled vasopressin. CE conditions27 cm 6 50 mm, 80 mM borate buffer(pH 8.9) containing 19 mM NaCl and50 mM SDS, 10 kV. Samples were inject-ed by pressure at 0.5 psi for 5.0 s [68].
pull perfusion samples collected from the paraventricularnucleus of freely moving rats. Simultaneous detection ofNPY and glucagon secretion from islets of Langerhanswas run [67]. Vasopressin [68], a peptide whose sequenceis Cys-Tyr-Phe-Gln-Asn-Cys-Pro-Leu-Gly-NH2, is syn-thesized in the hypothalamus and secreted in the poster-ior pituitary. It was also investigated using a competitiveimmunoassay. The peptides were fluorescently taggedwith FITC and purified by HPLC. The purified product wasthen mixed with the CSF sample followed with the addi-tion of antivasopressin antibody. It was possible to sepa-rate antibody-bound and free FITC-tagged vasopressinwithin 10 min by CE-LIF analysis using uncoated fused-silica capillary (Fig. 9).
A similar routine study was run some years ago regardingprion protein [69]. Jackman and Schmerr [70] developedan immunoassay for prion protein using synthesized flu-orescent peptides from this protein and the correspond-ing antibodies which were produced in rabbits againstthese peptides. The antibodies were then bound to pro-tein A Sepharose. After elution, the amount of fluorescentpeptide that was captured versus the total amount placedin the assay was evaluated by CZE-LIF. Of the three pep-tides used in this evaluation, it was found that the recov-ery was approximately 25–35%. When the abnormalprion protein was prepared from scrapie-infected brainsamples, the amount of abnormal prion protein that wasmeasured in the fluorescence immunoassay correlatedwith amounts estimated from Western blot, thus thismethod can be used to detect abnormal prion protein in atissue sample. A noncompetitive with NIR-LIF detectionfor insulin antibodies was developed to show the interestof such laser associated to NIR dye. In the assay, insulin
was derivatized with an NIR fluorescent dye from LI-COR.The insulin antibodies were detected via the formation ofthe immunocomplex. Several parameters affecting theseparation such as pH, voltage and ionic strength wereinvestigated, the LOD was estimated solely at 1.1 nM [71].
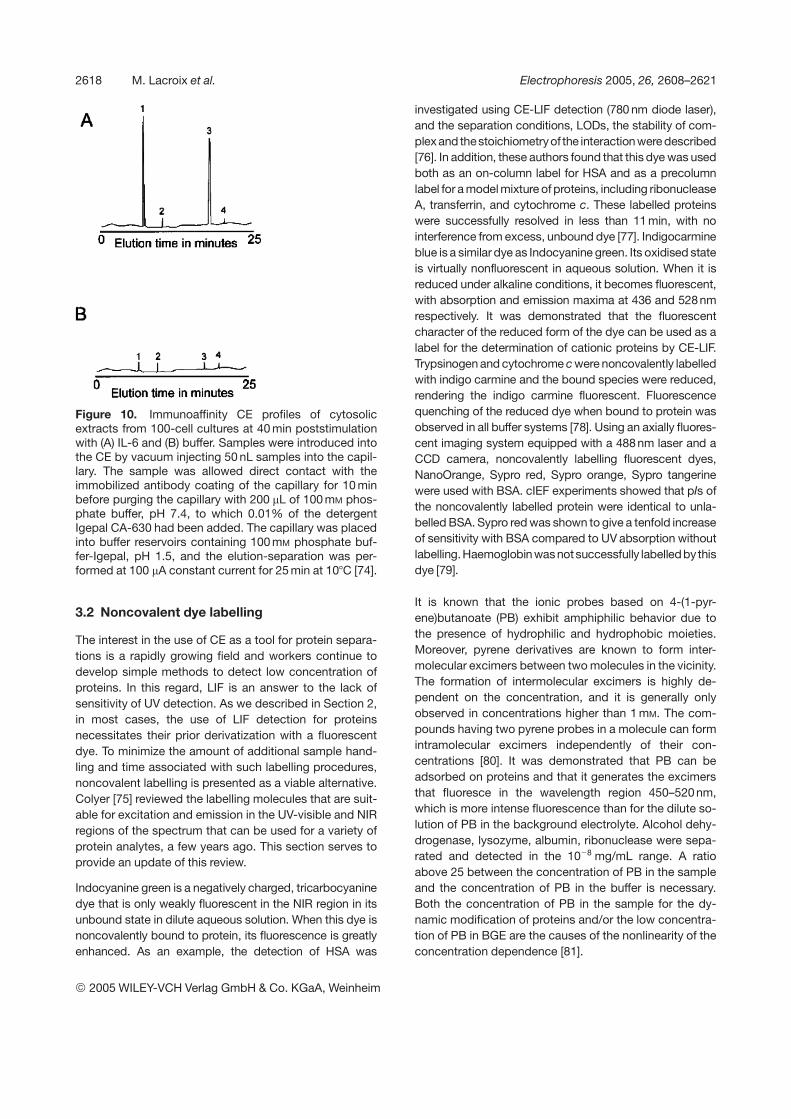
Immunoaffinity CE-LIF is an interesting strategy usingantibodies. The measurement of intracellular regulatoryproteins in cultures as low as 100 cells was performedusing an antibody-based CE-LIF (HeNe laser, 633 nm)with a high degree of precision and accuracy. Theauthors used immunoaffinity CE, by coating the mono-valent FAB fragments of diverse antibodies on approxi-mately 10 cm of the capillary [72, 73]. The sample wasthen injected in the capillary and was in contact with theimmobilized antibody for 10 min before purging thecapillary with 100 mM of phosphate buffer, pH 7.4, towhich a detergent (Igepal CA-630) had been added toreduce nonspecific interaction. The capillary is thenplaced into a buffer reservoir containing the same bufferat pH 1.5. The separation was run at a constant currentof 100 mA. Using this protocol, the quantitation of theintracellular regulatory proteins STAT-1 and STAT-3, fol-lowing stimulation of lymphocyte cultures with IL-6 (aninflammatory cytokine), was obtained. During the sam-ple preparation, the proteins were labelled with Alexa-Fluor 633. The differential expression of these proteinsover time, using a combination of four antibodies spe-cific for either STAT-1 or STAT-3 in both their nonpho-sphorylated and phosphorylated forms, was demon-strated. Figure 10 presents the clean electropherogramswhich were obtained with a cytosolic extract. An iden-tical work was achieved using chip-based immunoaffi-nity electrophoresis [74].
2005 WILEY-VCH Verlag GmbH & Co. KGaA, Weinheim
2618 M. Lacroix et al. Electrophoresis 2005, 26, 2608–2621
Figure 10. Immunoaffinity CE profiles of cytosolicextracts from 100-cell cultures at 40 min poststimulationwith (A) IL-6 and (B) buffer. Samples were introduced intothe CE by vacuum injecting 50 nL samples into the capil-lary. The sample was allowed direct contact with theimmobilized antibody coating of the capillary for 10 minbefore purging the capillary with 200 mL of 100 mM phos-phate buffer, pH 7.4, to which 0.01% of the detergentIgepal CA-630 had been added. The capillary was placedinto buffer reservoirs containing 100 mM phosphate buf-fer-Igepal, pH 1.5, and the elution-separation was per-formed at 100 mA constant current for 25 min at 107C [74].
3.2 Noncovalent dye labelling
The interest in the use of CE as a tool for protein separa-tions is a rapidly growing field and workers continue todevelop simple methods to detect low concentration ofproteins. In this regard, LIF is an answer to the lack ofsensitivity of UV detection. As we described in Section 2,in most cases, the use of LIF detection for proteinsnecessitates their prior derivatization with a fluorescentdye. To minimize the amount of additional sample hand-ling and time associated with such labelling procedures,noncovalent labelling is presented as a viable alternative.Colyer [75] reviewed the labelling molecules that are suit-able for excitation and emission in the UV-visible and NIRregions of the spectrum that can be used for a variety ofprotein analytes, a few years ago. This section serves toprovide an update of this review.
Indocyanine green is a negatively charged, tricarbocyaninedye that is only weakly fluorescent in the NIR region in itsunbound state in dilute aqueous solution. When this dye isnoncovalently bound to protein, its fluorescence is greatlyenhanced. As an example, the detection of HSA was
investigated using CE-LIF detection (780 nm diode laser),and the separation conditions, LODs, the stability of com-plexand thestoichiometryof the interactionwere described[76]. In addition, these authors found that this dye was usedboth as an on-column label for HSA and as a precolumnlabel for a model mixture of proteins, including ribonucleaseA, transferrin, and cytochrome c. These labelled proteinswere successfully resolved in less than 11 min, with nointerference from excess, unbound dye [77]. Indigocarmineblue is a similar dye as Indocyanine green. Its oxidised stateis virtually nonfluorescent in aqueous solution. When it isreduced under alkaline conditions, it becomes fluorescent,with absorption and emission maxima at 436 and 528nmrespectively. It was demonstrated that the fluorescentcharacter of the reduced form of the dye can be used as alabel for the determination of cationic proteins by CE-LIF.Trypsinogen and cytochrome c were noncovalently labelledwith indigo carmine and the bound species were reduced,rendering the indigo carmine fluorescent. Fluorescencequenching of the reduced dye when bound to protein wasobserved in all buffer systems [78]. Using an axially fluores-cent imaging system equipped with a 488nm laser and aCCD camera, noncovalently labelling fluorescent dyes,NanoOrange, Sypro red, Sypro orange, Sypro tangerinewere used with BSA. cIEF experiments showed that pIs ofthe noncovalently labelled protein were identical to unla-belled BSA. Sypro red was shown to give a tenfold increaseof sensitivity with BSA compared to UV absorption withoutlabelling.Haemoglobinwasnotsuccessfully labelledby thisdye [79].
It is known that the ionic probes based on 4-(1-pyr-ene)butanoate (PB) exhibit amphiphilic behavior due tothe presence of hydrophilic and hydrophobic moieties.Moreover, pyrene derivatives are known to form inter-molecular excimers between two molecules in the vicinity.The formation of intermolecular excimers is highly de-pendent on the concentration, and it is generally onlyobserved in concentrations higher than 1 mM. The com-pounds having two pyrene probes in a molecule can formintramolecular excimers independently of their con-centrations [80]. It was demonstrated that PB can beadsorbed on proteins and that it generates the excimersthat fluoresce in the wavelength region 450–520 nm,which is more intense fluorescence than for the dilute so-lution of PB in the background electrolyte. Alcohol dehy-drogenase, lysozyme, albumin, ribonuclease were sepa-rated and detected in the 1028 mg/mL range. A ratioabove 25 between the concentration of PB in the sampleand the concentration of PB in the buffer is necessary.Both the concentration of PB in the sample for the dy-namic modification of proteins and/or the low concentra-tion of PB in BGE are the causes of the nonlinearity of theconcentration dependence [81].
2005 WILEY-VCH Verlag GmbH & Co. KGaA, Weinheim
Electrophoresis 2005, 26, 2608–2621 CE-LIF of peptides and proteins 2619
NN127 and SQ-3, two symmetric and asymmetric squar-ylium dyes, were shown to have an enhanced fluores-cence upon complexation with proteins such as BSA,HSA, b-lactoglobulin A and trypsinogen. It was deter-mined that electrostatic interactions are involved, whichare due to dye-protein interaction. Dye/protein stoichio-metries in the noncovalent complexes were found to be1:1 for SQ-3, although various possible stoichiometrieswere found for NN127 depending upon pH and proteinconcentration. Association constants on the order of 105
and 107 were found for noncovalent complexes of SQ-3and NN127 respectively, with HSA [82].
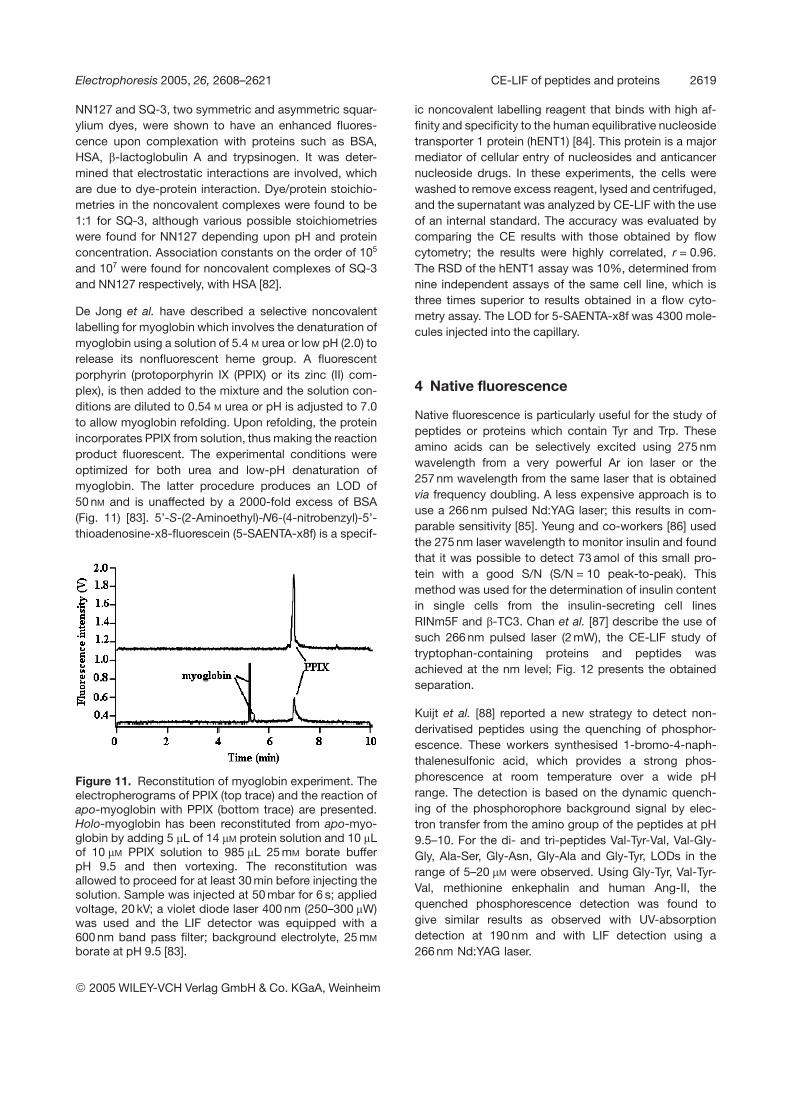
De Jong et al. have described a selective noncovalentlabelling for myoglobin which involves the denaturation ofmyoglobin using a solution of 5.4 M urea or low pH (2.0) torelease its nonfluorescent heme group. A fluorescentporphyrin (protoporphyrin IX (PPIX) or its zinc (II) com-plex), is then added to the mixture and the solution con-ditions are diluted to 0.54 M urea or pH is adjusted to 7.0to allow myoglobin refolding. Upon refolding, the proteinincorporates PPIX from solution, thus making the reactionproduct fluorescent. The experimental conditions wereoptimized for both urea and low-pH denaturation ofmyoglobin. The latter procedure produces an LOD of50 nM and is unaffected by a 2000-fold excess of BSA(Fig. 11) [83]. 5’-S-(2-Aminoethyl)-N6-(4-nitrobenzyl)-5’-thioadenosine-x8-fluorescein (5-SAENTA-x8f) is a specif-
Figure 11. Reconstitution of myoglobin experiment. Theelectropherograms of PPIX (top trace) and the reaction ofapo-myoglobin with PPIX (bottom trace) are presented.Holo-myoglobin has been reconstituted from apo-myo-globin by adding 5 mL of 14 mM protein solution and 10 mLof 10 mM PPIX solution to 985 mL 25 mM borate bufferpH 9.5 and then vortexing. The reconstitution wasallowed to proceed for at least 30 min before injecting thesolution. Sample was injected at 50 mbar for 6 s; appliedvoltage, 20 kV; a violet diode laser 400 nm (250–300 mW)was used and the LIF detector was equipped with a600 nm band pass filter; background electrolyte, 25 mM
borate at pH 9.5 [83].
ic noncovalent labelling reagent that binds with high af-finity and specificity to the human equilibrative nucleosidetransporter 1 protein (hENT1) [84]. This protein is a majormediator of cellular entry of nucleosides and anticancernucleoside drugs. In these experiments, the cells werewashed to remove excess reagent, lysed and centrifuged,and the supernatant was analyzed by CE-LIF with the useof an internal standard. The accuracy was evaluated bycomparing the CE results with those obtained by flowcytometry; the results were highly correlated, r = 0.96.The RSD of the hENT1 assay was 10%, determined fromnine independent assays of the same cell line, which isthree times superior to results obtained in a flow cyto-metry assay. The LOD for 5-SAENTA-x8f was 4300 mole-cules injected into the capillary.
4 Native fluorescence
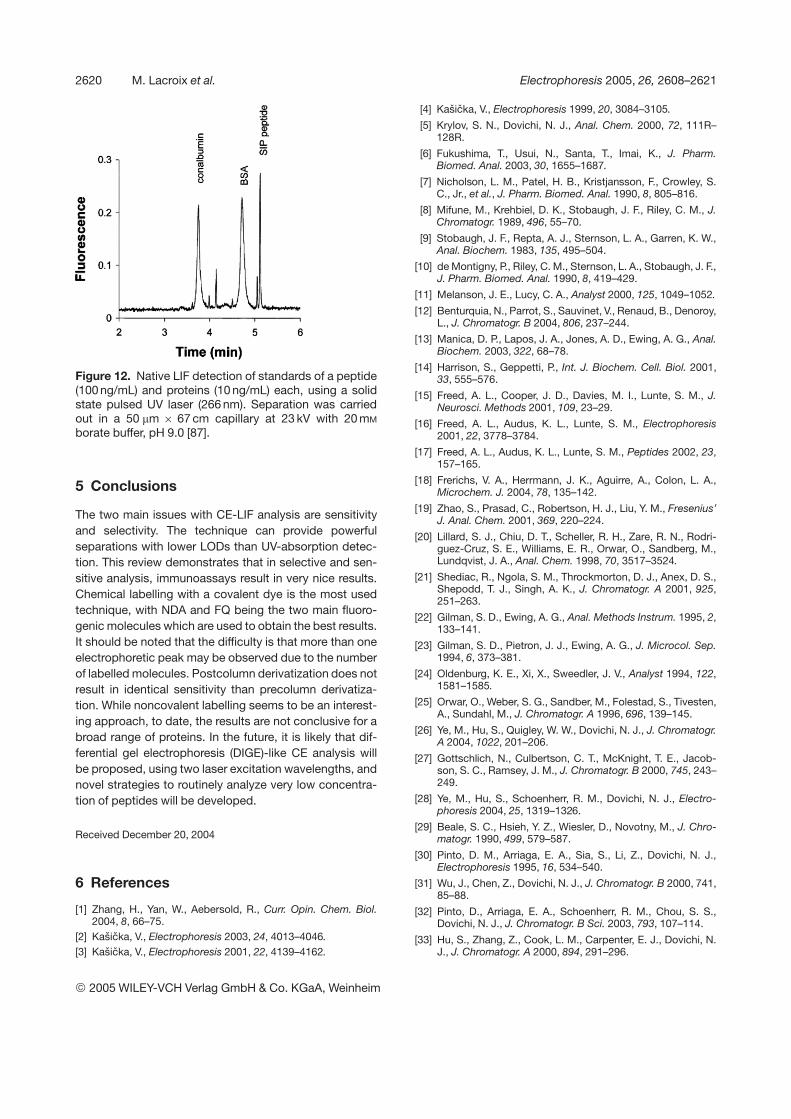
Native fluorescence is particularly useful for the study ofpeptides or proteins which contain Tyr and Trp. Theseamino acids can be selectively excited using 275 nmwavelength from a very powerful Ar ion laser or the257 nm wavelength from the same laser that is obtainedvia frequency doubling. A less expensive approach is touse a 266 nm pulsed Nd:YAG laser; this results in com-parable sensitivity [85]. Yeung and co-workers [86] usedthe 275 nm laser wavelength to monitor insulin and foundthat it was possible to detect 73 amol of this small pro-tein with a good S/N (S/N = 10 peak-to-peak). Thismethod was used for the determination of insulin contentin single cells from the insulin-secreting cell linesRINm5F and b-TC3. Chan et al. [87] describe the use ofsuch 266 nm pulsed laser (2 mW), the CE-LIF study oftryptophan-containing proteins and peptides wasachieved at the nm level; Fig. 12 presents the obtainedseparation.
Kuijt et al. [88] reported a new strategy to detect non-derivatised peptides using the quenching of phosphor-escence. These workers synthesised 1-bromo-4-naph-thalenesulfonic acid, which provides a strong phos-phorescence at room temperature over a wide pHrange. The detection is based on the dynamic quench-ing of the phosphorophore background signal by elec-tron transfer from the amino group of the peptides at pH9.5–10. For the di- and tri-peptides Val-Tyr-Val, Val-Gly-Gly, Ala-Ser, Gly-Asn, Gly-Ala and Gly-Tyr, LODs in therange of 5–20 mM were observed. Using Gly-Tyr, Val-Tyr-Val, methionine enkephalin and human Ang-II, thequenched phosphorescence detection was found togive similar results as observed with UV-absorptiondetection at 190 nm and with LIF detection using a266 nm Nd:YAG laser.
2005 WILEY-VCH Verlag GmbH & Co. KGaA, Weinheim
2620 M. Lacroix et al. Electrophoresis 2005, 26, 2608–2621
Figure 12. Native LIF detection of standards of a peptide(100 ng/mL) and proteins (10 ng/mL) each, using a solidstate pulsed UV laser (266 nm). Separation was carriedout in a 50 mm 6 67 cm capillary at 23 kV with 20 mM
borate buffer, pH 9.0 [87].
5 Conclusions
The two main issues with CE-LIF analysis are sensitivityand selectivity. The technique can provide powerfulseparations with lower LODs than UV-absorption detec-tion. This review demonstrates that in selective and sen-sitive analysis, immunoassays result in very nice results.Chemical labelling with a covalent dye is the most usedtechnique, with NDA and FQ being the two main fluoro-genic molecules which are used to obtain the best results.It should be noted that the difficulty is that more than oneelectrophoretic peak may be observed due to the numberof labelled molecules. Postcolumn derivatization does notresult in identical sensitivity than precolumn derivatiza-tion. While noncovalent labelling seems to be an interest-ing approach, to date, the results are not conclusive for abroad range of proteins. In the future, it is likely that dif-ferential gel electrophoresis (DIGE)-like CE analysis willbe proposed, using two laser excitation wavelengths, andnovel strategies to routinely analyze very low concentra-tion of peptides will be developed.
Received December 20, 2004
6 References
[1] Zhang, H., Yan, W., Aebersold, R., Curr. Opin. Chem. Biol.2004, 8, 66–75.
[2] Kasicka, V., Electrophoresis 2003, 24, 4013–4046.[3] Kasicka, V., Electrophoresis 2001, 22, 4139–4162.
[4] Kasicka, V., Electrophoresis 1999, 20, 3084–3105.
[5] Krylov, S. N., Dovichi, N. J., Anal. Chem. 2000, 72, 111R–128R.
[6] Fukushima, T., Usui, N., Santa, T., Imai, K., J. Pharm.Biomed. Anal. 2003, 30, 1655–1687.
[7] Nicholson, L. M., Patel, H. B., Kristjansson, F., Crowley, S.C., Jr., et al., J. Pharm. Biomed. Anal. 1990, 8, 805–816.
[8] Mifune, M., Krehbiel, D. K., Stobaugh, J. F., Riley, C. M., J.Chromatogr. 1989, 496, 55–70.
[9] Stobaugh, J. F., Repta, A. J., Sternson, L. A., Garren, K. W.,Anal. Biochem. 1983, 135, 495–504.
[10] de Montigny, P., Riley, C. M., Sternson, L. A., Stobaugh, J. F.,J. Pharm. Biomed. Anal. 1990, 8, 419–429.
[11] Melanson, J. E., Lucy, C. A., Analyst 2000, 125, 1049–1052.
[12] Benturquia, N., Parrot, S., Sauvinet, V., Renaud, B., Denoroy,L., J. Chromatogr. B 2004, 806, 237–244.
[13] Manica, D. P., Lapos, J. A., Jones, A. D., Ewing, A. G., Anal.Biochem. 2003, 322, 68–78.
[14] Harrison, S., Geppetti, P., Int. J. Biochem. Cell. Biol. 2001,33, 555–576.
[15] Freed, A. L., Cooper, J. D., Davies, M. I., Lunte, S. M., J.Neurosci. Methods 2001, 109, 23–29.
[16] Freed, A. L., Audus, K. L., Lunte, S. M., Electrophoresis2001, 22, 3778–3784.
[17] Freed, A. L., Audus, K. L., Lunte, S. M., Peptides 2002, 23,157–165.
[18] Frerichs, V. A., Herrmann, J. K., Aguirre, A., Colon, L. A.,Microchem. J. 2004, 78, 135–142.
[19] Zhao, S., Prasad, C., Robertson, H. J., Liu, Y. M., Fresenius’J. Anal. Chem. 2001, 369, 220–224.
[20] Lillard, S. J., Chiu, D. T., Scheller, R. H., Zare, R. N., Rodri-guez-Cruz, S. E., Williams, E. R., Orwar, O., Sandberg, M.,Lundqvist, J. A., Anal. Chem. 1998, 70, 3517–3524.
[21] Shediac, R., Ngola, S. M., Throckmorton, D. J., Anex, D. S.,Shepodd, T. J., Singh, A. K., J. Chromatogr. A 2001, 925,251–263.
[22] Gilman, S. D., Ewing, A. G., Anal. Methods Instrum. 1995, 2,133–141.
[23] Gilman, S. D., Pietron, J. J., Ewing, A. G., J. Microcol. Sep.1994, 6, 373–381.
[24] Oldenburg, K. E., Xi, X., Sweedler, J. V., Analyst 1994, 122,1581–1585.
[25] Orwar, O., Weber, S. G., Sandber, M., Folestad, S., Tivesten,A., Sundahl, M., J. Chromatogr. A 1996, 696, 139–145.
[26] Ye, M., Hu, S., Quigley, W. W., Dovichi, N. J., J. Chromatogr.A 2004, 1022, 201–206.
[27] Gottschlich, N., Culbertson, C. T., McKnight, T. E., Jacob-son, S. C., Ramsey, J. M., J. Chromatogr. B 2000, 745, 243–249.
[28] Ye, M., Hu, S., Schoenherr, R. M., Dovichi, N. J., Electro-phoresis 2004, 25, 1319–1326.
[29] Beale, S. C., Hsieh, Y. Z., Wiesler, D., Novotny, M., J. Chro-matogr. 1990, 499, 579–587.
[30] Pinto, D. M., Arriaga, E. A., Sia, S., Li, Z., Dovichi, N. J.,Electrophoresis 1995, 16, 534–540.
[31] Wu, J., Chen, Z., Dovichi, N. J., J. Chromatogr. B 2000, 741,85–88.
[32] Pinto, D., Arriaga, E. A., Schoenherr, R. M., Chou, S. S.,Dovichi, N. J., J. Chromatogr. B Sci. 2003, 793, 107–114.
[33] Hu, S., Zhang, Z., Cook, L. M., Carpenter, E. J., Dovichi, N.J., J. Chromatogr. A 2000, 894, 291–296.
2005 WILEY-VCH Verlag GmbH & Co. KGaA, Weinheim
Electrophoresis 2005, 26, 2608–2621 CE-LIF of peptides and proteins 2621
[34] Hu, S., Jiang, J., Cook, L. M., Richards, D. P., Horlick, L.,Wong, B., Dovichi, N. J., Electrophoresis 2002, 23, 3136–3142.
[35] Michels, D. A., Hu, S., Schoenherr, R. M., Eggertson, M. J.,Dovichi, N. J., Mol. Cell. Proteomics 2002, 1, 69–74.
[36] Michels, D. A., Hu, S., Dambrowitz, K. A., Eggertson, M. J.,Lauterbach, K., Dovichi, N. J., Electrophoresis 2004, 25,3098–3105.
[37] Zhang, Z., Carpenter, E., Puyan, X., Dovichi, N. J., Electro-phoresis 2001, 22, 1127–1132.
[38] Richards, D. P., Stathakis, C., Polakowski, R., Ahmadzadeh,H., Dovichi, N. J., J. Chromatogr. A 1999, 853, 21–25.
[39] Zhang, Z., Krylov, S., Arriaga, E. A., Polakowski, R., Dovichi,N. J., Anal. Chem. 2000, 72, 318–322.
[40] Hu, S., Lee, R., Zhang, Z., Krylov, S. N., Dovichi, N. J., J.Chromatogr. B 2001, 752, 307–310.
[41] Liu, J., Hsiek, Y. Z., Wiesler, D., Novotny, M., Anal. Chem.1991, 63, 408–412.
[42] Novatchev, N., Holzgrabe, U., J. Pharm. Biomed. Anal.2002, 28, 475–486.
[43] Nouadje, G., Rubie, H., Chatelut, E., Canal, P. et al., J.Chromatogr. A 1995, 717, 293–298.
[44] Lalljie, S. P. D., Sandra, P., Chromatographia 1995, 40, 519–526.
[45] Hentz, N. G., Richardson, J. M., Sportsman, J. R., Daijo, J.,Sittampalam, G. S., Anal. Chem. 1997, 69, 4994–5000.
[46] Huang, Y., Duan, J., Chen, Q., Chen, G., Electrophoresis2004, 25, 1051–1057.
[47] Siri, N., Riolet, P., Bayle, C., Couderc, F., J. Chromatogr. B2003, 793, 151–157.
[48] Larmann, J. P., Jr., Lemmo, A. V., Moore, A. W., Jr., Jorgen-son, J. W., Electrophoresis 1993, 14, 439–447.
[49] Moore, A. W., Jr., Jorgenson, J. W., Anal. Chem. 1995, 67,3448–3455.
[50] Issaq, H. J., Chan, K. C., Liu, C. S., Li, Q., Electrophoresis2001, 22, 1133–1135.
[51] Uchiyama, S., Santa, T., Okiyama, N., Fukushima, T., Imai,K., Biomed. Chromatogr. 2001, 15, 295–318.
[52] Massip, C., Riollet, P., Quemener, E., Bayle, C., Salvayre, R.,Couderc, F., Causse, E., J. Chromatogr. A 2002, 979, 209–215.
[53] Solinova, V., Kasicka, V., Koval, D., Barth, T., Ciencialova, A.,Zakova, L., J. Chromatogr. B 2004, 808, 75–82.
[54] Hart, J. J., Welch, R. M., Norvell, W. A., Kochian, L. V., Elec-trophoresis 2002, 23, 81–87.
[55] Zinellu, A., Carru, C., Galistu, F., Usai, M. F., Pes, G. M.,Baggio, G., Federici, G., Deiana, L., Electrophoresis 2003,24, 2796–2804.
[56] Bayle, C., Causse, E., Couderc, F., Electrophoresis 2004, 25,1457–1472.
[57] Bayle, C., Issac, C., Salvayre, R., Couderc, F., Causse, E., J.Chromatogr. A 2002, 979, 255–260.
[58] Shimura, K., Matsumoto, H., Kasai, K., Electrophoresis1998, 19, 2296–2300.
[59] Shimura, K., Kamiya, K., Matsumoto, H., Kasai, K., Anal.Chem. 2002, 74, 1046–1053.
[60] Cruickshank, K. A., Olvera, J., Müller, U. R., J. Chromatogr.A 1998, 817, 41–47.
[61] Le Potier, I., Franck, G., Smadja, C., Varlet, S., Taverna, M.,J. Chromatogr. A 2004, 1046, 271–276.
[62] Baars, M. J., Patonay, G., Anal. Chem. 1999, 71, 667–671.
[63] Yeung, W. S., Luo, G. A., Wang, Q. G., Ou, J. P., J. Chroma-togr. B 2003, 797, 217–228.
[64] Hennion, M. C., Pichon, V., J. Chromatogr. A 2003, 1000,29–52.
[65] German, I., Kennedy, R. T., J. Chromatogr. B 2000, 742,353–362.
[66] German, I., Kennedy, R. T., Anal. Chem. 2000, 72, 5365–5372.
[67] German, I., Roper, M. G., Kalra, S. P., Rhinehart, E., Ken-nedy, R. T., Electrophoresis 2001, 22, 3659–3667.
[68] Han, K. Y., Ban, E., Yoo, Y. S., J. Chromatogr. A 2003, 1013,215–220.
[69] Schmerr, M. J., Jenny, A. L., Bulgin, M. S., Miller, J. M.,Hamir, A. N., Cutlip, R. C., Goodwin, K R., J. Chromatogr. A1999, 853, 207–214.
[70] Jackman, R., Schmerr, M. J., Electrophoresis 2003, 24, 892–896.
[71] Sowell, J., Parihar, R., Patonay, G., J. Chromatogr. B 2001,752, 1–8.
[72] Phillips, T. M., Chmielinska, J. J., Biomed. Chromatogr.1994, 8, 242–248.
[73] Phillips, T. M., Smith, P., Biomed. Chromatogr. 2003, 17,182–187.
[74] Phillips, T. M., Electrophoresis 2004, 25, 1652–1659).[75] Colyer, C., Cell. Biochem. Biophys. 2000, 33, 323–337.
[76] Moody, E. D., Viskari, P. J., Colyer, C. L., J. Chromatogr. B1999, 729, 55–64.
[77] McCorquodale, E. M., Colyer, C. L., Electrophoresis 2001,22, 2403–2408.
[78] McCorquodale, E. M., Piper, J., Colyer, C. L., J. Capill.Electrophor. 2002, 7, 95–101.
[79] Sze, N. S. K., Huang, T. M., Pawliszyn, J. J., Sep. Sci. 2002,25, 1119–1122.
[80] Nohta, H., Satozono, H., Koiso, K., Yoshida, H., Ishida, J.,Yamaguchi, M., Anal. Chem. 2000, 72, 4199–4204.
[81] Horká, M., Slais, K., Electrophoresis 2002, 23, 1090–1095.
[82] Welder, F., Paul, B., Nakazumi, H., Yagi, S., Colyer, C. L., J.Chromatogr. B 2003, 793, 93–105.
[83] de Jong, E. P., Melanson, J. E., Lucy, C. A., Electrophoresis2004, 25, 3153–3162.
[84] Li, N., Cook, L., Santos, C., Cass, C. E., Mackey, J. R.,Dovichi, N. J., Anal. Chem. 2002, 74, 2573–2577.
[85] For a review see Yeung, E. S., J. Chromatogr. A 1999, 830,243–262.
[86] Tong, W., Yeung, E. S., J. Chromatogr. B 1996, 685, 35–40.
[87] Chan, K. C., Muschik, G. M., Issaq, H. J., Electrophoresis2000, 21, 2062–2066.
[88] Kuijt, J., van Teylingen, R., Nijbacker, T., Ariese, F., Brink-man, U. A., Gooijer, C., Anal. Chem. 2001, 73, 5026–5029.
2005 WILEY-VCH Verlag GmbH & Co. KGaA, Weinheim
Copyright © 2022 FDOKUMEN