Ion-pair association and acid–base equilibria in nonaqueous capillary electrophoresis of weakly...
10
Rita Carabias-Martínez Encarnación Rodríguez-Gonzalo Jesús Hernández-Méndez Edith Miranda Cruz Javier Domínguez-Álvarez Departamento de Química Analítica, Nutrición y Bromatología, Facultad de Química, Universidad de Salamanca, Salamanca, Spain Received July 6, 2005 Revised September 15, 2005 Accepted September 20, 2005 Research Article Ion-pair association and acid–base equilibria in nonaqueous capillary electrophoresis of weakly basic compounds CE in nonaqueous media was used to study the migrating behavior of two weakly basic s-triazine pesticides and one of their metabolites. The target pesticides were selected to be representative foreach of the two main groups: propazine and deethyl- atrazine for the chloro-s-triazines group and ametryn for the methylthio-s-triazines group. To elucidate the phenomena involved, systematic studies were carried out in the different organic media studied. Absolute mobilities were determined in 50% v/v methanol (MeOH)/ACN by extrapolation of the effective mobilities to zero ionic strength in the presence of different concentrations of perchloric acid. Conductivity measure- ments performed in MeOH and 50 and 20% v/v methanol/ACN permitted the evalua- tion of the associations of the components of the BGE. The effects of ionic strength on the actual mobilities of the compounds were determined in the presence of perchloric acid and SDS in different organic media. Two different ion-pair equilibria were con- sidered: one due to the presence of perchlorate anions present in the BGE and second that from the added dodecyl sulfate anions. Bearing in mind that these weakly basic compounds can exhibit ion-pair and acid–base equilibria, the acid–base and ion-pair parasite reaction coefficients were determined. Finally, the effects of ionic strength, ion-pair interactions and acid–base properties on the effective electrophoretic mobili- ties of the analytes are discussed. Keywords: Anionic additives / Ionic strength / Ion-pair association / Nonaqueous capillary electrophoresis / Triazine DOI 10.1002/elps.200500490 1 Introduction 1.1 General aspects The use of organic solvents extends the range of appli- cation for CE, affording more versatile electrophoretic separations since it is possible to work in media with dif- ferent physicochemical properties. Several solvents have been employed in nonaqueous CE (NACE) separations, ranging from hydrophobic [1] to hydrophilic [2] and sometimes even more hydrophilic than water [3], although the solvents most widely employed are methanol (MeOH) and ACN. Changing the solvents from water to another implies modifications in the acid– base properties of the analytes [4, 5]. In addition, the use of nonaqueous solvents permits a variety of interactions [6] between analytes and other species incorporated in the medium (additives), and hence increases the possibi- lities of analysts to manipulate the separations. Different types of additives have been employed in NACE. Large organic anionic and cationic additives, most of them as chiral selectors, have been proposed: sulfated b-CD [7], sulfated crown ethers [8], quinine- derived compounds [9] and certain special ones such as a copper(II)-L-proline complex [10]. Additionally, no chiral separations based on the use of anionic surfactants [11, 12], quaternary ammonium salts [13] or imidazolium- based liquids [14] as additives have been described. Small ions have also been employed, such as anionic additives (acetate [15], perchlorate [12] and halide [16]), or cationic (small-chain amines [17], inorganic cations [18, 16]). Correspondence: Professor Rita Carabias-Martínez, Departamento de Química Analítica, Nutrición y Bromatología, Facultad de Química, Universidad de Salamanca, Plaza de la Merced s/n, E-37008 Sala- manca, Spain E-mail: [email protected] Fax: 134-923-294-483 Abbreviations: Am, ametryn; DEA, deethylatrazine; DHO, Debye– Hückel–Onsager; FP , Falkenhagen–Pitts; MeOH, methanol; NACE, nonaqueous CE; Pz, propazine Electrophoresis 2006, 27, 423–432 423 2006 WILEY-VCH Verlag GmbH & Co. KGaA, Weinheim www.electrophoresis-journal.com
-
Upload
independent -
Category
Documents
-
view
2 -
download
0
Transcript of Ion-pair association and acid–base equilibria in nonaqueous capillary electrophoresis of weakly...

Rita Carabias-MartínezEncarnación Rodríguez-GonzaloJesús Hernández-MéndezEdith Miranda CruzJavier Domínguez-Álvarez
Departamento de Química Analítica,Nutrición y Bromatología,Facultad de Química,Universidad de Salamanca,Salamanca, Spain
Received July 6, 2005Revised September 15, 2005Accepted September 20, 2005
Research Article
Ion-pair association and acid–base equilibriain nonaqueous capillary electrophoresis ofweakly basic compounds
CE in nonaqueous media was used to study the migrating behavior of two weaklybasic s-triazine pesticides and one of their metabolites. The target pesticides wereselected to be representative for each of the two main groups: propazine and deethyl-atrazine for the chloro-s-triazines group and ametryn for the methylthio-s-triazinesgroup. To elucidate the phenomena involved, systematic studies were carried out inthe different organic media studied. Absolute mobilities were determined in 50% v/vmethanol (MeOH)/ACN by extrapolation of the effective mobilities to zero ionic strengthin the presence of different concentrations of perchloric acid. Conductivity measure-ments performed in MeOH and 50 and 20% v/v methanol/ACN permitted the evalua-tion of the associations of the components of the BGE. The effects of ionic strength onthe actual mobilities of the compounds were determined in the presence of perchloricacid and SDS in different organic media. Two different ion-pair equilibria were con-sidered: one due to the presence of perchlorate anions present in the BGE and secondthat from the added dodecyl sulfate anions. Bearing in mind that these weakly basiccompounds can exhibit ion-pair and acid–base equilibria, the acid–base and ion-pairparasite reaction coefficients were determined. Finally, the effects of ionic strength,ion-pair interactions and acid–base properties on the effective electrophoretic mobili-ties of the analytes are discussed.
Keywords: Anionic additives / Ionic strength / Ion-pair association / Nonaqueouscapillary electrophoresis / Triazine DOI 10.1002/elps.200500490
1 Introduction
1.1 General aspects
The use of organic solvents extends the range of appli-cation for CE, affording more versatile electrophoreticseparations since it is possible to work in media with dif-ferent physicochemical properties.
Several solvents have been employed in nonaqueous CE(NACE) separations, ranging from hydrophobic [1] tohydrophilic [2] and sometimes even more hydrophilic than
water [3], although the solvents most widely employedare methanol (MeOH) and ACN. Changing the solventsfrom water to another implies modifications in the acid–base properties of the analytes [4, 5]. In addition, the useof nonaqueous solvents permits a variety of interactions[6] between analytes and other species incorporated inthe medium (additives), and hence increases the possibi-lities of analysts to manipulate the separations.
Different types of additives have been employed inNACE. Large organic anionic and cationic additives,most of them as chiral selectors, have been proposed:sulfated b-CD [7], sulfated crown ethers [8], quinine-derived compounds [9] and certain special ones such asa copper(II)-L-proline complex [10]. Additionally, no chiralseparations based on the use of anionic surfactants [11,12], quaternary ammonium salts [13] or imidazolium-based liquids [14] as additives have been described.Small ions have also been employed, such as anionicadditives (acetate [15], perchlorate [12] and halide [16]),or cationic (small-chain amines [17], inorganic cations[18, 16]).
Correspondence: Professor Rita Carabias-Martínez, Departamentode Química Analítica, Nutrición y Bromatología, Facultad de Química,Universidad de Salamanca, Plaza de la Merced s/n, E-37008 Sala-manca, SpainE-mail: [email protected]: 134-923-294-483
Abbreviations: Am, ametryn; DEA, deethylatrazine; DHO, Debye–Hückel–Onsager; FP, Falkenhagen–Pitts; MeOH, methanol; NACE,nonaqueous CE; Pz, propazine
Electrophoresis 2006, 27, 423–432 423
2006 WILEY-VCH Verlag GmbH & Co. KGaA, Weinheim www.electrophoresis-journal.com
424 R. Carabias-Martínez et al. Electrophoresis 2006, 27, 423–432
Besides these interactions, it is well known that thepresence of species able to form ion pairs in the BGEproduces modifications in ionic strength, and hence itis necessary to take into account these effects to dis-criminate between ion-pairing and simple ionicstrength effects [19–23]. The latter must also be con-sidered so as not to overestimate the effects from theformer.
In general, triazine herbicides are weak bases thatbecome protonated at low pH values to afford cationicacids, HA1. Chlorotriazines have a much less basic na-ture than methylthiotriazines. In aqueous medium, theelectrophoretic separation of very weak compounds,such us chlorotriazines, is difficult because of the low pHrequired to protonate them and, in addition, becausetheir migration times appear to be very similar. Thesimultaneous determination of chloro- and methylthio-triazines by CZE in nonaqueous medium and in thepresence of ionic additives has been reported in a pre-vious work [4] as well as its application for the analysis ofnatural waters [12].
In the studies carried out here, it was observed thatchanges in solvent, acidity and added electrolytesaffect the electrophoretic behavior in nonaqueousmedia of these weakly basic species. Additionally,modification of these variables leads to joint variationsin ion–solvent interactions, in ionic strength and in theacid–base and ion-pair equilibria formation of the ana-lytes under study.
In the present work, NACE, with solutions containingperchloric acid and SDS, was used to analyze the migra-tion behavior of the chlorotriazine propazine (Pz) and theatrazine metabolite deethylatrazine (DEA) as well as themethylthiotriazine ametryn (Am). These compounds wereselected as group representatives.
A study was conducted on the electrophoretic behaviorof the three triazines in the presence of the perchloric–perchlorate system and of SDS in different organic mediacontaining different proportions of MeOH/ACN, dis-criminating the effects attributable to changes in ionicstrength and to acid–base equilibria and ion-pair forma-tion.
Knowledge of the different effects and their discriminationshould afford an explanation of the behaviour of the ana-lytes, the possibility of predicting this, and the chance toperform experimental studies aimed at a more effectiveseparation of the chemical species in a given problemsample.
1.2 Theoretical background
1.2.1 Ionic equilibria and actual mobility
If an analyte, A, is present in a CE system, it will move withan observed mobility, mobs,HA
1, which is the sum of theelectroosmotic mobility and the effective electrophoreticmobility of the analyte, mobs,HA
1 = meo 1 m(A).
The equilibria of a protonated triazine in a nonaqueousmedium containing anions (perchlorate and dodecyl sul-fate, DS2) in the BGE are the dissociations of the cationicacid:
HA1 . A 1 H1 Ka (1)
and ionic associations with anions:
HA1 1 ClO42 . HA1ClO4
2 KHA1ClO4
2 (2)
HA1 1 DS2 . HA1DS2 KHA1
DS2 (3)
Bearing in mind the chemical structure of the analytes,cationic homo- and heteroconjugations were not con-sidered since the hydrogen bonding bridges involvedwould be [NH. . .H]1, and these are relatively weak [24].
If a solution containing these species is subjected to anelectric field, an effective electrophoretic mobility isobserved that is the mean of the mobilities of all of them,according to Eq. (4).
mðAÞ ¼mHAþ � ½HAþ� þ mA � ½A� þ mHAþClO�
4� ½HAþClO�
4 � þ mHAþDS� � ½HAþDS��½HAþ� þ ½A� þ ½HAþClO�
4 � þ ½HAþDS��(4)
Since only the HA1 species has mobility, the effectiveelectrophoretic mobility will be that indicated by Eq. (5).
mðAÞ ¼ mact;HAþ � ½HAþ�½HAþ� þ ½A� þ ½HAþClO�
4 � þ ½HAþDS��(5)
This expression can be converted into Eq. (6), by takinginto account the equilibria between HA1 species and theother species.
mact;HAþ
mðAÞ¼ 1 þ Ka
½Hþ�þ KHAþClO�
4½ClO�
4 � þ KHAþDS� ½DS�� (6)
Equation (6) is similar to that described in [19, 25, 26] toexplain the electrophoretic behaviour of species that mayundergo the formation of a neutral ion-pair 1:1 stoichi-ometry. The difference with Eq. (6) lies in that – in this case– the possible protonation reaction and simultaneous for-mation of ion pairs should be considered.
The second term of Eq. (6) is the coefficient of the parasitereaction of the protonated species, atotal, which is relatedto the parasite reaction coefficient through Eq. (7).
atotal ¼ aacid�base þ aClO�4þ aDS� � 2 (7)
Thus, Eq. (6) can be converted into Eq. (8)
2006 WILEY-VCH Verlag GmbH & Co. KGaA, Weinheim www.electrophoresis-journal.com
Electrophoresis 2006, 27, 423–432 CE and CEC 425
mact;HAþ
mðAÞ¼ aacid�base þ aClO�
4þ aDS� � 2 (8)
where mact,HA1 is the actual mobility for a given ionic
strength, which can be determined from the value of theabsolute mobility (mobility at infinite dilution), mo,HA
1.
1.2.2 Ionic strength and ion-pair effects on ionmobility
The presence of an ionic cloud surrounding an ion redu-ces its absolute mobility, mo,HA
1, and this reduction is pro-portional to the square root of the ionic strength, I.According to the Debye–Hückel–Onsager (DHO) model[27], Eq. (9).
mact;HAþ ¼ mo;HAþ � A � mo;HAþ þ B� �
�ffiffiI
p
(9)A � 2:8023 � 106 � 0:5
1 þffiffiffiffiffiffiffi0:5
p� �� 2 �Tð Þ3=2
B � 4:2746 � 10�9 � 1
Z � 2 �Tð Þ1=2
In Eq. (9), E and Z are the relative dielectric constant andviscosity of the medium, respectively; T is the tempera-ture on the absolute scale and the units of all the param-eters are expressed in the international system, ionicstrength, I, being on the molar scale.
More advanced theories introduced by Falkenhagen et al.[28] and Pitts [29] take the finite radii of the monovalention and its counterion into account and give the expres-sions of Eq. (10)
mact;HAþ ¼ mo;HAþ � A � mo;HAþ þ B� �
�ffiffiI
p
1 þ D � a �ffiffiI
p(10)
D � 5:029 � 109 � 1
2 �Tð Þ1=2
where a is the distance of the closest approach betweencation and its counterion.
The parameter a can be calculated as the sum of thecation radius and that of its counterion. In turn, the radiusof each ion, rStokes, can be calculated from its absolutemobility [30] or equivalent conductivity at infinite dilution,lo, Eqs. (11), (12).
rStokes;ion ¼ zion � eo
6 � p � Z � mo;ion(11)
rStokes;ion ¼ zion � eo � F6 � p � Z � lo;ion
(12)
where zion is the charge number of the particular ion, eo isthe proton charge and F is the Faraday constant.
The absolute value, mo, is solvent-dependent according tothe generalized Walden rule [27], Eq. (13). If it is assumedthat the radius of the moving ion is independent, orslightly dependent on the solvent, the simplified Waldenproducts are obtained, Eq. (14).
mo;ion � rStokes;ion � Z ¼ constant (13)
mo;ion � Z ¼ constant (14)
1.2.3 Effects of electrolyte concentration onBGE conductivity
To determine the concentrations of ClO42 and DS2, it is
necessary to know whether these ions are totally dis-sociated in the different organic media studied.
The original DHO [27] theory of the conductance of ions insolution takes into account the ionic atmosphere effectsin reducing mobility. Moreover, in nonaqueous solutions,interionic interactions can appear. Thus, the variation inconductivity with the concentration can be expressed,among others, by the Justice equation [27]:
L1 � y
� Lo þ S � ð1 � yÞ0:5 � C0:5a
¼ E � ð1 � yÞ � Ca � lnðð1 � yÞ � CaÞþ
þ J1 � ð1 � yÞ � Ca � J2 � ð1 � yÞ1:5 � C1:5a
(15)
where L is the conductivity defined by Eq. (16); s beingthe specific conductivity and z the charge number for asymmetrical z:z electrolyte; Lo is the conductivity at infi-nite dilution; S is the Onsager limiting-law coefficient asexpressed in Eq. (17), F being the Faraday constant; E, J1
and J2 are constants; Ca is the molar analytical electrolyteconcentration and the y parameter is related to an asso-ciation constant KAS and the Debye–Hückel theory activi-ty coefficient, gc,6, as expressed in Eq. (18).
L � sðS=cmÞz � Caðmol=cm3Þ
(16)
S ¼ A � z3 � Lo þ B � z2 � 2 � 104 � F (17)
KAS ¼ y
ð1 � yÞ2 � Ca � g2c;�
(18)
2 Materials and methods
2.1 Chemicals
The herbicides were obtained from Riedel-de Haën(Seelze-Hannover, Germany) and were used without fur-ther purification (minimum purity greater than 98%). The
2006 WILEY-VCH Verlag GmbH & Co. KGaA, Weinheim www.electrophoresis-journal.com

426 R. Carabias-Martínez et al. Electrophoresis 2006, 27, 423–432
herbicides studied were as follows: Am, N2-ethyl-N4-iso-propyl-6-methylthio-1,3,5-triazine-2,4-diamine, CAS RN[834-12-8]; Pz, 6-chloro-N2-isopropyl-N4-isopropyl-1,3,5-triazine-2,4-diamine, CAS RN [139-40-2]. The metaboliteDEA, 6-chloro-N-isopropyl-1,3,5-triazine-2,4-diamine,was obtained from Dr. Ehrenstorfer (Augsburg, Germany).Stock solutions of each herbicide and DEA were preparedin MeOH at 200 mg/mL. SDS was obtained from Fluka(Buchs, Switzerland). Sodium perchlorate was fromMerck, Darmstadt, Germany. Perchloric acid (70%) waspurchased from Panreak, Barcelona, Spain. The organicsolvents – ACN and MeOH – were of HPLC-grade (Merck)and were used as received. All chemicals used for thepreparation of the BGE were of analytical reagent grade.The water content remaining in the nonaqueous mediafrom the reagents employed is, in all cases, lowerthan 0.03%.
2.2 Apparatus
All electrophoretic experiments were performed with aP/ACE 2000 (Beckman Instruments, Fullerton, CA)equipped with a UV detector. Standard fused-silicaP/ACE capillaries were used: 75 mm ID and 363 mm OD(57 cm long, 50 cm to the detector). The temperature ofthe capillary was maintained at (25 6 1)7C by the instru-ment thermostatting system. The UV detector was set ata wavelength of 214 nm. Conductivity measurementswere done at 257C in a microCM 2200 conductimeterfrom Crison, Alella, Spain.
2.3 NACE procedures
Uncoated capillaries were used throughout. All newcapillaries were conditioned before use. They were trea-ted for 10 min with ACN and for 5 min with nonaqueousseparation medium. This was also applied as a daily start-up procedure. Before each run, the capillary was rinsedfor 2 min with fresh nonaqueous separation medium; thatis, all nonaqueous separation solutions were prepareddaily and aliquots destined for rinse purposes were neversubjected to the application of an electric field. Sampleswere introduced into the capillary electrokinetically for15 s at 10 kV. The injection solution was 5 mg/L of eachcompound, 2.061023 mol/L HClO4 in 30%: v/v MeOH/ACN. Analysis was performed applying 22 kV. The acidicmedia were prepared with perchloric acid at differentconcentrations (usually 7.561023 mol/L) in differentMeOH/ACN mixtures and with different concentrations ofSDS.
2.3.1 Electroosmotic mobility measurements
The method employed by Williams and Vigh [31] was fol-lowed. Electroosmotic mobility measurements weremade in several nonaqueous acidic media, namely,MeOH, 50% v/v MeOH/ACN, ACN and 50% v/v MeOH/ACN with 1761023 mol/L SDS. All studies were doneunder acidic conditions (7.561023 mol/L HClO4). Theneutral marker employed was benzene dissolved in thecorresponding medium. For comparative purposes,electroosmotic mobility in acidic water was also deter-mined, following the same procedure. In this case, theneutral marker was the commonly employed mesityloxide.
2.3.2 Electrophoretic mobility measurements
Determination of the electrophoretic mobilities wasaccomplished based on the migration time of each ana-lyte injected in the nonaqueous medium considered. Allelectrophoretic mobilities are the means of three replicatemeasurements.
2.3.3 Conductivity measurements
Different solutions of the electrolyte in question (SDS orNaClO4) in the selected nonaqueous media – MeOH,50% v/v MeOH/ACN and 20% v/v MeOH/ACN – wereprepared, ranging in concentration from 1024 to461022 mol/L. The specific conductivities for thesesolutions were measured under stirring at 257C. The con-ductimeter cell was initially calibrated with a 1022 mol/L ofa standard solution of potassium chloride in water.
3 Results and discussion
All compounds studied are basic or weakly basic, andbelong to the s-triazine group. They can be allocated intwo types on the basis of the presence of either sub-stituent – chloride or methylthio – in the molecule.
Table 1 shows the values for the acid constant, Ka, of theprotonated form, HA1, in MeOH, 50% v/v MeOH/ACNand ACN. These data were determined experimentally bypotentiometric titration (unpublished observations). TheKa values in water found for the analytes in the literature[32, 33] are given for comparative purposes.
On comparing the values in water with those in ACN, astrong increase in the basic properties of the analytes canbe observed (6 pH units); in comparison, a small increasewas observed with MeOH (1–1.5 pH units) and in MeOH/ACN mixtures. Other authors have reported similar results
2006 WILEY-VCH Verlag GmbH & Co. KGaA, Weinheim www.electrophoresis-journal.com
Electrophoresis 2006, 27, 423–432 CE and CEC 427
Table 1. pKavaluesa) determined for the representativeanalytes in different nonaqueous media
Class Analyte pKab)
H2OpKa
c)
MeOH 50:50 v/vMeOH/ACN
ACN
Methylthiotriazine Am 4.00 5.5 5.9 9.8Chlorotriazine Pz 1.85 2.7 3.2 7.0
DEA 1.48 2.9 3.1 6.3
a) Ka corresponding to the acid equilibria for the proto-nated form of the analyte, HA1.
b) Data from [32, 33].c) Unpublished observations.
on studying the variation of Ka for cationic acids [22, 34].These results indicate that MeOH governs that effect.Moreover, a crossover between the Ka values of the pro-tonated forms of Pz and DEA should also be noted at highMeOH proportions.
3.1 Electroosmotic mobility, �eo, in nonaqueousmedia
The results obtained following the methodology indi-cated in Section 2 are shown in Table 2. It may beobserved that in all media studied, the magnitude of theelectroosmotic mobility is very small. It is worth men-tioning that the direction of meo in nonaqueous MeOH,ACN and mixtures thereof was found to be opposite tothat observed usually in water. In Table 2 it may be seenthat the EOF was towards the cathode when SDS wasdissolved in the medium, but was even more reduced inabsolute terms.
Table 2. EOF for different nonaqueous media in thepresence of 1061023 mol/L of perchloric acid(Section 4.1). Comparison to water
H2O MeOH ACN 50% v/vMeOH/ACN
50% v/vMeOH/ACN17 mMSDS
meoa)6109, m2/V6s 12.6 28.7 28.3 21.8 10.02
teob) 1 h
23 min25 min 26 min 2 h .7 days
a) Average value for two determinations. Minus sign (2)indicates that the movement of the solution inside thecapillary leads towards the anode.
b) For a 57 cm total length, 50 cm effective length capil-lary at 22 kV.
3.2 Absolute electrophoretic mobilities ofprotonated form of the analytes, �o,HA
1
Different concentrations of perchloric acid dissolved in50% v/v MeOH/ACN were prepared in the (5–30)61023 mol/L range. In each of these solutions – used aselectrophoretic media – the analytes were injected sepa-rately and their migration times, tobs, recorded. Fromthese migration times, and taking into account the valueof electroosmotic mobility in the medium, the values ofeffective electrophoretic mobilities, m(A), were calculated.
From the HClO4 concentration value extrapolated to zeroversus m(A), a rough value of absolute mobility, mo,HA
1, wasobtained for the analyte. From this initial mo,HA
1 value, themact,HA
1 values were calculated for each of the concentra-tions of HClO4 employed experimentally, based on theDHO model. It is also worth mentioning that ionic strengthis easily calculated, since perchloric acid is fully dis-sociated in MeOH and ACN [35, 36].
From the calculated mact,HA1 and the experimental m(A)
values, the first term of Eq. (19) was plotted versus thefree concentration of perchlorate anion. It should benoted that this equation is simply a rearrangement ofEq. (6) for a BGE in the absence of SDS.
mact;HAþ
mðAÞ� 1 þ Ka
½Hþ�
� �¼ KHAþClO�
4½ClO�
4 � (19)
According to Eq. (19), the plot would be expected to showpoints aligned with the intercept close to unity. In fact, thefirst value of mo,HA
1 obtained from extrapolation to zerogave an acceptable fit, but this value needed to be mod-ified subsequently in order to reach the better fit to theplot expected from Eq. (19). After this procedure, a moreaccurate value of mo,HA
1 can be obtained.
In addition, we checked whether a simpler DHO modelwould provide a good approach for mact,HA
1 or, by contrast,whether it would be necessary to make use of the Falk-enhagen–Pitts (FP) model. To check this point, the valuesof the parameter a of Eq. (10) were calculated for eachprotonated triazine (Am, Pz and DEA) from the sum of theradius of the protonated analyte obtained from Eq. (11)and the radius of the perchlorate anion. The calculatedradius values for the protonated analytes were 3.52, 3.64and 3.28 Å for Am, Pz and DEA, respectively.
The radius of the perchlorate anion was calculated in50% v/v MeOH/ACN from the literature value of equiva-lent conductivity at infinite dilution for the perchlorateanion in ACN, lo, ClO4
2 (104.0 S6cm2/mol) [37]. From thisvalue, and taking into account the viscosity of ACN andthat of the 50% v/v MeOH/ACN mixture [37], the calcu-lated radius of the perchlorate anion was 2.28 Å; Table 3.
2006 WILEY-VCH Verlag GmbH & Co. KGaA, Weinheim www.electrophoresis-journal.com
428 R. Carabias-Martínez et al. Electrophoresis 2006, 27, 423–432
Table 3. mo,HA1 values determined for the analytes and
distances of the closest approach between theprotonated analyte and the perchlorate anion, a,in 50% v/v MeOH/ACN according to Section 4.2
Analyte mo,HA1,
(m2/V6s)6108aa),Å
r2 Intercept6103
SlopeKHA
1ClO4
2)
Am 6.82 5.67 0.960 20.9 19.07Pz 6.62 5.77 0.974 20.1 23.63DEA 7.73 5.27 0.968 20.8 39.93
a) Stokes radii for perchlorate anion in 50% v/v MeOH/ACN, 2.28 Å.
The “D?a (I)0.5” term of Eq. (10) FP model resulted inmagnitudes of 0.50, 0.51 and 0.48 for Am, Pz and DEA,respectively, at 257C in 50% v/v MeOH/ACN with3061023 mol/L HClO4, which means that this term is notnegligible as compared to unity and hence indicates theappropriateness of employing the FP model instead of theDHO model to represent the effects of ionic strength onactual mobilities. Thus, the mo,HA
1 values determined forthe analytes, as well as the distance of the closestapproach between the protonated analyte and the per-chlorate anion, a, are shown in Table 3.
In the light of the values of mo,HA1, the order of migration for
the compounds would be DEA-Am-Pz. Experimentally,however, the order of migration observed in 50% v/vMeOH/ACN was Am-DEA-Pz. This can be explained bytaking into account that chlorotriazine DEA is the analytewith the smallest ionic radius, and hence the one showingthe greatest degree of association with the perchlorateanion. Once mo,HA
1 had been determined in 50% v/vMeOH/ACN, it was then estimated for other proportionsof MeOH/ACN assuming the simplified Walden products,Eq. (14).
3.3 Evaluation of ion-pairing in the BGE
In order to determine the possible formation of ion pairsbetween the perchlorate and dodecylsulphate anionswith the sodium cations present in the organic mediastudied, the variation in conductivity was studied for eachmedium as a function of the square root of the con-centration of either NaClO4 or SDS.
The contribution of HClO4 to the total ionic strength canbe calculated quite easily, since perchloric acid remainsfully dissociated in MeOH, ACN and mixtures thereof [35,36]. However, in BGE where SDS is also present, it isnecessary to know the ion-pair formation constants, KAS,for Na1DS2 and Na1ClO4
2.
Conductivity measurements (Table 4) revealed a dis-crepancy between the DHO law of conductivity and theexperimental data for both SDS and NaClO4. Plotting theconductivity values, L, against the square root of theconcentration afforded concave curves. This is becausein the DHO law neither the possible ion-pair associationsnor the finite radii of ions are considered [27]. It wastherefore necessary to make use of an equation, i.e.,Eq. (15), which included both effects in order to obtain agood fit for the experimental points.
Initially, the conductivities at infinite dilution, Lo, wereestimated by the extrapolation to zero concentration foreach individual electrolyte (SDS or NaClO4) in each medi-um (MeOH, 50 or 20% v/v MeOH/ACN). These are shownin Table 4.
Determination of the association constant, KAS, wasaccomplished as follows: an initial value of KAS (equalto unity) was assumed, and from Eq. (18) and the well-known Debye–Hückel expression for activity coeffi-cients, gc,6, the degree of dissociation, y, was calcu-lated for each experimental concentration of electrolyteemployed. Following this, a least squares regressionprocedure was carried out, employing as the responsevalues the first term of Eq. (15) and, as the predictiveblock, each of the three groups of variables containingy and Ca in the second term. This procedure wasrepeated from the beginning, assuming another KAS
value, and the process was completed when the set ofE, J1 and J2 obtained showed positive and significant(95% confidence level) values for all the parametersand a good fitting to the experimental data was found.The KAS values for both the SDS and NaClO4 electro-lytes in three different nonaqueous media are shown inTable 4.
Table 4. Conductivity data and KAS values for ion-pairformation of Na1DS2 and Na1ClO4
2 in MeOH/ACN mixtures, according to Section 4.3
Solvent Electro-lyte
Concen-tration,(mol/L)6103
La) L0a) KAS
MeOH SDS 0.39–39 76.7–48.8 82 6 2 20 6 1NaClO4 0.10–40 99.1–71.1 101 6 6 15 6 7
50% v/v SDS 2.2–42 94.5–62.9 112 6 4 43 6 1MeOH/ACN NaClO4 0.46–40 161.7–117.0 172 6 9 41 6 820% v/v SDS 0.50–5.0 48.1–38.0 56 6 4 50 6 2MeOH/ACN NaClO4 0.95–38 95.0–73.4 110 6 15 43 6 3
Number of points = 14.a) L and L0 in S?cm2/mol
2006 WILEY-VCH Verlag GmbH & Co. KGaA, Weinheim www.electrophoresis-journal.com
Electrophoresis 2006, 27, 423–432 CE and CEC 429
It should be stressed that the association for Na1DS2 issimilar to that for Na1ClO4
2 at 100 and 50% v/v MeOH,whereas it is little stronger at 20% v/v MeOH. Additionally,the association increases as the proportion of ACNincreases for both electrolytes.
3.4 Components of effective electrophoreticmobilities of the analytes in 50% v/v MeOH/ACN at different SDS concentrations
Separation media were prepared in 50% v/v MeOH/ACN,7.561023 mol/L HClO4, modifying the concentration ofSDS added (from 5 to 4061023 mol/L). The ionic strengthin this medium is shown in Table 5. The free anion con-centrations and ionic strength were calculated from theKAS values for the Na1DS2 and Na1ClO4
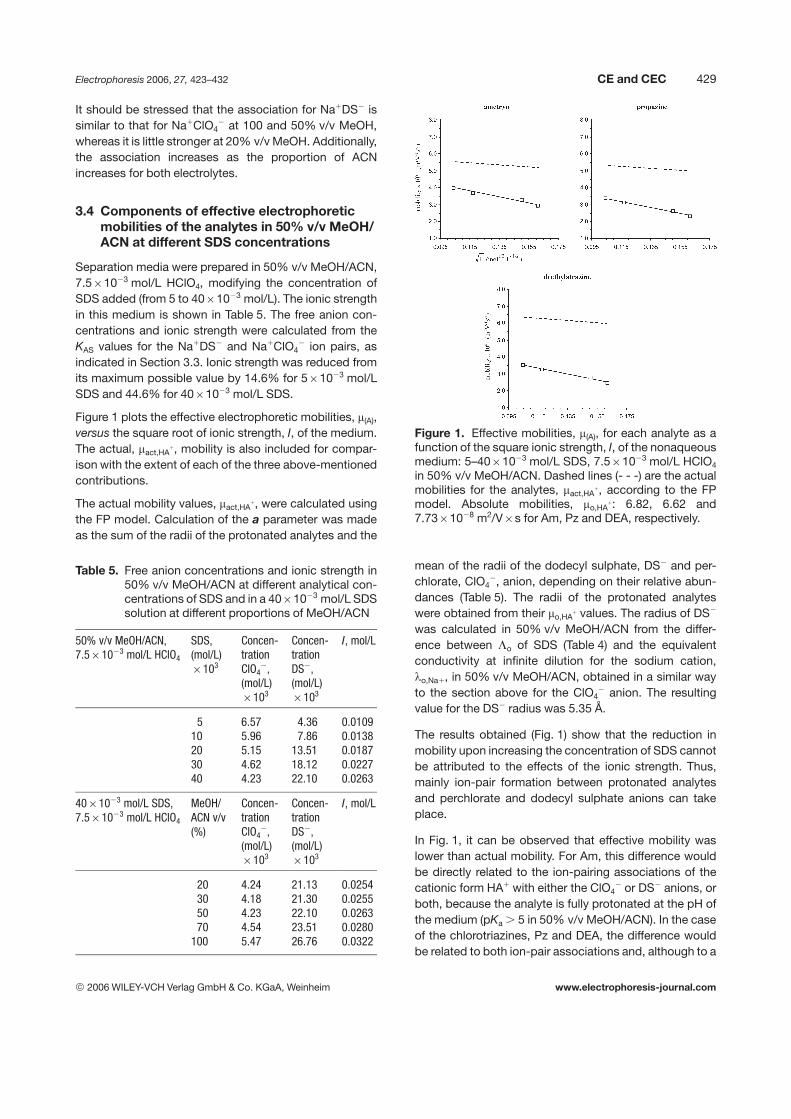
2 ion pairs, asindicated in Section 3.3. Ionic strength was reduced fromits maximum possible value by 14.6% for 561023 mol/LSDS and 44.6% for 4061023 mol/L SDS.
Figure 1 plots the effective electrophoretic mobilities, m(A),versus the square root of ionic strength, I, of the medium.The actual, mact,HA
1, mobility is also included for compar-ison with the extent of each of the three above-mentionedcontributions.
The actual mobility values, mact,HA1, were calculated using
the FP model. Calculation of the a parameter was madeas the sum of the radii of the protonated analytes and the
Table 5. Free anion concentrations and ionic strength in50% v/v MeOH/ACN at different analytical con-centrations of SDS and in a 4061023 mol/L SDSsolution at different proportions of MeOH/ACN
50% v/v MeOH/ACN,7.561023 mol/L HClO4
SDS,(mol/L)6103
Concen-trationClO4
2,(mol/L)6103
Concen-trationDS2,(mol/L)6103
I, mol/L
5 6.57 4.36 0.010910 5.96 7.86 0.013820 5.15 13.51 0.018730 4.62 18.12 0.022740 4.23 22.10 0.0263
4061023 mol/L SDS,7.561023 mol/L HClO4
MeOH/ACN v/v(%)
Concen-trationClO4
2,(mol/L)6103
Concen-trationDS2,(mol/L)6103
I, mol/L
20 4.24 21.13 0.025430 4.18 21.30 0.025550 4.23 22.10 0.026370 4.54 23.51 0.0280
100 5.47 26.76 0.0322
Figure 1. Effective mobilities, m(A), for each analyte as afunction of the square ionic strength, I, of the nonaqueousmedium: 5–4061023 mol/L SDS, 7.561023 mol/L HClO4
in 50% v/v MeOH/ACN. Dashed lines (- - -) are the actualmobilities for the analytes, mact,HA
1, according to the FPmodel. Absolute mobilities, mo,HA
1: 6.82, 6.62 and7.7361028 m2/V6s for Am, Pz and DEA, respectively.
mean of the radii of the dodecyl sulphate, DS2 and per-chlorate, ClO4
2, anion, depending on their relative abun-dances (Table 5). The radii of the protonated analyteswere obtained from their mo,HA
1 values. The radius of DS2
was calculated in 50% v/v MeOH/ACN from the differ-ence between Lo of SDS (Table 4) and the equivalentconductivity at infinite dilution for the sodium cation,lo,Na1, in 50% v/v MeOH/ACN, obtained in a similar wayto the section above for the ClO4
2 anion. The resultingvalue for the DS2 radius was 5.35 Å.
The results obtained (Fig. 1) show that the reduction inmobility upon increasing the concentration of SDS cannotbe attributed to the effects of the ionic strength. Thus,mainly ion-pair formation between protonated analytesand perchlorate and dodecyl sulphate anions can takeplace.
In Fig. 1, it can be observed that effective mobility waslower than actual mobility. For Am, this difference wouldbe directly related to the ion-pairing associations of thecationic form HA1 with either the ClO4
2 or DS2 anions, orboth, because the analyte is fully protonated at the pH ofthe medium (pKa . 5 in 50% v/v MeOH/ACN). In the caseof the chlorotriazines, Pz and DEA, the difference wouldbe related to both ion-pair associations and, although to a
2006 WILEY-VCH Verlag GmbH & Co. KGaA, Weinheim www.electrophoresis-journal.com
430 R. Carabias-Martínez et al. Electrophoresis 2006, 27, 423–432
lesser extent, their acid–base equilibria (pKa approx. 3).With knowledge of the values of KHA
1DS
2 from the datarelating to effective mobilities upon varying the con-centrations of SDS, it is possible to deduce the values ofKHA
1DS
2, Eq. (6). The association constants with thedodecyl sulfate anion are higher than those obtained forthe perchlorate anion. The association constants,KHA
1DS
2, found were 32.2, 44.7 and 53.6 for Am, Pz andDEA, respectively.
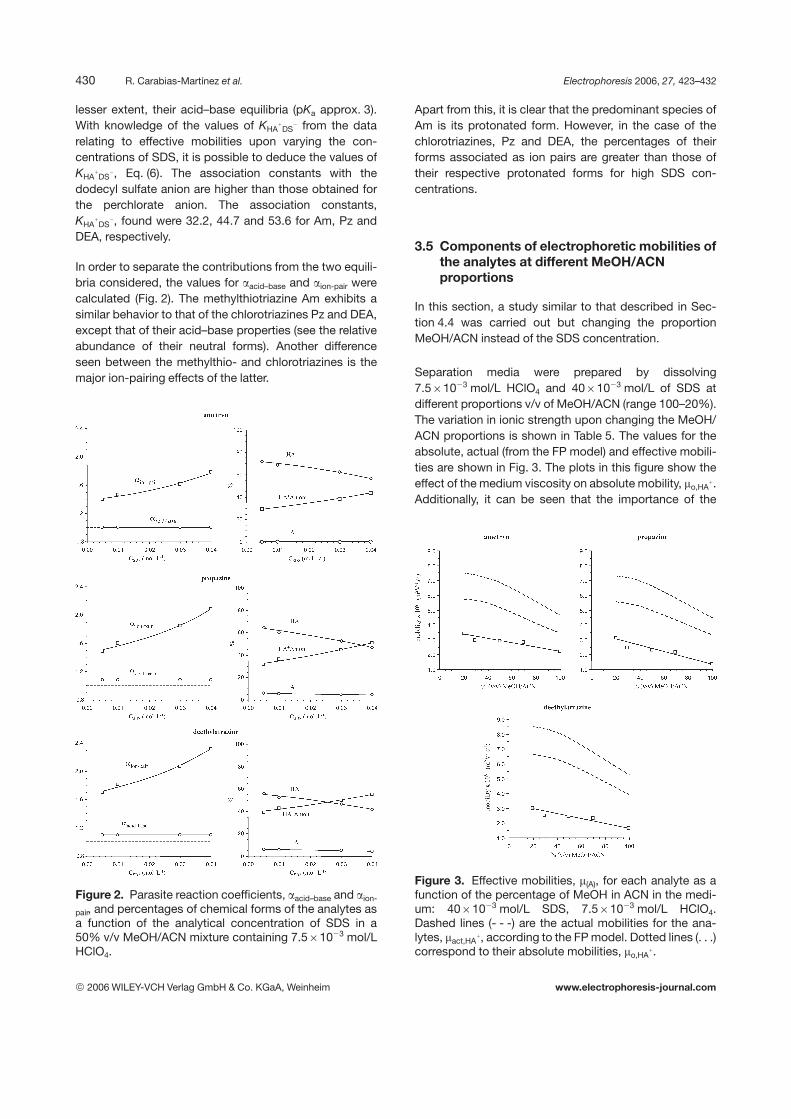
In order to separate the contributions from the two equili-bria considered, the values for aacid–base and aion-pair werecalculated (Fig. 2). The methylthiotriazine Am exhibits asimilar behavior to that of the chlorotriazines Pz and DEA,except that of their acid–base properties (see the relativeabundance of their neutral forms). Another differenceseen between the methylthio- and chlorotriazines is themajor ion-pairing effects of the latter.
Figure 2. Parasite reaction coefficients, aacid–base and aion-
pair, and percentages of chemical forms of the analytes asa function of the analytical concentration of SDS in a50% v/v MeOH/ACN mixture containing 7.561023 mol/LHClO4.
Apart from this, it is clear that the predominant species ofAm is its protonated form. However, in the case of thechlorotriazines, Pz and DEA, the percentages of theirforms associated as ion pairs are greater than those oftheir respective protonated forms for high SDS con-centrations.
3.5 Components of electrophoretic mobilities ofthe analytes at different MeOH/ACNproportions
In this section, a study similar to that described in Sec-tion 4.4 was carried out but changing the proportionMeOH/ACN instead of the SDS concentration.
Separation media were prepared by dissolving7.561023 mol/L HClO4 and 4061023 mol/L of SDS atdifferent proportions v/v of MeOH/ACN (range 100–20%).The variation in ionic strength upon changing the MeOH/ACN proportions is shown in Table 5. The values for theabsolute, actual (from the FP model) and effective mobili-ties are shown in Fig. 3. The plots in this figure show theeffect of the medium viscosity on absolute mobility, mo,HA
1.Additionally, it can be seen that the importance of the
Figure 3. Effective mobilities, m(A), for each analyte as afunction of the percentage of MeOH in ACN in the medi-um: 4061023 mol/L SDS, 7.561023 mol/L HClO4.Dashed lines (- - -) are the actual mobilities for the ana-lytes, mact,HA
1, according to the FP model. Dotted lines (. . .)correspond to their absolute mobilities, mo,HA
1.
2006 WILEY-VCH Verlag GmbH & Co. KGaA, Weinheim www.electrophoresis-journal.com
Electrophoresis 2006, 27, 423–432 CE and CEC 431
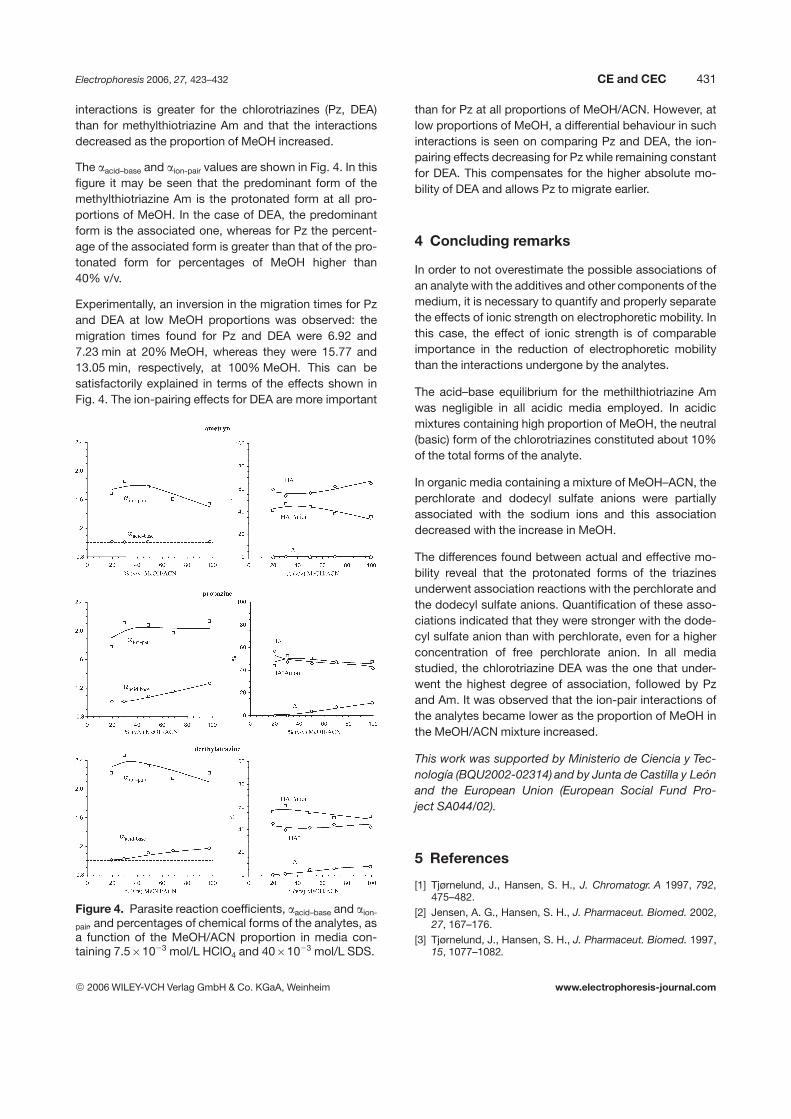
interactions is greater for the chlorotriazines (Pz, DEA)than for methylthiotriazine Am and that the interactionsdecreased as the proportion of MeOH increased.
The aacid–base and aion-pair values are shown in Fig. 4. In thisfigure it may be seen that the predominant form of themethylthiotriazine Am is the protonated form at all pro-portions of MeOH. In the case of DEA, the predominantform is the associated one, whereas for Pz the percent-age of the associated form is greater than that of the pro-tonated form for percentages of MeOH higher than40% v/v.
Experimentally, an inversion in the migration times for Pzand DEA at low MeOH proportions was observed: themigration times found for Pz and DEA were 6.92 and7.23 min at 20% MeOH, whereas they were 15.77 and13.05 min, respectively, at 100% MeOH. This can besatisfactorily explained in terms of the effects shown inFig. 4. The ion-pairing effects for DEA are more important
Figure 4. Parasite reaction coefficients, aacid–base and aion-
pair, and percentages of chemical forms of the analytes, asa function of the MeOH/ACN proportion in media con-taining 7.561023 mol/L HClO4 and 4061023 mol/L SDS.
than for Pz at all proportions of MeOH/ACN. However, atlow proportions of MeOH, a differential behaviour in suchinteractions is seen on comparing Pz and DEA, the ion-pairing effects decreasing for Pz while remaining constantfor DEA. This compensates for the higher absolute mo-bility of DEA and allows Pz to migrate earlier.
4 Concluding remarks
In order to not overestimate the possible associations ofan analyte with the additives and other components of themedium, it is necessary to quantify and properly separatethe effects of ionic strength on electrophoretic mobility. Inthis case, the effect of ionic strength is of comparableimportance in the reduction of electrophoretic mobilitythan the interactions undergone by the analytes.
The acid–base equilibrium for the methilthiotriazine Amwas negligible in all acidic media employed. In acidicmixtures containing high proportion of MeOH, the neutral(basic) form of the chlorotriazines constituted about 10%of the total forms of the analyte.
In organic media containing a mixture of MeOH–ACN, theperchlorate and dodecyl sulfate anions were partiallyassociated with the sodium ions and this associationdecreased with the increase in MeOH.
The differences found between actual and effective mo-bility reveal that the protonated forms of the triazinesunderwent association reactions with the perchlorate andthe dodecyl sulfate anions. Quantification of these asso-ciations indicated that they were stronger with the dode-cyl sulfate anion than with perchlorate, even for a higherconcentration of free perchlorate anion. In all mediastudied, the chlorotriazine DEA was the one that under-went the highest degree of association, followed by Pzand Am. It was observed that the ion-pair interactions ofthe analytes became lower as the proportion of MeOH inthe MeOH/ACN mixture increased.
This work was supported by Ministerio de Ciencia y Tec-nología (BQU2002-02314) and by Junta de Castilla y Leónand the European Union (European Social Fund Pro-ject SA044/02).
5 References
[1] Tjørnelund, J., Hansen, S. H., J. Chromatogr. A 1997, 792,475–482.
[2] Jensen, A. G., Hansen, S. H., J. Pharmaceut. Biomed. 2002,27, 167–176.
[3] Tjørnelund, J., Hansen, S. H., J. Pharmaceut. Biomed. 1997,15, 1077–1082.
2006 WILEY-VCH Verlag GmbH & Co. KGaA, Weinheim www.electrophoresis-journal.com
432 R. Carabias-Martínez et al. Electrophoresis 2006, 27, 423–432
[4] Carabias-Martínez, R., Rodríguez-Gonzalo, E., Domínguez-Álvarez, J., Hernández-Méndez, J., Anal. Chem. 1997, 69,4437–4444.
[5] Cottet, H., Struijk, M. P., Van Dongen, J. L. J., Claessens, H.A., Cramers, C. A., J. Chromatogr. A 2001, 915, 241–251.
[6] Bowser, M. T., Kranack, A. R., Chen, D. D. Y., Trends Anal.Chem. 1998, 17, 424–434.
[7] Wang, F., Khaledi, M. G., J. Chromatogr. B 1999, 731, 187–197.
[8] Mori, Y., Ueno, K., Umeda, T., J. Chromatogr. A 1997, 757,328–332.
[9] Lammerhofer, M., Zarbl, E., Lindner, W., J. Chromatogr. A2000, 892, 509–521.
[10] Karbaum, A., Jira, T., J. Chromatogr. A 2000, 874, 285–292.[11] Chen, Y. H., Chung, Y. L., Lin, C. H., J. Chromatogr. A 2002,
943, 287–294.[12] Carabias-Martínez, R., Rodríguez-Gonzalo, E., Domínguez-
Álvarez, J., Hernández-Méndez, J., J. Chromatogr. A 2000,869, 451–461.
[13] Walbroehl, Y., Jorgenson, J. W., Anal. Chem. 1986, 58, 479–481.
[14] Vaher, M., Koel, M., Kaljurand, M., J. Chromatogr. A 2002,979, 27–32.
[15] Morales, S., Cela, R., J. Chromatogr. A 2000, 896, 95–104.[16] Porras, S. P., Valkó, I. E., Jyske, P., Riekkola, M. L., J. Bio-
chem. Biophys. Methods 1999, 38, 89–102.[17] Descroix, S., Varenne, A., Goasdoue, N., Abian, J., Carras-
cal, M., Daniel, R., Gareil, P., J. Chromatogr. A 2003, 987,467–476.
[18] Tjørnelund, J., Hansen, S. H., J. Chromatogr. A 1997, 779,235–243.
[19] Descroix, S., Varenne, A., Geiser, L., Cherkaoui, S., Veuthey,J.-L., Gareil, P., Electrophoresis 2003, 24, 1577–1586.
[20] Porras, S. P., Riekkola, M. L., Kenndler, E., J. Chromatogr. A2001, 924, 31–42.
[21] Roy, K. I., Lucy, C. A., J. Chromatogr. A 2002, 964, 213–225.[22] Porras, S. P., Riekkola, M. L., Kenndler, E., Electrophoresis
2003, 24, 1485–1498.[23] Dai, J., Mendosa, S. D., Boewer, M.-T., Lucy, Ch. A., Carr, P.
W., J. Chromatogr. A 2005, 1072, 169–184.[24] Chmurzynski, L., Pawlak, Z., J. Chem. Thermodynam. 1998,
30, 27–35.[25] Bjørnsdottir, I., Hasen, S. H., Terabe, S., J. Chromatogr. A
1996, 745, 37–44.[26] Stefansson, M., Novotny, M., Anal. Chem. 1994, 66, 3466–
3471.[27] Bockris, J. O’. M., Reddy, A. K. N., Modern Electrochemistry
1: Ionics, 2nd Edn., Plenum Press, New York 1998.[28] Falkenhagen, H., Leist, M., Kelbg, G., Ann. Phys. 1952, 11,
51–59.[29] Pitts, E., Proc. Roy. Soc. (London) 1953, 217A, 43–70.[30] Robinson, R. A., Stokes, R. H., Electrolyte Solution, Butter-
worths Scientific Publications, London 1955.[31] Williams, A. B., Vigh, G., Anal. Chem. 1996, 68, 1174–1180.[32] Weber, J. B., Residue Rev. 1970, 32, 93–130.[33] Loos, R., Niessner, R., J. Chromatogr. A 1999, 835, 217–
229.[34] Wróbel, R., Kaczmarczyk, E., Chmurzynski, L., J. Chem.
Thermodynamics 1999, 31, 1561–1571.[35] Kolthoff, I. M., Bruckestein, S., Chantooni, M. K., J. Am.
Chem. Soc. 1961, 83, 3927–3935.[36] Coetzee, J. F., Kolthoff, I. M., J. Am. Chem. Soc. 1957, 79,
6110–6115.[37] Janz, G. J., Tomkins, R. P. T., Nonaqueous Electrolytes
Handbook, Vol. 1, Academic Press, New York 1972.
2006 WILEY-VCH Verlag GmbH & Co. KGaA, Weinheim www.electrophoresis-journal.com