Fuzzy Pre Generalized Pre Regular Weakly Homeomorphism ...
74
International Journal of Computer Applications Technology and Research Volume 7–Issue 02, 28-34, 2018, ISSN:-2319–8656 35 Fuzzy Pre Generalized Pre Regular Weakly Homeomorphism in Fuzzy Topological Spaces Vivekananda Dembre Assistant-Professor Department of Mathematics, Sanjay Ghodawat University, Kolhapur, India. Sandeep.N.Patil Assistant Professor, Department of Civil Engineering, Sanjay Ghodawat Polytechnic, Kolhapur,India Abstract: In this paper we introduce and study two new fuzzy homeomorphisms,namely fuzzy pgprw-homeomorphism and fuzzy pgprw-closed homeomorphism.We prove that every fuzzy homeomorphism is fuzzy pgprw-homeomorphism and we prove that the composition of two fuzzy pgprw closed homeomorphism is a pgprw-homeomorphism. Keywords: fuzzy pgprw-homeomorphism, fuzzy pgprw-closed set, fuzzy pgprw-open set. 1. INTRODUCTION The concept of a fuzzy subset was introduced and studied by L.A.Zadeh in the year 1965. The subsequent research activities in this area and related areas have found applications in many branches of science and engineering. In the year 1965, L.A.Zadeh [1] introduced the concept of fuzzy subset as a generalization of that of an ordinary subset. The introduction of fuzzy subsets paved the way for rapid research work in many areas of mathematical science. In the year 1968, C.L.Chang [2] introduced the concept of fuzzy topological spaces as an application of fuzzy sets to topological spaces . Subsequently several researchers contributed to the development of the theory and applications of fuzzy topology. The theory of fuzzy topological spaces can be regarded as a generalization theory of topological spaces. An ordinary subset A or a set X can be characterized by a function called characteristic function A : X [0,1] of A, defined by A (x) = 1, if x A. = 0, if x A. Thus an element x in A if A (x) = 1 and is not in A if A (x) = 0. In general if X is a set and A is a subset of X then A has the following representation. A = { ( x , A (x)):x X}, here A (x) may be regarded as the degree of belongingness of x to A, which is either 0 or 1. Hence A is the class of objects with degree of belongingness either 0 or 1 only. Prof. L.A.Zadeh [1] introduced a class of objects with continuous grades of belongingness ranging between 0 and 1 ; he called such a class as fuzzy subset. A fuzzy subset A in X is characterized as a membership function A : X [0,1] , which associates with each point in x a real number A(x) between 0 and 1 which represents the degree or grade membership of belongingness of x to A. The purpose of this paper is to introduce a new class of fuzzy sets called fuzzy pgprw-closed sets in fuzzy topological spaces and investigate certain basic properties of these fuzzy sets. Among many other results it is observed that every fuzzy closed set is fuzzy pgprw-closed but conversely.Also we introduce fuzzy pgprw-open sets in fuzzy topological spaces and study some of their properties. 1. PRELIMINARIES 1.1Definition:[1]A fuzzy subset A in a set X is a function A : X → [0, 1]. A fuzzy subset in X is empty iff its membership function is identically 0 on X and is denoted by 0 or ϕ.The set X can be considered as a fuzzy subset of X whose membership function is identically 1 on X and is denoted by x or Ix. In fact every subset of X is a fuzzy subset of X but not conversely. Hence the concept of a fuzzy subset is a generalization of the concept of a subset. 1.2 Defnition :[1] If A and B are any two fuzzy subsets of a set X , thenA is said to be included in B or A is contained in B iff A(x) ≤ B(x) for all x in X. Equivalently, A ≤ B iff A(x) ≤ B(x) for all x in X. 1.3 Defnition: [1]Two fuzzy subsets A and B are said to be equal if A(x) = B(x) for every x in X. Equivalently A = B if A(x) = B(x) for every x in X. 1.4Defnition:[1] The complement of a fuzzy subset A in a set X, denoted by A′ or 1 − A, is the fuzzy subset of X defined by A′(x) = 1 − A(x) for all x in X. Note that(A′ )′ = A. 1.5 Defnition:[1] The union of two fuzzy subsets A and B in X, denoted by A ∨ B, is a fuzzy subset in X defined by (A ∨ B)(x) = Max{ A(x), B(X)} for all x in X.
-
Upload
khangminh22 -
Category
Documents
-
view
1 -
download
0
Transcript of Fuzzy Pre Generalized Pre Regular Weakly Homeomorphism ...

International Journal of Computer Applications Technology and Research
Volume 7–Issue 02, 28-34, 2018, ISSN:-2319–8656
35
Fuzzy Pre Generalized Pre Regular Weakly Homeomorphism in Fuzzy Topological Spaces
Vivekananda Dembre
Assistant-Professor
Department of Mathematics,
Sanjay Ghodawat University, Kolhapur, India.
Sandeep.N.Patil
Assistant Professor,
Department of Civil Engineering,
Sanjay Ghodawat Polytechnic, Kolhapur,India
Abstract: In this paper we introduce and study two new fuzzy homeomorphisms,namely fuzzy pgprw-homeomorphism and fuzzy
pgprw-closed homeomorphism.We prove that every fuzzy homeomorphism is fuzzy pgprw-homeomorphism and we prove that the
composition of two fuzzy pgprw closed homeomorphism is a pgprw-homeomorphism.
Keywords: fuzzy pgprw-homeomorphism, fuzzy pgprw-closed set, fuzzy pgprw-open set.
1. INTRODUCTION The concept of a fuzzy subset was introduced and studied by
L.A.Zadeh in the year 1965. The subsequent research
activities in this area and related areas have found applications
in many branches of science and engineering. In the year
1965, L.A.Zadeh [1] introduced the concept of fuzzy subset
as a generalization of that of an ordinary subset. The
introduction of fuzzy subsets paved the way for rapid research
work in many areas of mathematical science. In the year 1968,
C.L.Chang [2] introduced the concept of fuzzy topological
spaces as an application of fuzzy sets to topological spaces .
Subsequently several researchers contributed to the
development of the theory and applications of fuzzy topology.
The theory of fuzzy topological spaces can be regarded as a
generalization theory of topological spaces. An ordinary
subset A or a set X can be characterized by a function called
characteristic function
A : X [0,1] of A, defined by
A (x) = 1, if x A.
= 0, if x A.
Thus an element x in A if A (x) = 1 and is not in A
if A (x) = 0. In general if X is a set and A is a subset of X
then A has the following representation. A = { ( x , A
(x)):x X}, here A (x) may be regarded as the degree of
belongingness of x to A, which is either 0 or 1.
Hence A is the class of objects with degree of belongingness
either 0 or 1 only. Prof. L.A.Zadeh [1] introduced a class of
objects with continuous grades of belongingness ranging
between 0 and 1 ; he called such a class as fuzzy subset. A
fuzzy subset A in X is characterized as a membership function
A : X [0,1] , which associates with each point in x a
real number A(x) between 0 and 1 which represents the
degree or grade membership of belongingness of x to A.
The purpose of this paper is to introduce a new class of fuzzy
sets called fuzzy pgprw-closed sets in fuzzy topological
spaces and investigate certain basic properties of these fuzzy
sets. Among many other results it is observed that every fuzzy
closed set is fuzzy pgprw-closed but conversely.Also we
introduce fuzzy pgprw-open sets in fuzzy topological spaces
and study some of their properties.
1. PRELIMINARIES
1.1Definition:[1]A fuzzy subset A in a set X is a function A :
X → [0, 1]. A fuzzy subset in X is empty iff its membership
function is identically 0 on X and is denoted by 0 or ϕ.The
set X can be considered as a fuzzy subset of X whose
membership function is identically 1 on X and is denoted by
x or Ix. In fact every subset of X is a fuzzy subset of X but
not conversely. Hence the concept of a fuzzy subset is a
generalization of the concept of a subset.
1.2 Defnition :[1] If A and B are any two fuzzy subsets of a
set X , thenA is said to be included in B or A is contained in B
iff A(x) ≤ B(x) for all x in X. Equivalently, A ≤ B iff A(x) ≤
B(x) for all x in X.
1.3 Defnition: [1]Two fuzzy subsets A and B are said to be
equal if A(x) = B(x) for every x in X.
Equivalently A = B if A(x) = B(x) for every x in X.
1.4Defnition:[1] The complement of a fuzzy subset A in a set
X, denoted by A′ or 1 − A, is the fuzzy subset of X defined by
A′(x) = 1 − A(x) for all x in X. Note that(A′)′ = A.
1.5 Defnition:[1] The union of two fuzzy subsets A and B in
X, denoted by A ∨ B, is a fuzzy subset in X defined by (A ∨
B)(x) = Max{ A(x), B(X)} for all x in X.

International Journal of Computer Applications Technology and Research
Volume 7–Issue 02, 28-34, 2018, ISSN:-2319–8656
36
1.6 Defnition:[1]The intersection of two fuzzy subsets A and
X is ‘Crisp‘ if it takes only the values 0 and 1 on X.
1.7 Defnition:[1] A fuzzy set on X is ‘Crisp‘ if it takes only
the values 0 and 1 on X.
1.8 Defnition:[2]Let X be a set and be a family of fuzzy
subsets of ( X, ) is called a fuzzy topology on X iff
satisfies the following conditions.
(i) ϕ ; X ∈ : That is 0 and 1 ∈
(ii) If Gi ∈ for i ∈ I then ∨ Gi ∈
i
(iii) If G,H ∈ then G ∧ H ∈
The pair (X, ) is called a fuzzy topological space
(abbreviated as fts). The members of are called fuzzy open
sets and a fuzzy set A in X is said to be closed iff 1 − A is an
fuzzy open set in X.
1.9 Remark :[2] Every topological space is a fuzzy
topological space but not conversely.
1.10 Defnition:[2]Let X be a fts and A be a fuzzy subset in X.
Then ∧ {B : B is a closed fuzzy set in Xand B ≥ A} is called
the closure of A and is denoted by A or cl(A).
1.11 Defnition:[2]Let A and B be two fuzzy sets in a fuzzy
topological space (X, )and let A ≥ B. Then B is called an
interior fuzzy set of A if there exists G ∈ such that A ≥ G ≥
B, the least upper bound of all interior fuzzy sets of A is
called the interior of A and is denoted by A0.
1.12 Definition[3] A fuzzy set A in a fts X is said to be fuzzy
semiopen if and only if there exists a fuzzy open set V in X
such that V A cl(V).
1.13 Definition[3] A fuzzy set A in a fts X is said to be fuzzy
semi-closed if and only if there exists a fuzzy closed set V in
X such that int(V) A V. It is seen that a fuzzy set A is
fuzzy semiopen if and only if 1-A is a fuzzy semi-closed.
1.14 Theorem:[3] The following are equivalent:
(a) is a fuzzy semiclosed set,
(b) C is a fuzzy semiopen set,
(c) int(cl( )) .
(b) int(cl( )) c
1.15 Theorem [3] Any union of fuzzy semiopen sets is a
fuzzy semiopen set and (b) any intersection of fuzzy semi
closed sets is a fuzzy semi closed.
1.16 Remark[3]
(i) Every fuzzy open set is a fuzzy semiopen but not
conversely.
(ii) Every fuzzy closed set is a fuzzy semi-closed set but not
conversely.
(iii) The closure of a fuzzy open set is fuzzy semiopen set
(iv) The interior of a fuzzy closed set is fuzzy semi-closed set
1.17Definition:[3] A fuzzy set of a fts X is called a fuzzy
regular open set of X if int(cl( ).= .
1.18 Definition:[3] A fuzzy set of fts X is called a fuzzy
regular closed set of X if cl(int( )) = .
1.19 Theorem:[3] A fuzzy set of a fts X is a fuzzy regular
open if and only if C fuzzy regular closed set.
1.20 Remark:[3]
(i) Every fuzzy regular open set is a fuzzy open set but not
conversely.
(ii) Every fuzzy regular closed set is a fuzzy closed set but not
conversely.
1.21 Theorem:[3]
(i) The closure of a fuzzy open set is a fuzzy regularclosed.
(ii) The interior of a fuzzy closed set is a fuzzy regular open
set.
1.22 Definition:[4] A fuzzy set in fts X is called fuzzy rw
closed if cl( ) whenever and is regular
semi-open in X.
1.23 Definition [5]: A fuzzy set in fts X is called fuzzy
pgprw closed if p-cl( ) whenever and is
rg open set in X.
1.24 Defintion [5]:A fuzzy set of a fts X is fuzzy pgprw-
open set, if it’s complement c is a fuzzy pgprw-closed in fts
X.
1.25 Defintion[6]: Let X and Y be two fts. A map

International Journal of Computer Applications Technology and Research
Volume 7–Issue 02, 28-34, 2018, ISSN:-2319–8656
37
f: (X,T) (Y,T) is called fuzzy pgprw-open map if the
inverse image of every fuzzy open set in X is fuzzy pgprw-
open in Y.
1.26 Defintion[6]:Let X and Y be two fuzzy topological
spaces. A map f: (X,T) (Y,T) is called fuzzy pgprw-
closed map if the image of every fuzzy closed set in X is a
fuzzy pgprw closed set in Y.
1.27 Definition[7]:Let X and Y be fts. A map f: X Y is
said to be fuzzy pgprw-continuous if the inverse image of
every fuzzy open set in Y is fu
1.28 Definition[7]: Let X and Y be fts. A map f: X Y is
said to be a fuzzy pgprw-irresoulute map if the inverse image
of every fuzzy pgprw-open in Y is a fuzzy pgprw-open set in
X.
1.29 definition [2]: Let X and Y be fts. A map f: X Y is
said to be a fuzzy continuous mapping if f -1( ) is fuzzy open
in X for each fuzzy open set in Y.
1.30 Definition [8]: Let X and Y be fts. A map f: X Y is
said to be a fuzzy -irresoulute map if the inverse image of
every fuzzy semi-open in Y is a fuzzy semi-open set in X.
1.31 Definition [9]: Let X and Y be fts. A bijection f: X Y
is said to be a fuzzy-homeomorphism Iff f and f – 1 are fuzzy
continuous.
2. Fuzzy pgprw-homeomorphism in fuzzy
topological spaces.
Definition 2.1: Let X and Y be fts. A bijective map
f: (X,T1) (Y,T2) is called fuzzy pgprw-homeomorphism if
f and f -1 are fuzzy pgprw-continuous map.
The family of all fuzzy pgprw-homeomorphism from (X,T)
on to itself is denoted by fuzzy pgprw-Homeomorphism
(X,T).
Theorem 2.2: Every fuzzy homeomorphism is fuzzy pgprw-
homeomorphism.
Proof: Let a map f:(X,T1) (Y,T2) be a fuzzy
homeomorphism. Then f and f -1 are fuzzy continuous map.
Since every fuzzy continuous map is fuzzy pgprw-continuous
map f and f -1 are fuzzy pgprw-continuous map therefore f is
fuzzy a pgprw-homeomorphism.
The converse of the above theorem need not be true as seen
from the following example.
Example 2.3:Let X=Y= {a, b, c,d} and the functions ,
: X [0, 1] be defined as
(x) = 1 if x = a
0 otherwise
(x) = 1 if x = b
0 otherwise
(x) = 1 if x = a,b,c
0 otherwise.
Consider T1={0,1, , } and T2 = { 0,1, , }
then (X,T1)and (Y,T2) are fts .Define a map f :(X,T1)
(Y,T2) by f(a)=c,f(b)=a,f(c)=b,f(d)=d then f is fuzzy pgprw-
homeomorphism but it is not fuzzy homeomorphism,as the
image of closed set in X is not fuzzy closed set in (Y,T2).
Theorem 2.4: Let X and Y be fuzzy topological spaces and f:
(X,T1) (Y,T2) be a bijective map.
Then the following statements are equivalent.
(a) f -1 is fuzzy pgprw continuous map.
(b) f is fuzzy pgprw-open map.
(c) f is fuzzy pgprw-closed map.
Proof: (a) implies (b) Let be any fuzzy open set in X.Since
f -1 is fuzzy pgprw continuous map,(f-1)-1( )=f(( ) is fuzzy
pgprw-open in Y. Hence f is fuzzy pgprw-open map.
(b)implies(c) Let be any fuzzy closed set in X. Then 1-
is fuzzy pgprw-open in x.Since f is a fuzzy pgprw-open,f(1-
) is fuzzy pgprw-open in Y.but f(1- )= 1- f( , as f is a
bijective map. Hence f( pgprw set in
Y.Therefore f is fuzzy pgprw-closed map.
(c) implies (a) Let be any fuzzy closed set in X. Then f( )
is a fuzzy pgprw closed set in Y but (f-1)- 1( = f(
Therefore f – 1 fuzzy pgprw-continuous map.
Theorem 2.5: Let X and Y be fuzzy topological spaces and f:
(X,T1) (Y,T2) be a bijective and fuzzy pgprw-continuous
map.Then the following statements are equivalent.
(a) f is fuzzy pgprw open map.
(b) f is fuzzy pgprw-homeomorphism.
(c) f is fuzzy pgprw-closed map.
Proof: (a) implies (b) by hypothesis and assumption f is a
fuzzy pgprw-homeomorphism

International Journal of Computer Applications Technology and Research
Volume 7–Issue 02, 28-34, 2018, ISSN:-2319–8656
38
(b) implies (c) since f is fuzzy pgprw-homeomorphism, it is
fuzzy pgprw-open,so by the above theorem 2.4 it is a fuzzy
pgprw-closed map.
(c) implies (b) Let be any fuzzy open set in X. so that 1-
is a closed set and f being pgprw-closed,f( 1- ) is fuzzy
pgprw-closed in Y.but f(1- )= 1- f( , thus f ( )
pgprw open set in Y.Therefore f is fuzzy pgprw-
open map.
Defintion 2.6 : A bijective map f:( X,T1) (Y,T2)is called
a fuzzy pgprw-closed homeomorphism. If f and f -1 are fuzzy
pgprw-irresolute map. We say that spaces (X,T1) and (Y,T2)
are fuzzy pgprw closed homeomorphism if there exist a fuzzy
pgprw-closed homomorphism from (X,T1) onto (Y,T2).
The family of all fuzzy pgprw-homeomorphism from (X,T)
onto itself is denoted by fpgprw-h(X,T).
Theorem 2.7: Every fuzzy pgprw closed homeomorphism is
fuzzy pgprw-homeomorphism but not conversely.
Proof: The proof follows from the fact that every fuzzy
pgprw-irresolute map is fuzzy pgprw-continuous map but not
conversely.
Theorem 2.8: Let (X,T1), (Y,T2) & (Z,T3) be a fts and
f:(X,T1) (Y,T2),g:(Y,T2) (Z,T3) be fuzzy Pgprw-
homeomorphism.Then their composition gof:(X,T1) (Z,T3)
is a fuzzy is a fuzzy pgprw-closed homeomorphism.
Proof: Let be a fuzzy pgprw-open set in (Z,T3),Since g is a
fuzzy pgprw-irresolute map,g-1( ) is a fuzzy pgprw-open set
in (Y,T2).Since f is a fuzzy pgprw-irreolute map,f - 1(g- 1( ) is
a fuzzy pgprw-open set in (X,T1) but f - 1(g -1 ( )==(gof) -1
=(gof)- 1( ). Therefore (gof) is fuzzy pgprw-irresolute map.
To prove: (gof) – 1 is fuzzy pgprw-iresolute map. Let be a
fuzzy pgprw-open set in (X,T1).Since f -1 is fuzzy pgprw-
irresolute map,(f – 1)-1 ( ) is a fuzzy pgprw –open set in (Y,T2)
also( f -1)- 1( )= f( ). Since g- 1 is fuzzy pgprw-irresolute
map, ((g- 1)-1)(f( ) is a fuzzy pgprw-open set in (Z,T3) that is
((g- 1)-1)(f( ))=g(f( =(gof)( )= ((gof)- 1) -1( ). Therefore
(gof)- 1 is fuzzy pgprw-irresolute map.Thus gof and (gof)- 1 are
fuzzy pgprw-irresolute map. Hence gof is fuzzy pgprw-closed
homeomorphism.
Theorem 2.9: The set fuzzy pgprw-closed homeomorphism
(X,T) is a group under the composition map.
Proof: Define a binary operation* f-pgprw closed
homeomorphism (X,T) f-pgprw closed homeomorphism
(X,T) f pgprwc-h(X,T) by By f*g=gof for all f,g f
pgprwc-h(X,T) and o is the usual operation of composition of
maps.Then by theorem 2.8,gof f pgprw closed h(X,T) we
know that, the composition of maps is associate and the
identity map I:(X,T) (X,T) belonging to fuzzy pgprw
closed-h(X,T) serves as the identity element. If f fpgprw
closed-h(X,T)then f - 1 fpgprw closed-h(X,T) s.t fof -1 = f -
1of=I and so inverse exist for each element of f pgprw-c-
h(X,T), Therefore [ f pgprw-c-h(X,T),o] is a group under the
operation of composition of maps.
Theorem 2.10: Let f: (X,T1) (Y,T2) be a fuzzy pgprw-
closed homeomorphism then f induces an isomorphism from
the group fuzzy pgprw closed h(X,T1) on to the group f
pgprw-h(Y,T2).
Proof: Using the map f ,we define a map f : f pgprw closed-
h(X,T1) f-pgprwclosed-h(Y,T2)by f (h)=fohof -1 for every
h fuzzy pgprw closed-h(X,T1). Then f is a bijection. Further
for all h1,h2 f pgprwc-h(X,T1), f (h1oh2)= fo(h1oh2)of-
1=(foh1of - 1)o(foh2of - 1)= f (h1)o f (h2).Therefore f is a
homeomorphism and so it is an isomorphism induced by f.
References:
[1] L.A.Zadeh, Fuzzy sets, Information and control, 8 (1965)
338-353.
[2]C.L.Chang, Fuzzy topological spaces, JI. Math. Anal.
Appl., 24(1968), 182-190.
[3] K.K.Azad, On fuzzy semi continuity, fuzzy almost
continuity and
fuzzy weakly continuity. JI. Math. Anal. Appl. 82 No. 1
(1981), 14-32.
[4] S. S. Benchalli, R. S. Wali and Basavaraj M. Ittanagi on
fuzzy rw-closed sets and fuzzy rw-open sets in fuzzy
topological spaces Int. J. of Mathematical Sciences and
Applications,Vol. 1, No. 2, May 2011.
[5] R.S.Wali and Vivekananda Dembre,R.S.Wali and
Vivekananda Dembre,Fuzzy pgprw-closed sets and Fuzzy
pgprw-open sets in Topological SpacesVolume 3, No. 3,
March 2016 Journal of Global Research in Mathematical
Archives.
[6] R.S.Wali and Vivekananda Dembre,Fuzzy pgprw-open
maps and fuzzy pgprw-closed maps in fuzzy topological
spaces; International Journal of Statistics and Applied
Mathematics 2016; 1(1): 01-07

International Journal of Computer Applications Technology and Research
Volume 7–Issue 02, 28-34, 2018, ISSN:-2319–8656
39
[7] R.S.Wali and Vivekananda Dembre,Fuzzy pgprw-
continuous maps and fuzzy pgprw-irresolute in fuzzy
topological spaces; International Journal of Statistics and
Applied Mathematics 2016; 1(1): 01-07
[8] Mukerjee,M.N. and Sinha ,s.p,irresolute and almost open
function between fts,fuzzy sets and systems,29(1989),141-
148.
[9]Ferraro,M and Foster, D.H.differention of fuzzy continuous
mappings on fts,jour. Math.anal &appl 121(1987),1-7.
[10]Thakur S.S. and Bajpai Pandey Jyoti “Intuitionistic Fuzzy
rgα-closed sets”, International Journal of Fuzzy system and
Rough System 4(1), 67-73.
[11] R.S.Wali and Vivekananda Dembre;On Pre Generalızed
Pre Regular Weakly Closed Sets in Topologıcal Spaces
;Journal of Computer and Mathematical Sciences,
Vol.6(2),113-125, February 2015.

International Journal of Computer Applications Technology and Research
Volume 7–Issue 02, 40-44, 2018, ISSN:-2319–8656
www.ijcat.com 40
An Improvement of the Basic El-Gamal Public Key Cryptosystem
W.D.M.G.M. Dissanayake
(PG/MPhil/2015/09)
Department of Computer Engineering
Faculty of Engineering, University of Peradeniya, Sri Lanaka
Abstract: In this paper an improvement of the El-Gamal public key cryptosystem is presented. The public key of the El-Gamal system
is not changed in this method. But, the sending structure of message and the decryption process are changed. The El-Gamal cryptosystem
is not secure under adaptive chosen ciphertext attack. That means El-Gamal cryptosystem can be ciphertext attacked without knowing
any key. Therefore changing keys of El-Gamal cryptosystem are not useful. This improvement cryptosystem immunes against CPA and
CCA attacks. This cryptosystem is practical and very simple. The importance of this modified cryptosystem is any adversary can’t find
the sending message in easily.
Keywords: public key cryptosystem, RSA public key cryptosystem, El-Gamal public key cryptosystem, Elliptic Curves Cryptosystem,
chosen ciphertext attack, chosen plaintext attack
1 INTRODUCTION Since the public key cryptography was introduced by Diffie and
Hellman in 1976, designing Public Key Crypto Systems is very
important research area in world. RSA cryptosystem, El-Gamal
cryptosystem and Elliptic Curves cryptosystem are famous
public key cryptosystems. But, there is no guarantee for the
security of any cryptosystem yet. For an example anyone can
attack to the ciphertext of El-Gamal cryptosystem without
knowing any keys. Many countries are trying to find a better
cryptosystem and fund more to research projects based on
cryptography. There are many public key cryptosystems have
been developed in world. But, we can’t trust 100% none of those
systems.
I describe here briefly the definition of public key cryptosystem
and two famous public key cryptosystems in world, the RSA
public key cryptosystem and the El-Gamal public key
cryptosystem.
1.1 Definition: A public key cryptosystem is a tuple of probabilistic polynomial
–time algorithm (𝐾𝑔𝑒𝑛, 𝐸𝑛𝑐, 𝐷𝑒𝑐) such that:
1. 𝐾𝑔𝑒𝑛 is a probabilistic key generation algorithm that
takes as input 1𝑘 for a security parameter 𝑘 ∈ ℕ and
returns a public key 𝑝𝑘 and a secret key 𝑠𝑘. The public
key pk defines a space M, called message space.
2. Enc is a probabilistic algorithm that takes as input a
public key 𝑝𝑘 and a message 𝑚 ∈ 𝑀 and returns a
ciphertext c.
3. Dec is a deterministic algorithm that takes as input a
secret key 𝑠𝑘 and a ciphertext c, and returns a message
m or the reject symbol ⊥ . Moreover a further
fundamental property is required: correctness. We
want that for every 𝑘 ∈ ℕ , every pair (𝑝𝑘, 𝑠𝑘) ← 𝐾𝑔𝑒𝑛(1𝑘), and for every message 𝑚 ∈ 𝑀 , the
following equation holds:
Pr[𝐷𝑒𝑐(𝑠𝑘, 𝐸𝑛𝑐(𝑝𝑘, 𝑚)) = 𝑚] = 1.
1.2 RSA public key cryptosystem This public key cryptosystem was introduced by R.L. Rivest, A.
Shamir and L. Adleman in 1978. This system was the first
practical public key cryptosystem. Following is the RSA scheme.
1. Two large prime numbers are generated. Let p and q.
2. Modulus n is generated by multiplying p and q.
3. The totient of n is ф(n) = (p-1).(q-1) is calculated.
4. Public Key: A prime number e is selected. where 3 ≤ e
≤ ф(n) and gcd [e, ф(n)] = 1; gcd means greatest
common divisor.
5. Private Key: The inverse of e with respect to mod ф(n)
is calculated.
The RSA function for message m and key k is,
F (m, k) ≡ 𝑚𝑘 mod n
Encryption: 𝑚𝑒 mod n ≡ c
Decryption: 𝑐𝑑 mod n ≡ m
Example: Let p = 7 and q = 11.
Then n = 77 and ф(n) = 60
Choose e = 13. gcd [e, ф(n)] = 1,
Then the secret key d can find easily. e.d ≡ 1 mod ф(n)
i.e. 13. 37 = 1 mod 60, Hence, d = 37.
Let the message is m = 6
Encryption: me mod n ≡ 613 mod 77 ≡ 62 ≡ c
Decryption: 𝑐𝑑 mod n ≡ 6237 mod 77 ≡ 6 ≡ m
The security of RSA is based on the infeasibility of factorization
large n.
1.3 The El-Gamal cryptosystem This public key cryptosystem was introduced by Taher Elgamal
in 1985.
Step 01: Global elements: Let any large prime number 𝑝 and a
primitive root 𝑔 of 𝑝.
Step 02: Decryption key: x – private, Calculate 𝑔𝑥 𝑚𝑜𝑑 𝑝 ,
where 𝑥 ∈ ℤ .
Publish ( 𝑝, 𝑔, 𝑔𝑥 𝑚𝑜𝑑 𝑝 ).
Step 03: Encryption:
Let the message is m; ( 0 < 𝑚 < 𝑝) and choose y -
private (0 < 𝑦 < 𝑝).
Compute 𝑏 = 𝑔𝑦 𝑚𝑜𝑑 𝑝. Then,
𝑐 ≡ 𝑚. 𝑎𝑦 𝑚𝑜𝑑 𝑝.
Send (b, c).
Step 04: Decryption:
Compute 𝑏𝑥 𝑚𝑜𝑑 𝑝 ≡ 𝑎𝑦. Then,
𝑚 ≡ 𝑎𝑦−1. 𝑐 𝑚𝑜𝑑 𝑝.
Example:
Step 01: Select 𝑝 = 23 and a primitive root of 𝑝 = 23 is 𝑔 = 5.
Step 02: Let, 𝑥 = 8.
Calculate 𝑔𝑥 𝑚𝑜𝑑 𝑝 ≡ 58 𝑚𝑜𝑑 23 ≡ 16.
Publish ( 23, 5, 16 ).
Step 03: Encryption:
Let the message is m = 6; and choose y = 3

International Journal of Computer Applications Technology and Research
Volume 7–Issue 02, 40-44, 2018, ISSN:-2319–8656
www.ijcat.com 41
Compute 𝑏 ≡ 𝑔𝑦 𝑚𝑜𝑑 𝑝 ≡ 53 𝑚𝑜𝑑 23 ≡ 10 .
Then,
𝑐 ≡ 𝑚. 𝑎𝑦 𝑚𝑜𝑑 𝑝 ≡ 6. 163 𝑚𝑜𝑑 23 ≡ 12.
Send (10, 12).
Step 04: Decryption:
Compute 𝑏𝑥 𝑚𝑜𝑑 𝑝 ≡ 108 𝑚𝑜𝑑 23 ≡ 2.
Then,
2−1. 12 𝑚𝑜𝑑 23 ≡ 6 ≡ 𝑚 .
The security of El-Gamal cryptosystem is depended on the
discrete logarithm problem.
1.4 A chosen ciphertext attack on El-
Gamal public key cryptosystem The El-Gamal system is not secure under Chosen Ciphertext
Attack. Anyone can easily get the message.
Example:
Global elements: Large prime number 𝑝 and a primitive root 𝑔
of 𝑝.
Decryption key: x – private, Calculate 𝑎 ≡ 𝑔𝑥 𝑚𝑜𝑑 𝑝 ,
where 𝑥 ∈ ℤ .
Publish ( 𝑝, 𝑔, 𝑎 ).
Encryption:
Let the message is m; ( 0 < 𝑚 < 𝑝) and choose y -
private (0 < 𝑦 < 𝑝).
Compute 𝑏 = 𝑔𝑦 𝑚𝑜𝑑 𝑝. Then,
𝑐 ≡ 𝑚. 𝑎𝑦 𝑚𝑜𝑑 𝑝.
Send (b, c).
k and m’ are chosen at randomly by the attacker. Note that all are
considered in mod p.
Let the ciphertext is C = (b, c).
𝐶 = (𝑏, 𝑐)
= (𝑔𝑦 , 𝑚. 𝑎𝑦)
Now calculate C’ by the attacker as follows:
C’ =
( 𝑔𝑦 𝑔𝑘 , 𝑎𝑦. 𝑚. 𝑎𝑘 . 𝑚′ )
C’ = (𝑔𝑦+𝑘 , (𝑚. 𝑚′). 𝑎𝑦+𝑘 ) )
Give, C’ to the decryption oracle.
m’’ will be
return.
Now we can get m from m’’.
C’’= (m. m’). 𝒂𝒚+𝒌
m’’ = m. m’
𝑚 = 𝑚′′. 𝑚′−1
Therefore we can get the message easily without any keys.
2 PROPOSED IMPROVEMENT OF
THE EL-GAMAL PUBLIC KEY
CRYPTOSYSTEM I proposed an improvement for the El-Gamal public key
cryptosystem. In this paper, I get the message in numerical form.
But, we can get any standard representation for a large message.
Consider we have to encrypt a message m. In this method, the
public encryption key is ( 𝑝, 𝑔, 𝑔𝑥 𝑚𝑜𝑑 𝑝 ). Here p is any large
prime number and 𝑔 is a primitive root of 𝑝 . The public
encryption key is similar to the public encryption key of the El-
Gamal public key cryptosystem.
The structure of the ciphertext C has changed on the
improvement system. Write m = 𝑝1𝑝2𝑝3 … 𝑝𝑖 ; Where 𝑝𝑖 is
prime. (0 < 𝑖 < 𝑃). That means we need i- prime numbers as
products to get m. Then (𝑔𝑥 𝑚𝑜𝑑 𝑝)y 𝑚𝑜𝑑 𝑝 is multiplied by the
number of prime numbers which needs to get m. c is calculated
by the i th power of the message m. Then we send
(𝑔𝑦𝑚𝑜𝑑 𝑝, 𝑚 𝑖, 𝑖 . 𝑔𝑥.𝑦 𝑚𝑜𝑑 𝑝).
In decryption process first 𝑔𝑥𝑦𝑚𝑜𝑑 𝑝 = (𝑔𝑥 𝑚𝑜𝑑 𝑝)𝑦 is
calculated. Then 𝑖. (𝑔𝑥 𝑚𝑜𝑑 𝑝)y 𝑚𝑜𝑑 𝑝. is divided by
(𝑔𝑥 𝑚𝑜𝑑 𝑝)𝑦. Now we have i. Then taking the inverse of i on c
we can get the message m.
You can use this system with following steps.
Step 01: Global elements: Let any large prime number 𝑝 and a
primitive root 𝑔 of 𝑝.
Step 02: Decryption key: x – private, Calculate 𝑔𝑥 𝑚𝑜𝑑 𝑝 ,
where 𝑥 ∈ ℤ .
Publish ( 𝑝, 𝑔, 𝑔𝑥 𝑚𝑜𝑑 𝑝 ).
Step 03: Encryption Process:
Let the message is m; ( 0 < 𝑚 < 𝑝) and choose y -
private (0 < 𝑦 < 𝑝).
Compute 𝑏 = 𝑔𝑦 𝑚𝑜𝑑 𝑝.
Write m = 𝑝1𝑝2𝑝3 … 𝑝𝑖 ; Where 𝑝𝑖 is prime.
(0 < 𝑖 < 𝑝)
Calculate 𝑛 = 𝑖. 𝑎𝑦 𝑚𝑜𝑑 𝑝
Calculate 𝑐 = 𝑚𝑖
Send (𝑏, 𝑐, 𝑛 )
Step 04: Decryption:
Compute 𝑏𝑥 𝑚𝑜𝑑 𝑝 ≡ 𝑎𝑦. Then,
Calculate 𝑛
𝑏𝑥 𝑚𝑜𝑑 𝑝
(Note : 𝑛
𝑏𝑥 𝑚𝑜𝑑 𝑝= 𝑖 )
𝑚 = 𝑐1
𝑖⁄
2.1 Proof The extended El-Gamal system decryption expression is
𝑐𝑏𝑥 𝑚𝑜𝑑 𝑝
𝑛 = 𝑐𝑔𝑦.𝑥𝑚𝑜𝑑 𝑝
𝑖.𝑎𝑦 𝑚𝑜𝑑 𝑝 = 𝑐𝑔𝑦.𝑥𝑚𝑜𝑑 𝑝
𝑖.𝑔𝑥.𝑦 𝑚𝑜𝑑 𝑝 = 𝑐1
𝑖⁄ =
(𝑚𝑖)1
𝑖⁄ = 𝑚 .
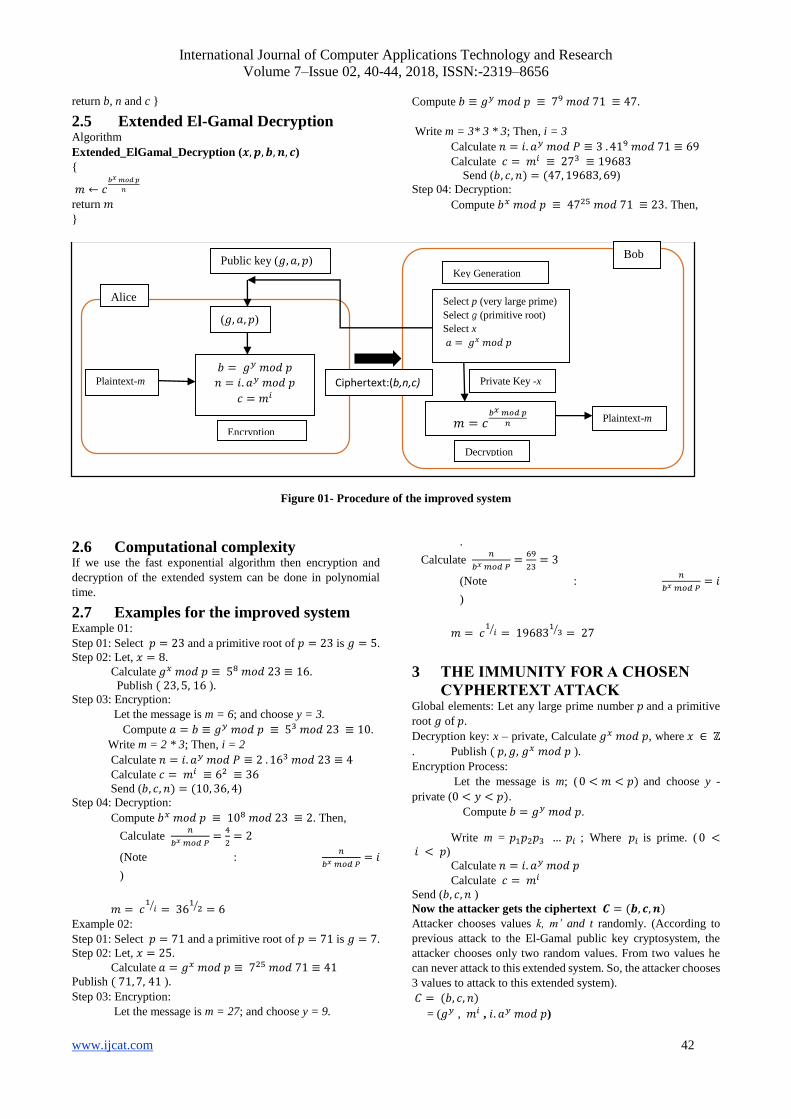
2.2 Procedure .Let the public key is (𝑔, 𝑎, 𝑝) and the ciphertext is (𝑏, 𝑐, 𝑛).
See the figure 01.
2.3 Key Generation for the Extended El-
Gamal system Key generation of the extended El-Gamal system is same as the
El-Gamal public key cryptosystem.
Algorithm
Extended_ElGamal_Key_Generation
{
Select a large prime p
Select x to be a member of the group (ℤ𝑝∗,×); 1 ≤ 𝑥 ≤ 𝑝 − 2
Select 𝑔 to be a primitive root in (ℤ𝑝∗,×)
𝑎 ← 𝑔𝑥 𝑚𝑜𝑑 𝑝
Public_key ← (𝑔, 𝑎, 𝑝)
Private_key ← d
return Public_key and Private_key
}
2.4 Extended El-Gamal Encryption Algorithm
Extended_ElGamal_Encryption (𝒈, 𝒂, 𝒑, 𝒊, 𝒎)
{
Select a random integer y in the group (ℤ𝑝∗,×)
𝑏 ← 𝑔𝑦 𝑚𝑜𝑑 𝑝
𝑛 ← 𝑖. 𝑎𝑦 𝑚𝑜𝑑 𝑝
𝑐 ← 𝑚𝑖
International Journal of Computer Applications Technology and Research
Volume 7–Issue 02, 40-44, 2018, ISSN:-2319–8656
www.ijcat.com 42
return b, n and c }
2.5 Extended El-Gamal Decryption Algorithm
Extended_ElGamal_Decryption (𝒙, 𝒑, 𝒃, 𝒏, 𝒄)
{
𝑚 ← 𝑐𝑏𝑥 𝑚𝑜𝑑 𝑝
𝑛
return 𝑚
}
Compute 𝑏 ≡ 𝑔𝑦 𝑚𝑜𝑑 𝑝 ≡ 79 𝑚𝑜𝑑 71 ≡ 47.
Write m = 3* 3 * 3; Then, i = 3
Calculate 𝑛 = 𝑖. 𝑎𝑦 𝑚𝑜𝑑 𝑃 ≡ 3 . 419 𝑚𝑜𝑑 71 ≡ 69
Calculate 𝑐 = 𝑚𝑖 ≡ 273 ≡ 19683
Send (𝑏, 𝑐, 𝑛) = (47, 19683, 69)
Step 04: Decryption:
Compute 𝑏𝑥 𝑚𝑜𝑑 𝑝 ≡ 4725 𝑚𝑜𝑑 71 ≡ 23. Then,
Figure 01- Procedure of the improved system
2.6 Computational complexity If we use the fast exponential algorithm then encryption and
decryption of the extended system can be done in polynomial
time.
2.7 Examples for the improved system Example 01:
Step 01: Select 𝑝 = 23 and a primitive root of 𝑝 = 23 is 𝑔 = 5.
Step 02: Let, 𝑥 = 8.
Calculate 𝑔𝑥 𝑚𝑜𝑑 𝑝 ≡ 58 𝑚𝑜𝑑 23 ≡ 16.
Publish ( 23, 5, 16 ).
Step 03: Encryption:
Let the message is m = 6; and choose y = 3.
Compute 𝑎 = 𝑏 ≡ 𝑔𝑦 𝑚𝑜𝑑 𝑝 ≡ 53 𝑚𝑜𝑑 23 ≡ 10.
Write m = 2 * 3; Then, i = 2
Calculate 𝑛 = 𝑖. 𝑎𝑦 𝑚𝑜𝑑 𝑃 ≡ 2 . 163 𝑚𝑜𝑑 23 ≡ 4
Calculate 𝑐 = 𝑚𝑖 ≡ 62 ≡ 36
Send (𝑏, 𝑐, 𝑛) = (10, 36, 4)
Step 04: Decryption:
Compute 𝑏𝑥 𝑚𝑜𝑑 𝑝 ≡ 108 𝑚𝑜𝑑 23 ≡ 2. Then,
Calculate 𝑛
𝑏𝑥 𝑚𝑜𝑑 𝑃=
4
2= 2
(Note : 𝑛
𝑏𝑥 𝑚𝑜𝑑 𝑃= 𝑖
)
𝑚 = 𝑐1
𝑖⁄ = 361
2⁄ = 6 Example 02:
Step 01: Select 𝑝 = 71 and a primitive root of 𝑝 = 71 is 𝑔 = 7.
Step 02: Let, 𝑥 = 25.
Calculate 𝑎 = 𝑔𝑥 𝑚𝑜𝑑 𝑝 ≡ 725 𝑚𝑜𝑑 71 ≡ 41
Publish ( 71, 7, 41 ).
Step 03: Encryption:
Let the message is m = 27; and choose y = 9.
.
Calculate 𝑛
𝑏𝑥 𝑚𝑜𝑑 𝑃=
69
23= 3
(Note : 𝑛
𝑏𝑥 𝑚𝑜𝑑 𝑃= 𝑖
)
𝑚 = 𝑐1
𝑖⁄ = 196831
3⁄ = 27
3 THE IMMUNITY FOR A CHOSEN
CYPHERTEXT ATTACK Global elements: Let any large prime number 𝑝 and a primitive
root 𝑔 of 𝑝.
Decryption key: x – private, Calculate 𝑔𝑥 𝑚𝑜𝑑 𝑝, where 𝑥 ∈ ℤ
. Publish ( 𝑝, 𝑔, 𝑔𝑥 𝑚𝑜𝑑 𝑝 ).
Encryption Process:
Let the message is m; ( 0 < 𝑚 < 𝑝) and choose y -
private (0 < 𝑦 < 𝑝).
Compute 𝑏 = 𝑔𝑦 𝑚𝑜𝑑 𝑝.
Write m = 𝑝1𝑝2𝑝3 … 𝑝𝑖 ; Where 𝑝𝑖 is prime. ( 0 < 𝑖 < 𝑝)
Calculate 𝑛 = 𝑖. 𝑎𝑦 𝑚𝑜𝑑 𝑝
Calculate 𝑐 = 𝑚𝑖
Send (𝑏, 𝑐, 𝑛 )
Now the attacker gets the ciphertext 𝑪 = (𝒃, 𝒄, 𝒏)
Attacker chooses values k, m’ and t randomly. (According to
previous attack to the El-Gamal public key cryptosystem, the
attacker chooses only two random values. From two values he
can never attack to this extended system. So, the attacker chooses
3 values to attack to this extended system).
𝐶 = (𝑏, 𝑐, 𝑛)
= (𝑔𝑦 , 𝑚𝑖 , 𝑖. 𝑎𝑦 𝑚𝑜𝑑 𝑝)
𝑏 = 𝑔𝑦 𝑚𝑜𝑑 𝑝
𝑛 = 𝑖. 𝑎𝑦 𝑚𝑜𝑑 𝑝
𝑐 = 𝑚𝑖
Select p (very large prime)
Select g (primitive root)
Select x
𝑎 = 𝑔𝑥 𝑚𝑜𝑑 𝑝
𝑚 = 𝑐𝑏𝑥 𝑚𝑜𝑑 𝑝
𝑛
Private Key -x
Plaintext-m
Key Generation
Decryption
(𝑔, 𝑎, 𝑝)
Ciphertext:(b,n,c)
Public key (𝑔, 𝑎, 𝑝)
Alice
Bob
Encryption
Plaintext-m
International Journal of Computer Applications Technology and Research
Volume 7–Issue 02, 40-44, 2018, ISSN:-2319–8656
www.ijcat.com 43
Now calculate C’ by the attacker as follows:
C’ = ( 𝑔𝑦. 𝑔𝑘 , 𝑚𝑖 . 𝑚′𝑡 , . 𝑎𝑦 𝑚𝑜𝑑 𝑝. 𝑡. 𝑎𝑘 𝑚𝑜𝑑 𝑝.
)
C’ = (𝑔𝑦+𝑘 , 𝑚𝑖 . 𝑚′𝑡 , (𝑖. 𝑡). (𝑎𝑦 𝑚𝑜𝑑 𝑝). (𝑎𝑘 𝑚𝑜𝑑 𝑝) )
Give, C’ to the decryption oracle.
m’’ will be return.
𝑚′′ = 𝑚𝑖 . 𝑚′𝑡
𝑚 = (𝑚′′
𝑚′𝑡)
1𝑖⁄
The attacker does not know the value of 𝑖. Therefore he can’t get
m from m’’.
So, above ciphertext attack will be failure in this extended El-
Gamal system.
4 SECURITY OF THE IMPROVED
PUBLIC KEY CRYPTOSYSTEM
4.1 Notions of Security Semantic Security (indistinguishability of Encryptions/ IND):
This notion was introduced by Goldwasser and Micali [12]. This
property captured the idea according to which an adversary
should not be able to get any information about a plaintext, its
length excepted given its encryption.
Chosen Plaintext Attack (CPA): The adversary can access an
encryption oracle and hence to the encryption of any plaintext.
Non-Adaptive Chosen Ciphertext Attack (CCA1/ Lunchtime
Attack/ Midnight Attack): The adversary can access a decryption
oracle before being given the challenge ciphertext.
Adaptive Chosen Ciphertext Attack (CCA2): According to
Rackoff and Simon [13], the adversary queries the decryption
oracle before and after being challenged. But, the adversary may
not feed the oracle with the challenge ciphertext itself.
4.2 IND-CPA security of the improved El-
Gamal cryptosystem This improved cryptosystem is IND-CPA secure as IND-CPA
security of El-Gamal public key cryptosystem.
Discrete Diffie-Hellman Assumption:
The tuple (𝑔𝑥, 𝑔𝑦 , 𝑔𝑥𝑦) is computationally indistinguishable
from (𝑔𝑥, 𝑔𝑦 , 𝑔𝑧) for 𝑥, 𝑦, 𝑧 $
← ℤ𝑞.
Theorem: If the Discrete Diffie-Hellman problem is hard then the
improved El-Gamal cryptosystem is IND-CPA secure.
Proof: (By contradiction). Assume that an adversary can break
the improved El-Gamal cryptosystem, That is, it has significant
advantage by a real or random definition,
𝐴𝑑𝑣𝐴 = Pr[𝐴𝐸𝑝𝑘(𝑝𝑘) = 1] − Pr [𝐴𝐸
𝑝𝑘0$ (𝑝𝑘) = 1].
Since improved cryptosystem is a public key encryption scheme,
if it is secure against a single query it is secure against q queries,
so we only need to show that it is (𝑡, 𝑞, 휀) secure for 𝑞 = 1; we
can thus assume that the adversary A makes exactly one query.
The adversary A that runs in time t and has advantage 𝛿, we can
construct another adversary B for DDH that runs in time 𝑡 +
𝑂(1) and has advantage 𝛿. Algorithm 𝐵(𝑎, 𝑏, 𝑐) is as follows:
1. Run 𝐴𝐸𝐵 (𝑎) , where B’s version of the encryption
oracle 𝐸𝐵 answers its one query m with (𝑏, 𝑐. 𝑚).
2. Output the same result as A does.
In the case where B is called on a triple of the form (𝑔𝑥,
𝑔𝑟 , 𝑔𝑥𝑟) , what A sees is identical to interacting with a real
encryption oracle 𝐵(𝑔𝑥, 𝑔𝑟 , 𝑔𝑥𝑟) = 𝐴𝐸𝑝𝑘(𝑝𝑘) . In the case
where B is called on a tuple of the form(𝑔𝑥 , 𝑔𝑟 , 𝑔𝑧), A sees the
values 𝑎 = 𝑔𝑥 𝑎𝑛𝑑 (𝑏, 𝑐. 𝑚) = (𝑔𝑟 , 𝑔𝑧. 𝑚). Since 𝑔𝑧 is selected
uniformly at random, 𝑔𝑧. 𝑚 is also a uniform random value and
is thus completely indistinguishable from 𝑔𝑧𝑟𝑥. $(𝑚)
and (𝑔𝑟 , 𝑔𝑧 . 𝑚) is the same distribution as 𝑔𝑟 , 𝑔𝑟𝑥. $(𝑚). This
makes B a perfect simulator of a random oracle and in this
case 𝐵(𝑔𝑥, 𝑔𝑟 , 𝑔𝑧) = 𝐴𝐸
𝑝𝑘0$ (𝑝𝑘).
This construction thus turns an adversary that breaks Extended
El-Gamal cryptosystem into one that breaks DDH with the same
advantage, adding constant time complexity.
5 CONCLUSIONS AND FUTURE
WORKS An improvement of El-Gamal public key cryptosystem has
presented. The security of this improved system depends on 𝑖. If
anyone gets 𝑖 then he can find the message easily. In this system
the encryption increases the size of a message. Therefore this
improved system is very suitable for small messages or key
exchanges.
I try to solve the problem that is the encryption increases the size
of a message of above introduced system, using modular
exponentiation methods.
6 ACKNOWLADGEMENT I would like to thank Dr. Sandirigama, M. (Department of
Computer Engineering, Faculty of Engineering, University of
Peradeniya, Sri Lanka), Dr. Ishak , M.I.M. (Department of
Engineering Mathematics, Faculty of Engineering, University of
Peradeniya, Sri Lanka) and Dr. Alawathugoda, J. (Department of
Computer Engineering, Faculty of Engineering, University of
Peradeniya, Sri Lanka) for their very useful advice in my
research work.
7 REFERENCES [1] [1] Rivest, R., Shamir, A., Adleman, L. 1978. A
method for obtaining digital signature and public key
cryptosystems. Communications of the ACM, Vol.21
(1978), 120-126.
[2] Diffie, W., Hellman, M. 1976. New directions in
Cryptography, IEEE Translations, Information Theory
22 (1976), 644-654.
[3] ElGamal, T. 1985. A public key cryptosystem and a
signature scheme based on discrete logarithms, IEEE
Transactions on Information Theory 31 (1985), 469-
472.
[4] Das, A. Public Key Cryptography – Theory and
Practice Chapter 3: Algebraic and Number-theoretic
Computations, 171-255.
[5] Cramer, R., Shoup. V. 1998. A Practical Public Key
Cryptosystem Provably Secure against Adaptive
Chosen Ciphertext Attack, In Crypto ’98, Springer-
Verlag (1998), LNCS 1462, 13–25.
[6] Naor, M., Yung, M. 1990. Public-Key Cryptosystems
Provably Secure against Chosen Ciphertext Attacks. In
Proc. of the 22nd STOC, ACM Press (1990), 427–437.
[7] Pointcheval, D. 1999. New Public Key Cryptosystems
based on the Dependent-RSA Problem, Advances in

International Journal of Computer Applications Technology and Research
Volume 7–Issue 02, 40-44, 2018, ISSN:-2319–8656
www.ijcat.com 44
Cryptology – Proceedings of EUROCRYPT ’99, J.
Stern Ed. Springer – Verlag, LNCS 1592 (1999), 239-
254.
[8] Forouzan, A.B., Mukhopadhyay, D. Cryptography
and Network Security, Special Indian Edition, 265-
290, 306-316.
[9] Liu, Z., Yang, X., Zhong, W., Han, Y. 2014. An
Efficient and Practical Public Key Cryptosystem with
CCA-Security on Standard Model, Tsinghua Science
and Technology, ISSN 1007-0214 08/13, Vol.19
(2014), 486-495.
[10] Bellare, M., Desai, A., Pointcheval, D., Rogaway, P.
1998. Relations among notions of security for public
key encryption schemes, Lecture Notes in Computer
Science, vol. 1462 (1998), 26-45.
[11] Tsiounis, Y., Yung, M. 1998. On the security of
ElGamal based encryption. In H. Imai and Y. Zheng,
editors, Public Key Cryptography, Springer, vol. 1431
of Lecture Notes in Computer Science (1998),117–
134.
[12] Goldwasser, S., Micali, S. 1984. Probabilistic
Encryption, Journal of Computer and System Sciences
28 (1984), 270-299.
[13] Racko, C., Simon, D.R. 1992. Non-Interactive Zero-
Knowledge Proof of Knowledge and Chosen
Ciphertext Attack, Crypto '91, LNCS 576, Springer-
Verlag (1992), 433-444.
International Journal of Computer Applications Technology and Research
Volume 7–Issue 02, 45-52, 2018, ISSN:-2319–8656
www.ijcat.com 45
A Hybrid Approach of Association Rule & Hidden Makov Model to Improve Efficiency Medical Text Classification
Huda Ali Al-qozani
Department of Computer Science
University of Thamar
Thamar, Yemen
Khalil saeed Al-wagih
Department of Information Technology
University of Thamar
Thamar, Yemen
Abstract: Text classification problem is a set of documents be classified into a predefined set of categories, each document is
classified based on a set of features (words). However, some of the words not relevant to a category which causes a gap between words
relevance in a document. A lot of research articles in public databases, and The digitization of critical medical information such as lab
reports, patients records, research papers, and anatomic images tremendous amounts of biomedical research data are generated every
day. So that, the classification this data and retrieving information relevant to information users’ needs have been a primary research
issue in the field of Information Retrieval, and the adoption of classification has been applied to tackle this particular problem. In this
paper, we propose a hybrid model for the classification of biomedical texts according to their content, using Association Rules and
Hidden Markov Model as classifier. In order to demonstrate it, we present a set of experiments performed on OHSUMED biomedical
text corpora. Our classifier compared with Naive Bayes and Support Vector Machine models. The evaluation result shows that the
proposed classification is complete and accurate when compared with Naive Bayes and Support Vector Machine models.
Keywords: Hidden Markov Model, Association Rules, Biomedical Text, Text Classification, Machine learning, Text mining,
Information Retrieved.
1. INTRODUCTION The field of biomedical informatics has drawn increasing
attention and has been growing rapidly. The amounts of
biomedical research data are generated every day in public
databases such as OHSUMED or elsewhere, has come to a
growing realization that such data contains buried within it
knowledge, knowledge that could lead to important
discoveries in science, knowledge that could enable us
accurately to predict the diseases. The knowledge that could
enable us to identify the causes of and possible cures for lethal
illnesses, a knowledge that could literally mean the difference
between life and death. It has rightly been said that the world
is becoming ‘data rich but knowledge poor’, These data need
to be effectively organized and analyzed in order to be useful
[18].
In the another side knowledge management practices often
need to leverage existing clinical decision support,
information retrieval (IR), and digital library techniques to
capture and deliver tacit and explicit biomedical knowledge.
Text mining techniques have been used to analyses research
publications as well as electronic patient records [9]. The task
of automatic classification is a relatively new IR sub field.
Since Machine Learning (ML) serves as a theoretical
foundation for the methodologies in this task, its scope is
often referred to as the intersection of IR and ML[46].
Text classification (TC) may be formalized as the task of
approximating the unknown target function f : D x C { - 1 , 1}
that corresponds to how documents would be classified . The
function f is the text classifier, C = { c1,c2,… ,cj,... ,c |C|} is a
pre-defined set of categories and D is a set of documents.
Each document is represented using the set of features,
usually words, W = { w1, w2, . . . ,wk, . . . , wW } , with each
one as a vector di = { wi1, wi2, . . . ,wik, . . . , wi | W |},
where wik describes each feature’s representation for that
specific document. When f (di,cj)= 1, di is a positive example
or member of category cj , whilst when f (di,cj) = 0 it is a
negative example of cj. The goal of this paper is to categorize
electronic biomedical texts to one or more categories
automatically[39]. The following part moves on to describe
the methods used in different aspects of TC. The Naive Bayes
(NB) model has been one of the more popular methods used
in TC due to its simplicity and relative effectiveness [7, 27,
30]. However, the performance of the NB model has turned
out to be inferior to other models such as Support Vector
Machine (SVM) [19], k-Near Neighbor (KNN) [43], Neural
Network (NN ) [44]. The outcome of many studies confirms
that there is no single TC model instead. Distinct models seem
to be robust for different aspects of TC and within different
contexts such as KNN-based models are easily scalable to
large data sets [43], NN-based are best suitable for
applications to obscure intrinsic structures [37], NB-based are
appropriate for their simplicity and extensibility to web
documents with links [26] and SVM-based may be used for
their resistance to over-fitting and large dimensionality [14].
Hidden Markov Model (HMM) has been used to describe a
sequential random process[41, 2]. Association Rule Mining
(ARM) is to examine the contents of the database and find
rules[7]. Another significant aspect of this study, the surveys
of biomedical text mining [50, 49], journal [8], and book [3]
indicate that general purpose text and data mining tools are
not well-suited for the biomedical domain. The biomedical
domain is highly specialized, but biomedical information is
being created in text forms [40].
In this paper, a hybrid association rule and hidden markov
model (AR-HMM) is investigated to prove the effectiveness
of the proposed method, it is compared with SVM and NB.
Rest of this paper is organized as follows: section 2, describes
the methods and materials which used in this study, also
present the performance measurements which are used to
evaluate the categorization models. section 3, the results and
discussion are presented, then reviews the most related work
of Hidden markov model and association rules. in section 4,
International Journal of Computer Applications Technology and Research
Volume 7–Issue 02, 45-52, 2018, ISSN:-2319–8656
www.ijcat.com 46
the conclusions. Finally, the last section presents the
conclusions.
2. METHODOLOGY TC is the process of assigning predefined category labels to
new documents based on the classifier learnt from training
examples. Text mining can be defined similar to data mining
as the application of algorithms and methods from the field
machine learning and statistics. To the dataset usually
comprises the documents themselves, and the features are
extracted from the documents automatically based on their
content before the classification algorithm is applied. For this
purpose it is necessary to pre-process the texts accordingly.
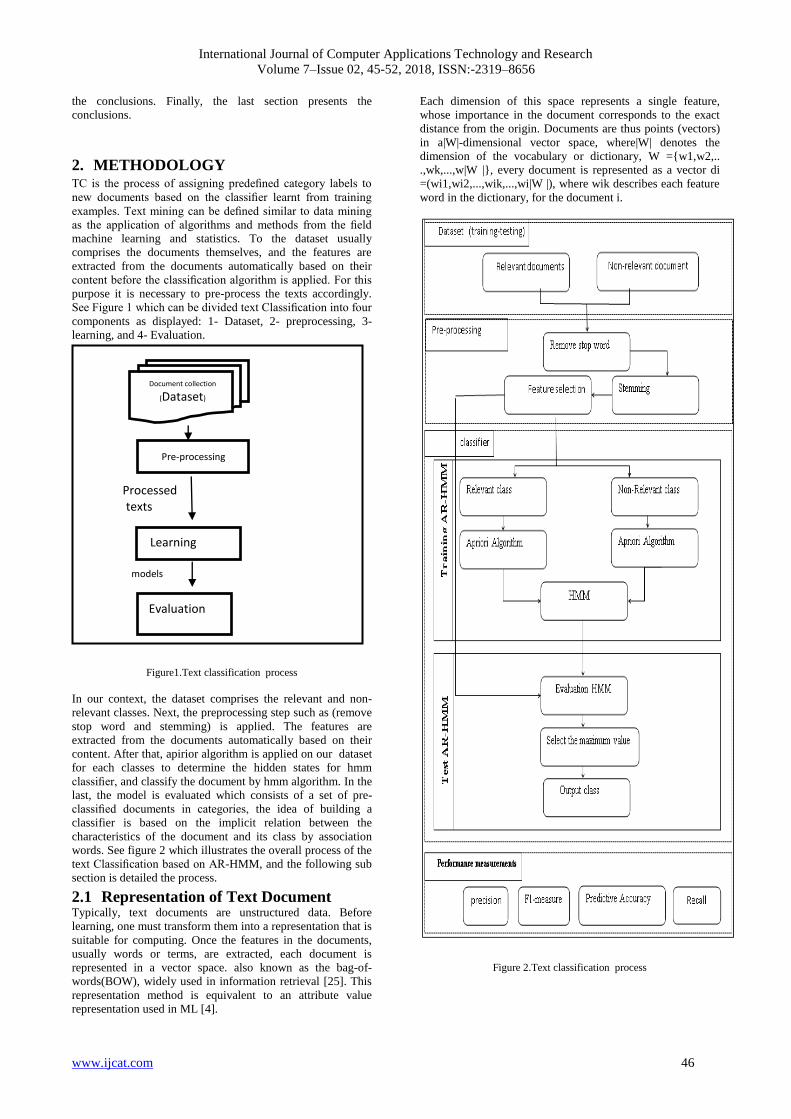
See Figure 1 which can be divided text Classification into four
components as displayed: 1- Dataset, 2- preprocessing, 3-
learning, and 4- Evaluation.
Figure1.Text classification process
In our context, the dataset comprises the relevant and non-
relevant classes. Next, the preprocessing step such as (remove
stop word and stemming) is applied. The features are
extracted from the documents automatically based on their
content. After that, apirior algorithm is applied on our dataset
for each classes to determine the hidden states for hmm
classifier, and classify the document by hmm algorithm. In the
last, the model is evaluated which consists of a set of pre-
classified documents in categories, the idea of building a
classifier is based on the implicit relation between the
characteristics of the document and its class by association
words. See figure 2 which illustrates the overall process of the
text Classification based on AR-HMM, and the following sub
section is detailed the process.
2.1 Representation of Text Document Typically, text documents are unstructured data. Before
learning, one must transform them into a representation that is
suitable for computing. Once the features in the documents,
usually words or terms, are extracted, each document is
represented in a vector space. also known as the bag-of-
words(BOW), widely used in information retrieval [25]. This
representation method is equivalent to an attribute value
representation used in ML [4].
Each dimension of this space represents a single feature,
whose importance in the document corresponds to the exact
distance from the origin. Documents are thus points (vectors)
in a|W|-dimensional vector space, where|W| denotes the
dimension of the vocabulary or dictionary, W ={w1,w2,..
.,wk,...,w|W |}, every document is represented as a vector di
=(wi1,wi2,...,wik,...,wi|W |), where wik describes each feature
word in the dictionary, for the document i.
Figure 2.Text classification process
Document collection
(Dataset)
Pre-processing
Learning
Evaluation
models
Processed texts
International Journal of Computer Applications Technology and Research
Volume 7–Issue 02, 45-52, 2018, ISSN:-2319–8656
www.ijcat.com 47
2.2 Stop Words and Stemming Where rare words which do not provide any useful
information such as(prepositions, determiners or
conjunctions) are removed.
Another very important way to reduce the number of words in
the representation is to use stemming. This is based on the
observation that words in documents often have many
morphological variants. For example we may use the words
computing, computer, computation, computes, computational,
computable and computability all in the same document.
These words clearly have the same linguistic root. Putting
them together as if they were occurrences of a single word
would probably give a strong indication of the content of the
document whereas each word individually might not [7].
Finally, all documents in the collection are mapped to a
matrix called the term. The document matrix representing the
feature space, each row of the matrix corresponds to a
document, and the columns of the matrix correspond to the
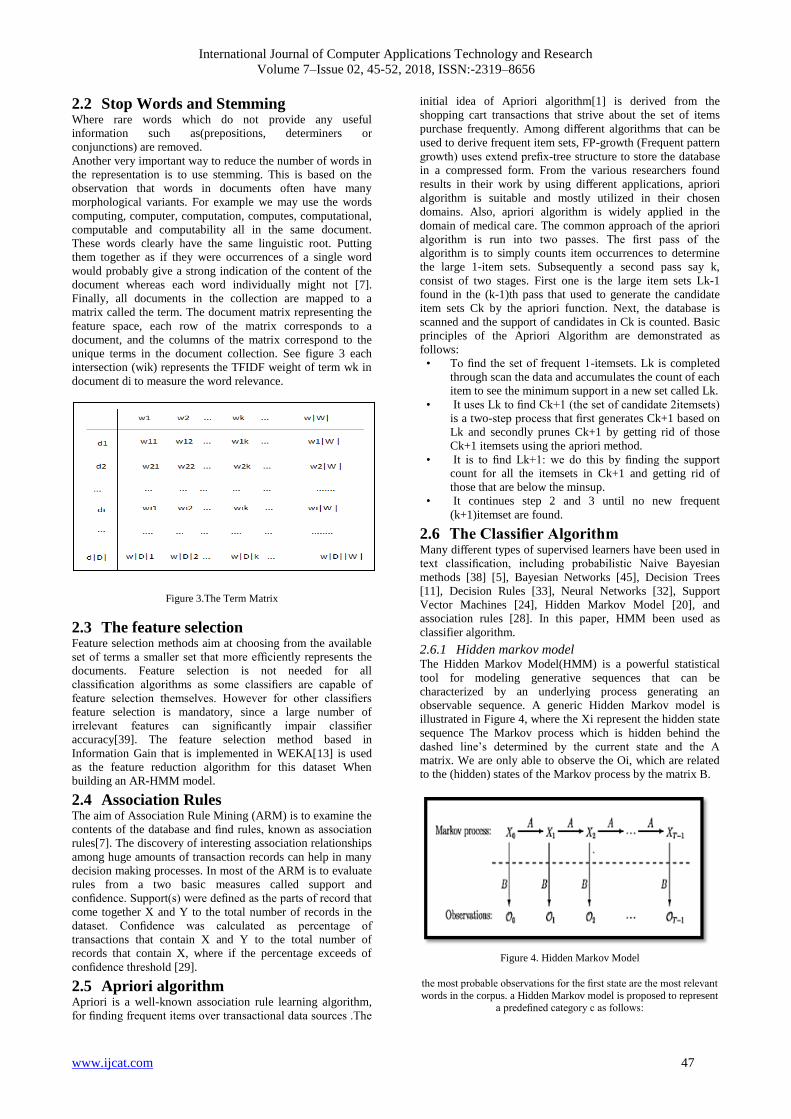
unique terms in the document collection. See figure 3 each
intersection (wik) represents the TFIDF weight of term wk in
document di to measure the word relevance.
Figure 3.The Term Matrix
2.3 The feature selection Feature selection methods aim at choosing from the available
set of terms a smaller set that more efficiently represents the
documents. Feature selection is not needed for all
classification algorithms as some classifiers are capable of
feature selection themselves. However for other classifiers
feature selection is mandatory, since a large number of
irrelevant features can significantly impair classifier
accuracy[39]. The feature selection method based in
Information Gain that is implemented in WEKA[13] is used
as the feature reduction algorithm for this dataset When
building an AR-HMM model.
2.4 Association Rules The aim of Association Rule Mining (ARM) is to examine the
contents of the database and find rules, known as association
rules[7]. The discovery of interesting association relationships
among huge amounts of transaction records can help in many
decision making processes. In most of the ARM is to evaluate
rules from a two basic measures called support and
confidence. Support(s) were defined as the parts of record that
come together X and Y to the total number of records in the
dataset. Confidence was calculated as percentage of
transactions that contain X and Y to the total number of
records that contain X, where if the percentage exceeds of
confidence threshold [29].
2.5 Apriori algorithm Apriori is a well-known association rule learning algorithm,
for finding frequent items over transactional data sources .The
initial idea of Apriori algorithm[1] is derived from the
shopping cart transactions that strive about the set of items
purchase frequently. Among different algorithms that can be
used to derive frequent item sets, FP-growth (Frequent pattern
growth) uses extend prefix-tree structure to store the database
in a compressed form. From the various researchers found
results in their work by using different applications, apriori
algorithm is suitable and mostly utilized in their chosen
domains. Also, apriori algorithm is widely applied in the
domain of medical care. The common approach of the apriori
algorithm is run into two passes. The first pass of the
algorithm is to simply counts item occurrences to determine
the large 1-item sets. Subsequently a second pass say k,
consist of two stages. First one is the large item sets Lk-1
found in the (k-1)th pass that used to generate the candidate
item sets Ck by the apriori function. Next, the database is
scanned and the support of candidates in Ck is counted. Basic
principles of the Apriori Algorithm are demonstrated as
follows:
• To find the set of frequent 1-itemsets. Lk is completed
through scan the data and accumulates the count of each
item to see the minimum support in a new set called Lk.
• It uses Lk to find Ck+1 (the set of candidate 2itemsets)
is a two-step process that first generates Ck+1 based on
Lk and secondly prunes Ck+1 by getting rid of those
Ck+1 itemsets using the apriori method.
• It is to find Lk+1: we do this by finding the support
count for all the itemsets in Ck+1 and getting rid of
those that are below the minsup.
• It continues step 2 and 3 until no new frequent
(k+1)itemset are found.
2.6 The Classifier Algorithm Many different types of supervised learners have been used in
text classification, including probabilistic Naive Bayesian
methods [38] [5], Bayesian Networks [45], Decision Trees
[11], Decision Rules [33], Neural Networks [32], Support
Vector Machines [24], Hidden Markov Model [20], and
association rules [28]. In this paper, HMM been used as
classifier algorithm.
2.6.1 Hidden markov model The Hidden Markov Model(HMM) is a powerful statistical
tool for modeling generative sequences that can be
characterized by an underlying process generating an
observable sequence. A generic Hidden Markov model is
illustrated in Figure 4, where the Xi represent the hidden state
sequence The Markov process which is hidden behind the
dashed line’s determined by the current state and the A
matrix. We are only able to observe the Oi, which are related
to the (hidden) states of the Markov process by the matrix B.
Figure 4. Hidden Markov Model
the most probable observations for the first state are the most relevant
words in the corpus. a Hidden Markov model is proposed to represent a predefined category c as follows:

International Journal of Computer Applications Technology and Research
Volume 7–Issue 02, 45-52, 2018, ISSN:-2319–8656
www.ijcat.com 48
• The union of words from the training corpus is taken as
the set of observation symbols V . For each word, there
is a symbol vk. The set of possible observations is the
same for every HMM, taking into account all words in
the corpus, regardless of their category.
• states represent ranking positions. Therefore, states are
ordered from the first rank to the last one. The state
transitions are ordered sequentially in the same way,
forming a left-right HMM [6] without self-state loops.
• The observation output probability distribution of each
state is defined according to the training corpus and
category c. A word/observation vk will have a higher
output probability at a given state si if the word appears
frequently with the same ranking position that si
represents.
• The initial probability distribution p is defined by giving
probability 1 to the first state s0. Once the two Hidden
Markov models are created and trained (one for each
category), a new document d can be classified by, first of
all, formatting it into an ordered wordlist Ld in the same
way as in the training process.
Then, as words are considered observations in our HMM, we
calculate the probability of the word sequence Ld being
produced by the two HMMs. That is, P(Ld—R) and P(Ld—
N) need to be computed, where R is the model for relevant
documents and N the model for non-relevant documents. The
final output class for document d will be the class represented
by the HMM with the highest calculated probability.
2.7 Performance measurements measuring the performance of a classifier is by its predictive
accuracy, i.e. the proportion of unseen instances it correctly
classifies. However this is not necessarily the case. There are
many other types of classification algorithm as well as :
• True Positive: positive instances that are correctly
classified as positive.
• False Positive: negative instances that are erroneously
classified as positive.
• False Negative: positive instances that are erroneously
classified as negative = 1 - True Positive Rate.
• True Negative: negative instances that are correctly
classified as negative.
• Precision: Proportion of instances classified as
Positive that are really positive.
precision =TP /TP + FP. (1)
• F1 Score A measure that combine Precision and
Recall.
F1 =2×precision×Recall/ Precision + Recall. (2)
3. RESULTS AND DISCUSSION To demonstrate the efficiency of the algorithm, a set of
experiments is presented which have been performed on the
OHSUMED biomedical corpus [17], each document in the set
has one or more associated category from 23 disease
categories.
3.1 Preparation of Datasets One of these categories is elected as relevant and consider the
others as non-relevant. Five categories are chosen as relevant:
Neoplasms (C04), Digestive (C06), Car-dio (C14),
Immunology (C20) and Pathology (C23).The other 18
categories are considered as the common bag of non-relevant documents. For each one of the five relevant categories,
corpora need to be pre-processed. Every document is
formatted into a vector of feature words which have been
described the word occurrence frequencies. All the different
words that appear in the training corpus are candidates for
feature words. To reduce the initial feature size, standard text
pre-processing techniques are used. A predefined list of
stopwords common English words is removed from the text
and a stemmer based on the Lovins stemmer is applied. The
feature selection method based in Information Gain is used as
the feature reduction algorithm, ending up with five distinct
matrices. That split into two matric relevant and non-relevant,
for each matric was been inputted as input to Aporior
algorithm. The feature wordset was sampled by the selection
of the higher 100 from the results of above steps, a different
corpus is created in the way mentioned above.
Most common (traditional) way of representing documents for
text ARM purposes is the Vector Space Model where
documents are represented as a single, high dimensional,
numeric vector d (where d is a subset of some vocabulary V).
A major concern of the apriori algorithm is the high
computational time needed to find frequent rule items from all
possible candidates at each level. The output form the apriori
was presented the number of state based on the support
threshold. We use text classification models such as NB and
SVM with these classifiers using the same corpus in order to
compare them with camper with our hybrid model were
applying a gaussian the kernel of SVM.
3.2 Experiments and results The proposed algorithm AR-HMM, SVM and NB are
implemented by c# programming language, where the SVM
was applied using a Gaussian kernel. The tests were made
with these classifiers using the same corpus in order to
compare SVM and NB with the AR-HMM. Table 1 shows the
results obtained from the preliminary analysis of the
experiments were carried out for the proposed AR-HMM, NB
and SVM. The results have shown the performance as
follows: The AR-HMM outperforms NB and SVM in
accuracy, recall and F1 measure for N class with each corpus.
While The AR-HMM outperforms NB and SVM in accuracy
for R class with each C4, C14, C20 corpus. The NB
outperforms AR_HMM and SVM in F1 measure for R class
except for C20 corpus, also SVM outperforms AR-HMM
and NB in the precision measure for R and N class with
C4, C6, and C14.
3.3 Discussion and Related Work
3.3.1 Discussion This section discusses the performances of classification by
showing accuracy and F1 measures, the average for all
corpus has taken with R and N classes. The accuracy is
measured by the effectiveness and efficiency of the classifier
and F1 is combined precision and recall measures . In the
partially, Table 2 shows the results of accuracy measure on R
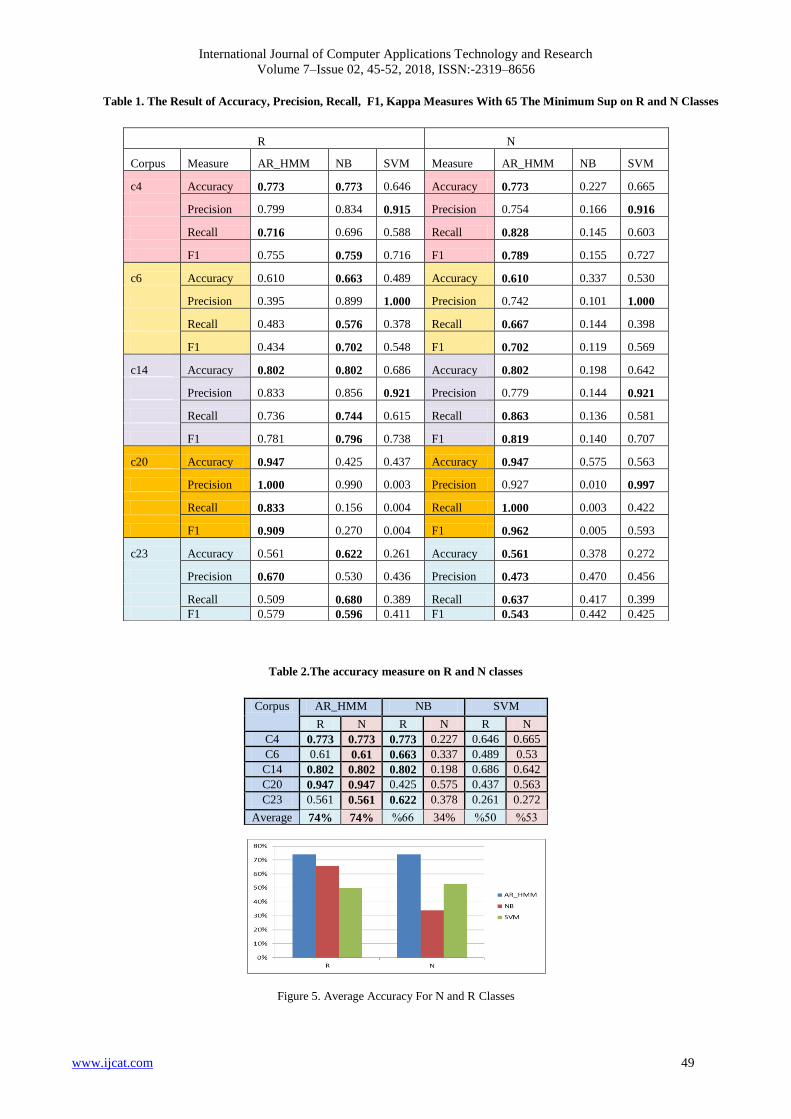
and N classes. According to N class AR-HMM outperforms
NB and SVM for each corpus, the AR-HMM gets 77%,
61%, 80%, 94%, 56% with C4, C6, C14, C20, and C23
respectively. In the case of R class AR-HMM gets 77%, 80%,
94%, with C4, C14, C20 respectively. While NB outperforms
AR-HMM and SVM in C6 and C23. As table.2, the average
for all corpus presents the order of accuracy algorithms,
whereas the AR-HMM algorithm gets74%, then NB algorithm
gets 66%, finally SVM algorithm gets 50% for R class. In
N class, the AR-HMM gets 74%, the SVM gets 53%, and
NB algorithm gets 34% as shown in figure 5 .
International Journal of Computer Applications Technology and Research
Volume 7–Issue 02, 45-52, 2018, ISSN:-2319–8656
www.ijcat.com 49
Table 1. The Result of Accuracy, Precision, Recall, F1, Kappa Measures With 65 The Minimum Sup on R and N Classes
Table 2.The accuracy measure on R and N classes
Figure 5. Average Accuracy For N and R Classes
R N
Corpus Measure AR_HMM NB SVM Measure AR_HMM NB SVM
c4 Accuracy 0.773 0.773 0.646 Accuracy 0.773 0.227 0.665
Precision 0.799 0.834 0.915 Precision 0.754 0.166 0.916
Recall 0.716 0.696 0.588 Recall 0.828 0.145 0.603
F1 0.755 0.759 0.716 F1 0.789 0.155 0.727
c6 Accuracy 0.610 0.663 0.489 Accuracy 0.610 0.337 0.530
Precision 0.395 0.899 1.000 Precision 0.742 0.101 1.000
Recall 0.483 0.576 0.378 Recall 0.667 0.144 0.398
F1 0.434 0.702 0.548 F1 0.702 0.119 0.569
c14 Accuracy 0.802 0.802 0.686 Accuracy 0.802 0.198 0.642
Precision 0.833 0.856 0.921 Precision 0.779 0.144 0.921
Recall 0.736 0.744 0.615 Recall 0.863 0.136 0.581
F1 0.781 0.796 0.738 F1 0.819 0.140 0.707
c20 Accuracy 0.947 0.425 0.437 Accuracy 0.947 0.575 0.563
Precision 1.000 0.990 0.003 Precision 0.927 0.010 0.997
Recall 0.833 0.156 0.004 Recall 1.000 0.003 0.422
F1 0.909 0.270 0.004 F1 0.962 0.005 0.593
c23 Accuracy 0.561 0.622 0.261 Accuracy 0.561 0.378 0.272
Precision 0.670 0.530 0.436 Precision 0.473 0.470 0.456
Recall 0.509 0.680 0.389 Recall 0.637 0.417 0.399
F1 0.579 0.596 0.411 F1 0.543 0.442 0.425
Corpus AR_HMM NB SVM
R N R N R N
C4 0.773 0.773 0.773 0.227 0.646 0.665
C6 0.61 0.61 0.663 0.337 0.489 0.53
C14 0.802 0.802 0.802 0.198 0.686 0.642
C20 0.947 0.947 0.425 0.575 0.437 0.563
C23 0.561 0.561 0.622 0.378 0.261 0.272
Average 74% 74% 66% 34% 05% 05%

International Journal of Computer Applications Technology and Research
Volume 7–Issue 02, 45-52, 2018, ISSN:-2319–8656
www.ijcat.com 50
In the table 3, shows the results of F1 measure on R and N
classes. In the case N class, The AR-HMM gets 78%, 70%,
81%, 96%, 54% with C4, C6, C14, C20, and C23
respectively. In the case R, AR-HMM gets 90%, with C20.
while NB have been getting 75%, 70%, 79%, 59% with C4,
C6, C14, C23 respectively.
Table 3. Measure F1 for R and N classes
Corpus AR_HMM NB SVM
R N R N R N
C4 0.755 0.789 0.759 0.155 0.716 0.727
C6 0.434 0.702 0.702 0.119 0.548 0.569
C14 0.781 0.819 0.796 0.140 0.738 0.707
C20 0.909 0.962 0.270 0.005 0.004 0.593
C23 0.579 0.543 0.596 0.442 0.411 0.425
Average 69% 76% 63% 17% 48% 60%
The average for all test corpus in above table shows the
results as :In R class, the AR-HMM algorithm gets 69%, NB
algorithm gets 63%, and SVM algorithm gets 48%.
According to N class the AR-HMM gets 76%, the SVM
gets 60%, then NB algorithm gets 17 % for as shown in
figure 6. In summary, for the informants in this analysis AR-
HMM outperforms NB and SVM.
Figure 6. Average F1 For N and R Classes
3.3.2 Related Work The theory of HMMs was developed in the late 1960s. HMM
was used as a statistical model for sequential process
application in temporal pattern recognition , i.e . speech[35],
handwriting [36] and bioinformatics [41], [47]. the model has
been extended to the text-related task such as information
retrieval [31] information extraction [13], [26] text
summarization [15] text categorization [6], [12], [42], [2] also
the model has been turned to the hybrid and novel model [41],
[22], [21] .In [31], the research use HMM in an information
retrieval model. Given a set of documents and a query Q, the
system searches a document D relevant to the query Q. It
computes the probability that D is the relevant document in
the users mind, given query Q, i.e P(D is R—Q), and ranks
the documents based on this measure. The HMM is viewed as
a generator of the query, and is used to estimate the
probability that each document will be produced in the corpus.
In the anther research[47], the research use the previous idea
in a similar approach. They describe the text classification as
the process of finding a relevant category c for a given
documented. They implement a Hidden Markov Model to
represent each category. Thus, given a document d, the
probability that a document d belongs to category c is
computed on the specific HMM model c.
In[17], The main idea of the article lies in setting up an HMM
classifier, combining x2 and an improved TF-IDF method and
reflecting the semantic relationship in the different categories.
The process shows the semantic character in different
documents to make the text categorization process more stable
and accurate.by [6] proposed novel two tier prediction
framework and present probabilistic model such as Markov
model and association rule mining. The models gives better
prediction accuracy without compromising prediction time but
suffers to scale on larger datasets.
In [41] use hmm in an original model for the classification of
biomedical texts stored in large document corpora. The model
classifies scientific documents according to their content using
information retrieval techniques and Hidden Markov Models,
they present a set of experiments which have been performed
on OHSUMED biomedical corpus, a subset of the MEDLINE
database, and the Allele and GO TREC corpora. their
classifier is also compared with Naive Bayes, k-NN and SVM
techniques.
In the anther hand, Classification rules are concerned with
predicting the value of a categorical attribute that has been
identified as being of particular importance. Agrawal et al [1]
introduced the AIS (Agrawal, Imielinski, Swami) algorithm
for mining association rules, the algorithm focuses on
improving the quality of databases along with the required
functionality to process queries and consequent association
rules are generated. In [2], the study presented an improved
algorithm named apriori for As association rule mining in
1994 and found more efficient. Apriori is an influential
algorithm for mining frequent itemsets for Boolean
association rules. In [16], worked and designed a tree
structure pattern mining algorithm called Frequent Pattern
(FP)-Tree algorithm. The FP-Tree algorithm generates
frequent itemsets by scanning the database only twice
without any iteration process for candidate generation. The
first one is FP-Tree construction process and the next one is
the generation of frequent patterns from the FP-Tree through a
procedure called FP-growth.
The FP-Growth Algorithm [15] is an alternative way to find
frequent itemsets without using candidate key generations,
thus improving performance. For so many, a divide-and-
conquer strategy has been using. Here the database had been
storing in the primary storage and to calculate the support of
all generated set of patterns. In [28] presents a system for
discovering association rule from the collections of
unstructured documents called Extract Association Rules from
Text (EART). The EART system has treated texts only not
images or figures. The study[34] presented Continuous
Association Rule Mining Algorithm (CARMA), an algorithm
to compute large itemsets online.The algorithm needs, at
most, two scans of the transaction sequence produce all large
itemsets. During the first scan -Phase-I, the algorithm
continuously con-structs a lattice of all potentially large
itemsets. Phase-II initially removes all itemsets which are
trivially small, i.e. itemsets with max Support below the last
user-specified threshold. On the anther side[48] propose a
new classification approach called classification based on
multiple classification rules (CMR). It combines the
advantages of both associative classification and rule-based
classification.
4. CONCLUSION Text classification is becoming a crucial task to analysts in
different areas. In the last few decades, the production of
International Journal of Computer Applications Technology and Research
Volume 7–Issue 02, 45-52, 2018, ISSN:-2319–8656
www.ijcat.com 51
textual documents in digital form has increased exponentially.
Their applications range from web pages to scientific
documents, including emails, news and books. This paper
investigated hybrid hidden Markov model with association
rules in automatic classification of biomedical text. were we
use the apiroir algorithm to determinate the size of number of
state hidden for hmm and we present a set of experiments
which have been performed on OHSUMED biomedical
corpus, a subset of the MEDLINE database. Our classifier
outperforms commonly used text classification techniques like
Naive Bayes and SVM techniques. In the whole process, there
are still some areas that could be improved. firstly, our model
were trained using a limited number of documents and terms
second, using a method of data mining like a neural networks
that can be make the rules dynamic or implementing use the
algorithm in many application such as computational biology
“DNA”, text retrieval, web searching, and handwriting.
5. REFERENCES [1] Agrawal, R., Imielin´ski, T. and Swami, A.1993,
“Mining association rules between sets of items in large
databases,” in Acm sigmod record, vol. 22, pp. 207–216,
ACM.
[2] Agrawal, R., Srikant, R. et al. , 1994, “Fast algorithms
for mining association rules,” in Proc. 20th int. conf.
very large data bases, VLDB, vol. 1215, pp. 487–499.
[3] Ananiadou, S. and McNaught, J. 2006.Text mining for
biology and biomedicine. Artech House London.
[4] Androutsopoulos, I., Koutsias, J., Chandrinos, K. V.
and Spyropoulos, C. D. 2000, “An experimental
comparison of naive bayesian and keyword-based anti-
spam filtering with personal e-mail messages,” in
Proceedings of the 23rd annual international ACM
SIGIR conference on Research and development in
information retrieval, pp. 160–167, ACM.
[5] Apt´e, C., Damerau, F. and Weiss, S. M. 1994,
“Automated learning of decision rules for text
categorization,” ACM Transactions on Information
Systems (TOIS), vol. 12, no. 3, pp. 233–251.
[6] Awad, M.A, and Khalil, I. 2012, Prediction of user’s
web-browsing behavior: Application of markov model.
IEEE Transactions on Systems, Man, and Cybernetics,
Part B (Cybernetics), 42(4):1131–1142.
[7] Bramer, M. 2007. Principles of data mining, vol. 180.
Springer.
[8] Chapman, W. W. and Cohen, K. B. 2009, “Current issues
in biomedical text mining and natural language
processing,” Journal of biomedical informatics, vol. 42,
no. 5, pp. 757–759.
[9] Chen, H., Fuller, S. S., Friedman, C. and Hersh, W.
2006. Medical informatics: knowledge management and
data mining in biomedicine, vol. 8. Springer Science &
Business Media.
[10] Conroy, J. M. and O’leary, D. P. 2001, “Text
summarization via hidden markov models,” in
Proceedings of the 24th annual international ACMSIGIR
conference on Research and development in information
retrieval, pp. 406–407, ACM.
[11] Dumais, S., Platt, J., Heckerman, D. and Sahami, M.
1998, “Inductive learning algorithms and representations
for text categorization,” in Proceedings of the seventh
international conference on Information and knowledge
management, pp. 148–155, ACM.
[12] Frasconi, P., Soda, G. and Vullo, A. 2002, “Hidden
markov models for text categorization in multi-page
documents,” Journal of Intelligent Information Systems,
vol. 18, no. 2-3, pp. 195–217.
[13] Freitag, D. and McCallum, A. 2000, “Information
extraction with hmm structures learned by stochastic
optimization,” AAAI/IAAI, vol. 2000, pp. 584–589.
[14] Glover, S. Rosenbaum, D. A. Graham, J. and Dixon, P.
2004, “Grasping the meaning of words,” Experimental
Brain Research, vol. 154, no. 1, pp. 103–108.
[15] Grahne, G. and Zhu, J. 2005, “Fast algorithms for
frequent itemset mining using fp-trees,” IEEE
transactions on knowledge and data engineering, vol. 17,
no. 10, pp. 1347– 1362.
[16] Han, J., Pei, J. and Yin, Y. 2000, “Mining frequent
patterns without candidate generation,” in ACM sigmod
record, vol. 29, pp. 1–12, ACM.
[17] Hersh, W., Buckley, C., Leone, T. and Hickam, D. 1994,
“Ohsumed: An interactive retrieval evaluation and new
large test collection for research,” in SIGIR94, pp. 192–
201, Springer.
[18] Izenman, A J. 2008, Modern Multivariate Statistical
Techniques: Regression, Classification, and Manifold
Learning.
[19] Joachims, T. 1998. “Text categorization with support
vector machines: Learning with many relevant features,”
Machine learning: ECML-98, pp. 137– 142.
[20] John, G. H., Kohavi, R., Pfleger, K. et al. , 1994,
“Irrelevant features and the subset selection problem,” in
Machine learning: proceedings of the eleventh
international conference, pp. 121–129.
[21] Krishnalal, G and Rengarajan, S and Srinivasagan, KG,
2010, ’ A new text mining approach based on HMM-
SVM for web news classification ’,International Journal
of Computer Applications,vol.1,no.19,pp.98–
104,Citeseer .
[22] Khosronejad, M. and Sharififar, E., Torshizi, H. A.and
Jalali, M., 2013,’ Developing a hybrid method of
Hidden Markov Models and C5. 0 as a Intrusion
Detection System ’,International Journal of Database
Theory and Application,vol.6,no.5,pp.165–174
[23] Kairong Li, G., Chen and Cheng , J..2011 ,“Research on
hidden markov model based text categorization process,”
in International Journal of Digital Content Technology
and its Application, pp. 244–251.
[24] Lam, W., Ruiz, M., and Srinivasan, P. 1999, “Automatic
text categorization and its application to text retrieval,”
IEEE Transactions on Knowledge and Data engineering,
vol. 11, no. 6, pp. 865–879.
[25] Larkey, L. S. and Croft, W. B. 1996, “Combining
classifiers in text categorization,” in Proceedings of the
19th annual international ACM SIGIR conference on

International Journal of Computer Applications Technology and Research
Volume 7–Issue 02, 45-52, 2018, ISSN:-2319–8656
www.ijcat.com 52
Research and development in information retrieval, pp.
289– 297, ACM.
[26] Leek, T. R. 1997. Information extraction using hidden
Markov models. PhD thesis, University of California,
San Diego.
[27] Lewis, D. D. 1998. “Naive(Bayes) at forty: The
independence assumption in information retrieval,” in
European conference on machine learning, pp. 4–15,
Springer.
[28] Mahgoub, H. and Ro¨sner, D. 2006, “Mining association
rules from unstructured documents,” in Proc. 3rd Int.
Conf. on Knowledge Mining, ICKM, Prague, Czech
Republic, pp. 167–172.
[29] Manimaran, J. and Velmurugan, T. 2013," A Survey of
Association Rule Mining in Text applications", IEEE,
pp.698-702.
[30] McCallum, A., Nigam, K. et al. , 1998, “A comparison
of event models for naive bayes text classification,” in
AAAI-98 workshop on learning for text categorization,
vol. 752, pp. 41–48, Citeseer.
[31] Miller, D. R., Leek, T. and Schwartz, R. M. 1999, “A
hidden markov model information retrieval system,” in
Proceedings of the 22nd annual international ACM
SIGIR conference on Research and development in
information retrieval, pp. 214–221, ACM.
[32] Mladeni´c, D. 1998, “Feature subset selection in text-
learning,” Machine learning: ECML-98, pp. 95–100.
[33] Moulinier, I., Raskinis, G., and Ganascia, J. 1996, “Text
categorization: a symbolic approach,” in proceedings of
the fifth annual symposium on document analysis and
information retrieval, pp. 87–99.
[34] Olmezogullari, E. and Ari, I. 2013, “Online association
rule mining over fast data,” in Big Data (BigData
Congress), 2013 IEEE International Congress on, pp.
110–117, IEEE.
[35] Rabiner, L. R. 1989, “A tutorial on hidden markov
models and selected applications in speech recognition,”
vol. 77, FEBRUARY.
[36] Rothacker, L. and Fink, G. A. 2016 ,“Robust output
modeling in bag-of features hmms for handwriting
recognition,” in Frontiers in Handwriting Recognition
(ICFHR), 15th International Conference on, pp. 199–
204, IEEE.
[37] Schweighofer, E. and Merkl, D. 1999. “A learning
technique for legal document analysis,” in Proceedings
of the 7th international conference on Artificial
intelligence and law, pp. 156–163, ACM.
[38] Sebastiani, F. et al. , 1999, “A tutorial on automated text
categorisation,” in Proceedings of ASAI-99, 1st
Argentinian Symposium on Artificial Intelligence, pp. 7–
35, Buenos Aires, AR.
[39] Silva, C. and Ribeiro, B. 2009. Inductive inference for
large scale text classification: kernel approaches and
techniques, vol. 255. Springer.
[40] Simpson, M. S. and Demner-Fushman, D. 2012,
“Biomedical text mining: A survey of recent progress,”
in Mining text data, pp. 465–517, Springer.
[41] Vieira, A. S. Iglesias, E. L. and Borrajo, L. 2014. “T-
hmm: a novel biomedical text classifier based on hidden
markov models,” in 8th International Conference on
Practical Applications of Computational Biology &
Bioinformatics (PACBB 2014), pp. 225–234, Springer.
[42] Xu, R., Supekar, K. S. , Huang, Y., Das, A. K.,
Garber, A.M .2006,’ Combining Text Classification and
Hidden Markov Modeling Techniques for Structuring
Randomized Clinical Trial Abstracts ,McGill University
,AMIA.
[43] Yang, Z. 1997. “Paml: a program package for
phylogenetic analysis by maximum likelihood,”
Computer applications in the biosciences: CABIOS, vol.
13, no. 5, pp. 555– 556.
[44] Yang, Y. and Liu, X. 1999. “A re-examination of text
categorization methods,” in Proceedings of the 22nd
annual international ACM SIGIR conference on
Research and development in information retrieval, pp.
42–49, ACM.
[45] Yang, Y. and Pedersen, J. O. 1997, “A comparative
study on feature selection in text categorization,” in Icml,
vol. 97, pp. 412–420.
[46] Yi, K. 2005. Text classification using a hidden Markov
model. McGill University.
[47] Yi, K. and Beheshti, J. 2009, “A hidden markov model-
based text classification of medical documents,” Journal
of Information Science, vol. 35, no. 1, pp. 67–81.
[48] Zhou, Z. 2014, “A new classification approach based on
multiple classification rules,” Mathematical Problems in
Engineering, vol. 2014.
[49] Zweigenbaum, P. Demner-Fushman, D. Yu, H. and
Cohen, K. B. 2007, “Frontiers of biomedical text mining:
current progress,” Briefings in bioinformatics, vol. 8, no.
5, pp. 358–375.
[50] Zweigenbaum, P. and Demner-Fushman, D. 2009,
“Advanced literature-mining tools,” in Bioinformatics,
pp. 347–380, Springer.
International Journal of Computer Applications Technology and Research
Volume 7–Issue 02, 53-57, 2018, ISSN:-2319–8656
www.ijcat.com 53
An Autonomous Approach for High Availability and Fault Tolerance using Effective Monitoring in Cloud Data
Center
Riddhi Trivedi
ME Student
GTU PG SCHOOL
Gandhinagar, India
Miren Karamta
Project Scientist
BISAG
Gandhinagar, India
Hardik Upadhyay
Assistant Professor
GPERI
Mehsana, India
Dr. M. B. Potdar
Project Director
BISAG
Gandhinagar, India
Abstract: The reason of grid monitoring and management is to detect offerings in grid surroundings for fault detection, performance
evaluation, performance tuning, load balancing and scheduling. We have reviewed and worked on a self-managing fault-tolerance
framework for high availability, scalability and reliability in cloud data center with proper monitoring tool which is deployed for
Cluster monitoring and balancing purpose. This framework introduces the load balancers combined with Ganglia Monitoring System.
The proposed framework is designed to overcome the issues regarding the high availability, fault tolerance, major downtime, self-
healing, etc in cloud data center. HAProxy has been used to offer scaling to the servers for load balancing in proactive way. It
additionally monitors the web servers for fault prevention on the client level. Our structure works with self-managed mirroring and
load balancing in database servers with the help of MySQL master, replication of master database and Nginx consequently.
Administrator supervise the running of servers through Ganglia Monitoring System because 24x7 manual monitoring cannot be
possibly done by the cloud data center. For that we have carried out this scenario by using the virtualization technique in cloud
environment.
Keywords: grid monitoring, Ganglia Monitoring System, cloud data center, HAProxy, load balancing, high availability, fault tolerance
1. INTRODUCTION
It’s far a totally hard job in the cloud data center that how and
where the computing is to be performed inside the cloud data
center. Which will make a cloud dependable for the genuine
customers, so many different issues are there like load
balancing, fault tolerance, availability, safety in cloud data
centers, etc. If by some means even after the occurrence of
incidences of a few flaws in the system, if our architecture
keeps running then the given structure is highly available and
fault tolerable. So many strategies has been invented with a
purpose to make cloud data center more reliable still it's far a
totally hard activity to make it efficient. The components like
very huge infrastructure, on call for carrier requirement inside
the cloud data center consequences lots in the efficiently
running of the cloud. In our proposition work using automated
running, scaling, virtualization of a system, replication of
data, monitoring of an environment and inside the computer
code repository dynamic automation of software is finished
using presumption fulfilled through an additional technique.
In this given outlook dedicated approach has been used for
high availability.
So as to representing TCP and HTTP based applications, load
balancing between more than one servers a freely accessible
High Availability Proxy is being used which presents
distinguished accessibility. Through using the weight
alternative supplied by means of the HAProxy corresponding
to separate servers’ solution provider can migrate the weight
according to the requirements. Client side servlets are being
used to send and accept the requests over HTTP. For making
connections to the database iptable is being used. MySQL port
is used in iptable to store the data in the concurrent database
by taking the help of Nginx. Nginx is used as a load balancer
in HAProxy which manages each of the database servers. The
load between database servers are controlled by Nginx
according to their precedence that is assigned to them. Live
replication of the MySQL database is being performed by
using master-master methodology for the purpose of
deployment over special virtual personal servers. We can
copy the server data from one database server to another by
using the replication. This facilitates us in including
redundancy and allows in growing efficiency when users are
looking to get access to the statistics. Then ganglia monitors
the comprehensive infrastructure, recognizing of the trouble
before its authentic occurrence, distinguishing the breaches
associated with the safety and many others. VMware creates
safe Linux Container for the applications so that the
administrator and developers can port the applications
together. The main goal of using VMware is to allow them
deploying across systems.
2. LITERATURE REVIEW
A massive amount of work has been completed within the
location of toes in cloud data center however there are many
demanding situations in it like high availability, fault
tolerance, protection, records control and so forth. For the
resolution of high availability many research work is
performed with various different methodologies. Many pro-
active and retroactive tools and methods have been invented
for the execution of high availability in cloud data center like
appropriate migration of application to other properly working
server, rebooting the whole system, self-repairing, etc. and
tools are used like HAProxy, Hadoop, etc. Normal
architecture of a web server with load balancer and
application server cannot provide the high availability in
cloud data center. Here load balancers performs as data
center’s single point of presence. It is installed between the
internet and the backend servers. This architecture causes a
single point failure for the network so the new approach came
which is performed as duplicating the content on multiple host
machines, and balancing the load between those host
machines with the help of DNS with basic round-robin load
balancing. But DNS load balancing has the problems like
alternative IP cannot be tried by users. The approach named
failover support in which increasing the availability they are

International Journal of Computer Applications Technology and Research
Volume 7–Issue 02, 53-57, 2018, ISSN:-2319–8656
www.ijcat.com 54
configuring another load balancer as a backup for the primary
load balancer but they don’t have any monitoring mechanism
in their implemented scenario.
In the given approach, to make system highly available the
proactive strategy is being used by taking the help of
HAProxy. For gaining the superior performance of database
servers and application servers the load balancer is used to
manage the load between all the servers and Ganglia
Monitoring System is also used over load balancers to
monitor the architecture and to send or receive the real time
status to the administrator 24x7.
2.1 Nagios Nagios is a freeware to use and edit. It is very easy to add a
custom script for extension of service availability. Anyone
can monitor any system by using the SNMP protocol over
their systems. It provides you variety of plugins and add-ons
for better development and download. It also gives alerts,
notifications or comments on the status of the architecture.
But the drawbacks are like, many features like wizards or
interactive dashboards are not available for the freeware of
Nagios. Configurations of some files are very hard. It has very
confusing interface. It can’t monitor the network usage or
bandwidth available. It can just monitor the network but
cannot manage it.
2.2 Ganglia Monitoring System Ganglia, a scalable dispersed monitoring system which was
built to label these issues and challenges. Ganglia Scalable
Monitoring Systems at different points in the architecture
includes large scale clusters and nodes in an instrument room,
computing grids, existing association of clusters and viewing
application on an open and shared platform [2, 3]. This system
is depends on a hierarchical structure which is targeted at
association of clusters. It depends on a multicast based
listen/announce protocol [4, 5, 6, 7] to monitor the situation
within the clusters and it uses a tree of peer-to-peer
connections between illustrative clusters nodes to associate
clusters and entirely their state. It holds widely used tools and
technologies like XML for data characterization, XDR for
dense, transferable data transport, and RRDtool for statistics
catch and visualization. It is using smartly organized
algorithms and data structures to gain very less overheads per
node and high compatibility[1]. The execution is robust, and
been transported to set of large scale operation systems and
architecture of high processors, and is used over 2000 clusters
around the world[1].
A). Working of Ganglia[1]: Tracking on a single cluster is
implemented through the ganglia monitoring daemon (gmond)
(Fig: 1). gmond is ready as a collection of threads, each
assigned a particular venture. Assemble and post thread is
answerable for converging neighborhood node records,
publishing it on a famous multicast channel, and sending
periodic heartbeats. The listening threads are responsible for
listening on the multicast channel for tracking records from
other nodes and updating gmond’s in-reminiscence storage, a
hierarchical hash table of monitoring metrics. In the end, a
thread pool of xml export threads are devoted to accepting and
processing consumer requests for monitoring information. All
facts stored by using gmond is gentle United States and
nothing is ever written to disk. This, blended with all nodes
multicasting their area, method that a new gmond comes into
a fact really via listening and saying.
Fig. 1 Working of Ganglia
3. PROPOSED WORK
3.1 Coherent Benefits of New Approach To gain high availability in cloud data center, the stated
approach gives many amenities for the applications so the
dynamic changes can be done very easily during the
implementation. The facilities given are as below:
1) For the motive of quick and smooth revolution for any
latest created server specimen and a load balancer, the
VMware and HAProxy together is being useful. VMware
provides OS level virtualization. The new specimen can be
created very easily and dynamically by the VMware.
2) High Availability Proxy can manage the load with the
help of weight option and Round-Robin method which have
the priority options. If any one of the server fails to handle the
request the requests can be handled by another servers.
3) Nginx is used as a load balancer in backend which
helps in balancing the operations of database requests in a
way that operations of database can be divided between a few
database replicated servers in a better way by using different
algorithms and weights alternatives.
4) By using the replication techniques number of MySQL
node has been made to work together as a cluster [8]. So the
replicated copy of data will always be there to provide fault
tolerance and high availability.
5) Seeing that the architecture is having the cluster of two
different databases. The problems like integrity of data, data
lost, consistency of data which is related to database
management can be reduced a lot.
6) The forecast of the availableness, fault and ongoing
monitoring has been done using Ganglia Monitoring System.
It acknowledges 24x7 to the administrator about the database
servers, application servers and the load balancers because the
administrator can’t handle the large amount of data manually.
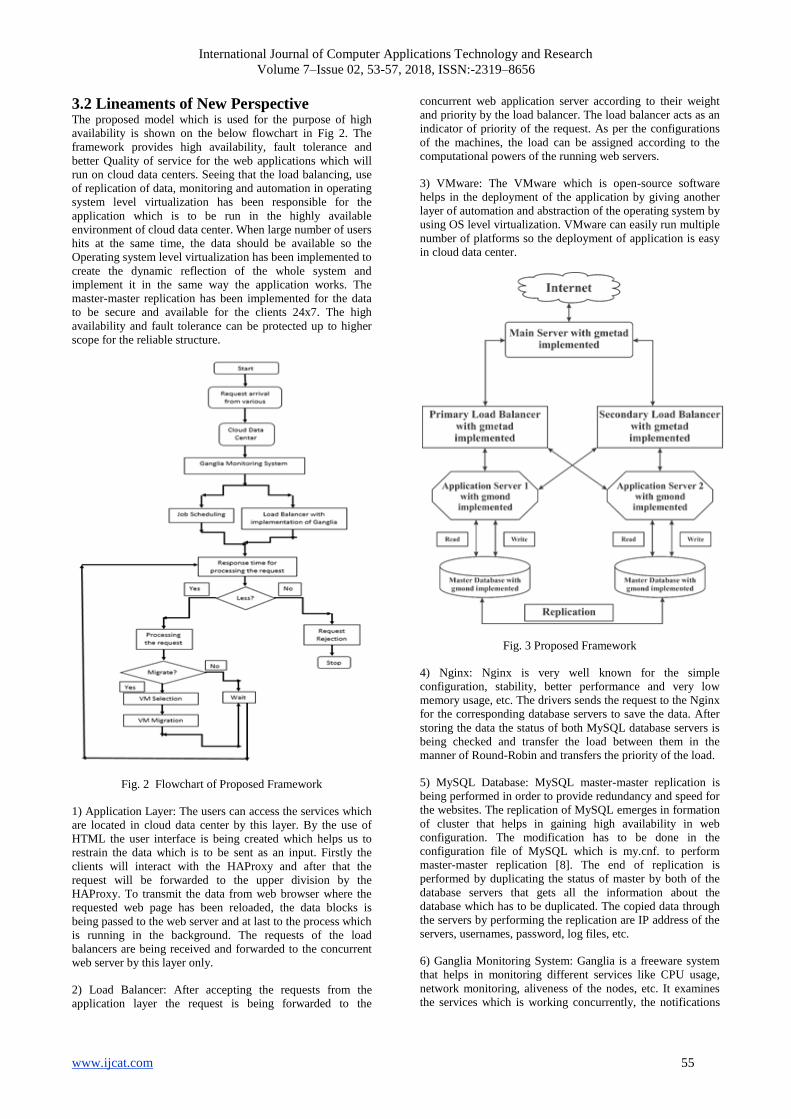
International Journal of Computer Applications Technology and Research
Volume 7–Issue 02, 53-57, 2018, ISSN:-2319–8656
www.ijcat.com 55
3.2 Lineaments of New Perspective The proposed model which is used for the purpose of high
availability is shown on the below flowchart in Fig 2. The
framework provides high availability, fault tolerance and
better Quality of service for the web applications which will
run on cloud data centers. Seeing that the load balancing, use
of replication of data, monitoring and automation in operating
system level virtualization has been responsible for the
application which is to be run in the highly available
environment of cloud data center. When large number of users
hits at the same time, the data should be available so the
Operating system level virtualization has been implemented to
create the dynamic reflection of the whole system and
implement it in the same way the application works. The
master-master replication has been implemented for the data
to be secure and available for the clients 24x7. The high
availability and fault tolerance can be protected up to higher
scope for the reliable structure.
Fig. 2 Flowchart of Proposed Framework
1) Application Layer: The users can access the services which
are located in cloud data center by this layer. By the use of
HTML the user interface is being created which helps us to
restrain the data which is to be sent as an input. Firstly the
clients will interact with the HAProxy and after that the
request will be forwarded to the upper division by the
HAProxy. To transmit the data from web browser where the
requested web page has been reloaded, the data blocks is
being passed to the web server and at last to the process which
is running in the background. The requests of the load
balancers are being received and forwarded to the concurrent
web server by this layer only.
2) Load Balancer: After accepting the requests from the
application layer the request is being forwarded to the
concurrent web application server according to their weight
and priority by the load balancer. The load balancer acts as an
indicator of priority of the request. As per the configurations
of the machines, the load can be assigned according to the
computational powers of the running web servers.
3) VMware: The VMware which is open-source software
helps in the deployment of the application by giving another
layer of automation and abstraction of the operating system by
using OS level virtualization. VMware can easily run multiple
number of platforms so the deployment of application is easy
in cloud data center.
Fig. 3 Proposed Framework
4) Nginx: Nginx is very well known for the simple
configuration, stability, better performance and very low
memory usage, etc. The drivers sends the request to the Nginx
for the corresponding database servers to save the data. After
storing the data the status of both MySQL database servers is
being checked and transfer the load between them in the
manner of Round-Robin and transfers the priority of the load.
5) MySQL Database: MySQL master-master replication is
being performed in order to provide redundancy and speed for
the websites. The replication of MySQL emerges in formation
of cluster that helps in gaining high availability in web
configuration. The modification has to be done in the
configuration file of MySQL which is my.cnf. to perform
master-master replication [8]. The end of replication is
performed by duplicating the status of master by both of the
database servers that gets all the information about the
database which has to be duplicated. The copied data through
the servers by performing the replication are IP address of the
servers, usernames, password, log files, etc.
6) Ganglia Monitoring System: Ganglia is a freeware system
that helps in monitoring different services like CPU usage,
network monitoring, aliveness of the nodes, etc. It examines
the services which is working concurrently, the notifications

International Journal of Computer Applications Technology and Research
Volume 7–Issue 02, 53-57, 2018, ISSN:-2319–8656
www.ijcat.com 56
by any contacts in the situation when any problem gets arises
or resolved. A health check program is being used to monitor
the MySQL database and the connection between the active
and passive load balancers. The parameters which is to be
monitored are uptime, logs, master-slave sql running,
connection time, connected threads, etc.
4. OVERVIEW OF ARCHITECTURE
A. Handling client request: The client will send the request by
getting into the IP address or Domain name system which is
assigned to the application running. HAProxy server will
forward the request to the web server without knowing any
knowledge of the client.
B. Balancing the incoming request between web servers:
After getting the request from the client HAProxy is to check
the availability of the application servers and balancing the
load between the application servers which are linked up with
HAProxy [8]. According to the priority of the requests the
HAProxy will forward the requests to the corresponding
servers. The priorities are assigned to in the file of
configuration with the help of weight option so load
distribution is available as per the configuration of the system.
The working of the servers are also being checked by the
HAProxy. The statistical report is being generated when any
of the server goes down. In HAProxy red colour indicates the
failure of the server and the green colour running of the
server.
C. What if both the servers are fully occupied?: HAProxy is
efficiently balancing the load among the web servers. If at any
case the number of requests are being increased which is more
than the number of requests which is handled by the servers.
In this scenario VMware can be used as an Operating system
level virtualization. In this case VMware separates our
infrastructure from the given infrastructure and handle our
application in a managed way. Here, in such scenario VM
image is generated which can hold our application. It results
as dynamically more web servers can be installed by the use
of VM images that’s why the entire load can be managed
easily.
D. Load Balancing using Nginx and Ganglia: By using Nginx
for balancing the load and ganglia for managing it, we got the
procedure through which we can distribute the incoming load
of the traffic. The database requests among the different
database servers as per the requirements. The load distribution
can be decided by the configurations of VMs available at
where database is loaded. So distribution of the requests
between different VMs gives us the high availability and fault
tolerance by giving the redundancy, stability to the
application.
E. Replication of Database: High availability and the fault
tolerance in database is being performed by configuring
MySQL master-master Replication [8]. Requests of the
database between the servers is managed by doing load
balancing with the help of Nginx [9]. It can also tackle the
queries which is related to write operations in database
servers. If number of write operations are not very frequently
performed and application is mainly deals with the read
operations then with the help of our proposed work we can
increase the client response to much higher level.
F. Monitoring MySQL: As the database is having large
number of entities stored in it, it is very difficult to find any
incompatibility manually in the database. For monitoring the
database the ganglia monitoring system is being used for the
purpose of fault tolerance and high availability. Ganglia will
address the administrator about the condition of the database
server and if it is working in a proper condition or not. It
notifies the admin through email, remote access, web
interface, etc. Though administrator is able to perform
monitoring 24x7.
5. CONCLUSION
In this paper the proposed model and implementation provides
the high availability, fault tolerance by safeguarding
availability, scalability and reliability. The different
conditions shows different situations like unexpected hike in
traffic, growth of traffic, many internal problems like
maintenance of the components, failure of the servers can be
easily handled by the HAProxy. HAProxy with the help of
Nginx and Ganglia balances the load between servers. It is
also capable to redirect the load to the other server if any web
servers is going through the failure. VMware provides the OS
level virtualization by separating the applications from the
system. Mirror copy of the database is being maintained by
the Master-Master replication. Nginx is used to balance the
load between primary and secondary servers and database
servers and able to redirect the requests if any of the server
fails. Ganglia Monitoring System enables the feature of
automatic monitoring of the servers that increases the
efficiency and accuracy. For the future work various types of
database locks can be used by the database server for the
effective use of database.
6. ACKNOWLEDGMENTS
We are thankful to Shree T. P. Singh, Director, BISAG for
providing infrastructure and encouragements. Special thanks
to Mr. Margam Suthar, Principal, GTU PG SCHOOL,
Gandhinagar for initial guidance.
REFERENCES [1] Massie, Matthew L., Brent N. Chun, and David E.
Culler. "The ganglia distributed monitoring system:
design, implementation, and experience." Parallel
Computing 30.7 (2004): 817-840.
[2] Foster, Ian, and Carl Kesselman. "Globus: A
metacomputing infrastructure toolkit." The International
Journal of Supercomputer Applications and High
Performance Computing 11.2 (1997): 115-128.
[3] Foster, Ian, Carl Kesselman, and Steven Tuecke. "The
anatomy of the grid: Enabling scalable virtual
organizations." The International Journal of High
Performance Computing Applications 15.3 (2001): 200-
222.
[4] Amir, Elan, Steven McCanne, and Randy Katz. "An
active service framework and its application to real-time

International Journal of Computer Applications Technology and Research
Volume 7–Issue 02, 53-57, 2018, ISSN:-2319–8656
www.ijcat.com 57
multimedia transcoding." ACM SIGCOMM Computer
Communication Review. Vol. 28. No. 4. ACM, 1998.
[5] Chun, Brent, and David Culler. "Rexec: A decentralized,
secure remote execution environment for clusters."
Network-Based Parallel Computing. Communication,
Architecture, and Applications (2000): 1-14.
[6] Fox, Armando, et al. "Cluster-based scalable network
services." ACM SIGOPS operating systems review. Vol.
31. No. 5. ACM, 1997.
[7] Stumm, Michael. "The design and implementation of a
decentralized scheduling facility for a workstation
cluster." Computer Workstations, 1988., Proceedings of
the 2nd IEEE Conference on. IEEE, 1988.
[8] (2015) Digital Ocean, Inc.(US), master-master
replication. [Online]. Available:
http://www.digitalocean.com/
[9] (2015) Nginx: Load Balancer. [Online]. Available:
wiki.nginx.org/Main
[10] Garg, Ashima, and Sachin Bagga. "An autonomic
approach for fault tolerance using scaling, replication and
monitoring in cloud computing." MOOCs, Innovation
and Technology in Education (MITE), 2015 IEEE 3rd
International Conference on. IEEE, 2015.
[11] Tchana, Alain, Laurent Broto, and Daniel Hagimont.
"Approaches to cloud computing fault tolerance."
Computer, Information and Telecommunication Systems
(CITS), 2012 International Conference on. IEEE, 2012.
[12] Bala, Anju, and Inderveer Chana. "Fault tolerance-
challenges, techniques and implementation in cloud
computing." IJCSI International Journal of Computer
Science Issues 9.1 (2012): 1694-0814.
[13] Jhawar, Ravi, Vincenzo Piuri, and Marco Santambrogio.
"A comprehensive conceptual system-level approach to
fault tolerance in cloud computing." Systems Conference
(SysCon), 2012 IEEE International. IEEE, 2012.
[14] Das, Pranesh, and Pabitra Mohan Khilar. "VFT: A
virtualization and fault tolerance approach for cloud
computing." Information & Communication
Technologies (ICT), 2013 IEEE Conference on. IEEE,
2013.
[15] Malik, Sheheryar, and Fabrice Huet. "Adaptive fault
tolerance in real time cloud computing." Services
(SERVICES), 2011 IEEE World Congress on. IEEE,
2011.
[16] Gupta, Dhananjya, and Anju Bala. "Autonomic Fault
Tolerant Framework for Web Applications."
International Journal of Computer Science and
Telecommunication (IJCST) 4.2 (2013): 528-533.
[17] Santhosh, R., and T. Ravichandran. "Pre-emptive
scheduling of on-line real time services with task
migration for cloud computing." Pattern Recognition,
Informatics and Mobile Engineering (PRIME), 2013
International Conference on. IEEE, 2013.
[18] Dai, Yuanshun, Yanping Xiang, and Gewei Zhang.
"Self-healing and hybrid diagnosis in cloud computing."
Cloud computing (2009): 45-56.
[19] Anderson, Eric, and David A. Patterson. "Extensible,
Scalable Monitoring for Clusters of Computers." LISA.
Vol. 97. 1997.
[20] Brewer, Eric A. "Lessons from giant-scale services."
IEEE Internet Computing 5.4 (2001): 46-55.
[21] Chakrabarti, Soumen, et al. "Automatic resource
compilation by analyzing hyperlink structure and
associated text." Computer networks and ISDN systems
30.1-7 (1998): 65-74.
[22] Buyya, Rajkumar. "PARMON: a portable and scalable
monitoring system for clusters." Software-Practice and
Experience 30.7 (2000): 723-740.
[23] Chien, Andrew A., et al. "High Performance Virtual
Machines (HPVM'S): Clusters with Supercomputing
API's and Performance." PPSC. 1997.
[24] Czajkowski, Karl, et al. "Grid information services for
distributed resource sharing." High Performance
Distributed Computing, 2001. Proceedings. 10th IEEE
International Symposium on. IEEE, 2001.
[25] Foster, Ian, Carl Kesselman, and Steven Tuecke. "The
anatomy of the grid: Enabling scalable virtual
organizations." The International Journal of High
Performance Computing Applications 15.3 (2001): 200-
222.
[26] Harren, Matthew, et al. "Complex queries in DHT-based
peer-to-peer networks." Peer-to-peer systems (2002):
242-250.
[27] Rowstron, Antony, and Peter Druschel. "Pastry: Scalable,
decentralized object location, and routing for large-scale
peer-to-peer systems." IFIP/ACM International
Conference on Distributed Systems Platforms and Open
Distributed Processing. Springer, Berlin, Heidelberg,
2001.
[28] Sottile, Matthew J., and Ronald G. Minnich. "Supermon:
A high-speed cluster monitoring system." Cluster
Computing, 2002. Proceedings. 2002 IEEE International
Conference on. IEEE, 2002.
[29] Van Renesse, Robbert, Kenneth P. Birman, and Werner
Vogels. "Astrolabe: A robust and scalable technology for
distributed system monitoring, management, and data
mining." ACM transactions on computer systems
(TOCS) 21.2 (2003): 164-206.
[30] Zhao, Ben Yanbin, John Kubiatowicz, and Anthony D.
Joseph. "Tapestry: An infrastructure for fault-tolerant
wide-area location and routing." (2001): 70.

International Journal of Computer Applications Technology and Research
Volume 7–Issue 02, 58-62, 2018, ISSN:-2319–8656
www.ijcat.com 58
Endpoint Protection through Windows Operating
System Hardening
Shruchi Mistry
M.E Student, GTU PG School,
Gandhinagar 382007, Gujarat,
India
Punit Lalwani
Project Scientist,
Bhaskaracharya Institute for
Space Applications and Geo-
Informatics,
Gandhinagar 382007, India
M. B. Potdar
Project Director,
Bhaskaracharya Institute for
Space Applications and Geo-
Informatics,
Gandhinagar 382007, India
Abstract: Nowadays Cybercrimes are rapidly increasing. Systems are always vulnerable to attack due to Security misconfiguration.
Most of the systems are vulnerable at client side or endpoint. The intrusion into the system can be done via violating operating systems
vulnerabilities. Windows operating system has its own security functionalities and configurations. Most users not setup the security
configuration properly and because of that systems are vulnerable to attacks. Today very sophisticated attacks like Ransomware,
malware, Remote Admin tools etc. can be exploit throughout the system, which is securely misconfigured.
Windows operating system hardening is the only solution against such threats to the system. System hardening is the technique
through which users can generate a checklist according to the requirements. A ransomware like Wanncry and Petya infected almost
windows system due to security misconfiguration. This project is focused on preparing the checklist for security configuration in
Windows operating system as per versions and vulnerabilities related with those OS versions; also Securely Audit those systems
periodical basis to maintain required security level. As result automated system audit report framework will be developed to maintain
the security level of Windows based operating system.
Keywords: OS Hardening; Security Checklist; Vulnerability; Security Audit; Threats; Ransomware
1. INTRODUCTION Operating System (OS) hardening is the cyclic process of
configuring an Operating System as per security requirements.
OS hardening includes installing regular updates from OS
developers and also patches the vulnerabilities with automated
tools or manual efforts. In OS Hardening user can create rules
and defined policies to keep the system secure against cyber
threats. OS Hardening should be performed periodically to
minimizing the possible risks possessed by OS, to the system
or network.[1] Operating System Security Audit is a powerful
method to harden the security of any operating system.
Security audit of an Operating System can be used for user
malicious activity identification, system forensic investigation
and security compliance. Security audit is helpful to any of
the security auditor to ensure the security levels of the
information is maintained as per compliance and standards
predefined by the users.
2. BACKGROUND SURVEY Today insider threats are at rise. Corporate, Governments
sectors, Multinational firms data at risk not due to external
attack but internal leakage.[2] Our approach is to identify
maximum risk factors affect the overall security of
information or assets of any corporate, public sector, MNC’s
or individuals. The main factor in the insider threat is the host
or endpoint. Though almost all endpoints and hosts are
secured by antivirus, anti-malware, data leakage prevention,
anti-ransomware etc. and also the compliance followed to
safeguard the endpoints. But in recent researches that is found
that the endpoint operating systems and their different
versions are vulnerable to attacks. As an example, recently the
malware called Ransomware infected the windows based
operating systems using operating systems vulnerable service.
The vulnerability exploited in Wannacry, Bad Rabbit,
petyaransomware was unknown by most of the antivirus, anti
ransomware or anti malware systems. These Vulnerabilities
are present in the versions of windows operating system since
long but not consider into security and compliance.
Users always keep the desktop busy with various tasks. Users
perform activities like installs, uninstalls, starting and
stopping services, disable and unable configurations etc. into
the system regularly and periodically. Some activities perform
by the users and some activities performed by operating
system vice a versa. Such activities by default performed by
the system. Many modifications keep the system vulnerable to
exploits and attacks. But if periodically and prioritize the risk
of the operating system user can assure the better level of
security to the overall system. To secure the system through
periodical audit, and reducing risks as per priority called as
system hardening.[3]
The security audit in windows operating system is essential,
especially when the system is part of a corporate network. The
main objective for Windows Operating System security audit
is to assure protection of information assets and to dispense
information to authorized parties. If the endpoints are
periodically audited then the information can be protected
from various latest cyber threats. Security audit of operating
system procedures required creating checklist, logging and
reporting of security incidents.
2.1 VTAE in Operating system context VTAE stands for combination of Vulnerability of the
Operating System, which can eventually become threat to
system, which can be attacked by any of the attacker with
exploits.
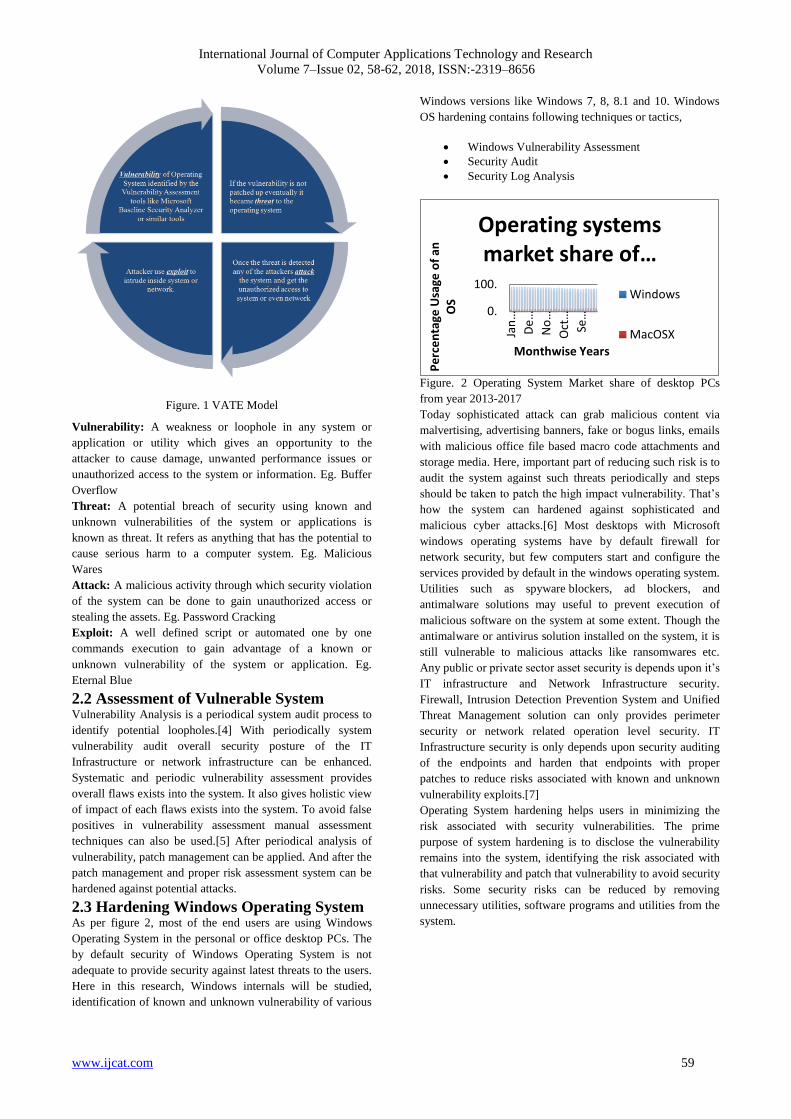
International Journal of Computer Applications Technology and Research
Volume 7–Issue 02, 58-62, 2018, ISSN:-2319–8656
www.ijcat.com 59
Figure. 1 VATE Model
Vulnerability: A weakness or loophole in any system or
application or utility which gives an opportunity to the
attacker to cause damage, unwanted performance issues or
unauthorized access to the system or information. Eg. Buffer
Overflow
Threat: A potential breach of security using known and
unknown vulnerabilities of the system or applications is
known as threat. It refers as anything that has the potential to
cause serious harm to a computer system. Eg. Malicious
Wares
Attack: A malicious activity through which security violation
of the system can be done to gain unauthorized access or
stealing the assets. Eg. Password Cracking
Exploit: A well defined script or automated one by one
commands execution to gain advantage of a known or
unknown vulnerability of the system or application. Eg.
Eternal Blue
2.2 Assessment of Vulnerable System Vulnerability Analysis is a periodical system audit process to
identify potential loopholes.[4] With periodically system
vulnerability audit overall security posture of the IT
Infrastructure or network infrastructure can be enhanced.
Systematic and periodic vulnerability assessment provides
overall flaws exists into the system. It also gives holistic view
of impact of each flaws exists into the system. To avoid false
positives in vulnerability assessment manual assessment
techniques can also be used.[5] After periodical analysis of
vulnerability, patch management can be applied. And after the
patch management and proper risk assessment system can be
hardened against potential attacks.
2.3 Hardening Windows Operating System As per figure 2, most of the end users are using Windows
Operating System in the personal or office desktop PCs. The
by default security of Windows Operating System is not
adequate to provide security against latest threats to the users.
Here in this research, Windows internals will be studied,
identification of known and unknown vulnerability of various
Windows versions like Windows 7, 8, 8.1 and 10. Windows
OS hardening contains following techniques or tactics,
Windows Vulnerability Assessment
Security Audit
Security Log Analysis
Figure. 2 Operating System Market share of desktop PCs
from year 2013-2017
Today sophisticated attack can grab malicious content via
malvertising, advertising banners, fake or bogus links, emails
with malicious office file based macro code attachments and
storage media. Here, important part of reducing such risk is to
audit the system against such threats periodically and steps
should be taken to patch the high impact vulnerability. That’s
how the system can hardened against sophisticated and
malicious cyber attacks.[6] Most desktops with Microsoft
windows operating systems have by default firewall for
network security, but few computers start and configure the
services provided by default in the windows operating system.
Utilities such as spyware blockers, ad blockers, and
antimalware solutions may useful to prevent execution of
malicious software on the system at some extent. Though the
antimalware or antivirus solution installed on the system, it is
still vulnerable to malicious attacks like ransomwares etc.
Any public or private sector asset security is depends upon it’s
IT infrastructure and Network Infrastructure security.
Firewall, Intrusion Detection Prevention System and Unified
Threat Management solution can only provides perimeter
security or network related operation level security. IT
Infrastructure security is only depends upon security auditing
of the endpoints and harden that endpoints with proper
patches to reduce risks associated with known and unknown
vulnerability exploits.[7]
Operating System hardening helps users in minimizing the
risk associated with security vulnerabilities. The prime
purpose of system hardening is to disclose the vulnerability
remains into the system, identifying the risk associated with
that vulnerability and patch that vulnerability to avoid security
risks. Some security risks can be reduced by removing
unnecessary utilities, software programs and utilities from the
system.
0.
100.
Jan
…
De…
No…
Oct
…
Se…
Pe
rce
nta
ge U
sage
of
an
OS
Monthwise Years
Operating systems market share of …
Windows
MacOSX
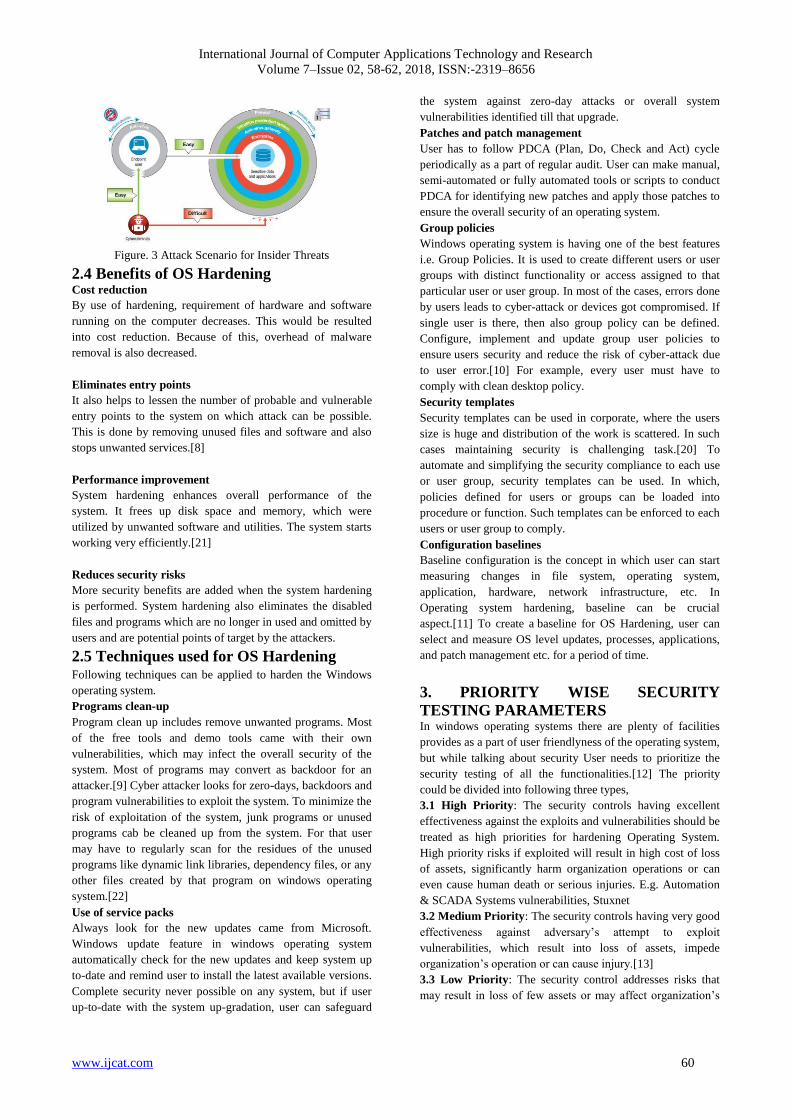
International Journal of Computer Applications Technology and Research
Volume 7–Issue 02, 58-62, 2018, ISSN:-2319–8656
www.ijcat.com 60
Figure. 3 Attack Scenario for Insider Threats
2.4 Benefits of OS Hardening Cost reduction
By use of hardening, requirement of hardware and software
running on the computer decreases. This would be resulted
into cost reduction. Because of this, overhead of malware
removal is also decreased.
Eliminates entry points
It also helps to lessen the number of probable and vulnerable
entry points to the system on which attack can be possible.
This is done by removing unused files and software and also
stops unwanted services.[8]
Performance improvement
System hardening enhances overall performance of the
system. It frees up disk space and memory, which were
utilized by unwanted software and utilities. The system starts
working very efficiently.[21]
Reduces security risks
More security benefits are added when the system hardening
is performed. System hardening also eliminates the disabled
files and programs which are no longer in used and omitted by
users and are potential points of target by the attackers.
2.5 Techniques used for OS Hardening Following techniques can be applied to harden the Windows
operating system.
Programs clean-up
Program clean up includes remove unwanted programs. Most
of the free tools and demo tools came with their own
vulnerabilities, which may infect the overall security of the
system. Most of programs may convert as backdoor for an
attacker.[9] Cyber attacker looks for zero-days, backdoors and
program vulnerabilities to exploit the system. To minimize the
risk of exploitation of the system, junk programs or unused
programs cab be cleaned up from the system. For that user
may have to regularly scan for the residues of the unused
programs like dynamic link libraries, dependency files, or any
other files created by that program on windows operating
system.[22]
Use of service packs
Always look for the new updates came from Microsoft.
Windows update feature in windows operating system
automatically check for the new updates and keep system up
to-date and remind user to install the latest available versions.
Complete security never possible on any system, but if user
up-to-date with the system up-gradation, user can safeguard
the system against zero-day attacks or overall system
vulnerabilities identified till that upgrade.
Patches and patch management
User has to follow PDCA (Plan, Do, Check and Act) cycle
periodically as a part of regular audit. User can make manual,
semi-automated or fully automated tools or scripts to conduct
PDCA for identifying new patches and apply those patches to
ensure the overall security of an operating system.
Group policies
Windows operating system is having one of the best features
i.e. Group Policies. It is used to create different users or user
groups with distinct functionality or access assigned to that
particular user or user group. In most of the cases, errors done
by users leads to cyber-attack or devices got compromised. If
single user is there, then also group policy can be defined.
Configure, implement and update group user policies to
ensure users security and reduce the risk of cyber-attack due
to user error.[10] For example, every user must have to
comply with clean desktop policy.
Security templates
Security templates can be used in corporate, where the users
size is huge and distribution of the work is scattered. In such
cases maintaining security is challenging task.[20] To
automate and simplifying the security compliance to each use
or user group, security templates can be used. In which,
policies defined for users or groups can be loaded into
procedure or function. Such templates can be enforced to each
users or user group to comply.
Configuration baselines
Baseline configuration is the concept in which user can start
measuring changes in file system, operating system,
application, hardware, network infrastructure, etc. In
Operating system hardening, baseline can be crucial
aspect.[11] To create a baseline for OS Hardening, user can
select and measure OS level updates, processes, applications,
and patch management etc. for a period of time.
3. PRIORITY WISE SECURITY
TESTING PARAMETERS
In windows operating systems there are plenty of facilities
provides as a part of user friendlyness of the operating system,
but while talking about security User needs to prioritize the
security testing of all the functionalities.[12] The priority
could be divided into following three types,
3.1 High Priority: The security controls having excellent
effectiveness against the exploits and vulnerabilities should be
treated as high priorities for hardening Operating System.
High priority risks if exploited will result in high cost of loss
of assets, significantly harm organization operations or can
even cause human death or serious injuries. E.g. Automation
& SCADA Systems vulnerabilities, Stuxnet
3.2 Medium Priority: The security controls having very good
effectiveness against adversary’s attempt to exploit
vulnerabilities, which result into loss of assets, impede
organization’s operation or can cause injury.[13]
3.3 Low Priority: The security control addresses risks that
may result in loss of few assets or may affect organization’s
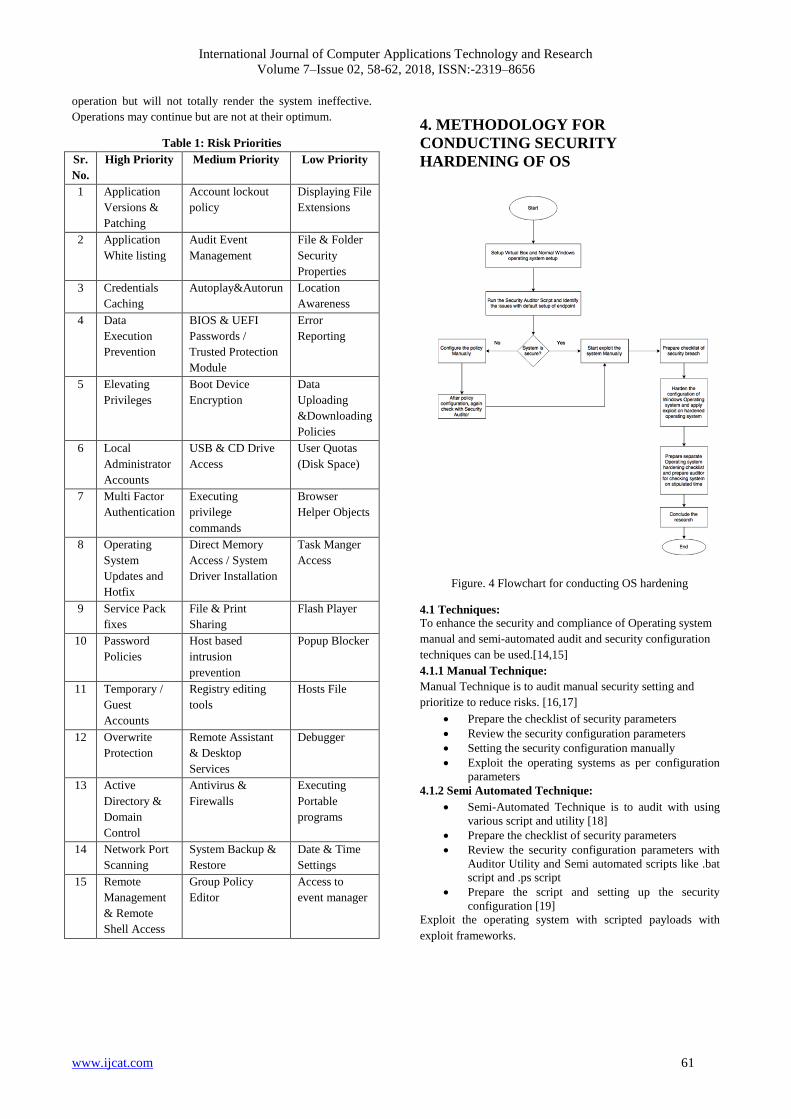
International Journal of Computer Applications Technology and Research
Volume 7–Issue 02, 58-62, 2018, ISSN:-2319–8656
www.ijcat.com 61
operation but will not totally render the system ineffective.
Operations may continue but are not at their optimum.
Table 1: Risk Priorities
Sr.
No.
High Priority Medium Priority Low Priority
1 Application
Versions &
Patching
Account lockout
policy
Displaying File
Extensions
2 Application
White listing
Audit Event
Management
File & Folder
Security
Properties
3 Credentials
Caching
Autoplay&Autorun Location
Awareness
4 Data
Execution
Prevention
BIOS & UEFI
Passwords /
Trusted Protection
Module
Error
Reporting
5 Elevating
Privileges
Boot Device
Encryption
Data
Uploading
&Downloading
Policies
6 Local
Administrator
Accounts
USB & CD Drive
Access
User Quotas
(Disk Space)
7 Multi Factor
Authentication
Executing
privilege
commands
Browser
Helper Objects
8 Operating
System
Updates and
Hotfix
Direct Memory
Access / System
Driver Installation
Task Manger
Access
9 Service Pack
fixes
File & Print
Sharing
Flash Player
10 Password
Policies
Host based
intrusion
prevention
Popup Blocker
11 Temporary /
Guest
Accounts
Registry editing
tools
Hosts File
12 Overwrite
Protection
Remote Assistant
& Desktop
Services
Debugger
13 Active
Directory &
Domain
Control
Antivirus &
Firewalls
Executing
Portable
programs
14 Network Port
Scanning
System Backup &
Restore
Date & Time
Settings
15 Remote
Management
& Remote
Shell Access
Group Policy
Editor
Access to
event manager
4. METHODOLOGY FOR
CONDUCTING SECURITY
HARDENING OF OS
Figure. 4 Flowchart for conducting OS hardening
4.1 Techniques:
To enhance the security and compliance of Operating system
manual and semi-automated audit and security configuration
techniques can be used.[14,15]
4.1.1 Manual Technique:
Manual Technique is to audit manual security setting and
prioritize to reduce risks. [16,17]
Prepare the checklist of security parameters
Review the security configuration parameters
Setting the security configuration manually
Exploit the operating systems as per configuration
parameters
4.1.2 Semi Automated Technique:
Semi-Automated Technique is to audit with using
various script and utility [18]
Prepare the checklist of security parameters
Review the security configuration parameters with
Auditor Utility and Semi automated scripts like .bat
script and .ps script
Prepare the script and setting up the security
configuration [19]
Exploit the operating system with scripted payloads with
exploit frameworks.

International Journal of Computer Applications Technology and Research
Volume 7–Issue 02, 58-62, 2018, ISSN:-2319–8656
www.ijcat.com 62
5. CONCLUSION Till the time, this research is very important to the public and
private sector to safeguard their information and data from
being compromised because of Operating Systems Security
misconfiguration. In this, the key vulnerabilities and exploits
will be applied to learn the default security and patch
management of the windows operating system. Accordingly
the security will be enhanced up to the extent and again check
in Security Audit Framework, and compare the results. After
then the security checklist will be defined and maintained.
Though there are very few literature and quality research
paper is available in this domain, we can take it as opportunity
to research and develop a better security enhanced harden
Operating System.
Most of the security settings are changed with installed
applications and software version up gradations. Windows
updates can harden the OS at some extent. Very important
aspect of OS security hardening is to prioritize risk and
effectiveness of that risks to business or critical IT and
Network Infrastructure. Periodical security audit can be
reviewed and can be useful to patch up the vulnerabilities.
Fuzzing can also be useful identifying unknown security
misconfigurations and if patched at early stages security may
enhance up to some extent. As an example, if early stage
detection of security misconfiguration detected in periodical
audit, user can safeguard IT or Network Infrastructure against
sophisticated attacks like Ransomware attacks, unauthorized
access, data theft, data modification or identity theft etc.
6. ACKNOWLEDGMENTS
We are thankful to Shri T. P. Singh, Director, BISAG for
providing infrastructure and encouragement, and Special
thanks to Abdul Zummarwala, Research Scholar, BISAG for
permitting to carry out this project at BISAG.
REFERENCES [1] Yile, Fan. "Research on the Security Problem in
Windows 7 Operating System." Measuring Technology
and Mechatronics Automation (ICMTMA), 2016 Eighth
International Conference on. IEEE, 2016.
[2] Berghel, Hal. "A Quick Take on Windows Security
Evolution." Computer 50.5 (2017): 120-124.
[3] Lin, Ma, Chen Houwu, and Liu Fuqiang. "The
monitoring and auditing method of Windows File
manipulations." Information Management, Innovation
Management and Industrial Engineering (ICIII), 2012
International Conference on. Vol. 3. IEEE, 2012.
[4] Berlin, Konstantin, David Slater, and Joshua Saxe.
"Malicious behavior detection using windows audit
logs." Proceedings of the 8th ACM Workshop on
Artificial Intelligence and Security. ACM, 2015.
[5] Guo, Hui, et al. "Research on Detecting Windows
Vulnerabilities Based on Security Patch
Comparison." Instrumentation & Measurement,
Computer, Communication and Control (IMCCC), 2016
Sixth International Conference on. IEEE, 2016.
[6] Shukla, Himanshu, et al. "Enhance OS security by
restricting privileges of vulnerable
application." Consumer Electronics (GCCE), 2013 IEEE
2nd Global Conference on. IEEE, 2013.
[7] Jing, Luo, Jiang Chunhua, and Yang Xia. "Design and
implementation of security os based on trust
zone." Electronic Measurement & Instruments (ICEMI),
2013 IEEE 11th International Conference on. Vol. 2.
IEEE, 2013.
[8] Lin, Ma, Chen Houwu, and Liu Fuqiang. "The
monitoring and auditing method of Windows File
manipulations." Information Management, Innovation
Management and Industrial Engineering (ICIII), 2012
International Conference on. Vol. 3. IEEE, 2012.
[9] Feifei, Liu. "The principle and prevention of windows
buffer overflow." Computer Science & Education
(ICCSE), 2012 7th International Conference on. IEEE,
2012.
[10] Berlin, Konstantin, David Slater, and Joshua Saxe.
"Malicious behavior detection using windows audit
logs." Proceedings of the 8th ACM Workshop on
Artificial Intelligence and Security. ACM, 2015.
[11] China National Vulnerability Database. Vulnerability
trend graph .http://www.cnvd.org.cn/ flaw/ statistic,
April 2016.
[12] SecurityTechCenter, Microsoft Security Bulletin MS15-
034.https://technet.microsoft.com/ library/security/ms15-
034, 2015.
[13] File detection test of malicious software.http://www.av-
comparatives.org/wp-
content/uploads/2015/04/avc_fdt_201503_en.pdf,
August 2017.
[14] B. Anderson, D. Quist, J. Neil, C. Storlie, and T.
Lane.Graph-based malware detection using dynamic
analysis.Journal in Computer Virology, 7(4):247-258,
2011.
[15] K. D. Bowers, C. Hart, A. Juels, and N. Triandopoulos.
Pillarbox: Combating next-generation malware with fast
forward-secure logging. In Research in Attacks,
Intrusions and Defenses, pages 46-67. Springer, 2014.
[16] M.Chandramohan, H. B. K. Tan, and L. K. Shar.
Scalable malware clustering through coarse-grained
behavior modeling. In Proceedings of the ACM
SIGSOFT 20thInternational Symposium on the
Foundations of Software Engineering, pages 27:1{27:4.
ACM, 2012.
[17] J. Dai, R. Guha, and J. Lee. E_cient virus detection using
dynamic instruction sequences. Journal of Computers,
4(5):405-414, 2009.
[18] M.Egele, T. Scholte, E. Kirda, and C. Kruegel. A survey
on automated dynamic malware-analysis techniques and
tools. ACM Computing Surveys, 44(2):6, 2012.
[19] W.Enck, P. Gilbert, S. Han, V. Tendulkar, B.-G. Chun,
L. P. Cox, J. Jung, P. McDaniel, and A. N. Sheth.
Taintdroid: An information tracking system for real time
privacy monitoring on smartphones. ACM Transactions
on Computer Systems, 32(2):5:1-5:29, June2014.
[20] T.-F. Yen, A. Oprea, K. Onarlioglu, T. Leetham, W.
Robertson, A. Juels, and E. Kirda. Beehive: Large-scale
log analysis for detecting suspicious activity in enterprise
networks. In Proceedings of the 29th Annual Computer
Security Applications Conference, pages 199-208. ACM,
2013.
[21] http://www.bmc.com/blogs/security-vulnerability-vs-
threat-vs-risk-whats-difference/, accessed on October 10,
2017.
[22] https://www.pcmag.com/encyclopedia/term/58124/os-
hardening, Accessed on August 11, 2017.

International Journal of Computer Applications Technology and Research
Volume 7–Issue 02, 63-77, 2018, ISSN:-2319–8656
www.ijcat.com 63
Model for Information Security Governance Prediction in Public Universities in Kenya
Anne Ndolo
Department of Computer
Science and Software
Engineering
Jaramogi Oginga Odinga
University of Science and
Technology
Kisumu, Kenya
Dr. Solomon Ogara
Department of Computer
Science and Software
Engineering
Jaramogi Oginga Odinga
University of Science and
Technology
Kisumu, Kenya
Dr. Samuel Liyala
Department of Information
Systems
Jaramogi Oginga Odinga
University of Science and
Technology
Kisumu, Kenya
Abstract: Information is one of the most important assets in Organizations worldwide. To enable secure business operations, an
organization must have an effective security governance strategy. The study focused on Information security governance in Public
Universities in Kenya by establishing the current status of information security practices. Purposive sampling used to select seven (7)
public Universities. A descriptive survey design, involving questionnaire was conducted to collect quantitative data. 394 respondents
participated in the study. Data was analyzed using SPSS software. Correlation and multiple Regression analysis were obtained. The
findings reveal that information security management’s participation level is inadequate to deal effectively with information security
governance threats, roles and responsibilities not well defined in support of information security governance practices. The research
provides a comprehensive model for ensuring alignment of information security objectives with business objectives.
Keywords: Information Security; Information Security Governance; Risk Assessment; IT; Public Universities;
1. INTRODUCTION
Organizations today face universal revolution in
governance that directly affects their information
management practices. There is an increased need to focus
on the overall value of information protected and delivered
in terms of enabled services. Due to the high-profile
organizational failures of the past years, legislatures,
statutory authorities and regulators have created a range of
new laws and regulations designed to force improvement
in universities governance, security controls and
transparency. Previous and new laws on information
retention and privacy, coupled with significant threats to
information and systems disruptions from hackers, worms,
viruses and terrorists, have resulted in a need for a
governance approach to information management,
protecting the universities’ most critical assets, its
information and reputation [24]. Public universities in
Kenya increasingly uses Information for essential business
operations including, administration, teaching, learning
and research activities. It is also evident that variety of
devices such as desktop and laptop computers, Personal
Digital Assistants (PDAs) and mobile/cellular phones,
each with the capability to access information located at
respective institution’s data centers are typically being
used. It is impossible to completely lock down these
devices as the Universities are havens of free exchange of
information that must uphold the principles of academic
freedom. This freedom opens an attack space to
information but the greatest challenge is to ensure that
information and the systems are open and flexible, yet as
secure as possible. One of the biggest challenges with
university cyber security is the sheer amount of hacking
that goes on in these environments. Schools have to deal
with a unique mix of user levels, including students who
are often young, and relatively trusting, and are not
International Journal of Computer Applications Technology and Research
Volume 7–Issue 02, 63-77, 2018, ISSN:-2319–8656
www.ijcat.com 64
employees of the organization so they are less controlled.
Research shows that 90% of malware attacks originate
through e-mail, various types of spoofing and spear-
phishing campaigns that entice students and others to click
on illegitimate links that can usher in a Trojan horse to do
damage to a network system, or compromise the security
of information. Many of these kinds of threats are costly,
which leads to an inundation of hacker activity that schools
have to keep on top of, by segmenting network systems,
shutting down compromise parts of the system, or by some
other high-tech means [32]. Until recently, most of the
public universities have focused their security on
protecting the Information technology (IT) systems that
process and store the vast majority of information, rather
than on the information itself. However, this kind of
approach is too narrow to accomplish the level of
integration, process assurance and overall protection that is
required to ensure confidentiality, integrity and availability
of information [24]. Information security governance is
achieved by implementing suitable set of controls,
including policies, processes, procedures, organizational
structures, and software and hardware functions. These
controls need to be established, implemented, monitored,
reviewed and improved, where necessary, to ensure that
the specific security and business objectives of the
organization are met [20]. Information security main goal
is to reduce adverse impacts on the organization to an
acceptable level of risk. To ensure effective information
security, Universities information management must
establish and maintain a governance model to guide in the
development and maintenance of a comprehensive
information security programme. However, studies
undertaken by [31] found that management do not
understand the importance of information security, they do
not give adequate support. There are risks of integrity and
confidentiality violation which leads to universities having
unreliable grading, financial loss and jeopardized
reputation. A study done by [40] found that practices
around information/data security elements were not to the
expectation within the universities. Despite all these
threats and risks, there is still a perception that information
security is an IT problem rather than everyone's business.
The purpose of this study is to design a model for
Information security governance for public Universities in
Kenya by establishing the current state of information
security governance practices. The research model will
enable the academia, business managers and information
Technology practitioners rethink and review their ISG
practices and ensure that Information security is placed at
the executive management level in order to ensure that
Information security and business objectives are aligned.
2.0 RELATED WORK
[17] defined the objective of information security as the
protection of the interests of those relying on information,
and the information systems and communications that
deliver the information, from harm resulting from failures
of availability, confidentiality and integrity. Any
organization may consider the security objective met when
those three criteria are satisfied, that is, when information
systems are available to users at any given time
(availability), data and information are disclosed only to
authorize users (confidentiality), and data and information
are protected against unauthorized modification (integrity).
Given the dramatic rise of information crimes, including
phishing and other cyber attacks, few today would contend
that improved security is not a requirement. With new
worms/malware and the increase in reported losses of
confidential customer information and intellectual property
theft, senior management is left with little choice but to
address these issues. Information security requires a
balance between sound management and applied
technology. With the widespread use of networks,
individuals and organizations are concerned with other
risks pertaining to privacy of personal information and the
organization’s need to protect the confidentiality of
information, whilst encouraging electronic business [22].
IT is essential for managing the information and
knowledge required in the daily operations of an
organization. It has, thus, become an integral part of most
businesses and is vital to their growth [22]. Such growth
comes at a price, however, today many security threats
exist that threaten both IT and information per se [52].
Consequently, both IT and information have to be
protected using proper information security measures that
will ensure continued growth and derived benefit [21].
Casey [6] indicated that data security should be a key
element of information technology security, that directly
contributes to its measurement, data security controls like
International Journal of Computer Applications Technology and Research
Volume 7–Issue 02, 63-77, 2018, ISSN:-2319–8656
www.ijcat.com 65
encryption, back-ups and retrieval are therefore so
important, that they are usually incorporated in the
information security policy as well as metrics. [21]
Illustrates that, information security is achieved by
implementing a suitable set of controls that consist of
policies, processes, procedures, organizational structures
and software and hardware functions. The controls need to
be established, implemented, monitored, reviewed and
improved to ensure that the particular security and
business objectives of the organization are met. This
exercise should not be done in isolation but in conjunction
with other business management processes. A
comprehensive security programme implements the
protection of information assets through a layered series of
technological and nontechnological safeguards and
controls like safety and environmental security measures,
perimeter and physical security, background checks,
access control security measures, user identifiers,
passwords, IT technical measures and manual and
automated procedures. These safeguards and controls are
necessary and should address threats and vulnerabilities in
a manner that reduces potential impacts to a defined
acceptable level [21]. [27] on Corporate Governance helps
to clarify why information security should be addressed as
a corporate governance responsibility. Firstly, a major
point of consideration is that the executive management is
responsible and accountable to the shareholders of the
company and therefore, they must ensure that their
organization produces business value and delivers a
suitable return on shareholder investment. Good
information security efforts will most assuredly help to
generate this return, which [45] clearly motivate. [27]
Further states that executive management is responsible for
ensuring that their organizations comply with all
applicable laws, regulations and codes of best practice that
should be well documented within a model. It should be in
their best interest to fulfill this responsibility as failure in
this regard could result in stringent legal action against
them [45]. [4] Highlights two critical obstructions which
hinder effective Information Security governance. Firstly,
the responsibility for Information Security is frequently
handed over to the Chief Information Officer (CIO), or the
Chief Security Officer (CSO), who may not necessarily be
positioned to delegate the resources and have the authority
required to resolve various Information Security-related
issues. Due to lack of attention by executive management,
the allocation of finance to Information security efforts is
scant in relation to the risks and degree of damage that
security incidents may produce. Until the executive
management has sufficient knowledge of the criticality of
information security governance, inadequate support for
security systems may be allocated less resources resulting
in defective risk mitigation activities. More often than not,
executive management only realizes the extent of
information security risks after a severe incident occurs
with severe consequences to the organizational reputation.
2.1 The Benefits of Information Security
Governance Information Security Governance (ISG) is a complex issue
requiring the commitment of everyone in an organization
to fulfill their role in protecting organizational information
assets. Information security governance, if executed
effectively, is of value to organizations in ways that exceed
the mere observance of lawful conduct [45]. Effective
information security governance results in enhanced
internal security practices and controls and the promotion
of self-governance as an alternative to legislation [11].
Sound ISG efforts have the potential to reduce auditing
and insurance costs and differentiate the organization from
industry competitors through an ongoing process of self-
improvement [11]. ISG is a useful function for increasing
overall productivity and lowering costs by delivering
strategic alignment with broad organizational strategies
and risk appetites [23]. This produces value for
stakeholders, including by improving risk management
efforts and enabling better performance measurements to
provide assurance that information-related risks are under
control [23]
2.2 Universities Information Security
Threats [28] States that universities face a variety of cyber security
threats. These include disruption to the functioning of a
university network, through to more general and targeted
attempts to obtain valuable information from networks and
their users. He further states that Universities also face a
growing challenge from advanced, persistent and targeted
threats that reflect the sector’s important contribution to
innovation and economic development worldwide. Cyber

International Journal of Computer Applications Technology and Research
Volume 7–Issue 02, 63-77, 2018, ISSN:-2319–8656
www.ijcat.com 66
security vulnerabilities are caused by a combination of the
technical and human elements of a system. Technical
elements may include software vulnerabilities that allow
unauthorized access through a particular program.
However, security failures are often traced to various
forms of user vulnerability. Legitimate users may be
targeted by social engineering that encourages them to take
certain actions or divulge information that will allow
attackers access to systems. Persistent remote access may
also be achieved through unauthorized physical access to
networks, such as through unsecured removable media like
laptops or mobile devices. [28] Posits that the primary risk
from the different types of cyber threat is to the business
continuity of the institution, theft of information or damage
to networks may have immediate impacts that prevent the
university and its community from going about their work.
Institutions or researchers may lose access to essential data
or that data may become corrupted. However, information
may also be stolen, including without the owner’s
knowledge, with eventual costs not realized until later.
Recent highly publicized cyber attacks [15] have spurred a
growing public awareness of the risk that sensitive
personal information might be accessed by unauthorized
third parties. Higher education since 2005, have been the
victim of 539 breaches involving nearly 13 million known
records. This trend may be due, in part, to the sheer
number of personal records kept by these institutions,
considering their ever-changing student bodies, as well as
the valued open, collaborative environment of most
colleges and universities. Federal Trade Commission
promulgated its (FTC) Safeguards Rule. This rule, above
all, directs institutions providing financial products or
services to establish a comprehensive written information
security program (WISP) containing administrative,
technical and physical safeguards to protect customers’
personal information. The FTC indicated that colleges and
universities are subject to the Safeguards Rule [12]. [15]
Further indicates that cyber attacks prove that even the
most sophisticated computer systems like those of major
banks, the government, and top retailers are not
impenetrable. Higher education institutions are,
unfortunately, no exception, in 2014 alone as many as 42
colleges and universities were victims of cyber attacks, and
there have been at least eight in 2015. In 2009 at the
University of California Berkeley, 160,000 people had
their identity stolen during a computer security breach, the
hackers operated for six months before being discovered
[14]. [42] highlighted that about 53 universities, including
Harvard, Stanford, Cornell, Princeton, Johns Hopkins, the
University of Zurich and other universities around the
world were hacked and about 36,000 e-mail addresses and
thousands of names, usernames, passwords, addresses and
phone numbers of students, faculty and staff from such
universities were published to the Website Pastebin.com.
Similar incidents have also been witnessed in public and
private universities in Kenya. According to [50], Kenya is
among African countries leading in cyber-attacks, just like
Morocco, Egypt and South Africa. In October 2011, a
report was circulated to all Vice Chancellors of public
universities and Principals of University Colleges from the
Office of the Permanent Secretary, Ministry of Higher
Education, Science and Technology contained Information
about a group of university students that compromised
academic and financial systems' integrity by altering
grades and fee balances in favor of students. The affected
universities were reportedly among others; Jomo Kenyatta
University of Agriculture and Technology, Daystar
University, the Catholic University of Eastern Africa, and
Maseno University. In yet another incident, on December
6th 2011, a syndicate of employees and students of
Kenyatta University hacked into the institution's online
database and altered examination results [46]. Due to the
alterations, the university struck off names of many
students who were scheduled to graduate on December 9th
2011. During the graduation period, students want better
cumulated average score, and fee clearance as well, and
this creates the motivation for attacking university systems
[26] With this in mind, better security often starts with
identifying separate pools of users for example,
administrative staff versus faculty and students, and then
customizing controls and access for each of these groups
individually. The challenge of limited resources and
funding for university cyber security generally speaks for
itself. The above kinds of network monitoring and cyber
security engineering have significant costs attached to
them, and many universities simply find it difficult allocate
the manpower or the funding to address cyber security
issues. [53] Emphasized that failure of institutions to
recognize the strategic importance and crucial role of
electronic information assets as well as not ensuring its

International Journal of Computer Applications Technology and Research
Volume 7–Issue 02, 63-77, 2018, ISSN:-2319–8656
www.ijcat.com 67
protection can be seen as gross negligence in terms of
good Corporate Governance. He went on further to argue
that good Corporate Governance entails that all risks
against electronic assets of the institution must be
identified and properly managed. However, these actions
belong to the Executive Management as part of their good
Corporate Governance responsibilities.
2.3 Risk Assessment Risk assessment is a key part of an effective information
security management system. [35] States that to minimize
information security threats, risk identification, analysis
and mitigation is paramount. The Risk Assessment
provides insight and guidance in developing an effective
security strategy. Instead of assessing organizational risk a
mile wide and an inch deep, the Risk Assessment focuses
on assessing the implementation, effectiveness, and
governance of information security controls. The outcome
of this assessment is a prioritized analysis of risks and
exposures that should be addressed to better protect your
organization. This argument is also supported by [2] that
once security risks have been identified and decisions for
the treatment of risks have been made, appropriate controls
should be selected and implemented to ensure risks are
reduced to an acceptable level. Understanding risk helps
organizations in any industry make more informed
business decisions. This assessment helps executives
determine what risk they are willing to accept, versus what
risk should be mitigated through security improvements
that will generate the most return on investment.
2.4 Information Security Controls A security control is a safeguard or countermeasure
designed to protect the confidentiality, integrity, and
availability of an information asset or system and meet a
set of defined security requirements. According to [48]
Security controls cover management, operational, and
technical actions that are designed to deter, delay, detect,
deny, or mitigate malicious attacks and other threats to
information systems. The protection of information
involves the application of a comprehensive set of security
controls that address cyber security (i.e., computer
security), physical security, and personnel security. It also
involves protecting infrastructure resources upon which
information security systems rely (e.g., electrical power,
telecommunications, and environmental controls). The
selection and application of specific security controls are
directed by a facility’s information security plans and
policies.
2.4.1 Physical Security Controls
Physical controls form the first level of defense for an
organization. Such controls prevent access to facilities by
unauthorized individuals [43]. Accordingly, these controls
regulate access in and out of organizational environments.
Such controls are the easiest and least expensive to
implement, but are often also the most effective. Common
physical controls include items such as walls, doors,
fencing, gates, locks, badges, guards, bollards, cameras
and alarm systems. [1] however, also mentions that
physical controls include the measures required to
maintain the physical environment in organizations,
including heating, air-conditioning systems, fire-
suppression systems, backup power generators, guards and
receptionists, door access controls, restricted areas, closed-
circuit television (CCTV), automatic door controls and
human traps, physical intrusion detection systems, and
physical protection systems. Many believe that physical
controls do not play a vital role in an organization’s
security, but they are actually the most critical components
[1] They can be considered critical owing to the fact that if
one cannot guarantee or protect the physical environment
in an organization, then any other controls that are added
would be immaterial [1].
2.4.2 Technical/ Logical Security Controls
According to [3], technical security controls is also called
logical controls, they refer to restriction of access to
system. [44] Posits that logical security elements consist of
those hardware and software features provided in a system
that helps to ensure the integrity and security of data,
programs and operating systems. Hardware elements that
segregate core and thus present overlap, accidental or
intentional, level of privileges that restrict access to the
operating system programs, firmware programs that are
not software- modifiable and similar Software elements
that provide access management capabilities. These are the
key security elements in a program to protect electronic
information. An effective logical security system provides
the means to identify, authenticate, authorize, or limit the
authenticated user to certain previously stipulated actions,
for each system user who may sign on or for each program

International Journal of Computer Applications Technology and Research
Volume 7–Issue 02, 63-77, 2018, ISSN:-2319–8656
www.ijcat.com 68
that may be called on by the computer to process files with
established value factors. These include firewalls, access
control lists, file permissions and anti-virus software.
2.4.3 Administrative Security Controls
Administrative security controls also called procedural
controls are primarily procedures and policies which put
into place to define and guide employee actions in dealing
with the organizations’ sensitive information [25]. They
inform people on how the business is to be run and how
day to day operations are to be conducted. Laws and
regulations created by government bodies are also a type
of administrative control because they inform the business.
Administrative security controls in the form of a policy can
be enforced with technical or physical security controls.
For instance, security policy may state that computers
without antivirus software cannot connect to the network,
but a technical control, such as network access control
software, will check for antivirus software when a
computer tries to attach to the network. Administrative
controls offer clear guidance; they include separation of
duties, least privilege and user computer access
registration and termination. Conducting security
awareness and technical training to end users and system
users helps in protecting the organizational mission.
Administrative controls deal with implementation of
personnel security controls including personnel clearance,
background investigations, and rotation of duties,
conducting periodic review on security controls and to
employees on how they should act when confronted with a
potential security breach [49]. Unfortunately, organizations
have found that if they cannot enforce compliance with
these controls, then their value is drastically diminished
[1]. This often leads to a false sense of security where
management of an organization trusts that its employees
are operating in a safe and secure manner, but in actual
fact they might not. This lack of compliance often results
in serious consequences for organizations. It can therefore
be stated that having controls that are not monitored or
enforced is tantamount to having laws but no police [54].
2.5 Information Security Policy According to [41], the cornerstone of effective information
security architecture is a well written security policy. A
security policy is a formal statement of the rules by which
people who are given access to an organization's
technology and information assets must abide. Since a
policy is typically written at a broad level, organizations
must also develop standards, guidelines, and procedures
that provide employees with a clear approach to
implementing the policy [37]. In order for a security policy
to be appropriate and effective, it needs to have the
acceptance and support of all levels of employees within
the organization. The ISO 27001 standard requires that the
security policy document (A.5) should be approved by
management, published and communicated as appropriate
to all employees [5]. It should state management
commitment and set out the organizations approach to
managing information security. However, [10] pointed out
that good governance of Information Security is reflected
by the commitment of the management and the leadership
through formulation of a security policy based on risk
analysis. Henceforth, security policy plays a strategic role
in defining high level organizational direction, as well as
being specific to the practical operations for users [30].
2.6 Information Security Governance
Roles and Responsibilities The importance of the structure and organization of the
information security within an organization is essential for
the success of an information security governance plan.
Several codes of best practices for information security
management stress the importance of having a proper
information security organizational structure which
includes the creation of an information security forum
[51]. [33] Suggest that the information security governance
forum should consist of representatives from mid-level to
senior-level management from lines of business, IT, audit
and risk. Information security is everyone’s responsibility
from the general members of staff all the way up through
all levels of management to the board of directors [16] but
if all employees involved do not understand their roles and
responsibilities, the organization will not be able to protect
the integrity, confidentiality and availability of its
information. [47] argued that it is important that people
understand the protection available to them when faced
with threats [13] and also when they are the ones causing
the threat to the organization. [56] Refer to employee
violations which may be passive such as employees who
are poorly trained, careless, unmotivated or who
accidentally enter incorrect data values. Examples of such

International Journal of Computer Applications Technology and Research
Volume 7–Issue 02, 63-77, 2018, ISSN:-2319–8656
www.ijcat.com 69
behavior are the failure to change passwords regularly,
failure to shred sensitive documents, delays in making data
backups or failure to select strong passwords Employees
may not understand that these actions may result in harm
to the organization without them specifically intending to
do so therefore, [55] agree with the International
Federation of Accountants that clearly communicating
individual roles, responsibility and authority is a major
activity. All interested parties should be involved but
ultimately the responsibility lies at the management level.
They should have an understanding of why information
security needs to be governed and that they also have
several responsibilities to ensure that information security
governance is in place [55].
2.7 Critical Success Factors for
Information Security Governance
2.7.1 Management Commitment
Ultimate responsibility for managing information security
is borne by corporate management, this provides the
resources and sets the requirements on the basis of which
the IT security manager promotes and coordinates security
activities. The objects and activities of information
security must be in line with the organization's business
objectives and the requirement imposed by them. Senior
management must take charge of this and provide visible
support and show real commitment. To do this, they have
to understand the seriousness of the threat that information
risks pose to corporate assets. Further, they need to ensure
that middle management and other staff fully grasp the
importance of the issue. The organization's information
security policy and objectives must be known by corporate
employees as well as by external partners. Information
security policy represents the position of senior
management toward information security, and sets the tone
for the entire organization. It is recommended that
coordinating the organization's information security policy
should be the responsibility of some member of top
management. Encouragement should be given to the
extensive application of information security within the
organization and among its stakeholder groups to make
certain that problems are dealt within an efficient and
regular manner. When necessary, external professional
assistance should be sought to keep abreast of advances,
standards and values in the field. At the same time, this
enables establishing forms of collaboration for potential
security breaches. The key component of information
security work is the visible support and engagement of
senior management. In practical terms, this commitment
involves allocating necessary funding to information
security work and responding without delay tone
situations. Nevertheless, swelling the Size of the
information security organization is unwise, for a small
organization is often more flexible and faster on the draw.
A better alternative to enlarging security staff is to enhance
information security skills and knowledge at all levels of
the organization, because that is where the actual work
processes are yet another way of showing management
commitment. Is participation in arrange of information
security-related events, which serves to underline the
importance attached to the topic [21].
2.7.2 Compliance
Organizations have to demonstrate an information security
policy that proves they have a range of steps and measures
in place for compliance, if these policies are not adhered
to, the regulators reserve the right to prosecute [21]). [21]
and [19] emphasize the importance of complying with an
organization’s policies, company standards and
procedures, this is because human nature in general and
employees in particular do not always conform to the
wishes of executive management with regard to
information security and secure information practices. [30]
argued that university environment is made up of a mixture
of corporate culture and academic freedoms, thus it is most
likely that information security may be taken as disabling
rather than enabling. Hence by carrying out security
awareness programs, the culture of compliance should
develop.
2.8 Conceptual framework for
Information Security Governance A conceptual framework for information security
governance in public universities in Kenya was developed
from best practice recommendations and guidelines in
information security governance as suggested in various
standards, guidelines and literature by information security
researchers and practitioners. The proposed framework
(Figure 1 below) served as a guide to the data collection
process and was used to develop the data collection

International Journal of Computer Applications Technology and Research
Volume 7–Issue 02, 63-77, 2018, ISSN:-2319–8656
www.ijcat.com 70
instrument. The research adopted the following concepts in
developing the framework: Computer security requires a
comprehensive and integrated approach that considers
issues both within and outside the computer security field
[36]. Careful selection and implementation of managerial,
technical and operational controls as well as an
understanding of their interdependencies is an important
information security management success factor . Control
A.7.1.1 of the [21] standard guidelines and best practices
recommendations for information management were used
to develop the conceptual model.
Figure 1. Conceptual Model
3.0 METHODOLOGY
The study adopted a descriptive survey design in which
quantitative data was collected among employees of public
universities in Kenya. 394 respondents were sampled using
[57]. Purposive sampling was used to select the first seven
(7) public universities that have been in existence for over
ten years and have sound structure of governance that has
evolved over time and where most of the other public
Universities originated from as either constituent college
or as a campus [8]. A Likert scale structured questionnaire
was used to collect data from the executive management,
security professionals and end users of the public
universities. A Cronbach‘s Alpha value of 0.815 was
obtained using SPSS. Content validity of the data
collection instrument was determined by the subject matter
experts who reviewed items adapted from relevant studies
previously published in peer-reviewed journals.
Correlation analysis was used to establish the relationship
between the dependent and independent variables.
Multiple Regression analysis was carried out to establish
the strength of relationship between the predictors and the
predicted. The outcome of the analysis was a model for
prediction of Information security governance in Public
Universities in Kenya. The confidentiality of the
participants was ensured by not disclosing their names or
personal information in the research, only relevant details
that help in answering the research questions were
included.
4.0 RESULTS
On risk assessment the findings shows that (60.4%) of
respondents have documented risk management program
to determine what controls can protect information,
majority (78.8% ) indicated that management has not
identified and analyzed departmental risk relating to
changes in operating environment, new personnel and new
information systems, while (67.5%) indicated their key
personnel fully consider risk in identifying potential
dangers of information and systems, (42.1%) indicated that
their institutions do not identify system weaknesses that
could be exploited. As for security threats and
vulnerability respondents indicated unauthorized access
(82.7%) as a major threat to universities information
security governance, others include social engineering
(80.2%), IP spoofing (79.3%), Virus attack ( 71.8%),
counterfeit software ( 68.9%), lack of file encryption
(64.3%), lack of system backups (64.3%) and lack of
awareness training ( 54.8%). As for information security
policy the findings indicated that (62.7%) have their
information security policies approved by top
management, 74.4% indicated that the policies are
communicated to them, violation of security policy not
punishable at (81.7%). As for information security controls
respondents indicated that physical security perimeter
implemented (66.3%), no entry controls implemented
(65.3%), user identification in place (75.2%), selection of
strong password put in place (88.3%), no allocation of
access rights (68.2%), no background investigation prior to
employment(89.1%), installed Anti-virus (80.3%),
termination of access right when job terminated
implemented (74.9%). When respondents were asked on
information security a governance responsibility , majority
(74.6%) of the participants indicated that the IT Director
and his team in the IT department are the ones responsible
for maintaining the security program, 81.7% do not have
information security roles stated in their terms and
Independent
Variables
Risk management
Information security
controls
Policies
Roles and
responsibilities
Effective
Security
Confidentiality
Integrity
Availability
Mediating
Factors
Commitment
Compliance

International Journal of Computer Applications Technology and Research
Volume 7–Issue 02, 63-77, 2018, ISSN:-2319–8656
www.ijcat.com 71
conditions of employment, 60.4% no formally appointed a
central point of contact for information security
governance coordination and 71.9% no communication of
business objectives for Information Security Governance
Alignment to staff. A Pearson’s correlation coefficient was
then computed to establish the relationship between Public
universities effective ISG and security best practices; a 2-
tailed test significance value was used. A correlation
coefficient for universities effective ISG with: information
security controls was significant at r=.553, p<.01,
Information policies significant at r=.394, P<.01, Risk
management significant at r=.374, P<.01 and roles and
responsibilities significant at r=.507, p<.01. Multiple
regression analysis was computed to help predict trends,
future values and to understand how much will the
dependent variable change when independent variables
changes. Multiple regression analyses was computed to
understand whether availability can be predicted based on
the predictors. A significant regression equation was found
(P<.001) with R2 = .400 as can be seen in table 1 model
summary and Anova table 2 below. This means that 40 %
of the variation in availability can be explained by the
predictors.
Table 1: Model Summary for availability
Model R Rsquare Adjusted
Rsquare
Std.Error of
the Estimate
1 .632a .400 .384 .46018
a. Predictors: (Constant),Riskmgt_1,Sectrols_1,
Rolesresponsi_1, Secpol_1
Table 2: Anovas for Availability
Model Sumof
Squares
df Mean
Square
F Sig.
1
Regressio
n 36.977 4 9.244 44.019 .000b
Residual 56.521 268 .210
Total 93.498 272
a. Dependent Variable: Availability
b.Predictors:(Constant),Riskmgt_1,Sectrols_1,
Rolesresponsi_1, Secpol_1
A comparison across all statistics presented in Table 3 for
the coefficients shows that; Information security controls
(sectrols_1) has (B =.467, p <.001) ,Risk Management
(Riskmgt_1) has (B =.210, p < .01), Information Security
policies (Secpol_1) has (B =.189, p < .000), Roles and
responsibilities (Rolesresponsi_1) has (B =-.143, p < .05)
are all significant and their coefficients positive indicating
that the greater the proportion of the predictors, the higher
the availability of the effective model for information
security governance.
Table 3: Coefficients for availability with Independent
variables
Model
Unstandardized
Coefficients
Standardized
Coefficients
T Sig.
B Std.
Error
Beta
1
(Constant) -.058 .208 -.279 .780
Riskmgt_1 .210 .076 .134 2.763 .006
Secpol_1 .189 .065 .183 2.920 .004
Sectrols_1 .467 .051 .475 9.113 .000
Rolesrespo
nsi_1 .143 .066 .133 2.161 .032
a. Dependent Variable: Availability
Multiple regression analyses was also computed to
understand whether confidentiality can be predicted based
on independent variable (Riskmgt_1, Sectrols_1,
Rolesresponsi_1, and Secpol_1). From the results ( R2 =
.583 as can be seen in model summary table 4, with a P=
0.000 as can be seen in ANOVA table 5). This means that
58% of the variation in Confidentiality can be explained by
the independent variables.
Table 4: Model Summary for Confidentiality
Model R R Square Adjusted R Square
Std. Error of the Estimate
1 .764a .583 .572 .54181
a. Predictors: (Constant), Riskmgt_1,Sectrols_1, Roles
responsi_1, Secpol_1
Table 5: Anovas for confidentiality
Model Sumof
Squares
df Mean
Square
F Sig.
1 Regression 108.886 4 27.221 93.865 .000b
Residual 77.792 268 .290
Total 186.678 272
a. Dependent: Confidentiality
b. Predictors: (Constant), Riskmgt_1, Sectrols_1,
Rolesresponsi_1, Secpol_1
A comparison across all statistics presented in Table 6 of
coefficients shows that; Information risk management has
(B = .048, p < 0.001), Information security Policies has (B
= .605, p < 0.001), Information security controls
(Sectrols_1) has (B = .613, p < 0.001), Roles and
responsibilities (Rolesresponsi_1), has (B = .357, p<.01)
are significant and their coefficients positive indicating
that the greater the proportion of predictors implemented
the higher the confidentiality of the information security
governance model.
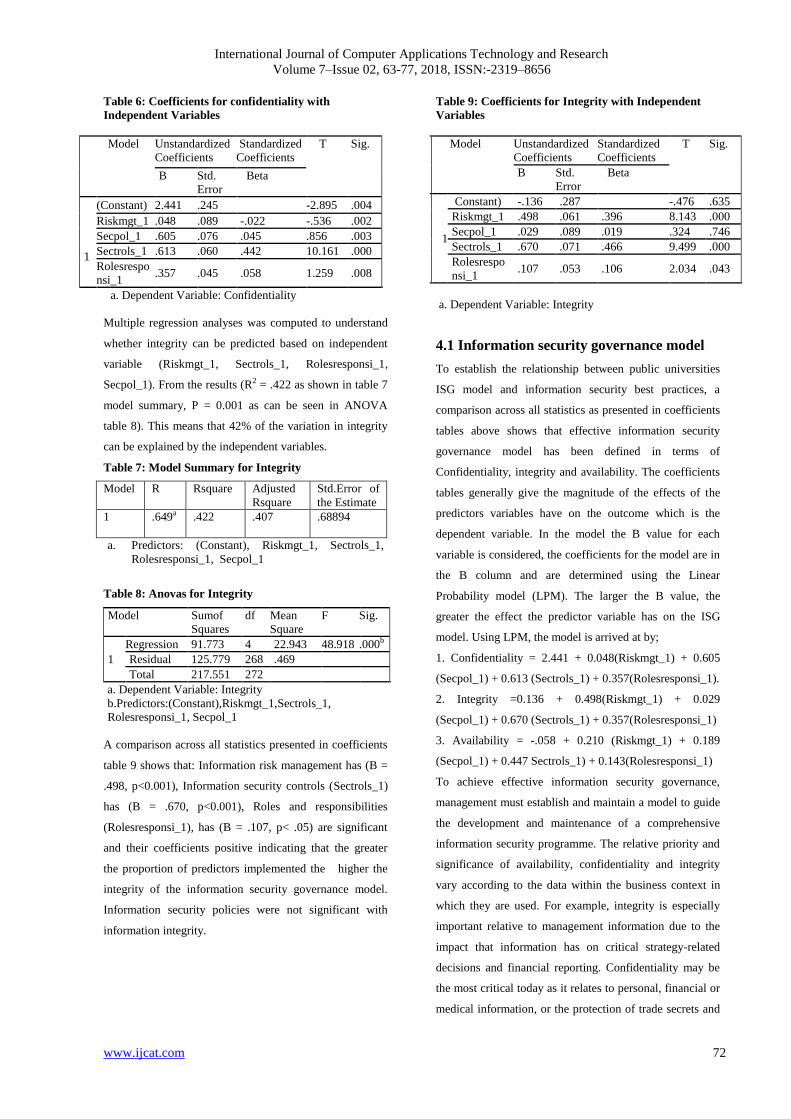
International Journal of Computer Applications Technology and Research
Volume 7–Issue 02, 63-77, 2018, ISSN:-2319–8656
www.ijcat.com 72
Table 6: Coefficients for confidentiality with
Independent Variables
Model Unstandardized
Coefficients
Standardized
Coefficients
T Sig.
B Std.
Error
Beta
1
(Constant) 2.441 .245 -2.895 .004
Riskmgt_1 .048 .089 -.022 -.536 .002
Secpol_1 .605 .076 .045 .856 .003
Sectrols_1 .613 .060 .442 10.161 .000
Rolesrespo
nsi_1 .357 .045 .058 1.259 .008
a. Dependent Variable: Confidentiality
Multiple regression analyses was computed to understand
whether integrity can be predicted based on independent
variable (Riskmgt_1, Sectrols_1, Rolesresponsi_1,
Secpol_1). From the results (R2 = .422 as shown in table 7
model summary, P = 0.001 as can be seen in ANOVA
table 8). This means that 42% of the variation in integrity
can be explained by the independent variables.
Table 7: Model Summary for Integrity
Model R Rsquare Adjusted
Rsquare
Std.Error of
the Estimate
1 .649a .422 .407 .68894
a. Predictors: (Constant), Riskmgt_1, Sectrols_1,
Rolesresponsi_1, Secpol_1
Table 8: Anovas for Integrity
Model Sumof
Squares
df Mean
Square
F Sig.
1
Regression 91.773 4 22.943 48.918 .000b
Residual 125.779 268 .469
Total 217.551 272
a. Dependent Variable: Integrity
b.Predictors:(Constant),Riskmgt_1,Sectrols_1,
Rolesresponsi_1, Secpol_1
A comparison across all statistics presented in coefficients
table 9 shows that: Information risk management has (B =
.498, p<0.001), Information security controls (Sectrols_1)
has (B = .670, p<0.001), Roles and responsibilities
(Rolesresponsi_1), has (B = .107, p< .05) are significant
and their coefficients positive indicating that the greater
the proportion of predictors implemented the higher the
integrity of the information security governance model.
Information security policies were not significant with
information integrity.
Table 9: Coefficients for Integrity with Independent
Variables
Model Unstandardized
Coefficients
Standardized
Coefficients
T Sig.
B Std.
Error
Beta
1
Constant) -.136 .287 -.476 .635
Riskmgt_1 .498 .061 .396 8.143 .000
Secpol_1 .029 .089 .019 .324 .746
Sectrols_1 .670 .071 .466 9.499 .000
Rolesrespo
nsi_1 .107 .053 .106 2.034 .043
a. Dependent Variable: Integrity
4.1 Information security governance model
To establish the relationship between public universities
ISG model and information security best practices, a
comparison across all statistics as presented in coefficients
tables above shows that effective information security
governance model has been defined in terms of
Confidentiality, integrity and availability. The coefficients
tables generally give the magnitude of the effects of the
predictors variables have on the outcome which is the
dependent variable. In the model the B value for each
variable is considered, the coefficients for the model are in
the B column and are determined using the Linear
Probability model (LPM). The larger the B value, the
greater the effect the predictor variable has on the ISG
model. Using LPM, the model is arrived at by;
1. Confidentiality = 2.441 + 0.048(Riskmgt_1) + 0.605
(Secpol_1) + 0.613 (Sectrols_1) + 0.357(Rolesresponsi_1).
2. Integrity =0.136 + 0.498(Riskmgt_1) + 0.029
(Secpol_1) + 0.670 (Sectrols_1) + 0.357(Rolesresponsi_1)
3. Availability = -.058 + 0.210 (Riskmgt_1) + 0.189
(Secpol_1) + 0.447 Sectrols_1) + 0.143(Rolesresponsi_1)
To achieve effective information security governance,
management must establish and maintain a model to guide
the development and maintenance of a comprehensive
information security programme. The relative priority and
significance of availability, confidentiality and integrity
vary according to the data within the business context in
which they are used. For example, integrity is especially
important relative to management information due to the
impact that information has on critical strategy-related
decisions and financial reporting. Confidentiality may be
the most critical today as it relates to personal, financial or
medical information, or the protection of trade secrets and
International Journal of Computer Applications Technology and Research
Volume 7–Issue 02, 63-77, 2018, ISSN:-2319–8656
www.ijcat.com 73
other forms of intellectual property (IP) and availability is
when information is available and usable when required,
and the systems that provide it can appropriately resist or
recover from attacks.
5.0 DISCUSSION
The general objective of the research was to design an
information security governance model for public
Universities through the assessment of current state of
information security governance in public university in
Kenya. It is vital that public universities put appropriate
controls, policies, risk management process, roles and
responsibilities in place to secure information assets. A key
to the protection of a company’s information assets and the
governance of the organizations is risk management.
Enterprise risk management identifies information security
risks that could impact the organization negatively. The
outcome of this study revealed that 60.4% of the
institutions have documented risk identification program is
consistent with prior research on risk management which
states that key to protection of organization’s information
asset and governance of information asset is having
document risk identification program[16]. The ISO 27001
standard requires that the security policy document (A.5)
should be approved by management, published and
communicated as appropriate to all employees [5]. It
should state management commitment and set out the
organization’s approach to managing information security.
Most of the institutions 62.7% have their security policy
approved by management, published and communicated at
74.4% as appropriate to all employees. Information
security policy findings was consistent with prior research
[37] which stated that information security policy should
be documented by organizations as it is a plan identifying
the organization's vital assets together with a detailed
explanation of what is acceptable, unacceptable and
reasonable behavior from the employee. In order to ensure
security of information, the documented policies should
not be violated [37. However, the findings show that
81.7% of the institutions violate policies and the violation
of information security policy is not punishable. Based on
this finding, it is important to help employees understand
that non-compliance with Information security policies can
cause serious information security problems for their
organization. To address this issue, companies should
organize information security seminars or training sessions
to create awareness about information security threats and
their severity. Institutions should also have a number of
options for discreetly enforcing acceptable use of policies.
For example, if IT discovers someone is viewing porn sites
or chatting through Internet Messages all day, they can use
firewall rule sets, router blacklists and content filters to
block the prohibited activity. This keeps the violation quiet
and preserves the person's employment. The findings
therefore suggest that mitigation of risks can only be
achieved through an information assurance programme
that is built on solid strategic foundation defined by policy
and not merely the implementation of malicious code
prevention, firewalls or information security technologies.
Information security policies are an important factor in
determining the confidentiality of information assets. To
exercise effective enterprise and information security
governance, senior executives must have a clear
understanding of what to expect from their enterprise’s
information security programme. They need to know how
to direct the implementation of an information security
programme, how to evaluate their own status with regard
to an existing security programme and how to decide the
strategy and objectives of an effective security programme
[24]. From the finding of the study, 74.6% of the
institutions security governance is left on the hands of
security professionals. The finding is consistent with the
[4] which showed that the responsibility for Information
Security is frequently handed over to the Chief
Information Officer (CIO), or the Chief Security Officer
(CSO), who may not necessarily be positioned to delegate
the resources and have the authority required to resolve
various Information Security-related issues. This study
shows that 81.7% of the institutions security roles are not
stated in terms and conditions of employment an
indication, which is consistent with [21] forum which
stated that in most public organizations, information
security governance responsibilities are loosely defined or
not defined in most job descriptions, security performance
is not a part of job reviews, most employees and even
personnel themselves are not aware of good information
security governance practices. Information security
governance requires strategic direction and impetus. It
requires commitment, resources and assignment of

International Journal of Computer Applications Technology and Research
Volume 7–Issue 02, 63-77, 2018, ISSN:-2319–8656
www.ijcat.com 74
responsibility for information security management, as
well as a means for the top management to determine that
its intent has been met. Experience has shown that the
effectiveness of information security governance is
dependent on the involvement of senior management in
approving policy and appropriate monitoring and metrics
coupled with reporting and trend analysis.
6. CONCLUSION Information security governance is the responsibility of the
senior executives. It must be an integral and transparent
part of enterprise governance and be aligned with the IT
governance framework. Senior executives have the
responsibility to consider and respond to the concerns and
sensitivities raised by information security, they are also
expected to make information security an intrinsic part of
governance, integrated with processes they already have in
place to govern other critical organizational resources. The
research reveals that information security governance
desired outcomes cannot be achieved due to lack of senior
executive management involvement. Accordingly,
executive management is required to both direct and
control information security according to sound corporate
governance principles and list of information security best
practices which include implementing various internal
controls, policies, risk management strategies and
mediating factors for information security to provide
assurance that information asset are in a secure
environment for business to thrive. The research reveals
that most of these security best practices are rarely fulfilled
due to lack of effective information security model for
attention by executive management which will guide the
executive management in the allocation of finance to
Information security efforts in relation to the risks and
degree of damage that security incidents may produce. To
address this research gap, the study integrates a model for
information security governance in public universities in
Kenya with information security controls, policies, risk
management strategies, defined roles and responsibilities.
The findings strongly support the model, showing that all
the security best practices ensured confidentiality, integrity
and availability of information asset.
7. RECOMMENDATIONS
The study reviewed the current state of information
security governance in Public universities in Kenya. The
findings inform the research that information Security is
still viewed as a technical aspect and not given any
attention from the executive management. Due to lack of
attention by the executive management Information
Security has become reactive rather than proactive and
poorly coordinated across the Institutions. The study
recommends the executive management to rethink the way
Information security should be addressed. They should be
fully responsible for Information security in their
institutions. They need to integrate information security
into the corporate governance through the proposed model.
The proposed model will help them have a reference point
of acceptable of risks to information assets. Executive
management should ensure the Information security is
escalated to the boardrooms to be allocated enough
resources just like other business assets. Proper
information security governance is only possible on the
basis of sound risk analysis, Public Universities should
therefore use risk analysis as the basis for formulation of
information security policy as well as selecting
information security controls. Policy enforcement:
Information security policy should be implemented and
enforced to keep information secure. Password policies
should be implemented and enforced to ensure the
selection of strong passwords. The results of this study
reveal that some users use weak passwords. Poor password
selection is frequently a major problem for any system's
security. Practically it can be challenging to ensure that
staff and students have read, understood and complied with
policies but the policies cannot be effective unless they are
widely understood and enforced.
REFERENCES [1] Andress, J. (2011). The Basics of Information
Security: Understanding the Fundamentals of
InfoSec in Theory and Practice. R. Rogers, Ed.
Elsevier.
[2] Arnason, S.T., and Willet, K.D., (2008). How to
Achieve 27001 Certification: An Example of
Applied Compliance Management. New York:
Auerbach Publications
International Journal of Computer Applications Technology and Research
Volume 7–Issue 02, 63-77, 2018, ISSN:-2319–8656
www.ijcat.com 75
[3] Bhaskar SM, Ahson SI (2008) Information
Security: A practical Approach. Oxford: Alpha
Science International Ltd.
[4] Business Software Alliance (2004). Information
Security Governance towards a Model. available
from:
http://www.bsa.org/resources/loader.cfm?url=/co
mmonspot.
[5] Calder, A. and Watkins, S. (2008). 4th Ed. IT
governance: A manager’s guide to data security
and ISO 27001/ ISO 27002.
[6] Casey, E. (2011). Digital evidence and computer
crime: Forensic science, computers, and the
internet, Academic press.
[7] Charles O. Oguk, C. Nickson Karie. N and
Rabah, K. (2017). Information Security Practices
in Universities in Kenya. Mara Research Journal
of Computer Science & Information Security
Vol. 2, No. 1, September 2017, Pages 61 - 73,
ISSN 2518-8453.
[8] Commission of University Education (2013).
Status of public Universities in Kenya and the
ripple effects. Retrieved from
http://www.cue.or.ke/status
[9] Cronbach, L. J. (1951). Coefficient alpha and the
internal structure of tests. Psychometrika 16,
297-334.
[10] Elachgar, H. & Regragui, B. (2012). Information
security, new approach. Innovative Computing
Technology (INTECH), 2012 Second
International Conference.
[11] Entrust, Inc., (2004). Implementing Information
Security Governance (ISG). Available from:
http://itresearch.forbes.com.
[12] Federal Trade Commission (2006). Identity
Theft Survey Report, Synovate. Available at:
http://www.synovate.com.
[13] Furnell, S., & Clarke, N. (2012). Power to the
people? The evolving recognition of human
aspects of security. Computers and Security,
2012, 983-988.
[14] Gilmore, J. (2009). Hackers attack campus
databases, steal Social Security numbers, other
data.
http://www.berkeley.edu/news/media/releases/20
09/05/08_breach.shtml.
[15] Harris, E. & Hammatgren, R. (2016). Higher
education Vulnerability and cyber attacks:
Establishing a written Information Security
program to address exposure Available at:
http://www.universitybusiness.com.
[16] Humphreys, EJ. Moses RH. and Plate EA.
(2012). Guide to BS779 Risk Assessment and
Management. British standard Institution (108).
[17] IFA, (2012). Pragmatic Security metrics.
Applying metrics to information security
International Security proceedings USA, 2012.
[18] International Federation of Accountants (1998).
International Information Technology
Guidelines—Managing Security of Information,
USA, 1998.
[19] ISACA,(2012). COBIT 5 for Information
Security. Available:
https://www.isaca.org/COBIT/.Documents/COBI
T-5-for-Information-Security-Introduction.pdf
[20] ISO/IEC 17799:2005: Information Technology –
Security Techniques – Code of Practice for
Information Security Management, ISO, Geneve
(2005).
[21] ISO/IEC 27002 (2005). Information technology -
security techniques - code of practice for
information security management. Switzerland
[22] ITGI (2003). Information Security Governance:
Guidance for Boards of Directors and Executive
Management’, USA, IT Governance Institute.
[23] ITGI (2005). Information Risks: Whose
Business are they, IT Governance Institute.
[24] ITGI (2006). Information Security Governance:
Guidance for Boards of Directors and Executive
Management, Rolling Meadows, IL, IT
Governance Institute.
[25] Jansson, K. (2011). A Model for Cultivating
Resistance to Social Engineering Attacks.Nelson
Mandela Metropolitan University.
[26] Karp (2016). U.S. Patent No. D761,822.
Washington, DC: U.S. Patent and Trademark
Office.
[27] King Report (2011). The king report on
corporate governance, Available from
http://www.iodsa.co.za
[28] Kritzinger (2013). Cyber security and
Universities: Managing the risks, UK
Government National Cyber Security strategy.
www.universitiesuk.ac.ke

International Journal of Computer Applications Technology and Research
Volume 7–Issue 02, 63-77, 2018, ISSN:-2319–8656
www.ijcat.com 76
[29] Kritzinger, E. and Solms, S. (2013). A
Framework for Cyber Security in Africa. JIACS,
Vol. 3, pp.1-10.
[30] Lane, T. (2007). Information Security
Management in Australian Universities - An
Exploratory Analysis.
[31] Magomelo, M., Mamboko, P., Tsokota, T.,
(2014). The Status of Information Security
Governance within State Universities in
Zimbabwe. Journal of Emerging Trends in
Computing and Information Sciences.
[32] Modern Malware Review (2017). Top 6 higher
education security risks and Issues [online]
available at: http://www.integrationpartners.com
[33] McMillan, R., & Scholtz, T. (2010). Security
governance and operations are not the same.
[34] Ministry of Education (2007). Press Release By
Hon. Minister For Education - Friday, 25th May
2007 on the eve of “2nd International
Conference on ICT for Development, Education
and Training - E-Learning Africa [online].
Available at: http://www.elearning-
Kenyan_Ministry_of_Education.pdf.
[35] National Institute of Standards and Technology
(1995). An Introduction to Computer Security:
88 The NIST Handbook, Special Publication
800-12 [online] Available at:
http://csrc.nist.gov/publications/nistpubs/800-
12/handbook.pdf.
[36] National Institute of Standards and technology
(1996). An introduction to Computer Security.
[37] National Institute of Standards and Technology
(2003). Building an Information Technology
Security Awareness and Training Program,
Special Publication 800-50 [online] Available at:
http://csrc.nist.gov/publications/nistpubs/800-
50/NIST-SP800-50.pdf.
[38] National Security Agency, USA. (2002).The 60
Minute Network Security Guide. First Steps
Towards a Secure Network Environment.
[39] NIST - National Institute of Standards and
Technology. 2013. Security and Privacy
Controls for Federal Information Systems and
Organizations.NIST Special Publication 800-53,
Revision 4. Available at
http://nvlpubs.nist.gov/nistpubs/SpecialPublicati
ons/NIST.SP.800-53r4.pdf
[40] Oguk, C.O., Karie, N., Rabah, K. (2017).
Information Security Practices in Universities in
Kenya. Mara Res. J. Computer. Sci. Inf.
Security. Vol. 2, No. 1, Pages 61 - 73, ISSN
2518-8453.
[41] Peltier, T.R., Peltier J., and Blackley J. (2005).
Information security fundamentals.CRC Press.
[42] Perlroth, N. (2012). Hackers Breach 53
Universities and Dump Thousands of Personal
Records Online.
http://bits.blogs.nytimes.com/2012/10/03/hacker
s-breach-53-universities-dump-thousands-of-
personal-records.
[43] Rainer & Cegielski (2010). Introduction to
Information system: Enabling and
transformation of Business. 3rd Edition Wiley
and sons.
[44] Schweitzer J.A., (1990). Managing Information
Security: Administrative, Electronics, and Legal
measures to Protect Business Information.
Boston: Butterworths.
[45] Swindle, O. and Conner, B. (2004). The link
between information security and corporate
Governance May 2004.
[46] The Star (2011). Student fails to stop KU
graduation date [online] Available at:
http://www.the-
star.co.ke/national/national/52785-student-fails-
to-stop-ku-graduation-date.
[47] Thompson K. and Von Solms R. (2006)
Integrating Information Security in Corporate
Culture, Port Elizabeth Technikon.
[48] United Nations Interregional Criminal Justice
Research Institute. 2015b. Information Security
Management System Planning for CBRN
Facilities. United Nations Interregional Criminal
Justice Research Institute, Turin, Italy.
[49] Vacca, J.(2009). Computer and Information
Security Handbook. Elsevier
[50] Veseli, I. (2011). Measuring the Effectiveness of
Information Security Awareness Program
(Master's thesis). (Luambano & Nawe 2004).
[51] Von Solms, B. and Von Solms, R. (2004). The
10 deadly sins of Information Security.
Management Computers & Security.
[52] Von Solms, R. and Von Solms, S.H. (2008).
Information Security Governance. Springer
International, USA: New York.
International Journal of Computer Applications Technology and Research
Volume 7–Issue 02, 63-77, 2018, ISSN:-2319–8656
www.ijcat.com 77
[53] Von Solms., B. (2006). What every Vice-
Chancellor and Council Members should know
about the use of ICT. CITTE Conference, 2006,
Pretoria.
[54] West, R. (2008). The psychology of security.
Communications of the ACM, 51(4).
[55] Williams, P., & Andersen, A., (2001).
Information Security Governance. Information
Security Report, 6(3), 60-70.
[56] Willison, R., & Warkentin, M. (2013). Beyond
deterrence: An expanded view of employee
computer abuse. MIS Quarterly, 37(1), 1-20.
[57] Yamane, Taro (1995). Statistics: an introductory
analysis. New York: Harper & Row

International Journal of Computer Applications Technology and Research
Volume 7–Issue 02, 78-85, 2018, ISSN:-2319–8656
www.ijcat.com 78
Examining Financial Performance, Firm Size, Leverage and Corporate Social Responsibility
Dr. Fraser Nega*
Walden University
USA
Dr. Ify Diala-Nettles
Walden University
USA
Abstract— Approximately $25.2 trillion in total assets under management is involved in some strategy of socially responsible and sustainable
investing. Grounded in the stakeholder theory, the purpose of this correlational study was to examine the relationship between financial
performance, firm size, leverage, and corporate social responsibility. A random sample included 119 large companies in the United States
from the population of companies listed in the Russell 1000 index. The data were collected via Bloomberg Terminal. Multiple linear
regression analysis was used to predict Environmental, Social & Governance (ESG) activity scores. The 3 predictor variables accounted for
approximately 7% of the variance in ESG activity scores and the result was statistically significant, F (3,115) = 2.83, p < .04, R2 = .07.
Although the p value was significant, the R2 was low, thus representing a poor model fit. In the final analysis, total revenue was a significant
predictor and was negatively correlated with ESG activity scores. However, return on equity and leverage were not significant predictors of
ESG activity scores. This suggested the potential need to transfer some corporate social initiatives from business leaders to government policy
makers. Future researchers should consider incorporating additional variables to make the model more useful. The results of this study are
expected to identify fiscal incentives for corporate social programs that would benefit stakeholders such as employees, suppliers, customers,
communities, and the environment.
Keywords— Financial Performance, Firm Size, Leverage, Corporate Social Responsibility, Bloomberg
I. INTRODUCTION
Corporate social responsibility (CSR) is a vital competitive strategy for all types of business organizations (Chandler
&Werther, 2013). Managers may improve competitiveness by engaging CSR strategies, based on the strengths of their
companies (Nagurney & Li, 2014). Implementing CSR strategies can transform a company’s image and thus lead to a positive
outlook among consumers, suppliers, and communities served by the company (Amma, Thaliyan & Lekshimi, 2013). As
thousands of companies in hundreds of countries participate in some level of CSR practices, research about CSR shifted from
existential questions to the core business and contextual factors, processes, and related measures of financial and social findings
(Tilt, 2016; Wang, Tong, Takeuchi, & George, Dahlander, Graffin, & Sim, 2016). Stakeholders may benefit from research that
explains the relationship between financial performance, firm size, leverage, and CSR. This understanding may, in turn, lead to
innovation, efficient logistics, employee motivation, positive publicity, and sustainability (Girerd-Potin, Jimenez, & Louvet,
2014). Wang et al. (2016) highlighted the concept of CSR and the various factors pertaining to organizational purpose, with a
call for additional research to inform academics and managerial leadership on business elements related to the transformative
roles of businesses in contemporary society.
II. PROBLEM & PURPOSE OF THE STUDY
Financial performance, firm size, and leverage may influence CSR (Maskun, 2013). In 2011, approximately $3.74 trillion of
the $25 trillion of investment assets in the United States was financed via socially responsible activities—a 22% increase since
2009 (Elliot, Jackson, & Peecher, 2014). The general business problem was that business leaders may lack adequate knowledge
to understand the implications of CSR on the financial performance of their businesses (Wang et al., 2016). The specific
business problem was that some business leaders in the United States do not understand the relationship between financial
performance, firm size, leverage and CSR. The purpose of this quantitative correlational study was to examine the relationships
between financial performance, firm size, leverage, and CSR. The predictor variables were financial performance, firm size, and
leverage. The criterion variable was environmental, social and governance (ESG) activity scores. The population for this study
comprised American publicly traded corporate firms listed in the Russell 1000 Index. The implications for positive social
change included the need for government policy makers to investigate the potential need and means to implement regulations
and financial incentives to increase the scale and prominence of CSR activities that may benefit employees, customers, the
environment, and members of society.

International Journal of Computer Applications Technology and Research
Volume 7–Issue 02, 78-85, 2018, ISSN:-2319–8656
www.ijcat.com 79
III. DISCUSSIONS
The following three null and alternative hypotheses, which aligned with the three predictor variables and the single criterion
variable in the overarching research question:
H1o. There is no statistically significant relationship between financial performance and CSR.
H1a. There is a statistically significant relationship between financial performance and CSR.
H2o. There is no statistically significant relationship between firm size and CSR.
H2a. There is statistically significant relationship between firm size and CSR.
H3o. There is no statistically significant relationship between leverage and CSR.
H3a. There is a statistically significant relationship between leverage and CSR.
A. Corporate Social Responsibility
CSR has become an increasingly important part of companies’ operations (Deng, Kang, &Low, 2013). Many businesses
increased their investment in CSR activities and some firms dedicated large portions of their annual reports to present their CSR
activities (Flammer, 2013). At the end of 2011, $3.74 trillion of the $25 trillion of investment assets went toward socially
responsible investment initiatives (Elliot, Jackson, & Peecher, 2014). The growing importance of corporate social investments
by American firms led to questions about why business leaders integrate CSR into their business strategies, especially in light of
the prior research that revealed mixed evidence for a relationship between CSR and financial performance (Wang et al., 2016).
American companies increasingly involved in CSR initiatives reported two major reasons for CSR investments, competition,
and profit growth (Flammer, 2015). The history of defining CSR dated back to Freeman (1984) who advanced the idea that in
the process of profit-maximization, firms should do right by their employees, customers, the environment, and local
communities. Freeman’s work pertained to the duties associated with good corporate citizenship. To build on Freeman’s work,
Solomon and Hanson (1985) suggested that addressing social responsibility is good for investors, as well as other stakeholders.
Solomon and Hanson expanded the view of stakeholders to include (a) customers, (b) employees, (c) communities, (d) public
interest groups, and (e) government agencies or regulators. Decades later, scholars, such as Kirat (2015), focused on the idea of
CSR as involving the maintenance of a high standard of living for stakeholders while increasing profits for organizations. The
various definitions provided by scholars are pertinent to the three essential dimensions of CSR: environmental, social, and
governance (Wang et al., 2016). Multiple terms emerged from the academic literature as synonymous or associated with CSR,
such as (a) social responsibility, (b) corporate social performance, (c) corporate citizenship, (d) sustainability, (e) global
business citizenship, (f) corporate governance, (g) corporate accountability, (h) corporate community engagement, and (i)
business commitment (Ioannou & Serafeim, 2015; Luu, 2013; Tribó et al., 2012). Early work with stakeholder theory and CSR
had significant philosophical implications (Flammer, 2013; Van Limburg et al., 2015). However, the new theoretical
approaches to CSR extended beyond the previous narrow focus toward a combined framework that includes operational and
behavioral aspects of companies’ integration with their outside environments (Wang et al., 2016). The traditional role of
business leaders is facing a challenge due to growing demands of societies (Schmelz, 2014). Companies rarely act as separate
entities operating with minimum attention to society (Wang et al., 2016). In the past, business leaders created strategies that
enabled them to maximize profits and outperform their competitors (John, 2014). Business leaders had no plan to listen to other
stakeholders as outside regulators closely monitored companies’ day-to-day activities to protect the environment and members
of communities (Flammer, 2013). Business leaders became more enthusiastic in embracing voluntary self-regulations to address
the social and environmental goals (Javaid, Ali, & Khan, 2016), and from a growing demand to incorporate the stakeholders’
interest into the companies’ business strategies (Van Limburg et al., 2015). According to Filatotchev and Nakajima (2014), CSR
initiatives provided opportunities for business leaders to convert resources into goods and services while creating additional
value for stakeholders. Successful leadership is required to promote companies’ corporate citizenship (Lindgreen et al., 2012;
Luu, 2013). Business leaders incorporate CSR as an integral part of the decision-making process (Jones, Mackey, &Whetten,
2014). Jones et al. (2014) furthered the idea that the adoption of CSR within a company requires progressive leadership
approach; progressive leaders are enablers and inspire a shared vision, which involves motivation, empowering employees
towards a greater good that serves stakeholders. Jones et al. noted that the implementation of progressive leadership strategies
requires business leaders to commit to their roles in facilitating employee motivation, team building, diversity, equal
employment, ethics, and financial transparency. Another aspect of CSR involves maintenance of adequate corporate governance
and control (Yusoff, Dalila, Jamal, & Darus, 2016). Jo and Harjoto (2011) noted that CSR is an extension of companies ‘efforts
to foster effective corporate governance to ensure sustainability via sound business practices that promote accountability and
financial transparency. Adequate corporate governance and controls build trusts with stakeholders through positive public
relations and high ethical standards to minimize business and legal risks and maximize responsible actions. The social
responsibility actions may include community development, environmental protection, customer satisfaction, and philanthropy,
creating shared value, social education and awareness, and product safety (Wang et al., 2016). Philanthropy involves charitable
activities by companies to share benefits with the communities and the environment in which these companies operate (Mair &
International Journal of Computer Applications Technology and Research
Volume 7–Issue 02, 78-85, 2018, ISSN:-2319–8656
www.ijcat.com 80
Hehenberger, 2014; Tilcsik & Marquis, 2013). Corporate philanthropic activities include the donation of funds, goods, and
services to serve the social and environmental welfare programs (Yusoff et al., 2016). Growing expectations by the customers
and communities may lead to increased corporate philanthropy (Sahota, 2013). Corporate philanthropy is one of the most
distinguishing factors between stockholder theorists who suggest profit maximization as the sole responsibility of a manager
and stakeholder theorists who advance corporate citizenship (Yusoff et al., 2016). Active participation of a manager in
corporate philanthropy promotes the wellbeing of the communities and may enhance stakeholders’ satisfactions (Wang et al.,
2016). In so doing, companies may attract new consumers and increase their prospects of future profitability (Koschate-Fischer
et al., 2012; Lindgreen et al., 2012; Metcalf et al., 2013). Managers may use corporate philanthropy to expand and promote
marketing programs and build positive reputations, which is an important intangible business firm asset (George et al., 2016).
Basera (2013) noted that in the last few decades, CSR became a broad concept with a focus on environmental concerns,
attraction of customers, service to communities, and treatment of employees. A review of the literature showed that six of the
major essential elements of corporate social responsibilities are addressing and benefiting (a) the environment, (b) customers, (c)
communities, (d) employees, (e) marketplace, and (f) government. Traditionally, the role of business manager was to generate
profits for the sole purpose of enhancing shareholder value (Basera, 2013). Baker (2004) and Paul and Lee (2007) explained the
transition toward social responsibility as stemming from both a moral responsibility as well as a strategic resource essential to
increase financial performance.
B. Relationship Between Financial Performance and CSR
Despite numerous studies by scholars, the relationship between financial performance and CSR remains questionable (Lu,
Chau, Wang, &Pan, 2014). The empirical study authored by Bidhari, Salim, and Aisjah (2013) involved the effects of CSR
information disclosure on financial performance and firm value in banking. Bidhari et al. selected 15 banking firms listed at ISE,
based on population criteria with observation of secondary data obtained from annual reports and financial statements from
2008 to 2011. Bidhari et al. applied path analysis method to analyze the data that revealed CSR information disclosure affects
all financial performance measurements, namely return on assets, return on equity, and return on sales. This empirical research
was relevant to this doctoral study in its examination of the potential link between CSR and financial performance. The study’s
findings indicated compelling argument as to which variables are appropriate to examine the relationship between CSR and
financial performance. Similarly, Ofori, Nyuur, and Darko (2014) reviewed the impact of CSR on financial performance based
on empirical evidence from the Ghanaian banking sector. The study included a sample of 22 banks and a structured
questionnaire to obtain primary data and used secondary sources for additional numerical data (Ofori et al., 2014). The research
findings revealed that banks in Ghana consider CSR practice as a strategic tool and Ofori et al. concluded there could be a
positive relationship between CSR and financial performance. However, the financial performance of banks in Ghana depends
significantly on other control variables such as growth, debt ratio, origin, and size (Ofori et al., 2014). This research also has
relevance to the primary research question of my study, which is an inquiry about a relationship between CSR and financial
performance. The possible relationship between CSR and financial performance is the subject of the first hypothesis of this
study.
C. Firm Size Measurements
Firm size is the second predictor variable proposed for this study. Firm size is an important variable because large companies
may promote CSR strategies more often than small firms. Inclusion of the concept of firm size may lead to additional insights
about a relationship that may exist between firm size and CSR. As detailed in previous sections, financial performance and CSR
were the subjects of previous research. However, relatively few researchers examined the possibility of a relationship between
firm size and CSR. According to Udayasankar (2008), small and medium-sized firms consist of 90 percent of the global number
of companies; unlike large firms, small firms have limited capital and operational capacities that may limit CSR activities.
D. Relationship Between Firm Size and CSR
Firm size is an element applied to explain economies of scale in production, advertising, capital market, and profitability
applied (Shalit & Sankar, 1977). Some factors determine firm size; according to Dang and Lee (2013), the two most popular
theories applied to determine firm size are technological theories and organizational theories. The size of a firm tends to be
large when longer chains of production process organized within the boundaries of the company. Technological theorists
postulate that as technology grows fast, the size of a firm declines. A practical example of this theory observed in the
manufacturing sector. Continuous investments in technology may reduce the need for hiring more workers because, as the
company transitions from labour-intensive to capital-intensive practices, leaders begin to hire only small and highly skilled
number of employees (Mohamad & Ismail, 2013). Sun, Shen, Cheng, & Zhang (2015) examined the Chinese manufacturing
sectors to determine the relationship between firm size and factor intensity. The study’s findings indicated that firms in more
capital-intensive industries are larger than those industries that are more labour-intensive. Technological theories focus on the
production process and emphasize physical capital and economies of scale and scope as variables that determine the optimal

International Journal of Computer Applications Technology and Research
Volume 7–Issue 02, 78-85, 2018, ISSN:-2319–8656
www.ijcat.com 81
firm size and ultimately profitability. Organizational theorists have linked size and profitability with organization structure,
agency cost, and span of control. Organizational theorists noted that most small businesses are sole proprietorships or
partnerships, while large firms are corporations or public companies managed by managers (Kirkland, 2015). In a corporate
business structure, an elected board of directors oversees the firm with the appointment of executive staff to manage the
company (Eesley et al., 2015). The executives manage the daily activities of the company and directly responsible for
implementing corporate strategies, although market demand tends to drive managerial activities as well as technology-
innovation achievements (Zou, Guo, & Guo, 2016). Orlitzky (2001) conducted a meta-analysis of the relationship between firm
size and corporate social performance, as well as CSR and financial performance. The study’s results indicated that meta-
analysis indicated a weak correlation between firm size and corporate social performance, whereas CSR and financial
performance may have a stronger positive relationship (Orlitzky, 2001). A limitation of the study was the meta-analytical
approach, but the study is relevant to the research question and provides an insight to support the ongoing study of CSR and
firm size. Understanding the configuration of firm characteristics in studying CSR findings is also important. Udayasankar
(2008) examined the relationship between CSR and firm size, including the different economic motivations of businesses with
varying combination of visibility, resource access, and scale of operations included in the examination. Udayasankar’s results
indicated that visibility, resource access, operating scale, and firm size lead to active social responsibility participation. The
research outcome, however, revealed a U-shaped relationship between firm size and CSR, implicating other factors that may
lead to active CSR, in addition to the size of a firm. Similarly, Lepoutrue and Heene (2006) examined firm size and CSR.
Lepoutrue and Heene reviewed the impact of firm size on four major antecedents of business characteristics: (a) issue
characteristics, (b) personal characteristics, (c) organization characteristics, and (d) context characteristics. Lepoutrue and
Heene revealed that size does not impose barriers on CSR activities. However, smaller firm CSR activity depended on
conditions such as (a) availability of resources, (b) the influence of external stakeholders, (c) negotiation power, and (d) socio-
economic conditions (Lepoutrue & Heene, 2006). Scholars such as Wang et al. (2016) suggested continuing the study of CSR
considering previous research that filled the peer-reviewed literature but that may not be as relevant to the changing contexts of
businesses in society due to the passage of time. A logistic regression analysis in a more recent study by Ozcelik, Ozturk, and
Gursakal (2014) revealed no relationship between CSR and financial performance, but indicated the possibility of a positive
relationship between CSR and company size. In this study, Ozcelik et al. selected a sample from the top 100 firms from Istanbul
Stock Index, who adopted CSR between 2010 and 2012. CSR was the dependent variable and financial performance, firm size,
risk, and type of ownership were independent variables (Ozcelik et al., 2014). Although there was a significant relationship
between company size and CSR for the sample in Istanbul, analysis did not indicate any relationship between financial
performance, risk, type of ownership, and CSR. The application of the accounting-based financial measurement metrics to
measure financial performance and the data analysis methodology used make it relevant to this study. Additionally, research
results might differ among industries, sectors, and operating locations based on differences in regulatory, cultural, and political
climates, which are limitations to the generalizability of Ozcelik et al.’s findings.
E. Relationship Between Leverage and CSR
Leverage in finance refers to the use of debt to finance or fund investments (Zhu et al., 2014). The use of debt to fund their
operations is a common practice by most business companies and can be a good business strategy if managers use it efficiently.
Understanding the implication of leverage can help investors and the company (Zhu et al., 2014). The prudent use of debts by a
manager may increase profitability; however, if companies use too much debt to finance operations, and the investment did not
go well, the company may face significant risks, as leverage affects future funding opportunities (Serrano-Cinca, Gutiérrez-
Nieto, & López-Palacios, 2015). The risks include substantial interest expense and default risk may reduce shareholders’ value.
In this study, leverage is one of the three predictor variables, which represent a new model for the view of CSR activities.
Orlitzky and Benjamin (2001) studied the relationship between CSR and financial risks. Orlitzky and Benjamin examined the
relationship between corporate social performance and financial performance and hypothesized that strong corporate social
performance could reduce financial risks. Orlitzky and Benjamin distributed a survey to the top-level managers of 655
corporations and applied descriptive statistics and regression to analyze the responses. Orlitzky and Benjamin reported a
relationship between corporate social performance and risk that appeared to be one of reciprocal causality. Implication of the
study by Orlitzky and Benjamin included the idea that a higher corporate social performance may lead to lower financial risks.
In another study, Maskun (2013) explored the impact of leverage, company size, and profitability on disclosure of CSR of 15
LQ-45 companies in the Indonesian Stock Exchange from 2009 through 2011. Maskun applied multiple linear regression
models to measure the impact of leverage, company size, and profitability on CSR disclosure. Results reported by Maskun
indicated companies with significant profit size maintained CSR disclosures. In regard to company size and leverage, the results
indicated large companies tended to have better CSR disclosures and high leverage levels had a significant positive impact on
CSR disclosures of the Indonesian companies (Maskun, 2013).

International Journal of Computer Applications Technology and Research
Volume 7–Issue 02, 78-85, 2018, ISSN:-2319–8656
www.ijcat.com 82
IV. METHODOLOGY
The objective of this quantitative study was to determine whether a significant relationship exists between financial
performance, firm size, leverage, and CSR. In this study, secondary archival data sources were used and it did not involve
human subjects. The appropriate way to examine the relationship was the use of a quantitative methodology and multiple
regression analysis using secondary datasets. The use of secondary data from the Bloomberg database for this study involved
searching the well-publicized, publicly available, free financial database. The specific sample data for this research came from
the Russell 3000 index, composed of the largest 3000 U.S. public companies (Malenko & Shen, 2016). SPSS Version 21
software was used to facilitate analysis of large datasets. A quantitative research method involves logical formation and
examination of research questions, hypothesis testing, and determination of relationships among known variables. The research
design for this study was correlational. The correlational design was suitable for the study of possible relationships among
known quantifiable variables. In this study, financial performance, firm size, and leverage were the predictor variables and ESG
activity scores was the criterion variable. The population consisted of companies in the top five Russell Global Sectors that
include financial, technology, health care, consumer discretionary, and producer durables. According to Mertens (2014),
sampling of the population is the extraction of subsets from the general frame to examine characteristics. The sample from the
population in quantitative studies leads to an opportunity to infer characteristics to the entire population. The general population
was U. S. publicly traded companies listed in the Russell index by the end of 2015. A random sampling technique was suitable
for quantitative research, resulting in a high level of inferential precision without studying every element of the population
(Bryman & Bell, 2015). In this study, there was an assumption that a random sample of the population is generalizable to the
larger population with a predefined confidence level. In a systematic random sampling technique, the companies in the
population received a number. It was determined the sample interval size (k) by dividing the number in the population (N) by
the number in the sample (n), predetermined by using G*Power3 statistical software. For this study, G*Power’s F-test
regression for linear multiple regression. The F-test regression test requires selecting and justifying an established effect size
of .02, .15, and .35 for small, medium, and large, respectively. A power analysis, using G*Power3 Version 3.1.9 software
conducted to determine the appropriate sample size for the study. A priori power analysis which contained three predictor
variables using a medium effect size (f = .15), = .05, and F-test linear multiple regression indicated a minimum sample size of
77 firms was sufficient to achieve a power of .80, and a maximum sample size of 119 firms to achieve a power of .95. Therefore,
in this study, a total sample size of 119 firms was obtained.
V. FINDINGS & RESULTS
Inferential Statistical Results
The regression analysis summary table for predictor variables (Table 1) contains the standardized regression equation
coefficients for the relationships between financial performance, firm size, leverage and CSR. The standardized β coefficients
indicate by how much the dependent variable is expected to increase or decrease for a unit change in the independent variable in
comparison with standardized coefficients of the other predictor variables.
Table 1
Regression Analysis Summary for Predictor Variables
Variable B SE B β t p Bootstrap 95% CI (M)
ROE .06 -09 .06 .67 .50 -.12 – .22
Total Revenue -.56 .12 -.26 -2.87 .01 -.90 – -.22
Leverage -.01 .02 -.04 -.40 .69 -.04 – .04
Note. N = 119; B = unstandardized coefficient; β = standardized coefficient
Standard multiple linear regression was used, α = .05 (two-tailed), to examine the relationship between financial performance,
firm size, leverage, and corporate social responsibility. The predictor variables were financial performance, firm size, and
leverage. The criterion variable was CSR ESG activity scores. The central research question pertained to the significance of the
relationship between financial performance, firm size, leverage, and corporate social responsibility. The following research
hypotheses reflected the research question:
H1o. There is no statistically significant relationship between financial performance and CSR.
H1a. There is a statistically significant relationship between financial performance and CSR.

International Journal of Computer Applications Technology and Research
Volume 7–Issue 02, 78-85, 2018, ISSN:-2319–8656
www.ijcat.com 83
H2o. There is no statistically significant relationship between firm size and CSR.
H2a. There is statistically significant relationship between firm size and CSR.
H3o. There is no statistically significant relationship between leverage and CSR.
H3a. There is a statistically significant relationship between leverage and CSR.
The model was adequate to significantly predict ESG activity scores, F (3, 115) = 2.83, p <.04, R2 = .07. The low R
2 (.07) value
indicated that the linear combination of the predictor variables (ROE, total revenue and leverage) was an explanation for
approximately 7% of the variations in ESG activity scores. In the final analysis, the predictor variable total revenue was
statistically significant to explain the variation in ESG activity scores with (β = -.26, t = -2.87, p <.01). The other predictor
variables ROE (β = .06, t = .67, p >.50) and leverage (β = -.04, t = -.40, p >.69) did not explain any significant variations in ESG
activity scores. Based on the statistical significance of the predictor variable (total revenue), I could reject the respective null
hypothesis. Based on the statistical insignificance of the other two predictor variables (ROE and leverage), I could not reject
their respective null hypotheses. The final predictive equation was:
ESG Activity Score = 33.65 + .06 ROE -.56 Total Revenue - .01 Leverage (1)
Total Revenue. There is a statistically significant negative relationship between firm size and corporate social responsibility.
The negative slope for total revenue (-.56) as a predictor variable of ESG activity scores indicated that there was about a .56
decrease in ESG activity scores for each 1-point increase in total revenue. The squared semipartial coefficient (sr2) that is an
estimate of how much variance in ESG activity scores was uniquely predictable from total revenue was .07, indicating that total
revenue accounts for 7% of the variance in ESG activity scores, after controlling for the effects of ROE and leverage.
ROE. There is no statistically significant relationship between financial performance and corporate social responsibility. The
positive slope for ROE (.06) as a predictor variable of ESG activity scores indicated that there was about a .06 increase in ESG
activity scores for each 1-point increase in ROE. The squared semipartial coefficient (sr2) that estimated how much variance in
ESG activity scores was uniquely predictable from ROE was less than .01, indicating that ROE accounts for less than .10% of
the variance in ESG activity when controlling for total revenue and leverage are controlled.
Leverage. There is no statistically significant relationship between leverage and corporate social responsibility. The negative
slope for leverage (-.01) as a predictor variable of ESG activity scores indicated that there was about a .01 decrease in ESG
activity scores for each 1-point increase in leverage. The squared semipartial coefficient (sr2) that was an estimate of how much
variance in ESG activity scores was uniquely predictable from leverage was less than .01, indicating that leverage accounts for
less than .1% of the variance in ESG activity scores when controlling for ROE and total revenue.
The following conclusions pertain to the results of the null and alternative hypotheses. First, financial performance measured by
ROE does not have a significant relationship with corporate social responsibility measured by ESG activity scores and does not
support the stakeholder theory. Second, firm size measured by total revenue has a significant statistical negative relationship
with corporate social responsibility, measured by ESG activity scores. Third, leverage does not have a significant relationship
with corporate social responsibility, measured by ESG activity scores.
VI. CONCLUSION
The findings in this study have two vital implications. First, in spite of the findings of this study, business leaders should
continue to integrate corporate social programs as long as business leaders justify that investing in these programs could yield
positive results to various stakeholders of the company. Secondly, corporate social responsibility should not be the sole
responsibility of business leaders. Government institutions should continue to have active roles in promoting CSR initiatives as
long as they find these CSR initiatives relevant to promoting the wellbeing of the society. Beyond the debate on the relationship
between financial performance and corporate social responsibility, researchers need to understand how corporate social program
modify the behavior of stakeholders including business leaders, investors, suppliers, customers, employees and the community.
Business leaders need to understand that socially responsible investment is efficient and sufficient to achieve the objective of
greater ethical and social responsibility in an organization.
International Journal of Computer Applications Technology and Research
Volume 7–Issue 02, 78-85, 2018, ISSN:-2319–8656
www.ijcat.com 84
REFERENCES
[1] Amma, K. S., Thaliyan, D., & Lekshmi, J. (2013). A study on the common imperatives organization require for creating productive employees: Creating
a perspective to the expression of authentic self as a new challenge to the global business management International Journal of Global Business,
6(2),
90-110. Retrieved from http://www/gsmi-ijgb.com/ [2] Baker, M. (2004). CSR: What does it mean? Retrieved from http://www.mallenbaker.net
[3] Basera, H. C. (2013). Internal CSR: A key tool for competitiveness in the retail small to medium enterprise sector in Masvingo, Zimbabwe. International Journal of Management Science and Business Research, 2(10), 72-80. Retrieved from http://www.ijmsbr.com
[4] Bidhari, S. C., Salim, U., & Aisjah, S. (2013). Effect of CSR information disclosure on financial performance and firm value in banking industry listed at
Indonesia stock exchange. European Journal of Business and Management, 5(18), 39-46. Retrieved from http://www.iiste.org [5] Bryman, A., & Bell, E. (2015). Business research methods. Oxford, UK: University Press.
[6] Chandler, D. B., & Werther, W. B. (2013). Strategic CSR: Stakeholders, globalization, and sustainable value creation. Thousand Oaks, CA: Sage
Publications [7] Deng, X., Kang, J. K., & Low, B. S. (2013). CSR and stakeholder value maximization: Evidence from mergers. Journal of Financial Economics, 110(1),
87-109. doi:10.1016/j. jfineco.2013.04.014
[8] Eesley, C. E., DeCelles, K., & Lenox, M. (2015). Through the mud or in the boardroom: Activist types and their coercive strategies in targeting firms for social change. Social Science Research Network, 1(1), 1-28. doi:10.2139/ssrn.2574046
[9] Elliot, W. B., Jackson, K. E., & Peecher, M. E. (2014). The unintended effect of CSR performance on investors’ estimates of fundamental value. The
Accounting Review, 89, 275-302. doi:10.2308/accr-50577 [10] Filatotchev, I., & Nakajima, C. (2014). Corporate governance, responsible managerial behavior, and CSR: Organizational efficiency versus
organizational
legitimacy? Academy of Management Perspectives, 28, 289-306. doi:10.5465/amp.2014.0014 [11] Flammer, C. (2013). Corporate social responsibility and shareholder reaction: The environmental awareness of investors. Academy of Management
Journal,
56, 758-781. doi:10.5465/amj.2011.0744 [12] Freeman, R. E. (1984). Strategic management: A stakeholder approach. New York, NY: Cambridge University Press.
[13] George, G., Dahlander, L., Graffin, S., & Sim, S. (2016). Reputation and status: Expanding the role of social evaluation in management research.
Academy of Management Journal, 59, 1-13. doi:10.5465/amj.2016.4001
[14] Girerd-Potin, I., Jimenez-Garces, S., & Louvet, P. (2012). Which dimensions of social responsibility concern financial investors? Journal of Business
Ethics, 121, 559-576. doi:10.1007/s10551-013-1731-1 [15] Ioannou, I., & Serafeim, G. (2015). The impact of CSR on investment recommendations: Analysts' perceptions and shifting institutional logics. Strategic
Management Journal, 36, 1053-1081. doi:10.1002/smj.2268
[16] Javaid L. E., Ali, A., & Khan, I. (2016). Corporate governance and CSR disclosure: evidence from Pakistan. The International Journal of Business in Society, 16, 785-797. doi:10.1108/CG-05-2016-0100
[17] Jo, H., & Harjoto, M. A. (2011). Corporate governance and firm value: The impact of corporate social responsibility. Journal of Business Ethics, 103,
351- 383. doi:10.1007/s10551-011-0869-y
[18] John, A. G. (2014). Market orientation, organizational learning capabilities and strategic competitiveness: An inquiry into the causes of sustaining
competitive success. International Business Research, 7, 179-186. doi:10.5539/ibrv7n10p179 [19] Jones C., L., Mackey, A., & Whetten, D. (2014). Taking responsibility for CSR: The role of leaders in creating, implementing, sustaining, or avoiding
socially responsible firm behaviors. Academy of Management Perspectives, 28(2), 164-178. doi:10.5465/amp.2012.0047
[20] Kirat, M. (2015). CSR in the oil and gas industry in Qatar perceptions and practices. Public Relations Review, 41, 438-446. doi:10.1016/j. pubrev.2015.07.001
[21] Kirkland, S. (2015). Helping S corporations avoid unreasonable compensation audits.
[22] Koschate-Fischer, N., Stefan, I., & Hoyer, W. (2012). Willingness to pay for cause- related marketing: The donation amount and moderating effects.
Journal of Marketing Research, 49, 910-927. doi:10.1509/jmr.10.0511
[23] Lindgreen, A., Xu, Y., Maon, F., & Wilcock, J. (2012). Corporate social responsibility brand leadership: A multiple case study. European Journal of
Marketing, 46, 965-993. doi.10.1108/03090561211230142 [24] Luu, T. T. (2013). Corporate social responsibility, leadership, and brand equity in healthcare service. Social Responsibility Journal, 8, 347-362.
doi:10.1108/17471111211247929
[25] Lu, W., Chau, K. W., Wang, H., & Pan, W. (2014). A decade's debate on the nexus between corporate social and corporate financial performance: A critical
review of empirical studies 2002–2011. Journal of Cleaner Production, 79, 195-206. doi:10.1016/j. jclepro.2014.04.072
[26] Mair, J., & Hehenberger, L. (2014). Front-stage and backstage convening: The transition from opposition to mutualistic coexistence in organizational philanthropy. Academy of Management Journal, 57, 1174-1200. doi:10.5465/amj.2012.0305
[27] Malenko, N., & Shen, Y. (2016). The role of proxy advisory firms: Evidence from a regression-discontinuity design. Oxford, England: Oxford University Press. doi:10.1093/rfs/hhw070
[28] Maskun, A. (2013). Leverage level, company size, profitability toward the disclosure of CSR of LQ-45 companies in Indonesia stock exchange.
International Journal of Academic Research, 5,140-144. doi:10.7813/2075- 4124.2013/5-2/B.21 [29] Mohamad, R., & Ismail, N. A. (2013). The extent of E-business usage and perceived cumulative benefits: A survey on small and medium-sized
enterprises.
Information Management and Business Review, 5, 13-19. Retrieved from http://www.ifrnd.org
[30] Nagurney, A., & Li, D. (2014). A dynamic network oligopoly model with transportation costs, product differentiation, and quality competition.

International Journal of Computer Applications Technology and Research
Volume 7–Issue 02, 78-85, 2018, ISSN:-2319–8656
www.ijcat.com 85
Computational Economics, 44, 201-229. doi:10.1007/s10614-013-9387-6
[31] Ofori, D. F., Nyuur, R. B., & Darko, M. D. (2014). CSR and financial performance: Fact or fiction? A look at Ghanaian Banks. Acta Commercii, 4(1), 1- 11. doi:10.4102/ac. v14i1.18
[32] Orlitzky, M. (2001). Does firm size confound the relationship between corporate social performance and firm financial performance? Journal of Business
Ethics, 33, 167-180. doi:10.1023/A:1017516826427 [33] Orlitzky, M., & Benjamin, J. D. (2001). Corporate social performance and firm risk: Ameta-analytic review. Business and Society, 40, 369-396.
doi:10.1177/000765030104000402
[34] Ozçelik, F., Avci Oztürk, B., & Gürsakal, S. (2014). Investigating the relationship between CSR and financial performance in Turkey. Ataturk University Journal of Economics and Administrative Sciences, 28, 189-203. Retrieved from http://www.e-dergi.atauni.edu.tr
[35] Sahota, A. (2013). CSR and philanthropy. Sustainability: How the cosmetics industry is greening up. Chichester, United Kingdom: John Wiley & Sons
Ltd. [36] Schmeltz, L. (2014). Identical or just compatible? The utility of corporate identity values in communicating CSR. Journal of Business Communication,
51,234-258. doi:10.1177/2329488414525439
[37] Serrano-Cinca, C., Gutiérrez-Nieto, B., & López-Palacios, L. (2015). Determinants of Default in P2P Lending. PLoS ONE, 10(10), 1-22. doi:10.1371/journal. pone.0139427
[38] Shalit, S. S., & Sankar, U. (1977). The measurement of firm size. Review of Economics and Statistics, 59, 290-298. Retrieved from http://www.jstor.org
[39] Solomon, R. C., & Hanson, K. R. (1985). It's good business. New York, NY: Atheneum.
[40] Sun, X., Shen, H., Cheng, X., & Zhang, Y. (2016). Market confidence predicts stock price: Beyond supply and demand. PLoS ONE, 11 (7), 1-10.
doi:10.1371/journal.pone.0158742
[41] Tilcsik, A., & Marquis, C. (2013). Punctuated generosity: How mega-events and natural disasters affect corporate philanthropy in U.S. communities. Administrative Science Quarterly, 58, 111-148. Retrieved from http://www.hdl.handle.net
[42] Tilt, C. (2016). Corporate social responsibility research: The importance of context. International Journal of Corporate Social Responsibility, 1, 2-7.
doi:10.1186/s40991-016-0003-7 [43] Tribó, J. A., Torres, A., Bijmolt, T. H., & Verhoef, P. (2013). Generating global brand equity through corporate social responsibility to key stakeholders.
International Journal of Research in Marketing, 29, 13-24. doi:101016/j.ijresmar.2011.10.002
[44] Udayasankar, K. (2008). CSR and firm size. Journal of Business Ethics, 83(2), 167-175. doi:10.1007/s10551-007-9609-8 [45] Van Limburg, M., Wentzel, J., Sanderman, R., &Van Gemert-Pijnen, L. (2015). Business modeling to implement an eHealth portal for infection control:
A reflection on co-creation with stakeholders. JMIR Research Protocols, 4(3), 104-119. doi:10.2196/resprot.4519
[46] Wang, H., Tong, L., Takeuchi, R., & George, G. (2016). CSR: An overview and new research directions. Academy of Management Journal, 59, 534-544. doi:10.5465/amj.2016.5001
[47] Yusoff, H., Dalila A., Jamal, A., & Darus, F. (2016). Corporate governance and corporate social responsibility disclosures: An emphasis on the CSR key
dimensions. Journal of Accounting and Auditing, 2016, 476-550. doi:10.5171/2016.476550 [48] Zou, B., Guo, F., & Guo, J. (2016). Absorptive capacity, technological innovation, and product life cycle: A system dynamics model. SpringerPlus, 5,
1662-1675. doi:10.1186/s40064-016-3328-5

International Journal of Computer Applications Technology and Research
Volume 7–Issue 02, 86-93, 2018, ISSN:-2319–8656
www.ijcat.com 86
Efficient Resource Utilization in Information Security Risk Management Investment
Mitende Nicholus Nyapete
School of Informatics and
Innovative Systems
Jaramogi Oginga Odinga
University of Science and
Technology
Bondo Town, Kenya
Prof. Anthony Rodrigues
School of Informatics and
Innovative Systems
Jaramogi Oginga Odinga
University of Science and
Technology
Bondo Town, Kenya
Dr. Samuel Liyala
School of Informatics and
Innovative Systems
Jaramogi Oginga Odinga
University of Science and
Technology
Bondo Town, Kenya
Abstract: Efficient Resource Utilization in Information Security Risk Management Investment can improve organization resiliency
to information security threats through identifying key information assets and security risks so that information security
expenditures can be directed cost effectively. The purpose of this study is to determine if framing and evaluation components of
prospect theory informs information security investment decisions. An empirical study was conducted on six microfinance
enterprises using Cochran’s correctional formula. Mediation Regression Analysis (MRA) was used to determine the impact of
organization and human factors on efficient information security risk management investment. The study established that Rational
Choice Decision Models (RCDM) in the context of information security investment needs to be supplemented with risk perception
measurement and account for individual level decision biases.
Key: Information Security Risk Management Investment, Rational Choice Decision Models, Information security, Prospect
Theory, Information Security, Efficient
1.0 Introduction: Poor Information Technology (IT) investments results to
major Information Security (IS) breaches, which translate to
both financial and non-financial loss. [15], point out that in
2014 globally business incurred $23 trillion loss due to
Information Security (breaches). To protect against IS losses
business enterprises are investing in proactive measures,
through adoption of standard Information Security Risk
Management (ISRM) approach. Although the standard
ISRM approach provide formal methods for identification
and analysis of IS risks, and provide an assessment of
potential impacts of IS risk on the business. The standard
ISRM approach does not take into consideration the
influence of organization factors and decision maker
perception on ISRM investment process.
(ISRM) is the process of recognizing IT related threats,
determining their consequences on the organization
resources, and applying modifying factors in a cost-effective
manner to keep adverse consequences within boundary [22].
[31] Explain that effective ISRM program should have a
comprehensive view of IS as through applying appropriate
policy, training, technology to enhance the integrity of
information, accountability and compliance with existing
legal frameworks. It should manage organization risk
posture proactively, and assist management to identify,
manage and optimize risk [1]. [9], point out that effective
ISRM help business in refreshing IT risk inventory and assist
in the creation of strategies to mitigate and define risk
tolerance.
2.0 Information Security Risk
Management Investment (ISRM
investment) The negative impacts of IS breaches is an issue of major
concern. [27] Argue that for organization to derive value
from ISRM Investment, they should implement well defined
security procedures that protect the right assets. Researchers
such as [7] considers returns on ISRM investment as a
critical determinant of efficient ISRM, [19] concurs by
pointing out that ability of an enterprise to mitigate IT risks
depend on how they effectively invest on ISRM processes.
Therefore for effective ISRM the management should
perform thorough evaluation of investment options.
Management should not view ISRM investment as technical
problem but, as part of business and risk management
strategies [26].
3.0 Organization factors influencing
Information Security Risk Management. Organization factors influencing information security risk
management include:
3.1 Organization Culture Organization Culture refers to a set of shared values, beliefs,
assumptions, and practices that shapes and direct members
attitudes and behaviors in the organization. [31] Observe that
organization culture is a key influencer of ISRM investment.
They argue that it is extremely challenging to realize quality
ISRM if management and staffs does not support and believe
in ISRM investment as priority. [10] Establish that
organization culture influences the quality of knowledge and
training on ISRM among organization staffs. [3] Concur by

International Journal of Computer Applications Technology and Research
Volume 7–Issue 02, 86-93, 2018, ISSN:-2319–8656
www.ijcat.com 87
opining that despite best standard ISRM approach and
guidelines, without well supportive organization culture,
efficient ISRM investment cannot be realized. Since poor
organization cultures do result to deficient security policy
and safe guard’s implementation [32]. For organization to
realize efficient ISRM investment there is need for positive
organization culture that support and prioritize ISRM.
3.2 Alignment to Business Strategy The alignment of ISRM to business strategy is a critical
element of efficient ISRM investment. [2]. [19], point out
that for achievement of business strategic goal, ISRM should
be in tandem with strategic goal. [17] Argue that ISRM
investment can only improve enterprise performance and
image only if it matches business processes and also
supported by business structures and processes. They
established that despite significance investment, most
organization have not been able to realize full benefits of
ISRM investment due to their own inability to effectively
align ISRM to business strategy [6].
3.3 Investment Valuation and Trade-off ISRM investment constitutes larger portion of organization
expenses, therefore managers should have quality
knowledge on ISRM investment valuation and trade-off
[21]. [5], point out that valuation and trade-off of ISRM
investment is challenging as it is characterized by long
payback period, uncertainty, and constantly changing
business environment. They established that the widely used
RCDM are not suited for ISRM investment since it does not
account for the flexibility inherent in most ISRM investment
decisions. [28] Observe that defining criterion for evaluation
and trade-off of ISRM investment is a nightmare to
managers. [29], pointed out that returns on ISRM investment
cannot be measured quantitatively and therefore should not
be considered in the same footing as other investments. [31],
argue that the availability of wide spectrum of ISRM
approaches and absence of quality ISRM investment
decision making methods makes it absolute difficult for
managers to perform effective valuation and trade-off in the
context of ISRM.
3.4. Stakeholder Participation Success in ISRM investment is dependent on collective
effort of both internal and external stakeholders [25]
.Therefore for efficiency in ISRM investment; there is need
for ISRM investment plan that is developed with
participation of all stakeholders [31]. But in contrary, [32],
established that most organization management do not
involve key stakeholders in ISRM investment decisions, but,
instead keep secret losses that emanates from IS breaches
3.4 IT Asset Inventory IT asset inventory is a set of business processes designed to
manage the lifecycle and inventory of technology assets. It
provides value to organizations by lowering IT costs,
reducing IT risk and improving productivity through proper
and predefined asset management. IT asset inventory
increases understanding of whom, in the organization needs
which IT assets in order to fulfill their assigned roles. A fully
functional and well documented IT asset inventory assist
business enterprise to identify and map critical assets to risks
they are exposed. Lack of well defined asset inventory
hinders efficient ISRM investment.
3.5 Risk Inventories Comprehensive risk inventory provide valuable information
that assist in enhancing the risk management processes
through: enabling the organization to identify gaps in its
current risk management processes. As new risks are
identified in the risk assessment process, the knowledge
gained from a comprehensive inventory help the
organization to assess the connections between existing risk
management processes and the most critical enterprise level
risks so that management can determine if there are any gaps
in their risk management process. [19] Point out that risk
inventory creates value through assisting organization in
mapping risks to underlying objectives.
4.0 Approaches to Information Security
Risk Management Investment (ISRM
investment) 4.1 The Optimum Information Security Risk
Management Investment Approach Experts of optimum ISRM investment methods have
proposed various strategies to determine the optimum
resources for ISRM investment activities. [18], proposed
two frameworks; in the first framework they considered the
firm’s objective to be reduction of losses due felonious. In
the second framework they considered firms reputation as
the key driver for ISRM investment. [11], developed model
which considers the ISRM implementer to be risk impartial
when making ISRM investment decision. They pointed out
that the expenses incurred in securing organization assets
should not exceed 37% of the expected loss emanating from
the occurrence of the security breach. Huang’s model
Optimum ISRM investments with assumption that the
decision makers are risk averse [14]. The model offers core
managerial insight into ISRM investment decision. They
observe that for successful ISRM investment the
organization should carefully evaluate risks impact to
business.
[12], model determined the relationship between ISRM
investment and vulnerability. The model considers the
nature of return as a core determinant of ISRM investment.
[30], developed probability based model to determine the
chance of attacks and the amount of resources to be
committed in protecting the asset with the support of API
and OSI algorithm. [20] Criticized Gordon and Loeb model
for being based on a single decision variable. [24], argues
the weakness of Gordon and Loeb model of not taking into
consideration the dynamism prospects such as changing
value of money and proposed real option theory for the
achievement of Optimum ISRM investment. In their study,
[8], proposed a model based on game theory. Cavusoglu
game theory approach is based on the assertion that both the
organization and the attacker are well aware of the
vulnerabilities to be exploited. [8], model is more objective
when ISRM investment challenge integrates both targeted
and random attack. [4], proposed the use of differential game
model to analyze ISRM investment decision. [15], proposed
utility theoretic model to determine optimum ISRM

International Journal of Computer Applications Technology and Research
Volume 7–Issue 02, 86-93, 2018, ISSN:-2319–8656
www.ijcat.com 88
investment. Their investment model has irreversible fixed
costs which introduces rigidity into the ISRM investment
decision making process.
5.0 Prospect Theory To overcome the RCDM pervasive inconsistencies, [16],
developed prospect theory. The prospect is descriptive
theory that models real-life choices, rather than optimal
decisions. Prospect Theory argues that decision making
process involves two steps which are framing and
evaluation. Framing helps in the representation of acts,
outcomes, identifying framing effect and establishment of
reference point. The evaluation phase assists the decision
maker to assign value and prioritize various prospects.
Framing and evaluation are the key features of prospect
theory that distinguishes it from utility theory, and makes it
appropriate for efficient resources allocation under risk
environment.
In this study prospect theory was adopted to correctly guide
framing (presenting) of factors (both organization and
human) that influences ISRM investment decisions,
determining framing effects in ISRM investment decision
making process, create a reference point based on
organization wealth on which risk evaluation is determined
rather than the final outcomes.
6.0 Proposed Conceptual Model for
Efficient Information Security Risk
Management Investment: Efficient ISRM investment within business organization
can be realized through positive organization culture that
prioritize ISRM, by ensuring that management and staff
values and appreciate the role of ISRM, have right attitude,
knowledge, and has set adequate budget for ISRM
Investment [31]. Business strategy is core variable that
influences effective ISRM Investment. [17], pointed, that
despite significance investments in ISRM a considerable
number of firms have not been able to derive full benefits
due to their own inability to effectively deploy Information
Security Risk Management in their business strategies. For
efficient resource utilization, it is prudent for management
investment to ensure ISRM is aligned and supported by
business strategy. A well documented asset and risk
inventory promotes efficient resource utilization in ISRM
through correctly identifying organization assets and risks
within the organization environment, this assist management
to design contingency measures that meets enterprise
security objective. Also through asset and risk inventories
correct valuations and trade-off can be performed by
management.
Human Perception
ISRM Investment
Efficient Resource Utilization Model (Author, 2018)
7.0 Problem of the study Interest in Information Security Risk Management has
increased drastically [33]. But, few researchers have focused
their energy on the economic implication of Information
Security Risk Management. Most of the studies on the
economics of Information Security Risk Management
emphasize the use of Rational Choice Decision Model to
guide Information Security Risk Management Investment.
Although Rational Choice Decision Model provides
normative guidance concerning investment options, its
application in Information Security Risk Management
investment context results to two major problems which are:
Efficient
Resource
Utilization
in ISRM
Business
Strategy
IT asset
Inventory
Organization
Culture
Valuation
& trade-off
EVALUATION
-Value
Segmentation
-Weight function
segmentation
Risk Inventory
Stakeholder
Participation
FRAMING
-Acceptance
-Segregation
-Coding
-Combination
-Reference Point
Data
security
Manageme
nt of
information
Security
Network
security
Policy Information
Security
Organization
Factors
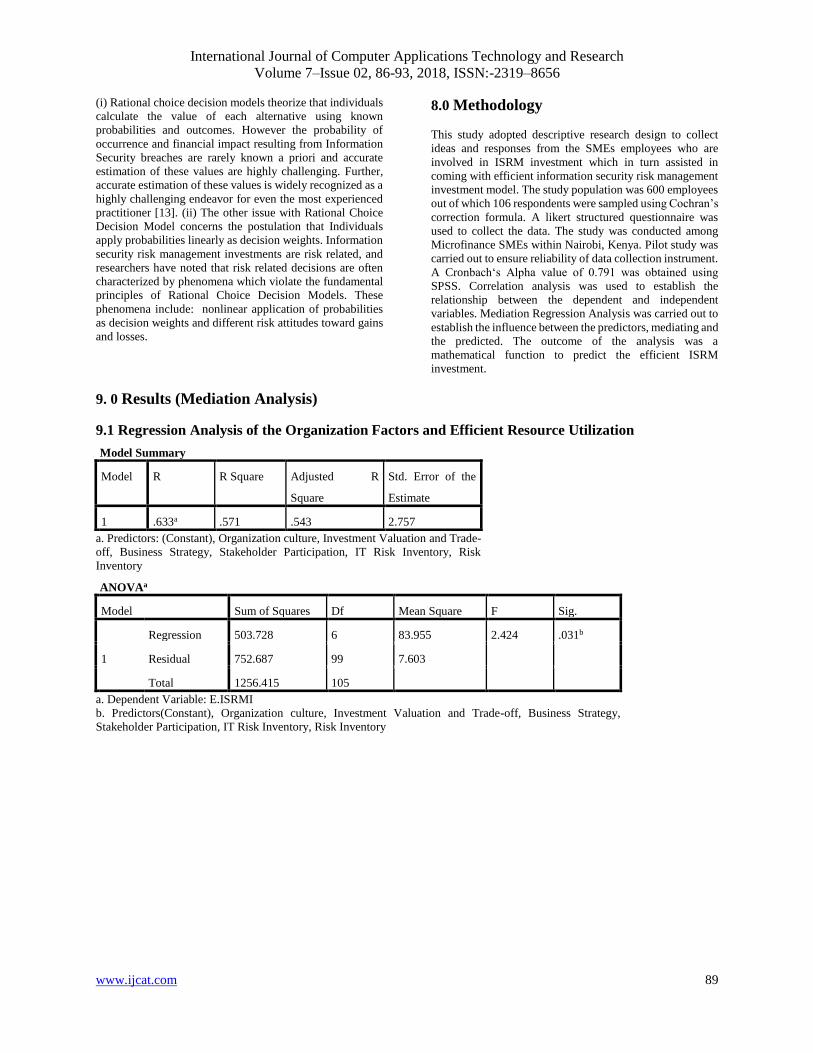
International Journal of Computer Applications Technology and Research
Volume 7–Issue 02, 86-93, 2018, ISSN:-2319–8656
www.ijcat.com 89
(i) Rational choice decision models theorize that individuals
calculate the value of each alternative using known
probabilities and outcomes. However the probability of
occurrence and financial impact resulting from Information
Security breaches are rarely known a priori and accurate
estimation of these values are highly challenging. Further,
accurate estimation of these values is widely recognized as a
highly challenging endeavor for even the most experienced
practitioner [13]. (ii) The other issue with Rational Choice
Decision Model concerns the postulation that Individuals
apply probabilities linearly as decision weights. Information
security risk management investments are risk related, and
researchers have noted that risk related decisions are often
characterized by phenomena which violate the fundamental
principles of Rational Choice Decision Models. These
phenomena include: nonlinear application of probabilities
as decision weights and different risk attitudes toward gains
and losses.
8.0 Methodology
This study adopted descriptive research design to collect
ideas and responses from the SMEs employees who are
involved in ISRM investment which in turn assisted in
coming with efficient information security risk management
investment model. The study population was 600 employees
out of which 106 respondents were sampled using Cochran’s
correction formula. A likert structured questionnaire was
used to collect the data. The study was conducted among
Microfinance SMEs within Nairobi, Kenya. Pilot study was
carried out to ensure reliability of data collection instrument.
A Cronbach‘s Alpha value of 0.791 was obtained using
SPSS. Correlation analysis was used to establish the
relationship between the dependent and independent
variables. Mediation Regression Analysis was carried out to
establish the influence between the predictors, mediating and
the predicted. The outcome of the analysis was a
mathematical function to predict the efficient ISRM
investment.
9. 0 Results (Mediation Analysis)
9.1 Regression Analysis of the Organization Factors and Efficient Resource Utilization
Model Summary
Model R R Square Adjusted R
Square
Std. Error of the
Estimate
1 .633a .571 .543 2.757
a. Predictors: (Constant), Organization culture, Investment Valuation and Trade-
off, Business Strategy, Stakeholder Participation, IT Risk Inventory, Risk
Inventory
ANOVAa
Model Sum of Squares Df Mean Square F Sig.
1
Regression 503.728 6 83.955 2.424 .031b
Residual 752.687 99 7.603
Total 1256.415 105
a. Dependent Variable: E.ISRMI
b. Predictors(Constant), Organization culture, Investment Valuation and Trade-off, Business Strategy,
Stakeholder Participation, IT Risk Inventory, Risk Inventory
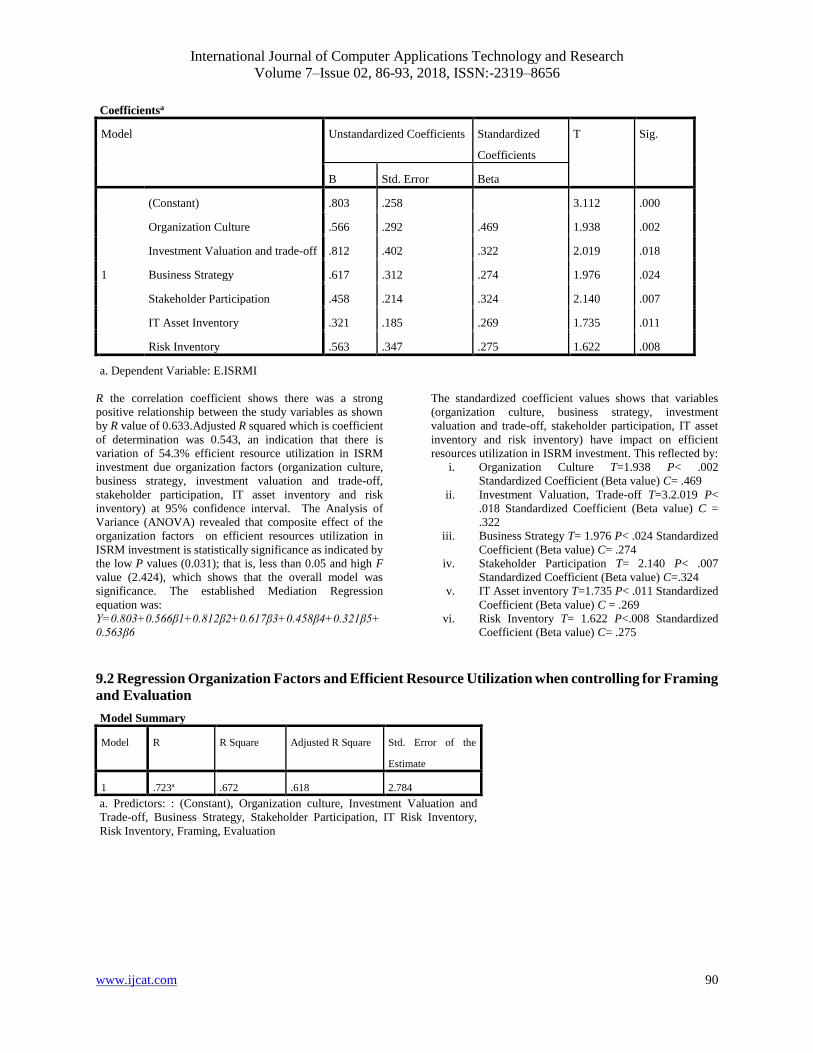
International Journal of Computer Applications Technology and Research
Volume 7–Issue 02, 86-93, 2018, ISSN:-2319–8656
www.ijcat.com 90
Coefficientsa
Model Unstandardized Coefficients Standardized
Coefficients
T Sig.
B Std. Error Beta
1
(Constant) .803 .258
3.112 .000
Organization Culture .566 .292 .469 1.938 .002
Investment Valuation and trade-off .812 .402 .322 2.019 .018
Business Strategy .617 .312 .274 1.976 .024
Stakeholder Participation .458 .214 .324 2.140 .007
IT Asset Inventory .321 .185 .269 1.735 .011
Risk Inventory .563 .347 .275 1.622 .008
a. Dependent Variable: E.ISRMI
R the correlation coefficient shows there was a strong
positive relationship between the study variables as shown
by R value of 0.633.Adjusted R squared which is coefficient
of determination was 0.543, an indication that there is
variation of 54.3% efficient resource utilization in ISRM
investment due organization factors (organization culture,
business strategy, investment valuation and trade-off,
stakeholder participation, IT asset inventory and risk
inventory) at 95% confidence interval. The Analysis of
Variance (ANOVA) revealed that composite effect of the
organization factors on efficient resources utilization in
ISRM investment is statistically significance as indicated by
the low P values (0.031); that is, less than 0.05 and high F
value (2.424), which shows that the overall model was
significance. The established Mediation Regression
equation was:
Y=0.803+0.566β1+0.812β2+0.617β3+0.458β4+0.321β5+
0.563β6
The standardized coefficient values shows that variables
(organization culture, business strategy, investment
valuation and trade-off, stakeholder participation, IT asset
inventory and risk inventory) have impact on efficient
resources utilization in ISRM investment. This reflected by:
i. Organization Culture T=1.938 P< .002
Standardized Coefficient (Beta value) C= .469
ii. Investment Valuation, Trade-off T=3.2.019 P<
.018 Standardized Coefficient (Beta value) C =
.322
iii. Business Strategy T= 1.976 P< .024 Standardized
Coefficient (Beta value) C= .274
iv. Stakeholder Participation T= 2.140 P< .007
Standardized Coefficient (Beta value) C=.324
v. IT Asset inventory T=1.735 P< .011 Standardized
Coefficient (Beta value) C = .269
vi. Risk Inventory T= 1.622 P<.008 Standardized
Coefficient (Beta value) C= .275
9.2 Regression Organization Factors and Efficient Resource Utilization when controlling for Framing
and Evaluation
Model Summary
Model R R Square Adjusted R Square Std. Error of the
Estimate
1 .723a .672 .618 2.784
a. Predictors: : (Constant), Organization culture, Investment Valuation and
Trade-off, Business Strategy, Stakeholder Participation, IT Risk Inventory,
Risk Inventory, Framing, Evaluation
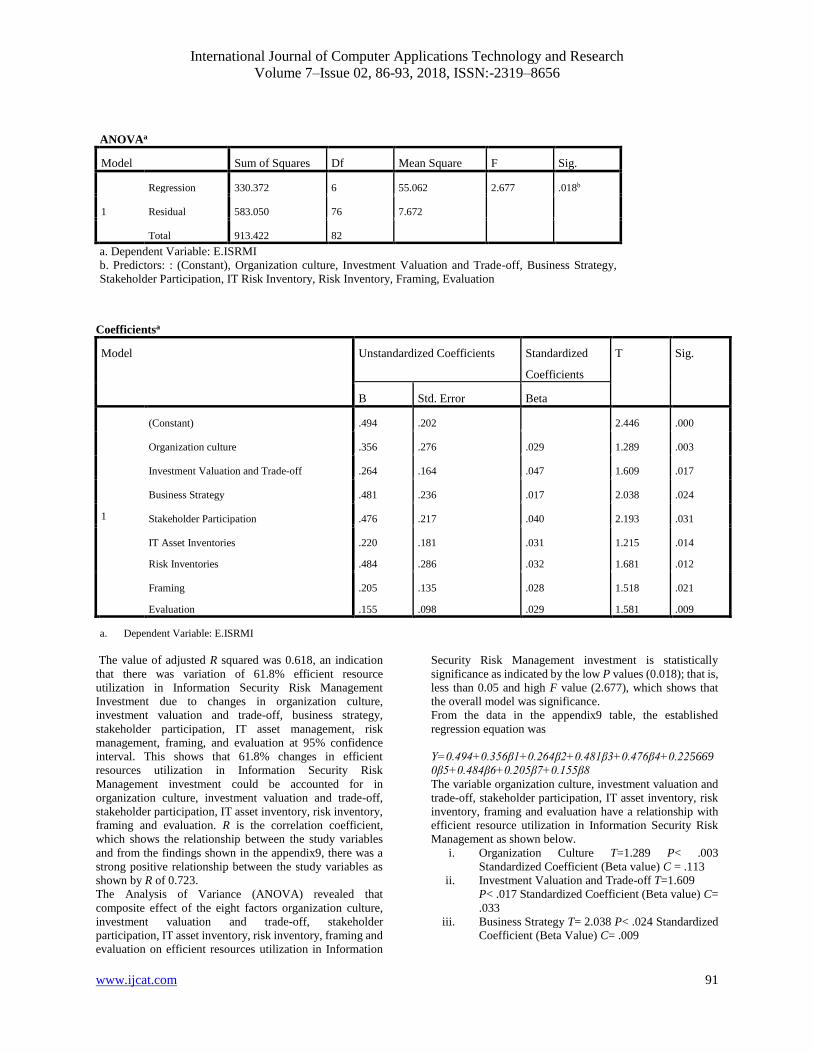
International Journal of Computer Applications Technology and Research
Volume 7–Issue 02, 86-93, 2018, ISSN:-2319–8656
www.ijcat.com 91
ANOVAa
Model Sum of Squares Df Mean Square F Sig.
1
Regression 330.372 6 55.062 2.677 .018b
Residual 583.050 76 7.672
Total 913.422 82
a. Dependent Variable: E.ISRMI
b. Predictors: : (Constant), Organization culture, Investment Valuation and Trade-off, Business Strategy,
Stakeholder Participation, IT Risk Inventory, Risk Inventory, Framing, Evaluation
Coefficientsa
Model Unstandardized Coefficients Standardized
Coefficients
T Sig.
B Std. Error Beta
1
(Constant) .494 .202
2.446 .000
Organization culture .356 .276 .029 1.289 .003
Investment Valuation and Trade-off .264 .164 .047 1.609 .017
Business Strategy .481 .236 .017 2.038 .024
Stakeholder Participation .476 .217 .040 2.193 .031
IT Asset Inventories
Risk Inventories
.220
.484
.181
.286
.031
.032
1.215
1.681
.014
.012
Framing
Evaluation
.205
.155
.135
.098
.028
.029
1.518
1.581
.021
.009
a. Dependent Variable: E.ISRMI
The value of adjusted R squared was 0.618, an indication
that there was variation of 61.8% efficient resource
utilization in Information Security Risk Management
Investment due to changes in organization culture,
investment valuation and trade-off, business strategy,
stakeholder participation, IT asset management, risk
management, framing, and evaluation at 95% confidence
interval. This shows that 61.8% changes in efficient
resources utilization in Information Security Risk
Management investment could be accounted for in
organization culture, investment valuation and trade-off,
stakeholder participation, IT asset inventory, risk inventory,
framing and evaluation. R is the correlation coefficient,
which shows the relationship between the study variables
and from the findings shown in the appendix9, there was a
strong positive relationship between the study variables as
shown by R of 0.723.
The Analysis of Variance (ANOVA) revealed that
composite effect of the eight factors organization culture,
investment valuation and trade-off, stakeholder
participation, IT asset inventory, risk inventory, framing and
evaluation on efficient resources utilization in Information
Security Risk Management investment is statistically
significance as indicated by the low P values (0.018); that is,
less than 0.05 and high F value (2.677), which shows that
the overall model was significance.
From the data in the appendix9 table, the established
regression equation was
Y=0.494+0.356β1+0.264β2+0.481β3+0.476β4+0.225669
0β5+0.484β6+0.205β7+0.155β8
The variable organization culture, investment valuation and
trade-off, stakeholder participation, IT asset inventory, risk
inventory, framing and evaluation have a relationship with
efficient resource utilization in Information Security Risk
Management as shown below.
i. Organization Culture T=1.289 P< .003
Standardized Coefficient (Beta value) C = .113
ii. Investment Valuation and Trade-off T=1.609
P< .017 Standardized Coefficient (Beta value) C=
.033
iii. Business Strategy T= 2.038 P< .024 Standardized
Coefficient (Beta Value) C= .009

International Journal of Computer Applications Technology and Research
Volume 7–Issue 02, 86-93, 2018, ISSN:-2319–8656
www.ijcat.com 92
iv. Stakeholder Participation T= 2.193 P< .031
Standardized Coefficient (Beta value) C=.094
v. IT Asset inventory T=1.215 P< .041Stadardized
Coefficient (Beta value) C= .116
vi. Risk Inventory T= 1.681 P<.012 Standardized
Coefficient (Beta value) C= .046
vii. Framing T=1.518 P<.021 Standardized
Coefficient (Beta value) C=.077
viii. Evaluation T= 1.581 P<.009 Standardize
Coefficient (Beta value) C = .214
At the introduction of mediation variable Prospect (framing
and evaluation), the standardized coefficient of the
regression equation reduces as below:
i. Organization Culture: Standardized Coefficient
(Beta value) C = .469 to C1= .029
ii. Investment Valuation and trade-off: Standardized
Coefficient (Beta value) C = .322 to C1= .047
iii. Business Strategy: Standardized Coefficient (Beta
Value) C= .274 to C1= .017
iv. Stakeholder Participation: Standardized
Coefficient (Beta value) C =.324 to C1= .040
v. IT Asset inventory: Standardized Coefficient
(Beta value) C = .269 to C1= .031
vi. Risk Inventory: Standardized Coefficient (Beta
value) C = .275 to C1= .032
vii. Framing: Standardized Coefficient (Beta) C=.077
to C1=.028
viii. Evaluation: Standardized Coefficient (Beta)
C=.214 to C1=.029
Y=0.618+0.029β1+0.047β2+0.017β3+0.040β4+0.031β5+0.
028β6+0.029 β7
The adjusted R square Coefficient shows a positive variation
from 54.6% to 61.8% at the introduction of human factors
(framing and evaluation)
The reduction in the values of standardized coefficients of
the independent variable shows that, Partial mediation exists
between the independent variable organization culture,
investment valuation, business tradeoff, risk and asset
inventories, stakeholder participation and dependent
variable ( efficient resources utilization in information
security risk management investment), when we control for
prospect (framing and evaluation). Also the positive
variation experienced in the value of Adjusted R square
proves that partial mediation exists between the component
of independent variables and dependent variables.
10. Recommendation The study recommends’ that for efficient ISRM investment
among business enterprises, there is need to implement
positive organization culture that is in congruent with
organization business strategy and supported by
organization structure. The organization staffs at various
levels of the organization from operation to senior
management level should be trained to support information
security risk management. This study recommendation are
in tandem with [31] who established that it is extremely
difficult to realize quality information security if
management does not support and believe in information
security risk management invest as a priority.
For efficient ISRM investment, the study recommends the
need to have well documented and up to date IT assets and
risks inventories as this will assist the SMEs organization to
identify critical assets and risks they are exposed and plan
for effective information security investments towards their
protection. [29] Concur with this recommendation by
pointing out that well documented asset and risk inventories
can assist the organization to identify the expertise it need,
help organization to map critical assets and risks they are
exposed.
Reference: [1] Al-Jaghoub, S., Al-Yaseen, H., & Al-Hourani, M.
(2010). Evaluation of Awareness and Acceptability of Using
e-. Government Services in Developing Countries: the Case
of Jordan. The Electronic Journal Information Systems
Evaluation, 13(1), 1–8.
[2] Ariyachandra, T. R., & Frolick, M. N. (2008). Critical
Success Factors in Business Performance Management—
Striving for Success. Information Systems Management,
25(2), 113–120.
[3] Baker, W., & Wallace, L. (2007). Is Information Security
Under Control?: Investigating Quality in Information
Security Management. IEEE Security and Privacy
Magazine, 5(1), 36–44.
https://doi.org/10.1109/MSP.2007.11
[4] Bandyopadhyay, T., Liu, D., Mookerjee, V. S., &
Wilhite, A. W. (2014). Dynamic competition in IT security:
A differential games approach. Information Systems
Frontiers, 16(4), 643–661.
[5] Bardhan, I. R., Bagchi, S., & Sougstad, R. (2004).
Prioritizing a portfolio of information technology
investment projects. Journal of Management Information
Systems, 21(2), 33–60.
[6] Bleistein, S. J., Cox, K., Verner, J., & Phalp, K. T.
(2006). B-SCP: A requirements analysis framework for
validating strategic alignment of organizational IT based on
strategycontext, and process. Information and Software
Technology, 48(9), 846–868.
[7] Brink, D. (2001). “A guide to determining return on
investment for e-security.” RSA Security Inc.
[8] Cavusoglu, H., Raghunathan, S., & Yue, W. T. (2008).
Decision-Theoretic and Game-Theoretic Approaches to IT
Security Investment. Journal of Management Information
Systems, 25(2), 281–304.
[9] Ciorciari, M., & Blattner, P. (2008). Enterprise risk
management maturity-level assessment tool (pp. 1–3).
Retrievedfromhttps://www.soa.org/...monographs/2008...sy
mposium/mono 2008-m-as08-1-ciorciari.
[10] Fenz, S., Ekelhar, A., & Neubaue, T. (2011).
Information Security Risk Management: In which Security
Solutions is it worth Investing? Communications of the
Association for Information Systems :, 28(1), 329–356.
[11] Gordon, L. A., & Loeb, M. P. (2002). The economics
of information security investment. ACM Transactions on
Information and System Security, 5(4), 438–457.
https://doi.org/10.1145/581271.581274
[12] Hausken, K. (2007). Returns to information security
investment: The effect of alternative information security
breach functions on optimal investment and sensitivity to
vulnerability. Information Systems Frontiers, 8(5), 338–349.
https://doi.org/10.1007/s10796-006-9011-6
International Journal of Computer Applications Technology and Research
Volume 7–Issue 02, 86-93, 2018, ISSN:-2319–8656
www.ijcat.com 93
[13] Home land security. (2009). A roadmap for cyber
security research (pp. 1–126). Washington: INFOSEC
Research Council (IRC).
[14] Huang, C. D., Hu, Q., & Behara, R. S. (2008). An
economic analysis of the optimal information security
investment in the case of a risk-averse firm. International
Journal of Production Economics, 2(114), 793–804.
[15] Ioannidis, C., Pym, D., & Williams, J. (2013). Fixed
Costs, Investment Rigidities, and Risk Aversion in
Information Security: A Utility-theoretic Approach. In B.
Schneier (Ed.), Economics of Information Security and
Privacy III (pp. 171–191). New York, NY: Springer
New York.
[16] Kahneman, D., & Tversky, A. (1979). The simulation
heuristic. In D. Kahneman, P. Slovic, & A. Tversky
(Eds.), Judgment under uncertainty: Heuristics and biases
(pp. 201-208). New York: Cambridge University Press.
[17] Karim, J., Somers, T., & Bhattacherjee, A. (2007). The
impact of ERP implementation on business process
outcomes: a factor-based study. Journal of Management
Information Systems, 24(1), 101–134.
https://doi.org/10.2753/MIS0742-1222240103
[18] Kort, P. M., Haunschmied, J. L., & Feichtinger, G.
(1999). Optimal firm investment in security. Annals of
Operations Research, 88(0), 81–98.
[19] Magnusson, C., Molvidsson, J., & Zetterqvist, S.
(2007). Value creation and return on security investments
(ROSI). In New Approaches for Security, Privacy and Trust
in Complex Environments (pp. 25–35). Springer, Boston.
[20] Matsuura, K. (2003). Information security and
economics in computer networks: an interdisciplinary
survey and a proposal of integrated optimization of
investment. Computing in Economics and Finance (48), 1-
13.
[21] Mithas, S., Tafti, A., Bardan, I., & Goh, J. M. (2012).
Information Technology and Firm Profitability:
Mechanisms and Empirical Evidence. MIS Quarterly, 36(1),
205-224.
[22] Nazımoğlu, Ö., & Özsen, Y. (2010). Analysis of risk
dynamics in information technology service delivery.
Journal of Enterprise Information Management, 23(3), 350–
364.
[23] Price water Coopers.(2015). 2014 annual report of Price
Water Coopers. Retrieved from
https://www.pwc.com/gx/en/about-pwc/global-annual-
review-2015/campaign-site/pwc-global-annual-review-
2015.pdf
[24] Tatsumi K., Goto M. (2009) Optimal Timing of
Information Security Investment: A Real Options Approach.
In: Moore T., Pym D., Ioannidis C. (eds) Economics of
Information Security and Privacy (pp 211 – 228). Boston:
Springer
[25] Trkman, P. (2010). “The critical success factors of
business process management. International Journal of
Information Management, 30 (2010), 125-134.
[26] Tsiakis, T., Kargidis, T., & Katsaros, P. (Eds.). (2014).
Approaches and processes for managing the economics of
information systems. Hershey, Pa: Business Science
Reference.
[27] Tsiakis, T., & Stephanides, G. (2005). The economic
approach of information security. Computers & Security,
24(2), 105–108. https://doi.org/10.1016/j.cose.2005.02.001
[28] Tsiakis, T., & Pekos, G. (Eds.). (2008). Analyzing and
determining return on investment for information security:
proceedings of the 2006 International Conference on
Applied Economics (ICOAE). Cham: Springer.
[29] Tsiakis, T. K., & Pekos, G. D. (2008). Analysing and
determining Return on Investment for Information Security.
In International Conference on Applied Economics – ICOAE
2008 (pp. 879–883). Thessaloniki: University of
Macedonia.
[30] Wang, J., Chaudhury, A., and Rao, H.R. (2008). "A
Value-At-Risk Approach to Information Security
Investment," Information Systems Research 19(1), 106-120.
[31] Whitman, M. E., & Mattord, H. J. (2013). Management
of information security (Fourth edition). Stamford: Cengage
Learning.
[32]Wood, C. C., & Parker, D. B. (2008). “Why ROI and
similar financial tools are not advisable for evaluating the
merits of security projects.” Computer Fraud & Security,
2004(5), 8–10.
[33] Zafar, H., & Clark, J. G. (2009). Current stateof
information security research in IS. Communications of the
Association for Information Systems, 24, 571–596.
International Journal of Computer Applications Technology and Research
Volume 7–Issue 02, 94-98, 2018, ISSN:-2319–8656
www.ijcat.com 94
Perspectives of Nigerian Youths on the Usage of Social Media and Their Academic Performance
OLANREWAJU, B.S.
Dept. of computer Science
Wellspring University
Benin City, Edo State, Nigeria
OLAYINKA, T.C.
Dept. of computer Science
Wellspring University
Benin City, Edo State, Nigeria
Abstract: Numerous efforts have been made to understand the impact and particularly the use of social media in education. However,
how do the youths see the benefits of using social media for improved academic performance? This research is spurred by the aim to
know if students think social media could be used to enhance their academic performance. The study assessed the use of social media
among young students by exploring their views about the academic benefits that could be derived from its usage with the objectives of
knowing if there is a link between social media usage and academic performance, which social medium platform has greater impact on
the youths, which gender use social media the more and if it translate to good academic performance among the gender and thereby
make recommendations on how to use social media to enhance their academic performance. This study is based on completed
questionnaire survey of students and the method of data analysis adopted is chi square. The study is conducted in Benin City, Edo state,
Nigeria. The result of this research shows that there is a link between social media and academic performance of youths. In the survey,
91% of the students use social media out of which 65.9% appreciate the impact of the social media on their academic achievements. The
study also reveals that Facebook has the highest usage among the students. The research also concluded that the higher usage of social
media by female does not translate to higher academic achievement. This makes gender usage of social media insignificant in academic
achievement of youth. One of the recommendations of this study is that Students should be encouraged to create study groups or forum
on social media to facilitate the exchange of information relating to their class work.
Keywords: social media; education; Nigerian youths; students; academic performance.
1. INTRODUCTION Social media which includes social networking sites and blogs
where people can easily connect with each other plays a vital
role in transforming people’s life style [1]. Fundamentally,
social networks sites are a category of community sites that
have profiles, friends, and comments [2]. For youth, using
social media sites can help promote creativity, interaction,
learning and solution to assignments and class works and also
to interact with other classmates [3]. Social media Web sites
usage is among the most common activity of today's youth [4].
Any Web site that allows social interaction is considered a
social media site. Examples include Facebook, MySpace, 2go,
Twitter, etc.
Youth are among the most prolific users of social media.
Studies have shown that youth spend a considerable portion of
their daily life interacting through social media. Academic
activities can also benefit from the opportunities provided by
social networking sites (SNSs) for secondary and higher
education. Despite the fact that there are potential benefits or
harmful effects of using SNSs, educators are seeking a new and
innovative way to try to engage students and improve student
achievement. Numerous efforts have been made particularly to
understand the use of social media in education and how it can elevate the quality of learning in higher learning institutions.
The primary goals of this study were to describe why and how
students use social media. The study aims to assess the use of
social media among young students with the objectives of
exploring the views of young students about the purpose and
academic benefits that could be derived from its usage. Another
objective of the study is to make recommendations on how
social media could be put into positive use to improve the
academic lives of youth.
More specifically, the study sought to do the following:
i. Identify social networking sites that could foster the
improvement of educational practices and student
learning.
ii. Clarify how social networking sites directly and
indirectly influence the academic lives of youths.
iii. Describe the ways in which social networking sites
help youths to acquire the will and skill required to
improve student learning.
Based on the purpose of this study, the following hypotheses
were made:
H1. Social media is not significantly affecting educational
achievements of students.
H2. Facebook social medium affect students achievements than
any other media.
H3. Gender effect is not significantly strong in discussing
effects of social media on academic achievements of students.
Social media use has increased in recent years across all age
levels. Social media has also been implemented in academic
settings to motivate students to participate, share, and learn
with other collaborators. The fact that social media is now very
popular among youth makes it a vital method of improving the
academic lives of youth, thus the importance of the study.
2. LITERATURE REVIEW The prevalence of social media in the lives of young people has
brought interest and concern about its impact on their
education, skill development and learning in general.
One of the many questions concerning social media is that what
kinds of effects these technologies have on youth development.

International Journal of Computer Applications Technology and Research
Volume 7–Issue 02, 94-98, 2018, ISSN:-2319–8656
www.ijcat.com 95
Social media is the social interaction among people in which
they create, share or exchange information and ideas in virtual
communities and networks and it depends on mobile and web-
based technologies to create highly interactive platforms
through which individuals and communities share, co-create,
discuss, and modify user-generated content [5].
Social media technologies take on many different forms
including magazines, Internet forums, weblogs, social blogs,
micro blogging, wikis, social networks, podcasts, photographs
or pictures, video, rating and social bookmarking. The article
by [6] defines social media as a group of new online media
which have most or all of the following characteristics:
i. Participation: Social media promotes contribution
and feedback from users who are interested in
participating; therefore it blurs the line between
media and the audience.
ii. Openness: Social media is accessible to people, it
does not have any sort of barriers that prohibit access
to users
iii. Conversation: Two-way communication is what
makes social media stand out from the traditional
media
iv. Community: Social media provides people with a
platform to share common interests which promote
sense of community amongst the users
v. Connectedness: Links to various sites, people,
networks etc promote social media’s ability to
connect it’s users to various areas of interest.
According to a study in America by [7], almost all sampled
youth have used social media. Nine out of ten (90%) 13- to 17-
year-olds have used some form of social media. Three out of
four (75%) teenagers currently have a profile on a social
networking site, and one in five (22%) has a current Twitter
account (27% have ever used Twitter). Facebook utterly
dominates social networking use among teens: 68% of all teens
say Facebook is their main social networking site, compared to
6% for Twitter, 1% for Google Plus, and 1% for MySpace (25%
don’t have a social networking site).For the vast majority of
teens, social and other digital communications media are a
daily part of life. Two-thirds (68%) of teens text every day, half
(51%) visit social networking sites daily, and 11% send or
receive tweets at least once every day. In fact, more than a third
(34%) of teens visits their main social networking site several
times a day. One in four (23%) teens is a “heavy” social media
user, meaning they use at least two different types of social media each and every day.
In his article, A to Z of social media for academia, [8] provides
an overview of how to use social media in a way that enriches
academic working life. However, the extent at which youth has
used this technology for academic development is a question to
be studied.
A research by [9] received much media attention with findings
that college Facebook users have lower GPAs than students
who are not users of the site. [9] offers several hypotheses for
these findings. For example, perhaps Facebook users spend too
much time online and less time studying. [10] note several clear
limitations of the study in [9]. First, the sample of students is
clearly limited. From this analysis, the researchers, find that
Facebook usage has no significant relationship to GPA in any
of their data sets. The researchers in this debate suggest that the
Facebook-GPA relationship is an interesting avenue for future
studies. However, aside from the fact that many youth use
Facebook, there appear to be no substantive theoretical reasons
why Facebook use might influence GPA. As noted earlier,
adolescents use the Internet for diverse communication and
social goals. If perhaps a large percentage of youth interactions
on Facebook were school or academic related, one might find a
relationship to measures such as GPA. However, measurement
of these communication patterns is lacking in the current
literature and is a critical area for additional studies. The work
of new media literacy researchers provides one avenue to better
specify behaviors that might lead to learning. Most studies of
social media and youth education define learning from a
literacy perspective [11, 12].
Many schools have started to use these sites to promote
education, keep students up to date with assignments, and offer
help to those in need [2]. In general, the Internet and social
networking sites can be a positive influence on adolescents.
Social networking sites provide an outlet for teens to express
themselves in their own unique ways [2]. In addition, they serve
both as a meeting place for teens to interact with other like-
minded people and as showplaces for a teen’s artistic and
musical abilities [2]. Finally, high school students use these
sites as tools to obtain information and resources for graduation
preparation and future planning. For example, students
applying for college visit profiles of that college’s students to
view pictures and read blogs of past students to determine
whether the college would be a good fit [2].
3. METHODOLOGY This study is based on completed questionnaire survey of
students in Edo state Nigeria. The survey included a series of
questions to determine the impact of social media on academic
lives of youths
This consists of secondary and those in the tertiary institutions
which include both genders and those from different ethnic and
religious backgrounds. The average age of these students is
twenty-one years.
Simple random sampling method, targeting youths in
secondary and higher institutions was adopted for this study.
Visits were made to different identified accessible categories of
schools where questionnaires were distributed at random.
Systematic sampling was also used to capture the views of
students of different classes or levels in these schools abut
social media. The samples are as follows:
i. Secondary Schools: Senior Secondary School 1 (SSS
1), Senior Secondary School 2 (SSS 2) and Senior
Secondary School 3 (SSS 3)
ii. College of Education: Part 1, Part 2, and Part 3
iii. University: 100, 200, 300, 400, and 500 levels
The study is based on questionnaire survey. Questionnaires
containing both open and close ended questions were
distributed among the students. The questionnaire has
questions on activities on social media and demographic
questions including age, gender, average grade in school,
location of residence, if and how long the participant has been
using any social media site. The questionnaire aims to assess
how, if at all participants use social media for academic
purposes and to what degree is the effect of the general usage
of the site on the academic performance of participants.
It is ensured that the questions fully represent the domain of the
effects of social media on academic lives of youth. The
reliability of the questionnaire is ensured through carefully
manipulated repeated highly correlated questions of the
questionnaire. The questions are structured to measure the
impact of social media on academic lives of youth.
Questionnaires were delivered to the respondent by direct
visitation for interactive completion. The administration of the

International Journal of Computer Applications Technology and Research
Volume 7–Issue 02, 94-98, 2018, ISSN:-2319–8656
www.ijcat.com 96
research instrument occurs at the same time or following some
time delay among the respondents. The participants were
carefully selected to capture the domain of interest that is,
youth. The questionnaire was made to be interesting, of value,
short, clearly thought through and well presented to obtain a
higher likelihood of respondents answering the questionnaire.
The method of data analysis that is adopted is chi square.
4. RESULTS AND DISCUSSION
4.1 Results Hypothesis I: Social media is not significantly affecting
educational achievements of students.
The null hypothesis (H0), states that there is no association
between social media and academic achievement of youth. The
alternate hypothesis (H1) states that social media have
association with academic achievement of youth. The
hypothesis is tested considering students that use social media
for educational purpose and those that do not use it for this
purpose. Also, those that do not use it at all are also considered.
The total number of students that use social media for
educational purposes (A) = 64
The total number of students that use social media but not for
educational purposes (B) = 27
The total number of students that do not use social media (C) =
9
Based on this classification the hypothesis is tested by asking
these three categories if they have noticed the effect of the use
of social media or they believe that social media has the
capacity to improve their academic achievement.
The observed versus expected counts is shown in table 1 below:
Table 1: Observed Versus Expected Counts of Social
Media Affecting Academic Achievement of Students
YES NO DON’T
KNOW
TOTAL
A
45
(39.68)
10
(10.88)
9
(13.44)
64
B 15
(16.74 )
5
( 4.59)
7
( 5.67)
27
C 2
( 5.58)
2
( 1.53)
5
( 1.89)
9
TOTAL 62 17 21 100
Using the Chi-square formula, the Chi-square value was
calculated for each of the cell.
𝑋𝐴12 = 0.713 𝑋𝐴2
2 = 0.071 𝑋𝐴32 = 1.467
𝑋𝐵12 =0.181 𝑋𝐵2
2 = 0.037 𝑋𝐵32 = 0.312
𝑋𝐶12 = 2.297 𝑋𝐶2
2 = 0.144 𝑋𝐶32 = 5.117
X2 = 0.713 + 0.071 + 1.467 +
0.181+0.037+0.312+2.297+0.144+ 5.117
= 10.34
The degree of freedom (df) = (number of row – 1) x (number
of column – 1) = (3 -1) X (3-1) = 4
From the chi square distribution table, the probability value (p-
value) for the calculated X2 and df is less than 0.05 which is the
level of significance. This result implies that there is negligible
probability (p < 0.05, i.e. less than 5%) that the observed value
occurred by chance. It is therefore concluded that association
exists between social media and academic achievement of
youth. The null hypothesis is therefore rejected.
Hypothesis II: Facebook social medium affects students’
achievements than any other media.
The null hypothesis (H0), states that Facebook social medium
does not affect students achievements more than any other
media. The alternate hypothesis (H1) states that Facebook
social medium affects students’ achievements more than any
other media. The hypothesis is tested considering only students
that use social media.
The total number of students that use Facebook more than other
social media (A) = 58
The total number of students that use other social media more
than Facebook (B) = 33
Based on this classification, the hypothesis is tested by asking
these two categories of students whether social media affect
their academic achievement. The table 2 below shows the
observed versus expected counts:
Table 2: Observed Versus Expected Counts of Numbers of
Students Using Different Types of Social Media
YES NO DON’T
KNOW
TOTAL
(A)
47
(38.242
)
4
(9.560
)
7
(10.198)
58
OTHERS
(B)
13
(21.758
)
11
(5.44)
9
(5.802)
33
TOTAL 60 15 16 91
Using the Chi-square formula, the Chi-square value was
calculated for each of the cell.
𝑋𝐴12 = 2.006 𝑋𝐴2
2 = 3.234 𝑋𝐴32 = 1.003
𝑋𝐵12 =3.525 𝑋𝐵2
2 = 5.680 𝑋𝐵32 = 1.763
X2 = 2.006 + 3.234 + 1.003 + 3.525 + 5.680 + 1.763
= 17.21
df = (2 -1) X (3-1) = 1 X 2 = 2
The p-value for the calculated X2 and df of 2 is less than 0.05
(about 0.001) which is far below the level of significance. This
result implies that there is negligible probability that the
observed value occurred by chance. The null hypothesis is
therefore rejected and concludes that Facebook social medium
affects students’ achievements more than any other media.
Hypothesis III: Gender effect is not significantly strong in
discussing effects of social media on academic achievements
of students. The null hypothesis (H0), states that gender has
nothing to do with the effect of social media on academic
achievements of students. The alternate hypothesis (H1) states
gender determines the extent to which social media affect
academic achievements of students. The hypothesis is tested by
considering the number of male and female students that use
social media and think that there is a measure of effects in the
usage of social media on academic achievements of students.
The table 3 below shows the observed versus expected counts:
Table 3: Observed Versus Expected Counts of Gender
Agreeing that Social Media Affect Academic Achievement
of Students
YES NO TOTAL
Male
(A)
36
( 32.637)
18
( 21.363)
54
Female
(B)
19
( 22.363)
18
( 14.637)
37
TOTAL 55 36 91

International Journal of Computer Applications Technology and Research
Volume 7–Issue 02, 94-98, 2018, ISSN:-2319–8656
www.ijcat.com 97
Using the Chi-square formula, the Chi-square value was
calculated for each of the cell.
𝑋𝐴12 = 0.347 𝑋𝐴2
2 = 0.529
𝑋𝐵12 =0.506 𝑋𝐵2
2 = 0.773
X2 = 0.347 +0.529+0.506+0.773 = 2.155
df = (2 -1) X (2-1) = 1
For the values of X2 and df, The p-value is more than 0.05
(about 0.1) which is above the level of significance. The null
hypothesis is therefore accepted and concludes that gender does
not determine the extent to which social media affect academic
achievements of students.
4.2 Discussion This study investigated the link between social media and
academic achievement of youths under three hypotheses.
Hypothesis I
The result of this research shows that there is a link between
social media and academic achievements of youths. In the
survey as shown in Table 4.1, 91% of the students use social
media out of which 65.9% appreciate the impact of the social
media on their academic achievements. This is in agreement
with the findings of [13] that students who participate in course
work that utilize social media demonstrate an increase in
overall GPA when compared with students who do not
participate in social media.
Hypothesis II
The study also reveals that Facebook has the highest usage
among the students. The number of students using different
types of social media sites is given in the table 4 below:
Table 4: How Students Use different Types of Social
Media
Social Media Number of students
(Out of 100)
Facebook 83
Whatsapp 56
Twitter 46
2go 37
Instagram 24
BBM 18
Badoo 12
Others 9
Considering this frequency of usage, Facebook is believed to
have the greatest impact on the academic achievement of
students because of its high usage.
Hypothesis III
Although, some studies in USA like [14] claims that more
women are getting online than men and this trend is expected
to increase in the next few years, this study however, shows that
gender is not related to how social media influence the
academic achievements of students. Females may be using
social media more than males but this does not suggest that they
are using it more on academics which could have made the
impact more on their academic than that of males. As a matter
of facts as shown in table 5, this survey found that 64% of the
respondents support the idea that female use social media more
than male, 9% think otherwise while 27% believe social media
are used equally. However, out of the 42 females that
participated in the survey (Table 6), 14 (about 33.3%) believe
that social media affects academic achievement, 12 (about
28.6%) think otherwise while 16 (about 38.1%) don’t know the
effect. It then means that only one-third of the female could
show the effect of social media on their academic performance.
Therefore, it could be concluded that the higher usage of social
media by female does not translate to higher academic
achievement. This makes gender usage of social media
insignificant in academic achievement of youth.
Table 5: Gender Usage of social Media
Male Usage more
than Female
Usage
Female Usage
more than Male
Usage
Usage The
Same
64% 27% 9%
Table 6: Effects of Social Media on Academic
achievements of Females (42 Female Respondents)
YES NO DON’T KNOW
14 12 16
5. SUMMARY, CONCLUSION AND
RECOMMENDATIONS This study was carried out to investigate the effects of social
media on academic achievement of youths. One hundred
questionnaires containing both open and close ended questions
were administered among students of secondary and tertiary
institutions. In line with the aims of this research, three
hypotheses were formulated. The first test confirmed that the
use of social media can affect the academic achievement of
youth. Secondly, the study showed that Facebook social
medium affects student achievements than any other media.
Thirdly, the study revealed that gender has nothing to do with
how social media affect youth’s academic achievements.
The study presents a general trend of social media usage among
students. It was found that Facebook is the most used social
media sites follow by Whatsapp, Twitter, 2go, Instagram,
BBM, Badoo and others in that order. Based on the results of
this research, it is therefore concluded that social media has the
capacity to help improve the academic achievement of youths.
This is however possible when youths use these media for
academic purposes. Facebook social media is mostly used and
if tutors or lecturers can use this medium to teach, it will
enhance the performance of students.
This study investigated how much social media affects
academic performance of youths. The key findings of this study
have further strengthened the literatures such as [15] that
confirm the link between academic performance of students
and social media.
Another result of this study reported the dominance of
Facebook usage among students and this will lead to further
research on why students tend to use Facebook the more.
The study affirmed the insignificance of gender in the usage of
social media and academic performance.
The following recommendations are made on the basis of findings of the study:
1. The students at various levels should be provided
with better Internet connections to promote the use of
social media among young students.
2. The use of social media should be integrated with the
conventional class room teaching and learning
process.

International Journal of Computer Applications Technology and Research
Volume 7–Issue 02, 94-98, 2018, ISSN:-2319–8656
www.ijcat.com 98
3. The teachers should enhance their skills in the use of
these media, so they could be able to cope with these
emerging global trends.
4. Teachers should encourage the use of social media
for educational purposes by posting assignments,
questions and tutorials on the media, knowing that a
large proportion of students use the media.
5. Students should be encouraged to create study groups
or forum on social media to facilitate the exchange of
information relating to their class work.
6. REFERENCES [1]. Shabnoor. S. and Tajinder, S. (2015). Social Media its
Impact with Positive and Negative Aspects. International
Journal of Computer Applications Technology and
Research, Volume 5– Issue 2, 71 - 75, 2016, ISSN:- 2319–
8656.
http://www.ijcat.com/archives/volume5/issue2/ijcatr0502
1006.pdf
[2]. Boyd, danah. (2007) “Why Youth (Heart) Social Network
Sites: The Role of Networked Publics in Teenage Social
Life.” MacArthur Foundation Series on Digital Learning
– Youth, Identity, and Digital Media Volume (ed. David
Buckingham). Cambridge, MA: MIT Press.
[3]. Ahn (2011). The Effect of Social Network Sites on
Adolescents’ Social and Academic Development: Current
Theories and Controversies
[4]. Papaioannou, 2011. Assessing Digital Media Literacy
among Youth through Their Use of Social Networking
Sites
[5]. Chiemela Q.A., Ovute A.O and Obochi C.I. (2015). The
influence of the social media on the Nigerian youths: Aba
residents experience. Journal of Research in Humanities
and Social Science, Volume 3 ~ Issue 3 (2015) pp:12-20
ISSN(Online) : 2321-9467
[6]. Antony Mayfield (2008). What is Social Media?
Available online at
http://www.icrossing.com/uk/sites/default/files_uk/insight
_pdf_files/What%20is%20Social%20Media_iCrossing_eb
ook.pdf
[7]. Common Sense Media (2012). Social Life: How Teens
View Their Digital Lives. A Common Sense Media
Research Study. Summer 2012.
[8]. Andy Miah (2014). The A to Z of Social Media for
Academia
[9]. Karpinski, A. C. (2009). A description of Facebook use
and academic performance among undergraduate and
graduate students. Paper presented at the Annual Meeting
of the American Educational Research Association, San
Diego, CA.
[10]. Pasek, J., More, E., & Hargittai, E. (2009). Facebook and
academic performance: Reconciling a media sensation
with data. First Monday, 14 (5),
http://firstmonday.org/htbin/cgiwrap/bin/ojs/index.php/f
m/article/view/2498/218.
[11]. Ito, M., Baumer ,S., Bittanti, M.,boyd, d., Cody, R.,&
Herr-Stephenson, B. (2009). Hanging out, messing
around, and geeking out: Kids living and learning with
new media. Cambridge, MA:MIT Press.
[12]. Jenkins, H. (2006). Confronting the challenges of
participatory culture: Media education for the 21st century.
Chicago: The John D.and Catherine T. MacArthur
Foundation.
[13]. Junco, R., Helbergert, G., & Loken, E. (2011). The effect
of Twitter on college student engagement and grades.
Journal of Computer Assisted Learning, 27, 119-132.
doi:10.1111/j.1365-2729.2010.00387.x
[14]. Tech Crunchies. (2008). Internet statistics and numbers.
Retrieved February 1, 2011, from
http://techcrunchies.com/males-vs-females-internet-
users-in-usa/
[15]. Carini, R. M., Kuh, G. D., & Klein, S. P. (2006). Student
engagement and student learning: Testing the linkages.
Research in Higher Education, 47(1), 1-32. doi:
10.1007/s11162-005-8150-9
International Journal of Computer Applications Technology and Research
Volume 7–Issue 02, 99-108, 2018, ISSN:-2319–8656
www.ijcat.com 99
Ahmed Bashir Abugharsa
Faculty of Information
Technology University of
Misurata, Misrata Libya.
Hamida Mohamed Almangush
Faculty of Information
Technology University of
Misurata, Misurata Libya
Abstract – Image scrambling is a useful approach to protect image data by confusing the image and
thus prevent it from being misused. The issues concerning the relationship among the adjacent pixels
of the scrambled image, the weakness of visual leakage, and similar histogram plots being produced,
all affect the image scrambling process. This paper is aimed at determining the iteration level that is
extracted from a secure key and a key mask for building a scrambling table which is used in the
scrambling processes and modifying the pixel colour values. The technique begins by modified pixel
colour values. These pixel colour values are then scrambled by reduce or the increase (modified) the
pixel colour values in the image between the range of the colour (0 to 255) by using a vertical and
horizontal scrambling method based on a scrambling table. The experimental results of the paper show
that the pixel colour values scrambling technique has reduced the relationship among the image
elements. This occurs because the entropy value of the scrambled images has increased and the
correlation value is lower. Moreover, the scrambling degree of the scrambling technique has larger
values for the scrambled image. Subsequently, the pixel colour value modification in the technique
helps to confuse and amend the pixel colour values of the scrambled image to produce a different
histogram plot when compared with plots made from the original images.
Keywords: Block Image Scrambling; Scrambled Image; Block Image Scramble; pixel scramble.
1. INTRODUCTION
The world is facing daily rapid changes in technology due to
swift advances in computing, networks and communications.
These advances have opened networks and individual machines
to a wide range of abuse by offenders who abuse the technologies
in many criminal activities. In other words, they use technologies
in various Cybercrimes [1]-[27]. A study found that there are
relatively few criminal and civil cases which do not apply digital
facilitation. It has been estimated that over 85 percent of criminal
and civil prosecution cases are committed through the use of
digital technology [2]. The impact of the Internet has contributed
to the demand for digital media such as audio, image, and video.
It has not so much affected the creation of these media, but more
on the reproduction and distribution, while in open networks
most of the information is kept electronically. Therefore, the
demand for protection of such images has gained more
importance [3]-[28] The objective of image scrambling is to
generate a non-intelligible image which prevents the human
visual system or a computer vision system from understanding
the true content. An authorised user is empowered to descramble
the image using information regarding the scrambling method
and the variables used in that processing in order to decipher the
image. Image scrambling has been proposed as a way to mitigate
such issues since way back in 1960 when the first documented
system to do so emerged [4].
The approach at that time involved scrambling, concealing
or encoding information and unscrambling and decoding the
received images using line screens and grids consisting of
opaque and transparent lines. Over the years, image scrambling
has evolved into two streams. One is based on matrix
transformation to shift coordinates and the other makes use
of permutations of the pixel coordinates.
Most of the scrambling approaches are based on an Arnold
Transform or a combination of the Arnold Transform with other
techniques [5]-[8]. However, these methods are applicable only
to equilateral images. If the images are not equilateral, meaning
the width and height are the same, then they have to be padded
with values to make them equilateral [9]. Since most of these
techniques do not use a ‘key’ that provides additional protection,
Zhou et al. [10] proposed a Fibonacci P-code based scrambling
algorithm which requires two parameters to be known by the
receiver side to descramble the images. Even though this is
certainly a favourable development over the other methods, just
two numbers do not provide adequate protection. Wang et al.
[11] proposed an approach for optical image scrambling with a
binary Fourier transform computer-generated hologram and
pixel-scrambling. For this kind of encryption algorithm, the
orders of the pixel scrambling and the encrypted image need to
be used as the keys to decrypt the original image.
Other researchers [12]-[15] have attempted scrambling using
random sequences based on chaos or pseudo random number
generation based on parameters. Zhou et al. [16] proposed an
algorithm using an M-sequence to shuffle image coordinates
using two parameter keys. The M-sequence is a maximum length
sequence that has been used in spread spectrum communications.
It is a pseudo random noise sequence. In this approach, the
authorised user is given the shift parameter r and the distance
parameter p which are used to generate a 2-D M-sequence to
descramble the scrambled image. Ye [12] proposed a scrambling
Multilevel Pixel Colour Values Scrambling Based on Shifting Image Technique
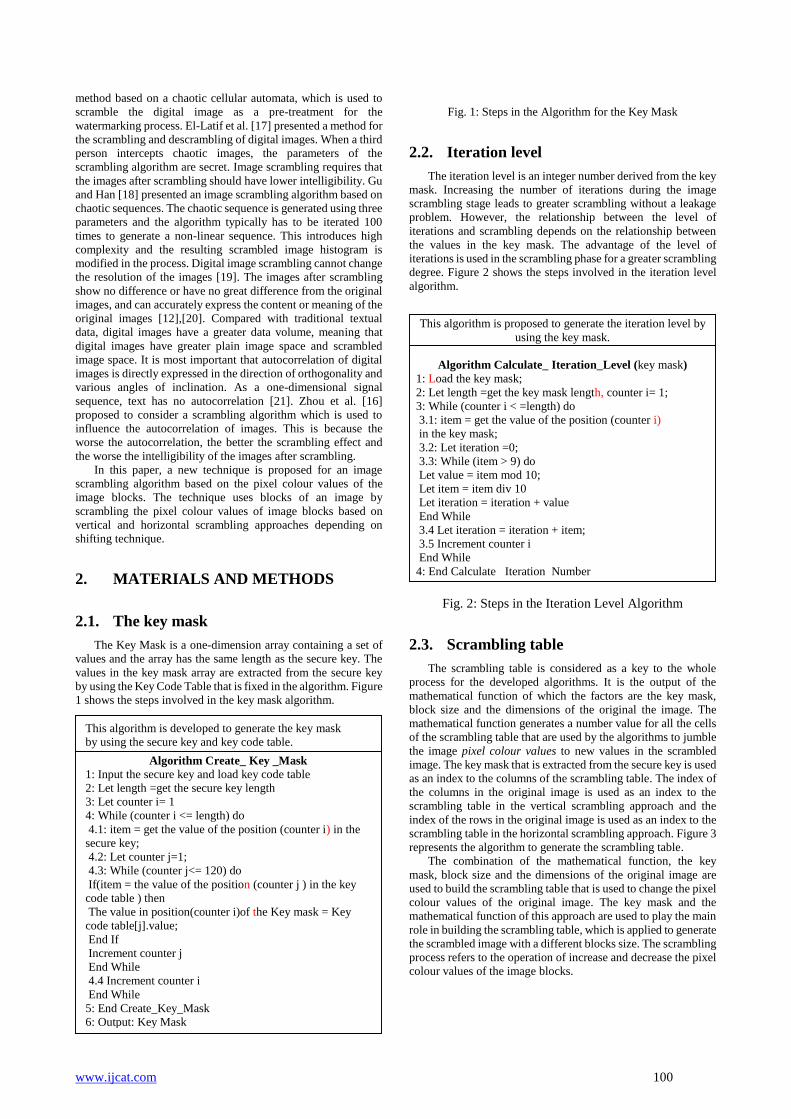
www.ijcat.com 100
method based on a chaotic cellular automata, which is used to
scramble the digital image as a pre-treatment for the
watermarking process. El-Latif et al. [17] presented a method for
the scrambling and descrambling of digital images. When a third
person intercepts chaotic images, the parameters of the
scrambling algorithm are secret. Image scrambling requires that
the images after scrambling should have lower intelligibility. Gu
and Han [18] presented an image scrambling algorithm based on
chaotic sequences. The chaotic sequence is generated using three
parameters and the algorithm typically has to be iterated 100
times to generate a non-linear sequence. This introduces high
complexity and the resulting scrambled image histogram is
modified in the process. Digital image scrambling cannot change
the resolution of the images [19]. The images after scrambling
show no difference or have no great difference from the original
images, and can accurately express the content or meaning of the
original images [12],[20]. Compared with traditional textual
data, digital images have a greater data volume, meaning that
digital images have greater plain image space and scrambled
image space. It is most important that autocorrelation of digital
images is directly expressed in the direction of orthogonality and
various angles of inclination. As a one-dimensional signal
sequence, text has no autocorrelation [21]. Zhou et al. [16]
proposed to consider a scrambling algorithm which is used to
influence the autocorrelation of images. This is because the
worse the autocorrelation, the better the scrambling effect and
the worse the intelligibility of the images after scrambling.
In this paper, a new technique is proposed for an image
scrambling algorithm based on the pixel colour values of the
image blocks. The technique uses blocks of an image by
scrambling the pixel colour values of image blocks based on
vertical and horizontal scrambling approaches depending on
shifting technique.
2. MATERIALS AND METHODS
2.1. The key mask
The Key Mask is a one-dimension array containing a set of
values and the array has the same length as the secure key. The
values in the key mask array are extracted from the secure key
by using the Key Code Table that is fixed in the algorithm. Figure
1 shows the steps involved in the key mask algorithm.
Fig. 1: Steps in the Algorithm for the Key Mask
2.2. Iteration level
The iteration level is an integer number derived from the key
mask. Increasing the number of iterations during the image
scrambling stage leads to greater scrambling without a leakage
problem. However, the relationship between the level of
iterations and scrambling depends on the relationship between
the values in the key mask. The advantage of the level of
iterations is used in the scrambling phase for a greater scrambling
degree. Figure 2 shows the steps involved in the iteration level
algorithm.
Fig. 2: Steps in the Iteration Level Algorithm
2.3. Scrambling table
The scrambling table is considered as a key to the whole
process for the developed algorithms. It is the output of the
mathematical function of which the factors are the key mask,
block size and the dimensions of the original the image. The
mathematical function generates a number value for all the cells
of the scrambling table that are used by the algorithms to jumble
the image pixel colour values to new values in the scrambled
image. The key mask that is extracted from the secure key is used
as an index to the columns of the scrambling table. The index of
the columns in the original image is used as an index to the
scrambling table in the vertical scrambling approach and the
index of the rows in the original image is used as an index to the
scrambling table in the horizontal scrambling approach. Figure 3
represents the algorithm to generate the scrambling table.
The combination of the mathematical function, the key
mask, block size and the dimensions of the original image are
used to build the scrambling table that is used to change the pixel
colour values of the original image. The key mask and the
mathematical function of this approach are used to play the main
role in building the scrambling table, which is applied to generate
the scrambled image with a different blocks size. The scrambling
process refers to the operation of increase and decrease the pixel
colour values of the image blocks.
This algorithm is proposed to generate the iteration level by
using the key mask.
Algorithm Calculate_ Iteration_Level (key mask)
1: Load the key mask;
2: Let length =get the key mask length, counter i= 1;
3: While (counter i < =length) do
3.1: item = get the value of the position (counter i)
in the key mask;
3.2: Let iteration =0;
3.3: While (item > 9) do
Let value = item mod 10;
Let item = item div 10
Let iteration = iteration + value
End While
3.4 Let iteration = iteration + item;
3.5 Increment counter i
End While
4: End Calculate_ Iteration_Number
5: Output: Iteration Number
This algorithm is developed to generate the key mask
by using the secure key and key code table.
Algorithm Create_ Key _Mask
1: Input the secure key and load key code table
2: Let length =get the secure key length
3: Let counter i= 1
4: While (counter i <= length) do
4.1: item = get the value of the position (counter i) in the
secure key;
4.2: Let counter j=1;
4.3: While (counter j<= 120) do
If(item = the value of the position (counter j ) in the key
code table ) then
The value in position(counter i)of the Key mask = Key
code table[j].value;
End If
Increment counter j
End While
4.4 Increment counter i
End While
5: End Create_Key_Mask
6: Output: Key Mask

www.ijcat.com 101
Fig. 3: Steps to generate the Scrambling Table
2.4. Scrambling Pixel Colour Values
. The main step is changing or modified the pixel colour
value (RGB) by using the scrambling pixel colour value
algorithm based on shifting technique. This process is initiated
by scrambling the pixel colour value which jumbles the colour
between the boundaries of the image colours according to the
values in the scrambling table by using the discussed formula to
prevent the problem of underflow and overflow. In this method,
the RGB value of a pixel is altered, the R value of the pixel is
modified to another value according to the scrambling table
values. In a similar manner, the G and B values of the pixel are
also changed. These techniques are explained in the next section.
Fig. 4: Steps to determine the New Pixel Colour Values
2.5. Scrambling the colour value based on
shifting technique
The image scrambling technique involves vertical and
horizontal movement approaches. The process is scrambling the
pixel colour values. This is achieved by modifying (scrambling)
the pixel colours between the boundaries of the image colours
(0 to 255) according to the values in the scrambling table by
using the discussed formula to prevent the problem of underflow
and overflow. The main difference between these two
approaches is how the pixel colour values are modified and how
the pixel colour values are updated within the new scrambled
image. In the vertical scrambling approach the pixel colour
values are modified from bottom to top while in the horizontal
scrambling approach the pixel colour values are modified from
left to right [22]. An overview of Scrambling the colour value
based on the shifting technique is shown in Figure 5.
Fig. 5: Overview of the Scrambling the colour value based on
the shifting technique
Change the pixel colour value by using the scrambling
table.
Algorithm Scrambling Pixel_Colour_Values
Algorithm Scrambling Pixel_Colour_Value( Block,
ValueofScramb_Table )
1: Calculate Block Width and Height;
2: For i = 1 to Bl_height do
3: For j = 1 to Bl_width do
3.1 Block[i,j].Red = 256 +Block[i,j].Red +
ValueofScramb_Table Mod 256
3.2 Block[i,j].Green =256 + Block[i,j].Green +
ValueofScramb_Table Mod 256
3.3 Block[i,j].Blue = 256 +Block[i,j].Blue +
ValueofScramb_Table Mod 256
4: Next j
5: Next i
6: End Scrambling Pixel_Colour_Value 7: Output: New Pixels Colour Value
This algorithm is proposed to generate the scrambling
table
Algorithm Create_ Scrambling _Table
1 : Load Image
2 : Load the Key mask
3 : Calculate Image Width and Height
4 : Let increased value = 2
5 : Let H_Blocks = Width /block size
6 : Let V_Blocks = Height /block size
7 : length = Calculate the length of the key mask
8 : V_B_ ScramblingTable (Index Of Columns in
Scrambling Table) = length
9 : If (H_Blocks ≥ V_Blocks) then
10: H_B_ Scrambling Table (Index Of Rows in
Scrambling Table) = H_Blocks
Else
11: H_B_ Scrambling Table (Index Of Rows in
Scrambling Table) = V_Blocks
12: For I = 1 to V_B_ Scrambling Table
13: Item = 2, increased value =2
14: For J = 1 to H_B_ Scrambling Table
15: Repeat
16: Scrambling Value = (increased value *
H_Blocks + height) + key mask[I] +
(increased value -1 )* V_Blocks + width) * mask
key[I] + Item Mod H_B_ Scrambling Table
17: Item = Item+3,
18: increased value = increased value + 2
19: Until (Scrambling Value >1)
20: Scrambling Table (I , J) = Scrambling Value
21: Next J
22: Next I
23: End Create_Scrambling_Table
Secure Key
Original Image
Scrambled Image
Generate
Scrambling
Table
Generate Key Mask
Generate
Iteration Number
Scrambling pixel colour
value (Modifying)
Key Code
Scrambling
Process
Iteration > 1
Y
N

www.ijcat.com 102
The Scrambling the colour value based on the shifting technique
works as follows:
1. Load the original image and secure key and then divide the
original image into a different blocks size. Each block has
the same number of pixels.
2. Generate the key code that will be used to extract the key
mask from the secure key.
3. Call the key mask algorithm to create the mask key table.
This step is very important in the proposed processes for the
iteration level, scrambling table and scrambling.
4. Call the iteration level algorithm to generate the iteration
level that can control the repetition of the scrambling
processes.
5. Call the scrambling table algorithm to generate the
scrambling table by combining the mathematical function,
the width and height of original image and the different blocks size and the key mask to build the scrambling table
that will be used to shift the rows and columns of the image.
The key mask and the mathematical function of this
approach are used to play the main role in building the
scrambling table. The scrambling process refers to the
operation of dividing and modified an arrangement of the
original image.
6. The main idea of the scrambling process contains two steps,
scrambling the pixel colour values horizontally and
scrambling the pixel colour values vertically.
By calling the pixel colour value algorithm, the process of
scrambling the pixel colour values takes place vertically and
horizontally which modifies (scrambles) the pixel colour
values between the boundaries of the image colour according
to the values in scrambling table by using the proposed
formula to prevent the problem of underflow and overflow.
In this process, the RGB value of a pixel is changed to
another value according to the scrambling table values.
7. The relationship among the elements of the image will be
decreased and thus it becomes difficult to predict the value
of any given pixel from the values of its neighbours. The
clear information present in an image is due to the
relationship among the image elements. The perceivable
information can be reduced among the image pixels using
Scrambling the colour value based on the shifting technique.
Also, changing the pixel colour values can increase the level
of security in the scrambled image by producing a new
histogram which is different from the histogram of the
original image. Thus, it becomes even more difficult to
predict the value of any given pixel from the values of its
neighbours.
Fig. 6: Steps to generate the Scrambled Image
3. EXPERIMENTAL DETAILS AND
RESULTS
A good quality scrambled algorithm should be strong against
all types of attack, including statistical and brute force attacks.
Some experiments are given in this section to demonstrate the
efficiency of the proposed technique. The original image is first
loaded by the Scrambling the colour value based on the shifting
algorithm to separately build a new scrambled image
respectively with different block sizes (1 pixel × 1 pixel, 3 pixels
× 3 pixels, 10 pixels × 10 pixels) using the same iteration level
(40 levels). Therefore, three different scrambled images are
obtained. The different blocks size and the block sizes in each
case are shown in Table 1.
This algorithm is proposed to generate the shifted image.
Algorithm Create_Shifted_Image
1: Load Original Image
2: Input SecureKey, Block size
3: H_Blocks =ImageWidth / Block size
4: V_Blocks =ImageHeight / Block size
5: Divide the original image into (H_Blocks * V_Blocks )
6: L_Key = Length (key mask)
7: Calculate Image Width and Height
8: Generate the Key code
9: Call the key mask algorithm(key code, SecureKey)
10: Call the iteration number algorithm(key mask)
11: Call the scrambling table algorithm(Image, Key mask,
block size)
12: Repeat
13: For J = 1 to L_Key
(Shift Vertically the Pixel Colour Value Of Image)
14: IndexOfColumnsInScramblingTable= Int (Key
mask( J ))
15: For I = 1 to V_Blocks
16: NumberOfShift = ScramblingTable( I ,
IndexOfColumnsInShiftingTable )
17: Call the Scrambling Pixel_Colour_Value( Block,
NumberOfShift)
18: Next I
(Shift Horizontally the Pixel Colour Value Of Image)
19: IndexRowsScramblingTable= Int(Key mask( J ))
20: For I = 1 to H_Blocks
21: NumberOfShift = ScramblingTable( I ,
IndexRowsScramblingTable )
22: Call the Scrambling Pixel_Colour_Value(
Block, NumberOfShift)
23: Next I
24: Next J
25: iteration = iteration - 1
26: Until(iteration > 0)
27: END CREATE_SCRAMBLED_IMAGE
28: Output: Scrambled Image

www.ijcat.com 103
Table 1. Different cases of number of blocks
Case number Block size
1 10 Pixels * 10 Pixels
2 3 Pixels * 3 Pixels
3 1 Pixel * 1 Pixel
In this paper, original images are selected as shown in Figure
7 for use in this experiment.
Original image
Measurements
Correlation Entropy Standard
Deviation
0.8346327 7.4672746 47.0519513
0.8068415 6.891374 54.253276
0.9470200 7.4933417 45.1491916
Fig. 7: the original images used in the experiment
Image Scrambled image
Pixel × Pixel 3 × 3 Pixels 10 × 10 Pixels
Birds
Eiffel
Stones
Fig. 8: Result of Scrambled image for all the cases by using
a 40 Iteration level
3.1. Correlation of two adjacent pixels
A correlation is a statistical measure of security that
expresses a degree of relationship between two adjacent pixels
in an image or a degree of association between two adjacent
pixels in an image. The aim of correlation measures is to keep
the amount of redundant information available in the encrypted
image as low as possible [23]. Equation (1) is used to study the
correlation between two adjacent pixels in the horizontal,
vertical, diagonal and anti-diagonal orientations [24].
𝐶𝑟 =𝑁 ∑ (𝑋𝑗 × 𝑌𝑗)− ∑ 𝑋𝑗
𝑁𝑗=1 × ∑ 𝑌𝑗
𝑁𝑗=1 𝑁
𝑗=1
√(𝑁 ∑ 𝑋𝑗2𝑁
𝑗=1 – (∑ 𝑋𝑗𝑁𝑗=1 )
2) × (𝑁 ∑ 𝑌𝑗
2𝑁𝑗=1 – (∑ 𝑌𝑗
𝑁𝑗=1 )
2)
(1)
where x and y are the intensity values of two neighbouring
pixels in the image and N is the number of adjacent pixels
selected from the image to calculate the correlation.
3.1.1. Analysis of the relationship between the pixel colour
value of number Blocks and the Correlation of
Scrambled image
Table 2 and Figure 9 summarise the correlation results of the
scrambled image for all cases by using a different blocks size
with 40 iteration levels.
Table 2: Correlation value results of the Scrambled image for
all cases
Case Number of blocks Correlation of Scrambled
image
Birds
30 x 30 0.060977
100 x 100 0.003329
300 x 300 0.00052
Eiffel
30 x 30 0.050091
100 x 100 0.003736
300 x 300 0.000065
Stones
30 x 30 0.049013
100 x 100 0.002993
300 x 300 0.000082
Table 2 and Figure 9 show that there is an inverse relationship
between the pixel colour value of number blocks and the
correlation. This means that increasing the blocks size results in
a lower correlation for all the cases as a result of using the
scrambling technique. The process of dividing and shuffling the
pixel colour value of of the image blocks will confuse the
relationship between the original image and the scrambled
image. Also, it minimises the relationship among image
elements. Therefore, the perceivable information in the
scrambled image is reduced by decreasing the correlation among
the image pixels using the scrambling technique.
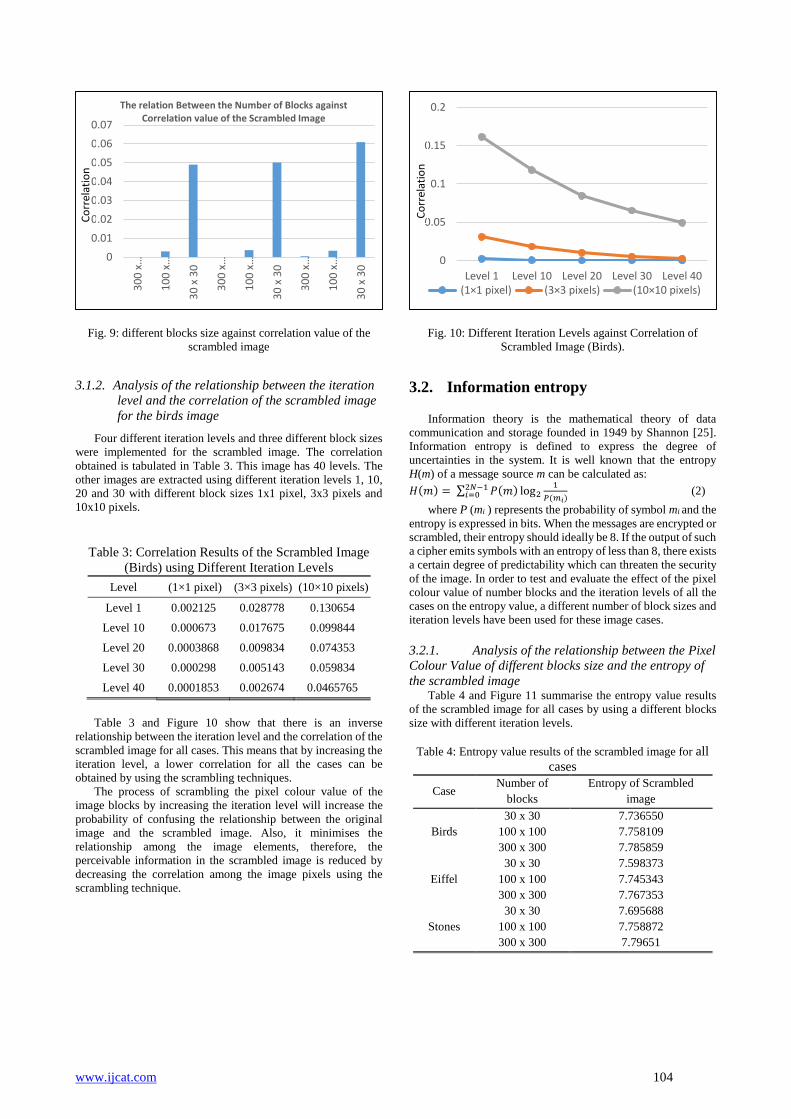
www.ijcat.com 104
Fig. 9: different blocks size against correlation value of the
scrambled image
3.1.2. Analysis of the relationship between the iteration
level and the correlation of the scrambled image
for the birds image
Four different iteration levels and three different block sizes
were implemented for the scrambled image. The correlation
obtained is tabulated in Table 3. This image has 40 levels. The
other images are extracted using different iteration levels 1, 10,
20 and 30 with different block sizes 1x1 pixel, 3x3 pixels and
10x10 pixels.
Table 3: Correlation Results of the Scrambled Image
(Birds) using Different Iteration Levels
Level (1×1 pixel) (3×3 pixels) (10×10 pixels)
Level 1 0.002125 0.028778 0.130654
Level 10 0.000673 0.017675 0.099844
Level 20 0.0003868 0.009834 0.074353
Level 30 0.000298 0.005143 0.059834
Level 40 0.0001853 0.002674 0.0465765
Table 3 and Figure 10 show that there is an inverse
relationship between the iteration level and the correlation of the
scrambled image for all cases. This means that by increasing the
iteration level, a lower correlation for all the cases can be
obtained by using the scrambling techniques.
The process of scrambling the pixel colour value of the
image blocks by increasing the iteration level will increase the
probability of confusing the relationship between the original
image and the scrambled image. Also, it minimises the
relationship among the image elements, therefore, the
perceivable information in the scrambled image is reduced by
decreasing the correlation among the image pixels using the
scrambling technique.
Fig. 10: Different Iteration Levels against Correlation of
Scrambled Image (Birds).
3.2. Information entropy
Information theory is the mathematical theory of data
communication and storage founded in 1949 by Shannon [25].
Information entropy is defined to express the degree of
uncertainties in the system. It is well known that the entropy
H(m) of a message source m can be calculated as:
𝐻(𝑚) = ∑ 𝑃(𝑚) log21
𝑃(𝑚𝑖)
2𝑁−1𝑖=0 (2)
where P (mi ) represents the probability of symbol mi and the
entropy is expressed in bits. When the messages are encrypted or
scrambled, their entropy should ideally be 8. If the output of such
a cipher emits symbols with an entropy of less than 8, there exists
a certain degree of predictability which can threaten the security
of the image. In order to test and evaluate the effect of the pixel
colour value of number blocks and the iteration levels of all the
cases on the entropy value, a different number of block sizes and
iteration levels have been used for these image cases.
3.2.1. Analysis of the relationship between the Pixel
Colour Value of different blocks size and the entropy of
the scrambled image Table 4 and Figure 11 summarise the entropy value results
of the scrambled image for all cases by using a different blocks
size with different iteration levels.
Table 4: Entropy value results of the scrambled image for all
cases
Case Number of
blocks
Entropy of Scrambled
image
Birds
30 x 30 7.736550
100 x 100 7.758109
300 x 300 7.785859
Eiffel
30 x 30 7.598373
100 x 100 7.745343
300 x 300 7.767353
Stones
30 x 30 7.695688
100 x 100 7.758872
300 x 300 7.79651
0
0.01
0.02
0.03
0.04
0.05
0.06
0.07
30
x 3
0
10
0 x
…
30
0 x
…
30
x 3
0
10
0 x
…
30
0 x
…
30
x 3
0
10
0 x
…
30
0 x
…
The relation Between the Number of Blocks against Correlation value of the Scrambled Image
Co
rrel
atio
n
0
0.05
0.1
0.15
0.2
Level 1 Level 10 Level 20 Level 30 Level 40 (1×1 pixel) (3×3 pixels) (10×10 pixels)
Co
rrel
atio
n

www.ijcat.com 105
Fig. 11: Entropy value against pixel colour value of different
blocks size of Scrambled image
Table 4 and Figure 11 indicate that there is a direct
relationship between the pixel colour value of number blocks and
the entropy value. this means that increasing the number of
blocks that modified the pixel colour value results in a higher
entropy value for all the cases by using the scrambling technique.
The process of dividing and shuffling the pixel colour value of
the image blocks will confuse the relationship between the
original image and the scrambled image.
3.2.2. Analysis of the relationship between the
iteration level and the entropy of scrambled image for
the Eiffel image Table 5 and Figure 12 illustrate the entropy results of the
scrambled image for the Eiffel image against iteration level for
all cases. Figure 12 illustrates the entropy values graphically.
The objective of this test is to clarify the effect of iteration level
on the entropy value for all cases.
Table 5: Entropy Results of the Scrambled Image (Eiffel) using
different Iteration Levels
Table 5 and Figure 12 indicate that the iteration level has
an impact on the entropy value when using the scrambling
technique. There is direct relationship between the entropy
value and the iteration level for all cases of the scrambled
images. This means that by increasing the iteration level,
a higher entropy value for all the cases is obtained by using
the scrambling techniques.
Fig. 12: Different Iteration Levels against Entropy of
Scrambled Image (Eiffel).
3.3. Image scrambling degree
The scrambled image must have diffusion and confusion
properties, which are the basis for designing practical ciphers.
These two superior properties can be tested by computing the
correlations of adjacent pixels in the scrambled image using the
gray difference degree (GDD) function. To evaluate the effect of
image scrambling, Ye and Li [26] introduced the gray difference
and the gray degree of scrambling. The gray difference of a pixel
with a neighbour pixel is defined as follows:
𝐺𝐷(𝑖, 𝑗) = 1
4 ∑ [𝑃(𝑖, 𝑗) − 𝑃(𝑖´, 𝑗´)]2
𝑖´,𝑗´ (3)
where {(𝑖´, 𝑗´) = (𝑖 − 1, 𝑗), (𝑖 + 1, 𝑗), (𝑖, 𝑗 − 1), (𝑖, 𝑗 + 1)} and
P(i,j) denotes the grey value at position (i, j).
After computing the gray difference for every pixel in the
image, except the pixels at the edges, the whole average
neighbourhood gray difference of the image can be computed by
summing and averaging:
𝐸(𝐺𝐷(𝑖, 𝑗)) = ∑ ∑ 𝐺𝐷(𝑖,𝑗)𝑁−1
𝑗=2𝑀−1𝑖=2
(𝑀−2)×(𝑁−2) (4)
The gray value degree is defined by
𝐺𝐷𝐷 = E´(GD(i,j))−E(GD(i,j))
E´(GD(i,j))+E(GD(i,j)) (5)
where E(GD(i, j)) and E´(GD(i, j)) denote the average
neighbourhood gray differences of the input and the scrambled
images, respectively. The GDD value will be a number between
-1 and 1. Better scrambling corresponds to an absolute value near
1 [20].
3.3.1. Analysis of the relationship between the
scrambled image and the scrambling
techniques by using the scrambling degree
Table 6 and Figure 13 summarise the scrambling degree
results of the difference between the original image and the
scrambled image for all cases by using a different pixel colour
value of different blocks size with 40 iteration levels.
7.5
7.55
7.6
7.65
7.7
7.75
7.8
7.85
30
x 3
0
10
0 x
10
0
30
0 x
30
0
30
x 3
0
10
0 x
10
0
30
0 x
30
0
30
x 3
0
10
0 x
10
0
30
0 x
30
0
Birds Eiffel Stones
Entr
op
y
7.45
7.5
7.55
7.6
7.65
7.7
7.75
7.8
Leve
l 1
Leve
l 10
Leve
l 20
Leve
l 30
Leve
l 40
1×1 pixel 3×3 pixels 10×10 pixels
Entr
op
y
Level 1×1 pixel 3×3 pixels 10×10 pixels
Level 1 7.748436 7.716288 7.561724
Level 10 7.754853 7.724342 7.570423
Level 20 7.757965 7.726645 7.582087
Level 30 7.75953 7.733538 7.59763
Level 40 7.767353 7.745343 7.598373

www.ijcat.com 106
Table 6: The Scrambling Degree Results of the Scrambled
Image
Case Number of blocks Scrambling Degree
Birds 30 x 30 0.8725
100 x 100 0.9048
300 x 300 0.9396
Eiffel 30 x 30 0.8822
100 x 100 0.9193
300 x 300 0.9496
Stones 30 x 30 0.9033
100 x 100 0.926
300 x 300 0.9584
Table 6 and Figure 13 indicate that the statistical results of
the scrambling techniques have a high scrambling degree. The
scrambling degree in all the cases is near 1. That means there is
a high relationship between the scrambling technique and the
scrambled image. Hence the efficiency of the scrambling
techniques is high. This indicates that there is a direct
relationship between the number blocks and the scrambling
degree. Increasing the number of blocks that modified the pixel
colour value resulted in a higher scrambling degree for all the
cases by using the scrambling technique, thus showing that the
security of the developed scrambling methods is high. The
process of dividing and shuffling the pixel colour value of the
image blocks will confuse the relationship between the original
image and the scrambled image.
Fig. 13: The Scrambling Degree Results of the scrambled
Image
3.3.2. Analysis of the relationship between the iteration
level and the scrambled images by using the
scrambling degree (stones image)
Table 7 and Figure 14 summarise the scrambling degree
results between the Iteration Level and the scrambled image for
all cases by using a different pixel colour value of number blocks
and different iteration levels. The objective of this test is to
clarify the effect of the iteration level on the scrambled images.
Table 7: Scrambling Degree Results of the Scrambled Image
using Different Iteration Levels
Level (1×1 pixel) (3×3 pixels) (10×10
pixels)
Level 1 0.9049 0.8856 0.8576
Level 10 0.9192 0.8992 0.874
Level 20 0.9296 0.9104 0.8875
Level 30 0.9408 0.9159 0.8934
Level 40 0.9584 0.926 0.9033
Fig.14: Iteration Level against Scrambling Degree of
Scrambled Image (Stones image)
Table 7 and Figure 14 show that a direct relationship exists
between the iteration level and the scrambling degree value of
the scrambled image for all the cases, as the iteration level
increases, the scrambling degree increases. This means that a
higher scrambling degree results from using the developed
techniques.
3.4. Histogram analysis
The histogram test illustrates how pixels of the scrambled
images are distributed at each colour intensity level. An image
histogram can be used to measure the statistical similarity
between the original image and the scrambled image.
Histograms illustrate how pixels in an image are distributed by
plotting the number of pixels at each intensity level. Histograms
are drawn for all the blocks for different block sizes. It is evident
from the results obtained that the block/region level histograms
of the scrambled image compared to the original image are
reasonably uniform and evenly spread across all possible
intensity levels in the original image. Figure 15 and Figure 16
illustrate the histogram of the original images and the histogram
of the scrambled image graphically.
0.82
0.84
0.86
0.88
0.9
0.92
0.94
0.96
0.98
30
x 3
0
10
0 x
10
0
30
0 x
30
0
30
x 3
0
10
0 x
10
0
30
0 x
30
0
30
x 3
0
10
0 x
10
0
30
0 x
30
0
Birds Eiffel Stones
Scra
mb
led
Deg
ree
0.8
0.82
0.84
0.86
0.88
0.9
0.92
0.94
0.96
0.98
Leve
l 1
Leve
l 10
Leve
l 20
Leve
l 30
Leve
l 40
(1×1 pixel) (3×3 pixels) (10×10 pixels)
Scra
mb
led
Deg
ree
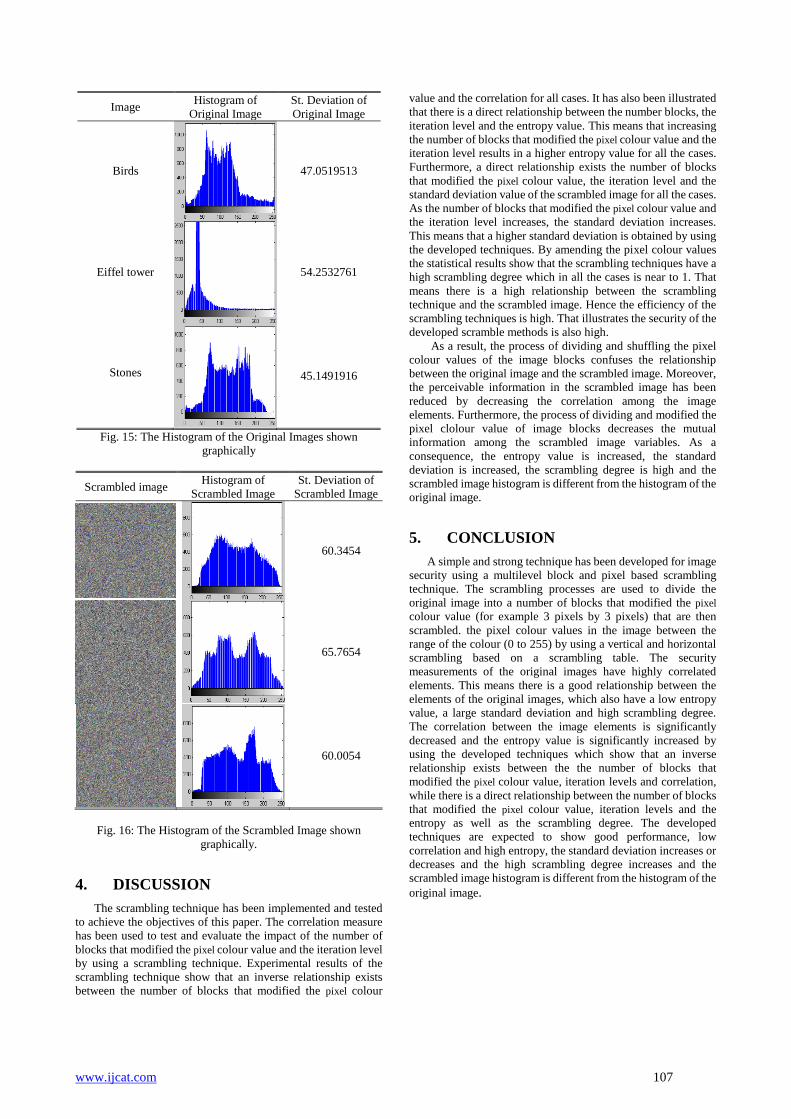
www.ijcat.com 107
Image Histogram of
Original Image
St. Deviation of
Original Image
Birds
47.0519513
Eiffel tower
54.2532761
Stones
45.1491916
Fig. 15: The Histogram of the Original Images shown
graphically
Scrambled image Histogram of
Scrambled Image
St. Deviation of
Scrambled Image
60.3454
65.7654
60.0054
Fig. 16: The Histogram of the Scrambled Image shown
graphically.
4. DISCUSSION
The scrambling technique has been implemented and tested
to achieve the objectives of this paper. The correlation measure
has been used to test and evaluate the impact of the number of
blocks that modified the pixel colour value and the iteration level
by using a scrambling technique. Experimental results of the
scrambling technique show that an inverse relationship exists
between the number of blocks that modified the pixel colour
value and the correlation for all cases. It has also been illustrated
that there is a direct relationship between the number blocks, the
iteration level and the entropy value. This means that increasing
the number of blocks that modified the pixel colour value and the
iteration level results in a higher entropy value for all the cases.
Furthermore, a direct relationship exists the number of blocks
that modified the pixel colour value, the iteration level and the
standard deviation value of the scrambled image for all the cases.
As the number of blocks that modified the pixel colour value and
the iteration level increases, the standard deviation increases.
This means that a higher standard deviation is obtained by using
the developed techniques. By amending the pixel colour values
the statistical results show that the scrambling techniques have a
high scrambling degree which in all the cases is near to 1. That
means there is a high relationship between the scrambling
technique and the scrambled image. Hence the efficiency of the
scrambling techniques is high. That illustrates the security of the
developed scramble methods is also high.
As a result, the process of dividing and shuffling the pixel
colour values of the image blocks confuses the relationship
between the original image and the scrambled image. Moreover,
the perceivable information in the scrambled image has been
reduced by decreasing the correlation among the image
elements. Furthermore, the process of dividing and modified the
pixel clolour value of image blocks decreases the mutual
information among the scrambled image variables. As a
consequence, the entropy value is increased, the standard
deviation is increased, the scrambling degree is high and the
scrambled image histogram is different from the histogram of the
original image.
5. CONCLUSION
A simple and strong technique has been developed for image
security using a multilevel block and pixel based scrambling
technique. The scrambling processes are used to divide the
original image into a number of blocks that modified the pixel
colour value (for example 3 pixels by 3 pixels) that are then
scrambled. the pixel colour values in the image between the
range of the colour (0 to 255) by using a vertical and horizontal
scrambling based on a scrambling table. The security
measurements of the original images have highly correlated
elements. This means there is a good relationship between the
elements of the original images, which also have a low entropy
value, a large standard deviation and high scrambling degree.
The correlation between the image elements is significantly
decreased and the entropy value is significantly increased by
using the developed techniques which show that an inverse
relationship exists between the the number of blocks that
modified the pixel colour value, iteration levels and correlation,
while there is a direct relationship between the number of blocks
that modified the pixel colour value, iteration levels and the
entropy as well as the scrambling degree. The developed
techniques are expected to show good performance, low
correlation and high entropy, the standard deviation increases or
decreases and the high scrambling degree increases and the
scrambled image histogram is different from the histogram of the
original image.
www.ijcat.com 108
6. REFERENCES
[1] Sekgwathe, Virginiah Talib, and Mohammad. Cyber
Crime Detection and Protection: Third World Still to
Cope-Up. in e-Technologies and Networks for
Development. 2011. Tanzania: Springer.
[2] Lin, K.T., Information hiding based on binary
encoding methods and pixel scrambling techniques.
Applied optics, 2010. 49(2): p. 220-228.
[3] Lestriandoko, N.H. and T. Wirahman. Reversible
watermarking using difference of virtual border for
digital image protection. in International Conference
Distributed Framework and Applications (DFmA).
2010. Yogyakarta: IEEE.
[4] van Renesse, R.L. Hidden and scrambled images: A
review. in Proceedings of the SPIE Electronic
Imaging. 2002. Santa Clara, CA: International Society
for Optics and Photonics.
[5] Huang, H.-f. An Image Scrambling Encryption
Algorithm Combined Arnold and Chaotic Transform.
in International Conference of China Communication
(ICCC 2010 E-BOOK). 2010. China: Scientific
Research Publishing.
[6] Fang, L. and W. YuKai. Restoring of the watermarking
image in Arnold scrambling. in Signal Processing
Systems (ICSPS), 2nd International Conference. .
2010. Dalian: IEEE.
[7] Liu, Z., et al., Image encryption by using gyrator
transform and Arnold transform. Journal of Electronic
Imaging, 2011. 20(1): p. 13 - 20.
[8] Abuturab, M.R., Securing color information using
Arnold transform in gyrator transform domain. Optics
and Lasers in Engineering, 2012. 50(5): p. 772 - 779.
[9] Wu, L., et al. Arnold Transformation Algorithm and
Anti-Arnold Transformation Algorithm. in 1st
International Conference Information Science and
Engineering (ICISE). 2009. Nanjing: IEEE.
[10] Zhou, Y., et al., Image encryption using P-Fibonacci
transform and decomposition. Optics
Communications, 2012. 285(5): p. 594-608.
[11] Wang, Y.-Y., et al., Optical image encryption based on
binary Fourier transform computer-generated
hologram and pixel scrambling technology. Optics and
Lasers in Engineering, 2007. 45(7): p. 761-765.
[12] Ye, G., Image scrambling encryption algorithm of
pixel bit based on chaos map. Pattern Recognition
Letters, 2010. 31(5): p. 347-354.
[13] Wang, Y., et al., A new chaos-based fast image
encryption algorithm. Applied soft computing, 2011.
11(1): p. 514-522.
[14] Ye, R., A novel chaos-based image encryption scheme
with an efficient permutation-diffusion mechanism.
Optics Communications, 2011. 284(22): p. 5290-5298.
[15] Wang, X., L. Teng, and X. Qin, A novel colour image
encryption algorithm based on chaos. Signal
Processing, 2012. 92(4): p. 1101-1108.
[16] Zhou, Y., K. Panetta, and S. Agaian. An image
scrambling algorithm using parameter bases M-
sequences. in International Conference on Machine
Learning and Cybernetics. 2008. Kunming: IEEE.
[17] El-Latif, A.A.A., X. Niu, and N. Wang, Chaotic image
encryption using bézier curve in DCT domain
scrambling, in Digital Enterprise and Information
Systems. 2011, Springer. p. 30-41.
[18] Gu, G.-S. and G.-Q. Han. The application of chaos and
DWT in image scrambling. in Machine Learning and
Cybernetics, 2006 International Conference on. 2006:
IEEE.
[19] Premaratne, P. and M. Premaratne, Key-based
scrambling for secure image communication, in
Emerging Intelligent Computing Technology and
Applications. 2012, Springer: Huangshan, China. p.
259-263.
[20] Qadir, F., M. Peer, and K. Khan, Digital Image
Scrambling Based on Two Dimensional Cellular
Automata. International Journal of Computer Network
and Information Security (IJCNIS), 2013. 5(2): p. 36-
41.
[21] Liehuang, Z., et al., A novel image scrambling
algorithm for digital watermarking based on chaotic
sequences. International Journal of Computer Science
and Network Security, 2006. 6(8B): p. 125-130.
[22] Abugharsa, A.B., A.S.B. Hasan Basari, and H.
Almangush, A New Image Scrambling Approach
using Block-Based on Shifted Algorithm. Australian
Journal of Basic & Applied Sciences, 2013. 7(7): p.
570-579,.
[23] Burger, W. and M. Burge, Digital image processing:
an algorithmic introduction using Java. 2008:
Springer-Verlag New York Inc.
[24] El-din., H., et al., Encryption quality analysis of the
RC5 block cipher algorithm for digital images. Optical
Engineering, 2006. 45( 10): p. 102 - 111.
[25] Shannon, C.E., Communication theory of secrecy
systems. Bell system technical journal, 1949. 28(4): p.
656-715.
[26] Ye, R. and H. Li. A novel image scrambling and
watermarking scheme based on cellular automata. in
Electronic Commerce and Security, 2008 International
Symposium on. 2008: IEEE.
[27] J. M. Guo, H. Prasetyo, H. Lee, C. C. Yao, "Image
retrieval using indexed histogram of void-and-cluster
block truncation coding", Signal Process., Jan 2016,
vol. 123, pp. 143-156.
[28] HM Almangush, MKA Ghani, AB Abugharsa.,
"Multilayer Reversible Data Hiding Based on
Histogram Shifting with High Quality and
Capacity", International Review on Computers and
Software (IRECOS)., 2015 ,vol. 8, No. 10 .