Regular Article
10
online February 7, 2014 originally published doi:10.1182/blood-2013-04-496760 2014 123: 2269-2277 Artur Bogo Chies, Alex D. Sheftel and Prem Ponka Daniel Garcia-Santos, Matthias Schranzhofer, Monika Horvathova, Mehrad Mojtahed Jaberi, Jose controls the level of regulatory heme Heme oxygenase 1 is expressed in murine erythroid cells where it http://bloodjournal.hematologylibrary.org/content/123/14/2269.full.html Updated information and services can be found at: (536 articles) Red Cells, Iron, and Erythropoiesis Articles on similar topics can be found in the following Blood collections http://bloodjournal.hematologylibrary.org/site/misc/rights.xhtml#repub_requests Information about reproducing this article in parts or in its entirety may be found online at: http://bloodjournal.hematologylibrary.org/site/misc/rights.xhtml#reprints Information about ordering reprints may be found online at: http://bloodjournal.hematologylibrary.org/site/subscriptions/index.xhtml Information about subscriptions and ASH membership may be found online at: Copyright 2011 by The American Society of Hematology; all rights reserved. of Hematology, 2021 L St, NW, Suite 900, Washington DC 20036. Blood (print ISSN 0006-4971, online ISSN 1528-0020), is published weekly by the American Society For personal use only. on April 3, 2014. by Prem Ponka bloodjournal.hematologylibrary.org From For personal use only. on April 3, 2014. by Prem Ponka bloodjournal.hematologylibrary.org From
-
Upload
independent -
Category
Documents
-
view
0 -
download
0
Transcript of Regular Article
online February 7, 2014 originally publisheddoi:10.1182/blood-2013-04-496760
2014 123: 2269-2277
Artur Bogo Chies, Alex D. Sheftel and Prem PonkaDaniel Garcia-Santos, Matthias Schranzhofer, Monika Horvathova, Mehrad Mojtahed Jaberi, Jose controls the level of regulatory hemeHeme oxygenase 1 is expressed in murine erythroid cells where it
http://bloodjournal.hematologylibrary.org/content/123/14/2269.full.htmlUpdated information and services can be found at:
(536 articles)Red Cells, Iron, and Erythropoiesis Articles on similar topics can be found in the following Blood collections
http://bloodjournal.hematologylibrary.org/site/misc/rights.xhtml#repub_requestsInformation about reproducing this article in parts or in its entirety may be found online at:
http://bloodjournal.hematologylibrary.org/site/misc/rights.xhtml#reprintsInformation about ordering reprints may be found online at:
http://bloodjournal.hematologylibrary.org/site/subscriptions/index.xhtmlInformation about subscriptions and ASH membership may be found online at:
Copyright 2011 by The American Society of Hematology; all rights reserved.of Hematology, 2021 L St, NW, Suite 900, Washington DC 20036.Blood (print ISSN 0006-4971, online ISSN 1528-0020), is published weekly by the American Society
For personal use only. on April 3, 2014. by Prem Ponka bloodjournal.hematologylibrary.orgFrom For personal use only. on April 3, 2014. by Prem Ponka bloodjournal.hematologylibrary.orgFrom
Regular Article
RED CELLS, IRON, AND ERYTHROPOIESIS
Heme oxygenase 1 is expressed in murine erythroid cells where itcontrols the level of regulatory hemeDaniel Garcia-Santos,1 Matthias Schranzhofer,1 Monika Horvathova,2 Mehrad Mojtahed Jaberi,1 Jose Artur Bogo Chies,3
Alex D. Sheftel,4 and Prem Ponka1
1Lady Davis Institute for Medical Research, Jewish General Hospital, and the Department of Physiology, McGill University, Montreal, QC, Canada;2Department of Biology, Faculty of Medicine and Dentistry, Palacky University, Olomouc, Czech Republic; 3Department of Genetics, Federal University of
Rio Grande do Sul, Porto Alegre, Rio Grande do Sul, Brazil; and 4High Impact Editing, Ottawa, ON, Canada
Key Points
• Heme oxygenase-1 levelsincrease during erythroiddifferentiation.
• Heme oxygenase-1 activelyparticipates in maintainingappropriate hemoglobinizationrates.
Heme isessential for the functionofall aerobiccells.However, it canbe toxicwhen it occurs
in a non–protein-bound form; cells maintain a fine balance between heme synthesis and
catabolism. The only physiological mechanism of heme degradation is by heme oxy-
genases (HOs). The heme-inducible isoform, HO-1, has been extensively studied in
numerous nonerythroid cells, but virtually nothing is known about the expression and
potential significance of HO-1 in developing red blood cells. We have demonstrated that
HO-1 is present in erythroid cells and that its expression is upregulated during erythroid
differentiation. Overexpression of HO-1 in erythroid cells impairs hemoglobin synthesis,
whereas HO-1 absence enhances hemoglobinization in cultured erythroid cells. Based on
these results, we conclude that HO-1 controls the regulatory heme pool at appropriate
levels for any given stage of erythroid differentiation. In summary, our study brings to light the importance of HO-1 expression for
erythroid development and expands our knowledge about the fine regulation of hemoglobin synthesis in erythroid cells. Our results
indicate that HO-1 plays an important role as a coregulator of the erythroid differentiation process. Moreover, HO-1 expressionmust
be tightly regulated during red blood cell development. (Blood. 2014;123(14):2269-2277)
Introduction
Heme is a complex of ironwith protoporphyrin IX,which is essentialfor the function of all aerobic cells. Heme serves as the prostheticgroup of numerous hemoproteins (eg, hemoglobin, myoglobin, cyto-chromes, guanylate cyclase, nitric oxide synthase) and plays animportant role in controlling protein synthesis and cell differenti-ation.1 However, when left unguarded, non–protein-bound hemepromotes free radical formation and lipid peroxidation, resulting incell damage and tissue injury.2,3 Hence, cellular heme levels aretightly controlled; this is achieved by a fine balance between hemebiosynthesis and catabolism.
The highest amounts of organismal heme (75% to 80%) are pre-sent in circulating red blood cells (RBCs) whose precursors syn-thesize heme with rates that are at least 1 order of magnitude higherthan those in the liver, the second most active heme producer inmammals. Differences in iron metabolism and in the genes encoding5-aminolevulinic acid synthase (the first enzyme in hemebiosynthesis) are responsible for the variation in the regulation andrates of heme synthesis in erythroid and nonerythroid cells.1
Heme is degraded by heme oxygenases (HOs) yielding iron,bilirubin, and carbon monoxide.4,5 Heme from RBCs is fated to becatabolized in splenic and hepatic macrophages after erythrophago-cytosis of senescent RBCs. There are 2 isoforms of HOs: HO-1 andHO-2. The constitutive form, HO-2, is membrane-bound protein
found at highest levels in the brain and testis.6 The inducible form,HO-1, is a 32.8-kDa membrane-bound enzyme found at the highestconcentrations in the liver and spleen. HO-1 is increased in animaltissues after treatment with its natural substrate heme and variousmetals, xenobiotics, endocrine factors, and synthetic metallopor-phyrins6 as well as several agents that cause oxidative damage.7-9
HO-1 promotes protection through the removal of the dangerousprooxidant “free” heme, generated in stress conditions, and releasesbiliverdin and bilirubin, which are metabolites with antioxidantproperties.3,10
HOs, in particular HO-1, have been extensively studied inhepatocytes and other nonerythroid cells.4,5 Ironically, even thoughRBCs possess the greatest amounts of heme, virtually nothing isknown about the expression of HO-1 in developing RBCs. More-over, it is unknown whether HO-1 plays any role in hemoglobinsynthesis under physiological or pathological conditions.
The aim of our study was to determine whether developingRBCs express HO-1 and, if so, characterize its role in physiologyand possibly pathophysiology of erythropoiesis. We have demon-strated that HO-1 is present in mouse erythroid cells (Ter1191 andfetal liver [FL] cells), and show that its expression is enhancedduring erythroid differentiation. Interestingly, we have also ob-served that HO-1 overexpression in murine erythroleukemia (MEL)
Submitted April 19, 2013; accepted January 30, 2014. Prepublished online as
Blood First Edition paper, February 7, 2014; DOI 10.1182/blood-2013-04-
496760.
The online version of this article contains a data supplement.
There is an Inside Blood commentary on this article in this issue.
The publication costs of this article were defrayed in part by page charge
payment. Therefore, and solely to indicate this fact, this article is hereby
marked “advertisement” in accordance with 18 USC section 1734.
© 2014 by The American Society of Hematology
BLOOD, 3 APRIL 2014 x VOLUME 123, NUMBER 14 2269
For personal use only. on April 3, 2014. by Prem Ponka bloodjournal.hematologylibrary.orgFrom

cells impairs and that its absence, in FL obtained from HO-12/2
mice, enhances hemoglobinization, respectively. Our resultsindicate that an appropriate level of HO-1 is essential for efficienterythropoiesis.
Material and methods
Animals
FVB.129S2(B6)-Hmox1tm1Poss/J mice were obtained from The JacksonLaboratory (Bar Harbor, ME) and bred in our animal facility. All animalstudies were approved by the McGill Animal Care Committee. Pregnantanimals were euthanized on embryonic day 12.5 post coitum and the embryoswere genotyped to identify those thatwereHO-12/2. Because there is no trulyerythroid cell line available, we used primary erythroid cells from control andHO-12/2 mice whenever possible. Livers from appropriate animals wereprocessed as described in the following section. For reticulocytes studies,wild-type (HO-11/1) and HO-1 knockout (HO-12/2) mice were injectedfor 3 days with phenylhydrazine (25 mg/kg). After 2 days of rest, the micewere euthanized and the blood was collected by cardiac puncture. ThiazoleOrange stainingwas performed to determine the percentage of reticulocytesin both HO-11/1 and HO-12/2 samples.11 The percentage of reticulocytesdetermined by thiazole orange staining was used to normalize the results.
Cell culture and chemicals
In experiments in which primary cells would not suffice, we settled for usingMEL cells. MEL cells were cultured as described in the supplementalMethods on the BloodWeb site. All of the experiments were conducted withboth uninduced MEL cells (0 hours) as well as cells treated with 1.8%dimethylsulfoxide (DMSO) to induce differentiation and hemoglobinization.12
Primary erythroid cells were cultured as described.13 Briefly, cells were grownfromFLs thatwereobtained fromembryonic day 12.5 embryos ofwild-type andHO-1 knockout (FVB.129[B6] background) mice. Primary FL cells were kepteither in an undifferentiated state (0 hours) or induced to terminal differentiation(24, 48, or 72 hours). The medium composition to maintain the cells in suchstates is described in further detail in the supplemental Methods. Whereindicated, cells were treated with 100 mM of the HO-1 inhibitor, tin-protoporphyrin IX (SnPP) (Frontier Scientific, Logan, UT), and 0.4 mM ofheme synthesis inhibitor, succinyl acetone (SA) (Sigma, St Louis, MO).
MEL cells’ stable transfection
We generatedMEL cells that overexpress HO-1 as described in supplementalMethods. MEL cell clones showing highest levels of HO-1 expression(MELHO-1)were used in the experiments.MEL cell clones carrying only theplasmid, without HO-1 complementary DNA insert, were used as control.
Cell membrane TfR detection
Nondifferentiated and differentiated cells werewashed twicewith phosphate-buffered saline/2% fetal calf serum and stained with fluorescence-labeledantibodies against transferrin receptor (TfR) (CD71- fluorescein isothio-cyanate; Pharmingen, San Diego, CA). Surface marker expression wasanalyzed by flow cytometry (FACSCalibur; BD Biosciences, Mississauga,Canada) as shown in supplemental Figure 1. Geometric means were used toquantify the changes in TfR expression in the different conditions tested.
Ter1192 and Ter1191 cell sorting
Femora and humeri from wild-type mice were collected and their bonemarrows extracted. Bonemarrow cells were processed following the protocoldescribed in supplemental Methods. Ter1192 and Ter1191 cells were sortedby flow cytometry (FACSVantage SE; BD Biosciences).
Heme and hemoglobin assay
Cellular heme contentwas assayed as described previously.14 The experimentresults were normalized by protein concentration. Hemoglobin assay was
performed as previously.15,16 The quantification results were normalized bycell number and cell volume. Both protocols are described in detail insupplemental Methods.
Statistical analysis
Statistical analysis was done using the software SPSS v15.0 (IBM Software,Markham, Canada). Data were evaluated applying analysis of variance andStudent t tests. Error bars of graphs represent the standard deviation of 3independent experiments (n5 3).
Results
HO-1 mRNA and protein are highly expressed in the bone
marrow Ter1191 cells
Weused the erythroidmarker Ter11917 to isolate erythroid cells frommouse bone marrow using a fluorescence-activated cell sorter. Asexpected,Ter1191cells showedahigh expressionof globinmessengerRNA (mRNA) and protein, indicating their erythroid origin(Figure 1A,C). We also found that HO-1 mRNA (Figure 1B) andprotein (Figure 1C) expressions were increased 20-fold and 2.5-fold,respectively, inTer1191cells (representing all cells of erythroid lineage)as compared with Ter1192 cells (representing the bone marrow–derived, nonerythroid cells).
HO-1 mRNA and protein levels increase during erythroid
differentiation of FL cells
Using primary erythroid cells isolated from mouse FL cells at 12.5days, we evaluated HO-1 mRNA levels during erythropoietin (EPO)-induced erythroid differentiation. As shown in Figure 1D, HO-1mRNA levels significantly increase during 48 and 72 hours of differ-entiation. Hence, we examined whether heme, whose synthesis is wellknown to increase throughout erythroid differentiation,1 could beinvolved in the enhancement of expression of HO-1 in the differ-entiating FL cells. We demonstrated (Figure 1D) that SA, a specificinhibitor18 of 5-aminolevulinic acid dehydratase (the second enzymein heme biosynthesis), added 24 hours before cell harvest, blockedthe increase inHO-1mRNA expression at 48 and 72 hours.Moreover,the expression of HO-1 protein, which became detectable by westernblot analysis at 48 hours of differentiation, was suppressed by SA(Figure 1E-F). Thus, as in virtually all cell types,19 heme inducesHO-1 expression in erythroid cells.
HO-1 overexpression impairs globin expression and activates
heme-regulated eIF2a kinase in differentiating MEL cells
Wewere surprised that the upregulation of HO-1 expression observedin this experiment (Figure 1D-F) did not interfere with hemoglobi-nization. To further examine this issue, we generated a MEL cell linestably overexpressing HO-1 (see “Material and methods”). As shownin supplemental Figure 2, MELHO-1 cells express 14-fold higherlevels of HO-1 mRNA (supplemental Figure 2A) and 10-fold moreHO-1 protein (supplemental Figure 2B) as compared with controls.After 72 hours’ incubation with DMSO, MELHO-1 cell pelletsexhibited a lower degree of redness (Figure 2A). Moreover, the HO-1overexpression resulted in a significant decrease in heme levels after72 hours of differentiation (Figure 2B). In agreement with theseobservations, we found that MELHO-1 cells also contain lower levelsof globin after 48 hours of differentiation (Figure 2C-D). Interestingly,MELHO-1 ferritin levels increased after 48 hours of differentiation
2270 GARCIA-SANTOS et al BLOOD, 3 APRIL 2014 x VOLUME 123, NUMBER 14
For personal use only. on April 3, 2014. by Prem Ponka bloodjournal.hematologylibrary.orgFrom

(Figure 2C-D). This increase was partially blocked (Figure 2C-D) bySnPP, an HO-1–specific inhibitor.20
In erythroid precursors, heme acts as a translational regulator bymodulating the activity of the heme-regulated eIF2a kinase, HRI.21
During heme deficiency, HRI is active, which in turn leads to theinhibition of globin translation. We demonstrated that after 48 hoursof stimulation of erythroid differentiation (incubation with DMSO),MELHO-1 cells contained increased levels of eIF2a-P comparedwith controls (Figure 2E-F). This indicates that HO-1 overexpressiondecreases the regulatory heme pool, which subsequently leads toHRI activation. Moreover, the observed decrease of globin proteinlevels in differentiated MELHO-1 cells (Figure 2C-D) furthersupports the conclusion that activated HRI inhibited globintranslation.
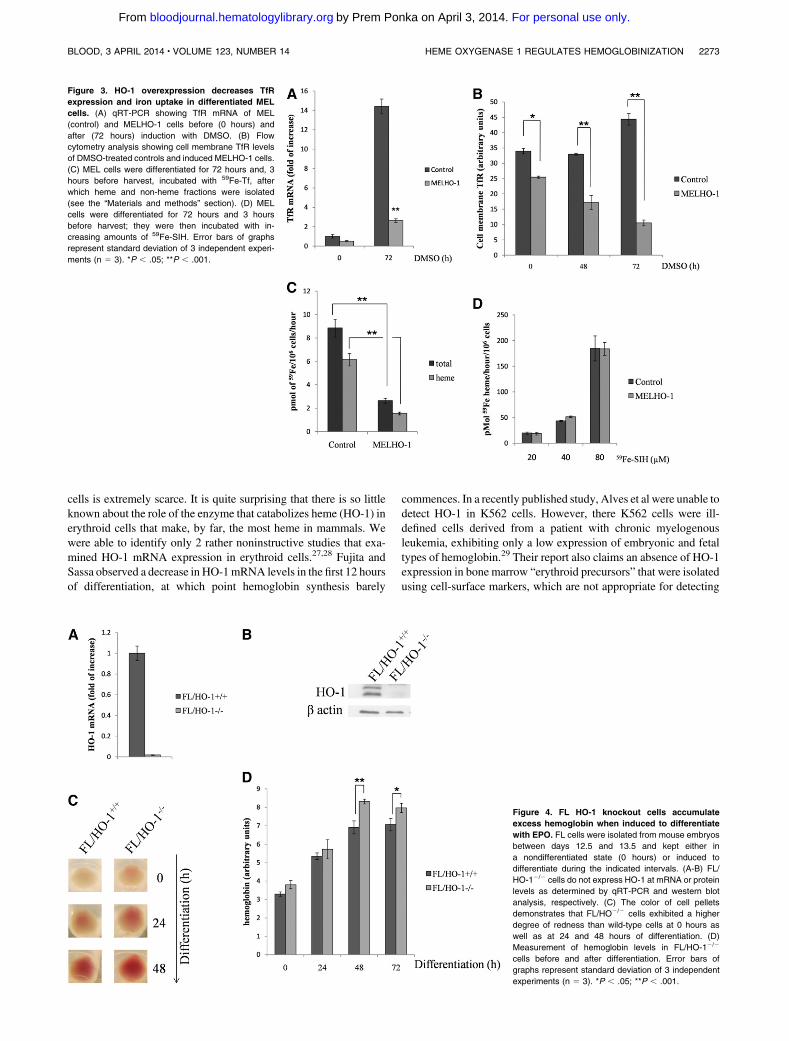
HO-1 overexpression decreases TfR levels and iron uptake in
DMSO-treated MEL cells
The rate of iron acquisition from transferrin limits and thereforecontrols the rate of heme synthesis in erythroid cells.1 The expressionof TfRs, the gatekeepers for physiological iron acquisition, is tightlyregulated1 during erythroid differentiation. After 72 hours ofDMSO-mediated differentiation, TfR mRNA expression was decreased by5.4-fold inMELHO-1 cells compared with control cells (Figure 3A).Additionally, TfR protein levels were also reduced after 48 hours ofdifferentiation comparedwith controls (Figure 2C-D).We also founda significant reduction of TfR on MELHO-1 cell membranes com-pared with control cells at 0 hours as well as 48 and 72 hours ofdifferentiation (Figure 3B). The reduction in TfR on the cell mem-brane significantly decreased the ability ofMELHO-1 cells to take up
59Fe from 59Fe-transferrin (Figure 3C) and incorporate 59Fe intoheme (Figure 3C).
HO-1 could interfere with the formation of heme and; therefore,we tested the integrity of heme biosynthesis by supplying cellswith 59Fe-salicylaldehyde isonicotinoyl hydrazone (59Fe-SIH), amembrane-permeable iron chelate that has the ability to supply ironfor ferrochelatase22-24 via bypassing the physiological transferrin-TfR pathway. There was no difference in iron incorporation intoheme between MELHO-1 and control cells when the physiologicaliron delivery pathway was bypassed using 59Fe-SIH (Figure 3D).Hence, these data indicate that HO-1 overexpression leads toa diminished iron supply for heme biosynthesis as a result ofdecreased TfR expression. Because in erythroid cells heme isneeded to maintain a high rate of TfR synthesis,25 the hemoglobi-nization defect in MELHO-1 is likely caused by the reduction inTfR levels. Additionally, we observed a slight decrease in the iron-regulatory protein 1 (IRP1) RNA-binding activity in MELHO-1with no difference in IRP2 levels when compared with control(supplemental Figure 3). These data suggest only a small con-tribution, if any, of the iron-responsive element/IRP system tothe reduction in TfR levels and the increase in ferritin levels inMELHO-1 cells (Figures 3A-B and 2C-D).
Differentiating FL/HO-12/2 cells contain higher
hemoglobin levels
The results of the preceding experiments led us to examine severalparameters of erythroid differentiation in FL cells isolated fromHO-1 knockout embryos (FL/HO-12/2). Figure 4A-B show that, inFL/HO-12/2 cells, HO-1 was not detectable at mRNA or protein
Figure 1. HO-1 and globin expression is increased
in Ter1191 cells from mouse bone marrow and
during the differentiation of FL cells. (A-B) Quanti-
tative reverse transcriptase-polymerase chain reaction
(qRT-PCR) of mouse bone marrow cells, sorted by
their expression of Ter119, showing globin and HO-1
mRNA. (C) Western blot of HO-1 and globin protein of
Ter1191/2 cells. (D) qRT-PCR showing HO-1 mRNA
levels in FL cells in a noninduced (0 hours) state or
after their differentiation at the indicated time points.
SA (0.4 mM), was added 24 hours before harvest. (E)
Representative western blot of HO-1 and globin protein
of FL cells in a noninduced (0 hours) state or after their
differentiation at the indicated time points. (F) Densi-
tometric analysis of HO-1 protein levels normalized to
b-actin. Error bars of graphs represent standard
deviation of 3 independent experiments (n 5 3).
*P , .05; **P , .001.
BLOOD, 3 APRIL 2014 x VOLUME 123, NUMBER 14 HEME OXYGENASE 1 REGULATES HEMOGLOBINIZATION 2271
For personal use only. on April 3, 2014. by Prem Ponka bloodjournal.hematologylibrary.orgFrom

levels. Interestingly, FL/HO-12/2 cell pellets exhibited a higherdegree of redness than wild-type cell pellets at 0, 24, and 48 hours ofdifferentiation (Figure 4C). Indeed, erythroid cells lacking HO-1have a higher hemoglobin content, as determined by its directmeasurement (Figure 4D).
Differentiating FL/HO-12/2 cells show increased TfR and globin
expression reduced ferritin expression
As expected, we found that FL/HO-12/2 cells express higheramounts of TfR mRNA, in particular at 24 and 48 hours (Figure 5A),and exhibit a slight increase in TfR protein levels (Figure 5D-E). Flowcytometry analysis revealed an increase in TfR presence on the mem-brane of FL/HO-12/2 cells, in particular at 0 and 24 hours after EPOtreatment (Figure 5B). Figure 5C shows a significant increase in globinmRNA in FL/HO-12/2 cells at 0 and 48 hours. The equal levels ofglobin mRNA at 24 hours can likely be explained by the presence ofoverriding, heme-independent transcription factors that drive globingene expression during the early stages of differentiation in bothcell types equally. FL/HO-12/2 cells contain more globin protein(Figure 5D-E), although the differences in its levels are smallerthan in the case of globin mRNAs. This probably indicates thattranslation is limiting in the overall process of globin geneexpression. On the other hand, ferritin protein levels were reducedin FL/HO-12/2 cells (Figure 5D-E), suggesting that the increased
flux of iron into heme leads to a decrease in ferritin translation. Anadditional factor that could cause a decrease in ferritin synthesiswould be a decrease in “free” iron levels caused by HO-1 deficiency.
HO-12/2 reticulocytes display increased TfR levels and iron
uptake and contain lower levels of eIF2a phosphorylation
Reticulocytes were isolated from both HO-11/1 and HO-12/2
mice injected with phenylhydrazine. When analyzed by flow cyto-metry, HO-12/2 reticulocytes showed a significant increase in thelevels of TfR present on the cell membrane (Figure 6A). Moreover,HO-12/2 reticulocytes took up significantly more 59Fe-Tf com-pared with HO-11/1 reticulocytes after 15 minutes of incubation(Figure 6B). Additionally, eIF2a-P levels were decreased inHO-12/2 reticulocytes (Figure 6C), suggesting an increased hemelevel and consequent reduction inHRI activity. In agreementwith that,globin protein levels were higher in HO-12/2 reticulocytes comparedwith HO-11/1 (Figure 6C).
Discussion
HO-1 has been extensively studied in hepatocytes and other non-erythroid cells.4,6,26 In contrast, the literature on HO-1 in erythroid
Figure 2. HO-1 overexpression leads to decreases in heme and globin levels and increases ferritin and eIF2a-P protein levels in MEL cells after their
differentiation. MEL cells were stably transfected with HO-1 and incubated with DMSO for 72 hours. (A) After DMSO-induced differentiation, MELHO-1 cells exhibited
a lower degree of redness than control cells. (B) After 72 hours of incubation with DMSO, MEL cells were harvested and washed, and their heme content was measured. (C)
Representative western blot showing TfR, ferritin, and globin protein levels after 48 hours of incubation with DMSO; these cells were treated with and without SnPP (an
inhibitor of HO activity). A vertical line has been inserted to indicate a repositioned gel lane. (D) Densitometric analysis of TfR, ferritin, and globin protein levels normalized to
b-actin. *,**Statistical significance when compared with control cells without SnPP. †Statistical significance when compared with MELHO-1 cells without SnPP. (E)
Representative western blot showing eIF2a-P protein levels in control and MELHO-1 cells after 48 hours of incubation with DMSO. (F) Densitometric analysis of eIF2a-P
protein levels normalized to eIF2a-total and b-actin. Error bars of graphs represent standard deviation of 3 independent experiments (n 5 3). *,†P , .05; **P , .001.
2272 GARCIA-SANTOS et al BLOOD, 3 APRIL 2014 x VOLUME 123, NUMBER 14
For personal use only. on April 3, 2014. by Prem Ponka bloodjournal.hematologylibrary.orgFrom
cells is extremely scarce. It is quite surprising that there is so littleknown about the role of the enzyme that catabolizes heme (HO-1) inerythroid cells that make, by far, the most heme in mammals. Wewere able to identify only 2 rather noninstructive studies that exa-mined HO-1 mRNA expression in erythroid cells.27,28 Fujita andSassa observed a decrease in HO-1mRNA levels in the first 12 hoursof differentiation, at which point hemoglobin synthesis barely
commences. In a recently published study, Alves et al were unable todetect HO-1 in K562 cells. However, there K562 cells were ill-defined cells derived from a patient with chronic myelogenousleukemia, exhibiting only a low expression of embryonic and fetaltypes of hemoglobin.29 Their report also claims an absence of HO-1expression in bone marrow “erythroid precursors” that were isolatedusing cell-surface markers, which are not appropriate for detecting
Figure 3. HO-1 overexpression decreases TfR
expression and iron uptake in differentiated MEL
cells. (A) qRT-PCR showing TfR mRNA of MEL
(control) and MELHO-1 cells before (0 hours) and
after (72 hours) induction with DMSO. (B) Flow
cytometry analysis showing cell membrane TfR levels
of DMSO-treated controls and induced MELHO-1 cells.
(C) MEL cells were differentiated for 72 hours and, 3
hours before harvest, incubated with 59Fe-Tf, after
which heme and non-heme fractions were isolated
(see the “Materials and methods” section). (D) MEL
cells were differentiated for 72 hours and 3 hours
before harvest; they were then incubated with in-
creasing amounts of 59Fe-SIH. Error bars of graphs
represent standard deviation of 3 independent experi-
ments (n 5 3). *P , .05; **P , .001.
Figure 4. FL HO-1 knockout cells accumulate
excess hemoglobin when induced to differentiate
with EPO. FL cells were isolated from mouse embryos
between days 12.5 and 13.5 and kept either in
a nondifferentiated state (0 hours) or induced to
differentiate during the indicated intervals. (A-B) FL/
HO-12/2 cells do not express HO-1 at mRNA or protein
levels as determined by qRT-PCR and western blot
analysis, respectively. (C) The color of cell pellets
demonstrates that FL/HO2/2 cells exhibited a higher
degree of redness than wild-type cells at 0 hours as
well as at 24 and 48 hours of differentiation. (D)
Measurement of hemoglobin levels in FL/HO-12/2
cells before and after differentiation. Error bars of
graphs represent standard deviation of 3 independent
experiments (n 5 3). *P , .05; **P , .001.
BLOOD, 3 APRIL 2014 x VOLUME 123, NUMBER 14 HEME OXYGENASE 1 REGULATES HEMOGLOBINIZATION 2273
For personal use only. on April 3, 2014. by Prem Ponka bloodjournal.hematologylibrary.orgFrom

hemoglobinized cells. Additionally, bonemarrow used in their studywas derived from patients with hematological malignancies. In thiscontext, a recent study by Contag and coworkers30 reported dis-turbed erythropoiesis in mouse spleens after the transplantation ofbone marrow cells isolated from HO-11/2 mice. It is likely that thatdecreasedmacrophageHO-1will diminish heme iron recycling fromsenescent erythrocytes and cause abnormal erythropoiesis in trans-planted mice. Moreover, these authors did not investigate HO-1
expression in erythroblasts of normal or transplanted mice. Becausethis study did not differentiate between erythroid and macrophageHO-1 function, it is not possible to relate the findings of Contag et alto our current report.
In the present work,we have demonstrated that HO-1 is present inerythroid cells and that its expression is upregulated during erythroiddifferentiation.When overexpressed inMEL cells, HO-1 impairs thehemoglobin synthesis pathway by inhibiting TfR expression and
Figure 5. FL/HO-12/2 cells express higher levels of TfR and globin and contain less ferritin after EPO-induced differentiation. (A) qRT-PCR showing TfR mRNA
levels in wild-type FL and FL/HO-12/2 cells. (B) Flow cytometry analysis showing cell membrane TfR levels of wild-type FL and FL/HO-12/2 cells at 0, 24, and 48 hours (h) of
EPO-induced differentiation. (C) qRT-PCR showing globin mRNA levels in wild-type FL and FL/HO-12/2 at 0, 24, and 48 hours of EPO-induced differentiation. (D)
Representative western blot showing TfR, ferritin, and globin protein levels of wild-type FL and FL/HO-12/2 cells at 0, 24, and 48 hours of EPO-induced differentiation. (E)
Densitometric analysis of TfR, ferritin, and globin protein levels normalized to b-actin. *Statistical significance (P, .05) when compared with FL/HO-11/1 cells at the time point
0 hours. †Statistical significance (P , .05) when compared with FL/HO-11/1 cells at time point 24 hours. wStatistical significance (P , .05) when compared with FL/HO-11/1
cells at time point 48 hours. Error bars of graphs represent standard deviation of 3 independent experiments (n 5 3). **P , .001.
Figure 6. HO-12/2 reticulocytes express more TfR at the cell membrane, have higher iron uptake, and exhibit decreased levels of phosphorylated eIF2a. Wild-type
(HO-11/1) and HO-1 knockout (HO-12/2) mice were injected with phenylhydrazine (25 mg/kg) for 3 consecutive days. After 2 days of rest, reticulocytes from HO-11/1 and
HO-12/2 mice were collected. (A) Flow cytometry analysis showing cell-membrane TfR levels of reticulocytes HO-11/1 and HO-12/2 reticulocytes. (B) HO-11/1 and HO-12/2
reticulocytes were incubated with 59Fe-Tf for 15 minutes, after which heme and non-heme fractions were isolated. (C) Representative western blot showing TfR, eIF2a-P, and
globin protein levels of HO-11/1 and HO-12/2 reticulocytes. Error bars of graphs represent standard deviation of 3 independent experiments (n 5 3). *P , .05; **P , .001.
2274 GARCIA-SANTOS et al BLOOD, 3 APRIL 2014 x VOLUME 123, NUMBER 14
For personal use only. on April 3, 2014. by Prem Ponka bloodjournal.hematologylibrary.orgFrom
consequently iron uptake, heme synthesis, and globin expression.The key element in this chain of events is the TfR, whose expressionin erythroid cells requires appropriate levels of heme for its tran-scription and likely also translation25 bymodulatingHRI activity.Onthe other hand, HO-1 absence leads to an enhancement of hemo-globin synthesis that is likely caused by increased TfR transcriptionand translation and, consequently, iron uptake.
Ter119, a molecule associated with glycophorin A, is expressedon erythroid cells at the differentiation stages from early pro-erythroblast to mature erythrocytes.17 We demonstrated that theexpression of both HO-1 mRNA (Figure 1B) and protein (Figure 1C)was increased 20-fold and 2.5-fold, respectively, in Ter1191 cellscompared with Ter1192 cells. We have also found that HO-1 in-creases after 48 and 72 hours of differentiation of FL cells (Figure 1D-F)and that this upregulation can be dramatically inhibited by the hemesynthesis inhibitor SA (Figure 1D-F). This finding strongly suggeststhat the enhancement of HO-1 levels in FL cells is mediated by heme,a well-known inducer of this enzyme in numerous cell types.5,26,31 Thisis the first report showing that this mechanism operates in erythroidcells as well. Heme is not only the essential component of hemoglobin,it is also a key regulatory molecule involved in the erythroid dif-ferentiation process. Considering these facts, it is surprising thaterythroid cells not only contain, but even upregulate, HO-1 duringtheir differentiation. Thus, HO-1 appears to be part and parcel of thephysiological erythroid differentiation program, but does not seemto, under physiological conditions, catabolize heme associated withhemoglobin.
The increase in ferritin levels inMELHO-1 cells (Figure 2C-D) islikely caused by a more efficient translation of this protein resultingfrom iron liberated from heme as an outcome of HO-1 overex-pression. This conjecturewas confirmed by ourfinding that theHO-1inhibitor, SnPP, decreased ferritin levels in MELHO-1 cells(Figure 2C-D). Intriguingly, SnPP decreased ferritin levels alsoin control of MEL cells (Figure 2C-D), suggesting that both thesynthesis of heme and its catabolism are involved in maintainingappropriate levels of heme in erythroid cells. It is tempting tospeculate that, in control cells, HO-1 regulates the level of“uncommitted” heme pool, whereas unphysiologically high levelsof HO-1 can also attack heme associated with hemoglobin or, atleast, earmarked for globin binding. This hypothesis is supportedby our finding that hemoglobin and heme levels decrease inMELHO-1 cells (Figure 2A-B).
We deemed it important to also investigate iron metabolismindices and some aspects of erythroid differentiation in erythroidcells lacking HO-1. We demonstrated that FL cells, obtained fromFL/HO-12/2 mice, accumulated more hemoglobin (Figure 4C-D)when induced to differentiate with EPO. Moreover, after 24 and 48hours of differentiation, FL/HO-12/2 had significantly increasedTfR mRNA (Figure 5A) and protein (Figure 5D-E) levels; thepresence of TfR at the cell membrane increased at 0 and 24 hoursof differentiation (Figure 5B). The likely explanation for theenhanced expression of FL/HO-12/2 cells’ TfR is their heme-mediated increase at both transcriptional and translational levels(reviewed in Ponka and Lok 25). There is a tendency for increaseduptake of iron and its incorporation into heme in FL/HO-12/2 cells(supplemental Figure 4), but this difference is statisticallysignificant only at 0 hours. At 0 and 48 hours of differentiation,globin mRNA expression was also significantly higher in FL/HO-12/2 cells (Figure 5C); this increase was associated with enlargedglobin protein levels (Figure 5D-E).
These results suggest that an expansion of an “uncommitted” or“regulatory” heme pool leads to an increase in TfR levels (Figure
5A-B,D-E) and consequently enhanced globin expression (Figure5C-E). Heme can be expected not only to promote the efficiency ofglobin translation21,32 but also its transcription.33,34 Similarly, TfRlevels and iron uptake were increased in HO-1 knockout reticulo-cytes (Figure 6A-B). We also observed a trend of increased ironincorporation into heme in HO-1 knockout reticulocytes comparedwith wild-type reticulocytes (Figure 6B). Additionally, eIF2a-P levelswere reduced in HO-1 knockout reticulocytes (Figure 6C). Therefore,the effects of HO-1 deficiency on erythroid iron metabolism and hemesynthesis are preserved up to the very late stages of the terminalerythroid differentiation.
Compared with control cells, ferritin protein expression is dra-matically reduced in both nondifferentiated and differentiated FL/HO-12/2 cells (Figure 5D-E). This finding strongly suggests that inthe absence of HO-1, there is a reduction in the cellular labile ironpool, which is highly likely as a result of increased heme stability.
HO-1–deficient mice developed anemia associated with abnor-mally low serum iron levels.35HO-1 deficiency in humans appears asan extremely rare condition, with only 2 live births reported.36,37
Bothpatients presented severe anemia.36,37Hence, our results showingthat FL/HO-12/2 cells have their hemoglobin synthesis pathwayinduced (Figures 4C-D and 5A-E) appear to be contradictory to theprevious reports.35-37 However, bothmice and humanHO-1–deficientphenotypes derive from the essential role of this enzyme in therecycling of hemoglobin iron from senescent erythrocytes by reti-culoendothelial macrophages.35,38 Macrophages recycle approx-imately 25 mg of iron daily, most of which is then transported tothe bone marrow for hemoglobin synthesis in developing erythroidcells.39Hence, it is not appropriate to compare the phenotype occurringin humans and mice lacking functional HO-1 with our resultsconducted on FL/HO-12/2 cells.
The next question is whether developing RBCs could benefit fromhaving a higher than physiological rate of hemoglobin synthesis; wesurmise that they would not. First, hyperchromia of erythrocyteswould predictably lead to abnormal membrane deformability.40
Second, it was shown that there is a critical mean corpuscularhemoglobin concentration, approximately 22 g/dL, above whichDNA replication is not possible.41 This means that the number ofcell divisions of erythroblasts with an artificially enhanced rate ofhemoglobinization would be lower; this could disturb erythropoi-esis. We have recently embarked on the generation of conditionalerythroid-specific Hmox12/2 mice with the aim of further assessingthe role of HO-1 in erythropoiesis.
The results reported here have important ramifications for ourunderstanding of erythroid differentiation, both in normal and somepathological conditions. First, it has been proposed that mostmammalian cells contain a “free” or “uncommitted” heme pool,serving both precursor and regulatory functions.1 This studystrengthens the idea that such a pool is also present in erythroidcells42,43 by demonstrating that the inhibition of HO-1 activitydecreases ferritin levels in MEL cells (Figure 2C-D and previousdiscussion). It has been estimated that the concentrations of “free”heme in young rat reticulocytes are 10 mM or lower.43 Asmentioned, the “regulatory” pool of heme is essential for synthesisof globin chains at both the transcriptional and translational levels.Additionally, in erythroid cells, heme serves as a positive feedbackregulator that maintains high TfR levels.25
Second, the aberrant expression of HO-1 may play a role in thepathophysiology of thalassemia. In the normal assembly of adulthemoglobin (a2b2), the synthesis of globin chains is very tightlycoordinated. However, in b-thalassemia, production of b-globindecreases and excess a-globin accumulates; in a-thalassemia, this
BLOOD, 3 APRIL 2014 x VOLUME 123, NUMBER 14 HEME OXYGENASE 1 REGULATES HEMOGLOBINIZATION 2275
For personal use only. on April 3, 2014. by Prem Ponka bloodjournal.hematologylibrary.orgFrom
process occurs in reverse.44,45 Unpaired globin chains that accumulatein both types of thalassemic erythroblasts have heme moleculesattached to them. a-subunits, which accumulate in b-thalassemia, arehighly unstable and susceptible to autoxidation, likely liberating theheme that would be expected to induce HO-1. Oxidative stress isa key pathogenic factor involved in damaging b-thalassemicerythroblasts,46 which also exhibit a significantly higher level ofapoptosis.47 Indeed, we found that MELHO-1 cells generate signifi-cantly higher levels of reactive oxygen species than control cells(supplemental Figure 5A) and display elevated apoptosis (supplementalFigure 5B), suggesting that elevated levels of HO-1 could play a role inthe pathophysiology of b-thalassemic erythroblasts. Additionally, ourfinding of elevated apoptosis in MELHO-1 cells is congruent with anearlier report that the inhibition of heme synthesis induces apoptosis inhuman erythroid progenitor cells.48 Also, membranes of b-thalassemicerythrocytes,49,50 and likely also erythroblasts, contain iron—asubstrate for a Fenton reaction—that can be derived from hemebecause of the enhanced activity of HO-1.
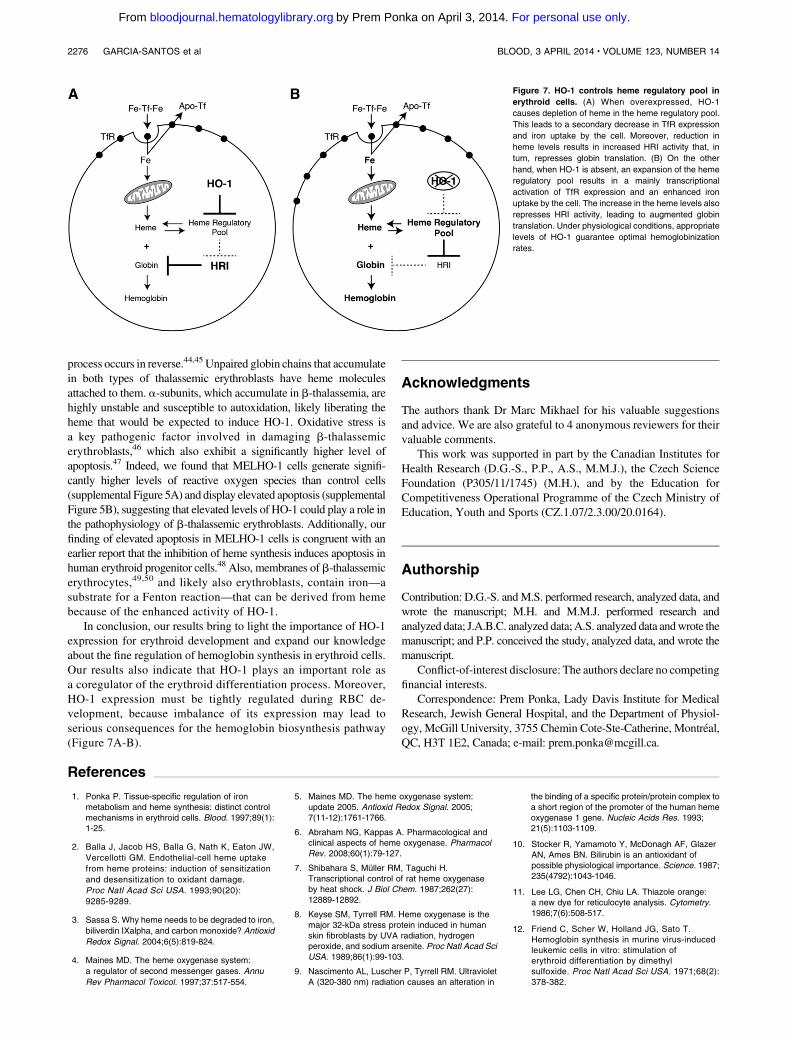
In conclusion, our results bring to light the importance of HO-1expression for erythroid development and expand our knowledgeabout the fine regulation of hemoglobin synthesis in erythroid cells.Our results also indicate that HO-1 plays an important role asa coregulator of the erythroid differentiation process. Moreover,HO-1 expression must be tightly regulated during RBC de-velopment, because imbalance of its expression may lead toserious consequences for the hemoglobin biosynthesis pathway(Figure 7A-B).
Acknowledgments
The authors thank Dr Marc Mikhael for his valuable suggestionsand advice. We are also grateful to 4 anonymous reviewers for theirvaluable comments.
This work was supported in part by the Canadian Institutes forHealth Research (D.G.-S., P.P., A.S., M.M.J.), the Czech ScienceFoundation (P305/11/1745) (M.H.), and by the Education forCompetitiveness Operational Programme of the Czech Ministry ofEducation, Youth and Sports (CZ.1.07/2.3.00/20.0164).
Authorship
Contribution: D.G.-S. andM.S. performed research, analyzed data, andwrote the manuscript; M.H. and M.M.J. performed research andanalyzed data; J.A.B.C. analyzed data; A.S. analyzed data andwrote themanuscript; and P.P. conceived the study, analyzed data, and wrote themanuscript.
Conflict-of-interest disclosure: The authors declare no competingfinancial interests.
Correspondence: Prem Ponka, Lady Davis Institute for MedicalResearch, Jewish General Hospital, and the Department of Physiol-ogy, McGill University, 3755 Chemin Cote-Ste-Catherine, Montreal,QC, H3T 1E2, Canada; e-mail: [email protected].
References
1. Ponka P. Tissue-specific regulation of ironmetabolism and heme synthesis: distinct controlmechanisms in erythroid cells. Blood. 1997;89(1):1-25.
2. Balla J, Jacob HS, Balla G, Nath K, Eaton JW,
Vercellotti GM. Endothelial-cell heme uptake
from heme proteins: induction of sensitization
and desensitization to oxidant damage.
Proc Natl Acad Sci USA. 1993;90(20):
9285-9289.
3. Sassa S. Why heme needs to be degraded to iron,
biliverdin IXalpha, and carbon monoxide? Antioxid
Redox Signal. 2004;6(5):819-824.
4. Maines MD. The heme oxygenase system:
a regulator of second messenger gases. Annu
Rev Pharmacol Toxicol. 1997;37:517-554.
5. Maines MD. The heme oxygenase system:update 2005. Antioxid Redox Signal. 2005;7(11-12):1761-1766.
6. Abraham NG, Kappas A. Pharmacological andclinical aspects of heme oxygenase. PharmacolRev. 2008;60(1):79-127.
7. Shibahara S, Muller RM, Taguchi H.Transcriptional control of rat heme oxygenaseby heat shock. J Biol Chem. 1987;262(27):12889-12892.
8. Keyse SM, Tyrrell RM. Heme oxygenase is themajor 32-kDa stress protein induced in humanskin fibroblasts by UVA radiation, hydrogenperoxide, and sodium arsenite. Proc Natl Acad SciUSA. 1989;86(1):99-103.
9. Nascimento AL, Luscher P, Tyrrell RM. UltravioletA (320-380 nm) radiation causes an alteration in
the binding of a specific protein/protein complex toa short region of the promoter of the human hemeoxygenase 1 gene. Nucleic Acids Res. 1993;21(5):1103-1109.
10. Stocker R, Yamamoto Y, McDonagh AF, GlazerAN, Ames BN. Bilirubin is an antioxidant ofpossible physiological importance. Science. 1987;235(4792):1043-1046.
11. Lee LG, Chen CH, Chiu LA. Thiazole orange:a new dye for reticulocyte analysis. Cytometry.1986;7(6):508-517.
12. Friend C, Scher W, Holland JG, Sato T.Hemoglobin synthesis in murine virus-inducedleukemic cells in vitro: stimulation oferythroid differentiation by dimethylsulfoxide. Proc Natl Acad Sci USA. 1971;68(2):378-382.
Figure 7. HO-1 controls heme regulatory pool in
erythroid cells. (A) When overexpressed, HO-1
causes depletion of heme in the heme regulatory pool.
This leads to a secondary decrease in TfR expression
and iron uptake by the cell. Moreover, reduction in
heme levels results in increased HRI activity that, in
turn, represses globin translation. (B) On the other
hand, when HO-1 is absent, an expansion of the heme
regulatory pool results in a mainly transcriptional
activation of TfR expression and an enhanced iron
uptake by the cell. The increase in the heme levels also
represses HRI activity, leading to augmented globin
translation. Under physiological conditions, appropriate
levels of HO-1 guarantee optimal hemoglobinization
rates.
2276 GARCIA-SANTOS et al BLOOD, 3 APRIL 2014 x VOLUME 123, NUMBER 14
For personal use only. on April 3, 2014. by Prem Ponka bloodjournal.hematologylibrary.orgFrom
13. Schranzhofer M, Schifrer M, Cabrera JA, et al.Remodeling the regulation of iron metabolismduring erythroid differentiation to ensure efficientheme biosynthesis. Blood. 2006;107(10):4159-4167.
14. Soe-Lin S, Sheftel AD, Wasyluk B, Ponka P.Nramp1 equips macrophages for efficient ironrecycling. Exp Hematol. 2008;36(8):929-937.
15. Dolznig H, Kolbus A, Leberbauer C, et al.Expansion and differentiation of immature mouseand human hematopoietic progenitors. MethodsMol Med. 2005;105:323-344.
16. Kowenz E, Leutz A, Doderlein G, Graf T, Beug H.ts-oncogene-transformed erythroleukemiccells: a novel test system for purifying andcharacterizing avian erythroid growth factors.Haematol Blood Transfus. 1987;31:199-209.
17. Kina T, Ikuta K, Takayama E, et al. Themonoclonal antibody TER-119 recognizesa molecule associated with glycophorin A andspecifically marks the late stages of murineerythroid lineage. Br J Haematol. 2000;109(2):280-287.
18. Ponka P, Wilczynska A, Schulman HM. Ironutilization in rabbit reticulocytes. A study usingsuccinylacetone as an inhibitor or hemesynthesis. Biochim Biophys Acta. 1982;720(1):96-105.
19. Alam J, Cook JL. How many transcription factorsdoes it take to turn on the heme oxygenase-1gene? Am J Respir Cell Mol Biol. 2007;36(2):166-174.
20. Maines MD, Trakshel GM. Differential regulationof heme oxygenase isozymes by Sn- andZn-protoporphyrins: possible relevance tosuppression of hyperbilirubinemia. BiochimBiophys Acta. 1992;1131(2):166-174.
21. Chen JJ. Regulation of protein synthesis by theheme-regulated eIF2alpha kinase: relevance toanemias. Blood. 2007;109(7):2693-2699.
22. Ponka P, Schulman HM. Acquisition of iron fromtransferrin regulates reticulocyte heme synthesis.J Biol Chem. 1985;260(27):14717-14721.
23. Laskey JD, Ponka P, Schulman HM. Control ofheme synthesis during Friend cell differentiation:role of iron and transferrin. J Cell Physiol. 1986;129(2):185-192.
24. Garrick LM, Gniecko K, Hoke JE, al-Nakeeb A,Ponka P, Garrick MD. Ferric-salicylaldehydeisonicotinoyl hydrazone, a synthetic iron chelate,alleviates defective iron utilization by reticulocytesof the Belgrade rat. J Cell Physiol. 1991;146(3):460-465.
25. Ponka P, Lok CN. The transferrin receptor: role inhealth and disease. Int J Biochem Cell Biol. 1999;31(10):1111-1137.
26. Gozzelino R, Jeney V, Soares MP. Mechanismsof cell protection by heme oxygenase-1. AnnuRev Pharmacol Toxicol. 2010;50:323-354.
27. Fujita H, Sassa S. The rapid anddecremental change in haem oxygenase mRNAduring erythroid differentiation of murineerythroleukaemia cells. Br J Haematol. 1989;73(4):557-560.
28. Alves LR, Costa ES, Sorgine MH, et al. Heme-oxygenases during erythropoiesis in K562 andhuman bone marrow cells. PLoS ONE. 2011;6(7):e21358.
29. Ponka P. In: Templeton DM, ed. Molecular andCellular Iron Transport. Boca Raton, FL: CRCPress; 2002:643-678.
30. Cao YA, Kusy S, Luong R, Wong RJ, StevensonDK, Contag CH. Heme oxygenase-1 deletionaffects stress erythropoiesis. PLoS ONE. 2011;6(5):e20634.
31. Tenhunen R. The enzymatic degradation ofheme. Semin Hematol. 1972;9(1):19-29.
32. Han AP, Yu C, Lu L, et al. Heme-regulatedeIF2alpha kinase (HRI) is required fortranslational regulation and survival of erythroidprecursors in iron deficiency. EMBO J. 2001;20(23):6909-6918.
33. Tahara T, Sun J, Igarashi K, Taketani S. Heme-dependent up-regulation of the alpha-globin geneexpression by transcriptional repressor Bach1 inerythroid cells. Biochem Biophys Res Commun.2004;324(1):77-85.
34. Tahara T, Sun J, Nakanishi K, et al. Hemepositively regulates the expression of beta-globinat the locus control region via the transcriptionalfactor Bach1 in erythroid cells. J Biol Chem. 2004;279(7):5480-5487.
35. Poss KD, Tonegawa S. Heme oxygenase 1 isrequired for mammalian iron reutilization. ProcNatl Acad Sci USA. 1997;94(20):10919-10924.
36. Kartikasari AE, Wagener FA, Yachie A,Wiegerinck ET, Kemna EH, Swinkels DW.Hepcidin suppression and defective iron recyclingaccount for dysregulation of iron homeostasisin heme oxygenase-1 deficiency [publishedcorrection appears in J Cell Mol Med. 2010;14(6B):1874]. J Cell Mol Med. 2009;13(9B):3091-3102.
37. Yachie A, Niida Y, Wada T, et al. Oxidative stresscauses enhanced endothelial cell injury in human
heme oxygenase-1 deficiency. J Clin Invest.1999;103(1):129-135.
38. Soe-Lin S, Apte SS, Andriopoulos B Jr, et al.Nramp1 promotes efficient macrophage recyclingof iron following erythrophagocytosis in vivo. ProcNatl Acad Sci USA. 2009;106(14):5960-5965.
39. Koury MJ, Ponka P. New insights intoerythropoiesis: the roles of folate, vitamin B12,and iron. Annu Rev Nutr. 2004;24:105-131.
40. Deuel JW, Lutz HU, Misselwitz B, Goede JS.Asymptomatic elevation of the hyperchromic redblood cell subpopulation is associated withdecreased red cell deformability. Ann Hematol.2012;91(9):1427-1434.
41. Yataganas X, Gahrton G, Thorell B. DNA, RNAand hemoglobin during erythroblast maturation. Acytophotometric study. Exp Cell Res. 1970;62(1):254-261.
42. Neuwirt J, Ponka P, Borova J. Evidence forthe presence of free and protein-boundnonhemoglobin heme in rabbit reticulocytes.Biochim Biophys Acta. 1972;264(2):235-244.
43. Garrick MD, Scott D, Kulju D, Romano MA, DolanKG, Garrick LM. Evidence for and consequencesof chronic heme deficiency in Belgrade ratreticulocytes. Biochim Biophys Acta. 1999;1449(2):125-136.
44. Shinar E, Rachmilewitz EA. Differences in thepathophysiology of hemolysis of alpha- and beta-thalassemic red blood cells. Ann N Y Acad Sci.1990;612:118-126.
45. Schrier SL. Pathophysiology of thalassemia. CurrOpin Hematol. 2002;9(2):123-126.
46. Rivella S, Rachmilewitz E. Future alternativetherapies for b-thalassemia. Expert Rev Hematol.2009;2(6):685.
47. Rivella S. Ineffective erythropoiesis andthalassemias. Curr Opin Hematol. 2009;16(3):187-194.
48. Muta K, Krantz SB. Inhibition of heme synthesisinduces apoptosis in human erythroid progenitorcells. J Cell Physiol. 1995;163(1):38-50.
49. Browne PV, Shalev O, Kuypers FA, et al.Removal of erythrocyte membrane iron in vivoameliorates the pathobiology of murinethalassemia. J Clin Invest. 1997;100(6):1459-1464.
50. Szuber N, Buss JL, Soe-Lin S, Felfly H, Trudel M,Ponka P. Alternative treatment paradigm forthalassemia using iron chelators. Exp Hematol.2008;36(7):773-785.
BLOOD, 3 APRIL 2014 x VOLUME 123, NUMBER 14 HEME OXYGENASE 1 REGULATES HEMOGLOBINIZATION 2277
For personal use only. on April 3, 2014. by Prem Ponka bloodjournal.hematologylibrary.orgFrom