PLANNER Article
38
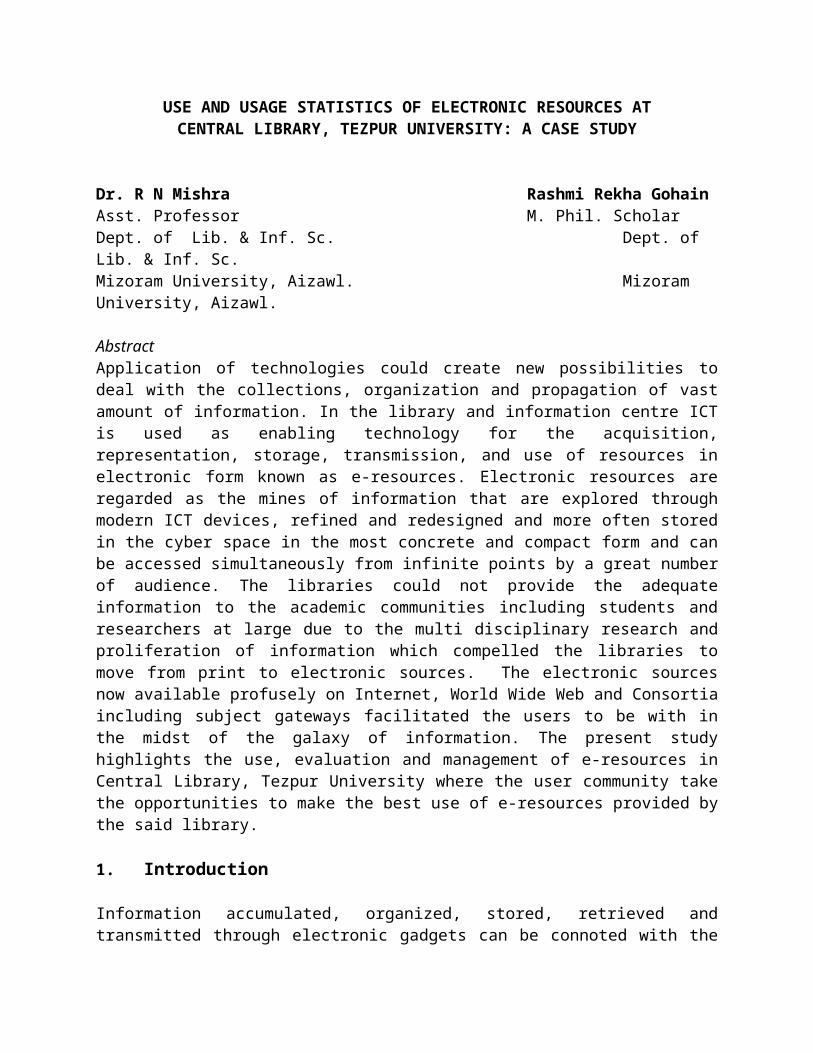
USE AND USAGE STATISTICS OF ELECTRONIC RESOURCES AT CENTRAL LIBRARY, TEZPUR UNIVERSITY: A CASE STUDY Dr. R N Mishra Rashmi Rekha Gohain Asst. Professor M. Phil. Scholar Dept. of Lib. & Inf. Sc. Dept. of Lib. & Inf. Sc. Mizoram University, Aizawl. Mizoram University, Aizawl. Abstract Application of technologies could create new possibilities to deal with the collections, organization and propagation of vast amount of information. In the library and information centre ICT is used as enabling technology for the acquisition, representation, storage, transmission, and use of resources in electronic form known as e-resources. Electronic resources are regarded as the mines of information that are explored through modern ICT devices, refined and redesigned and more often stored in the cyber space in the most concrete and compact form and can be accessed simultaneously from infinite points by a great number of audience. The libraries could not provide the adequate information to the academic communities including students and researchers at large due to the multi disciplinary research and proliferation of information which compelled the libraries to move from print to electronic sources. The electronic sources now available profusely on Internet, World Wide Web and Consortia including subject gateways facilitated the users to be with in the midst of the galaxy of information. The present study highlights the use, evaluation and management of e-resources in Central Library, Tezpur University where the user community take the opportunities to make the best use of e-resources provided by the said library. 1. Introduction Information accumulated, organized, stored, retrieved and transmitted through electronic gadgets can be connoted with the
Transcript of PLANNER Article
USE AND USAGE STATISTICS OF ELECTRONIC RESOURCES ATCENTRAL LIBRARY, TEZPUR UNIVERSITY: A CASE STUDY
Dr. R N Mishra Rashmi Rekha GohainAsst. Professor M. Phil. ScholarDept. of Lib. & Inf. Sc. Dept. of Lib. & Inf. Sc.Mizoram University, Aizawl. Mizoram University, Aizawl.
AbstractApplication of technologies could create new possibilities todeal with the collections, organization and propagation of vastamount of information. In the library and information centre ICTis used as enabling technology for the acquisition,representation, storage, transmission, and use of resources inelectronic form known as e-resources. Electronic resources areregarded as the mines of information that are explored throughmodern ICT devices, refined and redesigned and more often storedin the cyber space in the most concrete and compact form and canbe accessed simultaneously from infinite points by a great numberof audience. The libraries could not provide the adequateinformation to the academic communities including students andresearchers at large due to the multi disciplinary research andproliferation of information which compelled the libraries tomove from print to electronic sources. The electronic sourcesnow available profusely on Internet, World Wide Web and Consortiaincluding subject gateways facilitated the users to be with inthe midst of the galaxy of information. The present studyhighlights the use, evaluation and management of e-resources inCentral Library, Tezpur University where the user community takethe opportunities to make the best use of e-resources provided bythe said library.
1. Introduction
Information accumulated, organized, stored, retrieved andtransmitted through electronic gadgets can be connoted with the

term electronic information resources. E-resources has broadlybeen defined as, information accessed by a computer, may beuseful as bibliographic guides to potential sources but, as ofyet, they frequently appear as cited references in their ownright. According to IFLA ISBD (ER) 1, ‘An electronic resourceconsists of materials that are computer-controlled, includingmaterials that required the use of a peripheral (e.g. a CD-ROMplayer) attached to a computer’ and the items may or may not beused in the interactive mode. There are two types of e-resources:(i) Data (information in the form of numbers, letters, graphics,images, and sound, or a combination thereof) and (ii) Programs(instructions or routines for performing certain tasks includingthe processing of data and programs (e.g. online services,interactive multimedia) (Bavakenthy et al., 2003). E-resourcesare the electronic products that deliver a collection of datathrough text referring to full-text, e-journals, e-books, e-reports, image collection, and other multimedia products and anumber of numerical, graphical forms and these products arecommercially available though different outlets. Such productsare market oriented which are sold using electronic domain suchas Internet, e-mail, advertisements etc. Moreover, e-resourcesrefer to that kind of documents in digital formats which are madeavailable to the library users through a computer basedinformation retrieval system. E-resources is a very broad termthat includes a variety of different publishing models, includingonline databases, sources from web pages, OPACs, e-journalarticles, e-books, e-reports, e-databases, internet sources,print-on-demand (POD), electronic personal papers, e-mailmessages, newsgroup postings, newsletters, governmentpublications, electronic theses and dissertations, e-newspapers,CDs/DVDs, etc. In this context the term means “any electronicproduct that delivers collection of data be it in text,numerical, graphical, or time based, as a commercially availableresource.”
2. Statement of the ProblemThe library at present is maintaining two parallel collection ofreading materials such as traditional and electronic resources tosatisfy the varied needs of the user communities. Further, the

Library and Information Centres require availability andaccessibility to a variety of information resources and formats(such as digital full-text, sound, graphics, images, multimediaand hypertext). In view of the financial constraints almost allthe university libraries including the Central Library, TezpurUniversity are unable to procure sufficient reading and researchmaterials both in traditional and e-form for teaching andresearch purpose of the users including academicians. Moreover,the increasing volume of available publications has also createdconfusions for the library to acquire all the titles with in theallocated limited budget which caused immense problems for theusers in pursuing their teaching and research work. This hasresulted the academic communities including students andresearchers to move from print to electronic resources. Mentionmay be made that now-a-days, the e-resources are profuselyavailable through Internet, World Wide Web and Consortia andsubject gateways.
The problems associated with the library under study whether thee-resources could help the user communities to overcome theproblems in spite of inadequate funding or stringent budgetcurtailments. Moreover whether, the users are used to theInformation Technology to find out their information need from avast array of resources available in electronic form.
Therefore, the present research topic attempts to find out theuse of e-resources available in the Central Library, TezpurUniversity by the user community. This will facilitate theresearcher to find out the relevance and length of the e-resources services provided by Central Library, Tezpur Universityas well as the Librarians to compare usage statistics fromdifferent vendors; derive useful metrics such as cost-per-use,make better-informed purchasing decisions and plan infrastructuremore effectively.
3. Scope of the StudyTezpur University, Tezpur comprises 15 Departments covered under5 schools which include i) School of Management Sciences, ii)School of Energy, Environment and Natural Resources, iii) School
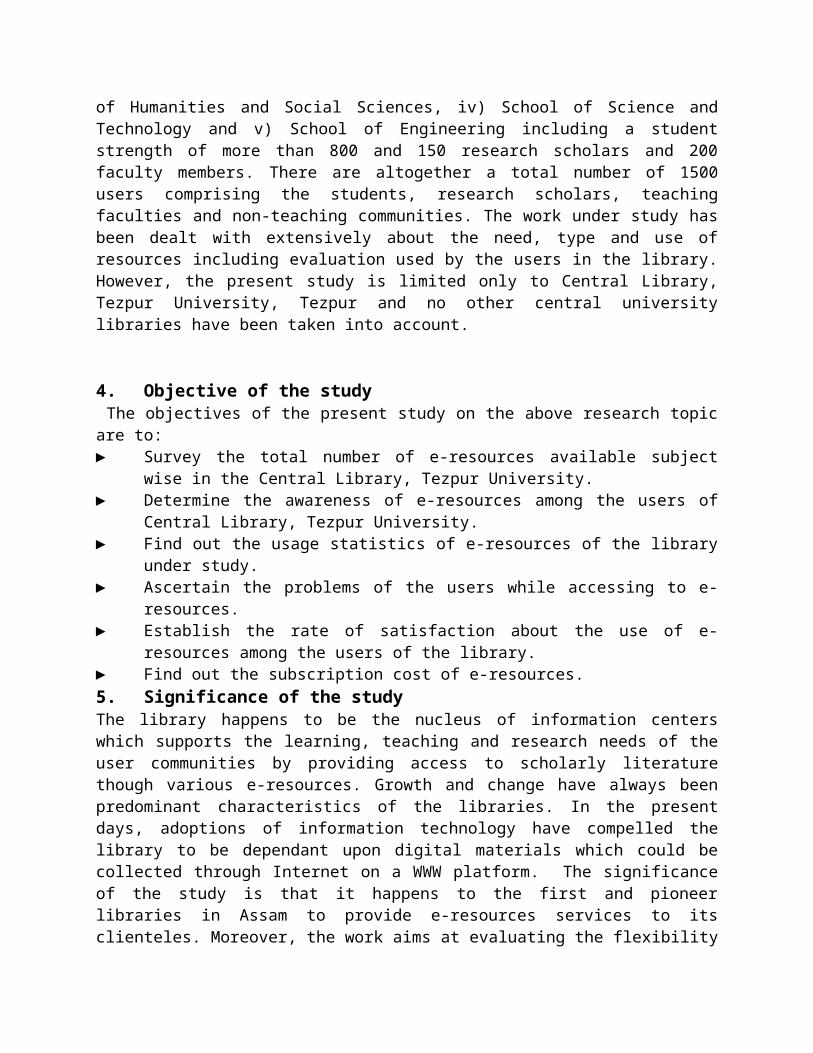
of Humanities and Social Sciences, iv) School of Science andTechnology and v) School of Engineering including a studentstrength of more than 800 and 150 research scholars and 200faculty members. There are altogether a total number of 1500users comprising the students, research scholars, teachingfaculties and non-teaching communities. The work under study hasbeen dealt with extensively about the need, type and use ofresources including evaluation used by the users in the library.However, the present study is limited only to Central Library,Tezpur University, Tezpur and no other central universitylibraries have been taken into account.
4. Objective of the study The objectives of the present study on the above research topicare to: ► Survey the total number of e-resources available subject
wise in the Central Library, Tezpur University.► Determine the awareness of e-resources among the users of
Central Library, Tezpur University.► Find out the usage statistics of e-resources of the library
under study.► Ascertain the problems of the users while accessing to e-
resources.► Establish the rate of satisfaction about the use of e-
resources among the users of the library.► Find out the subscription cost of e-resources.5. Significance of the studyThe library happens to be the nucleus of information centerswhich supports the learning, teaching and research needs of theuser communities by providing access to scholarly literaturethough various e-resources. Growth and change have always beenpredominant characteristics of the libraries. In the presentdays, adoptions of information technology have compelled thelibrary to be dependant upon digital materials which could becollected through Internet on a WWW platform. The significanceof the study is that it happens to the first and pioneerlibraries in Assam to provide e-resources services to itsclienteles. Moreover, the work aims at evaluating the flexibility
of this library in this fluid environment as well as theircapabilities in developing a process to integrate the changes into a standard library practice to meet the current and updatedemands of the users’ communities. 6. Methodology While conducting the research the following three methodologiessuch as (i) Questionnaire, (ii) Observation, and (iii) Interviewwere adopted to collect necessary data pertaining to the topic. While a structured questionnaire was designed for all types ofusers of Central Library, Tezpur University to assess the needsof the users of e-resources another structured questionnaire wasdesigned for the librarian to find out the infrastructuresdeveloped in the library for disseminating e-resources servicesto the users. Observation method was employed to make a survey ofon-site real situation of the Central Library, Tezpur Universityfollowed by Interview method to know the real life situationprevailing in the library under survey. 7. Data Analysis and FindingsE-resources are becoming important information resource intoday’s electronic environment, as they are more up-to-date, andcan be accessed anywhere, crossing all geographical boundaries.Through their various search techniques, electronic resourcesprovide extensive links to explore additional resources orrelated content. Such resources add value while conducting R & Dactivities. There has been a rapid urge of the user community toget more and more information online. The development of ICTdevices, the rapid rise of electronic databases, and modern e-book technologies have altogether changed the entire scenario ofinformatics. The user attitude to information is graduallyshifting from printed documents to electronic resources and thus,it has become an important area of research for the informationprofessionals in India.Data Analysis and findings are essential for a scientific studyand for that the scholar has taken relevant data obtained throughthe filled-in questionnaire for making analysis and drew thefollowing inferences. Analysis refers to the computation ofcertain measures along with searching for patterns ofrelationship that exist among data groups. The analysis of datain a general way involves a number of closely related operations,
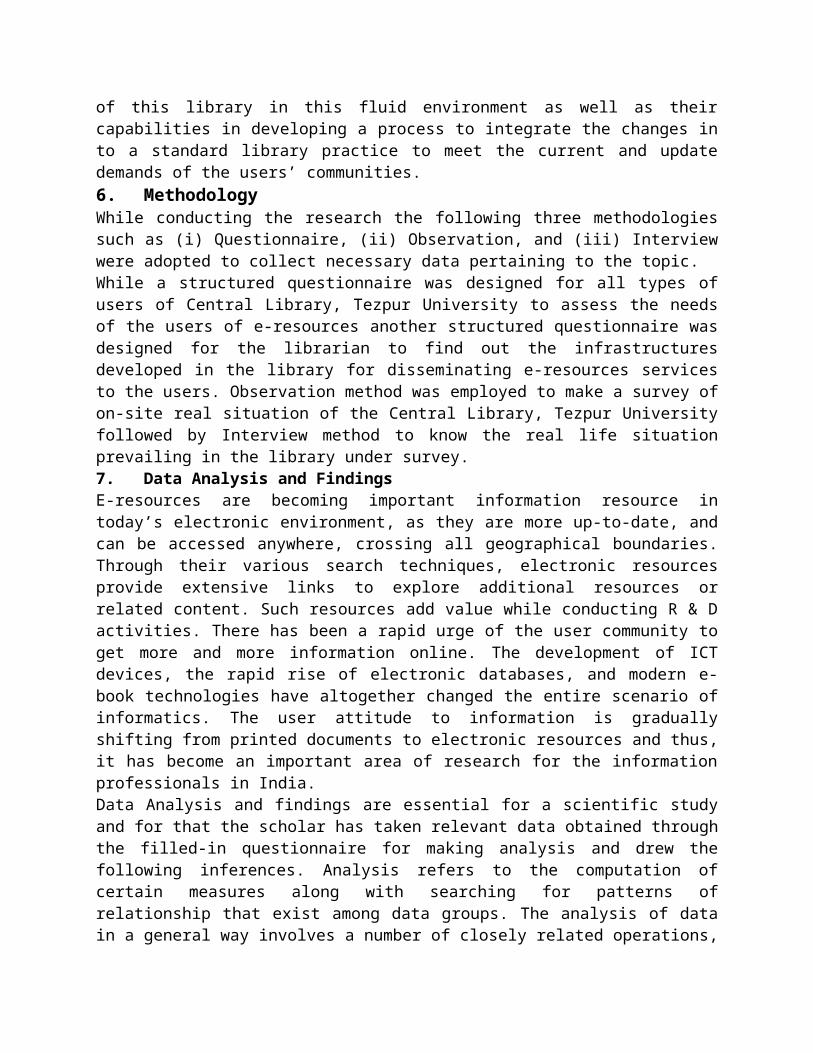
which are performed with the purpose of summarizing the collecteddata and organizing these in such a manner that they answer theresearch questions. Analysis is the product of insight into thetotal situation, paying upon the assembled facts and giving thema general significance. Its validity depends more upon commonsense, experience, background knowledge, and intelligent honestyof the interpreter than upon conformity to any set rules thatmight be formulated.7.1 Analysis by DesignationAnalysis of responses by designation of the library users’ understudy has been discussed in Table-1 supplemented with Graph-1.Altogether 410 questionnaires were distributed to the users inCentral Library of Tezpur University, which include 60 Teachers,100 Research Scholars and 250 Students of different academicdepartments. Out of 410, a total number of 293 filled-inquestionnaires were received which constitute (71.46%). Whileanalyzing the table it was revealed that, the users belonging tothe category of students have responded maximum which constitute(72.80%) followed by the responded teachers and research scholarswhich constitute (70.00%) and (69.00%) respectively. This showsthat, students give much emphasis with regard to use ofinformation Central Library, Tezpur University.
Sl.No.
Designation Questionnaire
Distributed
No. ofresponse
% ofresponse
1. Teachers 60 42 (70.00%)
2. ResearchScholar
100 69 (69.00%)
3. Students 250 182 (72.80%)
Total 410 293 (71.46%)
Table-1: Analysis by Designation
Analysis by Designation
60 4270
10069 69
250
182
72.8
050100150200250300
1 2 3Type of user
No. o
f res
pons
es
Teachers Research Scholar Students
Graph-1: Analysis by Designation
7.4 Analysis by Sources Used for Getting Information
Sl.No. Source of Information
CategoryTotalStudent Teache
rResearchScholar
1Print Material 110
(60.44%)
28(66.67%)
36(52.17%
174(59.39%
)
2Online Resources 83
(45.60%)
32(76.19%)
50(72.46%)
165(56.31%
)
3Web Resources 63
(34.62%)
21(50.00%)
33(47.83%)
117(39.93%
)
4CD-ROM 13
(07.14%)
03(07.14%)
05(07.25%)
21(07.17%
)
5Audio-Visual Tapes 11
(06.04%)
00(00.00%)
04(05.80%
15(05.12%
)
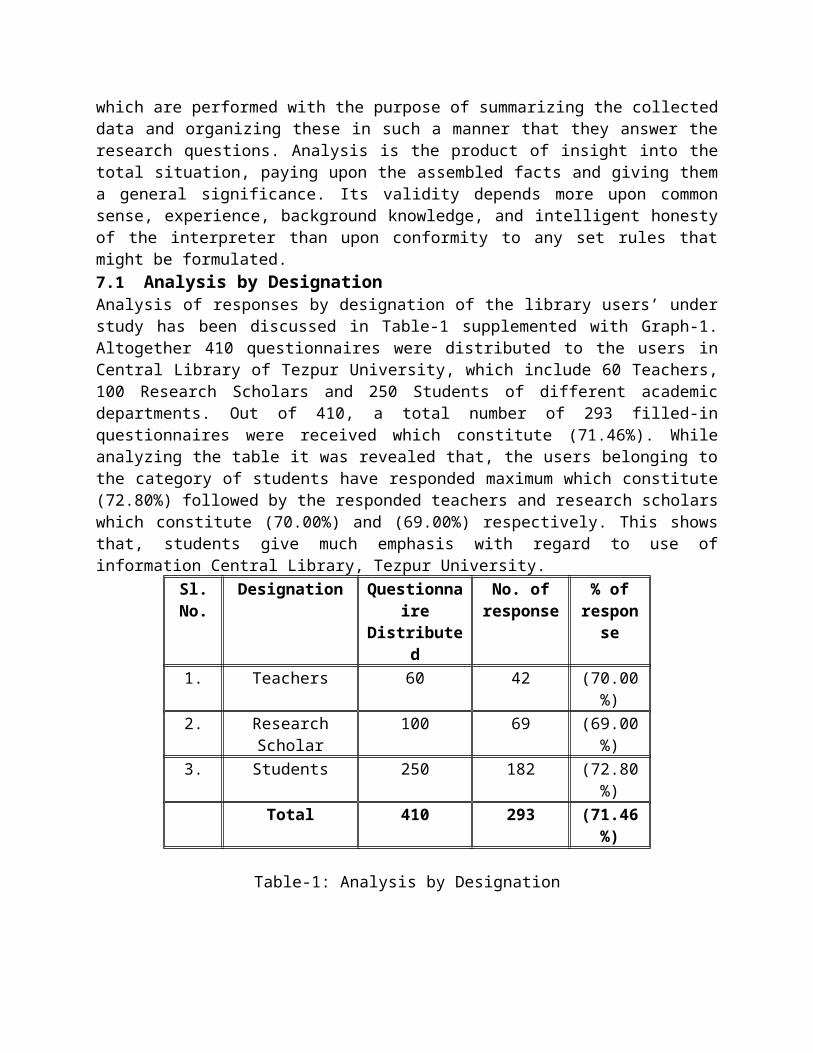
Table-23: Analysis by Preference of Source of Information
The user visits the library to fulfill the information needs ofthem by consulting the documents available in the library. Theusers of the library were asked to indicate the types ofresources which they prefer to use. Different types of
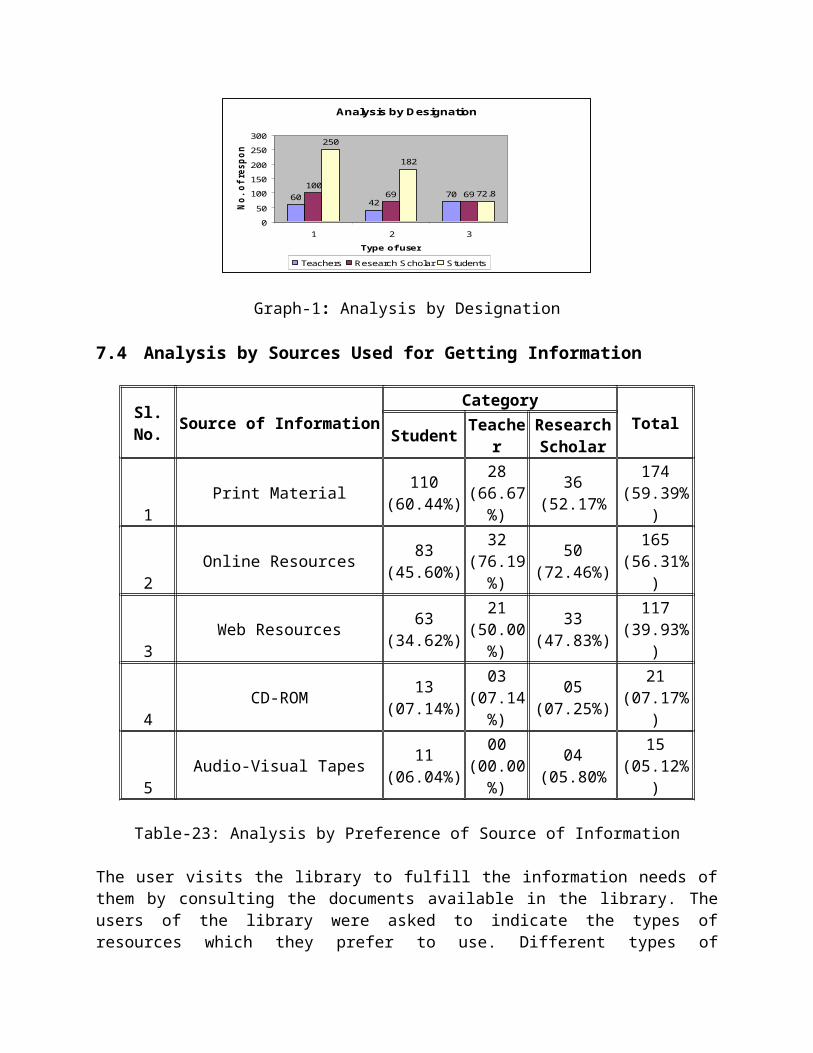
information resources were listed in the questionnaire. Table-23reveals the use of different sources and their preferences by theusers of the Central Library. The table reveals that While 174(59.39%) use print material, 165 (56.31%) and 117 (39.93%) usersof Central library are using the online and web resources of thelibrary which means e-resources are second most commonly usedresource of the library. In this information age with theavailability of more and more information accessible by the usersthrough the electronic environment, most of the users prefer touse the e-resources due to its flexible and convenient access.But due to different problems the users of Central Library,Tezpur University prefers to use print materials. Moreover 25(07.17%) uses CD-ROM and 15 (05.12%) uses Audio-Visual Tapes.
Graph-18: Analysis by Preference of Source of Information7.5 Use of e-resources
Electronic Resources are becoming very important these days asthey are more up-to-date, and can be accessed anywhere across allgeographical boundaries. e-resources add value while conductingR&D activities. Electronic resources are making a significantgrowth as part of library collection which adds potential valueto the resources of the library. Though a huge finance isinvolved in building of e-resources, it adds positive value tothe users. But without conducting a study, there is no way ofknowing whether the users accept them or not, do they find the e-

resources easy to use, reliable, and useful or are e-resourceseffectively in use. The use of e-resources of the universitylibrary has been depicted below in Table- 24 accompanying withGraph- 19 for clear vision of the statement.
Sl.No. Use of e-resources
Category
TotalStudent
Teacher
Research
Scholar
1Yes
119(65.38%)
40(95.24
%)
61(88.41%
)
220(75.09%
)
2No
63(34.62%)
02(04.76
%)
08(11.59%
)
73(24.91%
)
3Total 182
(100%)42
(100%)69
(100%)293
(100%)
Table- 24: Use of e-resources
Graph-19: Use of e-resourcesWhile analyzing the above facet it could be revealed that, 220numbers of users (75.09%) out of 293 samples opine in favour ofuse of e-resources while 73 (25%) submit their negative opinion.

This is however a positive response of the use of e-resources invarious forms for different academic purposes.
7.6 Purpose of Use of e-resources
Table-25 and Graph-20 shows the purpose of using the e-resourcesby the users of the library.
Sl.No. Purpose
Category
TotalStudent
Teacher
Research
Scholar
1To up date knowledge
107(58.79%)
20(47.62
%)
32(46.38%
)
159(54.27%
)
2
Supporting academicresearch work
28(15.38%)
36(85.71
%)
56(81.16%
)
120(40.96%
)
3Preparing notes
85(46.70%)
21(50.00
%)
06(08.70%
)
112(38.23%
)
4Writing an article
23(12.64%)
28(66.67
%)24
(34.78%
75(25.60%
)
5Preparing lectures
05(02.75%)
16(38.10
%)
04(05.80%
)
25(08.53%
)
6Writing book
06(03.30%)
13(30.95
%)
02(02.90%
)
21(07.17%
)
Table-25: Purpose of Use of e-resources
The respondents were asked to indicate the purpose of use of e-resources which differ from one user to another. The majorpurposes of use of use of e-resources are listed in Table-28which forms the quantitative study that gives an indication ofthe core purpose of e-resources used by the users of Central
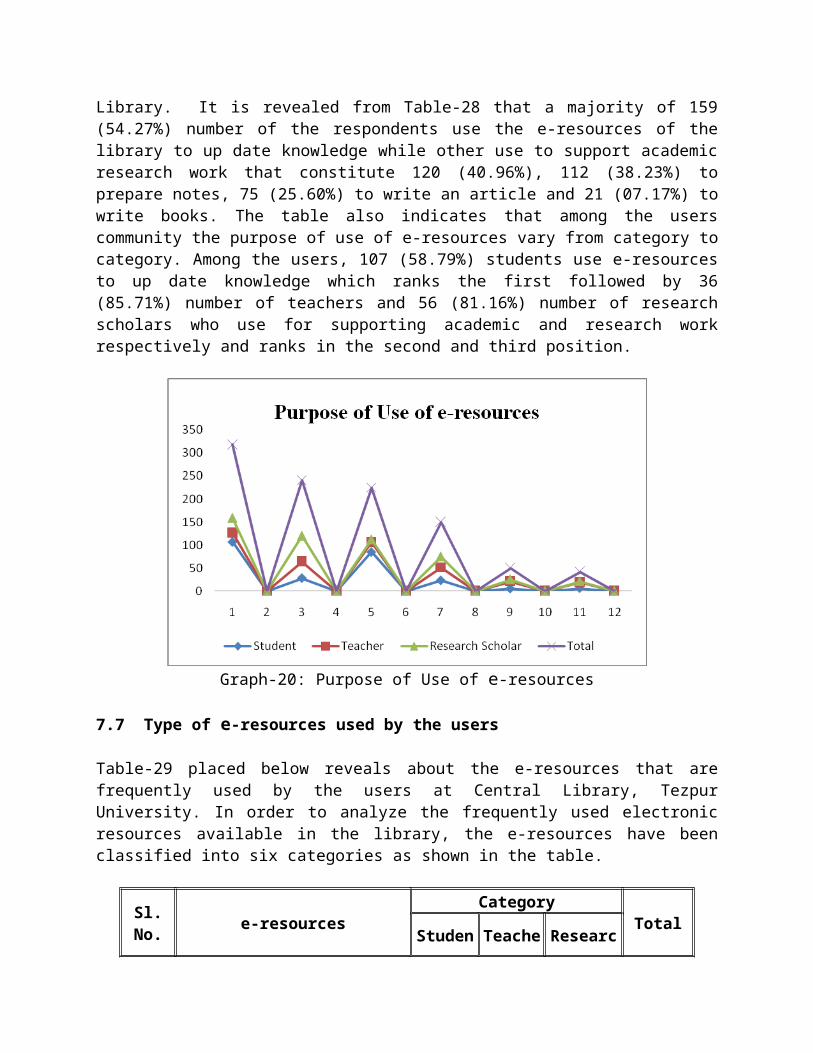
Library. It is revealed from Table-28 that a majority of 159(54.27%) number of the respondents use the e-resources of thelibrary to up date knowledge while other use to support academicresearch work that constitute 120 (40.96%), 112 (38.23%) toprepare notes, 75 (25.60%) to write an article and 21 (07.17%) towrite books. The table also indicates that among the userscommunity the purpose of use of e-resources vary from category tocategory. Among the users, 107 (58.79%) students use e-resourcesto up date knowledge which ranks the first followed by 36(85.71%) number of teachers and 56 (81.16%) number of researchscholars who use for supporting academic and research workrespectively and ranks in the second and third position.
Graph-20: Purpose of Use of e-resources
7.7 Type of e-resources used by the users
Table-29 placed below reveals about the e-resources that arefrequently used by the users at Central Library, TezpurUniversity. In order to analyze the frequently used electronicresources available in the library, the e-resources have beenclassified into six categories as shown in the table.
Sl.No. e-resources
CategoryTotalStuden Teache Researc
t r hScholar
1E-journals
85(46.70%)
05(11.90
%)
67(97.10%
)
157(53.58%
)
2E-books
101(55.49%)
07(16.67
%)
21(30.43%
)
129(44.03%
)
3Bulletin Board
09(04.95%)
32(76.19
%)00
(0.00%)
41(13.99%
)
4DVDs
15(08.24%)
03(07.14
%)
02(02.90%
)
20(06.83%
)
5CD-ROM
11(06.04%)
03(07.14
%)
02(02.90%
)
16(05.46%
)
6Floppy Diskettes
01(00.55%)
07(16.67
%)
00(00.00%
)
08(02.73%
)Total 222 57 92 371
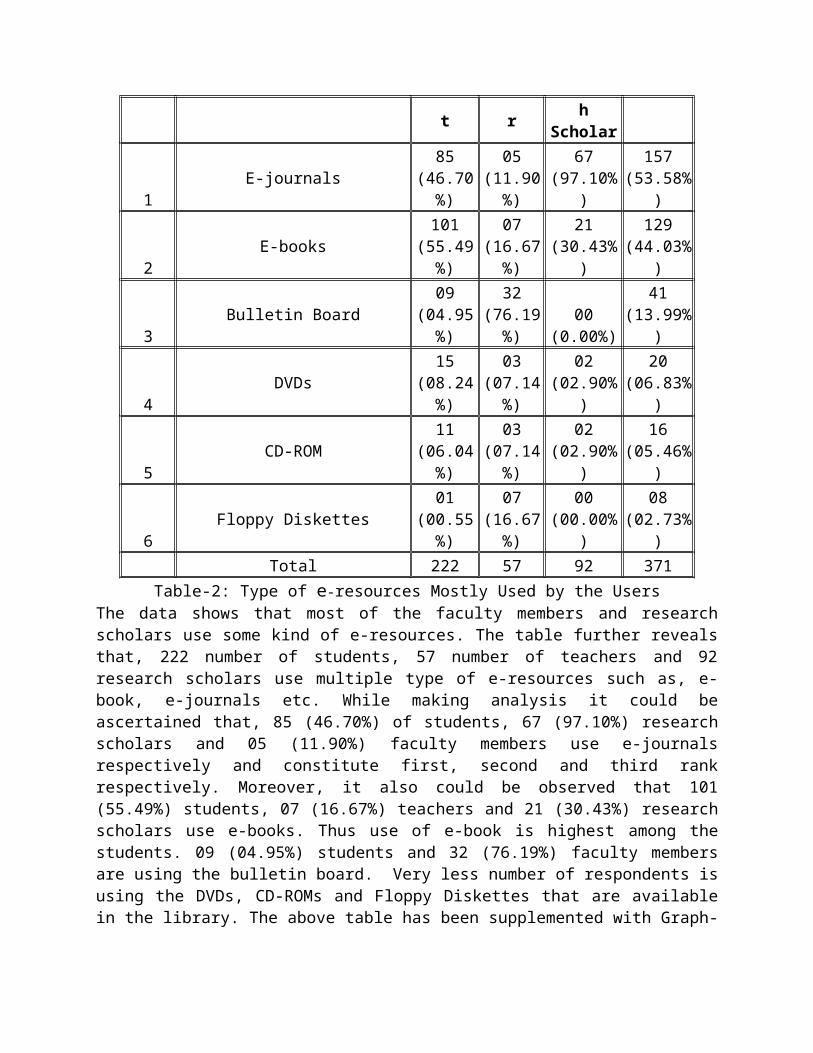
Table-2: Type of e-resources Mostly Used by the UsersThe data shows that most of the faculty members and researchscholars use some kind of e-resources. The table further revealsthat, 222 number of students, 57 number of teachers and 92research scholars use multiple type of e-resources such as, e-book, e-journals etc. While making analysis it could beascertained that, 85 (46.70%) of students, 67 (97.10%) researchscholars and 05 (11.90%) faculty members use e-journalsrespectively and constitute first, second and third rankrespectively. Moreover, it also could be observed that 101(55.49%) students, 07 (16.67%) teachers and 21 (30.43%) researchscholars use e-books. Thus use of e-book is highest among thestudents. 09 (04.95%) students and 32 (76.19%) faculty membersare using the bulletin board. Very less number of respondents isusing the DVDs, CD-ROMs and Floppy Diskettes that are availablein the library. The above table has been supplemented with Graph-
21 for clear understanding of the use of type of e-resourcesthose are mostly used by the users in the library under study.
Graph-21: Type of e-resources Mostly Used by the Users
7.8 Use of UGC- Infonet and INDEST
Sl.No.
Use of UGC-Infonet andINDEST
Category
TotalStudent
Teacher
Research
Scholar
1Yes
31(17.03%)
39(92.86%)
31(44.93)
101(34.47%
)
2No
151(82.97%)
03(07.14%)
38(55.07%
)
192(65.53%
)Table-28: Use of UGC- Infonet and INDEST
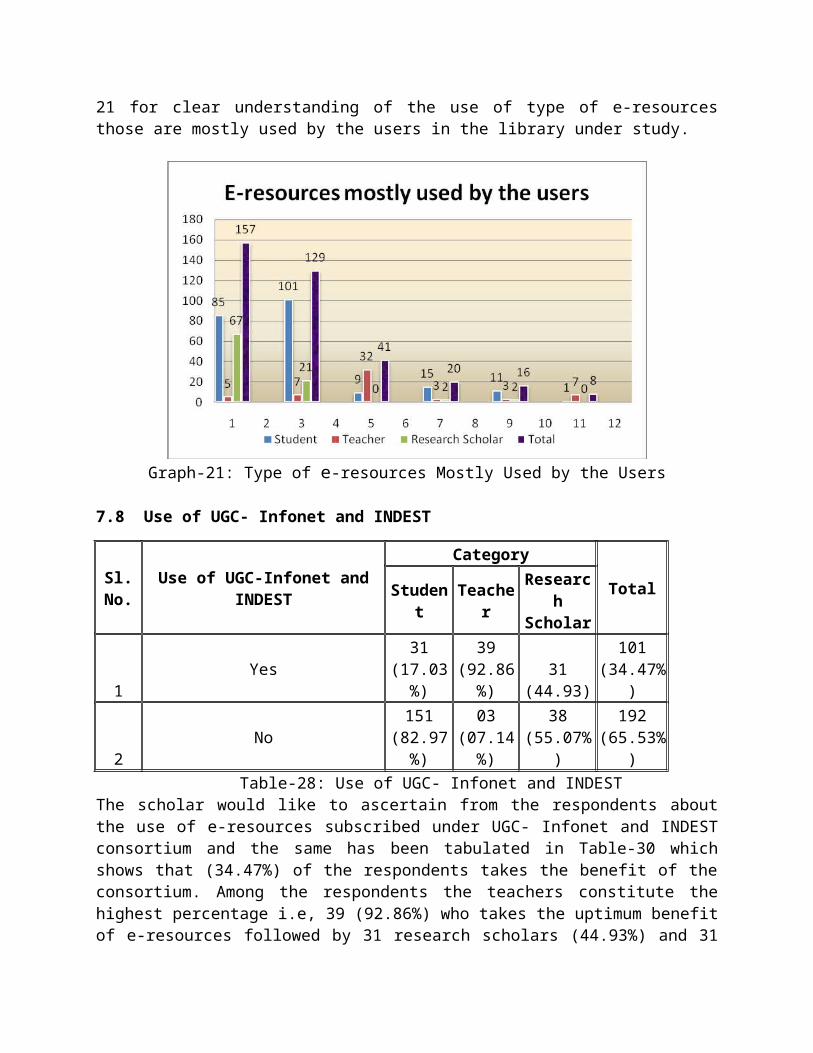
The scholar would like to ascertain from the respondents aboutthe use of e-resources subscribed under UGC- Infonet and INDESTconsortium and the same has been tabulated in Table-30 whichshows that (34.47%) of the respondents takes the benefit of theconsortium. Among the respondents the teachers constitute thehighest percentage i.e, 39 (92.86%) who takes the uptimum benefitof e-resources followed by 31 research scholars (44.93%) and 31
students (17.03%) and thus ranks in the first, second and thirdposition respectively. It is surprising to note that, a goodchunk of the respondents i.e., 192 (65.53%) in total who are notusing the e-resources of the library either due to lack ofawareness or may not feel the need of e-resources. The abovetable has been supplemented with the Graph-22 for better clarityof information.
Graph-22: Use of UGC- Infonet and INDEST
7.9 Analysis by frequency of e-resources use
Sl.No.
Frequency of e-resourcesUse
Category
TotalStudent
Teacher
Research
Scholar
1Never
07(03.85%)
01(02.38
%)
02(02.90%
)
10(03.41%
)
2Monthly
42(23.08%)
05(11.90
%)
06(08.70%
)
53(18.09%
)
3Weekly
67(36.81%)
11(26.19
%)
06(08.70%
)
84(28.67%
)4 Daily 66 25 55 146
(36.26%)
(59.52%)
(79.71%)
(49.83%)
5 Total 182(100%)
42(100%)
69(100%)
293(100%)
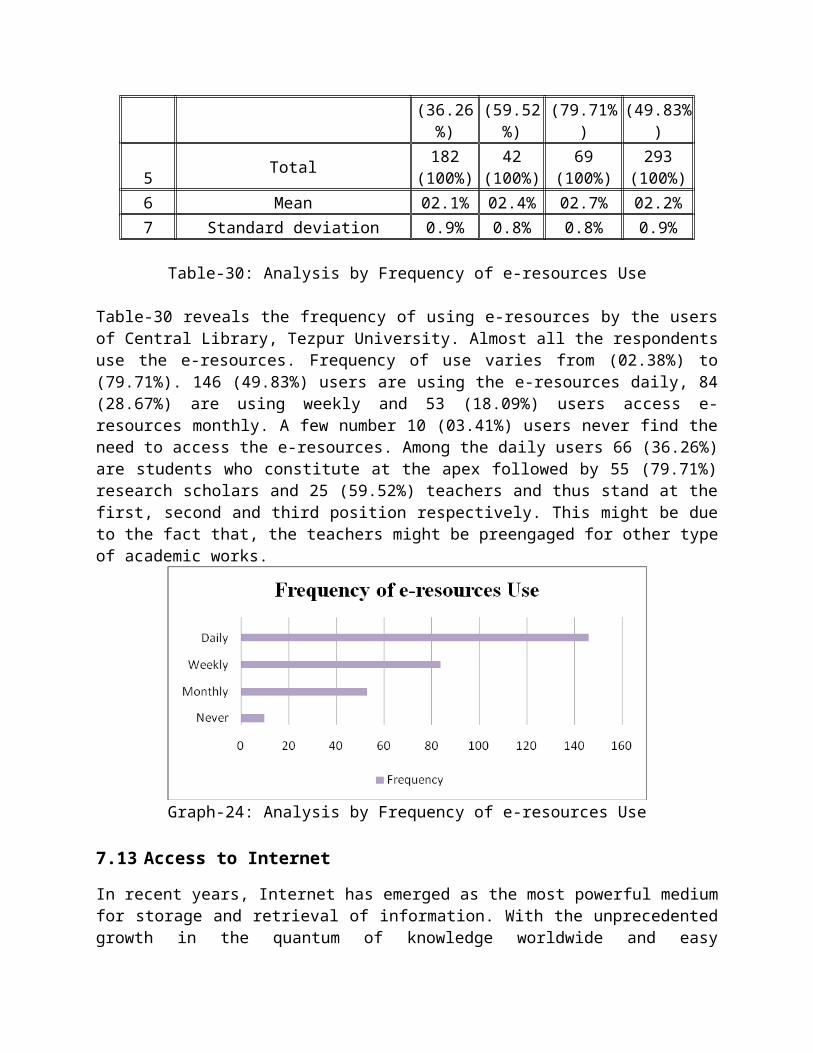
6 Mean 02.1% 02.4% 02.7% 02.2%7 Standard deviation 0.9% 0.8% 0.8% 0.9%
Table-30: Analysis by Frequency of e-resources Use
Table-30 reveals the frequency of using e-resources by the usersof Central Library, Tezpur University. Almost all the respondentsuse the e-resources. Frequency of use varies from (02.38%) to(79.71%). 146 (49.83%) users are using the e-resources daily, 84(28.67%) are using weekly and 53 (18.09%) users access e-resources monthly. A few number 10 (03.41%) users never find theneed to access the e-resources. Among the daily users 66 (36.26%)are students who constitute at the apex followed by 55 (79.71%)research scholars and 25 (59.52%) teachers and thus stand at thefirst, second and third position respectively. This might be dueto the fact that, the teachers might be preengaged for other typeof academic works.
Graph-24: Analysis by Frequency of e-resources Use
7.13 Access to Internet
In recent years, Internet has emerged as the most powerful mediumfor storage and retrieval of information. With the unprecedentedgrowth in the quantum of knowledge worldwide and easy
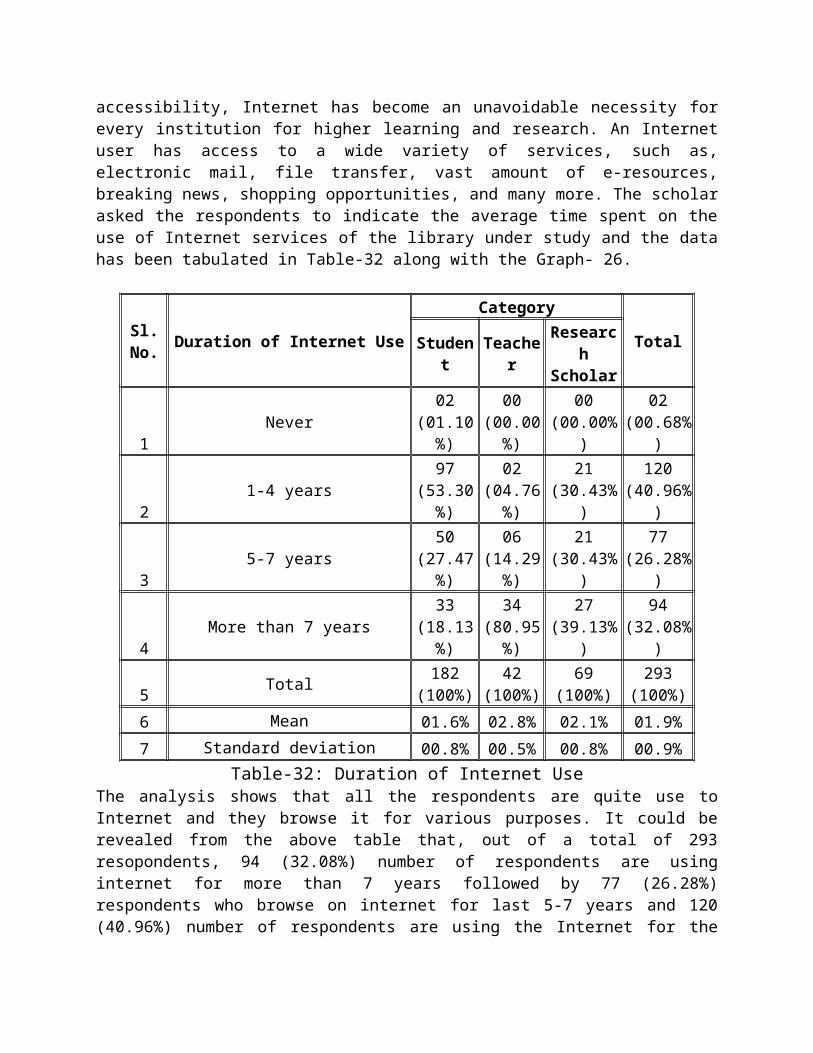
accessibility, Internet has become an unavoidable necessity forevery institution for higher learning and research. An Internetuser has access to a wide variety of services, such as,electronic mail, file transfer, vast amount of e-resources,breaking news, shopping opportunities, and many more. The scholarasked the respondents to indicate the average time spent on theuse of Internet services of the library under study and the datahas been tabulated in Table-32 along with the Graph- 26.
Sl.No. Duration of Internet Use
Category
TotalStudent
Teacher
Research
Scholar
1Never
02(01.10%)
00(00.00
%)
00(00.00%
)
02(00.68%
)
21-4 years
97(53.30%)
02(04.76
%)
21(30.43%
)
120(40.96%
)
35-7 years
50(27.47%)
06(14.29
%)
21(30.43%
)
77(26.28%
)
4More than 7 years
33(18.13%)
34(80.95
%)
27(39.13%
)
94(32.08%
)
5 Total 182(100%)
42(100%)
69(100%)
293(100%)
6 Mean 01.6% 02.8% 02.1% 01.9%7 Standard deviation 00.8% 00.5% 00.8% 00.9%
Table-32: Duration of Internet UseThe analysis shows that all the respondents are quite use toInternet and they browse it for various purposes. It could berevealed from the above table that, out of a total of 293resopondents, 94 (32.08%) number of respondents are usinginternet for more than 7 years followed by 77 (26.28%)respondents who browse on internet for last 5-7 years and 120(40.96%) number of respondents are using the Internet for the
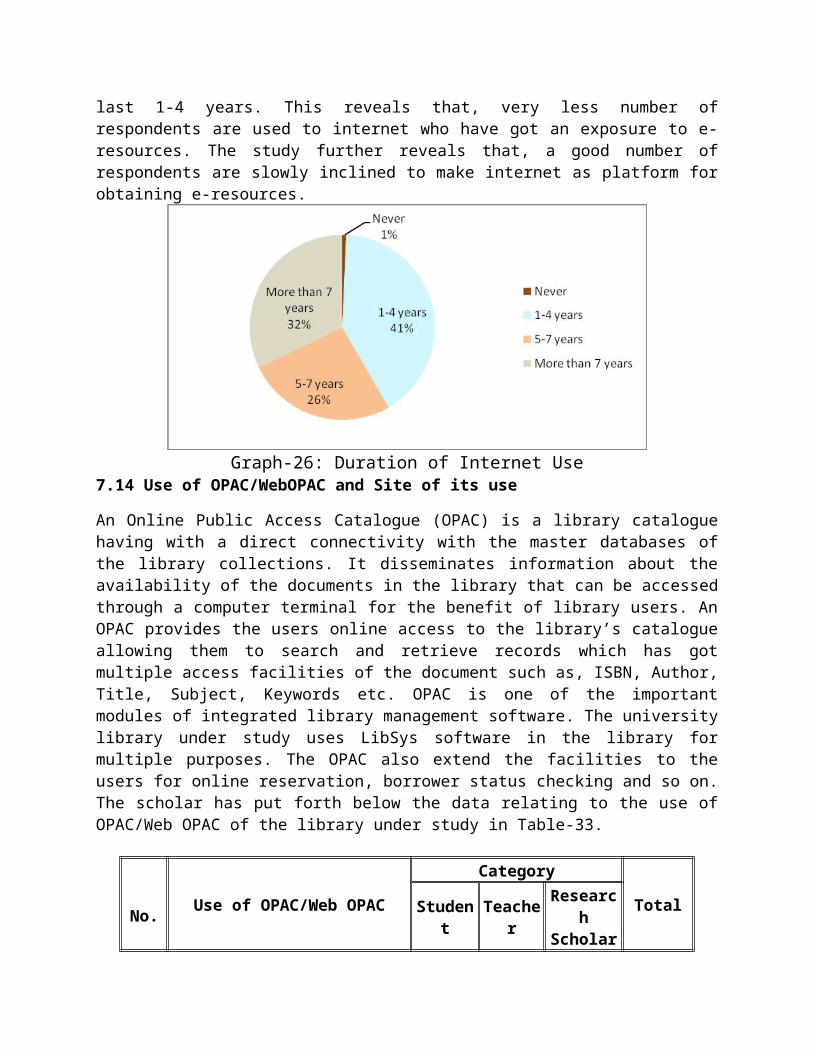
last 1-4 years. This reveals that, very less number ofrespondents are used to internet who have got an exposure to e-resources. The study further reveals that, a good number ofrespondents are slowly inclined to make internet as platform forobtaining e-resources.
Graph-26: Duration of Internet Use7.14 Use of OPAC/WebOPAC and Site of its use
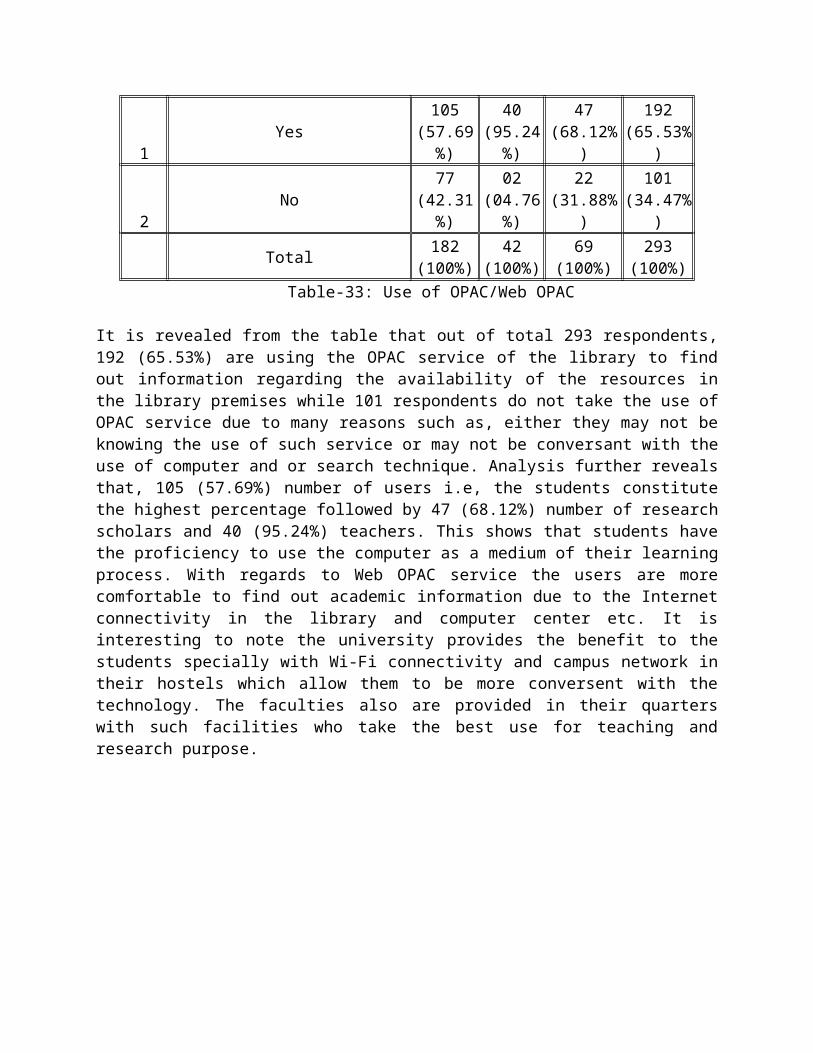
An Online Public Access Catalogue (OPAC) is a library cataloguehaving with a direct connectivity with the master databases ofthe library collections. It disseminates information about theavailability of the documents in the library that can be accessedthrough a computer terminal for the benefit of library users. AnOPAC provides the users online access to the library’s catalogueallowing them to search and retrieve records which has gotmultiple access facilities of the document such as, ISBN, Author,Title, Subject, Keywords etc. OPAC is one of the importantmodules of integrated library management software. The universitylibrary under study uses LibSys software in the library formultiple purposes. The OPAC also extend the facilities to theusers for online reservation, borrower status checking and so on.The scholar has put forth below the data relating to the use ofOPAC/Web OPAC of the library under study in Table-33.
No. Use of OPAC/Web OPAC
Category
TotalStudent
Teacher
Research
Scholar
1Yes
105(57.69%)
40(95.24
%)
47(68.12%
)
192(65.53%
)
2No
77(42.31%)
02(04.76
%)
22(31.88%
)
101(34.47%
)
Total 182(100%)
42(100%)
69(100%)
293(100%)
Table-33: Use of OPAC/Web OPAC
It is revealed from the table that out of total 293 respondents,192 (65.53%) are using the OPAC service of the library to findout information regarding the availability of the resources inthe library premises while 101 respondents do not take the use ofOPAC service due to many reasons such as, either they may not beknowing the use of such service or may not be conversant with theuse of computer and or search technique. Analysis further revealsthat, 105 (57.69%) number of users i.e, the students constitutethe highest percentage followed by 47 (68.12%) number of researchscholars and 40 (95.24%) teachers. This shows that students havethe proficiency to use the computer as a medium of their learningprocess. With regards to Web OPAC service the users are morecomfortable to find out academic information due to the Internetconnectivity in the library and computer center etc. It isinteresting to note the university provides the benefit to thestudents specially with Wi-Fi connectivity and campus network intheir hostels which allow them to be more conversent with thetechnology. The faculties also are provided in their quarterswith such facilities who take the best use for teaching andresearch purpose.
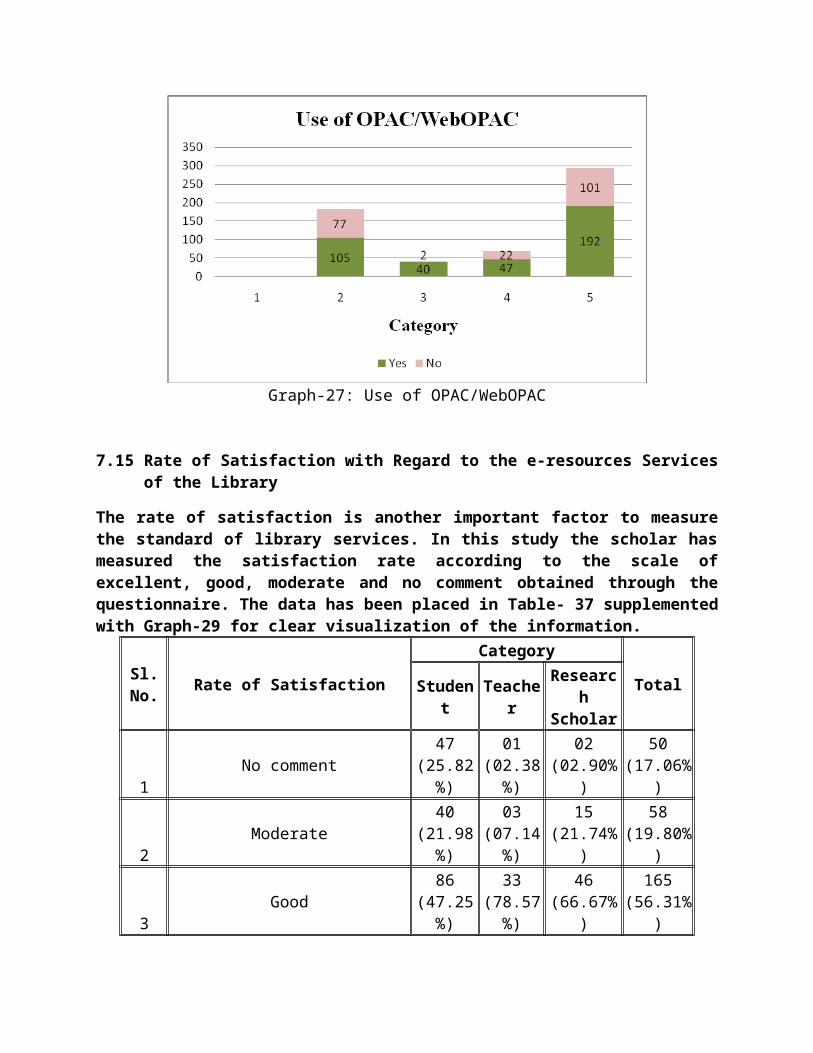
Graph-27: Use of OPAC/WebOPAC
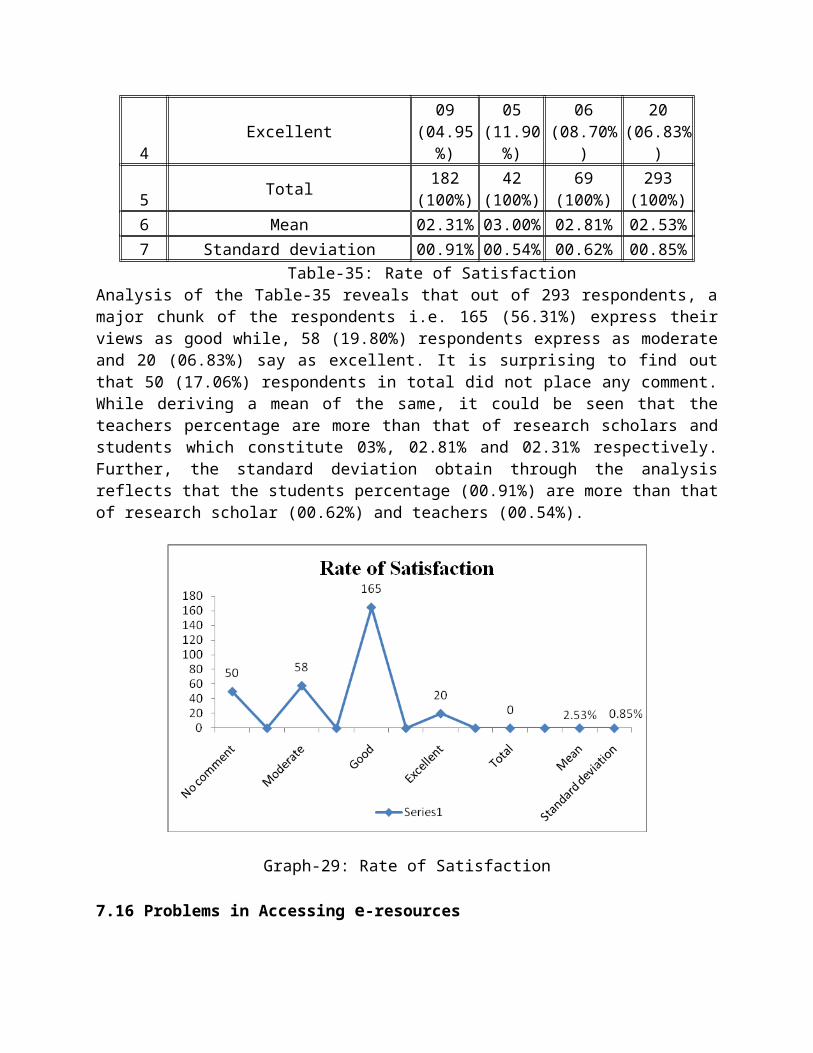
7.15 Rate of Satisfaction with Regard to the e-resources Servicesof the Library
The rate of satisfaction is another important factor to measurethe standard of library services. In this study the scholar hasmeasured the satisfaction rate according to the scale ofexcellent, good, moderate and no comment obtained through thequestionnaire. The data has been placed in Table- 37 supplementedwith Graph-29 for clear visualization of the information.
Sl.No. Rate of Satisfaction
Category
TotalStudent
Teacher
Research
Scholar
1No comment
47(25.82%)
01(02.38
%)
02(02.90%
)
50(17.06%
)
2Moderate
40(21.98%)
03(07.14
%)
15(21.74%
)
58(19.80%
)
3Good
86(47.25%)
33(78.57
%)
46(66.67%
)
165(56.31%
)
4Excellent
09(04.95%)
05(11.90
%)
06(08.70%
)
20(06.83%
)
5 Total 182(100%)
42(100%)
69(100%)
293(100%)
6 Mean 02.31% 03.00% 02.81% 02.53%7 Standard deviation 00.91% 00.54% 00.62% 00.85%
Table-35: Rate of SatisfactionAnalysis of the Table-35 reveals that out of 293 respondents, amajor chunk of the respondents i.e. 165 (56.31%) express theirviews as good while, 58 (19.80%) respondents express as moderateand 20 (06.83%) say as excellent. It is surprising to find outthat 50 (17.06%) respondents in total did not place any comment.While deriving a mean of the same, it could be seen that theteachers percentage are more than that of research scholars andstudents which constitute 03%, 02.81% and 02.31% respectively.Further, the standard deviation obtain through the analysisreflects that the students percentage (00.91%) are more than thatof research scholar (00.62%) and teachers (00.54%).
Graph-29: Rate of Satisfaction
7.16 Problems in Accessing e-resources

The study then sought to find out the main problems users hadwith accessing e-resources. Determination of the problems helpsthe library and information centers to increase the efficiencyand effectiveness of its services. To understand the problemsfacing by the users, the problem is categorized into fivedifferent categories as shown in following Table-36 followed byGraph-32 for clear understanding.
Sl.No. Problem
Category
TotalStudent
Teacher
Research
Scholar
1Accessing e-resources
112(61.54%)
25(59.52
%)
42(60.87%
)
179(61.09%
)
2
Limited number ofmachines
24(13.19%)
02(04.76
%)
02(02.90%
)
28(09.56%
)
3Slow Internet speed
79(43.41%)
20(47.62
%)
18(26.09%
)
117(39.93%
)
4Insufficient resources
33(18.13%)
17(40.48
%)
32(46.38%
)
82(27.99%
)
5
Information is not up todate
09(04.95%)
05(11.90
%)
02(02.90%
)
16(05.46%
)
6
Do not understand theprocess
11(06.04%)
00(00.00
%)
02(02.90%
)
13(04.44%
)Table-36: Problems in accessing e-resources
The scholar obtained the views of the users through thequestionnaire through Yes and No while accessing Internet. Atotal number of 179 (61.09%) express their views that they havegot some problems which has been split over Table-36 under fivebroad categories such as limited number of machines, slow
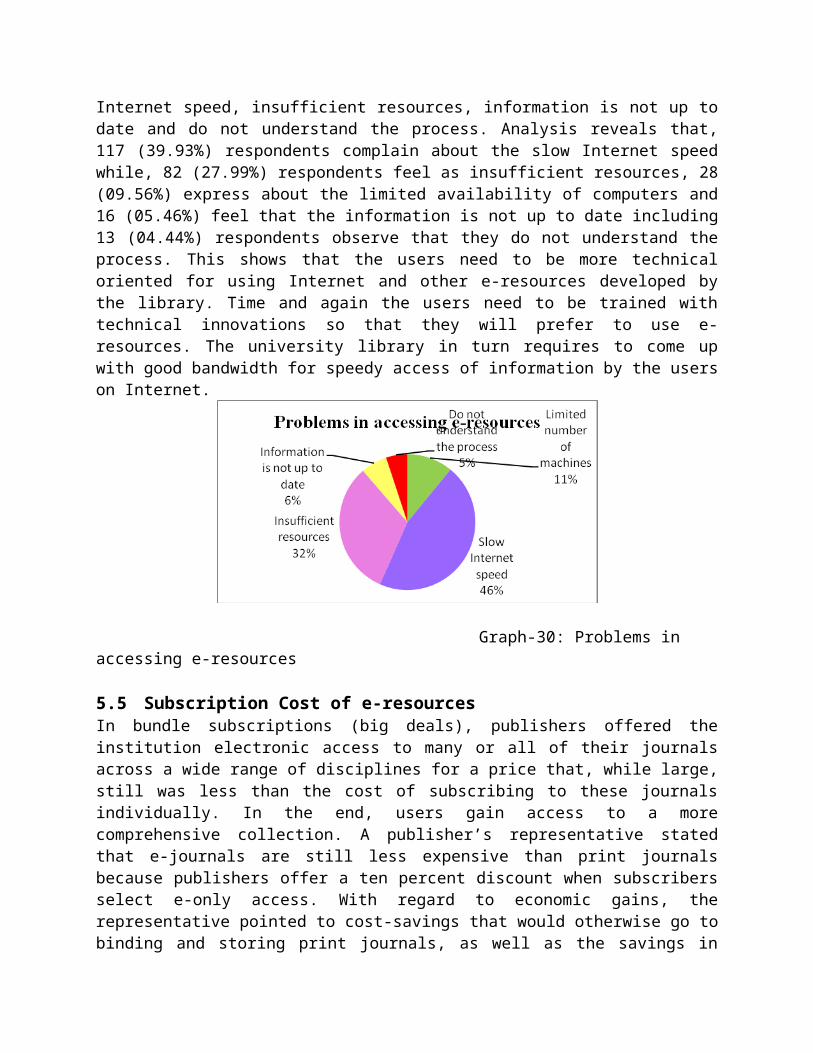
Internet speed, insufficient resources, information is not up todate and do not understand the process. Analysis reveals that,117 (39.93%) respondents complain about the slow Internet speedwhile, 82 (27.99%) respondents feel as insufficient resources, 28(09.56%) express about the limited availability of computers and16 (05.46%) feel that the information is not up to date including13 (04.44%) respondents observe that they do not understand theprocess. This shows that the users need to be more technicaloriented for using Internet and other e-resources developed bythe library. Time and again the users need to be trained withtechnical innovations so that they will prefer to use e-resources. The university library in turn requires to come upwith good bandwidth for speedy access of information by the userson Internet.
Graph-30: Problems in accessing e-resources
5.5 Subscription Cost of e-resourcesIn bundle subscriptions (big deals), publishers offered theinstitution electronic access to many or all of their journalsacross a wide range of disciplines for a price that, while large,still was less than the cost of subscribing to these journalsindividually. In the end, users gain access to a morecomprehensive collection. A publisher’s representative statedthat e-journals are still less expensive than print journalsbecause publishers offer a ten percent discount when subscribersselect e-only access. With regard to economic gains, therepresentative pointed to cost-savings that would otherwise go tobinding and storing print journals, as well as the savings in
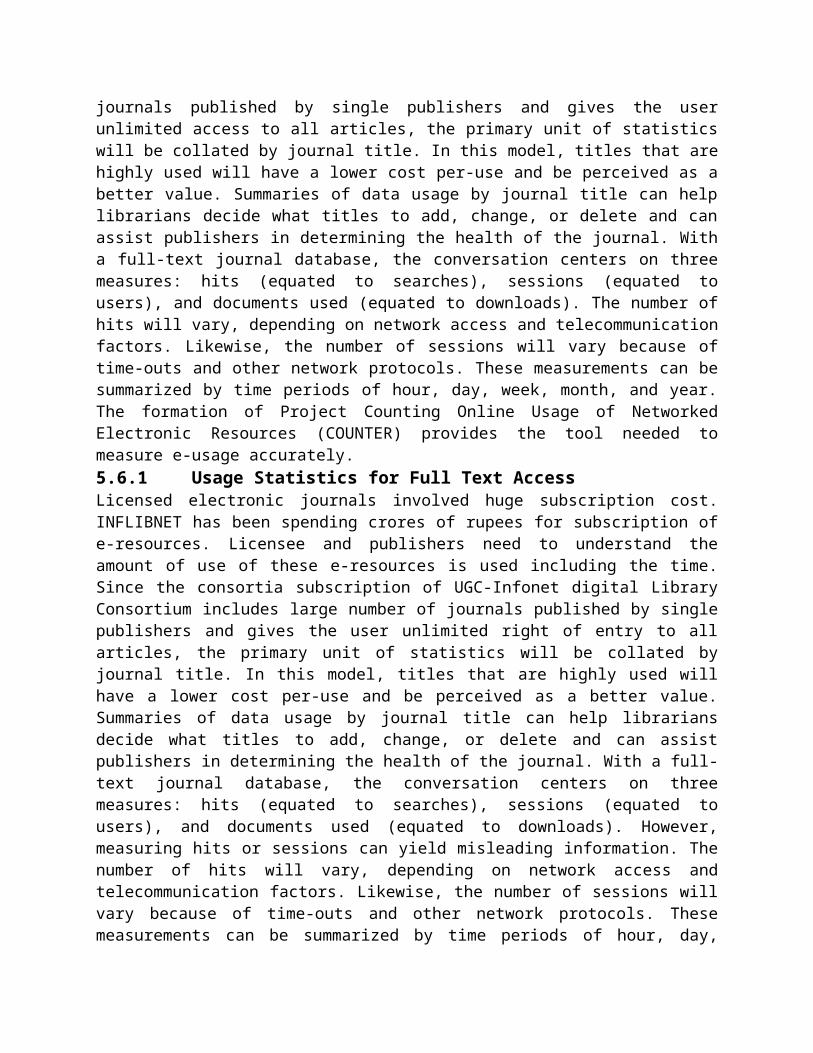
shelving capacity (Robertson, 2003). The INFLIBNET Centre spendshuge amount for the subscription of e-resources. In 2008, Rs.32,213,354 was spent for the subscription of number of e-journalsto 10 (Ten) universities located in the North Eastern region. Improved serviceThere is no doubt that e-journals opened up many exciting serviceopportunities for Central Library, Tezpur University. E-journalshave enabled it to provide for access to many journals for itsfaculty, research scholar and students to support their academicand research work. ScienceDirect usage statistics, for example,indicate that the university has used 72, 52, 856 and 61 titlesover the 12 months in 2005, 2006, 2007 and 2008 respectively.This number is nearly nine times the number of print journalsubscriptions the university had with Elsevier. This represents ahuge growth in the collection of the university and showstremendous savings in terms of document delivery and additionalsubscriptions. E-journal titles greatly exceed the number oftitles the library previously subscribed to in print. The greatmajority of ScienceDirect titles that were available to theuniversity in 2004 did not have corresponding current printsubscriptions. Access to these of e-journals supports thefaculty/student/research scholars in a effective and efficientmanner. It contains almost any title needed to maintainaccreditation standards. Enhanced accessE-journals have helped the Central Library, Tezpur University toimprove its services to the users. Today most of the users ofCentral Library prefer to use the e-resources of the library dueto its convenient access facility of 24-hour accessibility,remote and convenient access anytime and anywhere. Increased usageThe increased value of Central Library’s e-journal collection isalso evident in their use (Graph 4). E-journals are used morefrequently than print journals. It is certainly true that theusage statistics provided by publishers such as Elsevier indicateextensive performance. However, the high overall volume useconceals varied levels of use – a small number of titles haveexperienced the heaviest use while there are a large number oftitles with few, or zero, accesses. Journal usage indicates that
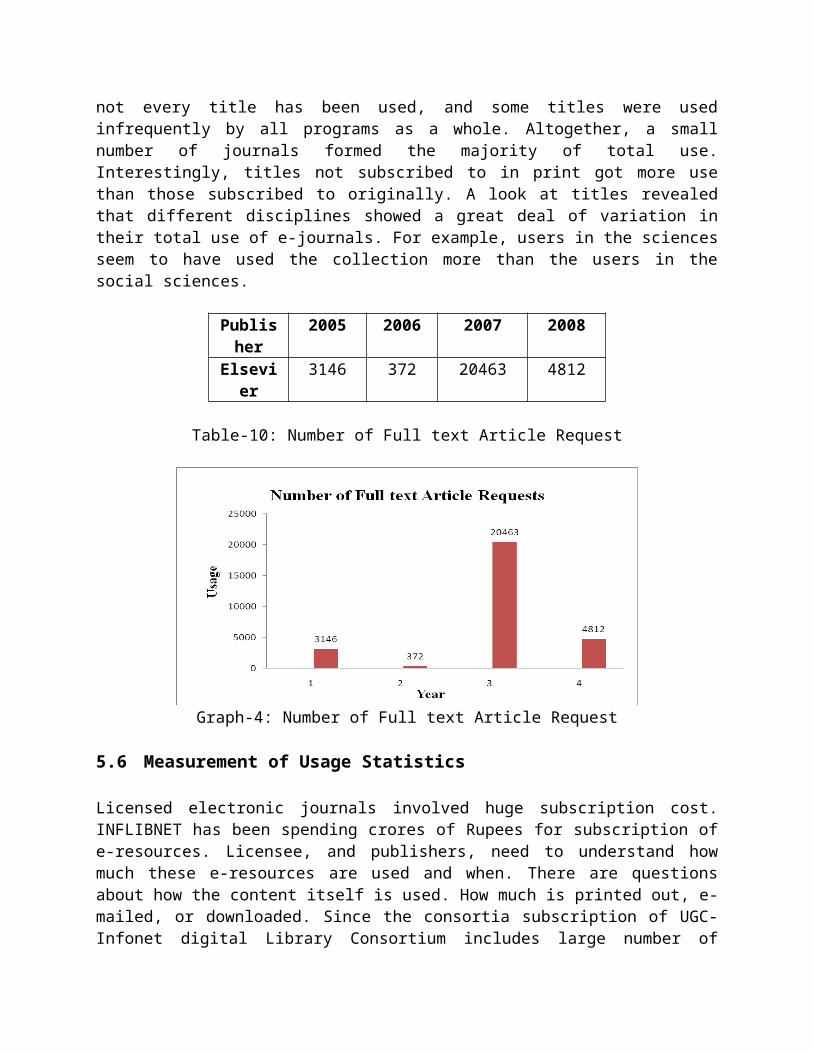
not every title has been used, and some titles were usedinfrequently by all programs as a whole. Altogether, a smallnumber of journals formed the majority of total use.Interestingly, titles not subscribed to in print got more usethan those subscribed to originally. A look at titles revealedthat different disciplines showed a great deal of variation intheir total use of e-journals. For example, users in the sciencesseem to have used the collection more than the users in thesocial sciences.
Publisher
2005 2006 2007 2008
Elsevier
3146 372 20463 4812
Table-10: Number of Full text Article Request
Graph-4: Number of Full text Article Request
5.6 Measurement of Usage Statistics
Licensed electronic journals involved huge subscription cost.INFLIBNET has been spending crores of Rupees for subscription ofe-resources. Licensee, and publishers, need to understand howmuch these e-resources are used and when. There are questionsabout how the content itself is used. How much is printed out, e-mailed, or downloaded. Since the consortia subscription of UGC-Infonet digital Library Consortium includes large number of
journals published by single publishers and gives the userunlimited access to all articles, the primary unit of statisticswill be collated by journal title. In this model, titles that arehighly used will have a lower cost per-use and be perceived as abetter value. Summaries of data usage by journal title can helplibrarians decide what titles to add, change, or delete and canassist publishers in determining the health of the journal. Witha full-text journal database, the conversation centers on threemeasures: hits (equated to searches), sessions (equated tousers), and documents used (equated to downloads). The number ofhits will vary, depending on network access and telecommunicationfactors. Likewise, the number of sessions will vary because oftime-outs and other network protocols. These measurements can besummarized by time periods of hour, day, week, month, and year.The formation of Project Counting Online Usage of NetworkedElectronic Resources (COUNTER) provides the tool needed tomeasure e-usage accurately.5.6.1 Usage Statistics for Full Text AccessLicensed electronic journals involved huge subscription cost.INFLIBNET has been spending crores of rupees for subscription ofe-resources. Licensee and publishers need to understand theamount of use of these e-resources is used including the time.Since the consortia subscription of UGC-Infonet digital LibraryConsortium includes large number of journals published by singlepublishers and gives the user unlimited right of entry to allarticles, the primary unit of statistics will be collated byjournal title. In this model, titles that are highly used willhave a lower cost per-use and be perceived as a better value.Summaries of data usage by journal title can help librariansdecide what titles to add, change, or delete and can assistpublishers in determining the health of the journal. With a full-text journal database, the conversation centers on threemeasures: hits (equated to searches), sessions (equated tousers), and documents used (equated to downloads). However,measuring hits or sessions can yield misleading information. Thenumber of hits will vary, depending on network access andtelecommunication factors. Likewise, the number of sessions willvary because of time-outs and other network protocols. Thesemeasurements can be summarized by time periods of hour, day,
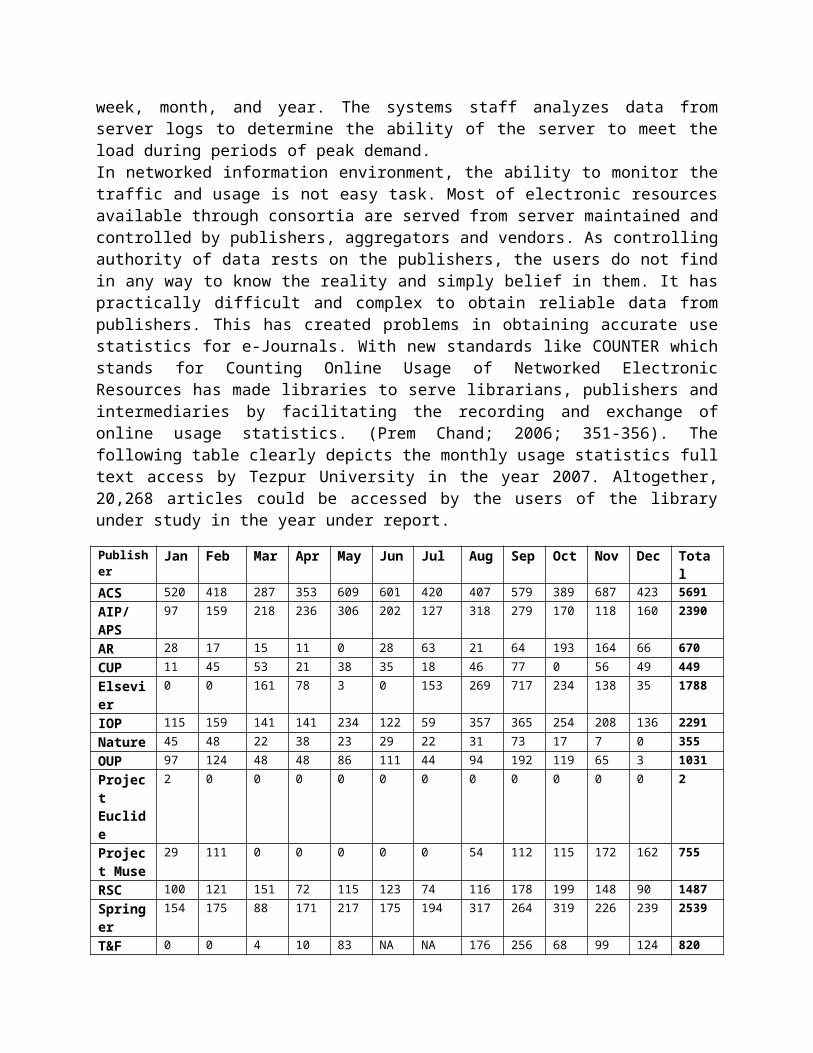
week, month, and year. The systems staff analyzes data fromserver logs to determine the ability of the server to meet theload during periods of peak demand.In networked information environment, the ability to monitor thetraffic and usage is not easy task. Most of electronic resourcesavailable through consortia are served from server maintained andcontrolled by publishers, aggregators and vendors. As controllingauthority of data rests on the publishers, the users do not findin any way to know the reality and simply belief in them. It haspractically difficult and complex to obtain reliable data frompublishers. This has created problems in obtaining accurate usestatistics for e-Journals. With new standards like COUNTER whichstands for Counting Online Usage of Networked ElectronicResources has made libraries to serve librarians, publishers andintermediaries by facilitating the recording and exchange ofonline usage statistics. (Prem Chand; 2006; 351-356). Thefollowing table clearly depicts the monthly usage statistics fulltext access by Tezpur University in the year 2007. Altogether,20,268 articles could be accessed by the users of the libraryunder study in the year under report. Publisher
Jan Feb Mar Apr May Jun Jul Aug Sep Oct Nov Dec Total
ACS 520 418 287 353 609 601 420 407 579 389 687 423 5691AIP/APS
97 159 218 236 306 202 127 318 279 170 118 160 2390
AR 28 17 15 11 0 28 63 21 64 193 164 66 670CUP 11 45 53 21 38 35 18 46 77 0 56 49 449Elsevier
0 0 161 78 3 0 153 269 717 234 138 35 1788
IOP 115 159 141 141 234 122 59 357 365 254 208 136 2291Nature 45 48 22 38 23 29 22 31 73 17 7 0 355OUP 97 124 48 48 86 111 44 94 192 119 65 3 1031Project Euclide
2 0 0 0 0 0 0 0 0 0 0 0 2
Project Muse
29 111 0 0 0 0 0 54 112 115 172 162 755
RSC 100 121 151 72 115 123 74 116 178 199 148 90 1487Springer
154 175 88 171 217 175 194 317 264 319 226 239 2539
T&F 0 0 4 10 83 NA NA 176 256 68 99 124 820
Total 1198
1377 1188
1179
1714
1426
1174 2206
3156
2075
2088
1487
20268
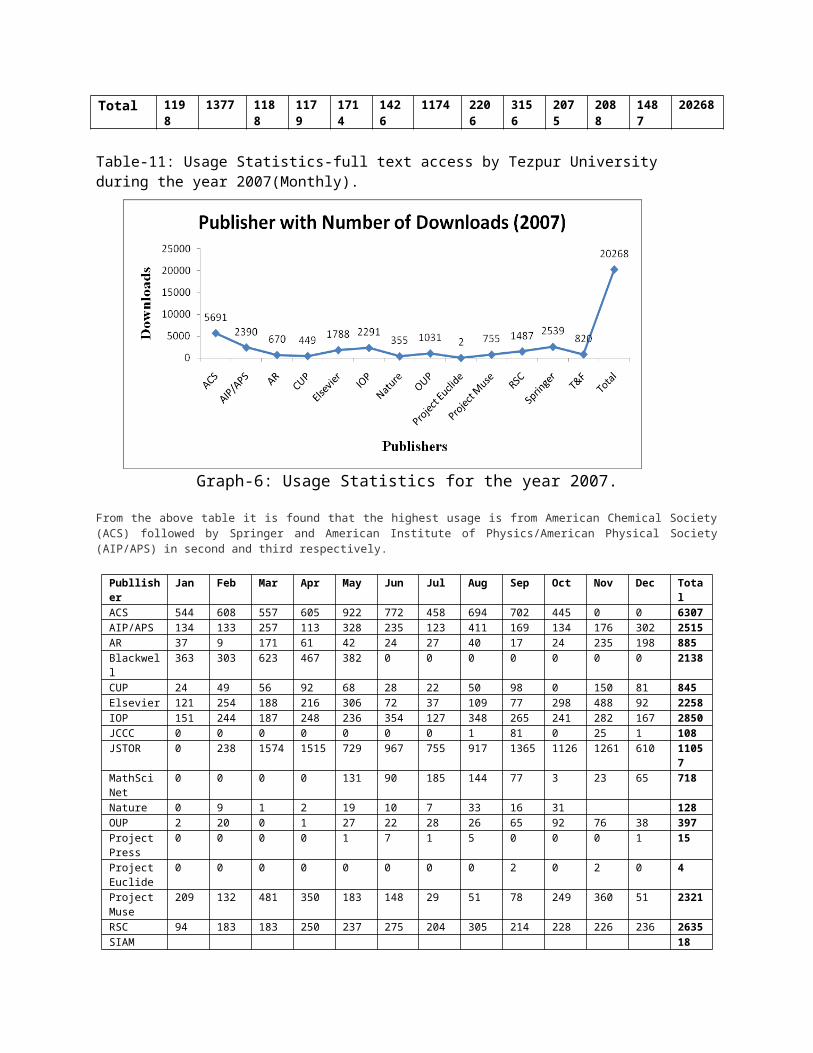
Table-11: Usage Statistics-full text access by Tezpur University during the year 2007(Monthly).
Graph-6: Usage Statistics for the year 2007.
From the above table it is found that the highest usage is from American Chemical Society(ACS) followed by Springer and American Institute of Physics/American Physical Society(AIP/APS) in second and third respectively.
Publlisher
Jan Feb Mar Apr May Jun Jul Aug Sep Oct Nov Dec Total
ACS 544 608 557 605 922 772 458 694 702 445 0 0 6307AIP/APS 134 133 257 113 328 235 123 411 169 134 176 302 2515AR 37 9 171 61 42 24 27 40 17 24 235 198 885Blackwell
363 303 623 467 382 0 0 0 0 0 0 0 2138
CUP 24 49 56 92 68 28 22 50 98 0 150 81 845Elsevier 121 254 188 216 306 72 37 109 77 298 488 92 2258IOP 151 244 187 248 236 354 127 348 265 241 282 167 2850JCCC 0 0 0 0 0 0 0 1 81 0 25 1 108JSTOR 0 238 1574 1515 729 967 755 917 1365 1126 1261 610 1105
7MathSciNet
0 0 0 0 131 90 185 144 77 3 23 65 718
Nature 0 9 1 2 19 10 7 33 16 31 128OUP 2 20 0 1 27 22 28 26 65 92 76 38 397Project Press
0 0 0 0 1 7 1 5 0 0 0 1 15
Project Euclide
0 0 0 0 0 0 0 0 2 0 2 0 4
Project Muse
209 132 481 350 183 148 29 51 78 249 360 51 2321
RSC 94 183 183 250 237 275 204 305 214 228 226 236 2635SIAM 18
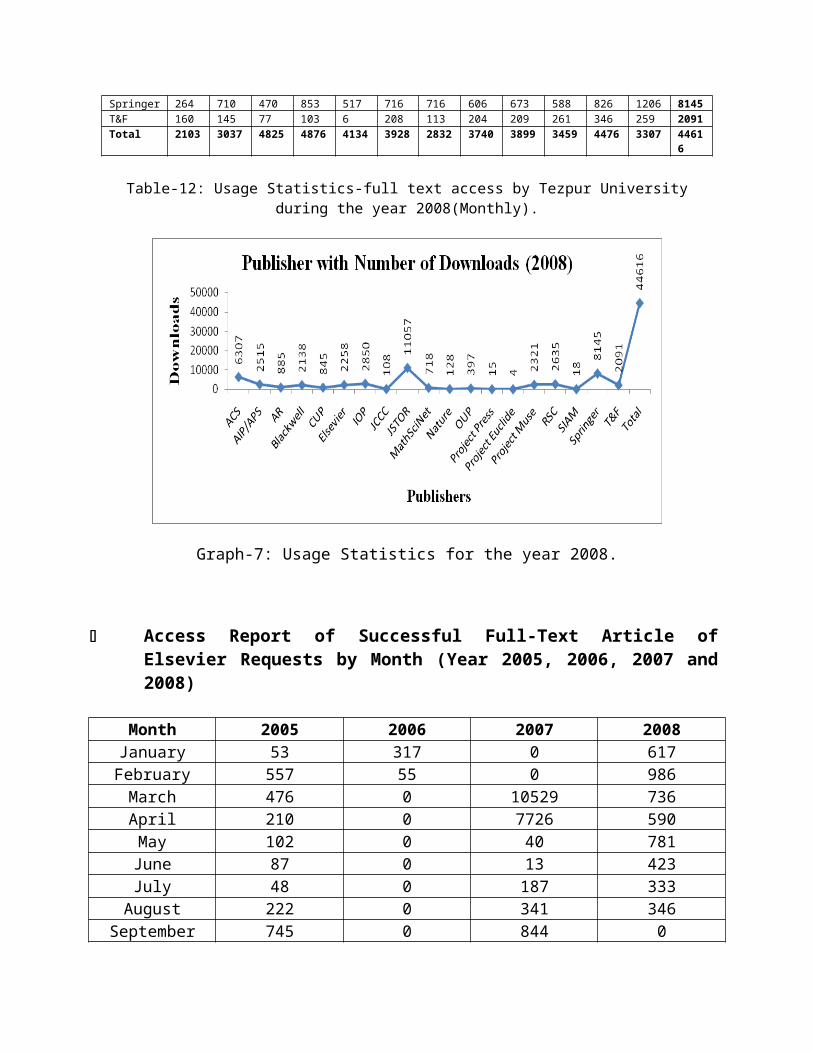
Springer 264 710 470 853 517 716 716 606 673 588 826 1206 8145T&F 160 145 77 103 6 208 113 204 209 261 346 259 2091Total 2103 3037 4825 4876 4134 3928 2832 3740 3899 3459 4476 3307 4461
6
Table-12: Usage Statistics-full text access by Tezpur Universityduring the year 2008(Monthly).
Graph-7: Usage Statistics for the year 2008.
Access Report of Successful Full-Text Article ofElsevier Requests by Month (Year 2005, 2006, 2007 and2008)
Month 2005 2006 2007 2008January 53 317 0 617February 557 55 0 986March 476 0 10529 736April 210 0 7726 590May 102 0 40 781June 87 0 13 423July 48 0 187 333August 222 0 341 346
September 745 0 844 0
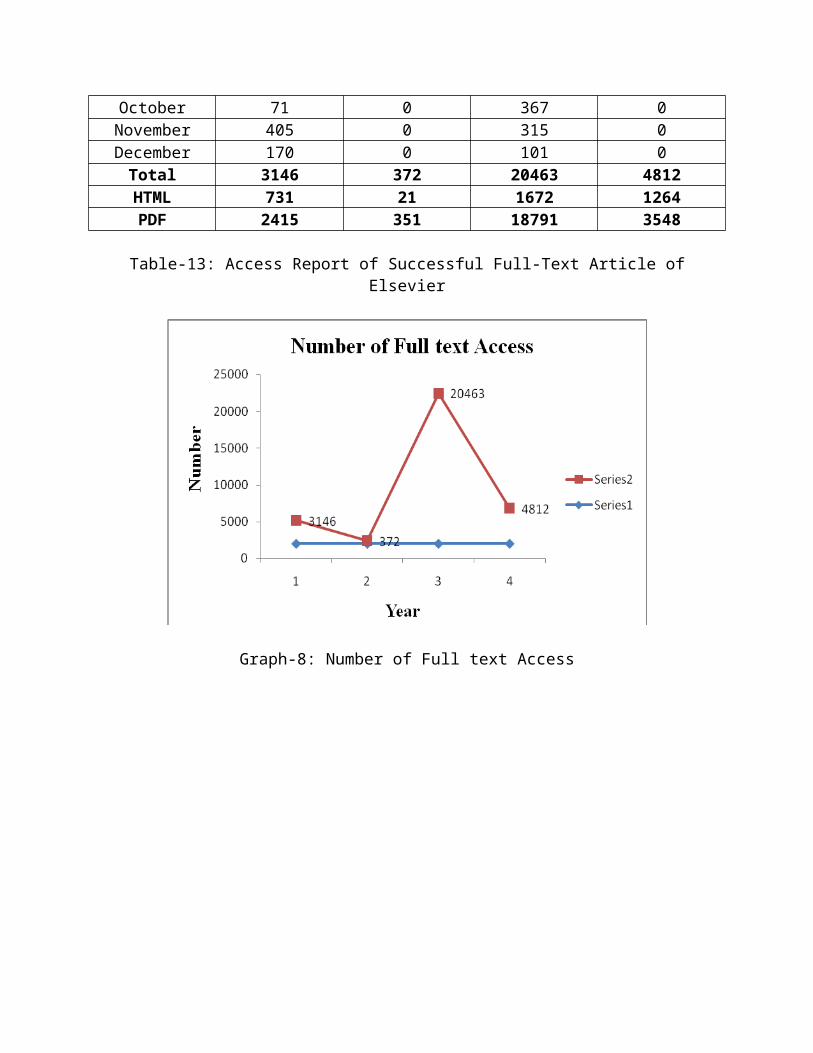
October 71 0 367 0November 405 0 315 0December 170 0 101 0Total 3146 372 20463 4812HTML 731 21 1672 1264PDF 2415 351 18791 3548
Table-13: Access Report of Successful Full-Text Article ofElsevier
Graph-8: Number of Full text Access
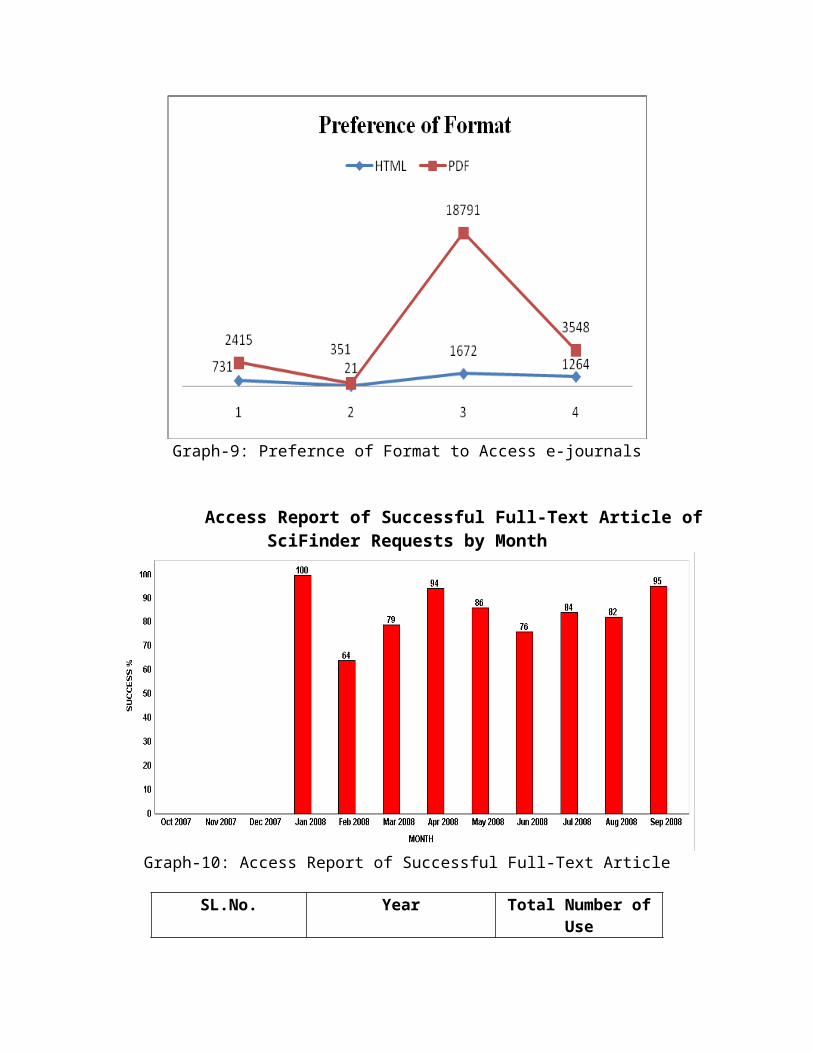
Graph-9: Prefernce of Format to Access e-journals
Access Report of Successful Full-Text Article ofSciFinder Requests by Month
Graph-10: Access Report of Successful Full-Text Article
SL.No. Year Total Number ofUse

1. 2007 202682. 2008 44616
Table-14: Growth of Number of Usage per Year.
7.17 Suggestions from the users
The scholar obtained suggestions for improvement of services withregard to e-resources of the library under study from therespondents which have been tabulated in Table- 37 along withsupported Graph- 31. The suggestions obtained from therespondents have been grouped under 9 broad headings as shown inthe table.
Sl.No. Suggestions
Category
TotalStudent
Teacher
Research
Scholar
1Increase of e-journals
05(02.75%)
06(14.29
%)
19(27.54%
)
30(10.24%
)
2
Availability of e-format of heavily used print documents
01(00.55%)
00(00.00
%)
05(07.25%
)
06(02.05%
)
3
Increase the bandwidth/ speed
06(03.30%)
04(09.52
%)
07(10.14%
)
17(05.80%
)
4
Keep the content updated for effective use
02(01.10%)
02(04.76
%)
03(04.35%
)
07(02.39%
)
5
Inform the users about the new e-resources accessible to them
07(03.85%)
04(09.52
%)
03(04.35%
)
14(04.78%
)
6Sufficient Infrastructure
03(01.65%)
01(2.38%
)
03(04.35%
)
07(02.39%
)
7
Provide training to use e-resources
06(03.30%)
02(04.76
%)
02(02.90%
)
10(03.41%
)8 Selection on the basis of 02 00 01 03
the need of the users (01.10%)
(00.00%)
(01.45%)
(01.02%)
9
24 hour opening of the library
02(01.10%)
00(00.00
%)
00(00.00%
)
02(00.68%
)Table-37: Suggestion by the users
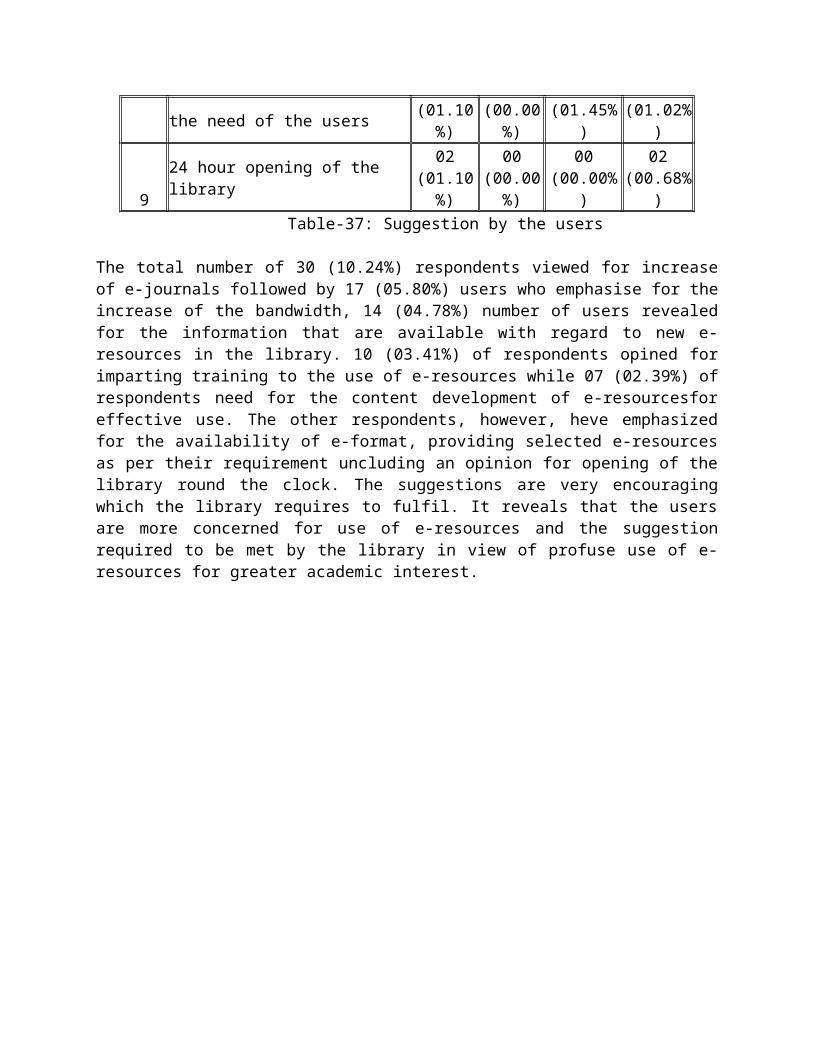
The total number of 30 (10.24%) respondents viewed for increaseof e-journals followed by 17 (05.80%) users who emphasise for theincrease of the bandwidth, 14 (04.78%) number of users revealedfor the information that are available with regard to new e-resources in the library. 10 (03.41%) of respondents opined forimparting training to the use of e-resources while 07 (02.39%) ofrespondents need for the content development of e-resourcesforeffective use. The other respondents, however, heve emphasizedfor the availability of e-format, providing selected e-resourcesas per their requirement uncluding an opinion for opening of thelibrary round the clock. The suggestions are very encouragingwhich the library requires to fulfil. It reveals that the usersare more concerned for use of e-resources and the suggestionrequired to be met by the library in view of profuse use of e-resources for greater academic interest.
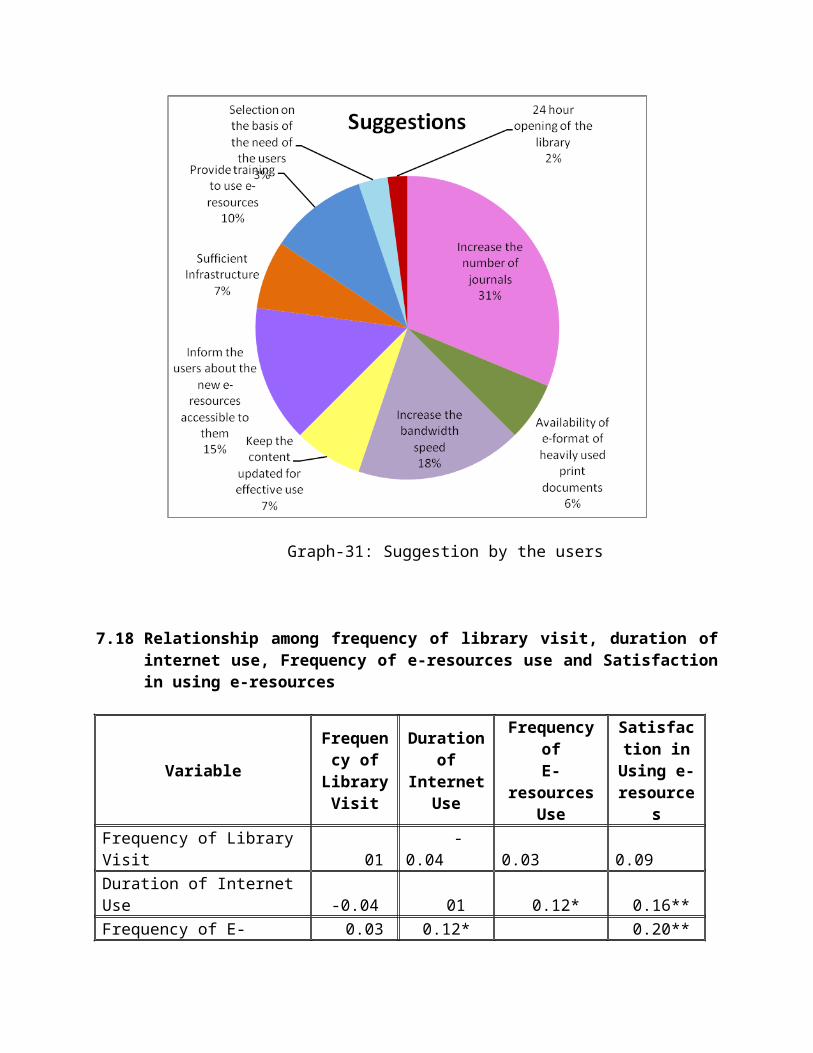
Graph-31: Suggestion by the users
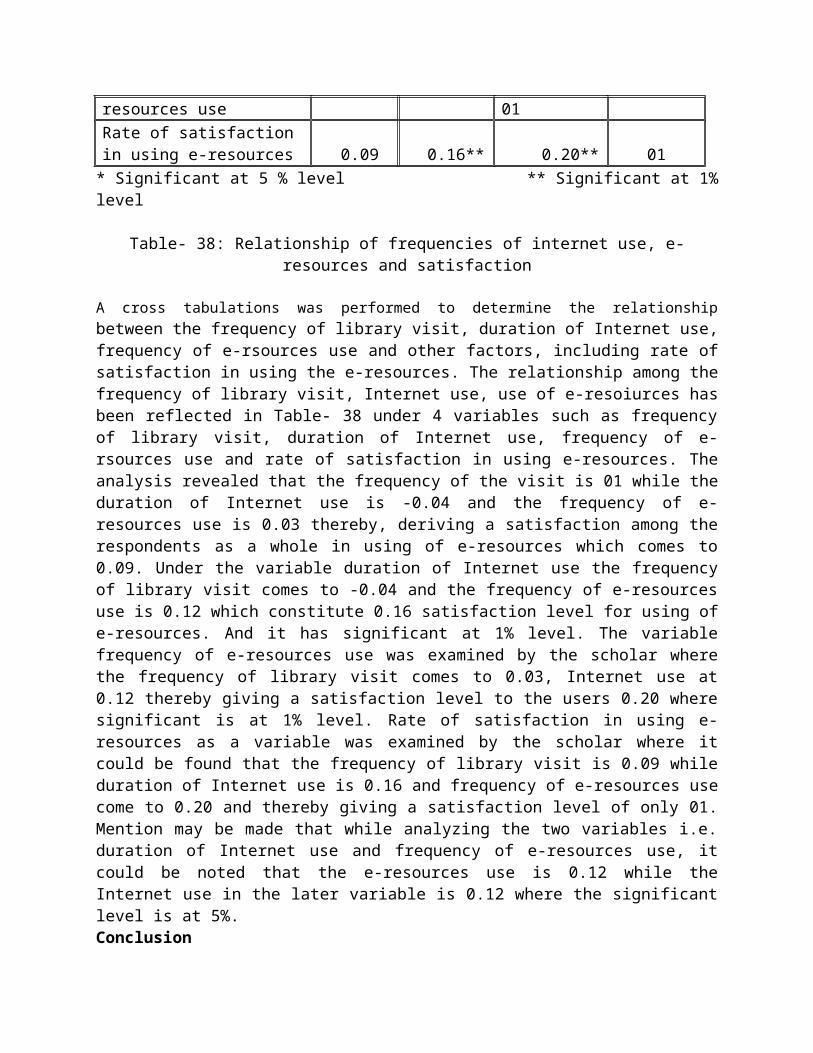
7.18 Relationship among frequency of library visit, duration ofinternet use, Frequency of e-resources use and Satisfactionin using e-resources
Variable
Frequency ofLibraryVisit
Durationof
Internet Use
FrequencyofE-
resources Use
Satisfaction inUsing e-resource
sFrequency of Library Visit 01
-0.04
0.03
0.09
Duration of Internet Use -0.04 01 0.12* 0.16**Frequency of E- 0.03 0.12* 0.20**
resources use 01Rate of satisfaction in using e-resources 0.09 0.16** 0.20** 01* Significant at 5 % level ** Significant at 1%level
Table- 38: Relationship of frequencies of internet use, e-resources and satisfaction
A cross tabulations was performed to determine the relationshipbetween the frequency of library visit, duration of Internet use,frequency of e-rsources use and other factors, including rate ofsatisfaction in using the e-resources. The relationship among thefrequency of library visit, Internet use, use of e-resoiurces hasbeen reflected in Table- 38 under 4 variables such as frequencyof library visit, duration of Internet use, frequency of e-rsources use and rate of satisfaction in using e-resources. Theanalysis revealed that the frequency of the visit is 01 while theduration of Internet use is -0.04 and the frequency of e-resources use is 0.03 thereby, deriving a satisfaction among therespondents as a whole in using of e-resources which comes to0.09. Under the variable duration of Internet use the frequencyof library visit comes to -0.04 and the frequency of e-resourcesuse is 0.12 which constitute 0.16 satisfaction level for using ofe-resources. And it has significant at 1% level. The variablefrequency of e-resources use was examined by the scholar wherethe frequency of library visit comes to 0.03, Internet use at0.12 thereby giving a satisfaction level to the users 0.20 wheresignificant is at 1% level. Rate of satisfaction in using e-resources as a variable was examined by the scholar where itcould be found that the frequency of library visit is 0.09 whileduration of Internet use is 0.16 and frequency of e-resources usecome to 0.20 and thereby giving a satisfaction level of only 01.Mention may be made that while analyzing the two variables i.e.duration of Internet use and frequency of e-resources use, itcould be noted that the e-resources use is 0.12 while theInternet use in the later variable is 0.12 where the significantlevel is at 5%. Conclusion
Information and knowledge are the products of society which flowsthrough various channels of information resources. Theseinformation resources help to improve the quality education andresearch work. The advances in ICTs have brought phenomenalchanges in libraries with regard to its infrastructures,management of information resources, library functions, services,and competencies of the staffs, development of skills along withusers’ requirements. In this changing environment there is ashift from print to e-resources which are easy to use, flexibleand available without geographical boundary. The enhancedfeatures of online access provided through web technologies suchas hyperlinks to related texts and links to multimedia alsoprovide value addition to these resources. Development ofcommunication systems and digital technology has made the e-resources available in abundance in World Wide Web. E-resourcesare becoming very popular and pervasive these days as it providesthe freedom to access the content at the desktop of the user atease. The summary and findings of the study has been placedbelow. It could be revealed that the use of e-resources among the
students of the library under study is primarily to updateknowledge.
The teachers and research scholars however use the e-resources for academic research work, preparation of notes,writing of articles and writing of books.
The type of e-resources available in the library in the formof e-book, e-journal, etc. all the category of users prefersto use e-resources.
The teachers of the university under study use UGC-Infonetand INDEST Consortium to find the latest information intheir own subject and constitute the highest percentage forusing the e-journals. It is also surprising to note that agood number of respondents are not used to e-resources ofthe library due to lack of their awareness.
The teachers and the research scholars however prefer to useon campus podium for e-resources due to wi-fi connectivity.

BibliographyADIKA, G. (2003). Internet use among faculty members ofuniversities in Ghana. Library Review. 52 (1). pp. 29-37.
APPLETON, L. (2006). Perceptions of electronic library resourcesin further education. The Electronic Library. 24 (5). pp. 619-34.
ASHCROFT, L. and WATTS, C. (2004). Change implications related toelectronic educational Resources. Online Information Review. 28 (4).pp. 284-91.
CHAKRAVARTY, R. and SINGH, S. (2005). E-resources for Indianuniversities: new initiatives. SRELS Journal of Information Management.42 (1). pp. 57-73.
CHARTON, G. (2001). Electronic resources and documentaryconsortia: a survey of French scientific institutions. Journal ofLibrarianship and Information Science. 32 (2). pp. 85-97.
COHEN, L.B. and CALSADA, M.M. (2003). Web accessible databasesfor electronic resource collections: a case study and itsimplications. The Electronic Library. 21 (1). pp. 31-8.
CRAWFORD, J. and DAYE, A. (2000). A survey of the use ofelectronic services at Glasgow
DADZIE, P.S. (2005). Electronic Resources: Access and Usage atAshesi University College. Campus-Wide Information Systems. 22 (5).pp. 290-297.
DE VICENTE, A., CRAWFORD, J. and CLINK, S. (2004). Use andawareness of electronic information services by academic staff atGlasgow Caledonian University. Library Review. 53 (8). pp. 401-7.
FALK, H. (2003). Electronic campus. The Electronic Library. 21 (1). pp.63-6.
FAN, K.W. (2003). Electronic resources for Chinese studies andEast Asian libraries. New Library World. 104 (10). pp. 404-11.
HARIDASAN, SUDHARMA and KHAN, Majid. (2009). Impact and Useof e-resources by Social Scientists in National Social ScienceDocumentation Centre (NASSDOC), India. The Electronic Library. 27 (1).pp. 117-133.
KEBEDE, G. (2002). The Changing Information Needs of Users inElectronic Information Environments. The Electronic Library. 20 (1).pp. 19-21.
KENNEDY, P. (2004). Dynamic web pages and the library catalogue.The Electronic Library. 22 (6). pp. 480-6.
LOHAR, M.S. and ROOPASHREE, T.N. (2006). Use of ElectronicResources by Faculty Members in B.I.E.T., Davanagere: A Survey.SRELS Journal of Information Management. 43 (1). pp. 101-12.
MAJID, S. and TAN, A.T. (2002). Usage of information resources bycomputer engineering students: a case study of NanyangTechnological University, Singapore. Online Information Review. 26 (5).pp. 318-25.
MATHEW, K.S. and SHEEJA, N.K. (2005). Use of e-resources in aNetworked Environment: A Case Study of CUSAT. NACLIN. 43 (3). pp.283-93.
SWAIN, Dillip K. and PANDA, K.C. (2009). Use of ElectronicResources in Business School Libraries of an Indian State: AStudy of Librarians’ Opinion. Electronic Library. 27 (1). pp. 74-85.