Structure-miscibility relationships in weakly interacting ...
74
Rochester Institute of Technology RIT Scholar Works eses esis/Dissertation Collections 9-1-2012 Structure-miscibility relationships in weakly interacting polymer blends eresa Hendrick Follow this and additional works at: hp://scholarworks.rit.edu/theses is esis is brought to you for free and open access by the esis/Dissertation Collections at RIT Scholar Works. It has been accepted for inclusion in eses by an authorized administrator of RIT Scholar Works. For more information, please contact [email protected]. Recommended Citation Hendrick, eresa, "Structure-miscibility relationships in weakly interacting polymer blends" (2012). esis. Rochester Institute of Technology. Accessed from
-
Upload
khangminh22 -
Category
Documents
-
view
1 -
download
0
Transcript of Structure-miscibility relationships in weakly interacting ...

Rochester Institute of TechnologyRIT Scholar Works
Theses Thesis/Dissertation Collections
9-1-2012
Structure-miscibility relationships in weaklyinteracting polymer blendsTheresa Hendrick
Follow this and additional works at: http://scholarworks.rit.edu/theses
This Thesis is brought to you for free and open access by the Thesis/Dissertation Collections at RIT Scholar Works. It has been accepted for inclusionin Theses by an authorized administrator of RIT Scholar Works. For more information, please contact [email protected].
Recommended CitationHendrick, Theresa, "Structure-miscibility relationships in weakly interacting polymer blends" (2012). Thesis. Rochester Institute ofTechnology. Accessed from

Structure-Miscibility Relationships in Weakly
Interacting Polymer Blends
Theresa M. Hendrick
September 2012
Thesis submitted in partial fulfillment of the requirements for the degree of Master of Science in Chemistry
Approved: ________________________________________ Dennis J. Massa (Advisor)
________________________________________
Paul Craig (Department Head)
College of Science Department of Chemistry
Rochester Institute of Technology Rochester, NY 14623-5603

ii
Copyright Release Form:
I, Theresa M. Hendrick, hereby grant permission to the Wallace Memorial Library of the Rochester Institute of Technology to reproduce my thesis in whole or part. Any reproduction will not be for commercial use or profit. _______________________ Theresa M. Hendrick September, 2012

iii
Abstract
In the present research, the relationship between blend miscibility and constituent
polymer structure was established. This work examines a series of blends of polyesters
(PE’s) and polycarbonates (PC’s) having systematic variations in aliphatic and aromatic
structural group content to establish how miscibility and phase behavior depend on
polymer structure. The blends were prepared by solution blending and precipitating,
while the polymer blend miscibility and phase behavior were characterized through
differential scanning calorimetry (DSC). The glass transition temperatures (Tg) of the
individual polymers and blends were measured. The polyesters and polycarbonates
explored in this research were 4MC-PC (Tg = 135.2°C), BPA-TMC-PC 9371 (Tg =
213.4°C), Lexan 145 BPA-PC (Tg = 152.7°C), Teijin BPA-PC (Tg = 149.5°C), N-PC (Tg
= 235.5°C), TCD-PC (Tg = 267.1°C), T(60)Az-N (Tg = 147.2°C), and T(80)Az-N (Tg =
74.8°C).
Generally, it was found that polycarbonate-polycarbonate blends were miscible, while
polycarbonate-polyester and polyester-polyester blends were partially miscible at most.
Of the 50:50 blends studied, the miscible blends were Lexan 145 BPA-PC and BPA-
TMC-PC 9371, N-PC and BPA-TMC-PC 9371, TCD-PC and BPA-TMC-PC 9371, N-PC
and Lexan 145 BPA-PC, and TCD-PC and N-PC. The partially miscible blends were
T(80)Az-N blended with BPA-TMC-PC 9371, Lexan 145 BPA-PC, Teijin-PC, N-PC,
TCD-PC, and T(60)Az-N. Other partially miscible blends included Teijin-PC and TCD-
PC, and T(60)Az-N blended with BPA-TMC-PC 9371, N-PC, and TCD-PC. The blend
that showed to be immiscible was T(60)Az-N and Lexan 145 BPA-PC. The results

iv
showed that blends made up of two polycarbonates with similarities in aromatic and
aliphatic group content brought about a miscible blend. For the PC-PE and PE-PE
blends, those with more similar structural content were more miscible than those with
less similar structural content.

v
Table of Contents
1.0 Introduction………………………………………………………………………… 1 1.1 Polymer blends and their advantages…………………………………….... 1
1.2 Methods to determine blend miscibility………………………………….... 2 1.3 Glass transition temperature……………………………………………….. 3 1.4 Phase behavior and miscibility of polymer blends………………………… 4 1.5 Determining polymer blend miscibility through Tg………………………... 4 1.6 The Fox and Couchman equations…………………………………………. 6 1.7 Polymer blend thermodynamics…………………………………………… 7 1.8 The Flory Huggins theory…………………………………………………. 8 1.9 Preparing polymer blends…………………………………………………. 10 1.10 Interchange reactions…………………………………………………….. 10 1.11 Previous work on strongly interacting polymer blends………………….. 11 1.12 Weakly interacting blends of polycarbonates and polyesters……………. 12 1.13 Previous work on weakly interacting PC-PE blends…………………….. 12 2.0 Experimental……………………………………………………………………….. 16 2.1 Materials…………………………………………………………................ 16 2.2 Instrumentation……………………………………………………….......... 16
2.3 Blend preparation………………………………........................................... 17 2.4 Solubility Test – T(80)Az-N…………………...…………………….......... 19
3.0 Results and Discussion……………………………………………………………. 20 3.1 Polycarbonate and polyester structural makeup…………………………… 21 3.2 Polymer blend preparation and results…………………………………….. 22 3.3 Solubility test results for T(80)Az-N………………………………………. 23 3.4 Thermal analysis of polymers and blends…………………………………. 25 3.5 Miscibility of 50:50 polymer blends………………………………………. 27 3.6 Fully miscible PC-PC blends……………………………………………… 29 3.7 Non-fully miscible PC-PC blends…………………………………………. 31 3.8 PE-PC miscibility results…………………………………………………... 33 3.9 T(80)Az-N and PC blend results…………………………………………… 34 3.10 T(60)Az-N and PC blend results………………………………………….. 36 3.11 Polymer blend series……………………………………………………… 40 4.0 Conclusions and Future Directions………………………………………………… 46 5.0 Appendix…………………………………………………………………………... 48 6.0 References………………………………………………………………………….. 62

vi
List of Figures
Figure 1: General Structure of Polycarbonate…………………………………………… 1 Figure 2: General Structure of Polyester………………………………………………… 1 Figure 3: Basic DSC Trace Example……………………………………………………. 4 Figure 4: Glass Transition Temperature Behavior of Polymer Blends…………………. 6 Figure 5: Polymer Chains as Segments in a Blend……………………………………... 9 Figure 6: Structure of T(40)Az-N……………………………………………………….. 13 Figure 7: Structure of BPA-PC………………………………………………………..... 13 Figure 8: Structure of BPA-TMC-PC 9371……………………………………………… 14 Figure 9: Wiehe 2-Dimensional Solubility Parameter Plot……………………………… 25 Figure 10: DSC Scan of 50:50 Lexan 145 BPA-PC:N-PC Blend……………………….. 30 Figure 11: DSC Scan of 50:50 4MC-PC:BPA-TMC-PC 9371 Blend…………………... 33 Figure 12: DSC Scan of 50:50 T(80)Az-N:Teijin-PC Blend…………………………… 36 Figure 13: DSC Scan of 50:50 T(60)Az-N:N-PC Blend………………………………... 38 Figure 14: DSC Scan of 50:50 T(60)Az-N:T(80)Az-N Blend………………………….. 40 Figure 15: BPA-TMC-PC 9371:Lexan 145 BPA-PC Series Blend Data……………….. 42 Figure 16: N-PC:Lexan 145 BPA-PC Series Blend Data Plot………………………….. 43 Figure 17: TCD-PC:Teijin-PC Series Blend Data Plot………………………………….. 45 Figure 18: DSC Scan of 4MC-PC……………………………………………………….... 48 Figure 19: DSC Scan of BPA-TMC-PC 9371…………………………………………….. 48 Figure 20: DSC Scan of Lexan 145 BPA-PC……………………………………………... 49 Figure 21: DSC Scan of Teijin-PC………………………………………………………… 49 Figure 22: DSC Scan of N-PC…………………………………………………………….. 50 Figure 23: DSC Scan of TCD-PC………………………………………………………….. 50 Figure 24: DSC Scan of T(60)Az-N……………………………………………………….. 51 Figure 25: DSC Scan of T(80)Az-N……………………………………………………….. 51 Figure 26. DSC Scan of Lexan 145 BPA-PC and BPA-TMC-PC 9371 50:50 Blend…….. 52 Figure 27. DSC Scan of N-PC and BPA-TMC-PC 9371 50:50 Blend……………………. 52 Figure 28. DSC Scan of TCD-PC and BPA-TMC-PC 9371 50:50 Blend………………… 53 Figure 29. DSC Scan of TCD-PC and N-PC 50:50 Blend………………………………… 53 Figure 30. DSC Scan of TCD-PC and Teijin-PC 50:50 Blend……………………………. 54 Figure 31. DSC Scan of 4MC-PC and Teijin-PC 50:50 Blend……………………………. 54 Figure 32. DSC Scan of T(80)Az-N and BPA-TMC-PC 9371 50:50 Blend……………… 55 Figure 33. DSC Scan of T(80)Az-N and Lexan 145 BPA-PC 50:50 Blend………………. 55 Figure 34. DSC Scan of T(80)Az-N and N-PC 50:50 Blend……………………………… 56 Figure 35. DSC Scan of TCD-PC and T(80)Az-N 50:50 Blend…………………………... 56 Figure 36. DSC Scan of T(60)Az-N and TCD-PC 50:50 Blend…………………………… 57 Figure 37. DSC Scan of T(60)Az-N and BPA-TMC-PC 9371 50:50 Blend………………. 57 Figure 38. DSC Scan of T(60)Az-N and Lexan 145 BPA-PC 50:50 Blend………………. 58 Figure 39. DSC Scan of 25:75 BPA-TMC-PC 9371 and Lexan 145 BPA-PC Blend……... 58

vii
Figure 40. DSC Scan of 75:25 BPA-TMC-PC 9371 and Lexan 145 BPA-PC Blend……... 59 Figure 41. DSC Scan of 25:75 N-PC and Lexan 145 BPA-PC Blend…………………….. 59 Figure 42. DSC Scan of 75:25 N-PC and Lexan 145 BPA-PC Blend…………………….. 60 Figure 43. DSC Scan of 25:75 TCD-PC and Teijin-PC Blend……………………………. 60 Figure 44. DSC Scan of 75:25 TCD-PC and Teijin-PC Blend……………………………. 61

viii
List of Schemes
Scheme 1: Ester Interchange………………………………………………………………. 10 Scheme 2: Associative reaction mechanism for the ester interchange of polyester……… 10

ix
List of Tables
Table 1: 50:50 Polymer Blends………………………………………………………… 18 Table 2: Series Polymer Blends………………………………………………………… 19 Table 3: Structures of Polycarbonates and Polyesters…………………………………. 20 Table 4: DSC Data for Polymers……………………………………………………….. 26 Table 5: DSC Data for Polymer Blends………………………………………………… 27 Table 6: Miscibility Results of Polymer Blends……………………………………….. 28 Table 7: Weight Fractions in Polymer Blends…………………………………………. 34 Table 8: Series DSC Data for BPAC-PC 9371:Lexan 145 BPA-PC Blend….………... 41 Table 9: Series DSC Data for N-PC:Lexan 145 BPA-PC Blend………………………. 43 Table 10: Series DSC Data for Teijin-PC:TCD-PC Blend……………………………… 44

x
List of Abbreviations
PE – Polyester PC – Polycarbonate DSC – Differential Scanning Calorimetry Tg – Glass Transition Temperature HDT – Heat Distortion Temperature SEM – Scanning Electron Microscopy TEM – Transmission Electron Microscopy IR – Infrared NMR – Nuclear Magnetic Resonance DMA – Dynamic Mechanical Analysis ΔCp – Specific Heat Increment w – Weight Fraction ΔGm - Free Energy of Mixing ΔHm – Enthalpy of Mixing T – Temperature ΔSm – Entropy of Mixing R – Gas Constant n – moles � – Volume Fraction x – Segments χ – Flory-Huggins Polymer-Polymer Interaction Parameter PVPh – Poly(vinylphenol) BPA – Bisphenol-A DCM – Dichloromethane DMSO – Dimethyl sulfoxide DMF – Dimethylformamide i-PrOH – Isopropyl Alcohol Diox – Dioxane Acet – Acetone MEK – Methyl Ethyl Ketone PrOAc – n-Propylacetate THF – Tetrahydrofuran CHCl3 – Chloroform Tol – Toluene M – Miscible PM – Partially Miscible IM – Immiscible VSM – Very Slightly Miscible
1
1.0 Introduction
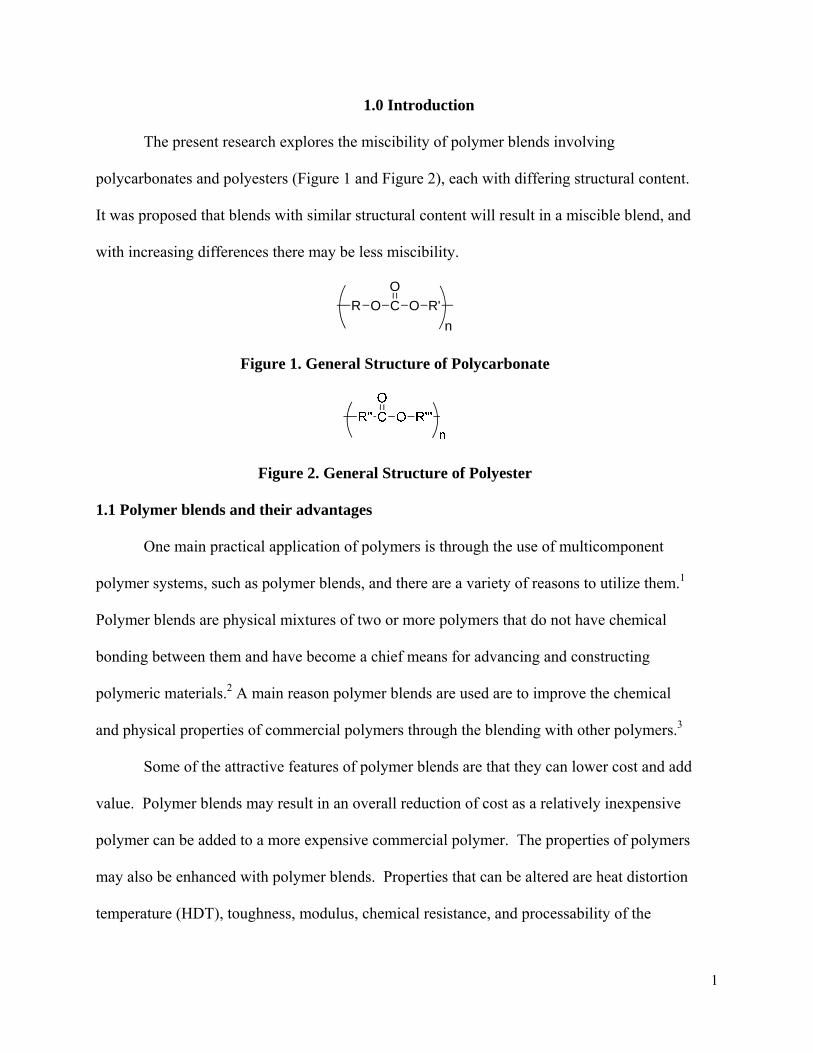
The present research explores the miscibility of polymer blends involving
polycarbonates and polyesters (Figure 1 and Figure 2), each with differing structural content.
It was proposed that blends with similar structural content will result in a miscible blend, and
with increasing differences there may be less miscibility.
R O C O R'O
n
Figure 1. General Structure of Polycarbonate
Figure 2. General Structure of Polyester
1.1 Polymer blends and their advantages
One main practical application of polymers is through the use of multicomponent
polymer systems, such as polymer blends, and there are a variety of reasons to utilize them.1
Polymer blends are physical mixtures of two or more polymers that do not have chemical
bonding between them and have become a chief means for advancing and constructing
polymeric materials.2 A main reason polymer blends are used are to improve the chemical
and physical properties of commercial polymers through the blending with other polymers.3
Some of the attractive features of polymer blends are that they can lower cost and add
value. Polymer blends may result in an overall reduction of cost as a relatively inexpensive
polymer can be added to a more expensive commercial polymer. The properties of polymers
may also be enhanced with polymer blends. Properties that can be altered are heat distortion
temperature (HDT), toughness, modulus, chemical resistance, and processability of the

2
commercial polymer to make it more ideal for a given application.3 Also, polymer blends
can be made in different compositions, and with differing compositions there are different
properties that result. Lastly, polymer blends may be implemented more quickly and
economically for a given application instead of looking into the chemistry of new polymers.
In addition, advantages to using polymer blends include impact modification when
rubber is incorporated; improved environmental stress crack resistance; possible anti-slip,
anti-block, and low coefficients of friction; and various commercial products can result from
property compromise with elastomers. Some advantages of single phase blends include HDT
enhancement, improved processability, plasticizer permanence, and no weld-line strength
deterioration. Single phase blends also retain optical clarity, which is necessary in packaging
and optical applications. Advantages to using two phase blends involve the ability to be used
in rubber-toughened plastics, composites, and recycled polymer mixtures.3 As it can be seen,
the degree of miscibility of a blend can have either advantages or disadvantages depending
on the application.
1.2 Methods to determine blend miscibility
There are various ways to determine polymer blend miscibility. One initial sign of
possible miscibility is if the polymer solution is clear at high concentrations. While the
results from this are not definitive, it is useful for examining potentially miscible blends.
Other ways involve microscopy techniques such as optical, scanning electron microscopy
(SEM), and transmission electron microscopy (TEM). Scattering methods are an option also
with scattering techniques of light, x-ray, or neutron. Infrared (IR) spectroscopy, nuclear
magnetic resonance (NMR), dynamic mechanical analysis (DMA), and fluorescence may
also be employed. A convenient and more reliable analysis technique is differential scanning

3
calorimetry (DSC). An important variable that results from the DSC analysis is the glass
transition temperature (Tg) which helps determine phase behavior.
1.3 Glass transition temperature
The glass transition temperature is the temperature at which there is an onset of large
scale segmental motion within a polymer. This transition is accompanied by more long-
range motion of the chain, meaning more rotational freedom and more segmental motion.
When this transition occurs, the space between the atoms, or the free volume, increases.
Greater free volume of a polymer will prevent close packing and will therefore cause a
lowering of the glass transition temperature. Therefore, polymers with larger groups that will
hinder rotational freedom will have a higher Tg. The DSC trace shown in Figure 3 below is a
basic example of what a glass transition looks like after the DSC analysis.4 The transition is
an “S” shaped curve. The analysis of this curve involves drawing a baseline where the curve
begins and ends, and then a tangent line through the curve. Point A represents the onset of
the Tg, the midpoint is represented by point B, and the point C represents the end point.
Through using the DSC, the glass transition temperature helps to determine the phase
behavior and miscibility of polymer blends.

1.4 Phas
In
different
homogen
immiscib
extent of
group co
In
immiscib
and exhib
forces, w
morpholo
1.5 Deter
T
transition
e behavior
n the past it w
polymer ble
nous phase re
ble blend.3 T
f interactions
ntent.5
n general, bl
ble. A misci
bits intermol
while an imm
ogy.
rmining pol
The phase beh
n behavior.1
Figur
and miscibi
was thought
ends can sho
esulting in a
The phase be
s between th
ends can be
ible blend is
lecular inter
miscible blen
lymer blend
havior or mi
If a blend of
re 3. Basic D
ility of polym
t that blend m
ow varying b
a miscible ble
ehavior of po
e constituen
classified in
a single pha
actions, such
d is a multip
d miscibility
iscibility of a
f polymers is
DSC Trace
mer blends
miscibility w
behavior.1 Po
end, or may
olymer blend
nt polymers,
nto two gene
ase blend tha
h as hydroge
phase system
y through T
a blend can b
s completely
Example
was rare, but
olymer blend
phase separ
ds is primari
which is rela
eral types, wh
at has a high
en bonding a
m that exhibit
Tg
be determin
y miscible, th
now it is see
ds may form
rate resulting
ily dependen
ated to their
hich are mis
degree of ho
and Van der
ts heterogen
ed from the
here will be
en that
m a single
g in an
nt on the
structural
scible and
omogeneity
Waals
neous phase
glass
a single
4

5
glass transition temperature (Tg). If a blend is immiscible, there will be two distinct Tg’s that
are similar to those of the constituent polymers in the blend. There is also the possibility of a
blend to not be fully miscible or immiscible, in which case it would be partially miscible. A
partially miscible blend would exhibit two Tg’s in between those of the constituent polymers,
where one phase would be rich in one polymer and the second phase would be rich in the
other.6,7,8 When the composition of the blend is varied, the glass transition temperature of
each polymer shifts as shown in Figure 4.9 It can be seen that for a fully miscible blend,
across all compositions there is a steady increase in the Tg and results in a plot with a slightly
concave upward curve. For partially miscible blends there are two possible plots when the
Tg is plotted versus composition. One is a curve that demonstrates two polymer rich phases
at each extreme and with partial interaction in between. The other is a plot that demonstrates
two polymer rich phases at each extreme, with no interaction taking place in between. The
plot for the immiscible blend shows that there is no interaction between the polymers at all
compositions. In addition to Tg, the specific heat increment (ΔCp) has also been used to
assess polymer blend behavior by DSC.10,11

6
Figure 4. Glass Transition Temperature Behavior of Polymer Blends
1.6 The Fox and Couchman equations
The phase behavior of polymer blends can be examined by comparison of the
measured Tg to a predicted or calculated Tg for the corresponding blend. 3,5 The glass
transition temperature of blends can be calculated or predicted through the Fox equation and
the Couchman equation, shown in Equations 1 and 2, respectively, where Tg is the glass
transition temperature of the blend, Tg1 and Tg2 are the glass transitions of the individual
polymers, w1 and w2 are the weight fractions of the polymers in the blend, and ΔCp1 and
ΔCp2 are the change in heat capacity of the polymers. When a polymer has a high ΔCp it is
possible that the Tg calculated from the Couchman equation will be slightly higher than the
Tg from the Fox equation.3
A composition → B
Miscible
Tg
Tg Tg
Partially miscible
Partially miscible Immiscible
A composition → B A composition → B
A composition → B
Tg

7
Δ ΔΔ Δ
The weight fractions of the polymer components in the system may also be calculated
from the Fox and Couchman equations by rearranging them, which are shown in the
Equations 3 and 4, respectively, where w1’ is the apparent weight fraction of polymer 1.12,13
The weight fraction of polymer 2 can then be solved for by subtracting w1’ from 1. Knowing
the weight fraction of each polymer present at a composition in a blend may also provide
confirmation of the degree of miscibility of the blend. The most miscible blends will have
experimental weight fractions the closest to the value from Fox or Couchman equation.
,
∆∆ ∆
1.7 Polymer blends thermodynamics
The best way to describe the degree of interaction of two polymers in a blend is
through polymer blend thermodynamics, which is governed by the free energy of mixing,
where ΔGm is Gibb’s free energy of mixing, ΔHm is the enthalpy of mixing, T is temperature,
and ΔSm is the entropy of mixing (Equation 5). 3
∆ ∆ ∆
In order for two polymers to be miscible, the free energy of mixing term must be
negative, or less than zero. In order for the free energy of mixing to meet this criterion, there
must be a degree of interaction between the polymers which will result in an exothermic or
Equation 1
Equation 2
Equation 3
Equation 4
Equation 5

8
favorable heat of mixing.3 Unfavorable mixing occurs when ΔGm is zero or positive, and this
can happen when there are only van der Waals or dispersion forces present.3
There is an increase in the entropy of mixing for polymer blends, so the entropy term
is always positive. The entropy term must exceed the enthalpy term in order to result in a
negative free energy of mixing and a fully miscible blend. With blends made up of two
dissimilar polymers, there will be a positive enthalpy term as they will have less attraction for
each other and this is not favorable towards mixing.
There is a molecular weight effect on the miscibility of polymers. The entropy gain is
larger with polymers of lower molecular weight, thereby promoting miscibility.3 Also, a
predetermined immiscible blend may be made miscible by chemical modification or by
copolymerization as a means of getting favorable interactions.2
1.8 The Flory Huggins theory
In a polymer blend, two types of polymer chains may be considered to be comprised
of segments within a lattice (Figure 5).1 The two polymers that are shown represented by
black and white circles each occupy a continuous sequence of segments. There may be
interactions between segments of the two different polymers or even interactions within the
same polymer when in a blend, which will affect the miscibility; and the Flory-Huggins
theory, another theory of polymer blend thermodynamics that takes these interactions into
account.1

9
Figure 5. Polymer Chains as Segments in a Blend
The Flory-Huggins equation for the Gibbs free energy of mixing for polymer blends
is shown below, where R is the gas constant, T is temperature, n1 and n2 are the number of
moles of polymer 1 and polymer 2, �1 and �2 are the volume fractions of the polymers, x1 is
the segments occupied by polymer 1, and is the Flory-Huggins polymer-polymer
interaction parameter (Equation 6).
∆
The combinatorial entropy of mixing is comprised of the first two terms on the right hand
side of the equation and the enthalpy term is comprised of the third term in the equation. The
entropy term represents how the polymers fit into the lattice, while the enthalpy term
represents the interactions between the polymers within the lattice.
Equation 6
Combinatorial entropy of mixing Enthalpy term

10
In polymers, atoms are restricted by being tied into a polymer chain which means that
the mixing is much less random and the entropy gain is much lower. Therefore, the entropy
term is not sufficient enough to bring about a fully miscible blend between two polymers and
the enthalpy term then becomes the dominant term.1
1.9 Preparing polymer blends
Polymer blends can be prepared in a variety of ways, two of which are solution
mixing and melt mixing. In solution mixing, polymers are dissolved individually into a
common solvent, are combined in the necessary ratios, are precipitated into a non-solvent,
and are then dried. In melt mixing, polymers (in pellet form) are mixed in the molten state.
Solution mixing was chosen over melt mixing for this current research because melt mixing
is a much larger scale process and involves polymers being held at higher temperatures for an
extended period of time which makes it possible for chemical changes to occur.
1.10 Interchange reactions
Often when held at high temperatures for extended periods of time, blends comprised
of two polyesters undergo interchange reactions where either ester group in the polymer
chain or end-group reacts (Scheme 1 and Scheme 2).14,15,16
Scheme 1. Ester Interchange
Scheme 2. Associative reaction mechanism for the ester interchange of
polyesters17

11
There is a similar reaction that can occur between a blend of a polycarbonate and
polyester (PC-PE).16,18 This results in the altering of the chemical nature of the final product
as it becomes a random copolymer.14 In the case of PE-PC blends, decarboxylation can
occur.19 This resulting blend would be miscible and have a single Tg, have a significantly
lowered melting temperature, and would not demonstrate any crystalline behavior.19,20 The
blends in the current study were prepared and characterized with minimal thermal history to
exclude the potential of any transesterification as much as possible.
1.11 Previous work on strongly interacting polymer blends
When two chemically different polymers are blended they can undergo phase
separation and two separate phases are formed; this is mainly dependent on the degree of
interaction between the constituent polymers determined by their structural content.1,5 Blends
that are strongly interacting have hydrogen bonding intramolecular forces present between
the two polymers of the blend, while weakly interacting blends do not have hydrogen
bonding. When studying the miscibility of poly(vinylphenol) (PVPh) with polyesters,
Landry and coworkers assert that the balance of aromatic and aliphatic character will
determine the miscibility of a blend.3 From their work, it was determined that the
copolyesters derived from aliphatic diols were more miscible with PVPh than the
copolyesters derived from aromatic diols.
Massa, et al. found that polymer architecture, chemical structure, and interactions
affect polymer blend miscibility in blends of linear polymers with hyperbranched polymers.
These combinations resulted in multi-phase blends.5 There was potential for hydrogen
bonding between the polymers; however there were not ample intermolecular interactions to
overcome the chemical and architectural differences between the two different polymers.

12
1.12 Weakly interacting blends of polycarbonates and polyesters
The blends explored in this present study are comprised of polycarbonates and
polyesters. PC’s are used in the engineering thermoplastics industry because their properties
allow for high HDT and have an exceptional balance of toughness and rigidity. However,
PC’s lack stress crack resistance to various chemicals, which can be improved by blending
with polyesters.21 Bisphenol-A polycarbonates (BPA-PC) are commercially important when
blended with PE’s when making high performance plastics.22
1.13 Previous work on weakly interacting PC-PE blends
Particular polymers explored in the present research have also been studied by other
groups in terms of miscibility of various blends. Research done by Yang and Yetter
explored the miscibility of a polyester, T(40)Az-N, with two BPA-PC’s having different
molecular weight (Figure 6 and Figure 7).21 The polyester studied was a poly[4,4’-(2-
norbornylidene)diphenol-co-(60%)terephthalic acid/(40%)azelaic acid], or T(40)Az-N, while
the polymers explored in the present research are T(60)Az-N and T(80)Az-N. The T(40)Az-
N is more aromatic and less aliphatic than the T(60)Az-N and T(80)Az-N in that the ratio of
terephthalic acid to azelaic acid is 0.6:0.4, while the ratios for T(60)Az-N and T(80)Az-N are
0.4:0.6 and 0.2:0.8, respectively. The polycarbonates that the T(40)Az-N was mixed with
were Lexan 145 BPA-PC and Makrolon, which has the same structure as Lexan 145 BPA-PC
and is just a higher molecular weight polymer.

13
Figure 6. Structure of T(40)Az-N
Figure 7. Structure of BPA-PC
Yang and Yetter’s results showed that the polyester T(40)Az-N was miscible with the
lower molecular weight Lexan 145 BPA-PC at all compositions and exhibited a single Tg;
however it was not miscible with the higher molecular weight BPA-PC, Makrolon, as it had
two Tg’s for most compositions. This supports the theory that a lower molecular weight
polymer promotes miscibility. Apart from the low molecular weight, the miscibility of the
T(40)Az-N with Lexan 145 BPA-PC could be attributed to the balance of aliphatic and
aromatic moieties between the structures, with both having more aromatic character than
aliphatic character.
Yang and Yetter’s work is also consistent with previous work by Cruz, Paul, Barlow,
et al., on blends of BPA-PC with aliphatic polyesters. Paul’s group found that poly(ε-
caprolactone) is miscible in all proportions with BPA-PC.23 Further, other linear aliphatic
polyesters having a CH2/COO ratio of 2 to 5 are miscible with BPA-PC, ratios up to 7 are
partially miscible, and ratios over 7 are immiscible.24,25 Methyl-substituted aliphatic
polyesters showed different behavior and were much less miscible. These results could be

14
explained by the heats of mixing of non-polymer analogs of BPA and the aliphatic
polyesters, as well as by the binary interaction model later developed.25,26,27 Based on these
results, it was anticipated that the degree of aliphatic character could influence the blend
miscibility in the current study of polycarbonates and polyesters that vary in aliphatic and
aromatic character.
Paul and Haggard studied effects of polymer structure on miscibility with blends of
BPA-TMC-PC 9371 (Figure 8) and BPA-PC.28 BPA-TMC-PC 9371 is a polymer based on
BPA and 1,1-bis(4-hydroxyphenyl)-3,3,5-trimethylcyclohexane and is an amorphous
material with high heat resistance.29 Apart from thermal properties, Paul and Haggard also
analyzed the mechanical properties of BPA-TMC-PC 9371 along with BPA-PC. BPA-TMC-
PC 9371 has a high Tg, tensile modulus, and yield stress, but has a low elongation at break.
When it was blended with the BPA-PC (which has a high elongation at break) the elongation
at break was reduced upon the addition of BPA-TMC-PC 9371, but the modulus and yield
stress were increased.
Figure 8. Structure of BPA-TMC-PC 9371
The blend of BPA-TMC-PC 9371 and BPA-PC resulted in a single phase blend with
a single Tg when analyzed by DSC. The formation of a miscible blend between the two PC’s
suggests that there were favorable interactions or that the entropy of mixing offset any
unfavorable interactions that were present. It was also discovered that interchange reactions

15
could have taken place between two polycarbonates in a blend when held at high
temperatures. Paul and Haggard were able to confirm whether or not this took place by
redissolving and recasting the blends. If there was a single phase that resulted, it indicated a
permanent change in the phase behavior because of the interchange reaction. However, if
there was still phase separation no reaction occurred. Paul and Haggard concluded that
precipitation into methanol gave the true miscibility of the blend, and that transesterification
was not the determining factor in miscibility when the thermal history consisted only of
ordinary DSC analysis.
Given the previous work done on weakly interacting polycarbonate and polyester
blends, it is proposed that there will be greater miscibility between blends with similar ratios
of aliphatic and aromatic content. Also, it is expected that with increasing differences in
structural content there will be less miscibility.
16
2.0 Experimental
2.1 Materials
All polymers and chemicals were used as received without any further purification.
Methanol was purchased from Fisher Scientific and dichloromethane was purchased
from Macron Chemicals. All solvents used in sample preparation and solubility testing were
of ACS certified purity grade.
4MC-PC, BPA-TMC-PC 9371, Lexan 145 BPA-PC, Teijin-PC, N-PC, TCD-PC,
T(60)Az-N, and T(80)Az-N were generously donated by Eastman Kodak.
2.2 Instrumentation
Glass transition temperature data were obtained using a Perkin Elmer Diamond DSC
and a TA Instruments DSC 2010, both cooled by liquid nitrogen. A temperature calibration
was performed with an indium sample, and the instrument calibration was adjusted to be
within 0.05°C of the indium melting point, 156.60°C. All samples were prepared in a capped
but not hermetically sealed aluminum pan. All samples followed a several-step analysis
process that consisted of at least two heating cycles according to the typical process shown
below. Typically, the final heating temperature would be 50°C higher than the highest Tg of
the blended polymers, but no more than 300°C as this is the highest temperature the
instrument is capable of reaching. After each heating and cooling cycle, the temperature was
held for 0.1 and 5 minutes, respectively. The onset, midpoint, endpoint, and ΔCp of all glass
transition temperatures were reported. The process shown below was used for the TCD-PC
polymer and its corresponding blends.

17
Step 1 – Heat to 300°C at 20°C/min
Step 2 – Hold at 300°C for 0.1 min
Step 3 – Cool to 20°C at 320°C/min
Step 4 – Hold at 20°C for 5.0 min
Step 5 – Reheat to 300°C at 20°C/min
2.3 Blend preparation
Blends were prepared by solution blending and precipitating into methanol, following
the methods of other blends preparations.3,21 5% polymer in dichloromethane solutions were
prepared (0.125g/2.5mL) and were allowed to stir for an hour. Dichloromethane was a
suitable solvent for every polymer except for the T(80)Az-N polymer which was prepared in
a 50:50 mixture of THF and dichloromethane. This solvent mixture was discovered by
performing a solubility test on this polymer.
For 50:50 blends, equal volumes of two different polymer solutions were mixed with
stirring. This solution was then precipitated by slowly adding it to 150 mL of methanol, the
non-solvent, with stirring. The solution was suction filtered to obtain a white precipitate.
The polycarbonate and polyester blend materials were allowed to air dry on a watch glass
overnight and were then transferred to a scintillation vial and placed in a vacuum oven to dry
for approximately 48 hours at a temperature no higher than 70°C. The temperature was not
allowed to exceed 70°C so it would not reach the glass transition temperature of some of the
material it was drying.
For 25:75 blends, the same procedure was followed except 2.5 mL of one 5%
polymer solution was mixed with 7.5 mL of the other 5% polymer solution. The 50:50

18
blends were considered first to determine the general extent of miscibility. From these
results, other compositions of chosen blends were examined. When blending a polymer with
a BPA-PC polymer, it was first blended with the lower molecular weight Teijin-PC, the
reasoning being that if there were no signs of miscibility with the lower molecular BPA-PC,
Teijin-PC, there would not be miscibility with the higher molecular weight Lexan 145 BPA-
PC. Table 1 shows the 50:50 polymer blends that were prepared and Table 2 shows the
25:75 polymer blends that were prepared. Some of the same blends were prepared in a 75:25
ratio to complete the series.
Table 1. 50:50 Polymer Blends
Polymer 1 (50%) Polymer 2 (50%) Blend 1 T(80)Az-N BPA-TMC-PC 9371 Blend 2 T(80)Az-N Lexan 145 BPA-PC Blend 3 T(80)Az-N N-PC Blend 4 4MC-PC Teijin-PC Blend 5 T(80)Az-N T(60)Az-N Blend 6 Lexan 145 BPA-PC BPA-TMC-PC 9371 Blend 7 4MC-PC BPA-TMC-PC 9371 Blend 8 T(60)Az-N BPA-TMC-PC 9371 Blend 9 N-PC BPA-TMC-PC 9371 Blend 10 T(60)Az-N Lexan 145 BPA-PC Blend 11 Lexan 145 BPA-PC N-PC Blend 12 T(80)Az-N Teijin-PC Blend 13 T(60)Az-N TCD-PC Blend 14 T(60)Az-N N-PC Blend 15 TCD-PC N-PC Blend 16 TCD-PC Teijin-PC Blend 17 TCD-PC T(80)Az-N Blend 18 TCD-PC BPA-TMC-PC 9371

19
Table 2. 25:75 Series Polymer Blends
Polymer 1 (25%) Polymer 2 (75%) Blend 19 BPA-TMC-PC 9371 Lexan 145 Blend 20 Lexan 145 BPA-TMC-PC 9371 Blend 21 N-PC Lexan 145 Blend 22 Lexan 145 N-PC Blend 23 TCD-PC Teijin-PC Blend 24 Teijin-PC TCD-PC
2.4 Solubility test – T(80)Az-N
5% polymer solutions of T(80)Az-N (0.25g) in 5mL of various solvents were
prepared. The polymer was added to the solvents with stirring and was allowed to stir for an
hour. The solvents used were acrylonitrile, dimethyl sulfoxide, dimethylformamide,
isopropanol, dioxane, acetone, methyl ethyl ketone, n-propyl acetate, tetrahydrofuran,
chloroform, toluene, and dichloromethane.

20
3.0 Results and Discussion
Various types of polycarbonates and polyesters can be blended together in order to
obtain more ideal thermal properties than those of the individual polymers themselves. The
objective of the present research is to explore how the structural content of polycarbonates
and polyesters affects the thermal properties of the polymer blends through looking at the
glass transition temperature. It is expected that blends with similar structural content will
result in a miscible blend, and with increasing differences there may be less miscibility. The
structures of the polycarbonates and polyesters explored in this study are shown in Table 3.
Table 3. Structures of Polycarbonates and Polyesters
Polymer Structure
4MC-PC
BPA-TMC-PC 9371
Lexan 145 BPA-PC
Teijin-PC
(low MW BPA-PC)

21
N-PC
TCD-PC
T(60)Az-N
T(80)Az-N
3.1 Polycarbonate and polyester structural makeup
The polycarbonates used were 4MC-PC, BPA-TMC-PC 9371, Lexan 145 BPA-PC,
Teijin-PC, N-PC, and TCD-PC. In their structure content, they all contain carbonate groups
(-O-(C=O)-O); however they differ in the rest of their chemical make-up. 4MC-PC is a
polycarbonate of 1,4-dioxy-2,2,4,4-tetramethylcyclobutane and is the only polycarbonate
O O
On
22
with complete aliphatic character as it is made up of a cyclobutane and four methyl groups.
BPA-TMC-PC 9371, N-PC, and TCD-PC all have a mix of aliphatic and aromatic character.
The BPA-TMC-PC 9371 is a copolycarbonate based on bisphenol-A and 1,1-bis(4-
hydroxyphenyl)-3,3,5-trimethylcyclohexane. This is believed to be a random copolymer and
is made up of 37% of the BPA monomer and 63% the TMC monomer. The overall structure
of the TMC portion contains two benzene rings as well as a saturated
trimethylcyclohexanone ring. The BPA portion contains two benzene rings and an
isopropylidene group. N-PC is a poly(oxycarbonyloxy-1,4-phenylene-norbornylidene-1,4-
phenylene) and has two benzene rings as well as a saturated bridged cyclohexane ring. TCD-
PC is a poly(oxycarbonyloxy-1,4-phenylene-tricyclodecylidene-1,4-phenylene). The
structure of TCD-PC is made up of two benzene rings contributing to its aromatic character
as well as a saturated bridged cyclohexane and a cyclopentane which contribute to its
aliphatic character. Lexan 145 BPA-PC and Teijin-PC have the same structural make up.
Teijin-PC is a lower molecular weight polymer than Lexan 145 BPA-PC. They are a
poly(oxycarbonyloxy-1,4-phenylene-isopropylidene-1,4-phenylene) and have a mix of
saturated and unsaturated structural content due to the two aromatic rings and an
isopropylidene group.
The polyesters explored in this study were T(60)Az-N and T(80)Az-N. The T(60)Az-
N is a poly[4,4’-(2-norbornylidene)diphenyl-co-(40%)terephthalic acid/(60%)azelaic acid]
and T(80)Az-N is the same polymer, except with 20% terephthalic acid and 80% azelaic
acid. T(60)Az-N and T(80)Az-N can be synthesized by the condensation polymerization of
4,4’-(2-norbornylidene)diphenol and terephthalic acid/azelaic acid chlorides with a 40/60 or
20/80 molar ratio, respectively. These polyesters are random copolymers because although
23
every other unit is N, whether the next unit is a T or Az is random. Both exhibit aliphatic and
aromatic character. The T portion comes from terephthalic acid and is aromatic, the Az
portion comes from azelaic acid and is aliphatic bearing seven methylene groups between the
two carbonyls, and the N portion comes from norbornylidene and is both aromatic and
aliphatic. The only difference between the two polyesters is the ratio of T:Az.
3.2 Polymer blend preparation results
There are a variety of methods to prepare polymer blends. The blends in this study
were prepared by solution blending and precipitation. Polymers were dissolved in
dichloromethane and a clear solution was obtained, which is required in order to have proper
homogenous blending in the next step. All polymers were fully miscible in dichloromethane,
except T(80)Az-N. Dichloromethane was chosen as the main solvent due to its compatibility
with the polymer samples and its low boiling point allowing for easy removal from the
polymer samples.
To prepare the blends, two of the individually dissolved polymers were combined and
a clear solution was obtained in all instances. The combined solution was precipitated
dropwise in methanol and, upon addition, the blended polymers immediately precipitated out
and a cloudy solution resulted. Methanol was used to precipitate the blends because it is a
low boiling solvent that all polymers were insoluble in and that could be easily removed from
the samples. This was followed by suction filtration and the precipitate was dried in a 70°C
vacuum oven for approximately 48 hours to ensure the blends were sufficiently free of
solvent. The precipitates ranged from white powders to a white netted material.

24
3.3 Solubility test results for T(80)Az-N
A solubility test was performed on the T(80)Az-N polyester to determine if there was
a more ideal solvent to use for the solution blending. Along with dichloromethane (DCM),
the other different solvents tested on T(80)Az-N were dimethylsulfoxide (DMSO),
dimethylformamide (DMF), isopropyl alcohol (i-PrOH), dioxane (Diox), acetone (Acet),
methylethyl ketone (MEK), n-propylacetate (PrOAc), tetrahydrofuran (THF), chloroform
(CHCl3), and toluene (Tol). The results of the solubility test are shown in a Wiehe 2-
dimensional solubility parameter plot (Figure 9).30 Solvents were rated on a scale from 1 to
6, with 1 being the most soluble and 6 being the least soluble. CHCl3 (1), THF (1), Diox (1),
and DMF (1) were the best solvents for T(80)Az-N. The less ideal solvents were DMSO (2),
MEK (2.5), PrOAc (2.5), Acet (3), Tol (3), and DCM (3). i-PrOH (6) was the worst solvent.
It was found that THF was the most ideal solvent to use due to its lower boiling point
compared to DIOX and DMF and its lower toxicity than CHCl3. T(80)Az-N was tested in a
50/50 solution of THF and dichloromethane so that there would be a greater ratio of DCM to
THF in the overall blend. This produced a clear solution ensuring that the polymer was
soluble.

25
Figure 9. Wiehe 2-Dimensional Solubility Parameter Plot
3.4 Thermal analysis of polymers and blends
The individual polymers and blends were analyzed by differential scanning
calorimetry (DSC). Samples (10 mg-15 mg) were sealed in aluminum pans and followed a
sequence of heating, cooling, and isothermal steps. There were at least two heating cycles
performed so that the sample would have a thermal history and the samples were heated to at
least 50°C higher than the expected Tg of the polymer, but no higher than 300°C. The onset,
midpoint, endpoint, and ΔCp for all individual polymers are shown in Table 4 and the
subsequent DSC spectra for each polymer is shown in the Appendix in Figures 18-25. The
midpoint is the reported value, but the onset and endpoint Tg’s were looked at in order to
determine how broad the transition was. A very broad transition would mean that there
0
2
4
6
8
10
7 7.5 8 8.5 9 9.5 10
Complexing Solubility Co
mpo
nent
Field Force Solubility Parameter Component
2‐D Solubility Parameter for T(80)Az‐N
Tol
CHCl3
DCM
iPrOHDMF
THF
Diox
DMSO
MEK PrOAc
Acet Key To Solvent Map
○ = soluble
Δ = slightly sol.
□ = swollen
■ = not soluble

26
would be a lower degree of homogeneity in the polymer blend. Although the Tg data are
reported to the second decimal place for computational purposes, the Tg values measured are
uncertain to + 0.2°C, and the ΔCp values are uncertain to + 0.02 J/g°C. For the blends the
uncertainty in ΔCp is estimated to be + 20%.
Table 4. DSC Data for Polymers Tg (°C)
Sample Onset Mid End ΔCp 4MC-PC 115.36 135.18 142.69 0.12
BPA-TMC-PC 9371 207.50 213.39 217.65 0.16 Lexan 145 BPA-PC 150.41 152.71 154.71 0.19
Teijin-PC 145.99 149.48 151.90 0.20 N-PC 223.12 235.50 241.83 0.16
TCD-PC 261.92 267.11 270.48 0.20 T(60)Az-N 138.08 147.17 155.44 0.22 T(80)Az-N 73.25 74.84 76.56 0.03
Based on the above Tg values for the individual polymers, the 50:50 polymer blends
were analyzed by DSC in a similar method. There were PC-PC blends, PC-PE, and PE-PE
blends studied. The samples underwent at least two heating cycles and were heated to at
least 50°C higher than the polymer with the highest Tg to ensure that a wide enough
temperature range in which a Tg could potentially occur in would be analyzed. The onset,
midpoint, endpoint, ΔCp, and calculated Fox Tg for all polymer blends are shown in Table 5.
Some blends exhibited two Tg’s, a lower and higher one, each represented with an L and H,
respectively. It is necessary to know the Fox Tg in order to determine the degree of
miscibility of the blend. The proximity of the measured Tg to the calculated Fox Tg will
determine this.

27
Table 5. DSC Data for Polymer Blends
Blend Polymer 1 Polymer 2 Onset (°C)
Midpoint (°C)
Endpoint (°C) ΔCp
Fox Tg (°C)
1 T(80)Az-N BPA-TMC-PC 9371 157.65 163.81 171.57 0.22 132.62 2L T(80)Az-N Lexan 145 73.26 74.95 77.34 0.03 109.86 2H T(80)Az-N Lexan 145 120.83 133.25 142.18 0.34 3L T(80)Az-N N-PC 69.58 94.34 119.77 0.07 140.10 3H T(80)Az-N N-PC 168.86 177.67 188.05 0.13 4 4MC-PC Teijin-PC 143.84 149.73 153.07 0.10 142.25 5 T(80)Az-N T(60)Az-N 124.59 133.49 142.97 0.20 107.60 6 Lexan 145 BPA-TMC-PC 9371 180.02 181.36 182.54 0.07 181.03
7L 4MC-PC BPA-TMC-PC 9371 115.71 123.14 127.42 0.05 170.87 7H 4MC-PC BPA-TMC-PC 9371 205.98 209.28 211.14 0.06 8L T(60)Az-N BPA-TMC-PC 9371 130.90 141.48 153.00 0.05 177.86 8H T(60)Az-N BPA-TMC-PC 9371 173.40 182.99 188.00 0.11 9 N-PC BPA-TMC-PC 9371 211.90 219.82 224.86 0.16 224.20
10L T(60)Az-N Lexan 145 140.14 143.49 148.16 0.05 149.92 10H T(60)Az-N Lexan 145 149.13 153.94 155.54 0.10 11 Lexan 145 N-PC 178.04 186.59 194.40 0.16 190.44
12L T(80)Az-N Teijin-PC 126.44 132.47 138.04 0.12 108.59 12H T(80)Az-N Teijin-PC 151.54 157.74 161.10 0.01 13 T(60)Az-N TCD-PC 188.71 195.00 203.96 0.10 199.65 14 T(60)Az-N N-PC 174.08 212.53 234.08 0.23 187.14 15 TCD-PC N-PC 244.00 249.37 254.00 0.16 250.83
16L TCD-PC Teijin-PC 183.08 190.69 198.82 0.18 201.17 16H TCD-PC Teijin-PC 225.72 233.99 240.74 0.08 17L TCD-PC T(80)Az-N 176.08 184.38 191.53 0.17 150.17 17H TCD-PC T(80)Az-N 221.80 230.21 238.60 0.08 18 TCD-PC BPA-TMC-PC 9371 221.40 231.71 241.76 0.16 238.84
3.5 Miscibility of 50:50 polymer blends
There was a general criterion followed for determining the degree of miscibility of
the polymer blends. In order for a blend to be classified as miscible (M), it would have to
demonstrate a single Tg within a few degrees of the calculated Tg from the Fox equation.
There are two different possible criteria for a blend to be partially miscible (PM). The blend
would have two Tg’s that were intermediate between the constituent Tg’s, or would have one
Tg intermediate between the constituent Tg’s which would be substantially different from the

28
Fox equation Tg. This second criterion was to account for the lack of resolution of the
second Tg by DSC that often occurs in polymer blends. A blend was classified as immiscible
(IM) if there were two Tg’s very close to the Tg’s of each polymer in the blend. In the case
that a blend was very slightly miscible (VSM), the glass transition behavior would be
somewhere between PM and IM. The miscibility results are summarized in Table 6.
Table 6. Miscibility Results of Polymer Blends
T(80
)Az-
N
BPA
-TM
C 9
371
Lexa
n 14
5
Teiji
n-PC
N-P
C
4MC
-PC
T(60
)Az-
N
TCD
-PC
T(80)Az-N PM PM PM PM PM PM
BPA-TMC 9371 PM M M VSM PM M
Lexan 145 PM M M IM
Teijin-PC PM IM PM
N-PC PM M M PM M
4MC-PC VSM IM
T(60)Az-N PM PM IM PM PM
TCD-PC PM M PM M PM

29
3.6 Fully miscible PC-PC blends
Out of the 18 blends explored in this study, five were fully miscible and all were PC-
PC blends. BPA-TMC-PC 9371 and Lexan 145 BPA-PC were fully miscible. This blend
exhibited a single Tg at 181.36°C, which is only 0.33°C higher than the calculated Fox Tg of
181.03°C. These two polymers have similar structural content since both have aromatic and
aliphatic moieties. The BPA-TMC-PC 9371 is a copolymer that is made up of a BPA group
and a TMC group, while Lexan 145 BPA-PC is a bisphenol-A. The similarity of both having
a BPA group and a similar enough ratio of aliphatic and aromatic character in both structures
is why this blend was fully miscible. This result agrees with Paul and Haggard’s work as
their work also resulted in a miscible blend between BPA-TMC-PC 9371 and a BPA-PC.28
BPA-TMC-PC 9371 and N-PC was a fully miscible blend which had a single glass
transition at 219.82°C which is just a few degrees lower than 224.20°C, which is the Fox Tg.
These two polymers both have aromatic and aliphatic group content. The TMC portion of
the copolymer BPA-TMC-PC 9371 has aliphatic character due to the trimethyl substituted
cyclohexane ring and aromatic character from the two benzene rings. N-PC has a similar
structure in that it has an aliphatic norbornylidene ring in between two aromatic benzene
rings. This similarity in structural content from a similar ratio of aromatic and aliphatic
content brought about a fully miscible blend.
Another fully miscible blend was BPA-TMC-PC 9371 and TCD-PC. This blend had
a single Tg at 231.71°C, which is in close proximity to the Fox Tg of 238.84°C. The
tricyclodecane ring system in the TCD-PC is highly aliphatic, as is the trimethyl substituted
cyclohexane in the BPA-TMC-PC 9371. Both also have aromatic benzene rings and this
correlation in structure brought about a fully miscible blend.

30
TCD-PC and N-PC was another fully miscible blend. This blend exhibited a single
Tg at 249.37°C and is 1.46°C lower than the calculated Fox Tg of 250.83°C. Structurally,
these two polymers are very similar with the aromatic benzene rings and the two large
aliphatic ring systems. TCD-PC has the tricyclodecane group and the N-PC has a
norbornene group, both of which are largely aliphatic. Their close structural similarities
resulted in a fully miscible blend.
The final fully miscible blend was Lexan 145 BPA-PC and N-PC. This blend had a
single Tg of 186.59°C and is less than 4°C away from the Fox Tg of 190.44°C. Like the other
fully miscible blends, these two polymers had both aromatic and aliphatic character that was
similar enough to bring about a fully miscible blend. The DSC for this blend is shown in
Figure 10. The DSC scans for the other fully miscible blends can be found in the Appendix
in Figures 26-29.
Figure 10. DSC scan of 50:50 Lexan 145 BPA-PC: N-PC Blend

31
3.7 Non-fully miscible PC-PC blends
Despite the full miscibility that was discovered between the above PC-PC blends, not
all PC-PC blends were fully miscible. The blend of Teijin-PC and TCD-PC was partially
miscible and had two Tg’s in between the comprising polymers. The lower glass transition
was 190.69°C and the higher was 233.99°C, with a Fox Tg of 201.17°C. The structures of
these two polymers differed in that the structure of the TCD-PC is more more aliphatic in
comparison with the BPA structure of the Teijin-PC. The saturated tricyclodecylidene group
of TCD-PC is significantly more aliphatic that the isopropylidene group of the Teijin-PC,
which was enough of a difference to make this a partially miscible blend. Since TCD-PC
was not miscible with Teijin-PC, it would not be miscible with the higher molecular Lexan
145 BPA-PC.
There were two PC-PC blends that were immiscible or very slightly miscible, and
both blends involved the 4MC-PC polymer. This was the only polycarbonate that that was
completely aliphatic, as opposed to the other polycarbonates that had a mix of aliphatic and
aromatic character. The blend of 4MC-PC and Teijin-PC exhibited a single Tg at 149.73°C,
and the Fox Tg was 142.25°C. Individually, the glass transitions of 4MC-PC and Teijin-PC
are 135.18°C and 149.48°C, respectively. The measured Tg just about matches the Tg for
Teijin-PC, which indicated that they are immiscible. Also, the low ΔCp for the blend 0.099
J/g°C indicated that there is another phase present that is unresolved by the DSC. This result
also indicated that there would not be miscibility in a blend of 4MC-PC and Lexan 145 BPA-
PC, since Lexan 145 BPA-PC is of a higher molecular weight than Teijin-PC.
The blend between BPA-TMC-PC 9371 and 4MC-PC was only very slightly
miscible. There were two glass transitions, the lower at 123.14°C and the higher at

32
209.28°C. The individual Tg’s of 4MC-PC and BPA-TMC-PC 9371 are 135.18°C and
213.39°C, respectively. The lower Tg of the blend is lower than the lowest Tg of the
individual polymers; this phenomenon is discussed later. Since the higher Tg phase had a Tg
that was only 4°C lower than that of the BPA-TMC-PC 9371, this blend is very slightly
miscible. This is not surprising due to the differences in structure content between the two
polymers.
These results showing the 4MC-PC has a very low miscibility with other polymers
with a mix of aliphatic and aromatic character are consistent with the results of Cruz, et al.
for methyl-substituted aliphatic polyester blends with BPA-PC, which were much less
miscible than analogous linear aliphatic blends.26
There was another interesting result that came from the 4MC-PC and BPA-TMC-PC
9371 blend. There were two peaks that represented crystallization and melting temperatures
that were present at 179.62°C and 258.98°C, respectively. Although each of the individual
polymers are not crystalline, when blended together, a crystalline blend resulted. The
crystallization and melting peaks are from the 4MC-PC phase because for there to be
crystallization the polymer must be above its Tg. A similar phenomenon was seen in work by
Cruz, Paul, et al., in BPA-PC/aliphatic polyester blends.24 Although BPA-PC is not itself
melt crystallizable under DSC conditions, its blends with aliphatic polyester were. The DSC
for the 4MC-PC and BPA-TMC-PC 9371 blend is shown in Figure 11 and the DSC scans of
the other two blends can be found in Figures 30 and 31 in the appendix.

33
Figure 11. DSC scan of 50:50 4MC-PC:BPA-TMC-PC 9371 Blend
3.8 PE-PC miscibility results
None of the PC-PE and PE-PE blends studied were fully miscible. They all resulted
in, at most, partial miscibility. The actual weight fractions of each polymer present in each
phase of the blends were calculated and are shown in Table 7, and this reflects the miscibility
of these non-fully miscible blends. In order to calculate the exact weight fractions in the
polymer blends the Fox equation was used again from Equation 3.

34
Table 7. Weight Fraction in Polymer Blends
Polymer 1 Polymer 2 w1 w2
T(80)Az-N BPA-TMC-PC 9371 0.28 0.72
T(80)Az-N (PE rich phase) Lexan 145 (PE rich phase) 0.9983 0.0017
T(80)Az-N (PC rich phase) Lexan 145 (PC rich phase) 0.21 0.79
T(80)Az-N (PE rich phase) N-PC (PE rich phase) 0.83 0.17
T(80)Az-N (PC rich phase) N-PC (PC rich phase) 0.28 0.72
T(80)Az-N (PC rich phase) TCD-PC (PC rich phase) 0.33 0.67
T(80)Az-N (PC rich phase) TCD-PC (PC rich phase) 0.13 0.87
T(80)Az-N (PC rich phase) Teijin-PC (PC rich phase) 0.20 0.80
T(80)Az-N (PC rich phase) Teijin-PC (PC rich phase) ____* ____*
T(60)Az-N (PE rich phase) BPA-TMC-PC 9371 (PE rich phase) ____* ____*
T(60)Az-N (PC rich phase) BPA-TMC-PC 9371 (PC rich phase) 0.42 0.58
T(60)Az-N (PE rich phase) Lexan 145 (PE rich phase) ____* ____*
T(60)Az-N (PC rich phase) Lexan 145 (PC rich phase) ____* ____*
T(60)Az-N TCD-PC 0.54 0.46
T(60)Az-N N-PC 0.22 0.78
T(60)Az-N T(80)Az-N 0.84 0.16
*Composition could not be calculated from data (see discussion).
3.9 T(80)Az-N and PC blend results
From the calculated weight fractions, it can be determined which blends had the
greater degree of miscibility from the non-fully miscible blends. The polycarbonates that

35
T(80)Az-N was blended with were BPA-TMC-PC 9371, Lexan 145 BPA-PC, Teijin-PC, N-
PC, and TCD-PC. All of these blends were partially miscible with either two glass
transitions or one Tg that was not close to the calculated Fox Tg. T(60)Az-N was blended
with same polycarbonates, except Teijin-PC. Both T(60)Az-N and T(80)Az-N are
copolyesters with both aromatic and aliphatic moieties, much like the polycarbonates they
were blended with. However, it comparison to the polycarbonates, the two polyesters have
more aliphatic character due to the norbornene ring in the N portion and the saturated seven
carbon chain of the Az portion Due to the greater amount of aliphatic character in the
polyesters than in the polycarbonates, the blends were no more than partially miscible.
Although all blends were partially miscible with T(80)Az-N, some polycarbonates
were more miscible than others with T(80)Az-N. T(80)Az-N was more miscible with BPA-
TMC-PC 9371, N-PC, and TCD-PC because they have more aliphatic character than Lexan
145 BPA-PC and Teijin-PC. The blend of T(80)Az-N and BPA-TMC-PC 9371 had a single
Tg at 163.81°C, compared to the Fox Tg of 132.62°C. By looking at the weight fractions, it
can be seen that the blend phase having a Tg of 163.81°C was PC rich with 28% of the blend
being T(80)Az-N. There were two Tg’s from the T(80)Az-N and N-PC blend at 94.34°C and
177.67°C, with a Fox Tg of 140.10°C. The lower Tg phase is PE rich with 17% being
composed of N-PC, while the higher Tg phase is PC rich with 28% being composed of the
PE. The blend of T(80)Az-N and TCD-PC had two Tg’s at 184.38°C and 230.21°C, with a
Fox Tg of 150.17°C. Both phases were rich in PC with the lower having 33% PE and the
higher having 13% PE.
The blends of T(80)Az-N with Lexan 145 BPA-PC and Teijin-PC were less partially
miscible. The blend with Lexan 145 BPA-PC resulted in two Tg’s at 74.95°C and 133.25°C,

36
with a Fox Tg of 109.86°C. The lower Tg phase is PE rich with 99.8% T(80)Az-N and the
higher is PC rich with 79% Lexan 145 BPA-PC. The blend of T(80)Az-N and Teijin-PC had
two Tg’s at 132.47°C and 157.74°C, compared to the Fox Tg of 108.59°C. The lower Tg was
PC rich with 80% Teijin-PC. However, a weight fraction for the higher Tg phase could not
be calculated because it was higher than the highest Tg of the individual polymers. This
phenomenon is explained later.
BPA-TMC-PC 9371, N-PC, and TCD-PC have more aliphatic character in their
structural content than Lexan 145 BPA-PC and Teijin-PC do. T(80)Az-N has a large amount
of aliphatic character, so even though the polycarbonates do not have as much, it makes
sense for it to be more miscible with the polycarbonates with the most aliphatic character.
The DSC for the T(80)Az-N and Teijin-PC blend is shown in Figure 12 and the other spectra
can be found in the appendix in Figures 32-35.
Figure 12. DSC scan of 50:50 T(80)Az-N:Teijin-PC Blend

37
3.10 T(60)Az-N and PC blend results
From the polycarbonates blended with T(60)Az-N, all but one was partially miscible.
T(60)Az-N was partially miscible with TCD-PC, N-PC, and BPA-TMC-PC 9371, which all
have aliphatic ring systems in their structural content. When it was blended with TCD-PC,
one Tg resulted at 195.00°C with a Fox Tg of 199.65°C. Although the measured Tg is
proximately close to the Fox Tg, the DSC trace was incredibly noisy with a variety of other
peaks present. This blend was slightly PE rich, with 54% T(60)Az-N. The blend of
T(60)Az-N and N-PC had a single Tg of 212.53°C compared to the Fox Tg of 187.14°C. This
blend was PC rich with 78% N-PC. When T(60)Az-N was blended with BPA-TMC-PC
9371 two Tg’s resulted at 141.48°C and 182.99°C and had a Fox Tg of 177.86°C. The lower
Tg was lower than that of the polymer with the lowest Tg and, therefore, the weight fractions
could not be calculated. The higher Tg phase was slightly PC rich with 58% BPA-TMC-PC
9371. These polycarbonates have more aliphatic character than Lexan 145 BPA-PC, which
when blended with T(60)Az-N was immiscible. The DSC for the T(60)Az-N and N-PC
blend is very broad and is shown in Figure 13 and the remaining PC-PE DSC traces can be
found in the appendix in Figures 36 and 37. This broad peak, 50 degrees separating the onset
from the endpoint, indicates that although it’s a single phase, there is a degree of
heterogeneity in the blend.

38
Figure 13. DSC scan of 50:50 T60)Az-N:N-PC Blend
The blend of T(60)Az-N with Lexan 145 BPA-PC had two Tg’s that exhibited a PE
rich phase and a PC rich phase, which were entirely composed of the polyester and the
polycarbonate, respectively. This blend had two Tg’s at 143.49°C and 153.94°C, with a Fox
Tg of 149.92°C. Neither of these fall between the Tg’s of the individual polymers with the
Tg’s of T(60)Az-N and Lexan145 BPA-PC, 147.17°C and 152.71°C respectively. The lower
Tg of the blend was lower than the Tg of the polyester and the higher Tg of the blend was
higher than the Tg of the polycarbonate. This seemingly paradoxical result can be explained
by the lower molecular weight portion of the Lexan 145 BPA-PC, which can be composed of
very low molecular weight oligomers having low Tg’s, dissolving in the PE phase, lowering
its Tg and leaving behind a higher Tg PC phase. This makes it impossible to calculate the
composition of the two phases from their constituent Tg’s. The presence of low molecular
weight fractions is also responsible for other Tg results lying outside the constituent Tg range
of the blends. This DSC scan can be found in Figure 38 in the appendix.

39
The results of the T(60)Az-N and T(80)Az-N blends with with BPA-PC is
understandable when relating them to the work of Yang and Yetter.21 Yang and Yetter
studied T(40)Az-N, which has more aromatic content than aliphatic, with Lexan 145 BPA-
PC. T(40)Az-N was miscible with Lexan 145 BPA-PC, while the results in this study
showed that Lexan 145 BPA-PC was partially miscible with T(80)Az-N and immiscible with
T(60)Az-N. Since Lexan 145 BPA-PC has more aromatic content than aliphatic, it should
more miscible with T(40)Az-N, which also has more aromatic character than aliphatic. Since
T(60)Az-N and T(80)Az-N have more aliphatic content, they are not as miscible with Lexan
145 BPA-PC.
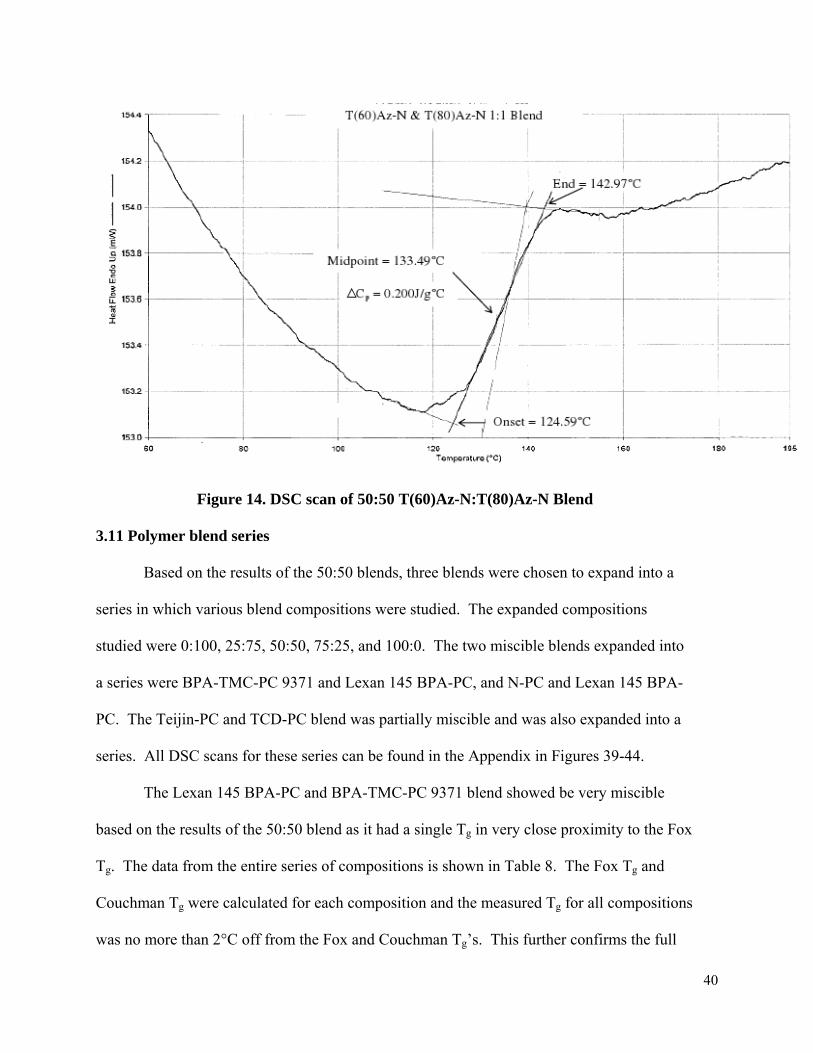
The two polyesters, T(60)Az-N and T(80)Az-N, were blended together and resulted
with a single Tg at 133.49°C compared to its Fox Tg of 107.60°C. Since the measured Tg was
not close to the calculated Fox Tg, this blend was determined to be partially miscible. The
T(60)Az-N took better to the blend as it was 84% T(60)Az-N and 16% T(80)Az-N. These
copolyesters have the same structure; however their overall composition is not the same. The
ratio of T:Az for T(60)Az-N and T(80)Az-N is 0.4:0.6 and 0.2:0.8, respectively. T represents
an aromatic component, while Az represents the aliphatic component. This difference
between their content, although not very large, was enough to alter their solubility and to
prevent the formation of a fully miscible blend. This phenomenon has been observed in
other copolymer blends of differing compositions where there was low miscibility and phase
separation.31 The calculated weight fractions of the T(60)Az-N and T(80)Az-N blend
showed that there was a greater fraction of T(60)Az-N miscible in the blend and their
differences in ratios of aliphatic and aromatic group content explains the partial miscibility.
The DSC spectrum for this blend is shown in Figure 14.
40
Figure 14. DSC scan of 50:50 T(60)Az-N:T(80)Az-N Blend
3.11 Polymer blend series
Based on the results of the 50:50 blends, three blends were chosen to expand into a
series in which various blend compositions were studied. The expanded compositions
studied were 0:100, 25:75, 50:50, 75:25, and 100:0. The two miscible blends expanded into
a series were BPA-TMC-PC 9371 and Lexan 145 BPA-PC, and N-PC and Lexan 145 BPA-
PC. The Teijin-PC and TCD-PC blend was partially miscible and was also expanded into a
series. All DSC scans for these series can be found in the Appendix in Figures 39-44.
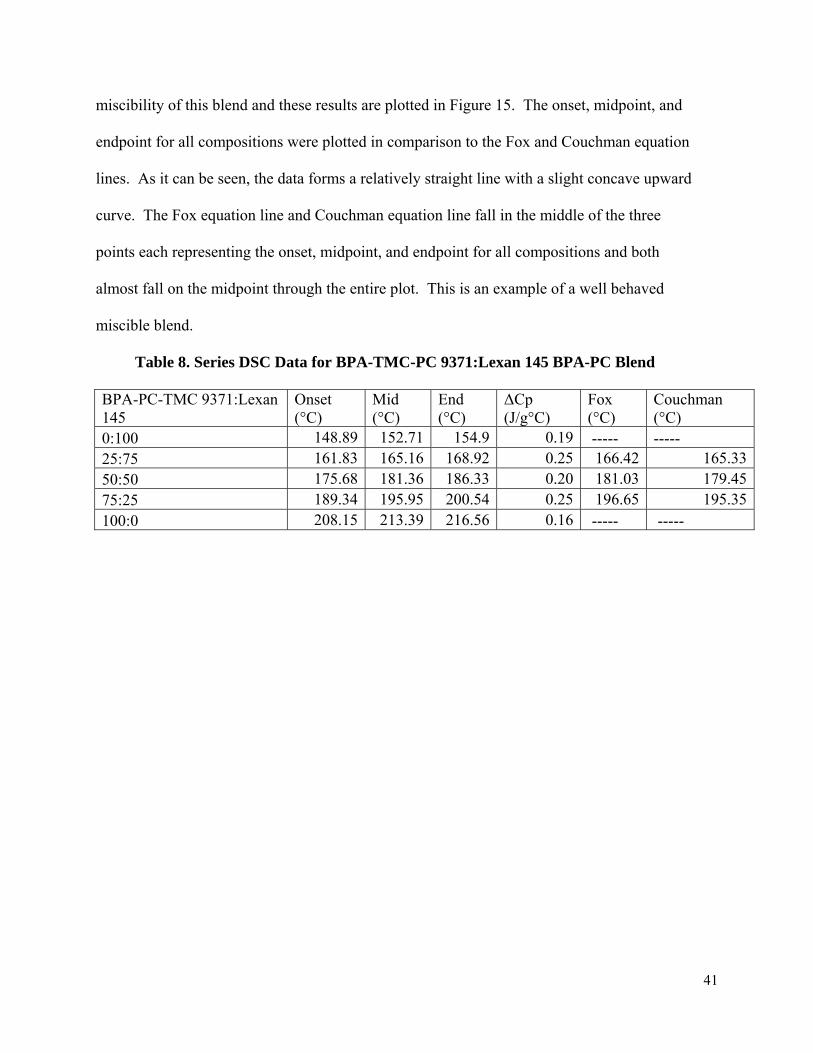
The Lexan 145 BPA-PC and BPA-TMC-PC 9371 blend showed be very miscible
based on the results of the 50:50 blend as it had a single Tg in very close proximity to the Fox
Tg. The data from the entire series of compositions is shown in Table 8. The Fox Tg and
Couchman Tg were calculated for each composition and the measured Tg for all compositions
was no more than 2°C off from the Fox and Couchman Tg’s. This further confirms the full
41
miscibility of this blend and these results are plotted in Figure 15. The onset, midpoint, and
endpoint for all compositions were plotted in comparison to the Fox and Couchman equation
lines. As it can be seen, the data forms a relatively straight line with a slight concave upward
curve. The Fox equation line and Couchman equation line fall in the middle of the three
points each representing the onset, midpoint, and endpoint for all compositions and both
almost fall on the midpoint through the entire plot. This is an example of a well behaved
miscible blend.
Table 8. Series DSC Data for BPA-TMC-PC 9371:Lexan 145 BPA-PC Blend
BPA-PC-TMC 9371:Lexan 145
Onset (°C)
Mid (°C)
End (°C)
ΔCp (J/g°C)
Fox (°C)
Couchman (°C)
0:100 148.89 152.71 154.9 0.19 ----- ----- 25:75 161.83 165.16 168.92 0.25 166.42 165.3350:50 175.68 181.36 186.33 0.20 181.03 179.4575:25 189.34 195.95 200.54 0.25 196.65 195.35100:0 208.15 213.39 216.56 0.16 ----- -----

42
Figure 15. BPA-TMC-PC 9371:Lexan 145-BPA-PC Series Blend Data Plot
The N-PC and Lexan 145 BPA-PC blend was another fully miscible blend that
exhibited a single Tg in close proximity to the calculated Fox and Couchman Tg’s. The onset,
midpoint, end point, ΔCp, Fox Tg, and Couchman Tg are shown in Table 9. The Couchman
equation gives a slightly better fit to the data than the Fox equation does. Each of the
calculated Tg’s were very close to the measured Tg’s at the varying compositions being that
they were no more than 6°C different, showing the blend’s full miscibility. The data are also
plotted in Figure 16. The measured Tg points form a slight concave curve and the Fox and
Couchman equation lines follow this curve as they fall in between the three points for each
composition and hold fairly close to the midpoint of the curve. The correlation between the
measured Tg’s at each composition to the calculated Tg’s for each composition further shows
that this is a fully miscible blend across all compositions.
140.00
150.00
160.00
170.00
180.00
190.00
200.00
210.00
220.00
0 0.2 0.4 0.6 0.8 1
Tg (*
C)
fraction 9371
BPA‐TMC‐PC 9371 & Lexan 145 Series
Fox
midpoint
onset
end point
Couchman

43
Table 9. Series DSC Data for N-PC:Lexan 145 BPC-PC Blend N-PC:Lexan 145 BPA-PC
Onset (°C)
Mid (°C)
End (°C)
ΔCp (J/g°C)
Fox (°C)
Couchman (°C)
0:100 148.89 152.71 154.90 0.19 ----- ----- 25:75 162.88 168.92 176.20 0.15 170.77 169.6250:50 178.04 186.59 194.40 0.16 190.44 188.7475:25 200.00 206.44 217.35 0.13 211.92 210.51100:0 223.12 235.50 241.83 0.16 ----- -----
Figure 16. N-PC:Lexan 145 BPA-PC Series Blend Data Plot
The TCD-PC and Teijin-PC blend was partially miscible as it had two Tg’s
intermediate between the glass transitions of the constituent polymers. The data obtained
from the series of compositions that were tested are shown in Table 10. Each composition
exhibited two Tg’s, with the Fox and Couchman Tg’s falling in between. The data were
plotted and are shown in Figure 17. The Fox and Couchman Tg lines are slightly concave
120.00
140.00
160.00
180.00
200.00
220.00
240.00
260.00
280.00
0 0.2 0.4 0.6 0.8 1
Tg (*
C)
fraction N‐PC
N‐PC & Lexan 145 BPA‐PC series
Fox
onset
mid point
end point
Couchman
44
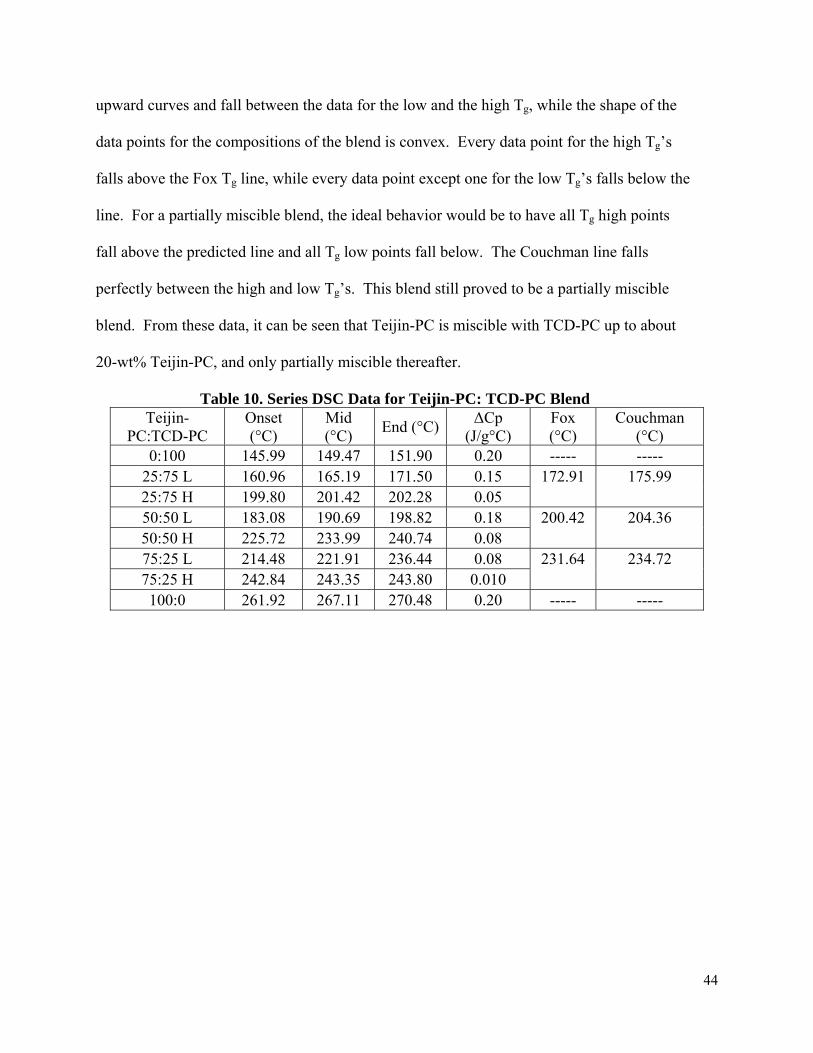
upward curves and fall between the data for the low and the high Tg, while the shape of the
data points for the compositions of the blend is convex. Every data point for the high Tg’s
falls above the Fox Tg line, while every data point except one for the low Tg’s falls below the
line. For a partially miscible blend, the ideal behavior would be to have all Tg high points
fall above the predicted line and all Tg low points fall below. The Couchman line falls
perfectly between the high and low Tg’s. This blend still proved to be a partially miscible
blend. From these data, it can be seen that Teijin-PC is miscible with TCD-PC up to about
20-wt% Teijin-PC, and only partially miscible thereafter.
Table 10. Series DSC Data for Teijin-PC: TCD-PC Blend Teijin-
PC:TCD-PC Onset (°C)
Mid (°C) End (°C) ΔCp
(J/g°C) Fox (°C)
Couchman (°C)
0:100 145.99 149.47 151.90 0.20 ----- ----- 25:75 L 160.96 165.19 171.50 0.15 172.91 175.99 25:75 H 199.80 201.42 202.28 0.05 50:50 L 183.08 190.69 198.82 0.18 200.42 204.36 50:50 H 225.72 233.99 240.74 0.08 75:25 L 214.48 221.91 236.44 0.08 231.64 234.72 75:25 H 242.84 243.35 243.80 0.010 100:0 261.92 267.11 270.48 0.20 ----- -----

45
Figure 17. TCD-PC:Teijin-PC Series Blend Data Plot
120.00
140.00
160.00
180.00
200.00
220.00
240.00
260.00
280.00
0 0.2 0.4 0.6 0.8 1
Tg (°C)
fraction TCD‐PC
TCD‐PC & Teijin‐PC series
Fox
Onset Low
Midpoint Low
End point low
Onset high
Midpoint high
End point high
Couchman

46
4.0 Conclusions and Future Directions
The present research explored the miscibility of polymer blends involving
polycarbonates and polyesters with differing structural content and it was proposed that
blends with similar structural content will result in a miscible blend, and with increasing
differences there may be less miscibility. The relationship between blend miscibility and
constituent polymer structure was established by examining blends of polyesters and
polycarbonates having a range of aliphatic and aromatic character. Solution blending and
precipitation was used to prepare blends and differential scanning calorimetry proved to be a
convenient and reliable method for characterizing the blend miscibility and phase behavior.
It was found that blends with similar structural content resulted in a miscible blend, and with
increasing differences there was less miscibility.
There were five fully miscible blends discovered, which were Lexan 145 BPA-PC
and BPA-TMC-PC 9371, N-PC and BPA-TMC-PC 9371, TCD-PC and BPA-TMC-PC 9371,
N-PC and Lexan 145 BPA-PC, and TCD-PC and N-PC. All these blends exhibited a single
Tg in between the Tg’s of the constituent polymers and close to the calculated Fox Tg.
T(80)Az-N blends with BPA-TMC-PC 9371, Lexan 145 BPA-PC, Teijin-PC, N-PC, TCD-
PC, and T(60)Az-N were partially miscible, along with BPA-TMC-PC 9371 and T(60)Az-N,
Teijin-PC and TDC-PC, N-PC and T(60)Az-N, and TCD-PC and T(60)Az-N. The blend that
showed to be immiscible was T(60)Az-N and Lexan 145. All partially miscible or
immiscible blends exhibited a single Tg not close to the calculated Tg, or two Tg’s more
similar to the Tg’s of the constituent polymers in the blend.
The polymer blends made in this study can be used for a variety of applications due to
their properties. Blends of polycarbonates and polyesters are able to be used in the

47
automobile industry and are used to make various parts of a car, including the bumper. Also,
the blends that were made that had higher thermal stability could be used in the medical
industry as they are capable of being sterilized.
For future work that can be done on this topic, computational studies on additional
blends should be done to determine more quantitatively the thermodynamic group interaction
parameters of the blends. This would involve the synthesis and characterization of a greater
range of molecular weights and wider BPA-TMC-PC polymer compositions. Also, there
should be a follow up on the 4MC-PC and BPA-TMC-PC 9371 polymer blend because
individually these polymers do not crystallize, but as a blend there showed to be
crystallization and melting temperatures from the DSC results. More could be learned about
these polymers individually and as a blend to see if there can be a better understanding of
why they crystallize as a blend.
The temperature dependence, phase morphology, and composition dependence of
miscibility could be looked at as well, in order to learn more about the properties and
behavior of these blends. This could be done through scattering techniques or a microscope
hot stage on which a blend film sample is placed and through which a laser beam is passed.
If the blend is cloudy or not fully miscible, the laser beam will scatter, and if it is clear or
miscible, the beam will shine through.

48
5.0 Appendix
Figure 18. DSC Scan of 4MC-PC
Figure 19. DSC Scan of BPA-TMC-PC 9371

49
Figure 20. DSC Scan of Lexan 145 BPA-PC
Figure 21. DSC Scan of Teijin-PC

50
Figure 22. DSC Scan N-PC
Figure 23. DSC Scan of TCD-PC

51
Figure 24. DSC Scan of T(60)Az-N
Figure 25. DSC Scan of T(80)Az-N

52
Figure 26. DSC Scan of Lexan 145 BPA-PC and BPA-TMC-PC 9371 50:50 Blend
Figure 27. DSC Scan of N-PC and BPA-TMC-PC 9371 50:50 Blend
Lexan 145 BPA-PC and BPA-TMC-PC 9371 50:50 Blend
53
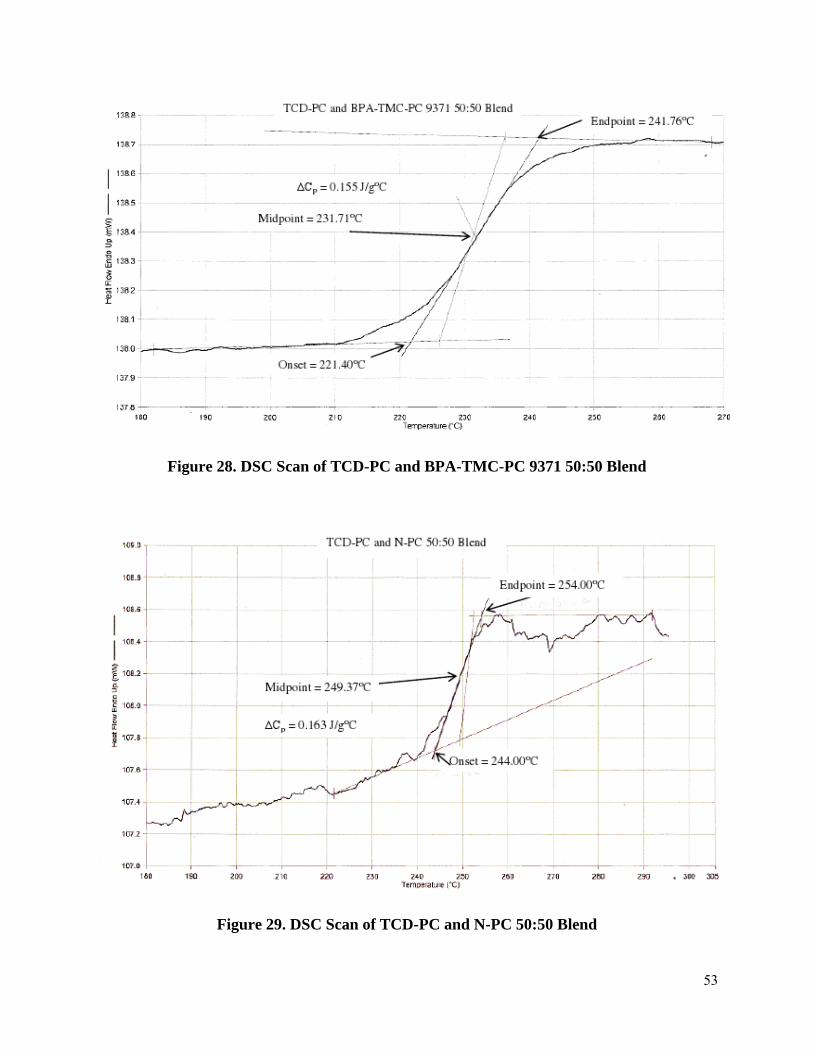
Figure 28. DSC Scan of TCD-PC and BPA-TMC-PC 9371 50:50 Blend
Figure 29. DSC Scan of TCD-PC and N-PC 50:50 Blend

54
Figure 30. DSC Scan of TCD-PC and Teijin-PC 50:50 Blend
Figure 31. DSC Scan of 4MC-PC and Teijin-PC 50:50 Blend

55
Figure 32. DSC Scan of T(80)Az-N and BPA-TMC-PC 9371 50:50 Blend
Figure 33. DSC Scan of T(80)Az-N and Lexan 145 BPA-PC 50:50 Blend

56
Figure 34. DSC Scan of T(80)Az-N and N-PC 50:50 Blend
Figure 35. DSC Scan of TCD-PC and T(80)Az-N 50:50 Blend

57
Figure 36. DSC Scan of T(60)Az-N and TCD-PC 50:50 Blend
Figure 37. DSC Scan of T(60)Az-N and BPA-TMC-PC 9371 50:50 Blend
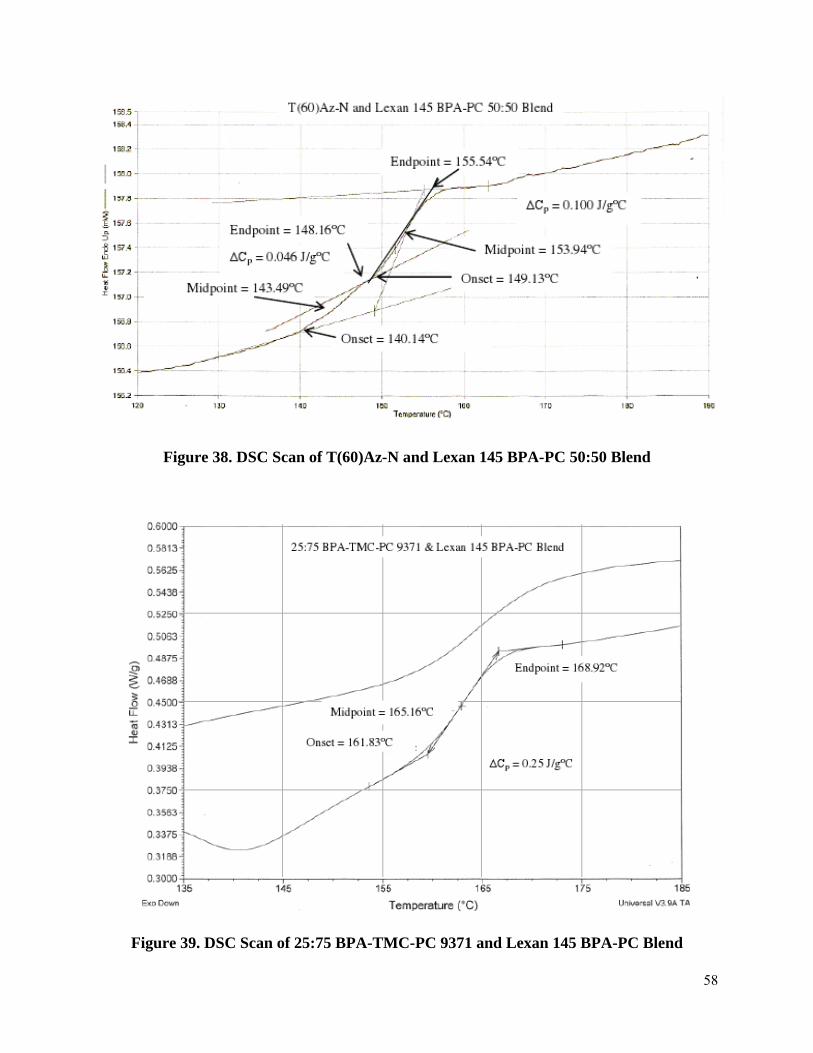
58
Figure 38. DSC Scan of T(60)Az-N and Lexan 145 BPA-PC 50:50 Blend
Figure 39. DSC Scan of 25:75 BPA-TMC-PC 9371 and Lexan 145 BPA-PC Blend

59
Figure 40. DSC Scan of 75:25 BPA-TMC-PC 9371 and Lexan 145 BPA-PC Blend
Figure 41. DSC Scan of 25:75 N-PC and Lexan 145 BPA-PC Blend

60
Figure 42. DSC Scan of 75:25 N-PC and Lexan 145 BPA-PC Blend
Figure 43. DSC Scan of 25:75 TCD-PC and Teijin-PC Blend

61
Figure 44. DSC Scan of 75:25 TCD-PC and Teijin-PC Blend

62
6.0 References 1 Young, Robert J., and Peter A. Lovell. "Multicomponent Polymer Systems." Introduction to Polymers. 3rd ed. Boca Raton: CRC, 2011. 449-55. 2 Paul, D. R., and S. Newman. Eds. Polymer Blends: Academic Press: New York, 1978; Vols. 1,2. 3 Landry, Christine J.T, Dennis J. Massa, David M. Teegarden, Michael R. Landry, P. Mark Henrichs, Ralph H. Colby, and Timothy E. Long. "Miscibility in Binary Blends of Poly(vinylphenol) and Aromatic Polyesters." Macromolecues 26 (1993): 6299-307. 4 Fluegel, Alexander. "Measurement of the Glass Transition Temperature Tg." Statistical Calculation and Development of Glass Properties. N.p., 7 Dec. 2007. Web. <http://glassproperties.com/>. 5 Massa, D. J., K. A. Shriner, S. R. Turner, and B. I. Voit. "Novel Blends of Hyperbranched Polyesters and Linear Polymers." Macromolecues 28 (1995): 3214-220. 6 Olabisi, O.; Robeson, L.M.; Shaw, M.T. “Polymer-Polymer Miscibility.” Academic. New York. 1979, Chap.3. 7 MacKnight, W.J.; Karasz, F.E.; Fried, J.R. “Polymer Blends.” D.R. Paul and S. Newman, Eds, Academic, New York, 1978, Chap.5. 8 Kim, W.N.; Burns, C.M. J. Appl. Polym. Sci.; 32 (1986): 2989. 9 Kim, Woo N., and Charles M. Burns. "Thermal Behavior, Morphology, and the Determination of the Flory-Huggins Interaction Parameter of Polycarbonate-Polystyrene Blends." Journal of Applied Polymer Science. 34 (1987): 945-67. 10 Ten Brinke, G.; Karasz, F.E.; Ellis, T.S. Macromolecules, 16 (1983): 244 11 Schultz, A.R.; Young, A.L. J. Appl. Polym. Sci. 28 (1983): 1677. 12 Fox, T.G. Bull. Am. Phys. Soc. 1(2), 123 (1956). 13 Couchman, P.R. Macromolecules. 11(1978):1156. 14 Davies, T.”Interchange reactions”, in: “High Polymers”, E.M. Fettes, Ed., Interscience, New York. 1964, vol. 19, pg. 501. 15 Tijsma, Edze J., Leen Does, and Adriaan Bantjes. "Interchange Reactions with Polypivalolactone." Makromol. Chem. 194 (1993): 305-19. 16 Mohn, R. N., D. R. Paul, J. W. Barlow, and C. A. Cruz. "Polyester-Polycarbonate Blends. III. Polyesters Based on 1,4-Cyclohexanedimethanol/Terephthalic Acid/Isophthalic Acid." Journal of Applied Polymer Science. 13 (1979): 575-587. 17 Ramjit, H.G.. J. Macromol. Sci., Chem. A 20, 659 (1983). 18 Porter, R.S.; Jonza, J.M.; Kimura, M.; Desper, C.R.; George, E.R. Polm. Eng. Sci. 1989, 29, 55. 19 Henrichs, P. M., Tribone, J.: Massa, D. J.; Hewitt, J. M. “Blend Miscibility in Bisphenol-A Polycarbonate and Poly(ethylene terephthalate) as Studied by Solid-state High-resolution Carbon-13 NMR Spectroscopy.” 20 Morimoto, S. Man-Made Fibers-Science and Technology. Wiley, New York. 3 (1967): 21-81. 21 Yang, H., and W. Yetter. "Miscibility Studies of High Tg Polyester and Polycarbonate Blends." Polymer 35 (1994): 2417-421. 22 Freitag, D.; Fengler, G.; Morbitzer, L. Angew. Chem. Int. End Engl. 30 (1991): 1598. 23 Cruz, C. A.; Paul, D. R.; Barlow, J. W. “Polyester-Polycarbonate Blends. IV. Poly(ε-caprolactone)”. J. Appl. Polymer Sci. (1979), 23(2), 589-600.

63
24 Cruz, C. A.; Paul, D. R.; Barlow, J. W. “Polyester-Polycarbonate Blends. V. Linear Aliphatic Polyesters”. J. Appl. Polymer Sci. (1979), 24(10), 2101-12. 25Lai, C. H.; Paul, D. R.; Barlow, J. W. “Group Contribution Methods for Predicting Polymer-Polymer Miscibility from Heats of Mixing. 1. Comparison of the Modified Guggenheim Quasi-chemical (MGQ) and UNIQUAC models”. Macromolecules (1988), 21(8), 2492-502. 26Cruz, C. A.; Paul, D. R.; Barlow, J. W. “Polyester-Polycarbonate Blends. VI. Branched Aliphatic Polyesters”. J. Appl. Polymer Sci. (1979), 24(12), 2399-405. 27Paul, D. R.; Barlow, J. W. “A Binary Interaction Model for Miscibility in Copolymer Blends”. Polymer (1984), 25(4), 487-94. 28 Paul, D. R., and K. W. Haggard. "Blends of High Temperature Copolycarbonates with Bisphenol-A polycarbonate and a Copolyester." Polymer 45 (2004): 2313-320. 29 Paul, W.G.; Bier, P.N. “Ann. Tech Conf.” Soc Plast Eng. 2 (1994): 1759-1762. 30 Wiehe, Irwin A. "Polygon Mapping with Two-Dimensional Solubility Parameters." Ind. Eng. Chem. Res. 34 (1995): 661-73. 31 Braun, Dietrich, and Manuela I. Meyer. "Phase Separation in Random Copolymers from High-conversion Free-radical Copolymerization." Macromolecular Chemistry and Physics 199(5) (1998): 735-44.