Magnetic Phase Diagram of Weakly Pinned Type-II Superconductors
24
arXiv:cond-mat/9911324v2 [cond-mat.supr-con] 25 Nov 1999 TIFR/CM/99/101(II) Magnetic Phase Diagram of Weakly Pinned Type-II Superconductors Satyajit Sukumar BANERJEE 1 , Srinivasan RAMAKRISHNAN 1,∗ , Dilip PAL 1 , Shampa SARKAR 1 , Arun Kumar GROVER 1,∗ , Gurazada RAVIKUMAR 2 , Prasant Kumar MISHRA 2 , Turumella Venkata CHANDRASEKHAR RAO 2 , Vinod Chandra SAHNI 2 , Chakkalakal Varduuny TOMY 3 , Mark Joseph HIGGINS 4 and Shobo BHATTACHARYA 1,4 1 Department of Condensed Matter Physics and Materials Science, Tata Institute of Fundamental Research, Mumbai-400005, India 2 Technical Physics and Prototype Engineering Division, Bhabha Atomic Research Center, Mumbai-400085, India 3 Department of Physics, Indian Institute of Technology, Powai, Mumbai-400076, India. 4 NEC Research Institute, 4 Independence Way, Princeton, New Jersey 08540, U.S.A The phenomenon of superconductivity was discovered in 1911, however, the methodology to classify and distinguish type-II superconductivity was established only in late fifties after Abrikosov’s prediction of a flux line lattice in 1957. The advent of high temperature superconductors (HTSC) in 1986 focused attention onto identifying and classifying other possible phases of vortex matter in all classes of superconductors by a variety of techniques. We have collated evidences in support of a proposal to construct a generic phase diagram for weakly pinned superconducting systems, based on their responses to ac and dc magnetic fields. The phase diagram comprises quasi-glassy phases, like, the Bragg glass, a vortex glass and a reentrant glass in addition to the (completely) amorphous phases of pinned and unpinned variety. The characteristic metastability and thermomagnetic history dependent features recognized amongst various glassy vortex phases suggest close connections between vortex matter and other disordered condensed matter systems, like, spin glasses, super cooled liquids/ structural glasses, etc. A novel quenched random disorder driven fracturing transition stands out amongst other noteworthy facets of weakly vortex pinned vortex matter. PACS numbers : 64.70 Dv, 74.60 Ge, 74.25 Dw, 74.60 Ec,74.60 Jg I. INTRODUCTION Superconducting materials in general are of two types, viz., (i) the type-I, which completely shield the external magnetic field (H) upto a limiting value called the ther- modynamic critical field H c , and (ii) the type−II, which completely shield the magnetic field(H) upto a thresh- old called the lower critical field (H c1 (T)) and above this field an incomplete shielding persists upto an upper crit- ical field H c2 (T), where the type-II superconductor turns normal. A phenomenological mean field description of the magnetic phase diagram of a type II superconductor, as proposed by A. A. Abrikosov [1] in 1957, comprises a mixed phase between H c1 (T) and H c2 (T), where the mag- netic field resides inside the superconductor in the form of string like entities called vortices. Each vortex is associ- ated with a quantum of flux, φ 0 = hc/2e. The repulsive interaction between the vortices stabilizes them into a regular (generally hexagonal) periodic arrangement (of- ten designated as the flux line lattice FLL) with an inter- vortex separation a 0 varying as 1/ √ H, where H is the magnetic field. The penetration depth λ determines the range of the repulsive interaction between the vortices; the interaction falls off as exp(−r/λ)/ √ r at large dis- tances (r) and it varies logrithmically at small distances [2]. The response of the FLL to stress, is similar to that of an elastic medium and one needs to associate three elastic moduli for the hexagonal symmetry of FLL (e.g., c 11 (for compression), c 44 (for tilt) and c 66 (for shear)). In realistic superconducting samples, the supercon- ducting order parameter could get preferentially sup- pressed at locations of atomic inhomogeneities, which therefore become energetically favorable sites for the lo- calization (i.e., pinning) of the normal core of any vor- tex. A measure of the pinning strength experienced by the vortex array is obtained via the material attribute critical current density (J c ) which can be defined as the maximum current that can be sustained by a supercon- ductor without depinning the vortices (or loosing the zero resistance property). Theoretical work of late eighties and nineties has shown that by taking into account the effects of thermal fluctuations and pinning centers on vortices, the mean field description of a type II superconductor gets sub- stantially modified and new phases and phase boundaries of vortex matter have been predicted [3]. In particular, in 1988 D. R. Nelson [4] predicted that in a clean pin- ning free system, an ideal FLL phase is stable only in the intermediate field range under the influence of thermal fluctuations (see Fig.1(a) for a schematic plot). A new phase, viz., the vortex liquid state, in which the inter- vortex correlation length is of the order of a 0 , was pre- dicted to exist at very low fields near H c1 and as well as at very high fields just before H c2 , such that the phase boundary marking the vortex solid to vortex liquid trans- formation is reentrant. This implies that while increasing 1
-
Upload
independent -
Category
Documents
-
view
1 -
download
0
Transcript of Magnetic Phase Diagram of Weakly Pinned Type-II Superconductors
arX
iv:c
ond-
mat
/991
1324
v2 [
cond
-mat
.sup
r-co
n] 2
5 N
ov 1
999
TIFR/CM/99/101(II)
Magnetic Phase Diagram of Weakly Pinned Type-II Superconductors
Satyajit Sukumar BANERJEE1, Srinivasan RAMAKRISHNAN1,∗ , Dilip PAL1, Shampa SARKAR1, Arun KumarGROVER1,∗, Gurazada RAVIKUMAR2, Prasant Kumar MISHRA2, Turumella Venkata CHANDRASEKHAR
RAO2, Vinod Chandra SAHNI2, Chakkalakal Varduuny TOMY3, Mark Joseph HIGGINS4 and ShoboBHATTACHARYA1,4
1 Department of Condensed Matter Physics and Materials Science, Tata Institute of Fundamental Research,Mumbai-400005, India
2Technical Physics and Prototype Engineering Division, Bhabha Atomic Research Center, Mumbai-400085, India3 Department of Physics, Indian Institute of Technology, Powai, Mumbai-400076, India.4 NEC Research Institute, 4 Independence Way, Princeton, New Jersey 08540, U.S.A
The phenomenon of superconductivity was discovered in 1911, however, the methodology to classify and distinguish type-IIsuperconductivity was established only in late fifties after Abrikosov’s prediction of a flux line lattice in 1957. The advent ofhigh temperature superconductors (HTSC) in 1986 focused attention onto identifying and classifying other possible phases ofvortex matter in all classes of superconductors by a variety of techniques. We have collated evidences in support of a proposal
to construct a generic phase diagram for weakly pinned superconducting systems, based on their responses to ac and dcmagnetic fields. The phase diagram comprises quasi-glassy phases, like, the Bragg glass, a vortex glass and a reentrant glass
in addition to the (completely) amorphous phases of pinned and unpinned variety. The characteristic metastability andthermomagnetic history dependent features recognized amongst various glassy vortex phases suggest close connections
between vortex matter and other disordered condensed matter systems, like, spin glasses, super cooled liquids/ structuralglasses, etc. A novel quenched random disorder driven fracturing transition stands out amongst other noteworthy facets of
weakly vortex pinned vortex matter.
PACS numbers : 64.70 Dv, 74.60 Ge, 74.25 Dw, 74.60 Ec,74.60 Jg
I. INTRODUCTION
Superconducting materials in general are of two types,viz., (i) the type-I, which completely shield the externalmagnetic field (H) upto a limiting value called the ther-modynamic critical field Hc, and (ii) the type−II, whichcompletely shield the magnetic field(H) upto a thresh-old called the lower critical field (Hc1(T)) and above thisfield an incomplete shielding persists upto an upper crit-ical field Hc2(T), where the type-II superconductor turnsnormal. A phenomenological mean field description ofthe magnetic phase diagram of a type II superconductor,as proposed by A. A. Abrikosov [1] in 1957, comprises amixed phase between Hc1(T) and Hc2(T), where the mag-netic field resides inside the superconductor in the form ofstring like entities called vortices. Each vortex is associ-ated with a quantum of flux, φ0 = hc/2e. The repulsiveinteraction between the vortices stabilizes them into aregular (generally hexagonal) periodic arrangement (of-ten designated as the flux line lattice FLL) with an inter-
vortex separation a0 varying as 1/√
H, where H is themagnetic field. The penetration depth λ determines therange of the repulsive interaction between the vortices;the interaction falls off as exp(−r/λ)/
√r at large dis-
tances (r) and it varies logrithmically at small distances[2]. The response of the FLL to stress, is similar to thatof an elastic medium and one needs to associate threeelastic moduli for the hexagonal symmetry of FLL (e.g.,
c11 (for compression), c44 (for tilt) and c66 (for shear)).In realistic superconducting samples, the supercon-
ducting order parameter could get preferentially sup-pressed at locations of atomic inhomogeneities, whichtherefore become energetically favorable sites for the lo-calization (i.e., pinning) of the normal core of any vor-tex. A measure of the pinning strength experienced bythe vortex array is obtained via the material attributecritical current density (Jc) which can be defined as themaximum current that can be sustained by a supercon-ductor without depinning the vortices (or loosing the zeroresistance property).
Theoretical work of late eighties and nineties hasshown that by taking into account the effects of thermalfluctuations and pinning centers on vortices, the meanfield description of a type II superconductor gets sub-stantially modified and new phases and phase boundariesof vortex matter have been predicted [3]. In particular,in 1988 D. R. Nelson [4] predicted that in a clean pin-ning free system, an ideal FLL phase is stable only in theintermediate field range under the influence of thermalfluctuations (see Fig.1(a) for a schematic plot). A newphase, viz., the vortex liquid state, in which the inter-vortex correlation length is of the order of a0, was pre-dicted to exist at very low fields near Hc1 and as well asat very high fields just before Hc2, such that the phaseboundary marking the vortex solid to vortex liquid trans-formation is reentrant. This implies that while increasing
1
field at a fixed T, one should first encounter the dilutelow density(a0 >> λ) vortex liquid phase, followed byan ideal FLL and, finally, one should reach a very dense(a0 ∼ ξ) vortex liquid phase. Experimental studies onhigh temperature superconductors (HTSC) have estab-lished the existence of vortex solid to liquid transitionat high fields, however, the demonstration of the reen-trant behavior of melting phase boundary at low fieldshas so far proved to be elusive. The mean field scenariopredicts that a perfectly periodic arrangement of vortices(ideal FLL) should undergo a qualitative transformationunder the influence of pinning centers such that the vor-tex lattice has spatial correlations only upto a limit asin a glassy phase [5]. The vortex glass phase can ex-hibit many metastable configurations, each of which ischaracterized by zero linear resistivity. In 1994, T. Gia-marchi and P. Le Doussal [6] proposed the existence of anovel (vortex) solid to solid transformation as a functionof varying field at a fixed temperature. In their frame-work, a novel Bragg glass (i.e., a quasi-FLL) phase atintermediate fields and weak disorder transforms (pre-sumably via a first order transition) into a vortex glassstate at high fields and stronger disorder. This solid tosolid transformation (see Fig.1(b) for a schematic phasediagram) is considered to arise due to a proliferation ofdislocations in the Bragg glass phase, which is initiallyassumed to be free of dislocations of any kind. A largefraction of the experimental efforts since the advent ofHTSC era have focused on identifying the characteristicsof different types of dense glassy phases of vortex matter[3]. On the other hand, relatively little is known aboutthe dilute vortex phases under the combined influence ofpinning centers and thermal fluctuations. A simulationby Gingras and Huse [8] has proposed that the addition ofpinning can yield a reentrant glass phase at low densities(cf. Fig.1(b)), analogous to the low density vortex liquidphase (cf. Fig.1(a)) in an ideal pinning free situation.
A fruitful experimental investigation on differentphases of vortex matter can come about via such exper-imentally accessible quantities, which are related to theextent of ordering of the vortices in the various phases.A theoretical framework which provides this link is theLarkin - Ovchinnikov (LO) description [9] propounded inthe mid seventies. The LO theory showed that the extentof order maintained in the FLL in the presence of pin-ning can be quantified in terms of the radial (Rc) and thelongitudinal (Lc) correlation lengths, which are distancescales over which the deviations u of the flux lines fromtheir mean periodic lattice positions become of the orderof the radius of the core of the vortex, i.e., the coherencelength ξ. The Rc and Lc, which are functions of the pin-ning strength and elastic moduli (which are functions ofH and T), are inversely related to Jc as, Jc ∝ 1√
R2cLc
.
It is therefore possible to understand the changes in thebehavior of Jc in terms of changes in Rc and Lc, whichcould happen due to occurrence of phase transformationsin the vortex matter.
To enable us to study the evolution of the differentphases of vortex matter under the combined influenceof thermal fluctuations and quenched random inhomo-geneities in the atomic lattice, we have used those experi-mental techniques (namely, ac susceptibility, dc magneti-zation measurements, transport experiments, etc.) whichprovide information on the behavior of Jc. A remark-able feature seen in the behavior of Jc in weakly pinnedsuperconducting systems is the phenomenon of Peak Ef-fect (PE) [2] prior to reaching the respective Hc2(T) orTc(H). The pinning strength or Jc values usually decreaseon increasing H or T. The PE relates to an anomalousincrease in Jc, terminating in a peak, with increasing H(or T) while approaching Hc2/Tc. Despite many yearsof efforts, the PE still awaits complete theoretical un-derstanding [10–12], however it is now widely acceptedthat PE signals the rapid softening of the elastic moduliof vortex solid and the occurrence of plastic deforma-tion and proliferation of topological defects (like, dislo-cations) in FLL [12,13]. The vortex array is expectedto be amorphous at and above the peak position in Jc
[14]. The phenomenon of PE can therefore be exploitedto gain information on different phases of vortex matterand the processes involved in enhancement of loss in or-der of FLL. We shall summarize in this paper the key ex-perimental results of PE studies [15–21] in single crystalshaving progressively higher amounts of quenched pinningcenters and belonging to an archetypal low Tc (Tc(0) ∼7 K) weak pinning system 2H-NbSe2. These results leadus to propose a generic phase diagram for a type II super-conductor whose details make contacts with theoreticalpredictions summarized schematically in Fig.1(b). Theproposed phase diagram finds support from identical be-havior noted in a variety of other low Tc superconductingsystems [16,22,23] and in a single crystal sample of a highTc compound YBa2Cu3O7 [24]. A glimpse into some ofthese results [22,23] shall also be provided here.
II. EXPERIMENTAL
The ac magnetic susceptibility, dc magnetization anddc resistivity studies have been performed using a stan-dard mutual inductance bridge, a Quantum designSQUID magnetometer and the usual four probe method,respectively. The single crystal samples (A, B and C,with progressively increasing number of pinning centers)of hexagonal 2H-NbSe2 system chosen for illustrating theresults here belong to the same batches of crystals asutilized by different groups of experimentalists in recentyears [25–27]. In each of these batches of crystals, theFLL with hexagonal arrangement is well formed at inter-mediate fields (H > 0.5kOe). The single crystals of someother superconducting systems such as CeRu2 (Tc = 6.4K), Ca3Rh4Sn13(Tc = 8.5 K), Y Ni2B2C(Tc = 15.3 K),etc. studied for comparison of trends emerging from datain 2H- NbSe2 have levels of quenched random inhomo-
2
geneities comparable to those in sample C of 2H-NbSe2.
III. RESULTS AND DISCUSSIONS
A. Peak Effect Represents a Phase Transition
We shall first focus attention on an experimental re-sult, which amounts to a compelling evidence in supportof an assertion that PE peak qualifies for the status of aphase transition in vortex matter. Fig.2 depicts the typ-ical variation in the real part of the ac susceptibility (χ′)with temperature in nominal zero field and in an applieddc field of 4 kOe in the cleanest crystal A of 2H-NbSe2 forHdc||c. The χ′ curve in zero field provides an estimate ofthe width ∆ Tc(0) of the normal- superconducting tran-sition. We will recall that when ac field has fully pene-trated the superconducting sample, the χ′ response canbe approximated in Bean’s critical state model as [28]:
χ ∼ −1 + αhac
Jc
; for hac < H∗, (1)
χ ∼ −βJc
hac
; for hac > H∗, (2)
where α and β are geometry and size dependent fac-tors and H∗ is the field at which screening currents flowthroughout the sample. Note that initially at very lowtemperatures, χ′ ≈ −1 (perfect shielding), when hac
does not penetrate. However, as hac penetrates the sam-ple, the temperature variation in χ′ gets governed bythe temperature variation in Jc. In zero field the dia-magnetic χ′ response monotonically increases (see Fig.2)due to an expected decrease in zero field current densityJc(0) with the increase in temperature. However, in a dcfield of 4 kOe, which creates a FLL with lattice constanta0 ≈ 790A, the usual decrease in diamagnetic χ′(T) re-sponse gets interrupted (cf. Fig.2) via a sudden onset (atT = Tpl) of an anomalous enhancement in the diamag-netic screening response; χ′ reaches a sharp minimumat T = Tp, above which χ′ recovers rapidly towards thenormal state value at Tc(H). Note that the rate of rapidrecovery of the latter is very much higher than the rate atwhich the diamagnetic χ′ response was decreasing priorto the onset of anomalous dip in χ′ at T = Tpl. The non-monotonicity in χ′ is a consequence of non-monotonicityin Jc(H, T ) such that the minimum in χ′ corresponds toa peak in Jc, the ubiquitous peak effect (PE). The experi-mental fact is that the width of the PE region is decisivelysmaller than the width of superconducting transition (∆Tc(0)) in zero field (cf. Fig.2). It may be further noted(see the inset of Fig. 2) that Jc crashes towards a zerovalue from peak position of PE such that the diamagneticχ′ response transforms to a paramagnetic response acrossthe so called irreversibility temperature, Tirr. AboveTirr, Jc ≈ 0 and the mixed state of the superconduc-tor is in its reversible phase, whose differential magnetic
response is positive (i.e., diamagnetic dc magnetizationdecreases as dc field/temperature increases). The dif-ferential paramagnetic effect (DPE) region in the insetof Fig.2, therefore, identifies the depinned (Jc= 0) stateof vortex matter in between irreversibility temperatureTirr(H) and the superconducting temperature Tc(H). Tosummarize, in a χ′(T ) measurement at a fixed H, wecan in principle identify four temperatures denoted asTpl, Tp, Tirr and Tc. In the subsequent sections, we willpresent more experimental results which elucidate andcharacterize the different phases of vortex matter corre-sponding to T < Tpl, Tpl < T < Tp and Tp < T < Tirr.
In weakly pinned systems, Jc is given by the pinningforce equation:
JcB = (np < f2
p >
Vc
)1
2 = (np < f2
p >
R2cLc
)1
2 , (3)
where np is the density of pins, fp is the elementary pin-ning interaction proportional to the condensation energyand Vc is the correlation volume of a Larkin domain,within which flux lines retain their nominal hexagonalsymmetry. As per eqn.(3.3), the PE in Jc corresponds toa rapid shrinkage in Vc (more rapid than the decrease in< f2
p >, which causes the usual monotonic decrease in acscreening response with increase in T or H), so as to pro-duce an overall enhancement in Jc upto the peak positionof PE. Above the peak position, the rapid collapse in χ′
is expected to be governed entirely by a sharp change inelementary pinning interaction fp while approaching thesuperconductor to normal boundary. Transport [13] andnoise studies [29] on driven vortex matter in very cleancrystals of 2H- NbSe2 have earlier provided indicationsthat the underlying depinned lattice (in the absence ofexternal driving force) between the onset and peak posi-tions of PE is probably in plastically deformed state incontrast to an elastically deformed vortex state existingprior to the onset of PE. We shall provide evidences herein favor of the scenario that the role of plastic deforma-tions (and consequently that of shrinkage in Vc) ceasesat the peak position of PE. It will also be elucidated thatthe onset of shrinkage in Vc is induced by the pinningeffects in a characteristically novel manner.
B. Structure in Peak Effect and Identification and
Characterization of Phase Transformations
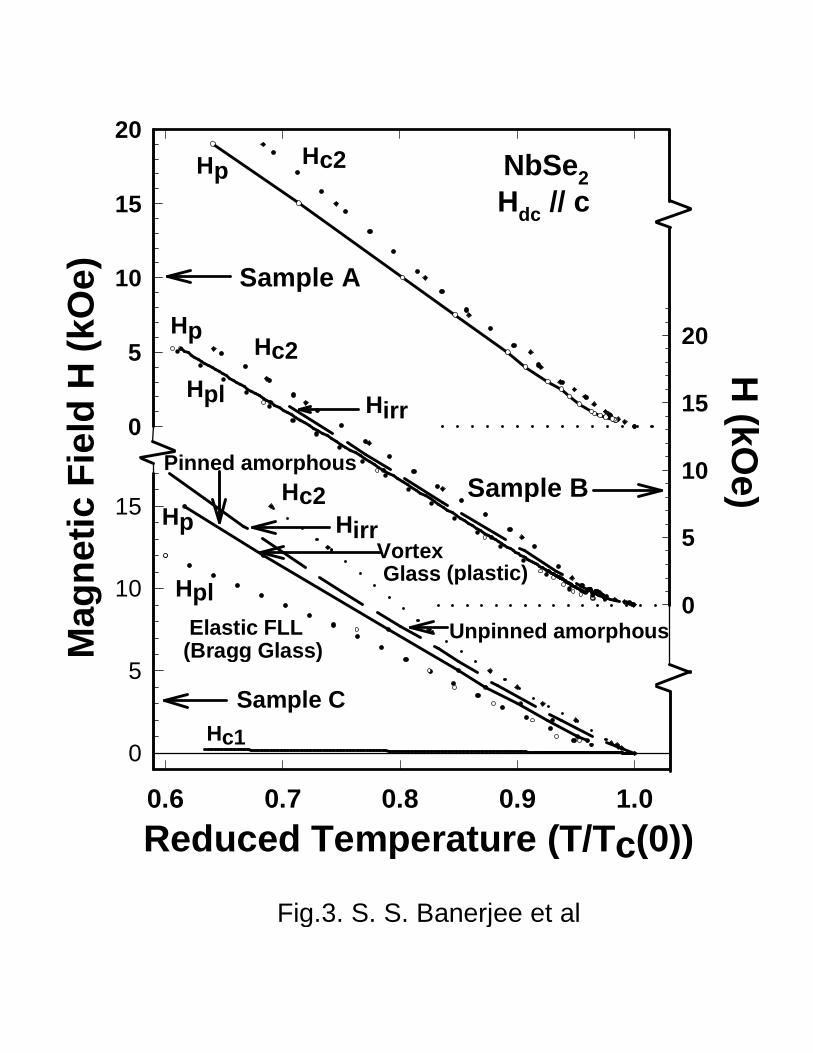
Fig.3 collates the plots of loci of four features, the on-set of PE at Hpl, Tpl, the location of peak of PE atHp, Tp, an apparent irreversibility line (Hirr ,Tirr) andthe superconducting-normal phase line (Hc2,Tc), in crys-tals A, B and C of 2H- NbSe2 for fields larger than 1kOe (i.e., for vortex arrays with lattice constants a0 <1600A). Note that the anomalous PE region spanningfrom (Hpl, Tpl) to (Hirr , Tirr) through (Hp, Tp) in ex-tremely weakly pinned cleanest sample A is so narrow
3

that it suffices for us to identify only its Hp line whosethickness encompasses its (Hpl, Tpl) and (Hirr , Tirr) datapoints as well. The PE region can be seen to become alittle broader in weakly pinned crystal B such that theHpl, Hp and Hirr lines in it can be distinctly drawn in Fig.3. However, as the pinning increases and one moves ontothe nominally weakly pinned sample C, the PE regioncan be seen to expand over considerably larger region of(H,T) phase space. It can be noted in Fig.3 that the Hpl
line moves away from Hirr line as H increases. The sepa-ration between the Hpl and Hp lines also correspondinglyincreases even though Hp line remains relatively moreclose to the Hirr line. In the vortex phase diagram ofsample C, we have labeled the region below the Hpl lineas the elastic glass and that between the Hpl and Hp linesas the plastic glass. The regions above the Hp line havebeen given the names pinned amorphous (for Hp < H <Hirr) and unpinned amorphous ( for Hirr < H < Hc2),respectively.
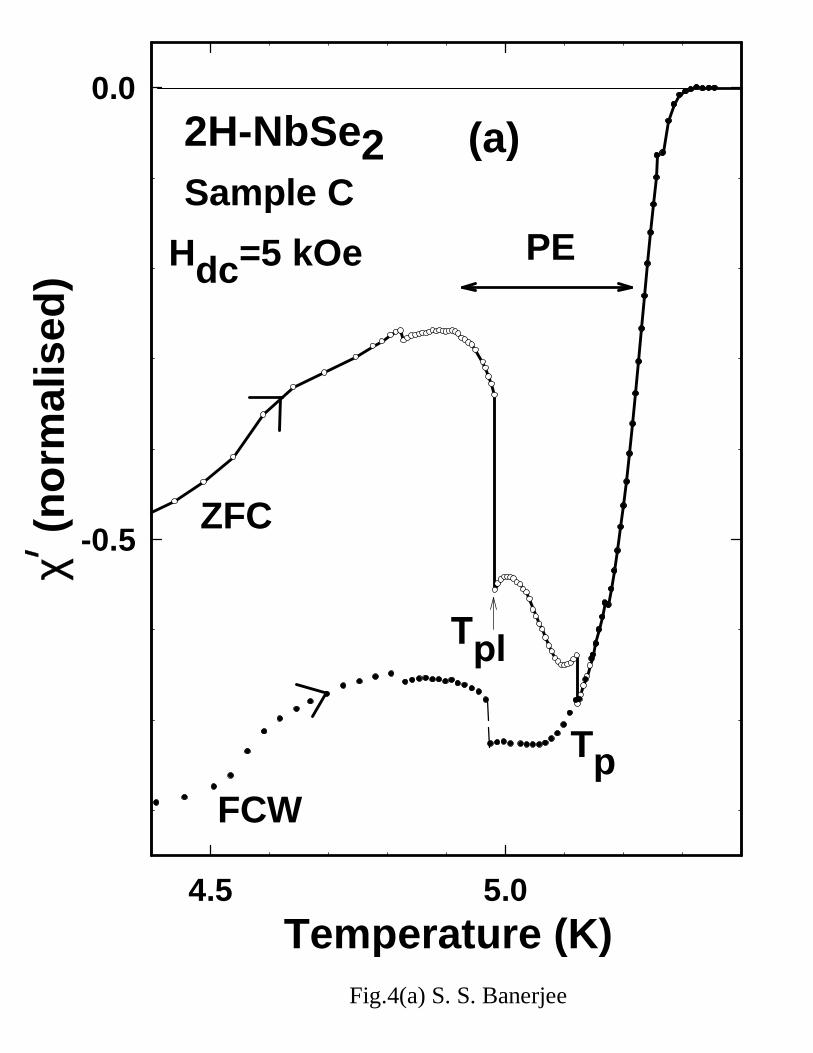
As a step towards rational explanation of these nomen-clatures, we focus attention onto χ′(T) behavior (seeFigs.4(a) and 4(b)) in sample C in a field of 5 kOe(a0 ≈ 700A). In Fig.4(a), we show a comparison of χ′(T)response in vortex states obtained at low temperatures(T << Tc) via two entirely different thermomagnetic his-tories, namely, zero field cooled (ZFC) and field cooled(FC). Note that in the ZFC case, χ′(T) behavior displaysa well recognizable PE peak. On the other hand, thesame feature is far less conspicuous in the data recordedduring the field cooled warm up (FCW) mode. Prior tothe peak position of PE, χ′ response in the FC state ismore diamagnetic than that in the ZFC state and abovethe peak temperature Tp, the difference between the tworesponses dramatically disappears (a la spin glass phe-nomenon). The observed behavior is usually understoodin terms of history dependence in the values of Jc (cf.eqn.1), such that Jc
FC > JcZFC for T < Tp [16,20].
Eqn.2 implies that history dependence in Jc reflects thehistory dependence in correlation volume Vc, as neithernp nor fp, both microscopic quantities for the same re-alization of quenched random disorder, can depend onthe thermomagnetic history of the vortex system. Wehave argued earlier [16] that in a given circumstance, Vc
attains the minimum value at the peak position of PE.The observation that the diamagnetic χ′ in FC state atT << Tp is not very different from its value at T = Tp im-plies that the correlation volume Vc at T << Tp is the su-percooled state existing at the peak position of PE. Thus,in the ZFC state, the correlation volume of the vortexstate prior to the arrival of the PE region (T << Tp) ismuch larger than that in the FC state. It can, therefore,be concluded that the ZFC vortex state is a well orderedone and the FC state at low temperatures attempts tofreeze in the maximally disordered (i.e., the amorphousphase) existing at T ≈ Tp. Note, further, that χ′(T)of the ZFC state shows two sharp (< 1mK in width)jumps at T ≈ Tpl and at T ≈ Tp. These jumps amountto sudden shrinkages in the Vc near the onset and peak
positions of PE.The sharp changes in Vc are candidates for first order
like phase transitions in vortex matter under the com-bined influence of thermal fluctuations and pinning cen-ters. To fortify this assertion, we elucidate here the oc-currence of irreversible behavior while thermal cyclingsacross both the temperatures Tpl and Tp. We show inFig.4(b) the χ′(T) data obtained in sample C in a fieldof 5 kOe while cooling down from temperatures TI , TII
and TIII lying in three different regions, viz., (i) TI < Tpl,(ii) Tpl < TII < Tp and (iii) Tp < TIII < Tirr. Theχ′(T) data recorded during warm up of ZFC and FCstates are indicated by a dotted curve and a solid curve(data points omitted), respectively in Fig.4(b). Fromthis figure, it is apparent that while cooling down fromTI , χ′(T) response retraces its path (i.e., the dotted ZFCcurve). However, while cooling down from TII , the χ′(T)response (see filled circle data points) attempts to re-trace its path while approaching Tpl, but as it nears thetemperature Tpl, the χ′(T) response suffers a sharp fallto a diamagnetic value which lies closer to that of thecompletely amorphous FC like state. On cooling downfurther below Tpl, the χ′ response never recovers on itsown towards the χ′(T) response of the ordered ZFC likestate. This striking result can be rationalized in termsof the following scenario. When an ordered ZFC likestate is warmed up towards the PE region, the FLL soft-ens, the energy needed to create dislocations decreasesand the lattice spontaneously (partially) fractures at Tpl.Upon lowering the temperature from within the PE re-gion (Tpl < T < Tp), the lattice stiffens and the stressesbuild up. The partially disordered vortex system fails todrive out dislocations in order to heal back to an orderedZFC like state. Instead, it shatters further to relieve itsstresses and reaches the completely amorphous FC likemetastable state. This yields an open hysteresis curvein T, i.e., one cannot recover the original ordered stateby cycling in temperature alone. This is a novel feature,not seen in the usual first order transitions in which onlythe thermal fluctuations are involved. There are com-pelling evidences that this feature is controlled by effec-tive pinning in the system. In Fig.4(b), it can finally benoted that while cooling down from a temperature TIII
lying above Tp, χ′(T) response (see the solid triangle datapoints) faithfully retraces its path while approaching Tp.Below Tp, the cool down χ′(T) response starts to differfrom that recorded earlier during warm up cycles for ZFCand FCW states in the same temperature interval. It isclear that dχ′/dT is negative between Tpl and Tp duringwarm up cycle (cf. dotted curve in Fig.4(b)), whereas itis positive for cool down from TIII in the same tempera-ture interval. Note, also, that eventually at T < Tpl, i.e.,after a jump in χ′(T) happens while cool down from TII ,the χ′(T) response of both the cool down cycles not onlynearly overlap but they are also not very different fromthe χ′(T) response recorded during FCW cycle. The dataof Fig.4(b) thus clearly indicate that the transformationoccurring in the vortex matter near the peak tempera-
4

ture Tp is such that the past history of the vortex stateis immaterial for its behavior above Tp. It can thereforebe surmised that the vortex state is disordered in equi-librium at T > Tp and the state of disorder existing atT ≈ Tp can be preserved or supercooled down to muchlower temperatures (i.e., T << Tp). In between Tpl andTp, the ordered state formed via ZFC (at T << Tpl)mode gets shattered in a stepwise manner.
The onset and peak positions have special significancein the sense that cyclings across them produce the un-usual open hysteresis curves in T. We have demonstrated[15] recently that the first sharp jump in χ′ near the on-set position is a special attribute of the disordering pro-cess of FLL which is induced by pinning centers as theytake advantage of the incipient softening of the latticeat PE. The connection between the history dependenceor metastability in vortex lattice can be appreciated byexamining the χ′(T) data recorded in ZFC and FCWmodes at the same field (fixed inter-vortex spacing a0)in samples with differing quenched inhomogeneities (likesamples A, B and C of NbSe2) or at different fields (i.e.,by changing the inter-vortex spacing a0) in a given sam-ple. It has often been argued [30] that an increase infield (i.e., decrease in a0) amounts to an increase in ef-fective pinning as the pinning induced wanderings of theflux lines from their mean positions do not decrease withfield in the same proportion as the decrease in a0 withfield. Thus, the ratio ∆a0/a0 (where ∆a0 is the pinninginduced spread in a0), which can be taken as a measure ofthe effective pinning, increases as H increases. We haveshown earlier [15] how the first jump in χ′ and the asso-ciated structure and metastability effects in χ′ responsebetween Tpl and Tp are intimately related. The first jumpin χ′ can be suppressed and the details of structure in χ′
between Tpl and Tp can be compromised under variouscircumstances [31], however, the feature of negative peakin χ′ at Tp is robust. For instance, the vortex state priorto the arrival of PE region can be reorganized to a state ofeven better order (than that in the nominal ZFC mode)by subjecting the lattice to a sizable driving force viathe process of cyclings in large enough ac fields. In suchcircumstance, the behavior of the kind (in ZFC mode)shown in Fig. 4(a) could transform to that shown inFig.2, i.e., the first jump in χ′ near Tpl could be made todisappear, and the detailed structure in χ′ smoothenedout.
A qualitative feature that emerges from the high fieldχ′ data in different crystals of 2H-NbSe2 can be summa-rized as follows. A well correlated (pinned) FLL stateloses order in a stepwise manner based on the competi-tion among three energy scales: the elastic energy Eel,the pinning energy Epin and thermal energy Eth. At lowT, Eel dominates and a phase akin to an elastic (Bragg)glass occurs. With increasing T, Eel decreases faster thanEpin, and above the (Hpl,Tpl) line, Epin dominates, lead-ing to proliferation of topological defects, likely similar toa vortex glass- entangled solid phase. At even higher tem-
peratures at the (Hp,Tp) line, the Eth overcomes Eel, andthe residual disorder is presumably lost due to thermalfluctuation effects (or the effects arising out of settingin of divergence in values of intrinsic parameters, like,λ and ξ near superconductor-normal phase boundary).The disordered state between (Hp,Tp) and (Hirr ,Tirr) ispinned with Jc 6= 0. Finally, a dynamical crossover tounpinned region (Jc ≈ 0) occurs above the (Hirr,Tirr)line and the (Hc2,Tc) line identifies the boundary wherethe diamagnetic response in dc magnetization measure-ments falls below a measurable limit.
C. Reentrant Characteristic in Peak Effect Curve
and the Effect of Pinning on it
There is a widespread consensus that the PE curve(Hp,Tp) separates the ordered and disordered phases ofvortex matter. Direct structural support for this viewpoint is now also growing via diffraction data obtainedfrom small angle neutron scattering experiments and viamicroscopic muon spin rotation studies on a variety ofdifferent superconducting systems, such as, pure Nb [14],NbSe2 [32], (K,Ba)BiO3 [33], etc.. Keeping these in view,we recall that Ghosh et al [27] had shown that Tp(H)curve determined from χ′(T) at low fields (< 2 kOe)in sample B of 2H-NbSe2 displayed a reentrant char-acteristic, which bore striking resemblance to the the-oretically proposed re-entrant melting phase boundaryshown in the schematic phase diagram of Fig.1(a). Theturnaround (or the reentrance) in Tp(H) curve in sam-ple B of 2H-NbSe2 has been reported [34] for H‖c andH‖ab at H ∼ 100 Oe, where FLL constant a0 exceeds therange of interaction (i.e., the penetration depth values)of vortex lines. The turnaround in Tp(H) is accompaniedby rapid broadening and eventual disappearance of PEpeak both in magnetic as well as transport studies [17],and such a behavior is rationalized by stating that as theinter-vortex interaction effects weaken, the collectivelypinned elastic vortex solid makes a crossover to the smallbundle or individual pinning regime, which is once againdominated by pinning effects of quenched random inho-mogeneities. The reentrant characteristic in Tp(H) curvetherefore, also, implies that as the field gets varied at afixed temperature (isothermal scan), one should first en-counter the pinning dominated disordered dilute vortexstate (where a0 > λ). This should be followed by inter-action dominated well ordered phase, which should even-tually once again transform to a disordered (amorphous)phase at very high vortex densities (λ >> a0 ≤ ξ).
A careful examination of the phase diagram shown inFig.3 reveals that for a fixed value of reduced tempera-ture t, the onset line (Hpl, Tpl) of PE progressively movesinwards from sample A to sample C. This means thatthe phase space of ordered elastic solid shrinks alongthe upper portion of the PE curve as the pinning ef-fects increase. If the same notion is to hold for the lower
5

(reentrant) portion of the PE boundary determined firstby Ghosh et al [27], the reentrant leg of the PE curveshould move upwards as pinning effects increase. Thisindeed is the experimental situation [17]. Fig.5 collatesthe plots of tp(H) curves in samples A, B and C in thelow field region (H< 1 kOe). For the purpose of refer-ence, the Hc2(t) curve has also been drawn for sample Ain Fig.5 and it may be assumed that Hc2(t) curves forother two samples overlap with that of sample A. Notefirst the error bars on the data points of samples B andC as the dc field decreases below 500 Oe. In sample C,the PE broadens so much that the PE peak cannot bedistinctly identified below about 200 Oe [17]. In sam-ple A, however, a sharp PE peak (as in Fig.2) can bedistinctly seen in χ′(T) scans in fields as low as 30 Oe.The tp(H) curve in sample A has a turnaround featurebut its lower (reentrant leg) portion could not be deter-mined from temperature dependent scans of the in-phaseac susceptibility data. However, the trend that the reen-trant lower leg of tp(H) curve should move upwards, asthe pinning effects progressively enhance from sample Ato C, stands satisfactorily demonstrated.
D. Evolution in Pinning Behavior and Identification
of Reentrant Disordered Region for Dilute Vortex
Arrays
In order to more convincing elucidate the reentrantcharacteristic in order to disorder transformation (cf.schematics drawn in Fig.1(b)) as the field is increasedin an isothermal scan, we focus attention onto Figs.6(a)to 6(d) and Figs.6(e) to 6(h). These data [21] on currentdensities were extracted from an analysis of isothermalin-phase and out-of-phase ac susceptibility data as per aprescription of Angurel et al [35] and the estimates wereverified via dc magnetization hysteresis measurements.
Figs.6(a) to 6(d) show Jc(H) vs H on log-log plots insample B for four reduced temperatures as identified byopen circle data points lying on tp(H) curve included inthe inset of Fig.6(c). Similarly, Figs.6(e) to 6(h) depictdata in sample A for four temperature values marked inthe inset of Fig.6(g). The two sets of plots elucidate thegeneric nature of evolution in shapes of Jc(H) vs H behav-ior. We first focus on pairs of plots in Figs.6(a) and 6(d)and in Figs.6(e) and 6(h). In both the Figs.6(a) and 6(e),we can identify three regimes, marked I, II and III in eachof them. The regime III identifies the quintessential peakeffect phenomenon. The field region II, in which Jc(H)decays with H in a power law manner (Jc∼H−1) identifiesthe collectively pinned elastic vortex solid. The low fieldregion I identifies the field span in which the vortices arein a small bundle or individual pinning regime and conse-quently Jc(H) decays more weakly with H as compared tothe decay rate seen in the power law regime II. Note thatthe power law region II extends down to much lower fieldvalues (∼10 Oe) in sample A as compared to that (∼200
Oe) in sample B. In fact in sample B, the Jc(H) valuesmove towards the saturation Jc(H=0) limit of regime Iin a faster manner than the extrapolated dotted line (ofpower law regime) desires in Fig.6(a). This faster ap-proach to the saturated amorphous limit (see Figs.7(a)and 7(b) for a replot of the data in Figs.6(a) to 6(h) ina normalized manner) is in fact the low field counterpartof the approach to the peak value of Jc(H) at the peakposition of PE at high fields. Now, we turn to the behav-ior shown in Figs.6(d) and 6(h), where Jc(H) decays veryslowly and monotonically with H (upto the highest fieldvalues) and the PE region cannot be distinctly identified.Note that the (reduced) temperatures corresponding toFigs.6(d) and 6(h) in samples B and A, respectively, arelocated near the turnaround portion of their respectivetp(H) curves in the insets of Figs.6(c) and 6(g). In anisothermal scan at such a temperature, the well orderedcollectively pinned regime is not expected to be encoun-tered. The low field small bundle pinning regime is ex-pected to crossover to the higher field amorphous vortexphase in a contiguous manner. The plots in Figs.6(b)and 6(c) and in Figs.6(f) and 6(g) elucidate how the col-lectively pinned well ordered region sandwiched (see ar-row marks in each figures) between the disordered statesshrinks as the temperature increases while approachingthe limiting value corresponding to the turnaround pointof respective tp(H) curves.
We collate all the data shown in Fig.6 in two sets ofnormalized plots for samples A and B in Figs.7(a) and7(b), respectively. The evolution in shapes of currentdensity vs reduced field (H/Hc2(T)) curves in the twosets of plots is remarkably similar to the evolution inbehavior reported earlier in weakly pinned single crys-tals of an archetypal low Tc alloy superconductor V3Si[36,37] and an archetypal high Tc cuprate superconduc-tor YBa2Cu3O7 [37,38]. This fact attests to the genericnature of the observed behavior across different classes ofsuperconductors. The electromagnetic response of type-II materials and the details of the vortex phase diagramsin them appear to bear little relationship with the mi-croscopics of the different varieties of superconductingsystems.
The plots in Figs.7(a) and 7(b) clearly bring out howthe PE broadens as the effects due to interplay betweenthe thermal fluctuations and the pinning effects enhancewhile approaching the turnaround feature in a PE curve.It can be noted that when the PE is very pronounced,Jc(H) rises from its smallest value at the end of collec-tively pinned power law regime (i.e., at the onset of PE)to reach its overall amorphous limit at the peak position(see curves from t=0.973 to 0.990 in Fig.7(a) and thosefrom t=0.965 to 0.973 in Fig.7(b)). At the lower fieldend of the power law regime as well, the Jc(H) starts torise faster on lowering the field further (see the curve fort=0.965 in Fig.7(b)) and reaches the small bundle pin-ning limit. From the high field amorphous limit, Jc(H)can only decrease on increasing the field towards Hc2 (i.e.,b=1) and, thereby, it yields a peak effect phenomenon in
6

Jc(H). On the otherhand, at the lowest field once thesmall bundle pinning limit is attained, the Jc(H) valuescan flatten out towards the Jc(0) value. This inevitablehappening has prompted us recently [21] to propose thatthe said feature be better designated as the Plateau Effectinstead of reentrant peak effect, as described earlier [17].Finally, a careful examination of the shapes of the curvesat t=0.983 and 0.99 in Fig.7(a) and that at t=0.977 inFig.7(b) reminds us of the phenomenon of second mag-netization peak or the so called fishtail anomaly widelyreported in the context of high Tc cuprates in recent years[37,38]. It may be useful to mention here that the fishtaileffect relates to a characteristic shape of the isothermaldc magnetization hysteresis loop. The display of data inFigs.7(a) and 7(b), therefore, provides a natural under-standing of the fishtail type anomalous behavior in Jc(H)in the context of the presence of the plateau effect for di-lute vortex arrays at low fields and the usual peak effectfor dense vortex arrays at high fields.
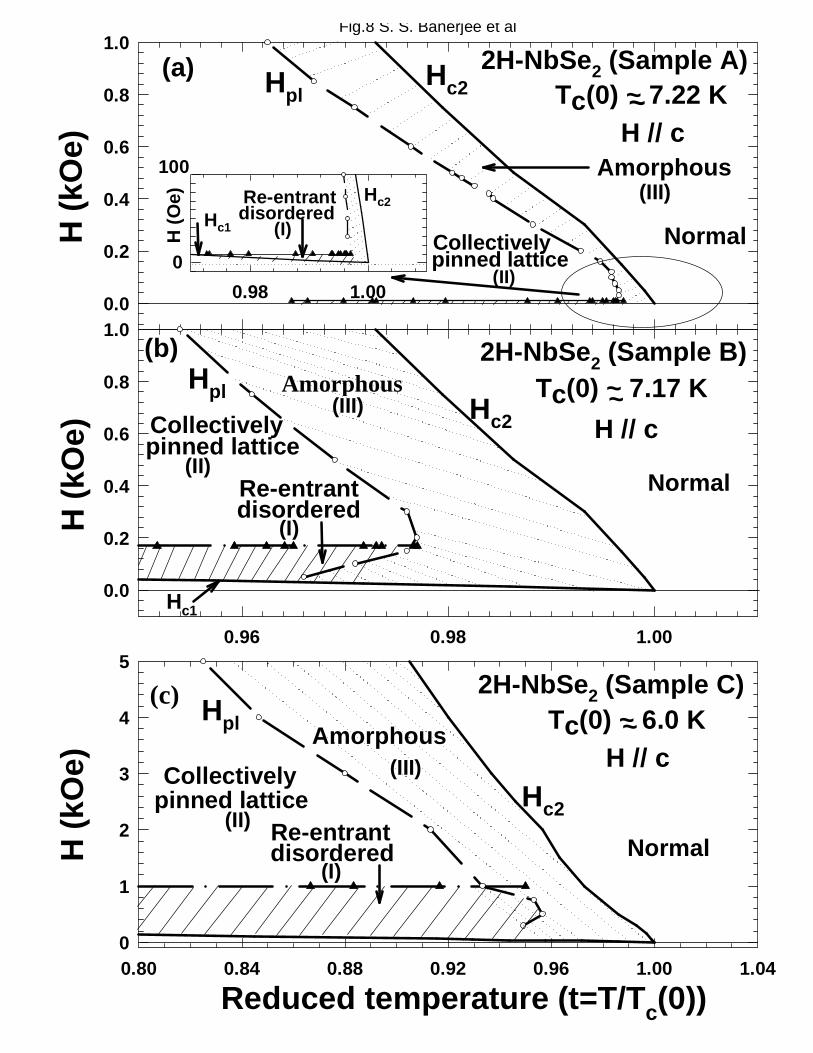
We present in Figs.8(a), 8(b) and 8(c) the vortex phasediagrams in samples A ,B and C, respectively at the lowfields and high temperatures (close to Tc(0)). Thesephase diagrams have been determined from the identi-fication of regimes I, II and III via plots as in Fig.6.The lower ends of collectively pinned regime II at dif-ferent temperatures have been marked by filled triangledata points, whereas, the upper ends of regime II co-incide with the dotted curve Hpl(t), which identifies theonset position of PE. The span of regime I , named as thereentrant disordered (following schematics in Fig.1(b)) inFigs.8(a) to 8(c), can be identified by slanted lines. Theregime III corresponding to the PE phenomenon has beentermed as amorphous (see the regions spanned by dottedlines) in both the phase diagrams. The so called reen-trant disordered and amorphous regions overlap and forma continuum near the turnaround point of the Hpl curve.Above the temperature corresponding to the turnaroundpoint, the vortex matter remains in a disordered state atall fields presumably due to juxtaposition of effects dueto thermal fluctuations and pinning. However, at tem-peratures sufficiently below the turnaround temperature,one would find the collectively pinned FLL sandwichedbetween an individually pinned disordered low densityphase and the plastically deformed (partially amorphous)high density phase. It is apparent that the (H,T) phasespace corresponding to the collectively pinned orderedstate progressively shrinks as one goes from the clean-est sample A to the nominally pure sample C, howeverthe reenterant characteristic in disorder to order trans-formation phenomenon stands elucidated in all the threesamples.
E. Vortex Phase Diagrams in Other Low Tc Systems
In earlier sections, we described results pertaining tothe construction of vortex phase diagrams in weakly
pinned samples of 2H-NbSe2, which has emerged as themost favored superconducting system for vortex statestudies for its optimum values [13] of Ginzburg numberGi and the ratio Jc/J0, where J0 is the depairing cur-rent density. However, in recent years, many reports onthe construction of vortex phase diagrams have appearedin wide classes of other low Tc superconducting systems,such as, heavy fermion superconductors, UPd2Al3, UPt3,etc., [39] mixed valent rare earth intermetallics, such asCeRu2 [16], Yb3Rh4Sn13 [40,41], etc., ternary stannides,like Ca3Rh4Sn13 [42], quarternary borocarbide [43] su-perconductors, such as, YNi2B2C, etc. It has often beenstated that some of the phase boundaries (locus of H andT values) drawn for all these systems extend over similarparametric limits in the normalized (H,T) phase space.Some reports [44] have also drawn attention to the sim-ilarities in the characteristics (in transport studies) ofdifferent vortex phases identified in systems, like CeRu2,YBa2Cu3O7, and 2H- NbSe2. In a recent study, some ofus have shown that the vortex phase diagram in a weaklypinned single crystal of CeRu2 is nearly identical to thatin sample C of 2H-NbSe2 [16]. It is our assertion that theweakly pinned samples of most other superconductingsystems also display detailed behavior in the PE regionsimilar to that observed in sample C. In isofield ac suscep-tibility studies, the PE region comprises two first orderlike jumps at the onset and the peak positions of PE. Inbetween these two jumps, χ′ often displays a two peaklike structure [15,16]. Our ansatz is that the first peakreflects the commencement of pinning induced stepwiseshattering of FLL through sudden shrinkage of correla-tion volume Vc at Tpl due to proliferation of dislocations.The disappearance of history dependence above Tp re-flects the absence of memory of previous history and thecomplete amorphisation of FLL. We present in Figs.9(a)and 9(b) the χ′(T) data at fixed fields in single crystals oftwo more superconducting systems, namely, Ca3Rh4Sn13
[22] and YNi2B2C [23] in support of the above ansatz. Inboth these figures, the onset (Tpl) and peak (Tp) posi-tions of PE phenomenon have been marked. Collectionof such data along with the measurements of isothermalmagnetization hysteresis loops lead us to the constructionof vortex phase diagrams in Ca3Rh4Sn13 and YNi2B2Cshown in Figs.10(a) and 10(b), respectively. The simi-larity between these phase diagrams and that shown forsample C in Fig.3 amply justify the assertion made above.The PE phenomenon cannot be observed in crystals ofCa3Rh4Sn13 and YNi2B2C in fields below few kOe, whereFLL constant a0(∼ 1000 A) exceeds the respective pen-etration depth values and the pinning effects dominateover interaction effects. This accounts for the termina-tion of Hpl and Hp lines at low field ends as shown in theFigs.10 (a) and (b).
7

IV. CONCLUSION
The advent of the phenomenon of high temperaturesuperconductivity stimulated search for different possi-ble phases (and transformations among them) of vortexmatter formed as a consequence of competition amongstinteraction between the vortices and the disorder effectscaused by thermal fluctuations and inevitable presenceof quenched random inhomogeneities in the underlyingatomic lattice. Theoretical studies [3–8] during the lastdecade have brought out how different phases of vortexmatter could be distinguished on the basis of the char-acteristics of spatial and temporal correlations amongstvortices. The phase boundary separating the (quasi)Abrikosov flux line lattice and the quasi-vortex liquidphases has received the most extensive attention fromthe experimentalists. In the field-temperature regions,where thermal fluctuation effects dominate over pinningdisorder in the context of high Tc cuprate systems, mag-netic, thermal and structural studies have elucidated thatthe ordered vortex solid to the (disordered) vortex liquidtransition is first order in character [45–49]. A crucialevidence in favor of this inference has been an obser-vation of a step increase in equilibrium magnetization(∆Meq) via bulk and local magnetization measurements[45,46,48], which translates into a change in entropy (∆S)and the latent heat L via the Clausius-Clapeyron re-lation; L = T∆S = −T (∆Meq)(δHm/δT ). In weaklypinned samples of low Tc superconductors, our assertionsabout the different phases of vortex matter and the trans-formations amongst them have been based on the charac-teristic details of the peak effect and their relationshipsto the order to disorder phenomenon. The change inequilibrium magnetization that could be related to order-disorder transition across the PE is difficult to discernexperimentally as the PE itself manifests as an anoma-lous increase in irreversible magnetization [18]. However,in a limited field-temperature region of a very clean crys-tal of 2H- NbSe2, Ravikumar et al [20] have revealed thepresence of ∆Meq across the PE. The estimated entropychange associated with order-disorder transition acrossPE is of the same order as observed earlier in the contextof melting of FLL in cuprate compounds [20,48,49]. Di-rect structural studies [14,33] across PE in weakly pinnedsamples of low Tc superconductors support the notion ofoccurrence of a transformation from an ordered (quasiFLL) vortex solid to an amorphous vortex phase. Fur-thermore, muon spin mutation studies at low fields incrystals of 2H-NbSe2 have revealed the occurrence of achange in state of vortex matter across PE which is nodifferent from the changes reported in the context of thefishtail effect and the melting of FLL in similar studiesin cuprate superconductors [32,50].
In view of the above, we are tempted to propose ageneric phase diagram for a realistic sample of a type-II superconductor which is weakly pinned. We show aschematic view of such a phase diagram in Fig.11, which
has been drawn on the basis of experimental data in sam-ple B of 2H-NbSe2. The generic phase diagram comprisessix phases, viz., an elastically deformed vortex solid phaseakin to a Bragg glass (H < Hpl), a plastically deformedvortex glass phase (Hpl < H < Hp), a pinned (Jc 6= 0)amorphous phase (Hp < H < Hirr) and an unpinned(Jc ≈ 0) amorphous phase (Hirr < H < Hc2
), a lowdensity reentrant glass phase (Hc1
< H < Hlow) and aMeissner phase (H < Hc1
). The (dotted) boundary sep-arating the reentrant glass and the Bragg glass phasesrepresents a crossover phenomenon. The vortex matterabove the PE boundary (Hp) is disordered in inequilib-rium in the sense that no metastability effects are ob-served above this boundary. However, the vortex mattercan be obtained in a disordered metastable state belowthe Hp line by the process of field cooling, which is analo-gous to the phenomenon of supercooling below a first or-der transition. An application of driving force can reorga-nize the disordered metastable state towards an orderedstable state [51]. Recent experiments [52] have revealedthat between the Hpl and Hp lines, the stationary stateof the vortex matter is a partially ordered state. In such aregion, the vortex matter can be obtained in a metastablewell ordered state or a metastable amorphous state bythe process of superheating or supercooling, respectively.An application of a driving force could transform bothtypes of metastable configurations to the stable partiallyordered state.
A phenomenological understanding of transformationsbetween the metastable and stable phases of vortex materhas also been achieved recently via the proposition of anew model [53] which reduces to the well known criti-cal state model due to C. P. Bean [54] in the absenceof metastability effects. We thus believe that the taskof sketching a magnetic phase diagram of conventionaltype-II superconductors stands accomplished [55] fairlysatisfactorily both from experimental view point as wellas phenomenological (theoretical) considerations. Manyinteresting details, however, need to be precisely investi-gated as well as quantitatively accounted for.
V. ACKNOWLEDGEMENT
This review is primarily based on the experiments per-formed at Mumbai, India in association with our collab-orators internationally, who provided us the high qual-ity single crystals of a variety of superconducting com-pounds. In particular, we would like to acknowledge ourcooperation with the groups of Prof. Y. Onuki (Osaka,Japan), Prof. D. Mck Paul (Warwick,U.K.) and Dr. H.Takeya (Tsukuba, Japan) and Dr. P. Gammel (LucentTechnoligies, Murray Hill, U.S.A.).
Correspondingauthors :[email protected]/[email protected]
8
[1] A. A. Abrikosov, Sov. Phys. JETP 5 (1957) 1174.[2] Michael Tinkham, Introduction to Superconductivity,
Mc Graw-Hill, Inc. U.S.A., Second edition (1996).[3] G. Blatter, M. V. Feigel’man, V. B. Geshkenbein, A. I.
Larkin and V. M. Vinokur, Rev. Mod. Phys. 66 (1994)1125 and references cited therein.
[4] D. R. Nelson, Phys. Rev. Lett. 60 (1988) 1973.[5] D. S. Fisher, M. P. A. Fisher and D. A. Huse, Phys. Rev.
B 43 (1991) 130.[6] T. Giamarchi and P. Le Doussal, Phys. Rev. Lett. 72
(1994) 1530.[7] T. Giamarchi and P. Le Doussal, Phys. Rev. B 52 (1995)
1242 and references therein.[8] M. J. P. Gingras and D. A. Huse , Phys. Rev. B 53 (1996)
15193.[9] A. I. Larkin and Yu. N. Ovchinnikov, Sov. Phys. JETP
38 (1974)854.[10] A. I. Larkin and Yu. N. Ovchinnikov, J. Low Temp. Phys.
34 (1979) 409.[11] A. I. Larkin, M. C. Marchetti and V. M. Vinokur, Phys.
Rev. Lett. 75 (1995) 2992.[12] C. Tang, X. S. Ling, S. Bhattacharya and P. M. Chaikin
, Europhys. Lett. 35 (1996) 597.[13] M. J. Higgins and S. Bhattacharya, Physica C 257 (1996)
232 and references cited therein.[14] P. L. Gammel, U. Yaron, A. P. Ramirez, D. J. Bishop, A.
M. Chang, R. Ruel, L. N. Pfeiffer and E. Bucher, Phys.Rev. Lett. 80 (1998) 833.
[15] S. S. Banerjee, N. G. Patil, S. Ramakrishnan, A. K.Grover, S. Bhattacharya, G. Ravikumar, P. K. Mishra,T. V. Chandrasekhar Rao, V. C. Sahni, M. J. Higgins, C.V. Tomy, G. Balakrishnan and D. Mck Paul, Phys. Rev.B, 59 (1999) 6043.
[16] S. S. Banerjee, N. G. Patil, S. Saha, S. Ramakrishnan, A.K. Grover, S. Bhattacharya, G. Ravikumar, P. K. Mishra,T. V. Chandrasekhar Rao, V. C. Sahni, M. J. Higgins, E.Yamamoto, Y. Haga, M. Hedo, Y. Inada and Y. Onuki,Phys. Rev. B 58 (1998) 995.
[17] S. S. Banerjee, N. G. Patil, S. Ramakrishnan, A. K.Grover, S. Bhattacharya, G. Ravikumar, P. K. Mishra,T. V. Chandrasekhar Rao, V. C. Sahni, M. J. Higgins,C. V. Tomy, G. Balakrishnan and D. Mck Paul, Euro.Phys. Lett. 44 (1998) 91.
[18] G. Ravikumar, T. V. C. Rao, P. K. Mishra, V. C. Sahni,Subir Saha, S. S. Banerjee, N. G. Patil, A. K. Grover, S.Ramakrishnan, S. Bhattacharya, E. Yamamoto, Y. Haga,M. Hedo, Y. Inada and Y. Onuki, Physica C 276 (1997)9.
[19] G. Ravikumar, P. K. Mishra, V. C. Sahni, S. S.Banerjee, A. K. Grover, S. Ramakrishnan, P. L.Gammel, D. J. Bishop, E. Bucher, M. J. Higginsand S. Bhattacharya, (submitted to Phys. Rev. B);http://xxx.lanl.gov/abs/cond-mat/9908222.
[20] G. Ravikumar, P. K. Mishra, V. C. Sahni, S. S. Banerjee,S. Ramakrishnan, A. K. Grover, P. L. Gammel, D. J.
Bishop, E. Bucher, M. J. Higgins and S. Bhattacharya,Physica C (in press).
[21] S. S. Banerjee, S. Ramakrishnan, A. K. Grover, G.Ravikumar, P. K. Mishra, V. C. Sahni, C. V. Tomy, G.Balakrishnan, D. Mck. Paul, P. L. Gammel, D. J. Bishop,E. Bucher, M. J. Higgins and S. Bhattacharya, (sub-mitted to Phys. Rev. B); http://xxx.lanl.gov/abs/cond-mat/9907111.
[22] Shampa Sarkar, D. Pal, S. S. Banerjee, S. Ramakrish-nan, A. K. Grover, C. V. Tomy, G. Ravikumar, P. K.Mishra, V. C. Sahni, G. Balakrishnan, D. Mck. Pauland S. Bhattacharya, (submitted to Phys. Rev. B) ;http://xxx.lanl.gov/abs/cond-mat/9909297.
[23] D. Pal, Shampa Sarkar, S. S. Banerjee, S. Ramakrish-nan, A.K.Grover, S. Bhattacharya, G. Ravikumar, P. K.Mishra, T.V.C. Rao, V. C. Sahni and H. Takeya, Pro-
ceedings of the DAE Solid State Physics Symposium, 40C(1997) 310.
[24] D. Pal, D. Dasgupta, B. K. Sarma, et al, (unpublished).[25] S. Bhattacharya and M. J. Higgins, Phys. Rev. Lett. 70
(1993) 2617.[26] W. Henderson, E. Y. Anderi, M. J. Higgins and S. Bhat-
tacharya, Phys. Rev. Lett. 77 (1996) 2077.[27] K. Ghosh, S. Ramakrishnan, A. K. Grover, Gautam I.
Menon, Girish Chandra, T. V. Chandrasekhar Rao, G.Ravikumar, P. K. Mishra, V. C. Sahni, C. V. Tomy, G.Balakrishnan, D. Mck Paul and S. Bhattacharya, Phys.Rev. Lett., 76 (1996) 4600.
[28] X. S. Ling and J. Budnick, in Magnetic Susceptibility ofSuperconductors and other Spin Systems, edited by R. A.Hein, T. L. Francavilla, and D. H. Leibenberg (PlenumPress, New York, 1991), p. 377.
[29] R. Merithew, M. W. Rabin and M. B. Weismann, M. J.Higgins and S. Bhattacharya, Phys. Rev. Lett. 77 (1996)3197.
[30] G. I. Menon and C. Dasgupta, Phys. Rev. Lett. 73 (1994)1023.
[31] S. S. Banerjee, Ph. D. thesis, 1999. University of Mumbai,Mumbai, India.
[32] T. V. C. Rao, V. C. Sahni, P. K. Mishra, G. Ravikumar,C. V. Tomy, G. Balakrishnan, D. Mck Paul, C. A. Scott,S. S. Banerjee, N. G. Patil, S. Saha, S. Ramakrishnan, A.K. Grover, S. Bhattacharya, Physica C 299(1998) 267.
[33] I. Journard, J. Marcus, T. Klein and R. Cubitt, Phys.Rev. Lett. 82 (1999) 4930.
[34] S. S. Banerjee, N. G. Patil, K. Ghosh, S. Saha, G. I.Menon, S. Ramakrishnan, A. K. Grover, P. K. Mishra,T. V. C. Rao, G. Ravikumar, V. C. Sahni, C. V. Tomy, G.Balakrishnan, D. Mck. Paul and S. Bhattacharya, Phys-ica B 237-238 (1997) 315.
[35] L. A. Angurel, F. Amin, M. Polichetti, J. Aarts and P.H. Kes, Phys. Rev. B 56 (1997) 3425 and references citedtherein.
[36] M. Isino, T. Kobayashi, N. Toyota, T. Fukase and Y.Muto, Phys. Rev. B 38 (1988) 4457.
[37] H. Kupfer, Th. Wolf, C. Lessing, A. A. Zhukov, X. Lanon,R. Meier-Hirmer, W. Schauer and H. Wuehl, Phys. Rev.B 58 (1998) 2886 and references cited therein.
[38] T. Nishizaki, T. Naito, and N. Kobayashi, Phys. Rev. B,58 (1998) 11169.
9
[39] R. Modler, P. Gegenwart, M. Lang, M. Deppe, M. Wei-den, T. Luhmann, C. Geibel, F. Steglich, C. Paulsen, J.L. Tholence, N. Sato, T. Komatsubara, Y. Onuki, M.Tachiki and S. Takahashi, Phys. Rev. Lett. 76 (1996)1292.
[40] H. Sato, Y. Akoi, H. Sugawara and T. Fukahara, J. Phys.Soc. Jpn. 64 (1995) 3175.
[41] C. V. Tomy, G. Balakrishnan and D. Mck. Paul, PhysicaC 280 (1997) 1.
[42] C. V. Tomy, G. Balakrishnan and D. McK. Paul, Phys.Rev. B 56 (1997) 8346.
[43] K. Hirata, H. Takeya, T. Mochiku and K. Kadowaki,Advances in Superconductivity V III, edited by H.Hayakawa and Y. Enomoto (Springer-Verlag, Berlin,Germany, 1996) p. 619.
[44] G. W. Crabtree, M. B. Maple, W. K. Kwok, J. Herrmann,J. A. Fendrich, N. R. Dilley and S. H. Han, Physics Es-says 9 (1996) 628 and references cited therein.
[45] H. Pastoriza, M. F. Goffman, A. Arribre, and F. de laCruz, Phys. Rev. Lett., 72 (1994) 2951.
[46] E. Zeldov, D. Majer, M. Konczykowski, V. M. Vinokurand H. Shtrikman, Nature, 375 (1995) 373.
[47] A. Schilling, R. A. Fisher, N. E. Phillips, U. Welp, D.Dasgupta, W. K. Kwok, G. W. Crabtree, Nature, 382
(1996) 791.[48] T. Sasagawa, K. Kishio, Y. Togawa, J. Shimoyama, and
K. Kitazawa, Phys. Rev. Lett., 80 (1998) 4297 and ref-erences therein.
[49] M. J. W. Dodgson, V. B. Geshkenbein, H. Nordborg, andG. Blatter, Phys. Rev. Lett., 80 (1998) 837.
[50] T. V. Chandrasekhar Rao, M. J. Higgins, V. C. Sahni,G. Ravikumar, P. K. Mishra, S. S. Banerjee, N. G. Patil,S. Ramakrishnan, A. K. Grover, S. Bhattacharya, C. A.Scott, C. V. Tomy, G. Balakrishnan and D. McK. Paul(unpublished).
[51] S. S. Banerjee, N. G. Patil, S. Ramakrishnan, A. K.Grover, S. Bhattacharya, G. Ravikumar, P. K. Mishra,T. V. Chandrasekhar Rao, V. C. Sahni, M. J. Higgins,Appl. Phys. Lett. 74 (1999) 126.
[52] G. Ravikumar, P. K. Mishra and V. C. Sahni, S. S. Baner-jee, A. K. Grover and S. Ramakrishnan, P. L. Gammel,D. J. Bishop and E. Bucher, M. J. Higgins and S. Bhat-tacharya, (unpublished).
[53] G. Ravikumar, K. V. Bhagwat, V. C. Sahni, A. K.Grover, S. Ramakrishnan and S. Bhattacharya, (unpub-lished).
[54] C. P. Bean, Phys. Rev. Lett., 8 (1962) 250.[55] S. S. Banerjee, S. Saha, N. G. Patil, S. Ramakrishnan, A.
K. Grover, S. Bhattacharya, G. Ravikumar, P. K. Mishra,T. V. C. Rao, V. C. Sahni, C. V. Tomy, G. Balakrishnan,D. Mck. Paul, M. J.Higgins, Physica C 308 (1998) 25.
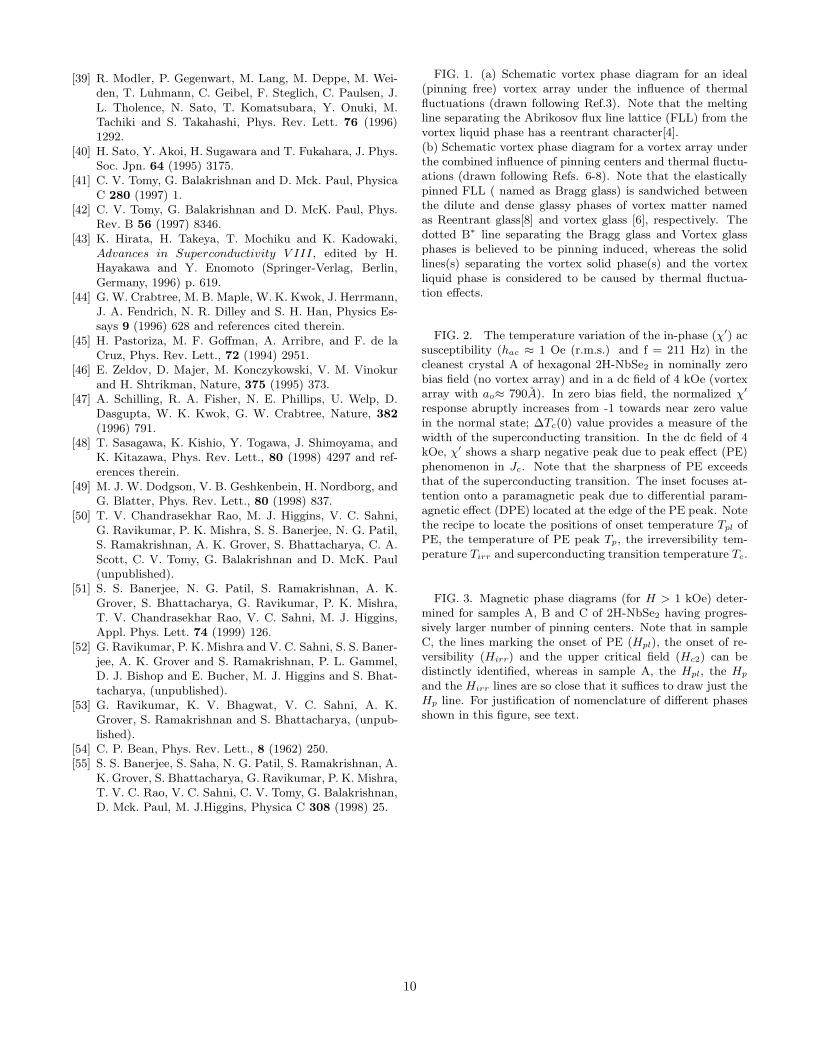
FIG. 1. (a) Schematic vortex phase diagram for an ideal(pinning free) vortex array under the influence of thermalfluctuations (drawn following Ref.3). Note that the meltingline separating the Abrikosov flux line lattice (FLL) from thevortex liquid phase has a reentrant character[4].(b) Schematic vortex phase diagram for a vortex array underthe combined influence of pinning centers and thermal fluctu-ations (drawn following Refs. 6-8). Note that the elasticallypinned FLL ( named as Bragg glass) is sandwiched betweenthe dilute and dense glassy phases of vortex matter namedas Reentrant glass[8] and vortex glass [6], respectively. Thedotted B∗ line separating the Bragg glass and Vortex glassphases is believed to be pinning induced, whereas the solidlines(s) separating the vortex solid phase(s) and the vortexliquid phase is considered to be caused by thermal fluctua-tion effects.
FIG. 2. The temperature variation of the in-phase (χ′) acsusceptibility (hac ≈ 1 Oe (r.m.s.) and f = 211 Hz) in thecleanest crystal A of hexagonal 2H-NbSe2 in nominally zerobias field (no vortex array) and in a dc field of 4 kOe (vortexarray with ao≈ 790A). In zero bias field, the normalized χ′
response abruptly increases from -1 towards near zero valuein the normal state; ∆Tc(0) value provides a measure of thewidth of the superconducting transition. In the dc field of 4kOe, χ′ shows a sharp negative peak due to peak effect (PE)phenomenon in Jc. Note that the sharpness of PE exceedsthat of the superconducting transition. The inset focuses at-tention onto a paramagnetic peak due to differential param-agnetic effect (DPE) located at the edge of the PE peak. Notethe recipe to locate the positions of onset temperature Tpl ofPE, the temperature of PE peak Tp, the irreversibility tem-perature Tirr and superconducting transition temperature Tc.
FIG. 3. Magnetic phase diagrams (for H > 1 kOe) deter-mined for samples A, B and C of 2H-NbSe2 having progres-sively larger number of pinning centers. Note that in sampleC, the lines marking the onset of PE (Hpl), the onset of re-versibility (Hirr) and the upper critical field (Hc2) can bedistinctly identified, whereas in sample A, the Hpl, the Hp
and the Hirr lines are so close that it suffices to draw just theHp line. For justification of nomenclature of different phasesshown in this figure, see text.
10
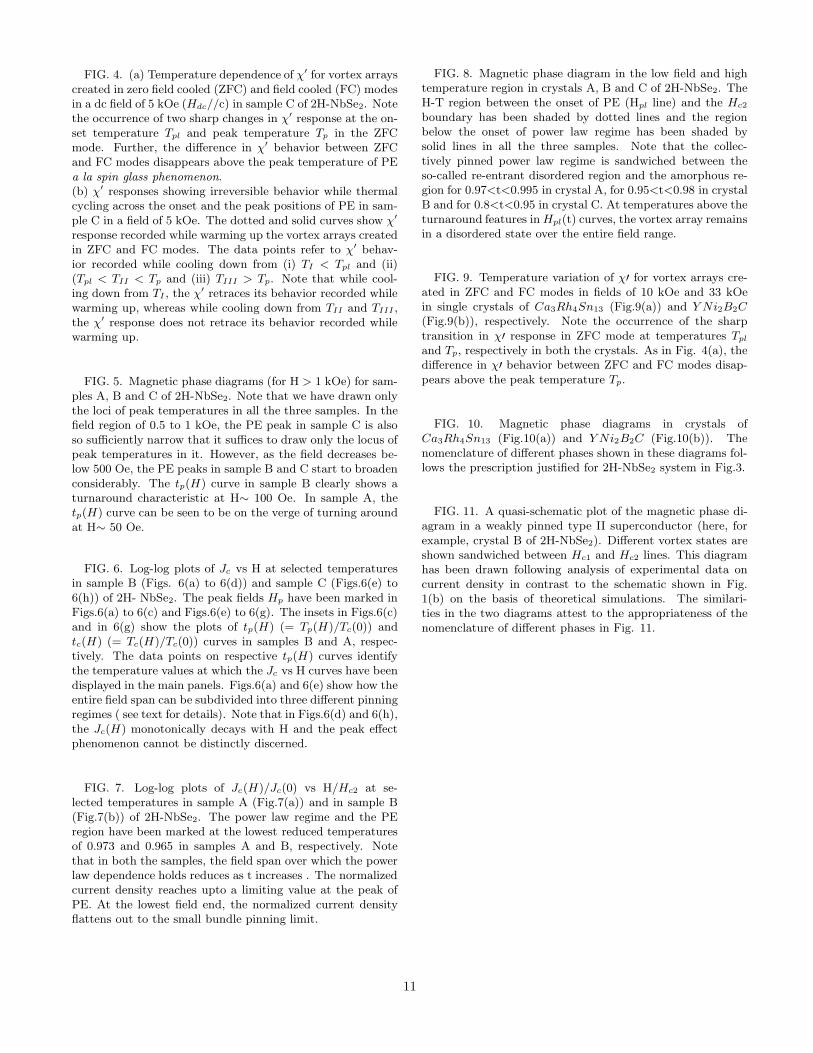
FIG. 4. (a) Temperature dependence of χ′ for vortex arrayscreated in zero field cooled (ZFC) and field cooled (FC) modesin a dc field of 5 kOe (Hdc//c) in sample C of 2H-NbSe2. Notethe occurrence of two sharp changes in χ′ response at the on-set temperature Tpl and peak temperature Tp in the ZFCmode. Further, the difference in χ′ behavior between ZFCand FC modes disappears above the peak temperature of PEa la spin glass phenomenon.(b) χ′ responses showing irreversible behavior while thermalcycling across the onset and the peak positions of PE in sam-ple C in a field of 5 kOe. The dotted and solid curves show χ′
response recorded while warming up the vortex arrays createdin ZFC and FC modes. The data points refer to χ′ behav-ior recorded while cooling down from (i) TI < Tpl and (ii)(Tpl < TII < Tp and (iii) TIII > Tp. Note that while cool-ing down from TI , the χ′ retraces its behavior recorded whilewarming up, whereas while cooling down from TII and TIII ,the χ′ response does not retrace its behavior recorded whilewarming up.
FIG. 5. Magnetic phase diagrams (for H > 1 kOe) for sam-ples A, B and C of 2H-NbSe2. Note that we have drawn onlythe loci of peak temperatures in all the three samples. In thefield region of 0.5 to 1 kOe, the PE peak in sample C is alsoso sufficiently narrow that it suffices to draw only the locus ofpeak temperatures in it. However, as the field decreases be-low 500 Oe, the PE peaks in sample B and C start to broadenconsiderably. The tp(H) curve in sample B clearly shows aturnaround characteristic at H∼ 100 Oe. In sample A, thetp(H) curve can be seen to be on the verge of turning aroundat H∼ 50 Oe.
FIG. 6. Log-log plots of Jc vs H at selected temperaturesin sample B (Figs. 6(a) to 6(d)) and sample C (Figs.6(e) to6(h)) of 2H- NbSe2. The peak fields Hp have been marked inFigs.6(a) to 6(c) and Figs.6(e) to 6(g). The insets in Figs.6(c)and in 6(g) show the plots of tp(H) (= Tp(H)/Tc(0)) andtc(H) (= Tc(H)/Tc(0)) curves in samples B and A, respec-tively. The data points on respective tp(H) curves identifythe temperature values at which the Jc vs H curves have beendisplayed in the main panels. Figs.6(a) and 6(e) show how theentire field span can be subdivided into three different pinningregimes ( see text for details). Note that in Figs.6(d) and 6(h),the Jc(H) monotonically decays with H and the peak effectphenomenon cannot be distinctly discerned.
FIG. 7. Log-log plots of Jc(H)/Jc(0) vs H/Hc2 at se-lected temperatures in sample A (Fig.7(a)) and in sample B(Fig.7(b)) of 2H-NbSe2. The power law regime and the PEregion have been marked at the lowest reduced temperaturesof 0.973 and 0.965 in samples A and B, respectively. Notethat in both the samples, the field span over which the powerlaw dependence holds reduces as t increases . The normalizedcurrent density reaches upto a limiting value at the peak ofPE. At the lowest field end, the normalized current densityflattens out to the small bundle pinning limit.
FIG. 8. Magnetic phase diagram in the low field and hightemperature region in crystals A, B and C of 2H-NbSe2. TheH-T region between the onset of PE (Hpl line) and the Hc2
boundary has been shaded by dotted lines and the regionbelow the onset of power law regime has been shaded bysolid lines in all the three samples. Note that the collec-tively pinned power law regime is sandwiched between theso-called re-entrant disordered region and the amorphous re-gion for 0.97<t<0.995 in crystal A, for 0.95<t<0.98 in crystalB and for 0.8<t<0.95 in crystal C. At temperatures above theturnaround features in Hpl(t) curves, the vortex array remainsin a disordered state over the entire field range.
FIG. 9. Temperature variation of χ′ for vortex arrays cre-ated in ZFC and FC modes in fields of 10 kOe and 33 kOein single crystals of Ca3Rh4Sn13 (Fig.9(a)) and Y Ni2B2C
(Fig.9(b)), respectively. Note the occurrence of the sharptransition in χ′ response in ZFC mode at temperatures Tpl
and Tp, respectively in both the crystals. As in Fig. 4(a), thedifference in χ′ behavior between ZFC and FC modes disap-pears above the peak temperature Tp.
FIG. 10. Magnetic phase diagrams in crystals ofCa3Rh4Sn13 (Fig.10(a)) and Y Ni2B2C (Fig.10(b)). Thenomenclature of different phases shown in these diagrams fol-lows the prescription justified for 2H-NbSe2 system in Fig.3.
FIG. 11. A quasi-schematic plot of the magnetic phase di-agram in a weakly pinned type II superconductor (here, forexample, crystal B of 2H-NbSe2). Different vortex states areshown sandwiched between Hc1 and Hc2 lines. This diagramhas been drawn following analysis of experimental data oncurrent density in contrast to the schematic shown in Fig.1(b) on the basis of theoretical simulations. The similari-ties in the two diagrams attest to the appropriateness of thenomenclature of different phases in Fig. 11.
11


Temperature (K)4 5 6 7
χχ'(n
orm
alis
ed
)
-1.0
-0.8
-0.6
-0.4
-0.2
0.0
4 kOe (a0~790 A0) (H// c)
0 Oe
Tp
Tc(0)
2H-NbSe2
(crys tal A)
6.4 6.8 7.2
χχ' (
x1
0-2 )
-4
-2
0
T ir r
Tc
Tp
DPE TC(H)
PE
∆∆Tc(0)
Tpl
4 kOe
Tpl
Fig.2. S. S. Banerjee et al
0
5
10
15
20
0
5
10
15
20
Mag
net
ic F
ield
H (
kOe)
0.6 0.7 0.8 0.9 1.0
0
5
10
15
NbSe2
Sample C
Reduced Temperature (T/Tc(0))
Hc2
Hc1
Hp
Hpl
Hc2
Hc2Hirr
Hpl
Hp
Hirr
Sample A
Sample B
Hdc // cHp
H (kO
e)
(Bragg Glass)
Vortex Glass
Pinned amorphous
Unpinned amorphous
(plastic)
Elastic FLL
Fig.3. S. S. Banerjee et al
PE
Temperature (K)4.5 5.0
-0.5
0.0χχ/ / (
no
rmal
ise
d)
FCW
ZFC
Tp
7SO
Sample C
Hdc=5 kOe
2H-NbSe2
Fig.4(a) S. S. Banerjee
(a)

Fig.4(b) S. S. Banerjee et alTemperature ( K )
2H-NbSe2
ZFC
H = 5 kOe (H // c)
Tpl
TITII
TIII
Tc
Tp
χχ/ (nor
mal
ised
)
FCW
4.5 5.0
-0.5
0.0
(b)
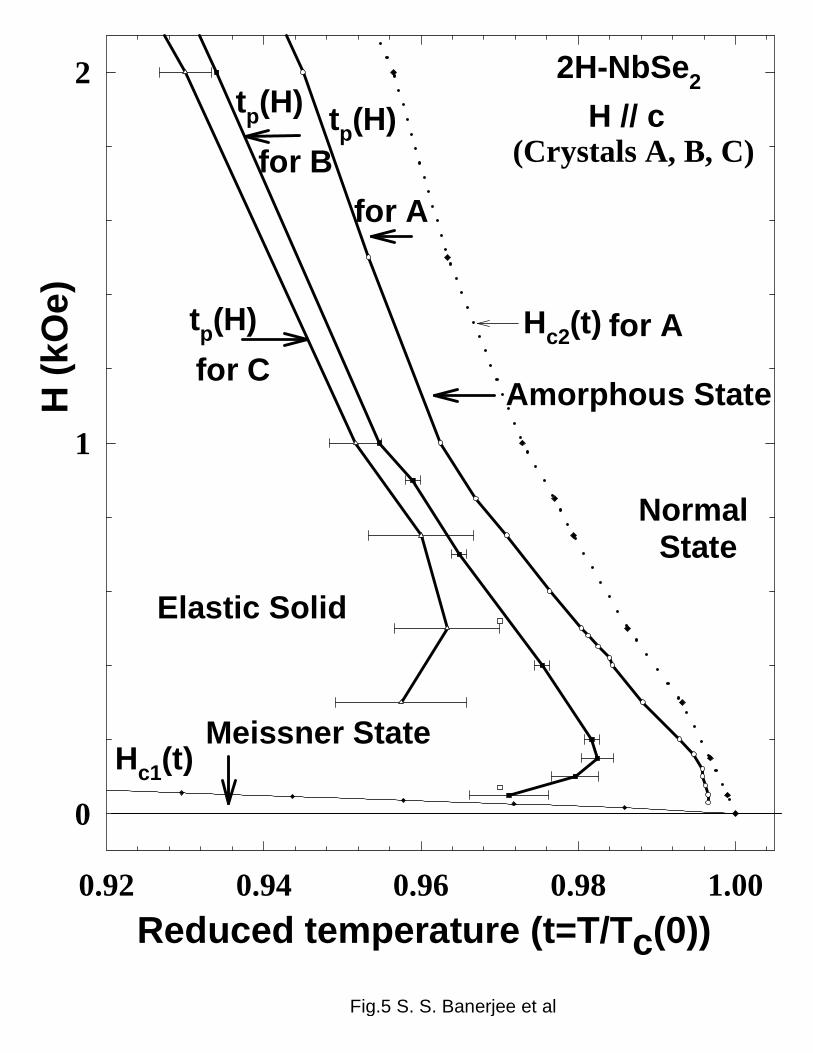
Fig.5 S. S. Banerjee et al
Reduced temperature (t=T/Tc(0))0.92 0.94 0.96 0.98 1.00
H (
kOe)
0
1
2
Hc2(t)
tp(H)
tp(H)
tp(H)
for A
for B
for Cfor A
Elastic Solid
2H-NbSe2
H // c(Crystals A, B, C)
Hc1(t)
NormalState
Amorpho us State
Meissner State

10 100 10001e+3
1e+4
1e+5
1e+6
10 100 10001e+3
1e+4
1e+5
1e+6
10 100 10001e+3
1e+4
1e+5
1e+6
H (Oe)10 100 1000
1e+3
1e+4
1e+5
1e+6
Crystal B
t = T/Tc(0) ~ 0.965
t ~ 0.973
t ~ 0.977
t ~ 0.982
~
~
~
0.96 1.00
0
1
H
t
Hp
Hp
Hp
H // c
tptc
2H-NbSe2
(a)
(b)
(c)
(d)
III
III
powerlaw
Fig.6. S. S. Banerjee et al
~
1 10 100 10001e+3
1e+4
1e+5
1e+6
1e+7
(h)
(g)
(f)
(e)
1 10 100 10001e+3
1e+4
1e+5
1e+6
H (Oe)1 10 100 1000
J c (A
/m2 )
1e+3
1e+4
1e+5
1e+6
t ~ 0.996
t ~ 0.997
1 10 100 10001e+3
1e+4
1e+5
1e+6
Crystal A
t = T/Tc(0) ~ 0.973~
~
~
~
t ~ 0.994
0.96 1.00
0
1
H
t
Hp
Hp
H // c
tptc
small bund lepinning regime
Powerlaw
PE
2H-NbSe2
I
II IIIpower
law

J c(H,T
) / J
c(0, T
)
NbSe2 (Crystal A)
PE
(a)
H // c
0.997
0.9830.9900.996
0.973
t = T/Tc(0)
Powerlaw
0.01 0.10 1.00
0.01
0.10
1.00
H / Hc2(T)
0.01 0.1 1
0.01
0.10
1.00NbSe2 (Crystal B)
small bund lepinning limit
PE
(b)
Amorphou s limit
H // c
0.9650.9700.9730.9770.982
t = T/Tc(0)
Powerlaw
Fig.7 S. S. Banerjee et al
Reduced temperature (t=T/Tc(0))0.80 0.84 0.88 0.92 0.96 1.00 1.04
H (
kOe)
0
1
2
3
4
5
H (
kOe)
0.0
0.2
0.4
0.6
0.8
1.0
0.98 1.00
H (
Oe)
Hc2
Collectivelypinned latt ice
Re-entrant disordered
Amorphou s
Hpl
0.96 0.98 1.00
H (
kOe)
0.0
0.2
0.4
0.6
0.8
1.0
Hc2
Hpl Amorphous
Re-entrantdisordered
Collectivelypinned latt ice
(a)
(b)
Hc1
Hc1
0
100
Normal
Normal
Hc2
(c)
Amorphou s
disorderedRe-entrant
Collectivelypinned latt ice
Hpl
Hc2
Normal
2H-NbSe2 (Sample C)Tc(0) ~ 6.0 K~
H // c
(III)
(I)
2H-NbSe2 (Sample A)Tc(0) ~ 7.22 K~
H // c
(II)
(III)
(I)
(II)
2H-NbSe2 (Sample B)Tc(0) ~ 7.17 K~
H // c
(III)
(II)
(I)
Fig.8 S. S. Banerjee et al

YNi2B2C
5 6 7 8-1.0
-0.8
-0.6
-0.4
-0.2
0.0
Temperature (K)
5.2 5.6 6.0 6.4
χχ' (
no
rmal
ized
)
-0.6
-0.4
-0.3
-0.1
0.0
ZFC
FCW
Hdc = 10 kOe, // [001]hac = 1 Oef = 211 Hz
Ca3Rh4Sn13
Tpl
Tp
Tc
Hdc = 33 kOe, // [001]hac = 1 Oef = 211 Hz
ZFC
FCW
TcTp
Tplχχ' (
norm
aliz
ed)
Tirr(a)
(b)
Fig. 9 S. S. Banerjee et al

(Tc , Hc2)
( Tp , Hp )
Ca3Rh4Sn13
Hc1 Elastic Glass
Plastic Glass
Normal State
Unpinned Amorpho us
( Tpl , Hpl )
Pinned Amorpho us
( Tirr , Hirr )
(a)
T/Tc(0)
H (
kOe)
0
10
20
30
40
Fig. 10 S. S. Banerjee et al
0.00 0.25 0.50 0.75 1.00
0
10
20
30
40
50
Normal State
Unpinned Amorpho us
Pinned
Plastic Glass
Elastic Glass
Amorphou s
Hirr ( Tp , Hp )
( Tpl , Hpl )Hc2
Hc1
+��N2H�
YNi2B2C
(b)

0
1
2
3
4
Elastically-deformed
Plastically
Vortex Solid
Unpinned Amorpho us State
Normal Metal
H (
kO
e )
T/Tc(0)0.9 1.0
deformed
Meissner State
Hc1
Hc2
Hirr
H
Vortex Solid
Hpl
Reentrant Glass ?
Pinned Amorpho us State
p
(Vortex Glass)
�%UDJJ�*ODVV�
Fig.11 S. S. Banerjee et al
Hlow